norddeutsche landesbank girozentrale hannover · norddeutsche landesbank girozentrale hannover ......
TRANSCRIPT

16 May 2014
Norddeutsche Landesbank Girozentrale Hannover First Supplement to the Base Prospectus relating to the EUR 25,000,000,000 Programme for the Issuance of Debt Instruments dated 14 August 2013 in accordance with § 16 (1) German Securities Prospectus Act (Wertpapierprospektgesetz, “WpPG”), hereafter referred to as ”Supplement No. 1 of 16 May 2014“.

page 2 of 190
TABLE OF CONTENTS Page
I. Right of Withdrawl and Changes 3
II. Changes relating to the Summary / Zusammenfassung 4
III. Changes relating to the Risk Factors 13
IV. Changes relating to the Description of the Norddeutsche Landesbank – Girozentrale – 14
V. Changes relating to General Information 20
VI. Changes relating to Financials 21
VII. Responsibility 190

page 3 of 190
I. RIGHT OF WITHDRAWAL AND CHANGES In accordance with § 16 (3) sentence 1 WpPG, investors who have already agreed to purchase or subscribe any Instrument before Supplement No. 1 of 16 May 2014 is published shall have the right, exercisable within two working days after the publication of this Supplement, to withdraw their acceptances, provided that the new factor, mistake or inaccuracy which is the subject of this Supplement arose prior to the final closing of the offer to the public and the delivery of the Instruments, § 16 (1) WpPG. The relevant new factor that lead to Supplement No. 1 of 16 May 2014 is the publication of the audited consolidated financial statements of NORD/LB Group for the fiscal year 2013 on 29 April 2014 at 10:30 o’clock. Pursuant to this publication, the following changes were made. The withdrawl is to be adressed to: Norddeutsche Landesbank – Girozentrale –, Friedrichswall 10, 30159 Hannover.

page 4 of 190
II. CHANGES RELATING TO THE SUMMARY CHAPTER I “SUMMARY” 1. The second sentence of Element A.1 in “Section A. „Introduction and Warnings“ on page 5 of
the Prospectus shall be deleted and replaced by the following:
„Any decision to invest in the Instruments should be based on consideration of the Prospectus as a whole as updated by supplement No. 1 of 16 May 2014 by the investor.”
2. Elements B.4b, B.12, B.13 and B.17 in Section B. „Issuer“ on pages 6 - 9 shall be deleted and
replaced by the following:
B.4b Known trends affecting the Issuer and the industries in which it operates
The financial crisis has led many governments and international organisations to significant changes in banking regulations. In particular, the implementation of the reform measures in 2010 (Basel III), developed by the Basel Committee to the New Basel Capital Accord on capital requirements for financial institutions (Basel II) and the Capital Requirement Regulation (CRR), are ongoing and will lead to higher requirements, particularly in terms of minimum capital resources, the Liquidity Coverage Ratio (LCR) and the Net Stable Funding Ratio (NSFR) which will be of great importance to the Issuer, in the future. Due to the current situation on the world market, particularly in terms of the low capacity utilization and freight rates remaining under pressure, in particular with regard to the container and tanker segment, the Nord / LB and its subsidiaries emanate from a complex market environment and market uncertainties in the area of ship financing, which has implications on the ship and aircraft segment. Therefore, the Nord / LB and its subsidiaries are preparing for a continued crisis in the shipping sector during the next quarters. The ongoing crisis in the shipping sector may continue to have a negative impact on the profitability of the Issuer and it may result in further deterioration of the shipping portfolio as well as a further increase in expenses for loan loss provisions during the coming quarters. Furthermore, the worsening situation in the shipping portfolio is resulting in an increase in regulatory deficits in valuation allowances, which reduce risk capital. The liquidity situation in the markets is still affected by the uncertainty concerning the possible medium-and long-term effects of the sovereign debt crisis in the EU peripheral countries, so that each of the aforementioned factors can adversely affect the business, the operating loss or financial position of the Nord / LB and its subsidiaries.

page 5 of 190
B.12 Selected historical key financial information regarding the issuer, presented for each financial year of the period covered by the historical financial information, and any subsequent interim financial period accompanied by comparative data from the same period in the prior financial year except that the requirement for comparative balance sheet information is satisfied by presenting the year-end balance sheet information
Sources: Audited consolidated Financial Statements of NORD/LB Group as of 31 December 2012 and 31 December 2013.
01 Jan - 31 Dec 2013
01 Jan - 31 Dec 2012
Performance figures in € million
Net interest income 1,931 1,9591
Loan loss provisions 846 5982
Net commission income 163 168
Profit/loss from financial instruments at fair value through profit or loss including hedge accounting 73 -122
Profit/loss from financial assets 11 -5
Profit/loss from investments accounted for using the equity method 33 -14
Administrative expenses 1,166 1,158
Other operating profit/loss 69 -99
Earnings before reorganisation and taxes 268 1313
Reorganisation expenses -38 -34
Expenses for Public Guarantees related to Reorganisation 69 194
Earnings before taxes 161 785
Income taxes -84 -4
Consolidated profit 245 826
Key figures in %
Cost-Income-Ratio (CIR) 51.4 61.2
Return-on-Equity (RoE) 2.1 1.0
31 Dec 2013 31 Dec 2012
Balance figures in € million
Total assets / total liabilities and equity 200,845 225,550
Liabilities to customers 54,861 55,951
Loans and advances to customers 107,661 114,577
Equity 8,190 7,700
Regulatory key figures
Core capital for solvency 8,112 8,451
1 This figure of the consolidated Financial Statement of 2012 has been adjusted and has been taken from the consolidated Financial Statement of
2013. 2 This figure corresponds with the according figure of the consolidated Financial Statement of 2012, in the consolidated Financial Statement of
2013 the method of presentation has been changed. 3 This figure of the consolidated Financial Statement of 2012 has been adjusted and has been taken from the consolidated Financial Statement of
2013. 4 This figure corresponds with the according figure of the consolidated Financial Statement of 2012, in the consolidated Financial Statement of
2013 the method of presentation has been changed. 5 This figure of the consolidated Financial Statement of 2012 has been adjusted and has been taken from the consolidated Financial Statement of
2013. 6 This figure of the consolidated Financial Statement of 2012 has been adjusted and has been taken from the consolidated Financial Statement of
2013.

page 6 of 190
reasons in € million
Eligible capital in accordance with §10 of the German Banking Act (KWG) in € million 9,811 10,776
Risk-weighted assets in € million 68,494 77,863
Overall ratio according to § 2 Paragraph 6 of the German Solvency Regulation (SolvV)* in % 14.32 13.84
Core capital ratio in % 11.84 10.85
* The overall ratio refers to the ratio of regulatory capital to risk-weighted assets.
Trend information There has been no material adverse change in the prospects of the Issuer since the date of its last published audited annual financial statements of 31 December 2013.
Significant change in the financial or trading position
There have been no material adverse changes in the financial or trading position of the Issuer since the date of its last published consolidated financial statements of 31 December 2013.
B.13 Description of any recent events particular to the Issuer which are to a material extent relevant to the evaluation of the Issuer’s solvency
See Element B.4b. The Issuer has implemented its Capital Boosting Programme and the herewith connected capital measures in August 2012. Within a state aid investigation procedure, the European Commission has approved all capital measures of the Capital Boosting Programme on 25 July 2012. The European Commission’s approval is based on a catalogue of commitments which were granted on the basis of a so-called restructuring plan (“Umstrukturierungsplan”) that sets out several conditions and commitments of the Issuer towards the European Commission. The compliance with these commitments is monitored by an independent monitoring trustee who regularly reports to the European Commission. NORD/LB and its Subsidiaries may become subject to stress testing exercises initiated by the German financial regulatory authorities Bundesanstalt für Finanzdienstleistungsaufsicht (“BaFin”) and Deutsche Bundesbank (the “German Central Bank”), the European Banking Authority (“EBA”) and/or the European Central Bank (“ECB”). Together with other large EU-based financial institutions, NORD/LB expects to be subject to the next EU-wide stress testing exercise by the EBA in 2014. The Issuer’s results of operations may be adversely affected if NORD/LB or any of the financial institutions with which the Issuer does business receives negative results on such stress tests. In the last such exercise conducted by the EBA in 2011, the EBA published more stringent capital requirements for certain larger banks in the EU, including NORD/LB. Also, in July 2013, the EBA recommended to national regulators to apply a so-called nominal capital floor. Alternatively, the relevant competent authority may waive the nominal floor requirement where it is determined that a common equity tier 1 ratio of 7 per cent., i.e. the minimum common equity tier 1 requirements and the capital conservation buffer as determined pursuant to fully implemented CRD IV/CRR requirements is met, i.e., without taking advantage of any transition rules such as phase-outs of certain capital instruments. While there is uncertainty as to the precise methodology, it is likely that the Issuer currently does not meet the nominal capital floor requirement. Instead of such nominal capital floor

page 7 of 190
requirement, the Issuer has therefore requested BaFin to apply the alternative requirement of a common equity tier 1 ratio to it, whereby it believes that it will satisfy such alternative requirement. It is not yet clear how BaFin will implement this recommendation and whether they will agree to apply the alternative testing method to the Issuer. Depending on BaFin’s decision, the Issuer may be required to take further action in relation to its regulatory capital. Meeting these or similar future requirements imposes significant costs on NORD/LB Group.
B.17 Credit ratings of the Issuer or its debt securities
At the date of this Supplement No. 1 of 16 May 2014 the Issuer has been assigned the following ratings for:
a.) non-guaranteed and unsubordinated liabilities:
Long term Short term
Moody’s7 A3 P-2 Fitch8 A F1
b.) guaranteed9 and unsubordinated liabilities:
Long term Short term
Moody’s Aa1 P-1 Fitch AAA F1
c.) subordinated capital
Lower Tier 2 Tier 1
Moody’s Ba1 Ba3 Fitch - -
Furthermore, at the date of the Supplement No. 1 of 16 May 2014 covered bonds (Pfandbriefe) issued by the Issuer have received the following rating(s):
Public Sector Mortgage Aircraft Ship Pfandbriefe Pfandbriefe Pfandbriefe Pfandbriefe
Moody’s Aaa Aaa A1 – Fitch AAA – – –
Investors should keep in mind that a rating does not constitute a recommendation to purchase, sell or hold Instruments issued by the Issuer. Moreover, the ratings awarded by the rating agencies may at any time be suspended, downgraded or withdrawn.
7 “Moody’s” means Moody’s Deutschland GmbH, An der Welle 5, 60322 Frankfurt am Main. Moody’s has been established in the European
Union and is registered under Regulation (EC) no 1060/2009 of the European Parliament and the Council of 16 September 2009 on credit rating agencies as amended in its current version (the “CRA Regulation”). Moody’s Deutschland GmbH is listed in the “List of registered and certified CRA's” by the European Securities and Markets Authority (“ESMA”) on its website (http://www.esma.europa.eu) as published in accordance with the CRA Regulation.
8 “Fitch” means Fitch Deutschland GmbH, Taunusanlage 17, 60325 Frankfurt am Main. Fitch has been established in the European Union and is registered under the “CRA Regulation”. Fitch Deutschland GmbH is listed in the “List of registered and certified CRA’s” by the ESMA on its website (http://www.esma.europa.eu) as published in accordance with the CRA Regulation.
9 The ratings for guaranteed liabilities apply to all liabilities entered into no later than 18 July 2001 and transactions concluded in the transition period of 19 July 2001 to 18 July 2005 with a maximum term to 31 December 2015.

page 8 of 190
3. The wording of Element D.2., Section D. „Risks“, paragraph 9 and 10 shall be deleted and replaced by the following:
D.2 Key information on the key risks that are specific to the Issuer or its industry
[…] Due to the current situation in the global market, in particular as regards the low level of utilisation of capacity and freight rates remaining under pressure, particularly in the container and tanker segment, NORD/LB and its Subsidiaries anticipate within the shipping sector a difficult market environment and market uncertainties which will affect the “Ships and Aircraft Customers” segment. Therefore, NORD/LB and its Subsidiaries are preparing for a continued crisis in the shipping sector during the next quarters. The ongoing crisis in the shipping sector will continue to have a negative impact on the Issuer’s profit situation and may result in a further deterioration of the shipping portfolio and a further increase in expenses for loan loss provisions during the next following quarters. Furthermore, the worsening situation in the shipping portfolio is resulting in an increase in regulatory deficits in valuation allowances (shortfall), which reduce risk capital. […]
CHAPTER I “ZUSAMMENFASSUNG” 4. The second sentence of Element A.1, Section A. „Einleitung und Warnhinweise“ after its
second paragraph shall be deleted and replaced by the following:
„Der Anleger sollte jede Entscheidung, in die Schuldverschreibungen zu investieren, auf den Prospekt als Ganzen, wie durch den Nachtrag Nr. 1 vom 16. Mai 2014 aktualisiert, stützen.“
5. Elements B.4b, B.12, B.13 and B.17, Section B. „Emittentin“ shall be deleted and replaced by
the following:
B.4b Alle bereits bekannten Trends, die sich auf die Emittentin und die Branchen, in denen sie tätig ist, auswirken.
Die Finanzkrise hat zahlreiche Regierungen und supranationale Organisationen zu maßgeblichen Änderungen bei der Bankenregulierung veranlasst. Insbesondere die Umsetzung der Reform 2010 (Basel III), die durch den Baseler Ausschuss für Bankenaufsicht für die Neue Baseler Eigenkapitalvereinbarung über die Eigenkapitalanforderungen für Finanzinstitute (Basel II) sowie die Kapitaladäquanzverordnung (CRR) entwickelt worden ist, wird in Zukunft bei der Emittentin zu höheren Eigenkapitalanforderungen und erhöhten Anforderungen hinsichtlich der Liquidity Coverage Ratio (LCR) und der Net Stable Funding Ratio (NSFR) führen. Aufgrund der aktuellen Situation auf dem Weltmarkt, besonders im Hinblick auf die geringe Kapazitätsauslastung und die unter Druck bleibenden Frachtraten, insbesondere im Container-und Tanker-Segment, gehen die NORD/LB und ihrer Tochtergesellschaften im Bereich der Schiffsfinanzierungen von einem schwierigen Marktumfeld und Marktunsicherheiten aus, was Auswirkungen auf das Schiffs- und Flugzeugsegment hat. Daher bereiten sich die NORD/LB und ihre Tochtergesellschaften auf eine anhaltende Krise im Schiffssektor in den nächsten Quartalen vor. Die anhaltende Krise im Schiffssektor kann auch weiterhin einen negativen Einfluss auf die Gewinnsituation der Emittentin haben und zu einer weiteren Verschlechterung des Schiffsportfolios sowie einer weiteren Erhöhung der Aufwendungen für die

page 9 of 190
Risikovorsorge in den nächsten folgenden Quartalen führen. Darüber hinaus führt die Verschlechterung im Schiffsportfolio zu gestiegenen aufsichtsrechtlichen Wertberichtigungsfehlbeträgen, die das Risikokapital mindern. Die Liquiditätssituation an den Märkten ist weiterhin durch die Unsicherheit in Bezug auf die möglichen mittel- und langfristigen Auswirkungen der Staatsschuldenkrise der EU-Peripherieländer geprägt, so dass sich jeder der oben genannten Faktoren nachteilig auf das Geschäft, das Betriebsergebnis oder die Finanzlage der NORD/LB und ihrer Tochtergesellschaften auswirken kann.
B.12 Ausgewählte wesentliche historische Finanzinformationen über den Emittenten, die für jedes Geschäftsjahr des von den historischen Finanzinformationen abgedeckten Zeitraums und für jeden nachfolgenden Zwischenberichts-zeitraum vorgelegt werden, sowie Vergleichsdaten für den gleichen Zeitraum des vorangegangenen Geschäftsjahrs, es sei denn, diese Anforderung ist durch Vorlage der Bilanzdaten zum Jahresende erfüllt
Quellen: Geprüfter Konzernabschluss des NORD/LB Konzerns zum 31. Dezember 2012 und 31. Dezember 2013.
01. Jan - 31. Dez. 2013
01. Jan - 31. Dez. 2012
Erfolgszahlen (in Mio. €)
Zinsüberschuss 1.931 1.95910
Risikovorsorge im Kreditgeschäft 846 59811
Provisionsüberschuss 163 168
Ergebnis aus erfolgs-wirksam zum Fair Value bewerteten Finanz-instrumenten einschließlich Hedge Accounting 73 -122
Ergebnis aus Finanzanlagen 11 -5
Ergebnis aus at Equity bewerteten Unternehmen 33 - 14
Verwaltungsaufwand 1.166 1.158
Sonstiges betriebliches Ergebnis 69 -99
Ergebnis vor Umstruk-turierung und Steuern 268 13112
Umstrukturierungs- ergebnis -38 -34
Aufwendungen für öffentliche Garantien i.V.m. Umstrukturierungen 69 1913
Ergebnis vor Steuern 161 7814
Ertragsteuern -84 -4
Konzernergebnis 245 8215
Kennzahlen (in %)
Cost-Income-Ratio (CIR) 51,4 61,2
Return-on-Equity (RoE) 2,1 1,0
10
Diese Position des Konzernjahresabschlusses 2012 ist angepasst worden und dem Konzernjahresabschluss 2013 entnommen. 11
Diese Position entspricht der Position aus dem Konzernjahresabschluss 2012, im Konzernjahresabschluss 2013 ist hierfür eine andere Darstellungsweise gewählt worden. 12
Diese Position des Konzernjahresabschlusses 2012 ist angepasst worden und dem Konzernjahresabschluss 2013 entnommen. 13
Diese Position entspricht der Position aus dem Konzernjahresabschluss 2012, im Konzernjahresabschluss 2013 ist hierfür eine andere Darstellungsweise gewählt worden. 14
Diese Position des Konzernjahresabschlusses 2012 ist angepasst worden und dem Konzernjahresabschluss 2013 entnommen. 15
Diese Position des Konzernjahresabschlusses 2012 ist angepasst worden und dem Konzernjahresabschluss 2013 entnommen.

page 10 of 190
31. Dez. 2013 31. Dez. 2012
Bilanzzahlen (in Mio. €)
Summe Aktiva / Summe
Passiva 200.845 225.550
Verbindlichkeiten gegenüber Kunden 54.861 55.951
Forderungen an Kunden 107.661 114.577
Eigenkapital 8.190 7.700
Regulatorische Kennzahlen
Kernkapital für Solvenzzwecke (in Mio. €) 8.112 8.451
Anrechenbare Eigenmittel gemäß § 10 KWG (in Mio. €) 9.811 10.776
Risikogewichtete Aktiva (in Mio. €) 68.494 77.863
Gesamt-kennziffer gemäß § 2 Abs. 6 SolV*(in %) 14,32 13,84
Kernkapitalquote (in %) 11,84 10,85
*Die Gesamtkennziffer bezeichnet das Verhältnis von aufsichtsrechtlichen Eigenmitteln zu risikogewichteten Aktiva.
Trend Informationen Seit dem 31. Dezember 2013, dem Bilanzstichtag für den letzten veröffentlichten geprüften Abschluss, sind keine wesentlichen negativen Veränderungen in den Aussichten der Emittentin eingetreten.
Wesentliche Veränderungen bei Finanzlage oder Handelsposition des Emittenten
Seit dem 31. Dezember 2013, dem Bilanzstichtag für den letzten veröffentlichten Konzernabschluss, sind keine wesentlichen Veränderungen in der Finanzlage oder der Handelsposition der Emittentin und des NORD/LB Konzerns eingetreten.
B.13 Beschreibung aller Ereignisse aus der jüngsten Zeit der Geschäftstätigkeit des Emittenten, die für die Bewertung seiner Zahlungsfähigkeit in hohem Maße relevant sind.
Siehe Element B.4b. Die Emittentin hat ihr im Jahr 2011 begonnenes Kapitalstärkungs-programm und die damit verbundenen Kapitalmaßnahmen im August 2012 umgesetzt. Die EU Kommission hat im Rahmen einer beihilferechtlichen Prüfung am 25. Juli 2012 alle Kapitalmaßnahmen im Rahmen des von der Nord-deutsche Landesbank implementierten Kapitalstärkungsprogramms final genehmigt. Grundlage der Entscheidung der EU Kommission ist ein sogenannter Umstrukturierungsplan, in dem die durch die NORD/LB gegenüber der EU Kommission gemachten Zusagen und Auflagen zusammengefasst worden sind. Die Einhaltung der Zusagen der NORD/LB wird durch einen Treuhänder überwacht, der der EU Kommission gegenüber regelmäßigen Bericht erstattet. Die NORD/LB und ihre Tochtergesellschaften könnten Stresstestmaßnahmen unterliegen, die von den deutschen Finanzaufsichtsbehörden, der Bundesanstalt für Finanzdienstleistungsaufsicht (“BaFin”) und der Deutschen Bundesbank, der Europäischen Bankenaufsichtsbehörde (“EBA”) und/oder der Europäischen Zentralbank (“EZB”) eingeleitet werden. Die NORD/LB geht davon aus, dass sie zusammen mit anderen großen in der EU ansässigen Finanzinstituten Gegenstand der nächsten EU-weiten Stresstest-Initiative der EBA im Jahr 2014 sein wird. Es könnte nachteilige Auswirkungen auf die Ergebnisse der Geschäftstätigkeit der

page 11 of 190
Emittentin haben, wenn die NORD/LB oder eines der Finanzinstitute, mit denen sie Geschäfte tätigt, bei diesen Stresstests negative Ergebnisse verzeichnet. Anlässlich der letzten derartigen Maßnahme, die von der EBA 2011 durchgeführt wurde, veröffentlichte die EBA für bestimmte größere Banken in der EU, einschließlich der NORD/LB, verschärfte Eigenkapitalanforderungen. Im Juli 2013 empfahl die EBA außerdem den nationalen Aufsichtsbehörden die Anwendung eines sogenannten nominellen Mindestkapitals. Alternativ kann die betreffende zuständige Behörde auf die Anforderung eines nominellen Mindestkapitals verzichten, wenn festgestellt wird, dass eine Kernkapitalquote von 7% vorliegt, d.h. die Mindestanforderungen an das Kernkapital sowie der Kapitalerhaltungspuffer gemäß den Anforderungen der vollständig umgesetzten CRD IV/CRR eingehalten werden, ohne dass Übergangsregelungen, wie z.B. der stufenweise Abbau bestimmter Kapitalinstrumente, in Anspruch genommen werden. Obwohl hinsichtlich der genauen Methode noch Unsicherheit besteht, erfüllt die Emittentin derzeit wahrscheinlich nicht die Anforderungen an das nominelle Mindestkapital. Daher hat die Emittentin die BaFin gebeten, anstatt der nominellen Mindestkapitalanforderungen alternativ die Anforderung einer Kernkapitalquote auf sie anzuwenden, wobei sie der Ansicht ist, diese alternative Anforderung erfüllen zu können. Es steht noch nicht fest, wie die BaFin diese Empfehlung umsetzen wird und ob sie bereit ist, die alternative Testmethode auf die Emittentin anzuwenden. In Abhängigkeit von der Entscheidung der BaFin könnte die Emittentin verpflichtet sein, weitere Maßnahmen in Bezug auf ihr regulatorisches Kapital zu treffen. Durch die Erfüllung dieser oder ähnlicher künftiger Anforderungen entstehen der NORD/LB-Gruppe beträchtliche Kosten.
B.17 Kreditratings des Emittenten oder ihrer Schuldtitel
Zum Datum des Nachtrags. Nr. 1 vom 16. Mai 2014 hat die Emittentin die folgenden Ratings erhalten: a.) für ungarantierte und nicht nachrangige Verbindlichkeiten:
Langfristig Kurzfristig
Moody’s16 A3 P-2 Fitch17 A F1
b.) für garantierte 18 und nicht nachrangige Verbindlichkeiten:
Langfristig Kurzfristig
Moody’s Aa1 P-1 Fitch AAA F1
c.) für Nachrangkapital
Lower Tier 2 Tier 1
16 Moody’s Deutschland GmbH, An der Welle 5, 60322 Frankfurt am Main hat ihren Sitz in der Europäischen Gemeinschaft und ist seit dem
31. Oktober 2011 gemäß der Verordnung (EG) Nr. 1060/2009 des Europäischen Parlaments und des Rates vom 16. September 2009 über Ratingagenturen in der jeweils gültigen Fassung („CRA Verordnung“) registriert. Moody’s Deutschland GmbH ist in der „List of registered and certified CRA’s“ aufgeführt, die von der European Securities and Markets Authority (ESMA) auf ihrer Internetseite (http://www.esma.europa.eu) gemäß der CRA Verordnung veröffentlicht wird.
17 Fitch Deutschland GmbH, Taunusanlage 17, 60325 Frankfurt am Main hat ihren Sitz in der Europäischen Gemeinschaft und ist seit dem 31. Oktober 2011 gemäß der CRA registriert. Fitch Deutschland GmbH ist in der „List of registered and certified CRA’s“ aufgeführt, die von der European Securities and Markets Authority auf ihrer Internetseite (http://www.esma.europa.eu) gemäß der CRA Verordnung veröffentlicht wird.
18 Das Rating für garantierte Verbindlichkeiten ist für alle Verbindlichkeiten gültig, die bis zum 18. Juli 2001 eingegangen wurden sowie für Geschäfte, die innerhalb der Übergangszeit vom 19. Juli 2001 bis zum 18. Juli 2005 mit einer Laufzeit längstens bis zum 31. Dezember 2015 abgeschlossen wurden.

page 12 of 190
Moody’s Ba1 Ba3 Fitch - -
Zum Datum des Nachtrags Nr. 1 vom 16. Mai 2014 wurden von der NORD/LB begebene Pfandbriefe mit den folgenden Ratings bewertet:
Öffentliche Hypotheken- Flugzeug- Schiffs- Pfandbriefe pfandbriefe pfandbriefe pfandbriefe
Moody’s Aaa Aaa A1 – Fitch AAA – – –
Anleger sollten beachten, dass ein Rating keine Empfehlung darstellt, von der Emittentin begebene Schuldverschreibungen zu kaufen, verkaufen oder zu halten. Zudem können die Ratings von den Rating Agenturen jederzeit ausgesetzt, herabgesetzt oder zurückgezogen werden.
6. The wording of Element D.2., Section D. „Risiken“, paragraph 9 and 10 shall be deleted and
replaced by the following:
D.2 Zentrale Angaben zu den zentralen Risiken, die dem Emittenten eigen sind
[…] Aufgrund der aktuellen Situation auf dem Weltmarkt, besonders im Hinblick auf die geringe Kapazitätsauslastung und die unter Druck bleibenden Frachtraten, insbesondere im Container-und Tanker-Segment, gehen die NORD/LB und ihrer Tochtergesellschaften im Bereich der Schiffsfinanzierungen von einem schwierigen Marktumfeld und Marktunsicherheiten aus und bereiten sich auf eine anhaltende Krise im Schiffssektor in den nächsten Quartalen vor. Die anhaltende Krise im Schiffssektor kann auch weiterhin einen negativen Einfluss auf die Gewinnsituation der Emittentin haben und zu einer weiteren Verschlechterung des Schiffsportfolios sowie einer weiteren Erhöhung der Aufwendungen für die Risikovorsorge in den nächsten folgenden Quartalen führen. Darüber hinaus führt die Verschlechterung im Schiffsportfolio zu gestiegenen aufsichtsrechtlichen Wertberichtigungsfehlbeträgen, die das Risikokapital mindern. […]

page 13 of 190
III. CHANGES IN RISC FACTORS Chapter II “Risk Factors”, No. 2 „Risk factors relating to regulatory aspects concerning credit institutions in general“ shall be deleted and replaced in its last subsection “Risks in relation to separation of proprietary trading and other high-risk trading from other banking business (“Trennbankengesetz”)” by the following:
Risks in relation to separation of proprietary trading and other high-risk trading from other banking business. Upon request from the EU Internal Markets Commissioner Michel Barnier, a group of experts led by Erkki Liikanen proposed a set of recommendations for structural reforms to promote financial stability and efficiency of the EU banking sector which were published in October 2012 (the so-called Liikanen Report). In this respect, the EU Commission presented proposals for the future bank structure in the EU on 29 January 2014, in particular with respect to the so-called “system of institutional separation of commercial and investment banking functions” (Trennbankensystem). Thus, the largest and most complex EU banks with significant trading activities (measured as the ratio of trading activities to total assets or in terms of the absolute trading volume) shall be prevented from certain proprietary trading activities in financial instruments and commodities and supervisors shall be granted the power and, in certain instances, the obligation to require the transfer of other high-risk trading activities (potentially including market-making activities, complex derivatives and securitisation operations) to separate legal trading entities within the group. In August 2013, the German law act for the “ringfencing of risks and for the planning, recovery and resolution of credit institutions” (“Trennbankengesetz“) was published in the German Federal Gazette. Pursuant to the Trennbankengesetz, subject to certain criteria, it will be required that trading activities of credit institutions are legally segregated from the other business areas in separate subsidiaries. The provision applies to credit institutions that accept deposits and other repayable funds and grant loans for their own account, provided their balance sheet positions exceed certain thresholds. Accordingly, banks whose trading portfolio and liquidity reserves either exceed EUR 100 billion (absolute threshold) or exceed 20% of total assets and amount to at least EUR 90 billion (relative threshold) may become subject to the separation requirement. The prohibition does not apply to hedging activities performed to hedge transactions with clients, to manage interest rates, currencies and liquidity, or to buy or sell long-term equity investments. Any potential related separation requirement would not apply before 1 July 2015. Even though it is currently not clearly foreseeable how the future EU proposals in relation to the Liikanen Report and/or implementation of the Trennbankengesetz will affect Holders’ rights, it is conceivable that, if the Issuer must separate certain trading activities, the Issuer may have a fundamentally different risk assumption or creditworthiness or that this may result in other negative effects on the business model and/or the profitability of the Issuer or that this may have other negative impact on the Issuer’s business model which in turn may have a material prejudicial effect on Holders’ rights.

page 14 of 190
IV. CHANGES RELATING TO DESCRIPTION OF NORDDEUTSCHE LANDESBANK - GIROZENTRALE -
1. Chapter IV. „Description of Norddeutsche Landesbank – Girozentrale –“, „1. „Auditors“
shall be deleted and replaced by the following: The consolidated financial statements of Norddeutsche Landesbank – Girozentrale – and its consoli-dated subsidiaries (the “NORD/LB Group”) for the financial year ended 31 December 2012 (the “Financial Year 2012” and the “Consolidated Financial Statements 2012”) and for the financial year ended 31 December 2013 (the “Financial Year 2013” and the “Consolidated Financial Statements 2013”) were prepared in accordance with International Financial Reporting Standards (IFRS), as adopted by the EU, and the additional requirements of German commercial law pursuant to § 315a (1) of the German Commercial Code (Handelsgesetzbuch – “HGB”), and have been audited, together with the respective group management reports (Konzernlageberichte) in accordance with § 317 HGB and German generally accepted standards for the audit of financial statements (the “German GAAP”). KPMG Wirtschaftsprüfungsgesellschaft AG (“KPMG”) audited the Consolidated Financial Statements 2012 and the Consolidated Financial Statements 2013. KPMG issued an unqualified auditor’s report (uneingeschränkter Bestätigungsvermerk) on the Consolidated Financial Statements 2012 and 2013 and the group management report of NORD/LB Group for the Financial Year 2012 and the Financial Year 2013. The unconsolidated financial statements of Norddeutsche Landesbank – Girozentrale – for the Financial Year 2013 (the “Annual Accounts 2013”) were prepared in accordance with German GAAP and have been audited, together with the management report (Lagebericht), in accordance with § 317 HGB and German GAAP for the audit of financial statements by KPMG. KPMG has issued an unqualified auditor’s report (uneingeschränkter Bestätigungsvermerk) on the Annual Accounts 2013 and the management report of Norddeutsche Landesbank – Girozentrale – for the Financial Year 2013. KPMG is a member of the German Chamber of Auditors (Deutsche Wirtschaftsprüferkammer).
2. In Chapter IV. „Description of Norddeutsche Landesbank – Girozentrale –“Section 2 „General information relating to the Issuer“ the third paragraph shall be deleted and replaced by the following:
NORD/LB is a public law institution incorporated under German public law with legal capacity (rechtsfähige Anstalt des öffentlichen Rechts) governed by the state treaty dated 22 August 2007 between the German Federal States of Lower Saxony (Niedersachsen), Saxony-Anhalt (Sachsen-Anhalt) and Mecklenburg-Western Pomerania (Mecklenburg-Vorpommern) as amended on 12 July 2011, which came into force on 31 December 2011, (the “State Treaty”) and the Issuer’s Articles of Association (Satzung) approved by resolution of the Owners’ Meeting (Trägerversammlung) on 9 December 2013, which became effective on 1 January 2014 (the “Articles of Association”).
3. In Chapter IV. „Description of Norddeutsche Landesbank – Girozentrale –“ Section „3. „Ratings“ shall be deleted and replaced by the following:
As of the date of this Prospectus, the Issuer has received the following credit ratings from Moody’s Deutschland GmbH, An der Welle 5, 60322 Frankfurt am Main, Germany (“Moody’s”) and Fitch Deutschland GmbH, Taunusanlage 17, 60325 Frankfurt am Main, Germany (“Fitch”): a) for long-term, non-guaranteed and unsubordinated liabilities:
A3 by Moody’s19 and
19 Obligations A rated are considered upper-medium grade and low credit risk. Moody's appends numerical modifiers 1, 2, and 3 to each generic
rating classification from Aa through Caa. The modifier 1 indicates that the obligation ranks in the higher end of its generic rating category; the modifier 2 indicates a mid-range ranking; and the modifier 3 indicates a ranking in the lower end of that generic rating category (source: http://www.moody.com).

page 15 of 190
A by Fitch20. b) for short-term, non-guaranteed and unsubordinated liabilities:
P-2 by Moody’s21 and
F1 by Fitch22. c) for long-term, guaranteed23 and unsubordinated liabilities:
Aa1 by Moody’s24 and
AAA by Fitch25. d) for short-term, guaranteed and unsubordinated liabilities:
P-1 by Moody’s26 and F1 by Fitch27 e) for subordinated capital:
Lower Tier2: Ba1 by Moody’s28 Tier 1 Ba3 by Moody’s29 Furthermore, at the date of this Prospectus covered bonds (Pfandbriefe) issued by NORD/LB have received the following ratings. a) Public Sector Pfandbriefe (Öffentliche Pfandbriefe):
Aaa by Moody’s30 and
AAA by Fitch31 b) Mortgage Pfandbriefe (Hypothekenpfandbriefe):
Aaa by Moody’s32 c) Ship Pfandbriefe (Schiffspfandbriefe):
20 “A” ratings denote expectations of a low default risk. This capacity may, nevertheless, be more vulnerable to adverse business or economic
conditions than is the case for higher ratings (source: http:// www.fitchratings.com). 21 Issuers (or supporting institutions) rated “Prime-2” have a strong ability to repay short-term debt obligations (source: http://www.moodys.com). 22 “F1” indicates the strongest intrinsic capacity for timely payment of financial commitments; may have an added “+” to denote any exceptionally
strong credit feature (source: http://www.fitchratings.com). 23 The ratings for guaranteed liabilities apply to all guaranteed liabilities entered into no later than 18 July 2001 and transactions concluded in the
transition period from 19 July 2001 to 18 July 2005 with a maximum term to 31 December 2015. 24 Obligations rated Aa are judged to be of high quality and are subject to very low credit risk. Moody's appends numerical modifiers 1, 2, and 3 to
each generic rating classification from Aa through Caa. The modifier 1 indicates that the obligation ranks in the higher end of its generic rating category; the modifier 2 indicates a mid-range ranking; and the modifier 3 indicates a ranking in the lower end of that generic rating category (source: http://www.moodys.com).
25 “AAA” ratings denote the lowest expectation of default risk. They are assigned only in cases of exceptionally strong capacity for payment of financial commitments. This capacity is highly unlikely to be adversely affected by foreseeable events (source: http://fitchratings.com.) 26
“P-1” Issuers (or supporting institutions) rated Prime-1 have a superior ability to repay short-term debt obligations (source: http://www.moodys.com). 27
F1” indicates the strongest intrinsic capacity for timely payment of financial commitments; may have an added “+” to denote any exceptionally strong credit feature (source: http://www.fitchratings.com).
28 “Ba1” Obligations rated Ba are judged to be speculative and are subject to substantial credit risk. The modifier 1 indicates that the obligation
ranks in the higher end of its generic rating category (source: http://www.moodys.com) 29 “Ba3” Obligations rated Ba are judged to be speculative and are subject to substantial credit risk. The modifier 3 indicates a ranking in the lower end of that generic rating category (source: http://www.moodys.com). 30 Obligations rated “Aaa” are judged to be of the highest quality, with minimal risk. Moody's appends numerical modifiers 1, 2, and 3 to each
generic rating classification from Aa through Caa. The modifier 1 indicates that the obligation ranks in the higher end of its generic rating category; the modifier 2 indicates a mid-range ranking; and the modifier 3 indicates a ranking in the lower end of that generic rating category (source: http://www.moodys.com).
31 “AAA” ratings denote the lowest expectation of default risk. They are assigned only in cases of exceptionally strong capacity for payment of financial commitments. This capacity is highly unlikely to be adversely affected by foreseeable events. (source:http://www.fitchratings.com).
32 Obligations rated “Aaa” are judged to be of the highest quality, with minimal risk (source: http://www.moodys.com).

page 16 of 190
Not rated.
d) Aircraft Pfandbriefe (Flugzeugpfandbriefe)
A1 by Moody’s33. Moody’s and Fitch are established in the European Union and are currently registered pursuant to Regulation (EC) no 1060/2009 of the European Parliament and the Council of 16 September 2009 on credit rating agencies as amended (the “CRA Regulation”). Moody’s and Fitch are listed in the “List of registered and certified CRAs” as published by the European Securities and Markets Authority on its website (http://www.esma.europa.eu) in accordance with the CRA Regulation. Instruments to be issued under this Prospectus may be rated or unrated. Where a Series of Instruments is rated, its rating may not be the same as the rating applicable to the Issuer. Furthermore, a security rating is not a recommendation to buy, sell or hold securities and may be revised or withdrawn by the assigning rating agency at any time. 4. Chapter IV. „Description of Norddeutsche Landesbank – Girozentrale –“, Section 4. „Recent events in the business activities of Norddeutsche Landesbank – Girozentrale –“ shall be deleted in its first two subsection (“Capital-Boosting-Measures” and “EU process: restructuring plan and commitments made by the NORD/LB Group”) and shall be replaced by the following: Capital-Boosting-Measures and EU-process The Issuer has implemented its Capital Boosting Programme and the herewith connected capital measures in August 2012. Within a state aid investigation procedure, the European Commission has approved all capital measures of the Capital Boosting Programme on 25 July 2012. The European Commission’s approval is based on a catalogue of commitments which were granted on the basis of a so-called restructuring plan (“Umstrukturierungsplan”) that sets out several conditions and commitments of the Issuer towards the European Commission. The compliance with these commitments is monitored by an independent monitoring trustee who regularly reports to the European Commission. Stresstests NORD/LB and its Subsidiaries may become subject to stress testing exercises initiated by the German financial regulatory authorities Bundesanstalt für Finanzdienstleistungsaufsicht (“BaFin”) and Deutsche Bundesbank (the “German Central Bank”), the European Banking Authority (“EBA”) and/or the European Central Bank (“ECB”). Together with other large EU-based financial institutions, NORD/LB expects to be subject to the next EU-wide stress testing exercise by the EBA in 2014. The Issuer’s results of operations may be adversely affected if NORD/LB or any of the financial institutions with which the Issuer does business receives negative results on such stress tests. In the last such exercise conducted by the EBA in 2011, the EBA published more stringent capital requirements for certain larger banks in the EU, including NORD/LB. Also, in July 2013, the EBA recommended to national regulators to apply a so-called nominal capital floor. Alternatively, the relevant competent authority may waive the nominal floor requirement where it is determined that a common equity tier 1 ratio of 7%, i.e. the minimum common equity tier 1 requirements and the capital conservation buffer as determined pursuant to fully implemented CRD IV/CRR requirements is met, i.e., without taking advantage of any transition rules such as phase-outs of certain capital instruments. While there is uncertainty as to the precise methodology, it is likely that the Issuer currently does not meet the nominal capital floor requirement. Instead of such nominal capital floor requirement, the Issuer has therefore requested BaFin to apply the alternative requirement of a common equity tier 1 ratio to it, whereby it believes that it will satisfy such alternative requirement. It is not yet clear how BaFin will
33 Obligations rated “A” are considered upper-medium grade and are subject to low credit risk.Moody's appends numerical modifiers 1, 2, and 3 to
each generic rating classification from Aa through Caa. The modifier 1 indicates that the obligation ranks in the higher end of its generic rating category; the modifier 2 indicates a mid-range ranking; and the modifier 3 indicates a ranking in the lower end of that generic rating category. (source: http://www.moodys.com).

page 17 of 190
implement this recommendation and whether they will agree to apply the alternative testing method to the Issuer. Depending on BaFin’s decision, the Issuer may be required to take further action in relation to its regulatory capital. Meeting these or similar future requirements imposes significant costs on NORD/LB Group. 5. Chapter IV. „Description of Norddeutsche Landesbank – Girozentrale –“, Section „8.
Governing bodies of Norddeutsche Landesbank – Girozentrale –“ shall be amended as follows:
[…] The Managing Board […] The Chart on Page 68 – 69 shall be deleted in its entirety and be replaced as follows: Name Company Mandates
Dr. Gunter Dunkel (Chairman)
Bremer Landesbank Kreditanstalt Oldenburg – Girozentrale –
1. Supervisory Board 2. General Working and
Credit Committee 3. Owners’ Meeting
(Trägerversammlung)
Continental AG Supervisory Board
Deutsche Hypothekenbank (Actien-Gesellschaft)
1. Supervisory Board (Chairman)
2. Credit Committee 3. Nomination Committee 4. Personnel Committee
(Chairman)
Norddeutsche Landesbank Luxembourg S.A.
1. Supervisory Board (Chairman)
2. Presidential Committee
NORD/LB Covered Finance Bank S.A.
Supervisory Board (Chairman)
Herr Thomas S. Bürkle Bremer Landesbank Kreditanstalt Oldenburg – Girozentrale –
Supervisory Board
Norddeutsche Landesbank Luxembourg S.A.
Supervisory Board
NORD/LB Covered Finance Bank S.A.
Supervisory Board
LHI Leasing GmbH Supervisory Board
Ulrike Brouzi NORD/LB Capital Management GmbH
Supervisory Board (Deputy Chairman)
NORD/LB Kapitalanlagegesellschaft AG
Supervisory Board (Deputy Chairman)
Norddeutsche Landesbank Luxembourg S.A.
Supervisory Board
NORD/LB Covered Finance Bank S.A.
Salzgitter AG, Stahl und Technologie
Supervisory Board
Supervisory Board

page 18 of 190
Name Company Mandates
Eckhard Forst Deutsche Hypothekenbank (Actien-Gesellschaft)
1. Supervisory Board (Deputy Chairman)
2. Credit Committee 3. Nomination Committee 4. Personnel Committee 5. Audit Committee
(Deputy Chairman)
LHI Leasing GmbH Supervisory Board (Deputy Chairman)
Dr. Hinrich Holm LBS Norddeutsche Landesbausparkasse Berlin/Hannover
1. Supervisory Board 2. Audit Committee
NORD/LB Capital Management GmbH
Supervisory Board (Chairman)
NORD/LB Kapitalanlagegesellschaft AG
Caplantic GmbH
Supervisory Board (Chairman)
Supervisory Board
Christoph Schulz LBS Norddeutsche Landesbausparkasse Berlin/Hannover
1. Supervisory Board (Chairman)
2. Personnel Committee of the Supervisory Board
Norddeutsche Landesbank Luxembourg S.A.
1. Supervisory Board 2. Presidential Committee
NORD/LB Covered Finance Bank S.A.
Supervisory Board
[…] The Owners’ Meeting (Trägerversammlung) […] The list of Members of the Owners’ Meeting on Page 73 - 74 shall be deleted in its entirety and be replaced as follows: The Owners’ Meeting (Trägerversammlung) currently comprises the ten members below, who may be contacted at Norddeutsche Landesbank – Girozentrale –’s business address.
• Thomas Mang, President of Lower Saxony Savings Banks and Giro Association (Niedersächsischer Sparkassen- und Giroverband), (Chairman of the Owners’ Meeting) (Trägerversammlung);
• Frank Berg, Chairman of the Managing Board of OstseeSparkasse Rostock, (First Deputy Chairman of the Owners’ Meeting) (Trägerversammlung);
• Harri Reiche, Chief Executive (Landrat) of the District of Burgenlandkreis;
• Ulrich Böckmann, Senior Counsellor (Regierungsdirektor) of the Ministry of Finance of the German Federal State of Saxony-Anhalt;
• Frank Doods (Deputy State Secretary (Staatssekretär) of the Ministry of Finance of the German Federal State of Lower Saxony);
• Dr. Ingolf Lange, Principal (Ministerialrat) in the Ministry of Finance of the German Federal State of Saxony-Anhalt;
• Michael Richter, Deputy State Secretary (Staatssekretär) of the Ministry of Finance of the German Federal State of Saxony;
• Jürgen Kiehne, Chairman of the Managing Board of Sparkasse Burgenlandkreis;

page 19 of 190
• Dr. Paul Krüger, Mayor of the City of Neubrandenburg;
• Ludwig Momann, Chairman of the Management Board of Sparkasse Emsland.
6. Chapter IV. „Description of Norddeutsche Landesbank – Girozentrale –“, Section „10.
Financial Information on the asset, financial and earnings position “ shall be deleted in its entirety and be replaced by the following:
Historical financial information The Consolidated Financial Statements 2013 and the auditor’s report (Bestätigungsvermerk) are included in pages F- 1 to F- 119 within the section “Financials”. The Annual Accounts 2013 and the auditor’s report (Bestätigungsvermerk) are included in pages F-121 – F-168 within the section “Financials”. The Consolidated Financial Statements 2012 and the auditor’s report (Bestätigungsvermerk) are incorporated by reference into this Prospectus and are contained in the Prospectus relating to the EUR 25,000,000,000 Programme for the Issuance of Debt Instruments on pages F- 44 to F-145 and incorporated into this Prospectus by reference (see section XI. “General Information 5. Incorporation by reference”).34 The Consolidated Financial Statements 2013 and the Consolidated Financial Statements 2012 were prepared in accordance with IFRS, as adopted by the EU, and the additional requirements of German commercial law pursuant to § 315a (1) HGB. The Annual Accounts 2013 were prepared in accordance with German GAAP. The Consolidated Financial Statements 2013 and the auditor’s report (Bestätigungsvermerk) contained in this Prospectus have been taken from the Annual Report (Geschäftsbericht) of the NORD/LB Group for the Financial Year 2013 respectively (see section XI. “General Information 4. Availability of documents”). The Annual Accounts 2012 and the auditor’s report (Bestätigungsvermerk) have been taken from the Annual Report (Geschäftsbericht) of Norddeutsche Landesbank – Girozentrale – for the Financial Year 2012 (see section XI. “General Information 4. Availability of documents”). The auditor's reports (Bestätigungsvermerke) with respect to the Consolidated Financial Statements 2012 and the Consolidated Financial Statements 2013 were issued in accordance with § 322 HGB on the audited consolidated financial statements and the group management reports (Konzernlage-berichte) each as a whole, respectively. The respective group management reports for the Financial Year 2012 and the Financial Year 2013 are neither included nor incorporated by reference in this Prospectus. The auditor’s report (Bestätigungsvermerk) with respect to the Annual Accounts 2013 of Norddeutsche Landesbank – Girozentrale – was issued in accordance with § 322 HGB on the unconsolidated financial statements and the management report (Lagebericht) as a whole. The management report is neither included nor incorporated by reference in this Prospectus. Some figures of the audited consolidated financial statements of NORD/LB Group for the fiscal year 2012 have been adjusted. The adjusted figures are displayed in the audited consolidated financial statements of NORD/LB Group for the fiscal year 2013.
34 Some figures of the consolidated Financial Statement of 2012 have been adjusted, as described in the consolidated Financial Statement of 2013, see annual report of NORD/LB Group of 2013 at Notes (2), pages 153 ff.

page 20 of 190
V. CHANGES RELATING TO GENERAL INFORMATION 1. Chapter XI. „General Informationen“ Section 4. „Availability of documents“ shall be deleted and
replaced by the following: From the date hereof and at least throughout the life of this Prospectus, copies of the following documents (together with English translations) may be inspected at the registered office of NORD/LB, in its capacity as Issuer and Paying Agent in Germany, and at the specified office of the Luxembourg Listing Agent and Paying Agent in Luxembourg, in each case during usual business hours, on any workday (Saturdays, Sundays and public holidays excepted): (i) State Treaty dated 22 August 2007, as amended on 12 July 2011;
(ii) the Articles of Association (Satzung) of Norddeutsche Landesbank – Girozentrale –;
(iii) the Annual Report (Geschäftsbericht) of NORD/LB Group for the Financial Year 2013;
(iv) the Annual Report (Geschäftsbericht) of Norddeutsche Landesbank – Girozentrale – for the Financial Year 2013;
(v) the Annual Report (Geschäftsbericht) of NORD/LB Group for the Financial Year 2012;
(vi) the Dealer Agreement dated on or about 14 August 2013;
(vii) the Fiscal Agency Agreement dated on or about 14 August 2013;
(viii) this Prospectus and any Supplement hereto. The documents mentioned under (i) to (v) and (viii) are also available in electronic form. They are available on the Issuer’s website (http://www.nordlb.de). The Final Terms will be published on the Issuer’s website (http://www.nordlb.de) with regard to Instruments which are either listed on a regulated market on a stock exchange located in member state of the European Economic Area or publicly offered in such member state only. 2. Chapter XI. „General Information“ Section 5. „Incorporation by reference“ shall in its second
paragraph be deleted and replaced by the following: Document Pages Reference Page in this Prospectus Debt Issuance Programme Prospectus dated 14 August 2013 (Consolidated Financial Statements 2012) F 44 - F 145 74 Some figures of the audited consolidated financial statements of NORD/LB Group for the fiscal year 2012 have been adjusted. The adjusted figures are displayed in the audited consolidated financial statements of NORD/LB Group for the fiscal year 2013.
page 21 of 190
VI. CHANGES RELATING TO FINANCIALS Chapter XII. “FINANCIALS” shall be deleted and replaced by the following: The following English-language Consolidated Financial Statements 2013 of NORD/LB Group and the related auditor’s Report and the Annual Accounts 2013 of Norddeutsche Landesbank – Girozentrale – and the related auditor’s report are each translations of the German-language Consolidated Financial Statements 2013 of NORD/LB Group and the related auditor’s report and the Annual Accounts 2013 of Norddeutsche Landesbank – Girozentrale – and the related auditor’s report.

F-1
Income Statement F-4
Statement of Comprehensive Income F-5
Balance Sheet F-6
Statement of Changes in Equity F-8
Cash Flow Statement F-10
Notes to the Consolidated
Financial Statements F-12
General Disclosures F-12
(1) Principles for the preparation of the
Consolidated financial statements F-12
(2) Adjustment of figures for the previous year F-13
(3) Adopted IFRS F-14
(4) Consolidation principles F-19
(5) Basis of consolidation F-20
(6) Currency translation F-20
(7) Financial instruments F-20
(8) Risk provisioning F-29
(9) Property and equipment F-30
(10) Leases F-31
(11) Investment property F-31
(12) Intangible assets F-32
(13) Assets held for sale F-32
(14) Provisions for pensions and
similar obligations F-32
(15) Other provisions F-33
(16) Insurance business F-33
(17) Income taxes F-35
(18) Subordinated capital F-35
Segment Reporting F-36
(19) Segment reporting by business segment F-40
(20) Breakdown by geographical regions F-42
Notes to the Income Statement F-43
(21) Net interest income F-43
(22) Loan loss provisions F-44
(23) Net commission income F-44
(24) Profit / loss from financial instruments
at fair value through profit or loss F-45
(25) Profit / loss from hedge accounting F-46
(26) Profit / loss from financial assets F-46
(27) Profit / loss from investments
accounted for using the equity method F-47
(28) Administrative expenses F-47
(29) Other operating profit / loss F-48
(30) Reorganisation expenses F-49
(31) Expenses for public guarantees
related to reorganisation F-49
(32) Income taxes F-49
Notes to the Statement
of Comprehensive Income F-51
Notes to the Balance Sheet F-51
(33) Cash reserve F-51
(34) Loans and advances to banks F-52
(35) Loans and advances to customers F-52
(36) Risk provisioning F-53
(37) Balancing items for hedged
financial instruments F-53
(38) Financial assets at fair value
through profit or loss F-54
(39) Positive fair values from
hedge accounting derivatives F-55
(40) Financial assets F-55
(41) Investments accounted
for using the equity method F-56
(42) Property and equipment F-57
(43) Investment property F-57
(44) Intangible assets F-59
(45) Income tax assets F-60
Consolidated Financial Statementsfor the 2013 Reporting Period of NORD/LB Group

F-2
(46) Other assets F-62
(47) Liabilities to banks F-62
(48) Liabilities to customers F-63
(49) Securitised liabilities F-63
(50) Balancing items for hedged
financial instruments F-64
(51) Financial liabilities at fair value
through profit or loss F-64
(52) Negative fair values from
hedge accounting derivatives F-65
(53) Provisions F-65
(54) Income tax liabilities F-70
(55) Other liabilities F-71
(56) Subordinated capital F-71
(57) Equity F-72
Notes to the Cash Flow Statement F-73
Other Disclosures F-74
Notes to Financial Instruments F-74
(58) Fair value hierarchy F-74
(59) Carrying amounts by measurement
category F-84
(60) Net gains or losses
by measurement category F-85
(61) Impairments / reversals of impairment
by measurement category F-85
(62) Offsetting of financial assets
and financial liabilities F-86
(63) Transfer and derecognition
of financial assets F-87
(64) Derivative financial instruments F-88
(65) Disclosures concerning
to selected countries F-90
(66) Underlying transactions in effective hedges F-94
(67) Residual terms of financial liabilities F-95
(68) NORD/LB Group as assignor and assignee F-96
Other Notes F-97
(69) Equity management F-97
(70) Regulatory data F-98
(71) Foreign currency volume F-99
(72) Longer-term assets and liabilities F-100
(73) Lease agreements F-101
(74) Contingent liabilities
and other obligations F-101
(75) Other financial obligations F-102
(76) Subordinated assets F-104
(77) Trust activities F-104
Related Parties F-105
(78) Number of employees F-105
(79) Related parties F-105
(80) Members of governing bodies
and list of mandates F-111
(81) Remuneration of and loans
to governing bodies F-113
(82) Group auditor’s fees F-113
(83) Equity holdings F-114
Auditor!s Report F-119

F-3(page intentionally left blank)

F-4
Notes 1 Jan.– 31 Dec.
2013
(in € million)
1 Jan.– 31 Dec.
20121)
(in € million)
Change
(in %)
Interest income 9 787 12 280 – 20
Interest expenses 7 856 10 321 – 24
Net interest income 21 1 931 1 959 – 1
Loan loss provisions 22 846 598 41
Commission income 270 277 – 3
Commission expenses 107 109 – 2
Net commission income 23 163 168 – 3
Trading profit / loss – 136 517 > 100
Profit / loss from the fair value option 219 – 640 > 100
Profit / loss from financial instruments at fair value through profit or loss 24 83 – 123 > 100
Profit / loss from hedge accounting 25 – 10 1 > 100
Profit / loss from financial assets 26 11 – 5 > 100
Profit / loss from investments accounted for using the equity method 27 33 – 14 > 100
Administrative expenses 28 1 166 1 158 1
Other operating profit / loss 29 69 – 99 > 100
Earnings before reorganisation and taxes 268 131 > 100
Reorganisation expenses 30 – 38 – 34 12
Expenses for public guarantees related to reorganisation 31 69 19 > 100
Earnings before taxes 161 78 > 100
Income taxes 32 – 84 – 4 > 100
Consolidated profit 245 82 > 100
of which: attributable to the owners of NORD/LB 185 83
of which: attributable to non-controlling interests 60 – 1
1) Some previous year’s figures were adjusted as you can see at note (2) adjustment of figures for the previous year.
INCOME STATEMENT

F-5
STATEMENT OF COMPREHENSIVE INCOME
1 Jan.– 31 Dec.
2013
(in € million)
1 Jan.– 31 Dec.
20121)
(in € million)
Change
(in %)
Consolidated profit 245 82 > 100
Other comprehensive income which is not recycled in the income statement in subsequent periods
Revaluation of the net liability from defined benefit pension plans 73 – 500 > 100
Changes in value for investments accounted for using the equity method recognised directly in equity – – 14 – 100
Deferred taxes – 23 174 > 100
50 – 340 > 100
Other comprehensive income which is not recycled in the income statement in subsequent periods
Increase / decrease from available for sale (AfS) financial instruments
Unrealised profit / losses 322 877 – 63
Transfer due to realisation profit / loss 23 – 31 > 100
Translation differences of foreign business units
Unrealised profit / losses – 36 – 2 > 100
Changes in value investments accounted for using the equity method recognised directly in equity
– 27 54 > 100
Deferred taxes – 82 – 305 – 73
200 593 – 66
Other profit / loss 250 253 – 1
Comprehensive income for the period under review 495 335 48
of which: attributable to the owners of NORD/LB 423 308
of which: attributable to non-controlling interests 72 27
1) Some previous year’s figures were adjusted as you can see at note (2) adjustment of figures for the previous year.
For the breakdown of deferred taxes into their individual components the notes to the statement of comprehensive
income are referred to.
The comprehensive income of the NORD/LB Group comprises the earnings and expenses recognised in the income
statement and in other comprehensive income. The layout of the statement of comprehensive income has been
changed due to the amendment to IAS 1; for further information see Note (3) Adopted IFRS. The previous year’s
figures were adjusted accordingly.

F-6
Assets Notes 31 Dec. 2013
(in € million)
31 Dec. 20121)
(in € million)
Change
(in %)
Cash reserve 33 1 311 665 97
Loans and advances to banks 34 27 481 34 378 – 20
Loans and advances to customers 35 107 661 114 577 – 6
Risk provisioning 36 – 2 248 – 1 949 15
Balancing items for financial instruments hedged in the fair value hedge portfolio 37 – 171 – 3 > 100
Financial assets at fair value through profit or loss 38 13 541 17 920 – 24
Positive fair values from hedge accounting derivatives 39 3 872 4 924 – 21
Financial assets 40 47 043 52 423 – 10
Investments accounted for using the equity method 41 306 318 – 4
Property and equipment 42 601 635 – 5
Investment property 43 101 94 7
Intangible assets 44 136 142 – 4
Current income tax assets 45 69 50 38
Deferred income taxes 45 741 727 2
Other assets 46 401 649 – 38
Total assets 200 845 225 550 – 11
1) Some previous year’s figures were adjusted as you can see at note (2) adjustment of figures for the previous year.
BALANCE SHEET

F-7
Liabilities Notes 31 Dec. 2013
(in € million)
31 Dec. 20121)
(in € million)
Change
(in %)
Liabilities to banks 47 59 181 65 079 – 9
Liabilities to customers 48 54 861 55 951 – 2
Securitised liabilities 49 50 228 60 619 – 17
Balancing items for financial instruments 50 351 895 – 61
Financial liabilities at fair value through profit or loss 51 15 131 20 724 – 27
Negative fair values from hedge accounting derivatives 52 3 344 4 908 – 32
Provisions 53 4 303 4 137 4
Current income tax liabilities 54 116 162 – 28
Deferred income taxes 54 48 34 41
Other liabilities 55 379 508 – 25
Subordinated capital 56 4 713 4 833 – 2
Equity 57
Issued capital 1 607 1 607 –
Capital reserves 3 332 3 332 –
Retained earnings 2 220 2 011 10
Revaluation reserve 122 – 95 > 100
Currency translation reserve – 6 – 3 100
Equity capital attributable to the owners of NORD/LB 7 275 6 852 6
Equity capital attributable to non-controlling interests 915 848 8
8 190 7 700 6
Total liabilities and equity 200 845 225 550 – 11
1) Some previous year’s figures were adjusted as you can see at note (2) adjustment of figures for the previous year.

F-8
STATEMENT OF CHANGES IN EQUITY
(in € million)
Issued
capital
Capital
reserves
Retained
earnings
Revaluation
reserve
Currency
translation
reserve
Equity
attributable
to the
owners of
NORD/LB
Equity
attributable
to noncon-
trolling
interests
Consolidated
equity
Equity as at 1 Jan. 2012 1 494 3 175 2 480 – 543 – 3 6 603 – 57 6 546
Adjustments according to IAS 8 – – – 206 – 28 – – 234 234 –
Adjusted equity as at 1 Jan. 2012 1 494 3 175 2 274 – 571 – 3 6 369 177 6 546
Consolidated profit – – 83 – – 83 – 1 82
Increase / decrease from available for sale (AfS) financial instruments – – – 769 – 769 77 846
Changes in the value of investments for using the equity method – – 40 – – 40 – 40
Translation differences of foreign business units – – – – – – – 2 – 2
Revaluation of the net liability from defined benefit pension plans – – – 438 – – – 438 – 62 – 500
Deferred taxes – – 145 – 291 – – 146 15 – 131
Adjusted comprehensive income for the period under preview – – – 170 478 – 308 27 335
Distribution – – – 53 – – – 53 – 6 – 59
Capital increases / decreases 113 157 – – – 270 654 924
Changes in the basis of consolidation – – 59 – 2 – 57 – 8 49
Consolidation effects and other changes in capital – – – 99 – – – 99 4 – 95
Adjusted equity as at 31 Dec. 2012 1 607 3 332 2 011 – 95 – 3 6 852 848 7 700
The individual components of equity and their development in 2012 and 2013 are shown in the following statement
of changes in equity:

F-9
(in € million)
Issued
capital
Capital
reserves
Retained
earnings
Revaluation
reserve
Currency
translation
reserve
Equity
attributable
to the
owners of
NORD/LB
Equity
attributable
to noncon-
trolling
interests
Consolidated
equity
Equity as at 1 Jan. 2013 1 607 3 332 2 011 – 95 – 3 6 852 848 7 700
Consolidated profit – – 185 – – 185 60 245
Increase / decrease from available for sale (AfS) financial instruments – – – 315 21 336 9 345
Changes in the value of investments for using the equity method – – – 27 – – – 27 – – 27
Translation differences of foreign business units – – – – – 24 – 24 – 12 – 36
Revaluation of the net liability from defined benefit pension plans – – 72 – – 72 1 73
Deferred taxes – – – 23 – 96 – – 119 14 – 105
Comprehensive income for the period under preview – – 207 219 – 3 423 72 495
Distribution – – 1 – – 1 – 5 – 4
Capital increases / decreases – – – – – – – –
Changes in the basis of consolidation – – 4 – 2 – 2 – 2
Consolidation effects and other changes in capital – – – 3 – – – 3 – – 3
Equity as at 31 Dec. 2013 1 607 3 332 2 220 122 – 6 7 275 915 8 190
The consolidation effects and other changes in equity mainly comprise transactions which result in changes in shareholdings without changing
the consolidation method.
For a more detailed account, Note (57) Equity is referred to.

F-10
CASH FLOW STATEMENT
1 Jan.– 31 Dec.
2013
(in € million)
1 Jan.– 31 Dec.
2012 1)
(in € million)
Change
(in %)
Consolidated profit for the period 245 82 > 100
Adjustment for non-cash items
Depreciation, impairment and write-ups of property and equipment and financial assets 156 583 – 73
Increase / decrease in provisions 171 199 – 14
Gains / losses from the disposal of property and equipment and financial assets – 8 – 32 – 75
Increase / decrease in other non-cash items 817 589 39
Other adjustments net – 2 056 – 1 931 6
Sub-total – 675 – 510 32
Increase / decrease in assets and liabilities from operating activities after adjustment for non-cash item
Loans and advances to banks and customers 13 711 359 > 100
Trading assets 4 298 567 > 100
Other assets from operating activities 7 923 272 > 100
Liabilities to banks and customers – 7 144 1 278 > 100
Securitised liabilities – 10 825 – 5 393 > 100
Other liabilities from operating activities – 7 939 1 960 > 100
Interest received 7 238 8 207 – 12
Dividends received 21 49 – 57
Interest paid – 5 616 – 6 630 – 15
Income taxes paid – 38 – 44 – 14
Cash flow from operating activities 954 115 > 100

F-11
1 Jan.– 31 Dec.
2013
(in € million)
1 Jan.– 31 Dec.
20121)
(in € million)
Change
(in %)
Cash receipts from the disposal of
financial assets 54 22 > 100
property and equipment 1 31 – 97
Payments for acquisition of
financial assets – 20 – 8 > 100
property and equipment – 67 – 85 – 21
Cash receipts from the disposal of consolidated companies and other business units – 25 – 100
Cash flow from investing activities – 32 – 15 > 100
Cash receipts from equity contributions – 893 – 100
Payments to owners and non-controlling interests – – 131 – 100
Increase in funds from other capital 51 40 28
Decrease in funds from other capital – 103 – 728 – 86
Interest expenses on subordinated capital – 217 – 245 – 11
Dividends paid – 4 – 57 – 93
Cash flow from financing activities – 273 – 228 20
Cash and cash equivalents as at 1 January 665 796 – 16
Cash flow from operating activities 954 115 > 100
Cash flow from investing activities – 32 – 15 > 100
Cash flow from financing activities – 273 – 228 20
Total cash flow 649 – 128 > 100
Effects of changes in exchange rates – 3 – 3 –
Cash and cash equivalents as at 31 December 1 311 665 88
1) Some previous year’s figures were adjusted as you can see at note (2) adjustment of figures for the previous year.
With regard to cash and cash equivalents as at 31 December, Note (33) Cash Reserve is referred to.

F-12
NOTES TO THE CONSOLIDATED FINANCIAL STATEMENTS
General Disclosures
(1) Principles for the preparation of the consolidated financial statements
The consolidated financial statements of Norddeutsche Landesbank Girozentrale, Hanover, Braunschweig, Magde-
burg (NORD/LB) as at 31 December 2013 were prepared on the basis of Regulation (EC) No. 1606/2002 of the
European Parliament and Council of 19 July 2002 (IAS Regulation) in accordance with the International Financial
Reporting Standards (IFRSs) issued by the International Accounting Standards Board (IASB). Standards published at
the end of the financial year and adopted by the European Union were relevant. National regulations contained in the
German Commercial Code (Handelsgesetzbuch, HGB) under § 315a of the HGB were also observed. NORD/LB as
a group in terms of commercial law is referred to in the following as the NORD/LB Group.
The consolidated financial statements as at 31 December 2013 comprise the income statement, the statement of
comprehensive income, the balance sheet, the statement of changes in equity, the cash flow statement and the
notes. The segment reporting is shown in the notes (Note (19) Segment Reporting by Business Segment and
Note (20) Segment reporting by geographical segment). The reporting on the nature and scope of risks relating to
financial instruments in accordance with IFRS 7 is provided mainly in a risk report within the Group Management
Report.
Assets are always measured at amortised cost, apart from the financial instruments in accordance with IAS 39, which
are measured at fair value. In the accounting it was assumed that the company was a going concern. Earnings and
expenses are recognised pro rata temporis. They are recognised and reported in the period to which they relate.
Significant accounting policies are described below.
Estimations and assessments required in accordance with IFRS are made on the basis of assumptions and parame-
ters which in turn are made by management duly exercising its discretionary powers. The estimations and assess-
ments are reviewed on an ongoing basis and are based on experience and other factors, including expectations as to
future events which appear reasonable under prevailing circumstances. In the process global developments and the
industry-specific environment are taken into account.
Estimations and assessments are made relating in particular to the calculation of the fair value of financial assets and
liabilities of Level 2 and Level 3 calculation of the fair value of financial assets and liabilities of Level 2 and Level 3
including the estimation of the existence of an active or inactive market, the valuation of pension provisions in terms
of determining the underlying parameters (Note (14) in conjunction with Note (53)), the assessment of risk provisions
with regard to future cash flows (Note (8) in conjunction with Note (36)), the calculation of deferred tax assets relating
to the recoverability of tax losses not yet utilised. If significant estimations were required, the assumptions made are
presented. Regarding the effect of the assumptions on the valuation of financial instruments allocated to Level 3, the
relevant disclosures concerning sensitivity in Note (58) Fair Value Hierarchy are referred to.
Estimations and assessments and the underlying assessment factors and methods of estimation are reviewed
regularly and compared with actual events. Provided that an amendment only refers to a single period, amendments
to estimations are only taken into account for this period. If an amendment refers to the current and following report-
ing periods it is duly observed in this period and in the following periods.
Apart from estimates, the following significant discretionary management decisions in respect of the accounting
policies of the NORD/LB Group need to be mentioned: The use of the fair value option for financial instruments,
the non-use of the categorisation of financial instruments as Held to Maturity (HtM) and the non-use of the reclassifi-
cation provisions of IAS 39.

F-13
The reporting currency for the consolidated financial statements is the euro. All amounts are reported rounded in
euro millions (€ million), unless otherwise is indicated. The previous year’s figures are shown afterwards in brackets.
These consolidated financial statements were signed by the Managing Board on 18 March 2014 and approved for
submission to the Supervisory Board.
(2) Adjustment of figures for the previous year
The figures for the previous year were adjusted in these consolidated financial statements on the basis of IAS 8.42 in
the following areas:
In the financial year 2013 there was a change in the reporting of the equity components of the sub-group Öffentliche
Versicherung Braunschweig (ÖVBS).
Part of the portfolio, which was reported in the past as equity attributable to the owners of NORD/LB, is now reported
under non-controlling interests. The figures for 2012 have been adjusted with retrospective effect.
In addition, since the financial year 2013 the income from ÖVBS, which was eliminated in the past from the
consolidated financial statements, is shown under net interest income. An adjustment has been made for 2012 with
retrospective effect.
As a result, the elimination of the transfer of income from ÖVBS to NORD/LB has been reversed.
31 Dec. 2012
(in € million)
Prior to
adjustment
Adjustment After
Adjustment
Liabilities
Retained earnings 2 192 – 181 2 011
Revaluation reserve – 13 – 82 – 95
Equity capital attributable to the owners of NORD/LB 7 115 – 263 6 852
Equity capital attributable to non-controlling interests 585 263 848
1 Jan. –31 Dec. 2012
(in € million)
Prior to
adjustment
Adjustment After
Adjustment
Interest income 12 278 2 12 280
Earnings before taxes 76 2 78
Income taxes – 4 – – 4
Consolidated profit 80 2 82
Of which: attributable to the owners of NORD/LB 82 1 83
Of which: capital attributable to non-controlling interests – 2 1 – 1
The respective adjustments were also taken into account in the following notes: (19) Segment reporting by business
segment, (20) Breakdown by geographical segments (21) Net interest income, (32) Income taxes and (57) Equity.

F-14
(3) Adopted IFRS
In these consolidated financial statements all standards, interpretations and their respective amendments which
have been endorsed by the EU and were relevant for the NORD/LB Group in the financial year 2013 were adopted.
In the period under review consideration has been given to the following standards and amendments to the stand-
ards which were first applied as at 1 January 2013 for the NORD/LB Group:
• IAS 19 (rev. 2011) – employee benefits
In June 2011 the IASB published the amended IAS 19 – Employee Benefits. Actuarial gains and losses are to be
reported accordingly directly under other comprehensive income, i. e. the previously applicable option of using the
so-called corridor method has been abolished. In addition to this, the interest of plan assets may no longer be
estimated on the basis of the underlying assets, instead interest is to be recognised in the amount of the discount
rate. Extended disclosures are also to be made in the notes. The resulting changes to the accounting policies for the
NORD/LB Group compared to the balance sheet date 31 December 2012 primarily concern the reporting of costs and
taxes relating to benefit plans. The expected income from plan assets has been calculated since 2013 with a standard
interest rate which is the same as the discount rate for the obligation. In addition, the top-up amounts promised in
partial retirement agreements are reported and measured for the first time in accordance with the regulations for
other long-term employee benefits.
Due to the minor significance of the effects of IAS 19 (rev. 2011) for the Group, the previous year’s figures have not
been adjusted. As the NORD/LB Group already reported actuarial gains and losses under other comprehensive income
in accordance with the previous regulations of IAS 19, this change has not had any effect.
• IFRS 13 – fair value measurement
In IFRS 13 – Fair Value Measurement, which was published in May 2011 and is to be applied prospectively, the differ-
ent regulations for establishing fair value in the individual standards were consolidated for the first time in a single
framework and at the same time modified and expanded in some areas; only IAS 17 and IFRS 2 will continue to have
separate regulations.
The specifications of the new standard concern among other things the definition of fair value, the implementation of
the change in approach particularly in the context of determining relevant markets (main market or most beneficial
market), the allocation of levels, the reporting of a day one profit / loss and the use of a bid-ask spread in the
measurement of assets and liabilities.
The implementation of IFRS 13 does not have a significant effect on the measurement of the NORD/LB Group’s assets
and liabilities. In accordance with the standard’s extended disclosure requirements, a description of the process for
measuring fair value has been included in the notes. Furthermore, a detailed risk-related presentation of the Level
disclosures for financial instruments which are measured in the balance sheet at fair value and a first-time presenta-
tion of the Level disclosures for financial instruments whose fair value is calculated solely for disclosure purposes is
made.
• Amendments to IAS 1 – Presentation of other comprehensive income
The amendments to IAS 1 published in June 2011 by the IASB within the scope of the Financial Statement Presenta-
tion Project have changed the breakdown of the statement of comprehensive income. The items of other comprehen-
sive income (OCI) are to be broken down by whether they can be recycled in the income statement or not. If OCI is
reported before tax, deferred taxes are to be treated similarly and broken down into recyclable and non-recyclable
items.

F-15
The amendments to IAS 1 result in a change in presentation in the NORD/LB Group’s statement of comprehensive
income.
• Amendments to IAS 12 – deferred taxes: recovery of underlying assets
The amendments to IAS 12 – Deferred Tax: Recovery of Underlying Assets make clear that the deferred tax for invest-
ment property, which is measured using the fair value model in IAS 40, is measured on the basis of the rebuttable
presumption that the carrying amount will be recovered through sale.
The application of this new rule had no effect on NORD/LB’s consolidated financial statements.
• Amendments to IFRS 7 – offsetting of financial assets and financial liabilities
In association with the amendments to IAS 32 – Financial instruments: Presentation published in December 2011, an
amendment was made to the disclosure requirements of IFRS 7 relating to offsetting in order to make it easier for the
readers of financial statements to assess the potential effects of existing netting agreements, including the rights to
offset recognised financial instruments and their effect on the financial position of an entity. The amendments will be
applied for the NORD/LB Group for financial years commencing on or after 1 January 2013 with retrospective effect.
The amendments will result in extended disclosure requirements which are to be disclosed for the first time as at
31 December 2013 in the NORD/LB Group’s consolidated financial statements.
• Improvements to IFRS (2009–2011 Cycle) within the scope of the IASB’s annual improvements process
The amendments published in May 2012 within the scope of the improvement project for the cycle 2009 – 2011
comprise clarifications concerning IFRS 1 First-time Adoption of International Financial Reporting Standards, IAS 1
Presentation of Financial Statements, IAS 16 Property, Plant and Equipment, IAS 32 Financial Instruments: Presenta-
tion and IAS 34 Interim Financial Reporting.
The annual improvements to IFRSs (cycle 2009–2011) do not have a significant effect on the interim consolidated
financial statements of NORD/LB.
As is allowed, we have not yet applied the following standards and amendments to standards which have been
adopted in European law and which did not have to be implemented for NORD/LB Group’s consolidated financial
statements prior to 31 December 2013:
• IFRS 10 – consolidated financial statements
With this standard the term “control” is comprehensively redefined. If a company controls another company, the
parent company has to consolidate the subsidiary. According to the new concept, control is given if the potential
parent company has decision-making power over relevant activities of the potential subsidiary due to voting rights
or other rights, if it participates in positive or negative variable flows from the subsidiary and these flows can be
influenced by its decision-making power. The new standard will be mandatory in the EU for users of IFRSs for
the first time for financial years commencing on or after 1 January 2014. IFRS 10 is to be applied, with some
exceptions, with retrospective effect.
The NORD/LB Group prepared for the first application of IFRS 10 starting in August 2011 within the scope of
a project. However, the importance of traditional credit collateralisation rights in relation to the borrower under
the new definition of control of IFRS 10 is the subject of international debate. For example, in Germany issues are
being looked at by a work group of the Institute of Public Auditors in Germany (IDW). At the time these consoli-
dated financial statements were prepared, a common view had not yet been established in key areas.

F-16
Notwithstanding this, the NORD/LB Group is expecting that the number of entities that will need to be included in
its consolidated financial statements will increase with the first application of IFRS 10. Subject to the ongoing
debate concerning traditional credit collateralisation rights referred to in the above paragraph, we make the
following statements on our assessment of the possible effects: A few entities will need to be fully consolidated for
the first time in the consolidated financial statements, because the economic and legal relationship with these
entities as at 1 January 2014 establish a control relationship under IFRS 10. It is expected that there will be no
entities that will no longer be fully consolidated due to the first application of IFRS 10. Based on the situation in
2013, its application would only have a minor impact on total consolidated assets and consolidated profit. We also
expect that it will only have a minor impact on total consolidated assets and consolidated profit in 2014.
The NORD/LB Group is following the debate on the possible control of borrowers in the context of credit collateral-
isation very closely. It is not currently possible to state reliably whether there will be any further impact in addition
to the expectations outlined in the above paragraph.
• IFRS 11 – joint arrangements
IAS 31 – Interests in joint ventures will be replaced by IFRS 11, which was published in May 2011 and is applicable
from 1 January 2014. This regulates the recognition of facts when an entity has joint control over a joint venture
or runs a joint operation. Compared to the current standard, there are two significant changes. Firstly, for the
consolidation of joint ventures the option of proportionate consolidation has been abolished, i. e. consolidation
is only allowed based on the equity method as in IAS 28. Secondly, the new category of joint operations has been
introduced, in which the assets and liabilities allocatable to the Group will be recognised.
The initial application of IFRS 11 is unlikely to result in any need for adjustments to NORD/LB’s consolidated
financial statements both for 2013 and 2014.
• IFRS 12 – disclosure of interests in other entities
The new IFRS 12 condenses the disclosure requirements related to subsidiaries, joint ventures, associated compa-
nies and unconsolidated structured entities in one standard. The objective is the disclosure of information on the
nature of control over the aforementioned companies and the associated risks and the effects resulting from
the control on the balance sheet, income statement and cash flow. IFRS 12 must be applied for the first time for
financial years commencing on or after 1 January 2014.
IFRS 12 will result in extended disclosure requirements for NORD/LB’s consolidated financial statements. These
concern in particular the disclosures relating to unconsolidated structured entities (special purpose entities).
• Consolidated financial statements, joint arrangements and disclosure of interests in other entities:
transition guidance (amendments to IFRS 10, IFRS 11 and IFRS 12)
In June 2012 the IASB published amendments which substantiate and clarify the transition regulations in IFRS 10
– Consolidated financial statements. In addition, some relief is granted with only the reference figures for the
immediately preceding reference period having to be adjusted and the disclosure requirement of comparative
information on non-consolidated special purpose entities upon initial application of IFRS 12 being struck. The
amendments come into effect following their adoption into European law for reporting periods commencing on or
after 1 January 2014.
It is expected that the transition guidance will simplify matters for the NORD/LB Group with the initial application
of the new consolidation regulations.

F-17
• Amendments to IAS 32 – offsetting of financial assets and financial liabilities
In December 2011 the IASB clarified its requirements for the offsetting of financial instruments with the publica-
tion of amendments to IAS 32 – Financial instruments: Presentation. The amendments essentially put guidelines
regarding application into more specific terms and should eliminate the current inconsistencies regarding the
application of the offsetting criteria. In particular the meaning of “currently has a legally enforceable right of
set-off’” and the conditions for systems with gross settlement as an equivalent to net settlement are explained.
The amendments are mandatory for financial years commencing on or after 1 January 2014 with retrospective
effect.
The amendments to IAS 32 are not expected to have any significant effect on the NORD/LB Group’s consolidated
financial statements.
• Amendments to IAS 39 – novation of derivatives and continuation of hedge accounting
The IASB published an amendment to IAS 39 in June 2013. The amendment provides an exception to the require-
ment for the discontinuation of hedge accounting. This applies if due to regulatory requirements a hedging
instrument is required to be novated to a central counterparty. The amendments are mandatory for financial years
commencing on or after 1 January 2014 with retrospective effect.
For the NORD/LB Group it is not expected that this will have any effect on its existing business in hedge accounting
even with the mandatory application of the clearing obligation introduced by the European Market Infrastructure
Regulation (EMIR). A final statement can only be made after the mandatory application of EMIR.
The following amended or new standards have also not been applied early:
• IAS 27 (amended 2011) – Separate Financial Statements
• IAS 28 (amended 2011) – Investments in Associates and Joint Ventures
• Amendments to IAS 36 – Impairment of Assets – Recoverable Amounts Disclosures for Non-Financial Assets
These amendments must be applied in the Group for financial years commencing on or after 1 January 2014.
The amendments to IAS 27, IAS 28 and IAS 36 are not expected to have a significant impact on NORD/LB’s consoli-
dated financial statements.
The following standards, amendments to standards and interpretations have not yet been adopted into European
Law by the EU Commission:
• IFRS 9 – financial instruments
As part of the project to replace IAS 39, a revised version of IFRS 9 was published in October 2010 (revising
the version published in November 2009). The first phase of the three phases includes regulations for the catego-
risation and measurement of financial assets and financial liabilities. IFRS 9 initially only provided two options for
the categorisation of financial assets: measurement at amortised cost and measurement at fair value through
profit or loss. In November 2012 a draft amendment of the categorisation and valuation rules of IFRS 9 was
published. The draft includes in particular the proposal of introducing a third valuation model for financial assets
in the form of debt instruments and envisages these instruments being valued at fair value with the changes in
valuation being reported directly in equity under other comprehensive income.

F-18
The categorisation will in future be based on the reporting entity’s business model and the contractually agreed
cash flows of the asset. Furthermore the regulations for embedded derivatives and reclassification have also been
modified. The regulations relating to financial liabilities are largely unaltered compared to IAS 39. The main
difference with the previous regulation concerns the fair value option. The rating-induced changes in the valuation
of financial liabilities will in future be shown under other comprehensive income; the remaining changes in valua-
tion will continue to be reported in the income statement.
In the first half of 2013 the second phase of IFRS 9 concerning impairment was published. The second phase
covers financial instruments, loan commitments and financial guarantees. The new impairment model moves away
from the concept of incurred loss towards the concept of expected loss. Based on the new impairment model,
financial instruments, loan commitments and financial guarantees will, depending on the change in their credit
quality, be divided into three stages. The calculation of the expected loan loss will depend on the stage to which
a financial instrument, loan commitment or financial guarantee has been allocated. In Stage 1 the expected loan
losses will be calculated in the amount of the expected loss with a time horizon of one year. In Stage 2 and 3 the
expected loan loss will be calculated over the whole residual term to maturity (lifetime expected loss).
For Phase 3 concerning Hedge Accounting, the IASB had decided to divide this issue into two sections, General
Hedge Accounting (Phase 3a) and Macro Hedge Accounting (Phase 3b). In the fourth quarter of 2013 a standard
for General Hedge Accounting was published. A draft for Macro Hedge Accounting is now not expected to be
published before 2018. Until then the provisions of IAS 39 concerning the fair value hedge accounting for a port-
folio hedge of interest rate risk will remain and will not be transferred into IFRS 9. The standard for General Hedge
Accounting pursues the goal of reflecting operational risk management in the financial reporting of hedging
relationships in closed portfolios more strongly than before. In this connection, compared to the provisions in IAS
39, the role of qualitative application criteria were strengthened compared to quantitative application criteria. In
addition, the group of underlying and hedging transactions which are eligible for hedge accounting was extended
significantly and additional designation options were created. Regarding the effectiveness of hedging relation-
ships, in future this should no longer be based on a strict effectiveness threshold on a percentage basis.
The amendments to IFRS 9 and IFRS 7 published in December 2011 – Mandatory effective date for IFRS 9 and
transition disclosures – allow the previous year’s figures not to be reported when IFRS 9 is first applied and
introduce additional disclosure requirements at the time of transition.
The IASB decided in the fourth quarter of 2013 to cancel the previously applicable first application date of 1 Janu-
ary 2015 and to set a new date when an outcome for the discussions concerning in particular the phases for
categorisation and measurement and for impairment can be foreseen.
It is expected that IFRS 9 will have a significant impact on the accounting, valuation and reporting in future
consolidated financial statements. The potential impact can only be quantified in the NORD/LB Group when the
final regulations for all phases of IFRS 9 have been passed by the IASB.
• IFRIC 21 – levies
In May 2013 the IASB published IFRIC 21 as an interpretation of IAS 37 concerning levies, which essentially
regulates which government-imposed levies need to be recognised and when a present liability needs to be
recognised. IFRIC 21 is, subject to its endorsement by the EU, mandatory for financial years commencing on or
after 1 January 2014 with retrospective effect.
This is not expected to have a significant impact on the reporting of the bank level in NORD/LB’s consolidated
financial statements.
F-19
The following amendments to standards have not yet been adopted in European law:
• Amendments to IAS 19 – Defined Benefit Plans: Employee Contributions
• Improvements to IFRS (2010 – 2012 Cycle) Within the Scope of the IASB’s Annual Improvements Process
• Improvements to IFRS (2011 – 2013 Cycle) Within the Scope of the IASB’s Annual Improvements Process
These amendments must be applied in the Group for financial years commencing on or after 1 July 2014.
The amendments to IAS 19 and the annual improvements to IFRSs (2010–2012 and 2011–2013 cycles) are not
expected to have a significant impact on NORD/LB’s consolidated financial statements.
The amendments to standards described above are expected to be implemented on the dates when their application
first becomes mandatory.
(4) Consolidation principles
NORD/LB’s consolidated financial statements, prepared in accordance with uniform accounting policies throughout
the Group, comprise the financial statements of the parent company (NORD/LB) and of the companies controlled by
the parent company, including controlled special purpose entities (subsidiaries). Control exists as soon as a Group
company has the power to determine the financial and business policies of a company so as to obtain benefits from
its activities.
The purchase method of accounting is applied, i. e. assets and liabilities relating to subsidiaries were recognised at
fair value on consideration of deferred taxes on the date on which a controlling interest was gained. Goodwill result-
ing from initial consolidation is reported under intangible assets. The value of goodwill is reviewed at least once
a year and is the subject of unscheduled depreciation if necessary. Shares in the equity of subsidiaries which are not
held by the parent company are reported as non-controlling interests in consolidated equity and measured with their
appropriate share in the identifiable net assets of the acquired company.
Receivables and liabilities and expenses and earnings generated within the Group are eliminated in the consolidation
of intercompany balances and earnings and expenses. Intragroup profits and losses are consolidated in the elimina-
tion of intercompany profits and losses.
Results of subsidiaries included or disposed of during the course of the year are recognised in the income statement
as at the effective date of acquisition or up to the effective date of disposal, respectively.
Joint ventures and associated companies are accounted for using the equity method and are reported as investments
accounted for using the equity method. The cost of acquisition of investments accounted for using the equity method
and the differences are determined as at the date on which significant influence is obtained. In this case the rules
applied are the same as those applied for subsidiaries. Adjustments to the at equity value are recognised in profit
or loss or in other comprehensive income (OCI) on the basis of uniform accounting policies for the Group. Losses
exceeding the at equity value are not reported unless the Group has entered into legal or factual obligations or makes
payments on behalf of the investment accounted for using the equity method.
For transactions between a Group company and a joint venture or an associated company, profits and losses are
eliminated in proportion with the shareholding of the Group in the respective company.
Deconsolidation is carried out from the date on which control or significant influence ceases to exist.

F-20
(5) Basis of consolidation
In addition to NORD/LB as the parent company, the consolidated financial statements include 50 (49) subsidiaries
(including special purpose entities in accordance with SIC-12) in which NORD/LB directly or indirectly holds more
than 50 per cent of the voting rights or over which NORD/LB is in a position to exercise control in another manner.
1 (1) joint venture and 10 (10) associated companies are accounted for using the equity method.
Compared to 31 December 2012 the basis of consolidation has changed as follows:
The subsidiaries established in September 2013, BLB Grundbesitz KG and BLBI Investment GmbH & Co.KG, both
based in Bremen, have been fully consolidated since 30 September 2013.
In December 2013 the previously fully consolidated fund NORD/LB AM 56 was dissolved and deconsolidated.
At the same time the liquidity was transferred to the master fund ds NORD/LB AM ALCO, which is wholly owned by the
NORD/LB Group.
The effects resulting from the changes to the basis of consolidation have no significant impact on the NORD/LB
Group’s assets, financial and earnings position.
Subsidiaries, joint ventures and associated companies included in the consolidated financial statements are shown in
Note (83) Equity holdings.
(6) Currency translation
Monetary assets and liabilities in foreign currencies and non-monetary items recognised at fair value were translated
using the reference exchange rates of the European Central Bank (ECB reference exchange rates) as at the measure-
ment date. Non-monetary items carried at cost are recognised at historical rates. Expenses and earnings in foreign
currencies are translated at market exchange rates. Currency differences relating to monetary items are always shown
in the income statement; non-monetary items are recognised through the profit or loss of such items under other
comprehensive income or in the income statement.
The assets and liabilities of foreign subsidiaries were translated using ECB reference exchange rates as at the
measurement date; with the exception of the revaluation reserve (closing rate method) and the profit for the year,
equity is translated using historical currency rates. Earnings and expenses are translated into the Group currency at
period-average exchange rates; resulting translations are reported as a separate item under other comprehensive
income. On disposal, the cumulative amount of exchange differences is included in the gain or loss on disposal.
(7) Financial instruments
A financial instrument is defined as a contract which results in a financial asset for one company and a financial
liability or an equity instrument for another. Financial instruments are reported accordingly in the NORD/LB Group.
They are allocated to valuation categories and measured according to this classification in accordance with IAS 39
requirements.
The financial instruments contain financial guarantees in accordance with the definition of IAS 39.
a) Addition to and disposal of financial instruments
Financial assets and financial liabilities are recognised in the balance sheet when the Group becomes a party to
a contract in accordance with the contractual provisions of the financial instrument. In the case of the regular cash
purchases or cash sales of financial assets, the date of trade and the date of settlement generally do not fall on
the same date. These regular cash purchases or cash sales bear the option of recognition as at the date of trade
(trade date accounting) or as at the date of settlement (settlement date accounting). Trade date accounting applies
for the recognition and disposal of all financial assets transacted by the NORD/LB Group.
F-21
IAS 39 disposal regulations comply with both the concept of risk and reward and of control; measuring risks and
rewards should be given priority over measuring the transfer of control on verifying derecognition entries.
The continuing involvement approach is employed when opportunities and risks are only partly transferred and
control is retained. In this case a financial asset is recognised to the extent equivalent to its continuing involvement
on consideration of certain accounting policies. The extent of continuing involvement is determined by the scope in
which the Group continues to bear the opportunities and risks of changes in the values of the assets transferred.
A financial liability (or part of a financial liability) is derecognised when the liability has been eliminated, i. e. when the
liabilities specified in the contract have been settled or eliminated or if they have expired. The reacquisition of the
banks own debt instruments is also included in the derecognition of financial liabilities. Differences between the
carrying amount of a liability (including premiums and discounts) and the purchase price are recognised through
profit or loss; a new financial liability whose cost of acquisition is equivalent to the sales proceeds will arise in the
case of resale at a later date. Differences between these new costs of acquisition and the amount repaid are spread
over the remaining term of the debt instrument in accordance with the effective interest method.
b) Categorisation and measurement
Fair value is applied when financial assets and financial liabilities are recognised for the first time. The net method is
applied for financial guarantees reported in the NORD/LB Group. For financial instruments in the categories Loans
and Receivables (LaR), Held to Maturity (HtM), Available for Sale (AfS) and Other Liabilities (OL), transaction costs are
included in the cost of acquisition if they are directly apportionable. They are accounted for in the nominal value or
the repayment amount on distribution of premiums and discounts in compliance with the effective rate of interest
component. Transaction costs for financial instruments in the categories financial assets or financial liabilities at fair
value through profit or loss are recognised immediately in profit or loss.
Subsequent measurement of financial assets and financial liabilities is contingent on the IAS 39 category under which
the assets or liabilities had been classified on the date of acquisition:
ba) Loans and receivables (LaR)
Non-derivative financial assets involving fixed or determinable payments which are not listed in an active market
are allocated to this category provided that they have not been classified as financial assets at fair value through
profit or loss or available for sale. The loans and receivables category is the largest in the Group since this
category essentially comprises all traditional credit and loan transactions. Subsequent measurement is at
amortised cost applying the effective interest method. The recoverability of loans and receivables (LaR) is veri-
fied and they are written down if necessary on each balance sheet reporting date and in the event of indications
of potential impairment losses (cf. Notes (8) Risk Provisioning, (22) Loan loss provisions and (26) Profit / loss from
Financial Assets). Appreciations in value are recognised through profit or loss. The upper limit for appreciations
in value is the amortised cost which would have resulted at the date of measurement without impairment losses.
bb) Held to maturity (HtM)
Non-derivative financial assets involving fixed or determinable payments and a fixed term are classified in this
category if they are intended to be held until maturity. They may be allocated if the financial instruments are not
classified as financial assets at fair value through profit or loss (AFV), as available for sale (AfS) or as loans and
receivables (LaR). Subsequent measurement is at amortised cost applying the effective interest method. The
held to maturity category is currently not employed in the NORD/LB Group.

F-22
bc) Financial assets or financial liabilities at fair value through profit or loss (AFV)
This category is divided into two sub-categories:
i) Held for trading (HfT)
This sub-category comprises financial instruments (trading assets and trading liabilities) acquired with the
intention of selling or buying these back in the short term and contains all the derivatives which do not
constitute collateral instruments within the scope of hedge accounting. Trading assets essentially comprise
money market instruments, bonds and debt securities and derivatives with a positive fair value. Trading
liabilities mainly comprise derivatives with a negative fair value and delivery obligations resulting from
futures sales. Trading assets and trading liabilities are recognised at fair value through profit or loss upon
subsequent measurement. There is no amortisation at constant effective interest rates of premiums and
discounts.
ii) Designated at fair value through profit or loss (DFV)
Any financial instrument can be allocated to this sub-category, known as a fair value option, provided that
certain requirements are met. Exercising the fair value option means that recognition and measurement
mismatches resulting from different measurement methods for financial assets and liabilities is avoided or
significantly reduced (for example, by presenting economic hedges of structured bond issues and corre-
sponding derivatives without having to fulfil the restrictive requirements of hedge accounting). Allocation
to this category also meant that embedded derivatives in structured products do not need to be separated.
The category was used in some cases because the management and measurement of the performance of
a portfolio is at fair value. More information on the type and the scope of application of the fair value option
in the Group is presented in Note (38) Financial Assets at Fair Value through Profit or Loss and in Note (51)
Financial Liabilities at Fair Value through Profit or Loss. Financial instruments measured using the fair value
option are measured at fair value through profit or loss upon subsequent measurement. There is no amorti-
sation at constant effective interest rates of premiums and discounts.
bd) Available for sale (AfS)
Any non-derivative financial assets which have not been assigned to any of the aforementioned categories are
allocated to this category. These assets are primarily bonds, debt securities, shares and investments which are
not measured in accordance with IAS 27, IAS 28 or IAS 31. Subsequent measurement was at fair value. Measure-
ment is at cost if the fair value of financial investments in equity instruments such as certain shares or invest-
ments for which no price is available on an active market (and the relating derivatives which can only be settled
by way of offer) cannot be determined with sufficient reliability. The result of the measurement at fair value is
reported under other comprehensive income. In the event of the sale of the financial asset, the accumulated
estimated profit / loss reported in the valuation result is written back and reported in the income statement.
With equity instruments differences between the cost of acquisition and repayment amounts are amortised in
recognition of profit or loss on application of the effective interest method.
Impairment is only carried out in the case of rating-induced impairment. The occurrence of rating-induced
impairment is examined on the basis of specific objective factors. Objective factors in this context are the
trigger events listed in IAS 39, for example significant financial difficulty of the issuer or the obligor or a breach
of contract or default or delay in interest or principal payments. In addition to the criteria of permanence,
a measurable decrease in the fair value of equity securities to below the acquisition cost is an objective indica-
tion of impairment.

F-23
In the case of rating-induced impairments, the difference between the book value and current fair value must be
recognised in the income statement. Appreciations in the value of debt capital instruments are recognised in the
amount of the appreciation through profit or loss in the income statement as well as in other comprehensive
income. Appreciations in the value of equity instruments are recognised in other comprehensive income unless
they are measured at acquisition cost.
be) Other Liabilities (OL)
This category includes in particular liabilities to banks and customers, securitised liabilities and subordinated
capital provided that these liabilities have not been designated at fair value under the fair value option.
Subsequent measurement is at amortised cost applying the effective interest method.
The carrying amounts and gains/losses for each measurement category are presented in Notes (59) and (60).
c) Reclassification
In accordance with the regulations of IAS 39, financial instruments are allowed to be reclassified from the HfT (trading
assets) category to the LaR, HtM and AfS categories and from the AfS category to the LaR and HtM categories under
certain circumstances. The NORD/LB Group did not make use of this right to reclassify.
d) Establishing fair value
The unit of account upon which the value of financial instruments is based is determined by IAS 39. In the NORD/LB
Group the single financial instrument is the measurement unit, so long as IFRS 13 does not allow an exception.
The fair value of financial instruments according to IAS 39 in conjunction with IFRS 13 reflects the price at which
an asset can be sold or a liability transferred in an ordinary transaction between market participants on the
measurement date, i. e. the fair value is a market-related and not a company-specific value. According to IFRS 13, the
fair value is the price that can either be observed directly or a price established by a measurement method which, in
an ordinary transaction, i. e. a sale or a transfer, could be achieved on the main market or the most advantageous
market on the measurement date. It is therefore an exit price, i. e. the measurement as at the measurement date
is always based on a fictitious, possible market transaction. If there is a main market, the price on this market repre-
sents the fair value, independently of whether the price can be observed directly or will be calculated on the basis of
a valuation method, and even if the price is potentially more advantageous on another market.
da) Financial instruments which are reported at fair value in the balance sheet
In the NORD/LB Group the three-tier fair value hierarchy is applied with Level 1 (Mark to Market), Level 2 (Mark to
Matrix) and Level 3 (Mark to Model) terminology provided for in IFRS 13.
The respective level is determined by the input data used in the measurement and reflects the market proximity
of the variables included in establishing the fair value. If input data from various levels of the hierarchy is used in
the calculation of the fair value, the resulting fair value of the financial instrument is assigned to the lowest level
of the input data which has a significant influence on the fair value measurement.

F-24
Level 1
Under the fair value hierarchy, a financial instrument is categorised in Level 1 if it is traded on an active market
and is used to establish the fair value of publicly listed market prices or prices actually traded on the over-
the-counter market (OTC market). If no market prices or prices actually traded on the OTC market are available, in
the measurement the feasible prices quoted by dealers are used for measurement purposes, with prices quoted
by other banks or market makers being applied when price sources other than stock exchange quoted prices
are used. These instruments are then assigned to Level 1 if there is an active market for these broker quotations,
i. e. if only minor bid-ask spreads exist and there are several price suppliers with only marginally differing prices.
If the broker quotations are for (mixed) prices or if the price is established on a non-active market, these are not
assigned to Level 1, but to Level 2 of the measurement hierarchy, if the quotations concern binding offers,
observable prices or market transactions.
The Level 1 prices are taken over without any adjustment. Level 1 financial instruments include trading assets
and liabilities, financial instruments designated at fair value, financial assets recognised at fair value and other
assets.
Level 2
In the event that no price quotes are available, the fair value is calculated by means of recognised measurement
methods or models as well as by means of external pricing services, if measurement in this case is carried out
either fully or to a significant degree using observable input data such as spread curves (Level 2). For the
measuring of financial instruments, these methods include measurement methods which are established on the
market (e. g. discounted cash flow method and the Hull-White model for options) whose calculations are always
based on input parameters available on an active market. A requirement here is that variables which market
participants would have taken into account when specifying prices are included in the measurement process.
Wherever possible, respective parameters are taken from markets on which the instruments are issued or
acquired.
Measurement models are employed primarily for OTC derivatives and securities listed on inactive markets. The
models include a range of parameters such as for example market prices and other market quotations, risk-free
interest rate curves, risk premiums, exchange rates and volatilities. The parameters for the models are always
chosen using prevailing market methods.
Market data which forms the basis of risk controlling is generally applied for these Level 2 measurements.
For securities on the assets side for which there was no active market on 31 December 2013 and for which meas-
urement could no longer be based on market prices, fair value was determined for measurement purposes in
accordance with a mark-to-matrix method that was based on discounted cash flows. For discounted cash flow
methods, all payments are discounted by the risk-free interest rate curve adjusted for the credit spread. Spreads
are determined on the basis of comparable financial instruments (for example on consideration of the respective
market segment and the issuers credit rating).
The financial instruments in the NORD/LB Group to be measured in this manner are ascertained on the basis
of individual securities and a subsequent separation into active and inactive markets. Changed market
assessments are consistently included in measurement. The identification, analysis and valuation of financial
instruments in inactive markets take place in several areas of the Group, whereby the inactivity is assessed as
objectively as possible. The measurement model for financial instruments for which no prices listed in active
markets can be used is based on term-related interest rates, the credit rating of the respective issuer and where
applicable further components such as foreign currency premiums.
Level 2 financial instruments include trading assets and liabilities, hedge accounting derivatives, financial assets
and liabilities designated at fair value and financial assets recognised at fair value.
F-25
Level 3
Financial instruments for which there is no longer an active market and for which measurement can no longer be
based completely on observable market parameters are allocated to Level 3. In comparison and in differentiation
to Level 2 measurement, this method employs models specific to the bank or data which is not observable on
the market. The input parameters used in these methods include among other things assumptions about cash
flows, loss estimates and the discount rate and are gathered as far as possible on a near-market basis.
The Level 3 method is partly used to measure the Group’s credit default swaps (CDS) and asset-backed securities
(ABS) / mortgage-backed securities (MBS) for which the market has been classified as being inactive. Further
interest-bearing securities are also allocated to Level 3. Individual tranches of collateralised debt obligations
(CDO) and equity structures are also measured in accordance with Level 3. Level 3 financial instruments include
trading assets and liabilities, hedge accounting derivatives, financial assets and liabilities designated at fair
value and financial assets recognised at fair value.
Establishing fair values
All measurement models applied in the Group are reviewed periodically. The fair values are subject to internal
controls and processes in the NORD/LB Group. These controls and processes are carried out and coordinated in
the Finance and Risk Control Division. The models, the data used in them and the resulting fair values are
reviewed regularly.
In the measurement appropriate consideration is given to all relevant factors such as the bid-ask spread, coun-
terparty risk and typical discounting factors. In the context of the bid-ask spread, measurement is always based
on the average price. The financial instruments concerned are in particular securities or liabilities whose fair
values are based on prices listed on active markets and financial instruments such as OTC derivatives whose fair
values are established using a measurement method and for which the average price is an observable input
parameter in the measurement method.
In addition, the option to calculate the counterparty risk (credit value adjustment (CVA)/debit value adjustment
(DVA) on the basis of the net risk position in accordance with IFRS 13.48 was exercised. The CVA / DVA is allocated
to individual transactions in the balance sheet using the relative credit adjustment approach.
For derivatives of OTC markets there are generally no listed prices available, the fair values are therefore
established using other measurement methods. The fair values are initially measured using cash-flow models
without taking into account the credit default risk. For the correct measurement of fair values, both the credit
default risk of the counterparty (CVA) and the bank’s own credit default risk (DVA) need to be considered. The
credit default risk is considered by way of an add-on.
For the measurement of secured OTC derivatives the NORD/LB Group has switched primarily to the current
market standard of overnight index swap discounting (OIS discounting). This means that secured derivatives
are no longer discounted with the tenor-specific interest rate, but with the OIS interest rate curve. Unsecured
derivatives will continue to be discounted with the tenor-specific interest rate to establish their fair value.
For some of the NORD/LB Group’s liabilities recognised at fair value the guarantor liability of the state of Lower
Saxony, the state of Saxony-Anhalt and the state of Mecklenburg-Western Pomerania apply. The effect of the
guarantee is considered in the fair value measurement of the liabilities.

F-26
db) Financial instruments which are reported at fair value for disclosure purposes
Basically the same rules apply for financial instruments whose fair value is established solely for disclosure
purposes as for financial instruments whose fair value is reported in the balance sheet. The financial instruments
include for example the cash reserve, loans and advances to and liabilities to banks and customers, certain debt
securities and company shares, securitised liabilities and subordinated capital.
For the cash reserve and short-term loans and advances to and liabilities to banks and customers (sight depos-
its), the nominal value is considered to be the fair value due to their short-term nature.
For securities and liabilities, in practice, like with financial instruments recognised at fair value in the balance
sheet, a range of measurement methods (e. g. market or reference prices or measurement models), but as
a general rule one measurement method (discounted cash low model) are used. In order to establish the value
in this measurement model a risk-free yield curve is often used and adjusted with risk premiums and where
applicable other components. For liabilities NORD/LB’s own credit default risk is used as the risk premium. An
appropriate level allocation in the existing fair value hierarchy is made according to the significance of the input
data.
For long-term loans and advances to and liabilities to banks and customers and for investments no observable
market prices are available, as no observable primary or secondary markets exist. The fair value for these
financial instruments is established using recognised measurement methods (discounted cash flow model). The
input data for this model are the risk-free interest rate, a risk premium and where applicable further premiums to
cover administrative and equity costs.
Financial instruments are allocated to Level 3 if the method uses the NORD/LB Group’s internal ratings based on
the Internal Ratings-Based Approach (in accordance with BASEL II). This is the case regardless of whether the
internal data for the regulatory eligibility check was gauged using data from publicly available ratings which form
the basis of pricing decisions by market participants.
Further information on the fair value hierarchy and the fair values of financial instruments can be found in
Note (58) Fair value hierarchy.
e) Measurement of Investments which do not fall under IAS 27, IAS 28 or IAS 31
Investments which do not fall under IAS 27, IAS 28 or IAS 31 are measured at fair value. If the fair value of financial
investments in equity instruments which do not have a listed price on an active market cannot be reliably estab-
lished, they are measured at acquisition cost (cf. Note (58) Fair Value Hierarchy).
If investments are traded on an active market, the market/stock exchange price is used to determine the fair value. If it
is not possible to use prices listed on active markets, the fair value is established using recognised measurement
methods. In addition to the peer-group method, the NORD/LB Group also uses the income-value method.
This method is allocated in the fair value hierarchy in accordance with IFRS 13 to Level 3 (cf. Note (58) Fair Value
Hierarchy).
The fair value is calculated in the earnings-value method from the present value of the shareholders future net
earnings associated with the ownership of the company.
The net earnings of shareholders, which are discounted to calculate the income value, relate primarily to the
distributions of financial profits generated by the company. The starting point for calculating the fair value of the
participating interest is a forecast for earnings performance for 2013, a detailed plan for 2014 and where applicable
the medium-term plan for the following four years (planning phase I). For the following years beyond the planning
horizon in general perpetuity of the undertaking is assumed. For this purpose a perpetual annuity is calculated which
should reflect the long-term situation of the affiliated company (planning phase II). These anticipated future profits
are discounted taking into account the anticipated distributions on the balance sheet date.

F-27
The discount rate used represents the yield from an adequate alternative investment in respect of maturity and risk
to the investment in the affiliated company and is derived on the basis of a capital market model. The discount rate
comprises the components of risk-free interest and the risk premium for future financial profits. The risk premium is
the product of an average market risk premium and the beta factor which expresses the specific risk structure of the
company to be valued. The beta factor describes as a relative measure to what extent the yield of the respective share
in the affiliated company follows changes in the yield of the market portfolio.
In order to value investments in companies which are not listed on the stock exchange, comparison groups of similar
titles traded on the stock exchange are formed and for each individual value the beta is calculated in relation to
the respective broadest national index. In brief, the beta factor of the comparison group calculated in this way is
a significant multiplier used when calculating the capitalisation interest.
f) Structured products
Structured products comprise two components – a basic contract (host contract, e. g. security) and one or several
embedded derivative financial instruments (embedded derivatives, e. g. swaps, futures or caps). The two components
are the subject matter of a single contract relating to the structured product, i. e. these products constitute a legal
unit and may not be negotiated separately due to the circumstance of a contractual unit.
In accordance with IAS 39 an embedded derivative is to be separated from the host contract and accounted for as
a separate derivative provided that all of the following criteria are fulfilled:
• The economic characteristics and risks of the embedded derivative are not closely related to the economic
characteristics and risks of the host contract.
• A separate instrument with the same terms as the embedded derivative financial instrument would meet the
definition of a derivative financial instrument.
• The structured product is not measured at fair value through profit or loss.
If separation of financial instruments is obligatory, these financial instruments are measured and recognised
separately in the NORD/LB Group, provided they have not been classified as AFV. The host contract is accounted for
in compliance with the regulations of the category to which a financial instrument is allocated and embedded
derivatives are accounted for at fair value through profit or loss as part of the trading assets or trading liabilities.
g) Hedge accounting
Hedge accounting is the balance sheet presentation of hedging relationships. In this framework, hedging relation-
ships are established between underlying items and hedging transactions. The aim is to avoid or reduce fluctuations
in profits and equity resulting from differing measurements of underlying and hedging transactions.
A distinction is made between three basic forms of hedges, each needing to be handled differently in hedge account-
ing. The fair value hedge involves the hedging of (parts of) assets and liabilities against changes in fair value. In
particular investment and lending transactions in the Group as well as the security portfolios under liquidity control,
provided that the securities bear interest, are subject to this type of risk in changes to value. Both individual transac-
tions and portfolios are hedged by fair value hedges. Currently the fair value is only hedged against interest rate risk.
Changes in the fair values of assets and liabilities are hedged in single-currency portfolios in euros and US dollars.
Interest rate swaps and currency swaps are mainly used to hedge these risks.
The two other basic forms, the cash flow hedge and the hedge of a net investment in a foreign operation, are currently
not used in the NORD/LB Group.

F-28
Only hedging relationships which have fulfilled the restrictive requirements of IAS 39 may be reported in accordance
with the regulations of hedge accounting. Hedge accounting requirements, in particular evidence of the effectiveness
of the hedge transaction, must be met for each hedging relationship on each balance sheet reporting date. The
critical term match method, the market data shift method and the regression method are applied in the Group for the
prospective conducting of effectiveness tests. The modified dollar offset method is primarily used in the Group for
retrospective effectiveness tests. This method takes account of the problem of small numbers in the case of minor
changes in the value of underlying transactions and hedges by means of an additional tolerance limit. Deutsche Hypo
uses the regression method for the retrospective effectiveness test.
In the fair value hedge portfolio, for the retrospective effectiveness test disposals from the hedged portfolio of
underlying transactions were previously dealt with using the bottom layer method.
In accordance with the fair value hedge accounting rules, derivative financial instruments used for hedging purposes
are reported at fair value as positive or negative fair values from hedge accounting (Note (39) or Note (52) Positive
or negative fair values from hedge accounting derivatives. The changes in valuation are recognised in the income
statement (Note (25) Profit / loss from Hedge Accounting). Changes in fair value resulting from the hedged risk of
hedged assets or hedged liabilities are also recognised through profit or loss in the profit / loss from hedge account-
ing item.
When employing hedge accounting for financial instruments in the annual financial statements category, the
portion of any change in fair value relating to hedged risks is recognised in profit or loss as profit / loss from hedge
accounting, while the portion of a change in fair value which is not related to the hedged risk is accounted for in the
revaluation reserve.
In micro hedge accounting, financial instruments measured at amortised cost are adjusted in the balance sheet item
by the change in fair value resulting from the hedge risk (hedge adjustment).
Changes in the fair value of underlying asset and liability-side transactions related to the hedged risk are reported
under the adjustment item for hedged financial instruments in the fair value hedge portfolio on the assets side or
liabilities side of the balance sheet. Underlying transactions relating to AfS items carried as assets continue to be
reported at their full fair value under financial assets. There are currently asset and liability items in the fair value
hedge portfolio.
A hedge relationship is terminated when the basic transaction or the hedging transaction expires, is sold or exercised
or when hedge accounting requirements are no longer fulfilled; for underlying transactions in effective hedges
(cf. Note (66)).
h) Repos and securities lending
In the case of genuine repos, transferring the securities sold under repurchase agreements does not lead to
derecognition, as the transferring entity essentially retains all the risks and rewards associated with the ownership of
the repurchased securities. The asset transferred must therefore still be reported by the transferor and measured
according to its respective category. Payment received is carried as a financial liability (in liabilities to banks or
liabilities to customers, depending on the counterparty). Interest payments agreed are reported as interest expenses
over the respective terms.
F-29
Reverse repo transactions are reported accordingly as loans and advances to banks and customers and are allocated
to the loans and receivables (LaR) category. Securities for sale and repurchase which constitute the basis of the
financial transaction are not reported in the balance sheet. Interest resulting from such transactions is reported as
interest income over the respective term.
Security sale agreements with a repurchase option were not concluded in the NORD/LB Group.
Principles which apply for reporting genuine repurchase transactions also apply for securities lending transactions.
Securities lent are reported as security portfolios and measured in accordance with IAS 39, while borrowed securities
are not reported. Cash collateral pledged for security lending transactions is reported as a claim and cash collateral
received is reported as a liability.
With regard to the scope and the volume of security sale and repurchase agreements and securities lending
transactions, Note (62) Offsetting of Financial Liabilities is referred to.
i) Securitisations
Various financial assets relating to lending business are securitised either in synthetic securitisation using credit
derivatives or by non-recourse factoring to special purpose entities (SPEs), which in turn issue securities to investors
(true sale securitisation). Interest and capital repayments resulting from such securities are directly linked to the
performance of the underlying claim, and not to that of the issuer.
The accounting of such transactions depends on the method of securitisation. Assets relating to synthetic securitisa-
tion remain in the balance sheet and are reported with the credit derivatives concluded in accordance with IAS 39
regulations. In the case of true sale securitisation, the assets are written off if the opportunities and risks relating to
these assets have been (virtually) fully transferred to the SPE. With securitisation transactions normally (virtually) all
of the opportunities and risks are transferred to the SPE or the buyer. Assets of consolidated SPEs remain in the
NORD/LB Groups consolidated balance sheet.
(8) Risk provisioning
Risks relating to lending business are accounted for by forming specific valuation allowances, specific loan loss provi-
sons and general loan loss provisions.
Recoverability is reviewed for all significant claims at individual transaction level. Risk provisions cover all recognisa-
ble credit risks in the form of specific valuation allowances. A valuation allowance is required when observable criteria
indicate that it is likely that not all the interest and capital repayments or other obligations will be met on time. The
essential criteria for a valuation allowance are for example the default on interest and capital payments or a delay in
such payments of more than 90 days, considerable financial difficulties on the part of the debtor such as arithmetic
and actual insolvency or the long-term negative consequences of a restructuring. These criteria also include conces-
sions made by lenders such as interest exemption, write-off of debt or deferred repayment, impending insolvency
and impending restructuring proceedings.
With ship financing the essential criteria for a valuation allowance are interest deferrals and / or deferred repayment,
concessions such as the granting of restructuring loans to support the liquidity of borrowers or individual ships, and
threatened insolvency.
The amount of the specific valuation allowance is calculated as the difference between the carrying amount and the
recoverable amount as the present value of the anticipated future cash flows.

F-30
If the criteria for a valuation allowance have been met for claims which are not significant, these claims are concen-
trated in narrowly defined portfolios with similar risk structures, measured by a standard method and are the subject
of an appropriate flat-rate specific valuation allowance. The calculation is made on the basis of historical probabilities
of default and loss rates.
To cover impairments which have occurred but have not yet been identified, general loan loss provisions are made.
These are calculated on the basis of historical probabilities of default and loss rates, with the portfolio-specific loss
identification period factor (LIP factor) also being considered.
Since the first quarter of 2013 general loan loss provisions have been made at specific customer level. As a result the
reporting is adjusted to reflect the actual circumstances and developments in the specific industry. Using the old
calculation method, general loan loss provisions would have totalled € 552 million as at 31 December 2013. The
calculation at specific customer level produces a figure of € 478 million (cf. Note (36) Risk Provisioning).
The parameters employed in the lumpsum specific loan loss provisions and the general loan loss provisions derived
from the Basel II system.
The total amount of loan loss provisions resulting from balance sheet business is recognised as a separate item
under assets in the balance sheet.
Risks relating to off-balance sheet transactions (guarantees, endorsement liabilities and loan commitments) are
accounted for by a loan loss provision.
Irrecoverable loans for which no specific valuation allowances are written off immediately. Payments received for
written-off loans and advances are recognised in profit or loss.
Financial assets classified as LaR are only written off directly.
(9) Property and equipment
Property and equipment are recognised at cost on the date of addition. Subsequent costs are capitalised if they result
in a significant improvement in the asset and therefore increase the future economic benefit of the asset. Property
and equipment subject to wear are reported upon subsequent measurement less scheduled straight-line deprecia-
tion charged over the useful life. Impairments are charged at the amount at which the carrying amount exceeds the
higher amount of fair value less the cost of disposal and value in use of the asset. If reasons for impairment no longer
exist, write-ups (appreciations in value) are carried out, but not in excess of the amount of amortised cost. Scheduled
depreciation is recognised under administrative expenses and impairments and write-ups in other operating
profit / loss.
Property and equipment is depreciated over the following periods:
Property and equipment
Land and buildings 10 – 50
Operating and office equipment 3 – 25
Ships 25
Other property and equipment 3 – 25

F-31
(10) Leases
In accordance with IAS 17, leases must be classified as finance or operating leases at the inception of a lease. If essen-
tially all of the opportunities and risks associated with ownership are transferred to the lessee, the lease is classified
as a finance lease and the leased asset is accounted for by the lessee. If essentially all of the opportunities and risks
associated with ownership are not transferred to the lessee, the lease is classified as an operating lease and the
leased asset is accounted for by the lessor.
Finance lease
If the NORD/LB Group is considered to be the lessor, a receivable to the amount of the lessee’s payment obligations
resulting from the lease is reported at the inception of the lease. The receivable is reported at the net investment
value (difference between the gross investment in the lease and finance income not yet realised) and is shown in
other loans and advances to banks or loans and advances to customers. Any additional costs incurred are spread over
the term of the contract.
Lease payments relating to a finance lease are split into a capital and an interest amount. The capital amount is
deducted from loans and advances directly in equity. The interest amount is accounted for as interest income through
profit or loss.
Operating lease
If the Group is considered to be the lessee in operating leases, lease payments made are reported as an expense in
other administrative expenses. Initial direct costs (for example costs for appraisers) are immediately recognised
through profit or loss.
(11) Investment property
Investment property is considered to be land and buildings or parts of buildings held to generate rental income
and / or for the purpose of capital appreciation. Properties where more than 20 per cent of the leased floor space
is utilised by third parties are examined to determine whether the part used by third parties can be separated. If this
is not the case then the whole property is reported in property and equipment.
Investment property is reported at cost on the date of acquisition; transaction costs are included in initial measure-
ment. Subsequent costs are capitalised if they result in a significant improvement in the asset and therefore increase
the future economic benefit of the asset.
Upon subsequent measurement of investment properties scheduled straight-line depreciation is charged. Impair-
ments are charged at the amount at which the carrying amount exceeds the higher amount of fair value less the cost
of disposal and value in use of the asset. If the reasons for impairment cease to exist, impairment losses are reversed,
but not above the amortised cost. Scheduled depreciation is recognised under administrative expenses and
impairments and write-ups in other operating profit / loss.
Investment property is depreciated over a period of 2 to 50 years.
The income value method is used, based on market data, to calculate the fair value of investment property. The
valuation is carried out in part by independent experts who are appropriately qualified and relevant experience.

F-32
(12) Intangible assets
Intangible assets which are acquired by the NORD/LB Group are reported at cost of acquisition and internally devel-
oped intangible assets are reported at cost of production provided that the criteria for recognition required under
IAS 38 are met. Subsequent costs are capitalised if they result in a significant improvement in the asset and therefore
increase the future economic benefit of the asset.
Scheduled straight-line amortisation over the useful life is charged for intangible assets with a finite useful life.
Impairments are charged at the amount at which the carrying amount exceeds the higher of fair value less cost of
disposal and value in use of the asset for intangible assets with a finite useful life. If the reasons for the impairment
no longer exist, write-ups are carried out, but not in excess of the amortised cost. Scheduled depreciation is recog-
nised under administrative expenses and impairments and write-ups in other operating profit / loss.
Intangible assets with a finite useful life are amortised over a period of 3 to 15 years.
Intangible assets with an indefinite useful life are tested at least once a year in the fourth quarter for their recoverabil-
ity. The value of goodwill is reviewed on the basis of cash generating units (CGUs).
(13) Assets held for sale
Longer-term assets or disposal groups held for sale whose carrying amounts are realised through a sale and not
through operational use are recognised in separate balance sheet items. Such assets are measured at fair value less
costs of disposal provided that these costs do not exceed the carrying amount. Longer-term assets held for sale are
no longer amortised as at the date of reclassification. Impairment losses resulting from longer-term assets and
disposal groups held for sale are, however, taken into account.
No entire business divisions were discontinued in 2013 or in 2012.
(14) Provisions for pensions and similar obligations
Pension obligations from defined benefit plans are calculated in accordance with IAS 19 by independent actuaries as
at the balance sheet date in accordance with the projected unit credit method. Plan assets which are invested in order
to cover defined benefit pension obligations and similar benefits are measured at their fair value and offset against
the corresponding liabilities.
Differences between the assumptions made and developments that have actually taken place and changes in the
assumptions for the measurement of defined benefit plans and similar liabilities result in actuarial gains and losses
which are recognised in the year that they occur under other comprehensive income.
Interest is added to the balance of defined benefit pension obligations, similar benefits and plan assets (net pension
obligation) using the discount rate used in the measurement of the gross pension obligation. The resulting net
interest expense is recognised in the income statement under interest expenses. The other expenses related to the
granting of pension obligations and similar benefits, which primarily relate to entitlements earned in the financial
year, are considered in the income statement under administrative expenses.

F-33
In order to establish the present value of defined benefit obligations, in addition to biometric assumptions, the
discount rate calculated using the Mercer Yield Curve Approach (MYC) for first-class industrial securities and antici-
pated future salary and pension increase rates are taken into account. For the projection of mortality and invalidity,
Klaus Heubeck’s “Richttafeln 2005 G” mortality tables were used. Gains or losses from the reduction or payment of
a defined benefit plan are recognised at the time of the reduction or payment through profit or loss.
The defined benefit obligation is calculated based on the following actuarial assumptions:
(in %) 31 Dec. 2013 31 Dec. 2012
Domestic
Actuarial interest rate 3.70 3.60
Increase in salaries 2.00 2.30
Increase in pensions (contingent on the occupational pension scheme)
2.75 / 2.87 / 1.00 / 2.0 / 2.25 / 3.25 2.86
Cost increase rate for allowance payments – –
Mortality, invalidity, etc.Based on Heubeck
2005G mortality tablesBased on Heubeck
2005G mortality tables
Abroad (weighted parameters)
Actuarial interest rate 4.49 4.49
Increase in salaries 4.43 4.08
Increase in pensions 2.81 2.82
Mortality, invalidity, etc.
USA RP-2000, GB S1PMA Light/S1PFA light base tables with
CMI 2013 projections basis LUX DAV 2004 R
Inflation 3.48 3.10
(15) Other provisions
Other provisions are established in accordance with IAS 37 and IAS 19 for uncertain liabilities to third parties
and anticipated losses on pending transactions if utilisation is likely and if its amount can be reliably determined.
Provisions are measured as the best estimate. This is based on the assessment of management taking into account
empirical values and, if necessary, experts reports or opinions. Risks and uncertainties are taken into account.
Future events which may influence the amount required to meet an obligation are only included if there are objective
indications of their occurrence. Provisions are discounted if the effect is material.
(16) Insurance business
Insurance business is recognised in current balance sheet and income statement items. Where these significant
components of a balance sheet and income statement item refer to sector-specific insurance business, information is
presented in the corresponding notes. Reference is made in particular to information in Notes (23), (29), (46), (53),
and (55). Insurance company investments that fall within the scope of application of IAS 39 are recognised in accord-
ance with accounting policies which apply for the entire Group. Investments for the account and risk of holders of life
insurance policies are reported at fair value through profit or loss.

F-34
In accordance with IFRS 4.13, insurers may temporarily report insurance items in accordance with the previously
applied accounting regulations. Provisions relating to insurance are therefore reported and measured in accordance
with commercial law in keeping with IFRS 4.25. For consolidated insurers this law is German commercial law, and in
particular §§ 341 to § 341p of the German Commercial Code (Handelsgesetzbuch, HGB), the German Law Regulating
Insurance Companies (Versicherungsaufsichtsgesetz, VAG) and the German Insurance Accounting Ordinance
(Versicherungsunternehmens-Rechnungslegungsverordnung, RechVersV). Unlike under the German Commercial
Code, an equalisation provision or similar provision is not allowed to be made under IFRSs.
The application of German accounting principles to measure insurance obligations in accordance with IFRS 4 also
involves the principle of prudence. In this case, in the event of uncertainty concerning the amount of a value, the
tendency is to include a conservative value instead of the most probable value. This ensures that when values are
determined in accordance with German commercial law, liability adequacy tests in accordance with IFRS 4.14 (b) will
already have been performed.
Premium surpluses for insurance business concluded directly have been calculated in accordance with the 360th
system in accordance with the coordinate Ländererlass (state decree) of 9 March 1973. Reinsurer shares are taken
from their calculation. Premium surpluses for insurance business taken over as reinsurance are assumed in accord-
ance with the functions of the previous insurance company.
Actuarial reserves for insurance business concluded directly, including the relevant share in surpluses and the corre-
sponding claims on policy holders, are calculated on an individual contract basis with implicitly calculated costs for
each insurance contract. With the exception of unit-linked life insurance and annuity insurance policies, prospective
methods are applied here. Calculations of bonus and administrative cost provisions for existing and new contracts
are based on the same accounting principles as for the relevant primary insurance policy. The biometric accounting
principles employed have been derived from Deutsche Aktuarvereinigung e.V. (German Association of Actuaries) and
comply with requirements of the General Equal Treatment Act (Allgemeines Gleichbehandlungsgesetz, AGG).
In insurance business concluded directly, individual provisions for outstanding insurance claims are created for each
reported insurance claim and adjusted if necessary if new findings are made. Long-tail claims are reported globally on
the basis of statistical measurement methods. Reinsurer shares were taken over from their calculation. A correspond-
ing provision is established for redemptions in the case of paid-up and cancelled insurance policies. The provision for
business assumed as reinsurance is reported in accordance with the functions of the previous insurance company.
Some of the values stated are estimates due to the late submission of final accounts.
The provision for the reimbursement of premiums contains amounts which have been provided for future distribution
to policy holders in accordance with the law or the statutes. Calculations for final surplus share funds contained
in provisions for the reimbursement of insurance contributions are prospective and have all been calculated on an
individual contract basis. Amounts resulting from temporary differences between conclusions according to IAS / IFRSs
and those according to German commercial law are proportionately allocated to a deferred provision for the reim-
bursement of insurance contributions.
Insofar as the investment risk is borne by policy holders, the retrospective method is applied for calculating the
value of insurance provisions in life insurance from the current investment units of the individual insurers in the
corresponding item on “Investments for the account and risk of holders of life insurance policies”.
Financial assets and liabilities specific to insurance held in the NORD/LB Group are accounted for in accordance with
IFRS 4. These are net deposit receivables and payables from lending and deposit reinsurance business, amounts
receivable and amounts payable from reinsurance business and amounts receivable and amounts payable under
direct insurance contracts. These items are recognised at their settlement value. Any allowances required for receiva-
bles from insurance business concluded directly are reported in risk provisioning.

F-35
(17) Income taxes
Current income tax assets and tax liabilities were calculated at currently valid tax rates to the amount expected to be
received from/paid to the respective tax authority or to the amount of tax refunds expected to be received from the
respective tax authority.
Deferred tax assets and tax liabilities are calculated on the basis of the difference between the carrying amount of
an asset or a liability in the balance sheet and the corresponding tax value. In this case, deferred tax assets and tax
liabilities will probably result in effects which increase or reduce income tax in future periods due to temporary
differences. They were measured on the basis of tax rates expected to be valid in the period in which an asset is
realised or an obligation is met. In this case tax rates (and tax regulations) which are valid for individual companies on
the balance sheet date or which have been resolved by the reporting date are applied.
Deferred tax income for carrying forward tax losses not yet utilised and tax credits not yet utilised is only reported to
the extent that it is probable that taxable future income will be available for applying tax losses not yet utilised and
tax credits not yet utilised.
Current income tax assets and tax liabilities as well as deferred tax assets and tax liabilities are offset when require-
ments for offsetting are met. They are not discounted. Depending on the treatment of the underlying circumstances,
deferred tax assets and tax liabilities are reported either in the income statement or in other comprehensive income.
Income tax assets and income tax liabilities are shown separately in the balance sheet and separated into actual and
deferred assets and liabilities for the year under review. The carrying amount of deferred tax asset is reviewed for
recoverability as at every balance sheet date.
Taxes on earnings or income tax proceeds are recognised in the income tax item in the consolidated income state-
ment.
(18) Subordinated capital
The subordinated capital item comprises secured and unsecured subordinated liabilities, participatory capital and
silent participations. The NORD/LB Group’s silent participations are mostly classified as debt in accordance with regu-
lations specified in IAS 32 due to contractual cancellation rights; under the German Commercial Code silent participa-
tions always qualify as equity. For regulatory purposes in accordance with the German Banking Act (Kreditwesen-
gesetz, KWG), they are primarily recognised as liable equity.
Subordinated capital is reported at amortised cost. Premiums and discounts are distributed over the term in accord-
ance with the effective interest method and recognised in the income statement under net interest income. Deferred
interest not yet due is allocated directly to the corresponding items in subordinated capital.

F-36
Segment Reporting
The segment reporting provides information on the operational business segments of the Group. The segment
reporting below is based on IFRS 8 “Operating segments”, which follows the “management approach”. The segment
information is presented in the IFRSs on the basis of internal reporting in the same way that it is reported internally
on a regular basis for assessing performance and making decisions on the allocation of resources to the segments. In
the segment reporting adjustments of figures for the previous year are taken into account (cf. Note (2) Adjustment of
figures for the previous year). In addition to this, previous year’s figures have been reallocated due to overhead
costs and the income from financing from tied-up equity being distributed to the business segments from 2013
(see below). The allocation of overheads and the income from financing from tied-up equity increases the focus on
the actual income and cost performance of the business model, as the earnings from the business segments is
compared with the operational costs of the bank. At the same time the burden on Group Controlling / Others segment
is eased and results transparency is improved.
Segment reporting by business segment
The segments are defined as customer or product groups which reflect the organisational structures and therefore
the internal control of the Group. Calculations are based on the internal data of Group member companies. The inter-
nal control focuses on the operational units’ earnings before tax.
An important criterion for the formation of segments is the greatest possible homogeneity of the customers
aggregated in the segment in relation to financing and investment requirements and the products demanded. It is
not possible to recognise dependencies on individual customers. The product ranges offered in the segments are
described below and the earnings generated are shown in the overview. The product range offered comprises
classical lending business and syndicate business, savings and giro products, securities, currency and derivative
transactions, complex structured financing solutions, private banking products, liquidity and risk management, merg-
ers and acquisitions, services such as accounting management, payment transactions, securities business, brokering,
documentary business, credit processing, sureties, guarantees and advisory services for asset management.
Net interest income generated by the individual segments is calculated on the basis of the market interest rate
method. In the process the contribution from the interest rate conditions for each customer transaction is calculated
by comparing the customer conditions with the structure-congruent market interest rate for a fictitious counter
transaction applicable at the time the transaction is completed. This market interest rate is at the same time the cost
value for the Treasury Division’s balancing provision. Therefore interest income and interest expenses are not
reported gross. From 2013 the income from financing from tied-up equity is allocated to the market segments
(the previous year’s figures were adjusted).
In the bank every interest-bearing customer transaction is allocated to the balancing provision of the Treasury
Division as the central planning division. There are no direct business relations between the market divisions in the
bank. Therefore inter-segment earnings are not included in the internal reporting.
Segment expenses comprise primary expenses, expenses allocated on the basis of cost and service allocations and
the overhead costs allocated from 2013 (previous year adjusted). Risk provisioning are allocated to segments on the
basis of actual costs incurred. Overall bank revenue, such as general loan loss provisions and profit / loss from hedge
accounting and overhead costs, is not allocated to the operational profit centres of the bank but to the segment
“Group Controlling / Others”.

F-37
In addition to figures relating to the statement of comprehensive income, the segment report also shows risk-
weighted assets to be allocated on the basis of the regulatory provisions of Basel II including shortfall, segment
assets and liabilities, committed capital, the cost income ratio (CIR) and return on equity (RoE). The CIR is defined as
the ratio between administrative expenses and the sum total of the following earnings items: net interest income, net
commission income, profit / loss from financial instruments at fair value through profit or loss, profit / loss from hedge
accounting, profit / loss from investments accounted for using the equity method and other operating profit / loss.
RoRaC (Return on Risk adjusted Capital) calculations in the segments include the contribution to income after risk
provisions and valuation on committed capital (here 8 per cent of the higher value of the RWA limits and the amount
called on).
In order to consider the increased equity requirements, since 2013 a capital securitisation level of 8 per cent
(7 per cent) of risk-weighted assets applies for calculating committed capital in the segments. These are based on the
provisions of the German Solvency Regulation (Solvabilitätsverordnung, SolvV). Capital tied up in the segments is
calculated on the basis of average annual figures. The reconciliation figure for the tied-up capital reported in the
segments and the long-term equity in the Group in accordance with commercial law is included in the segment
reconciliation. A transfer from long-term equity under commercial law to equity reported in the balance sheet is
shown separately at the end of the segment overview.
The following segments are reported by business segment in the segment reporting:
Private and commercial customers
As well as business with private, individual, commercial and small-business customers, this business segment
includes middle-market corporate customer business in the Braunschweig region. This segment also includes
the business conducted by Öffentliche Lebensversicherung Braunschweig and Öffentliche Sachversicherung
Braunschweig.
The product range for the business segment Private and Commercial Customers is based on the savings bank finance
concept and comprises all of the usual banking services and products for account and lending business, savings and
investment business and the provision of internet banking and direct brokerage. Extended services for wealthy
private customers range from the integrated advisory approach of asset structure analysis, financial planning, asset
succession and inheritance and foundation management. The product range also includes investment loans and
start-up advice for the middle-market company business.
Corporate customers & markets
The business segment includes, for the Corporate Customers Division, all of the NORD/LB business conducted with
corporate customers in the core regions (excluding the Altes Braunschweiger Land region) and in neighbouring
regions, and in particular Agricultural Banking and Residential Housing. The Markets Division covers the Financial
Markets activities performed in Germany, the foreign branches and in the Group companies on behalf of customers.
The Savings Bank Network Division covers transactions with the public sector; institutional business with associated
savings banks and syndicated business transacted with associated savings banks are reported.
As a full-service provider, banking products and banking services are offered. The services include traditional transac-
tion management, tailored business financing, management of interest and currency risk and solutions for company
pension schemes. In the segment comprehensive solutions are developed for complex business financing and for the
strategic positioning of corporate customers. This Division also provides its customers with a professional, concep-
tual liquidity and risk management, measures for the structuring of equity and innovative financing instruments.
F-38
Alternative products which are detached from retail banking including derivatives are also offered, e. g. special kinds
of debt securities which are not standardised in respect of their interest and repayment, but instead offer alternatives
in respect of returns and the type or time of repayment (structured securities). In the secondary business all kinds of
securities are sold and traded. Tailored solutions for institutional customers such as for example the structuring of
special funds, pool funds solutions, portfolio management mandates and institutional public funds are also offered.
The product range also includes private banking products for the savings banks, such as investment products in the
form of for example open or closed funds with assets in German or foreign real estate, ships or aircraft, products for
individual asset management or inheritance or foundation management, which the savings banks require as direct
customers for their own trading business or to complete their product range in their own business with private or
corporate customers.
In the Energy and Infrastructure Customers, Ship and Aircraft Customers and Real Estate Banking Customers
segments traditional lending products and innovative products are generally offered irrespective of the respective
industry. This primarily concerns financing for specific purposes.
Energy and infrastructure customers
This segment summarises the global business relations of the Group companies NORD/LB and Bremer Landesbank in
the Infrastructure, Energy (in particular renewable energy) and Leasing divisions. Primarily project financing which is
related to a specific project or asset is offered and accordingly tailored to meet the respective individual need. The
structure of this financing is developed taking into account the respective political and economic risks, legal and task
factors, social determinants and optimal equity structures. The aim is to tailor project requirements and cash flows to
the respective customers.
Ship and aircraft customers
In this segment the national and international activities of NORD/LB and Bremer Landesbank in ship and aircraft
financing are reported. The customers of the Ship and Aircraft Customers segment are offered short to long-term
financing, such as equity pre-financing, interim finance, construction period finance (short and medium term) and
financing to completion (long term). Ships or aircraft are financed by the provision of loans or guarantees on a prop-
erty-related and normally property-secured basis. Products such as for example swap, option, future or forward
transactions complete the product range.
Real estate banking customers
Here NORD/LB and Deutsche Hypo’s national and international financing of commercial real estate and Bremer
Landesbank’s financing of community interest properties are aggregated. This normally concerns structured financing
for large-volume commercial real estate projects and portfolios in Germany and abroad. Both interim finance for new
construction projects and long-term loans for existing properties are offered.

F-39
Group controlling / others
This business segment covers all other performance data directly related to the business activity such as Group
companies not included in the business segments, components of comprehensive income at Group level which are
not allocated to the business segments, general loan loss provisions, the profit / loss from other financial instruments
(in particular from central valuation effects), financial assets and hedge accounting, projects covering the entire bank;
consolidation items; profit / loss from interest rate change risk control, balancing provision, liquidity management
and self-induced assets (in particular Treasury and Bank Asset Allocation). Other operating profit / loss includes the
bank levy.
Earnings after taxes in Group Controlling / Others totalled € – 179 million in 2013.
Positive contributions were made by net interest income in the amount of € 198 million, and in particular approx.
€ 214 million from Financial Markets activities recorded here, € 71 million from interest income not allocated to
the business segments, € – 29 million from other Group companies and € – 59 million from consolidations. Also
recognised in this business segment under loan loss provisions are allocations to general loan loss provisions in the
amount of approx. € 59 million.
Net commission income, in particular from other Group companies and consolidation effects, had a negative effect
in the amount of € – 23 million. The profit / loss from hedge accounting also had a negative effect in the amount of
€ – 10 million. The profit / loss from financial instruments at fair value is negative in the amount of € 13 million due in
particular to the central valuation effects reported here; positive factors such as interest-rate and credit-rating-in-
duced valuation effects valuation effects with derivatives almost compensated for the negative impact of the narrow-
ing of the USD / EUR base spread for currency derivatives and valuation losses in the fair value option following the
improvement in NORD/LB’s own credit spread.
Also reported in this business segment are the effects from the profit / loss from financial assets (€ 16 million, in
particular from the sale of AfS items) and the profit / loss from investments accounted for using the equity method
(€ 33 million). Regarding other operating profit / loss (€ 61 million), the contributions from other Group companies
(€ 76 million) and the proceeds from sales in the Treasury Division (€ 59 million) cannot compensate for the consoli-
dation items and the bank levy (total of € – 73 million).
Administrative expenses in this business segment total € 271 million. Administrative expenses in this segment result
in the amount of € 102 million from the Financial Markets activities reported here and € 46 million from other Group
companies. Further administrative expenses (€ 214 million) in this business segment are for projects covering the
entire bank and non-allocated service centre costs. This was offset in part by consolidations in the amount of approx.
€ – 91 million.
Furthermore, in 2013 reorganisation expenses (€ 38 million) and expenses related to public guarantees for reorgani-
sation (€ 69 million) were incurred.
Reconciliations
Here the reconciliation items from internal accounting for the consolidated figures in the income statement are
shown as well as reclassifications of profit and loss items that are reported differently in the internal reporting to in
the external reporting. The shortfall in the regulatory capital requirement is converted into risk-weighted assets
within internal reporting and assigned to the operational units; the adjustment item resulting from the regulatory
risk-weighted assets report flows into the reconciliation.

F-40
(19) Segment reporting by business segment
1 Jan.–31 Dec. 2013 /
31 Dec. 2013
(in € million)
Private
and
Commer-
cial
Customers
Corporate
Customers
& Markets
Energy
and
Infra-
structure
Customers
Ship and
Aircraft
Customers
Real
Estate
Banking
Customers
Group
Manage-
ment /
Others
Recon-
ciliations
NORD/LB
Group
Net interest income before loan loss provisions 286 495 159 489 258 198 45 1 931
Loan loss provisions – 2 45 8 678 79 64 – 26 846
Net interest income after loan loss provisions 288 450 151 – 188 180 134 71 1 085
Net commission income 31 103 56 34 4 – 23 – 43 163
Profit / loss from financial instruments at fair value through profit or loss 3 55 12 23 17 – 13 – 14 83
Profit / loss from hedge accounting – – – – – – 10 – – 10
Profit / loss from financial assets 13 – – – – 16 – 18 11
Profit / loss from investments accounted for using equity method – – – – – 33 – 33
Administrative expenses 329 285 79 115 74 271 13 1 166
Other operating profit / loss 32 8 4 5 – 61 – 41 69
Profit / Loss before reorganisation and taxes 38 332 144 – 242 128 – 72 – 59 268
Reorganisation expenses – – – – – – 38 – – 38
Expenses for public guarantees related to reorganisation – – – – – 69 – 69
Earnings before taxes (EBT) 38 332 144 – 242 128 – 179 – 59 161
Taxes – – – – – – – 85 – 85
Consolidated profit 38 332 144 – 242 128 – 179 25 245
Segment assets 10 801 65 457 14 047 26 335 16 374 67 605 226 200 845
of which: investments at equity – – – – – 306 – 306
Segment liabilities 11 145 43 364 2 952 4 974 733 136 330 1 346 200 845
Risk-weighted assets 5 489 15 422 7 231 43 287 13 018 14 156 – 30 109 68 494
Capital employed 1) 462 1 237 578 3 463 1 041 1 106 – 66 7 822
CIR 93,6 % 43,0 % 34,4 % 20,9 % 26,3 % 51,4 %
RoRaC/RoE 2) 8,2 % 19,8 % 19,1 % – 7,0 % 10,1 % 2,1 %

F-41
(in € million) 31 Dec.2013 31 Dec.2012
Long-term equity under commercial law 7 822 7 712
Revaluation reserve 122 – 95
Silent participations in reported equity 245 82
Reported equity 8 190 7 700
1) Reconciliation of long-term equity under commercial law to reported equity: 2) Business segment RoRaC: earnings before taxes / committed core capital;
(8 per cent (7 per cent) of the higher value of the RWA limit and the amount called on)
Group RoE: earnings before taxes / long-term equity under commercial law (= reported equity – revaluation reserve – earnings after taxes)
The tables may include minor differences that occur in the reproduction of mathematical operations.
1 Jan.–31 Dec. 2012 /
31 Dec. 2012
(in € million)
Private
and
Commer-
cial
Customers
Corporate
Customers
& Markets
Energy
and
Infra-
structure
Customers
Ship and
Aircraft
Customers
Real
Estate
Banking
Customers
Group
Manage-
ment /
Others
Recon-
ciliations
NORD/LB
Group
Net interest income before loan loss provisions 283 500 167 510 268 143 88 1 959
Loan loss provisions 1 87 30 500 132 – 153 1 598
Net interest income after loan loss provisions 282 413 137 9 136 295 88 1 360
Net commission income 25 94 51 57 13 – 25 – 48 168
Profit / loss from financial instruments at fair value through profit or loss 12 112 3 11 4 – 284 20 – 123
Profit / loss from hedge accounting – – – – – 10 – 9 1
Profit / loss from financial assets 10 – – – – – 16 – – 5
Profit / loss from investments accounted for using equity method – – – – – – 14 – – 14
Administrative expenses 324 274 77 103 76 295 9 1 158
Other operating profit / loss 9 7 4 – 2 1 – 65 – 53 – 99
Profit / Loss before reorganisation and taxes 15 353 119 – 29 77 – 393 – 11 131
Reorganisation expenses – – – – – – 34 – – 34
Expenses for public guarantees related to reorganisation – – – – – 19 – 19
Earnings before taxes (EBT) 15 353 119 – 29 77 – 446 – 11 79
Taxes – – – – – – – 4 – 4
Consolidated profit 15 353 119 – 29 77 – 446 – 7 82
Segment assets 11 798 65 459 14 745 27 780 18 308 84 838 2 622 225 550
of which: investments at equity – – – – – 318 – 318
Segment liabilities 10 917 48 175 3 098 4 261 905 155 114 3 080 225 550
Risk-weighted assets 5 641 15 686 8 062 37 736 16 768 14 101 – 20 133 77 863
Capital employed 1) 411 1 100 564 2 642 1 174 969 853 7 712
CIR 98,3 % 38,4 % 34,0 % 18,0 % 26,7 % 61,2 %
RoRaC/RoE 2) 3,6 % 25,9 % 18,3 % – 1,1 % 6,3 % 1,0 %

F-42
(20) Breakdown by geographical regions
1 Jan.–31 Dec. 2013 /
31 Dec. 2013
(in € million)
Federal
Republic of
Germany
Europe
excluding
Germany
America Asia Consolida-
tion
NORD/LB
Group
Earnings before taxes (EBT) – 28 88 68 49 – 17 161
Segment assets 200 116 27 729 4 547 4 223 – 35 771 200 845
Segment liabilities 202 135 26 704 4 547 4 223 – 36 765 200 845
Risk-weighted assets 61 533 7 343 2 130 1 517 – 4 029 68 494
Capital employed 7 380 587 170 121 – 437 7 822
CIR 55.1 % 43.3 % 34.0 % 23.0 % 51.4 %
RoRaC/RoE 1) – 0.4 % 15.1 % 39.9 % 40.6 % 2.1 %
1 Jan.–31 Dec. 2012 /
31 Dec. 2012
(in € million)
Federal
Republic of
Germany
Europe
excluding
Germany
America Asia Consolida-
tion
NORD/LB
Group
Earnings before taxes (EBT) – 128 119 111 53 – 77 79
Segment assets 230 608 29 920 5 526 4 133 – 44 637 225 550
Segment liabilities 230 608 29 920 5 526 4 133 – 44 637 225 550
Risk-weighted assets 69 643 7 312 3 298 1 735 – 4 125 77 863
Capital employed 7 249 512 231 121 – 401 7 712
CIR 64.5 % 28.5 % 28.6 % 20.4 % 61.2 %
RoRaC/RoE 1) – 1.8 % 23.3 % 47.9 % 43.7 % 1.0 %
1) By business segment RoRaC:earnings before taxes / core capital employed(8 per cent (7 per cent) of the higher value coming from RWA-Limit or usage amount)
For the Group RoE:(earnings before taxes – interest expenses for silent participationsin reported equity) / long-term equity under commercial law(= share capital + capital reserves + retained earnings + non-controlling interests –silent participations in reported equity)
The tables may include minor differences that occur in the reproduction of mathematical operations.

F-43
Notes to the Income Statement
(21) Net interest income
The items interest income and interest expense comprise interest received and paid, deferred interest and pro rata
reductions in premiums and discounts relating to financial instruments. Due to the fact that under certain
circumstances silent participations are to be classified as liabilities under IAS 32, payments to silent partners are
reported as interest expense.
1 Jan.– 31 Dec.
2013
(in € million)
1 Jan.– 31 Dec.
2012 1)
(in € million)
Change
(in %)
Interest income
Interest income from lending and money market transactions 4 190 4 798 – 13
Interest income from debt securities and other fixed-interest securities 973 1 271 – 23
Interest income from financial instruments at fair value
Interest income from trading profit / loss and hedge accounting derivatives 4 067 5 730 – 29
Interest income from fair value option 50 64 – 22
Current income
from shares and other non fixed-interest securities 12 9 33
from investments 11 40 – 73
Interest income from other amortisations 482 355 36
Other interest income and similar income 2 13 – 85
9 787 12 280 – 20
Interest expense
Interest expenses from lending and money market transactions 2 127 2 527 – 16
Interest expenses from securitised liabilities 1 107 1 605 – 31
Interest expenses from financial instruments at fair value
Interest expenses from trading profit / loss and hedge accounting derivatives 3 646 5 274 – 31
Interest expenses from fair value option 323 324 –
Interest expenses from subordinated capital 229 245 – 7
Interest expenses from other amortisations 346 261 33
Interest expenses from provisions and liabilities 71 79 – 10
Other interest expenses and similar expenses 7 6 17
7 856 10 321 – 24
Total 1 931 1 959 – 1
1) Some previous year’s figures were adjusted as you can see at note (2) adjustment of figures for the previous year.
Interest income from lending and money market transactions includes interest income relating to impaired loans
(unwinding) of € 77 million (€ 61 million).
The interest income includes € 5,646 million (€ 6,424 million) relating to income from financial instruments which
are not measured at fair value through profit or loss. The interest expenses include € 3,809 million (€ 4,638 million)
relating to expenses from financial instruments which are not measured at fair value through profit or loss.

F-44
(22) Loan loss provisions
1 Jan.– 31 Dec.
2013
(in € million)
1 Jan.– 31 Dec.
2012
(in € million)
Change
(in %)
Income from provisions for lending business
Reversal of specific valuation allowances 336 299 12
Reversal of lumpsum specific loan loss provisions 10 13 – 23
Reversal of general loan loss provisions 25 175 – 86
Reversal of loan loss provisions 65 69 – 6
Additions to receivables written off 21 25 – 16
457 581 – 21
Expenses for provisions for lending business
Allocation to specific valuation allowances 1 030 939 10
Allocation to lumpsum specific loan loss provisions 5 5 –
Allocation to general loan loss provisions 80 44 82
Allocation to loan loss provisions 54 98 – 45
Direct write-offs of bad debts 134 92 46
Premium payments for credit insurance – 1 – 100
1 303 1 179 11
Total 846 598 41
(23) Net commission income
1 Jan.– 31 Dec.
2013
(in € million)
1 Jan.– 31 Dec.
2012
(in € million)
Change
(in %)
Commission income
Lending and guarantee business 106 127 – 17
Account management and payment transactions 41 41 –
Trust activities 5 10 – 50
Security transactions and custody service 36 29 24
Brokerage business 31 30 3
Insurance business 8 8 –
Other commission income 43 32 34
270 277 – 3
Commission expense
Lending and guarantee business 19 17 12
Account management and payment transactions 2 2 –
Trust activities – 4 – 100
Security transactions and custody service 23 21 10
Brokerage business 9 5 80
Insurance business 32 31 3
Other commission expenses 22 29 – 24
107 109 – 2
Total 163 168 – 3
Commission income includes earnings from financial instruments which are not measured at fair value in the amount
of € 183 million (€ 197 million). Commission expenses include expenses from financial instruments which are not
measured at fair value in the amount of € 45 million (€ 40 million).

F-45
(24) Profit / loss from financial instruments at fair value through profit or loss
1 Jan.– 31 Dec.
2013
(in € million)
1 Jan.– 31 Dec.
2012
(in € million)
Change
(in %)
Trading profit / loss
Profit / loss from debt securities and other fixed-interest securities – 66 123 > 100
Profit / loss from shares and other non fixed-interest securities 4 2 100
Profit / loss from derivatives – 80 304 > 100
Interest-rate risks – 130 200 > 100
Currency risks – 108 – 243 – 56
Share-price and other price risks 57 63 – 10
Credit derivatives 101 284 – 64
Profit / loss from receivables held for trading – 41 78 > 100
Profit / loss from other trading activities 2 – –
– 181 507 > 100
Foreign exchange result 39 8 > 100
Other income 6 2 > 100
– 136 517 > 100
Profit / loss from the fair value option
Profit / loss from receivables to customers and banks – 13 12 > 100
Profit / loss from debt securities and other fixed-interest securities – 45 – 29 55
Profit / loss from shares and other non fixed-interest securities 1 1 –
Profit / loss from liabilties to banks and customers 383 – 299 > 100
Profit / loss from securitised liabilties – 108 – 325 – 67
Profit / loss from subordinated capital 1 – –
219 – 640 > 100
Total 83 – 123 > 100
Commission income from trading activities in the amount of € 6 million (€ 2 million) is reported under other income.

F-46
(25) Profit / loss from hedge accounting
The profit / loss from hedge accounting includes fair value adjustments relating to the hedged risk of an underlying
transaction and offset fair value adjustments to hedge instruments in effective fair value hedge relationships.
1 Jan.– 31 Dec.
2013
(in € million)
1 Jan.– 31 Dec.
2012
(in € million)
Change
(in %)
Profit / loss from micro fair value hedges
from hedged underlying transactions – 395 – 106 > 100
from derivatives employed as hedging instruments 373 70 > 100
– 22 – 36 – 39
Profit / loss from portfolio fair value hedges
from hedged underlying transactions 136 – 385 > 100
from derivatives employed as hedging instruments – 124 422 > 100
12 37 – 68
Total – 10 1 > 100
(26) Profit / loss from financial assets
Shown in the profit / loss from financial assets are profits / losses from disposals and estimated profits / losses relating
to securities and company shares in the financial asset portfolio.
1 Jan.– 31 Dec.
2013
(in € million)
1 Jan.– 31 Dec.
2012
(in € million)
Change
(in %)
Profit / loss from financial assets classified as LaR – 12 – 2 > 100
Profit / loss from financial assets classified as AfS (excluding investments)
Profit/ loss from the disposal of
debt securities and other fixed-interest securities 50 34 47
shares and other non fixed-interest securities 18 13 38
Other financial assets classified as AfS – 2 – 2 –
Profit / loss from allowances for losses on
debt securities and other fixed-interest securities – – 2 100
shares and other non fixed-interest securities – 14 – 6 > 100
Other financial assets classified as AfS – 4 – 16 – 75
48 21 > 100
Profit / loss from shares in companies (not consolidated) – 25 – 24 4
Total 11 – 5 > 100

F-47
(27) Profit / loss from investments accounted for using the equity method
The profit / loss from investments accounted for using the equity method is summarised below. It shows the contribu-
tions to earnings of joint ventures and associated companies accounted for using the equity method.
1 Jan.– 31 Dec.
2013
(in € million)
1 Jan.– 31 Dec.
2012
(in € million)
Change
(in %)
Shares in joint ventures
Earnings 2 3 – 33
2 3 – 33
Shares in associated companies
Earnings 37 41 – 10
Expenses 6 58 – 90
31 – 17 > 100
Total 33 – 14 > 100
(28) Administrative expenses
1 Jan.– 31 Dec.
2013
(in € million)
1 Jan.– 31 Dec.
2012
(in € million)
Change
(in %)
Staff expenses
Wages and salaries 490 492 –
Social insurance contributions 68 68 –
Expenditure on pension schemes and other benefits 52 37 41
Other staff expenses 6 6 –
616 603 2
Other administrative expenses
Costs for IT and communications 237 215 10
Building occupancy costs 48 45 7
Expenses for marketing, communications and entertainment 28 48 – 42
Personnel-related material expenses 22 25 – 12
Costs for legal, auditing, appraisal and consulting services 67 64 5
Levies and contributions 18 20 – 10
Expenses for operating and office equipment 6 6 –
Other services 9 9 –
Other administrative expenses 37 34 9
472 466 1
Amortisation and depreciation
Property and equipment 39 45 – 13
Intangible assets 37 42 – 12
Investment properties 2 2 –
78 89 – 12
Total 1 166 1 158 1
Included under staff expenses are expenses for defined contribution plans in the amount of € 52 million (€ 37 million).

F-48
(29) Other operating profit / loss
1 Jan.– 31 Dec.
2013
(in € million)
1 Jan.– 31 Dec.
2012
(in € million)
Change
(in %)
Other operating income
from the reversal of provisions 327 269 22
from insurance business 540 497 9
from other business 226 183 23
1 093 949 15
Other operating expenses
from allocation to provisions 455 441 3
from insurance business 344 315 9
from other business 225 292 – 23
1 024 1 048 – 2
Total 69 – 99 > 100
Earnings from the reversal of provisions and expenses from allocation to provisions primarily concern provisions
relating to insurance business.
Other operating income from insurance business is primarily the result of premium income (€ 427 million
(€ 417 million)) and earnings from reinsurance contracts (€ 83 million (€ 50 million)).
Earnings from other business includes earnings from the disposal of receivables (€ 84 million (€ 54 million)), earnings
from the redemption of debt securities (€ 41 million (€ 2 million)), earnings from the chartering of ships relating to
restructuring commitments in lending business (€ 35 million (€ 42 million)), rental income from investment property
(€ 11 million (€ 10 million)), reimbursements of costs (€ 10 million (€ 11 million)) and earnings from the disposal of
property and equipment (€ 0 million (€ 25 million)).
Other operating expenses from insurance business mainly comprise indemnity expenses (€ 284 million (€ 258
million)) and expenses from reinsurance business (€ 50 million (€ 49 million)).
Expenses from other business essentially comprise expenses from the redemption of debt securities (€ 47 million
(€ 38 million)), expenses from the disposal of other liabilities (€ 32 million (€ 0 million)), expenses to generate charter
income from ships (€ 27 million (€ 23 million)), expenses from other taxes (€ 14 million (€ 3 million)), expenses
from the transfer of losses (€ 8 million (€ 7 million) and expenses from the disposal of receivables (€ 5 million
(€ 99 million)). The expenses from other business also include an amount of € 37 million (€ 37 million) provided for
the bank levy set by the Restructuring Fund Act (Restrukturierungsfonds-Verordnung).
The expenses from other business also include unscheduled depreciation in the amount of € 0 million (€ 44 million).
The previous year’s figure was the result of a fall in the market value of ships due to the crisis in the shipping market.
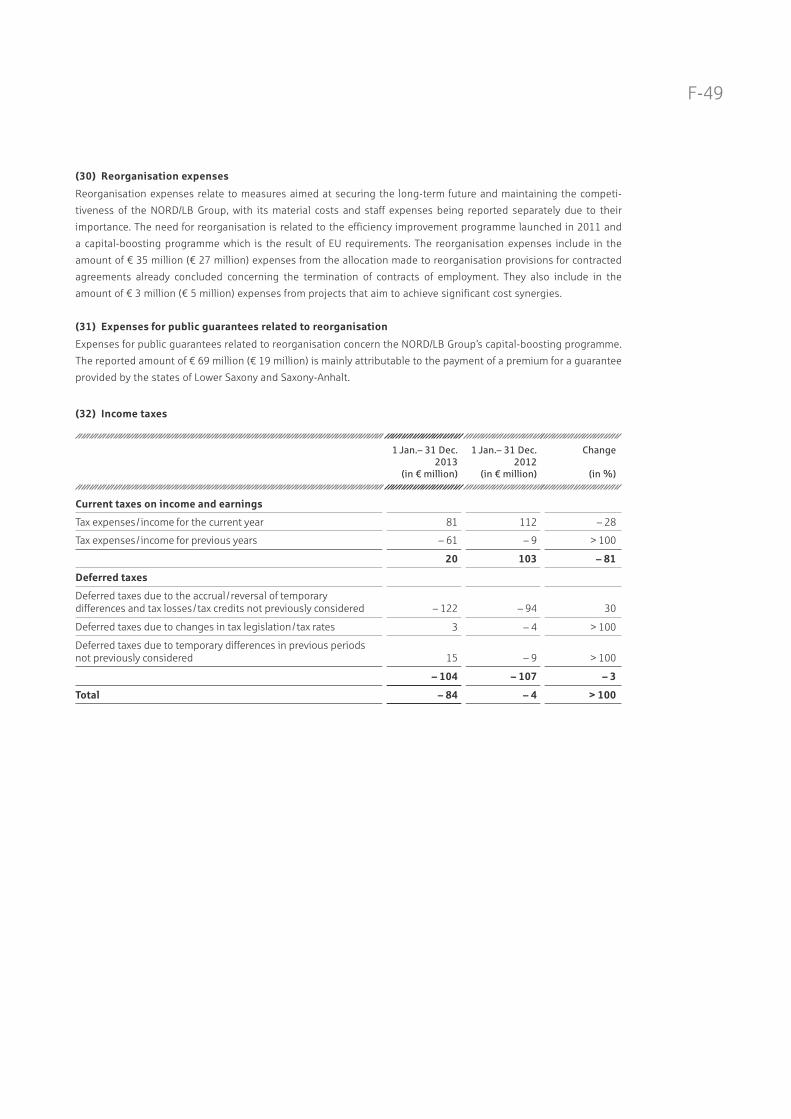
F-49
(30) Reorganisation expenses
Reorganisation expenses relate to measures aimed at securing the long-term future and maintaining the competi-
tiveness of the NORD/LB Group, with its material costs and staff expenses being reported separately due to their
importance. The need for reorganisation is related to the efficiency improvement programme launched in 2011 and
a capital-boosting programme which is the result of EU requirements. The reorganisation expenses include in the
amount of € 35 million (€ 27 million) expenses from the allocation made to reorganisation provisions for contracted
agreements already concluded concerning the termination of contracts of employment. They also include in the
amount of € 3 million (€ 5 million) expenses from projects that aim to achieve significant cost synergies.
(31) Expenses for public guarantees related to reorganisation
Expenses for public guarantees related to reorganisation concern the NORD/LB Group’s capital-boosting programme.
The reported amount of € 69 million (€ 19 million) is mainly attributable to the payment of a premium for a guarantee
provided by the states of Lower Saxony and Saxony-Anhalt.
(32) Income taxes
1 Jan.– 31 Dec.
2013
(in € million)
1 Jan.– 31 Dec.
2012
(in € million)
Change
(in %)
Current taxes on income and earnings
Tax expenses / income for the current year 81 112 – 28
Tax expenses / income for previous years – 61 – 9 > 100
20 103 – 81
Deferred taxes
Deferred taxes due to the accrual / reversal of temporary differences and tax losses / tax credits not previously considered – 122 – 94 30
Deferred taxes due to changes in tax legislation / tax rates 3 – 4 > 100
Deferred taxes due to temporary differences in previous periods not previously considered 15 – 9 > 100
– 104 – 107 – 3
Total – 84 – 4 > 100

F-50
The current tax expenses for the current financial year are reduced by € 25 million (€ 36 million) due to the utilisation
of tax losses previously not considered. Deferred taxes include earnings from tax losses previously not considered, tax
credits and temporary differences of € 90 million (€ 51 million).
The following tax reconciliation statement shows an analysis of the difference between the expected income taxes
which would result from applying the German income tax rate to earnings before tax in accordance with IFRS and the
income taxes actually reported.
(in € million)
1 Jan.– 31 Dec.
2013
1 Jan.– 31 Dec.
2012
IFRS earnings before taxes 161 78
Anticipated income tax expenditure 51 25
Effects of reconciliation:
Effects of differing tax rates – 7 – 2
Taxes from previous years reported in the reporting period – 46 – 18
Effects of changes in tax rates 3 – 2
Non-creditable income taxes 1 2
Non-deductible operational expenditure 22 47
Effects of tax-free earnings – 37 – 27
Effect of permanent accounting-related effects – 2 – 6
Effects of write-ups / write-downs / recognition adjustments – 82 – 44
Other effects 13 21
Reported income tax expenses – 84 – 4
Anticipated income tax expenditure in the tax reconciliation statement is calculated on the basis of the corporation
tax rate of 15 per cent plus a solidarity surcharge of 5.5 per cent and the average trade tax rate of approximately
15.6 per cent, as valid in Germany in 2013. The income tax rate for Germany is therefore 31.5 per cent (31.5 per cent).
The deferred taxes of the Group entities in Germany are measured using the tax rate applicable as at or the future tax
rate applicable as at the balance sheet date of 31.5 per cent (31.5 per cent).
Effects resulting from deviating tax rates are caused by differing tax rates in each country. The effects of write-
ups / write-downs / recognition adjustments also include effects from the subsequent increase or decrease in the
recognition of losses carried forward.

F-51
Notes to the Statement of Comprehensive Income
Income tax effects fall upon the individual components of other comprehensive income as follows:
(in € million)
1 Jan.–
31 Dec. 2013
Amount
before taxes
1 Jan.–
31 Dec. 2013
Income tax
effect
1 Jan.–
31 Dec. 2013
Amount
after taxes
1 Jan.–
31 Dec. 2012
Amount
before taxes
1 Jan.–
31 Dec. 2012
Income tax
effect
1 Jan.–
31 Dec. 2012
Amount
after taxes
Revaluation of the net liability from defined benefit pension plans 73 – 23 50 – 500 174 – 326
Changes in value for investments accounted for using the equity method recognised directly in equity – 27 – – 27 40 – 40
Increase/decrease from available for sale (AfS) financial instruments 345 – 82 263 846 – 305 541
Translation differences of foreign business units – 36 – – 36 – 2 – – 2
Other 355 – 105 250 384 – 131 253
Notes to the Balance Sheet
(33) Cash reserve
31 Dec. 2013
(in € million)
31 Dec. 2012
(in € million)
Change
(in %)
Cash on hand 146 214 – 32
Balances with central banks 1 165 451 > 100
Total 1 311 665 97
Of the balances with central banks, € 775 million (€ 103 million) are credit balances with Deutsche Bundesbank.
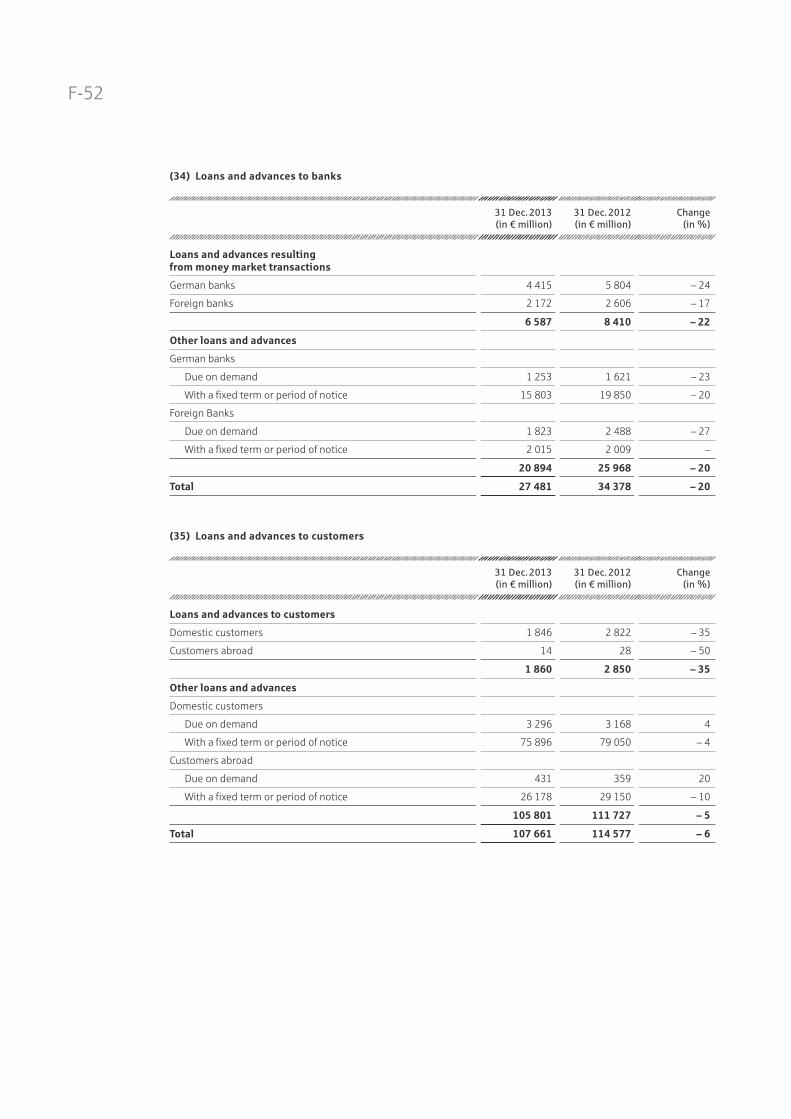
F-52
(34) Loans and advances to banks
31 Dec. 2013
(in € million)
31 Dec. 2012
(in € million)
Change
(in %)
Loans and advances resulting from money market transactions
German banks 4 415 5 804 – 24
Foreign banks 2 172 2 606 – 17
6 587 8 410 – 22
Other loans and advances
German banks
Due on demand 1 253 1 621 – 23
With a fixed term or period of notice 15 803 19 850 – 20
Foreign Banks
Due on demand 1 823 2 488 – 27
With a fixed term or period of notice 2 015 2 009 –
20 894 25 968 – 20
Total 27 481 34 378 – 20
(35) Loans and advances to customers
31 Dec. 2013
(in € million)
31 Dec. 2012
(in € million)
Change
(in %)
Loans and advances to customers
Domestic customers 1 846 2 822 – 35
Customers abroad 14 28 – 50
1 860 2 850 – 35
Other loans and advances
Domestic customers
Due on demand 3 296 3 168 4
With a fixed term or period of notice 75 896 79 050 – 4
Customers abroad
Due on demand 431 359 20
With a fixed term or period of notice 26 178 29 150 – 10
105 801 111 727 – 5
Total 107 661 114 577 – 6

F-53
(36) Risk provisioning
31 Dec. 2013
(in € million)
31 Dec. 2012
(in € million)
Change
(in %)
Specific valuation allowance
Domestic customers 1 422 1 163 22
Customers abroad 334 330 1
1 756 1 493 18
Lumpsum specific loan loss provisions
Domestic customers 14 19 – 26
14 19 – 26
General loan loss provisions
German banks 1 2 – 50
Foreign banks 2 1 100
Domestic customers 382 383 –
Customers abroad 93 51 82
478 437 9
Total 2 248 1 949 15
Risk provisioning recognised on the asset side and loan loss provisions developed as follows:
(in € million)
Specific
valuation
allowances
Lumpsum
specific loan
loss provisions
General loan
loss provisions
Loan loss
provisions
Total
2013 2012 2013 2012 2013 2012 2013 2012 2013 2012
1 January 1 493 1 159 19 28 437 580 136 113 2 085 1 880
Allocations 1 030 939 5 5 80 44 54 98 1 169 1 086
Reversals 336 299 10 13 25 175 65 69 436 556
Utilisation 343 250 – 1 – – – – 343 251
Unwinding – 77 – 63 – – – – – – 1 – 77 – 64
Effects of changes of foreign exchange rates and other changes – 11 7 – – – 14 – 12 – 1 – 5 – 26 – 10
31 December 1 756 1 493 14 19 478 437 124 136 2 372 2 085
(37) Balancing items for hedged financial instruments
This item includes the fair value adjustments to assets attributable to the hedged risk, for which there is a fair value
hedge portfolio.
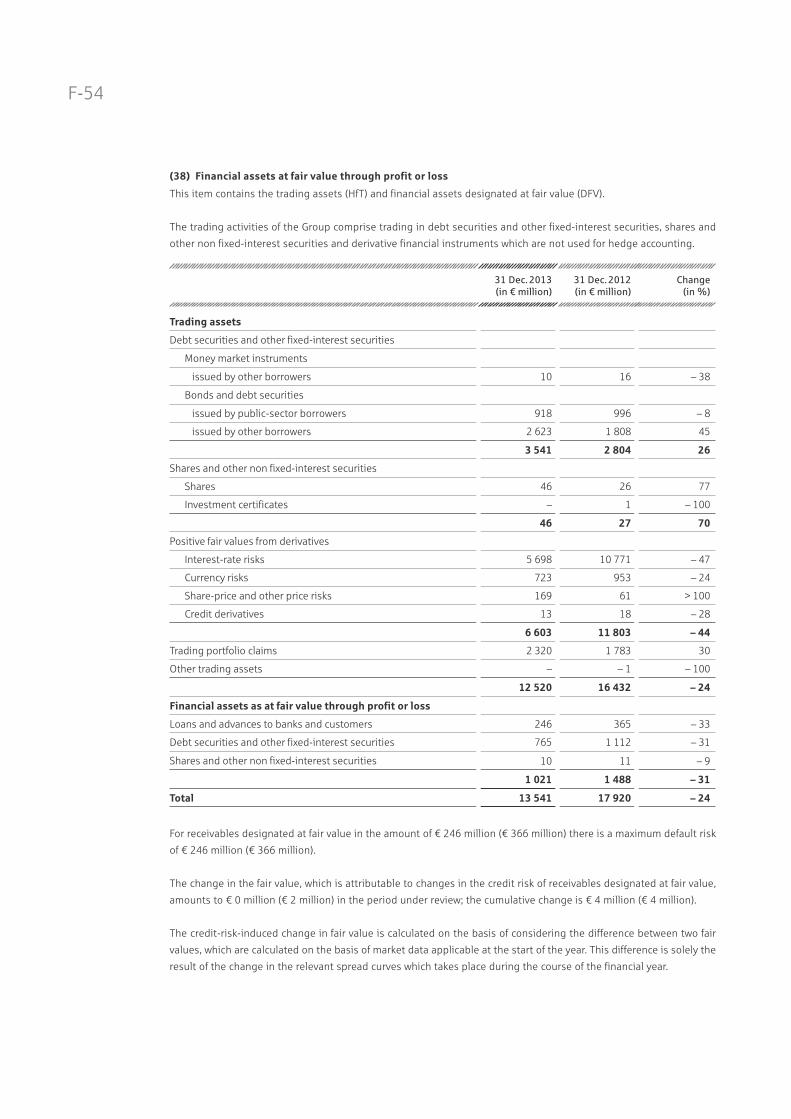
F-54
(38) Financial assets at fair value through profit or loss
This item contains the trading assets (HfT) and financial assets designated at fair value (DFV).
The trading activities of the Group comprise trading in debt securities and other fixed-interest securities, shares and
other non fixed-interest securities and derivative financial instruments which are not used for hedge accounting.
31 Dec. 2013
(in € million)
31 Dec. 2012
(in € million)
Change
(in %)
Trading assets
Debt securities and other fixed-interest securities
Money market instruments
issued by other borrowers 10 16 – 38
Bonds and debt securities
issued by public-sector borrowers 918 996 – 8
issued by other borrowers 2 623 1 808 45
3 541 2 804 26
Shares and other non fixed-interest securities
Shares 46 26 77
Investment certificates – 1 – 100
46 27 70
Positive fair values from derivatives
Interest-rate risks 5 698 10 771 – 47
Currency risks 723 953 – 24
Share-price and other price risks 169 61 > 100
Credit derivatives 13 18 – 28
6 603 11 803 – 44
Trading portfolio claims 2 320 1 783 30
Other trading assets – – 1 – 100
12 520 16 432 – 24
Financial assets as at fair value through profit or loss
Loans and advances to banks and customers 246 365 – 33
Debt securities and other fixed-interest securities 765 1 112 – 31
Shares and other non fixed-interest securities 10 11 – 9
1 021 1 488 – 31
Total 13 541 17 920 – 24
For receivables designated at fair value in the amount of € 246 million (€ 366 million) there is a maximum default risk
of € 246 million (€ 366 million).
The change in the fair value, which is attributable to changes in the credit risk of receivables designated at fair value,
amounts to € 0 million (€ 2 million) in the period under review; the cumulative change is € 4 million (€ 4 million).
The credit-risk-induced change in fair value is calculated on the basis of considering the difference between two fair
values, which are calculated on the basis of market data applicable at the start of the year. This difference is solely the
result of the change in the relevant spread curves which takes place during the course of the financial year.
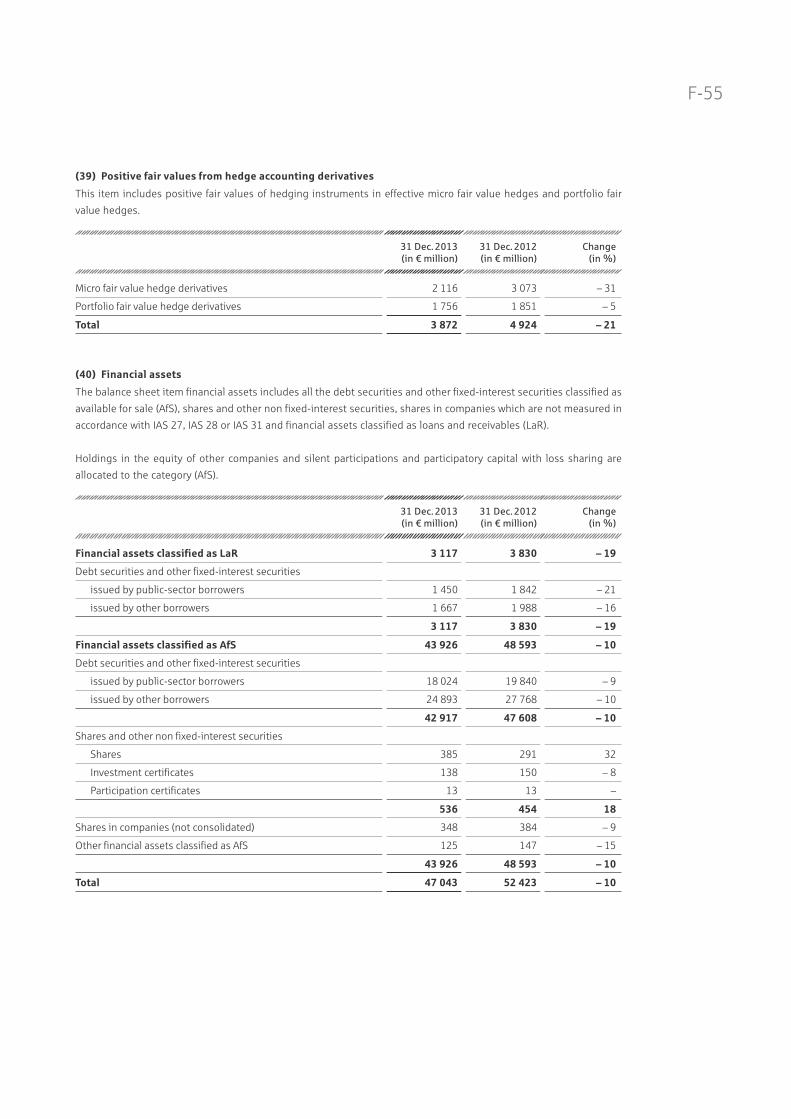
F-55
(39) Positive fair values from hedge accounting derivatives
This item includes positive fair values of hedging instruments in effective micro fair value hedges and portfolio fair
value hedges.
31 Dec. 2013
(in € million)
31 Dec. 2012
(in € million)
Change
(in %)
Micro fair value hedge derivatives 2 116 3 073 – 31
Portfolio fair value hedge derivatives 1 756 1 851 – 5
Total 3 872 4 924 – 21
(40) Financial assets
The balance sheet item financial assets includes all the debt securities and other fixed-interest securities classified as
available for sale (AfS), shares and other non fixed-interest securities, shares in companies which are not measured in
accordance with IAS 27, IAS 28 or IAS 31 and financial assets classified as loans and receivables (LaR).
Holdings in the equity of other companies and silent participations and participatory capital with loss sharing are
allocated to the category (AfS).
31 Dec. 2013
(in € million)
31 Dec. 2012
(in € million)
Change
(in %)
Financial assets classified as LaR 3 117 3 830 – 19
Debt securities and other fixed-interest securities
issued by public-sector borrowers 1 450 1 842 – 21
issued by other borrowers 1 667 1 988 – 16
3 117 3 830 – 19
Financial assets classified as AfS 43 926 48 593 – 10
Debt securities and other fixed-interest securities
issued by public-sector borrowers 18 024 19 840 – 9
issued by other borrowers 24 893 27 768 – 10
42 917 47 608 – 10
Shares and other non fixed-interest securities
Shares 385 291 32
Investment certificates 138 150 – 8
Participation certificates 13 13 –
536 454 18
Shares in companies (not consolidated) 348 384 – 9
Other financial assets classified as AfS 125 147 – 15
43 926 48 593 – 10
Total 47 043 52 423 – 10

F-56
(41) Investments accounted for using the equity method
The shares in joint ventures in terms of IAS 31 and associated companies in terms of IAS 28 accounted for using the
equity method are broken down as follows:
31 Dec.2013
(in € million)
31 Dec. 2012
(in € million)
Change
(in %)
Joint ventures
Financial institutions 26 27 – 4
Affiliated companies
Banks 144 161 – 11
Other entities 136 130 5
280 291 – 4
Total 306 318 – 4
The development of investments accounted for using the equity method is as follows:
(in € million)
Joint ventures Affiliated
companies
Total
1 January 2012 26 361 387
Additions 3 74 77
Disposals 2 87 89
Depreciations – 57 57
31 December 2012 27 291 318
Additions 2 38 – 40
Disposals 2 44 46
Depreciations – 6 6
31 December 2013 27 279 306
The share of profits / losses for joint ventures and associated companies accounted for using the equity method are
reported under additions and disposals, while impairments are reported under deprecation. Dividends received are
reported under disposals.
Investments accounted for using the equity method amounted to € 306 million (€ 318 million), a fall of € 12 million
compared to the previous year. The development in the financial year 2013 is the result of the share
of profits / losses in the amount of € 33 million (€ – 14 million), changes in equity in the amount of € 27 million
(€ 40 million) and distributions received in the amount of € 18 million (€ 22 million) for joint ventures and associated
companies accounted for using the equity method and reported under additions and disposals.
In the financial year unscheduled depreciation was deducted from the equity value of LBS in the amount of € 5 million
and NORD KB Beteiligungsgesellschaft mbH in the amount of € 1 million.

F-57
The table below summarises the financial information of joint ventures and associated companies accounted for
using the equity method. The values shown represent the proportionate share of the capital held by the NORD/LB
Group in the respective companies.
(in € million)
Joint
ventures
31 Dec. 2013
Joint
ventures
31 Dec. 2012
Affiliated
companies
31 Dec. 2013
Affiliated
companies
31 Dec. 2012
Short-term assets 50 70 832 827
Long-term assets 29 25 3 186 3 320
Short-term liabilities 34 51 694 563
Long-term liabilities 18 18 2 982 3 209
Total income 27 27 568 535
Total expenses 25 25 536 506
Contingent liabilities 53 110 42 53
(42) Property and equipment
31 Dec.2013
(in € million)
31 Dec. 2012
(in € million)
Change
(in %)
Land and buildings 343 353 – 3
Operating and office equipment 59 74 – 20
Ships 188 200 – 6
Other property and equipment 11 8 38
Total 601 635 – 5
The development of property and equipment is shown under Note (43) Investment Property.
(43) Investment property
The profit / loss from investment property is summarised as follows:
(in € million)
1 Jan.– 31 Dec.
2013
1 Jan.– 31 Dec.
2012
Rental income 11 10
Direct operating expenses 3 3

F-58
The development of cost and accumulated depreciation for property and equipment and investment property is
shown as follows:
(in € million)
Land and
buildings
Operating
and office
equipment
Ship Other
property
and
equipment
Total Investment
property
Cost as at 1 January 2012 682 303 270 4 1 259 110
Additions 35 16 – 5 56 22
Disposals 4 17 – – 21 22
Transfers – – – – – – 2
Changes from foreign exchange rates – – – 2 – – 2 –
Totals 31 December 2012 713 302 268 9 1 292 108
Accumulated depreciationas at 1 January 2012 337 221 12 1 571 17
Depreciations 13 20 12 – 45 2
Impairments (non-scheduled) – – 44 – 44 –
Additions 10 – – – 10 –
Disposals – 13 – – 13 5
Totals 31 December 2012 360 228 68 1 657 14
Closing balance as at 31 December 2012 353 74 200 8 635 94
Cost as at 1 January 2013 713 302 268 9 1 292 108
Additions 35 11 – 3 49 24
Disposals 63 47 – – 110 18
Changes from foreign exchange rates – – 1 – 4 – – 5 –
Totals 31 December 2013 685 265 264 12 1 226 114
Accumulated depreciationas at 1 January 2013 360 228 68 1 657 14
Depreciations 13 17 9 – 39 2
Impairments (non-scheduled) – 6 – – 6 –
Disposals 31 45 – – 76 3
Changes from foreign exchange rates – – – 1 – – 1 –
Totals 31 December 2013 342 206 76 1 625 13
Closing balance as at 31 December 2013 343 59 188 11 601 101
The additions to investment property are all acquisitions.

F-59
(44) Intangible assets
31 Dec.2013
(in € million)
31 Dec. 2012
(in € million)
Change
(in %)
Software
Purchased 20 21 – 5
Internally developed 64 91 – 30
84 112 – 25
Intangible assets under development 39 18 > 100
Other intangible assets 13 12 8
Total 136 142 – 4
Intangible assets under development refer primarily to internally developed software. Fully amortised software is still
in use.
Expenses for research and development in the amount of € 83 million (€ 93 million) have been incurred. The research
expenditure on internally developed software which is not eligible for capitalisation totals € 76 million (€ 83 million).
The NORD/LB Group has intangible assets with an indefinite useful life in the amount of € 7 million (€ 7 million).
These are accounted for entirely in other intangible assets acquired by payment.
The NORD/LB Group’s significant intangible assets are shown in the table below:
Carrying amount
(in € million)
Remaining depreciation period
(in years)
31 Dec. 2013 31 Dec. 2012 31 Dec. 2013 31 Dec. 2012
Migration of IT applications 38 52 3 4
Internally developed software 11 12 13 14
Brand name 5 5 Unlimited Unlimited

F-60
(45) Income tax assets
31 Dec. 2013
(in € million)
31 Dec. 2012
(in € million)
Change
(in %)
Current income tax assets 69 50 38
Deferred tax assets 741 727 2
Total 810 777 4
Deferred tax assets reflect potential relief on income taxes from temporary differences in the values of assets and
liabilities between the IFRS consolidated balance sheet and tax values in accordance with the tax regulations of the
Group companies. Deferred tax assets which were recognised in other comprehensive income totalled € 217 million
as at 31 December 2013 (€ 372 million).
The development of intangible assets is as follows:
(in € million)
Software
Purchased
Software
Internally
generated
Other
Purchased
Other
Internally
generated
Total
Cost as at 1 January 2012 121 231 17 18 387
Additions 7 6 – 21 34
Disposals 1 – – – 1
Transfers 11 – – – 11 –
Total 31 December 2012 138 237 17 28 420
Accumulated depreciationas at 1 January 2012 106 113 5 10 234
Depreciations 9 33 – – 42
Impairments (non-scheduled) 3 – – – 3
Disposals 1 – – – 1
Total 31 December 2012 117 146 5 10 278
Closing balance as at 31 December 2012 21 91 12 18 142
Cost as at 1 January 2013 138 237 17 28 420
Additions 5 2 1 23 31
Disposals 11 – 10 – 21
Transfers 2 – 10 – 12 –
Total 31 December 2013 134 239 18 39 430
Accumulated depreciationas at 1 January 2013 117 146 5 10 278
Depreciations 8 29 – – 37
Transfers – – 10 – 10 –
Disposals 11 – 10 – 21
Total 31 December 2013 114 175 5 – 294
Closing balance as at 31 December 2013 20 64 13 39 136

F-61
Deferred income tax assets were established in respect of the following balance sheet items and with tax losses not
yet utilised:
31 Dec.2013
(in € million)
31 Dec. 2012
(in € million)
Change
(in %)
Assets
Loans and advances to banks 13 19 – 32
Risk provisioning 132 128 3
Financial assets at fair value through profit or loss 328 514 – 36
Financial assets 277 535 – 48
Property and equipment 64 42 52
Other assets 221 73 > 100
Liabilities
Liabilities to customers 375 652 – 42
Securitsed liabilities 109 180 – 39
Financial liabilities at fair value through profit or loss 282 455 – 38
Negative fair values from hedge accounting derivatives 864 1 407 – 39
Provisions 368 377 – 2
Other liabilities 77 113 – 32
Tax losses carried forward 69 18 > 100
Total 3 179 4 513 – 30
Net 2 438 3 786 – 36
Total 741 727 2
In addition to deferred taxes recognised in the income statement, deferred income tax assets also comprise financial
assets of € 198 million (€ 332 million) and provisions of € 19 million (€ 40 million) recognised in other comprehensive
income.
No deferred taxes were recognised on losses carried forward to the amount of € 1 million (€ 7 million ) for corporation
tax and trade tax in the amount of € 1 million (€ 7 million) due to a limited planning horizon and the resulting
insufficient likelihood of their utilisation by 31 December 2013. There is no time limit on the utilisation of existing tax
losses carried forward.
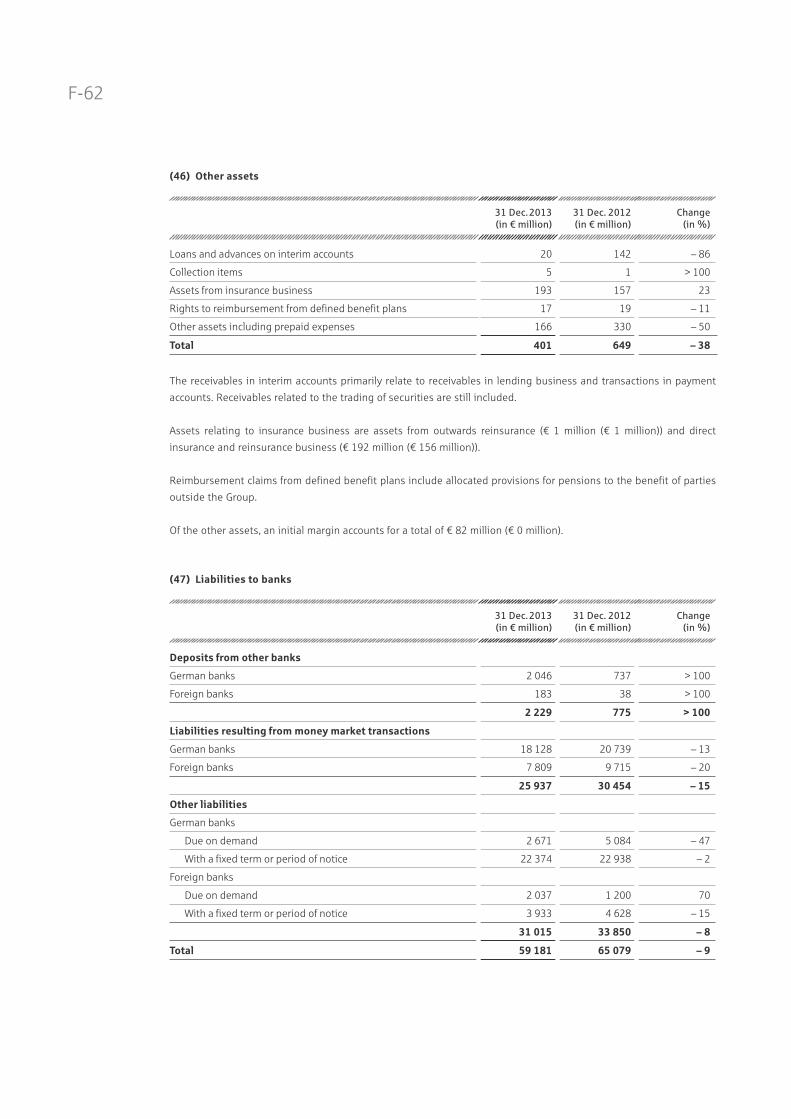
F-62
(46) Other assets
31 Dec.2013
(in € million)
31 Dec. 2012
(in € million)
Change
(in %)
Loans and advances on interim accounts 20 142 – 86
Collection items 5 1 > 100
Assets from insurance business 193 157 23
Rights to reimbursement from defined benefit plans 17 19 – 11
Other assets including prepaid expenses 166 330 – 50
Total 401 649 – 38
The receivables in interim accounts primarily relate to receivables in lending business and transactions in payment
accounts. Receivables related to the trading of securities are still included.
Assets relating to insurance business are assets from outwards reinsurance (€ 1 million (€ 1 million)) and direct
insurance and reinsurance business (€ 192 million (€ 156 million)).
Reimbursement claims from defined benefit plans include allocated provisions for pensions to the benefit of parties
outside the Group.
Of the other assets, an initial margin accounts for a total of € 82 million (€ 0 million).
(47) Liabilities to banks
31 Dec.2013
(in € million)
31 Dec. 2012
(in € million)
Change
(in %)
Deposits from other banks
German banks 2 046 737 > 100
Foreign banks 183 38 > 100
2 229 775 > 100
Liabilities resulting from money market transactions
German banks 18 128 20 739 – 13
Foreign banks 7 809 9 715 – 20
25 937 30 454 – 15
Other liabilities
German banks
Due on demand 2 671 5 084 – 47
With a fixed term or period of notice 22 374 22 938 – 2
Foreign banks
Due on demand 2 037 1 200 70
With a fixed term or period of notice 3 933 4 628 – 15
31 015 33 850 – 8
Total 59 181 65 079 – 9

F-63
(48) Liabilities to customers
31 Dec.2013
(in € million)
31 Dec. 2012
(in € million)
Change
(in %)
Savings deposits
With an agreed notice period of three months
Domestic customers 1 558 911 71
Customers abroad 18 16 13
With an agreed notice period of more than three months
Domestic customers 343 407 – 16
Customers abroad 2 2 –
1 921 1 336 44
Liabilities resulting from money market transactions
Domestic customers 8 164 7 275 12
Customers abroad 2 172 1 860 17
10 336 9 135 13
Other liabilities
Domestic costumers
Due on demand 11 738 11 708 –
With a fixed term or period of notice 29 311 31 844 – 8
Customers abroad
Due on demand 692 1 018 – 32
With a fixed term or period of notice 863 910 – 5
42 604 45 480 – 6
Total 54 861 55 951 – 2
(49) Securitised liabilities
31 Dec.2013
(in € million)
31 Dec. 2012
(in € million)
Change
(in %)
Issued debt securities
Pfandbriefe 8 947 9 732 – 8
Municipal debentures 13 417 13 345 1
Other debt securities 25 730 35 249 – 27
48 094 58 326 – 18
Money market instruments
Commercial paper 1 790 1 651 8
Certificates of deposit 344 240 43
Other money market instruments – 402 – 100
2 134 2 293 – 7
Total 50 228 60 619 – 17
Repurchased debt securities issued by the bank itself have been directly deducted from securitised liabilities in the
amount of € 6,984 million (€ 7,962 million).

F-64
(50) Balancing items for hedged financial instruments
This item includes the fair value adjustments to financial liabilities in portfolio fair value hedges for transactions
classified as other liabilities (OL); these fair value adjustments are attributable to the hedged risk.
(51) Financial liabilities at fair value through profit or loss
This item shows trading liabilities (HfT) and financial liabilities designated at fair value (DFV).
Trading liabilities comprise negative fair values resulting from derivative financial instruments which are not used in
hedge accounting and delivery obligations resulting from short sales of securities.
The category financial liabilities designated at fair value includes liabilities to banks and customers, securitised
liabilities and subordinated capital.
31 Dec.2013
(in € million)
31 Dec. 2012
(in € million)
Change
(in %)
Trading liabilities
Negative fair values from derivatives relating to
interest-rate risks 5 666 10 105 – 44
currency risks 443 820 – 46
share-price and other price risks 3 27 – 89
credit derivatives 66 169 – 61
6 178 11 121 – 44
Delivery obligations from short-sales 110 214 – 49
6 288 11 335 – 45
Financial liabilities designated at fair value
Liabilities to banks and customers 5 680 5 920 – 4
Securitised liabilities 3 138 3 443 – 9
Subordinated capital 25 26 – 4
8 843 9 389 – 6
Total 15 131 20 724 – 27
The change in the fair value of liabilities designated at fair value is the result of changes in the credit risk and amounts
to € – 24 million (€ – 200 million) in the period under review; the cumulative change is € – 73 million (€ – 52 million).
The credit risk induced change in fair value is calculated on the basis of difference consideration. The amount stated
is the result of the difference between the fair value determined on the balance sheet date on the basis of current
market data as well as the current NORD/LB spread curves and the fair values calculated with the help of current
market data and the NORD/LB spread curves used in previous reporting periods.
The book value of liabilities designated at fair value as at 31 December 2013 is € 466 million higher (€ 883 million
higher) than the corresponding repayment amount. The difference essentially comprises compounding effects from
zero bond issues and is the difference between the discounted payment typical for zero bonds and their repayment at
nominal value.

F-65
(52) Negative fair values from hedge accounting derivatives
This item includes negative fair values of hedge instruments in effective micro fair value hedge relationships and
portfolio fair value hedges.
31 Dec.2013
(in € million)
31 Dec. 2012
(in € million)
Change
(in %)
Micro fair value hedge derivatives 2 498 3 829 – 35
Portfolio fair value hedge derivatives 846 1 079 – 22
Total 3 344 4 908 – 32
(53) Provisions
Provisions are broken down as follows:
31 Dec.2013
(in € million)
31 Dec. 2012
(in € million)
Change
(in %)
Provisions for pensions and other obligations 1 955 1 975 – 1
Other provisions
Provisions in lending business 124 136 – 9
Provisions for reorganisation measures 11 18 – 39
Provisions for contingent losses 26 4 > 100
Provisions for uncertain liabilities 244 182 34
Provisions for insurance business 1 943 1 822 7
2 348 2 162 9
Total 4 303 4 137 4
For risks from insurance business, provisions were made on the basis of the best possible estimates of future
expenses. Due to the low level of insurance business in the NORD/LB Group, the uncertainty concerning the
amount or due date of these outflows does not have a significant impact on the consolidated financial statements
of NORD/LB.
Pensions and similar obligations
The net liability from a defined benefit plan is broken down as follows:
31 Dec.2013
(in € million)
31 Dec. 2012
(in € million)
Change
(in %)
Present value of defined benefit obligations 2 021 2 040 – 1
Less fair value of plan assets – 66 – 65 2
Negative balance (net indebtness) 1 955 1 975 – 1
In the NORD/LB Group there are both defined benefit pension obligations and on a small scale defined contribution
pension obligations.

F-66
Description of the pension plans
The NORD/LB Groups company pensions are based on several retirement benefit systems. On the one hand employ-
ees acquire an entitlement to a pension through a defined contribution made by the Group to an external pension
fund (defined contribution plan). The pension entitlements are based on annual benefit components, the amount of
which depend on the individual pensionable annual salary. In this case contributions are reported as current expenses
on application of IAS 19 financial reporting regulations for defined contribution plans. No pension provisions need
to be made.
Employees also acquire entitlements to pensions with defined benefits, dependent on factors such as anticipated
wage and salary increases, age, length of service and a forecast pension trend (defined benefit plan). These mainly
concern various pension modules, with benefits for reduction in earnings capacity and dependent’s pensions also
being granted in addition to a retirement pension, depending on the occurrence of the insured event. There are also
entitlements to allowance payments.
Different occupational pension schemes are in place in the NORD/LB Group, with commitments based on collective
bargaining employment agreements or on individual contractual commitments. Significant occupational pension
schemes in this case are the total benefit commitment according, the benefit ordinance from 1973 and the benefit
ordinance from 2000. The accounting regulations according to IAS 19 for defined benefit plans are applied for these
retirement benefit schemes.
The defined contribution pension commitment has also applied for members of the Managing Board since 1 January
2000. In addition, depending on the role of the member of the Managing Board and the number of reappointments to
the Managing Board, in addition to the benefit components acquired in instalments, further initial components
are awarded here. Members of the Managing Board who joined the company before 1 January 2000 received an
individual total benefit commitment which was in accordance with the regulations as at 31 December 1999.
Risks from defined benefit pension plans
The NORD/LB Group is exposed to various risks from defined benefit pension plans.
As a registered public institute (Anstalt öffentlichen Rechts), NORD/LB was the subject of a guarantor liability up to
and including 17 July 2001. This means that creditors, and therefore also employees, are entitled in respect of their
pension entitlements to have the amounts owed to them paid by the respective guarantors of the registered public
institute. On 17 July 2001 the guarantor liability for savings banks and landesbanks was abolished by the European
Commission. Therefore pension commitments agreed at this time are covered indefinitely by the guarantor liability.
Also covered by the guarantor liability are all pension commitments made up to 18 July 2005, provided the pension
benefit can be claimed before 31 December 2015. All pension commitments agreed since 18 July 2001 and all
commitments not covered by the transition rules are protected against insolvency by NORD/LB paying contributions
to a pension guarantee association.
Both the liabilities from defined benefit obligations and the plan assets may fluctuate over time. This might have
a negative or positive impact on the financing status. The fluctuations of defined benefit obligations result in particu-
lar from changes in financial assumptions such as interest rates as well as changes in demographic assumptions such
as a change in life expectancy. Due to the arrangement of existing pension commitments, the amount of the benefits
depends on the development of pensionable income, the earnings ceiling in the statutory pension insurance and
the social security benefit. If these parameters do not develop as assumed when the provisions were calculated,
additional finance might be necessary.

F-67
The NORD/LB Group reviews the pension payments schedule regularly (liquidity control), as well as the investment
strategy and the level of investment. The level of investment and pension payments is calculated on each due date
based on actuarial reports. Most of the amount invested is invested long term in government bonds which have at
least an AA rating are listed in an active market. An investment is also made in the same amount of the pension
payments in short-term, highly fungible other assets. The interest rate risk is largely reduced by the even rolling
nature of the investment debt instruments (government bonds). The control of liquidity risk which is due among
other things to the pension payments is described in the risk report.
The net liability of defined benefit obligations can be reconciled from the opening to the closing balance of the period
taking into account the effects of the items shown below:
(in € million)
Defined benefit
obligation
Fair value
of plan assets
Negative balance
(net indebtness)
Change
(in %)
2013 2012 2013 2012 2013 2012
Opening balance 2 040 1 498 65 61 1 975 1 437 37
Current service cost 42 27 – – 42 27 56
Interest expense 73 75 – 2 – 3 71 72 – 1
Additional accounting current service costs 1 – – – 1 – –
Effects from settlements / assignments (compensation payments) 1 – – – 1 – –
Increase / decrease resulting from changes in foreign exchanges rates – 1 2 – 1 – – 2 – 100
Benefits paid – 63 – 62 – 15 – 15 – 48 – 47 2
Employer contributions – – 14 13 – 14 – 13 8
2 093 1 540 65 62 2 028 1 478 37
Revaluation
Adjustments made on the basis of experience – 11 – – – – 11 – –
Profit / losses from the change in demographic assumptions 1 – – – 1 – –
Profit / losses from the change in financial assumptions – 62 500 – 3 – 62 497 > 100
Without interest income – – 1 – – 1 – –
Closing balance 2 021 2 040 66 65 1 955 1 975 – 1
In addition to pension obligations, the present value of defined benefit obligations includes allowance payments in
the amount of € 147 million (€ 178 million).
The defined benefit obligation is broken down as at the balance sheet date into amounts for defined benefit plans in
the amount of € 1,581 million (€ 1,609 million) which are not financed through a fund and into amounts from defined
benefit obligations in the amount of € 440 million (€ 432 million) which are either fully or partially financed through
a fund.

F-68
The fair value of plan assets is broken down as follows:
31 Dec.2013
(in € million)
31 Dec. 2012
(in € million)
Change
(in %)
Equity instruments
active market 18 17 6
Debt instruments
active market 35 39 – 10
Other assets
active market 10 6 67
inactive market 3 3 –
13 9 44
Total 66 65 2
The fair value of plan assets includes the bank’s own debt instruments in the amount of € 2 million (€ 4 million).
The table below shows the expected undiscounted defined benefit obligations broken down by time to maturity:
(in € million)
Pensions
expenses
Less than 1 year – 61
between 1 and 2 years – 64
between 2 and 3 years – 67
between 3 and 4 years – 70
between 4 and 5 years – 73
Total – 335
The duration of the defined benefit pension obligation is 15 years and is reviewed every year by an actuarial expert.
The contribution payments for plans are expected to be € 11 million (€ 10 million) in the next reporting period.
Due to the actuarial assumptions, the defined benefit obligation is subject to change. The following sensitivity
analysis shows the impact of the change in the respective assumption on the amount of the defined benefit obliga-
tion under the premise that there are no correlations and there is no change in the other assumptions.
(in € million) Increase Decline
Actuarial interest rate 311 319
Wages 180 175
Pensions 205 196
Cost increase rate for allowance payments 31 24
Mortality, invalidity, etc. 59 212

F-69
A sensitivity of – /+ 0.50 per cent was applied to the interest rate, – /+ 0.25 per cent for both the salary and pension
trend and 1 per cent for allowances. To calculate the impact on the obligation of an increase in life expectancy, the
probability of death was reduced to 90 per cent. This results in an increase in life expectancy of 0.8 to 1.2 years in the
20 to approx. 70 age range, an increase of 0.4 to 0.8 years in the approx. 70 to 90 age range and less than 0.4 years in
the above approx. 80 age range. Due to reasons of materiality, a sensitivity analysis was only conducted for Germany.
Other provisions developed as follows in the year under review:
(in € million)
Provisions
in lending
business
Provisions
for
reor gani-
sation
Provisions
for
contingent
losses
Provisions for
uncertain liabilities
Insurance
business
provisions
Total
Provisions
for
liabilities to
personnel
Other
provisions
for
uncertain
liabilities
1 January 136 18 4 78 104 1 822 2 162
Utilisation – 8 – 16 12 46 82
Reversals 65 – – 3 33 288 389
Allocations 54 1 22 104 20 455 656
Changes from foreign exchange rates – 1 – – 2 – – 1
31 December 124 11 26 165 79 1 943 2 348
Provisions for reorganisation relate to the implementation of the business model initiated in 2005.
Reported under provisions for liabilities to personnel are provisions for reorganisation measures in the amount of
€ 56 million (€ 27 million) which are a result of the efficiency improvement programmed launched in 2011 (cf. Note
(30) Restructuring expenses). Of the provisions for liabilities to personnel, provisions due to early retirement schemes
account for € 31 million (€ 27 million) and provisions for long-service awards account for € 8 million (€ 10 million).
Insurance provisions mainly contain actuarial reserves in the amount of € 1,496 million (€ 1,398 million), provisions
for known losses in the amount of € 263 million (€ 222 million) and provisions for the reimbursement of premiums in
the amount of € 121 million (€ 127 million).
The remaining provisions are mainly due in the long term.

F-70
(54) Income tax liabilities
31 Dec.2013
(in € million)
31 Dec. 2012
(in € million)
Change
(in %)
Current Income tax liabilities 116 162 – 28
Deferred tax liabilities 48 34 41
Total 164 196 – 16
Current income tax liabilities comprise payment obligations from current income tax to domestic and foreign tax
authorities.
Deferred tax liabilities reflect potential income tax liabilities from temporary differences between the values of
assets and liabilities in the IFRS consolidated balance sheet and tax values in accordance with the tax regulations
of the Group companies. Deferred tax liabilities which were recognised in other comprehensive income totalled
€ 183 million as at 31 December 2013 (€ 234 million).
Deferred tax liabilities relate to the following balance sheet items:
31 Dec.2013
(in € million)
31 Dec. 2012
(in € million)
Change
(in %)
Assets
Loans and advances to banks 31 40 – 23
Loans and advances to customers 162 269 – 40
Financial assets at fair value through profit or loss 114 158 – 28
Fair values from hedge accounting derivatives 992 1 333 – 26
Financial assets 543 898 – 40
Intangible assets 26 32 – 19
Property and equipment 29 10 > 100
Other assets 37 41 – 10
Liabilities
Securitised liabilities 5 21 – 76
Financial liabilities at fair value through profit or loss 484 936 – 48
Provisions 5 5 –
Other liabilities 58 77 – 25
Total 2 486 3 820 – 35
Net 2 438 3 786 – 36
Total 48 34 41
In addition to deferred taxes recognised in the income statement, deferred tax liabilities also comprise financial
assets of € 181 million (€ 233 million) and provisions of € 2 million (€ 1 million) recognised in other comprehensive
income.

F-71
(55) Other liabilities
31 Dec.2013
(in € million)
31 Dec. 2012
(in € million)
Change
(in %)
Liabilities resulting from outstanding invoices 35 32 9
Liabilities from premiums 1 1 –
Liabilities from short-term employee remuneration 60 56 7
Deferred income 26 39 – 33
Liabilities from payable taxes and social insurance contributions 21 22 – 5
Liabilities from interim accounts 49 152 – 68
Liabilities from insurance contracts 44 46 – 4
Other liabilities 143 160 – 11
Total 379 508 – 25
Liabilities from short-term employee remuneration comprise residual leave entitlements as well as compensation
payments and bonuses; the latter are to be paid to employees in the Group in the first half of 2014.
The liabilities in interim accounts primarily relate to liabilities in lending business, trading of securities and trans-
actions in payment accounts.
Liabilities from insurance business relate to liabilities from direct insurance and reinsurance contracts in the amount
of € 4 million (€ 8 million).
(56) Subordinated capital
31 Dec.2013
(in € million)
31 Dec. 2012
(in € million)
Change
(in %)
Subordinated liabilities 3 540 3 452 3
Participatory capital 209 224 – 7
Silent participations 964 1 157 – 17
Total 4 713 4 833 – 2
Subordinated liabilities are not paid back until the claims of all senior creditors have been satisfied. It meets
the requirements of §§10 para. 5a of the German Banking Act in the amount of € 2,786 million (€ 3,051 million) for
attribution to supplementary capital in accordance with §10 para. 2b of the German Banking Act. Interest expenses
for subordinated liabilities amount to € 149 million (€ 145 million).
Participatory capital comprises solely registered participatory capital. The participatory capital meets the require-
ments of § 10 para. 5 of the German Banking Act in the amount of € 60 million (€ 193 million) for attribution to
supplementary capital in accordance with § 10 para. 2b of the German Banking Act. Interest expenses for participatory
capital amount to € 13 million (€ 14 million).
Due to their contractual structure and their substance, silent participations constitute debt in accordance with IAS 32;
they do, however, meet requirements for recognition as core capital in the amount of € 813 million (€ 955 million)
in accordance with § 10 para. 2a clause 1 no. 10 of the German Banking Act. Interest expenses relating to silent
participations amount to € 68 million (€ 86 million).

F-72
(57) Equity
The equity is made up as follows:
31 Dec.2013
(in € million)
31 Dec. 20121)
(in € million)
Change
(in %)
Issued capital 1 607 1 607 –
Capital reserves 3 332 3 332 –
Retained earnings 2 220 2 011 10
Revaluation reserve 122 – 95 > 100
Reserve for the change on foreign exchanges rates – 6 – 3 100
Equity capital attributable to the owners of NORD/LB 7 275 6 852 6
Equity capital attributable to non-controlling interests 915 848 8
Total 8 190 7 700 6
1) Some previous year’s figures were adjusted as you can see at note (2) adjustment of figures for the previous year.
As at 31 December 2013 the following shareholdings were held in the subscribed capital of NORD/LB: the federal
state of Lower Saxony 59.13 per cent (59.13 per cent), the federal state of Saxony-Anhalt 5.57 per cent (5.57 per cent),
the Association of the Savings Banks of Lower Saxony (SVN) 26.36 per cent (26.36 per cent), the Holding Association
of the Savings Banks of Saxony-Anhalt (SBV) 5.28 per cent (5.28 per cent) and the Special Purpose Holding Associa-
tion of the Savings Banks of Mecklenburg-Western Pomerania (SZV) 3.66 per cent (3.66 per cent).
Retained earnings include retained earnings from previous reporting periods, allocations from profit less the share of
other shareholders in profit / loss, the effects of the revaluation of the net liability from defined benefit pension plans
as well as the changes in equity relating to the shares in associated companies and joint ventures accounted for
using the equity method.
The revaluation reserve item reports the effects of the measurement of available for sale (AfS) financial instruments.
The reserve for the change in foreign exchange rates includes the effects of the translation of annual reports of
foreign business units with a currency other than the euro relating to the application of the closing rate method.
In addition to the owners of the parent company NORD/LB, other shareholders have an interest in the equity of the
NORD/LB Group. These hold shares in the equity of subsidiaries and are reported as non-controlling interests in
consolidated equity.
For 2012 the dividend rate is 4.9 per cent (11.0 per cent). The dividend rate expresses ratio of dividends to owners
and non-controlling interest in the period under review to the previous year’s consolidated profit.
For 2013 there will be no dividend payment owing to the commitments made to the EU Commission. Instead it is
proposed that a portion of the profit will be allocated to retained earnings and the remainder will be carried forward
to new account.

F-73
Notes to the Cash Flow Statement
The cash flow statement shows the change in cash and cash equivalents for the reporting period as a result of cash
flows from operating, investment and financing activities.
Cash and cash equivalents are defined as the cash reserve (cash on hand and balances with central banks).
The cash from operating activities is calculated based on the consolidated profit using the indirect method. Prior to
this calculation, expenses which have no effect on cash in the accounting period are added and earnings which have
no effect on cash in the year under review is deducted. Furthermore, all cash expenses and earnings which are not
allocated to operating activities are eliminated. These payments are taken into account in cash flows from investment
or financing activities.
In accordance with IASB recommendations, payments from loans and advances to banks and customers, trading
securities, liabilities to banks and customers and from securitised liabilities are reported under cash flow from
operating activities.
Cash flow from investment activities includes payments relating to investment and security portfolios classified as
financial assets as well as cash receipts and payments relating to property and equipment and to the acquisition of
subsidiaries.
Cash flow from financing activities includes cash flows from changes in capital, interest payments on subordinated
capital and dividend payments to the guarantors of the parent company NORD/LB.
We refer to information contained in the risk report concerning liquidity risk management in the NORD/LB Group.

F-74
Other disclosures
Notes to Financial Instruments
(58) Fair value hierarchy
The fair values of financial instruments are compared with their carrying amounts in the following table.
(in € million)
31 Dec. 2013 31 Dec. 2012
Fair Value Carrying
amount
Difference Fair Value Carrying
amount
Difference
Assets
Cash reserve 1 311 1 311 – 665 665 –
Loans and advances to banks 28 216 27 481 735 35 744 34 378 1 366
Loans and advances to customers 106 454 107 661 – 1 207 115 611 114 577 1 034
Risk provisioning 1) – 2 248 – 1) – 1 949 –
Sub-total of loans and advancesto banks/customers (net after loan loss provisions) 134 670 132 894 1 776 151 355 147 006 4 349
Balancing items for financial instruments hedged in the fair value hedge portfolio 2) – 171 – 2) – 3 –
Financial assets at fair value through profit or loss 13 541 13 541 – 17 920 17 920 –
Positive fair values from hedge accounting derivatives 3 872 3 872 – 4 924 4 924 –
Financial assets not reported at fair value 2 864 3 164 – 300 3 496 3 910 – 414
Financial assets reported at fair value 43 879 43 879 – 48 513 48 513 –
Other assets not reported at fair value 17 17 – – – –
Other assets reported at fair value 25 25 – 16 16 –
Total 200 179 198 532 1 476 226 889 222 951 3 935
Liabilities
Liabilities to banks 59 836 59 181 655 66 429 65 079 1 350
Liabilities to customers 57 179 54 861 2 318 59 355 55 951 3 404
Securitised liabilities 51 116 50 228 888 61 476 60 619 857
Balancing items for financial instruments hedged in the fair value hedge portfolio 2) 351 – 2) 895 –
Financial liabilities at fair value through profit or loss 15 131 15 131 – 20 724 20 724 –
Negative fair values from hedge accounting derivatives 3 344 3 344 – 4 908 4 908 –
Other liabilities not reported at fair value 44 44 – 1 1 –
Subordinated capital 5 037 4 713 324 5 043 4 833 210
Total 191 687 187 853 4 185 217 936 213 010 5 821
1) Amounts relating to risk provisioning are shown in the corresponding fair values of loans and advances to banks and loans and advances to customers.2) Amounts relating to the assets and liabilities item “Adjustment items for financial instruments hedged in the fair value hedge portfolio”
are shown in the fair values of the respective items of hedged financial instruments.
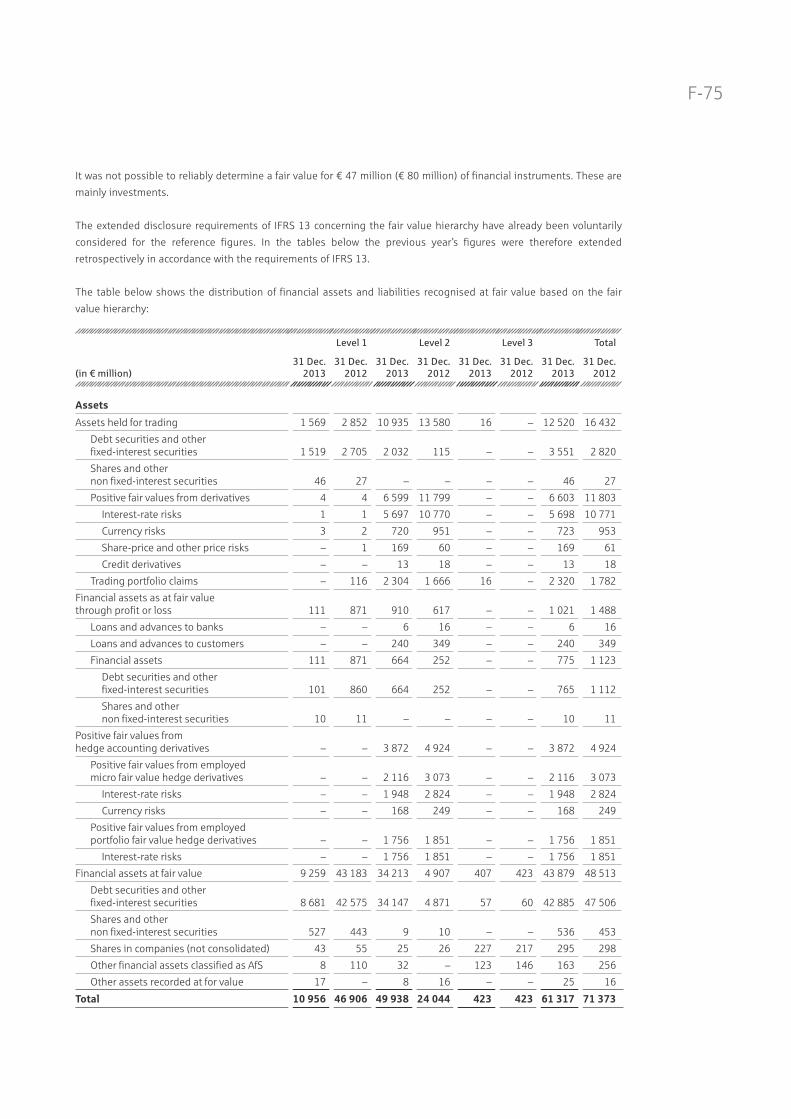
F-75
It was not possible to reliably determine a fair value for € 47 million (€ 80 million) of financial instruments. These are
mainly investments.
The extended disclosure requirements of IFRS 13 concerning the fair value hierarchy have already been voluntarily
considered for the reference figures. In the tables below the previous year’s figures were therefore extended
retrospectively in accordance with the requirements of IFRS 13.
The table below shows the distribution of financial assets and liabilities recognised at fair value based on the fair
value hierarchy:
(in € million)
Level 1 Level 2 Level 3 Total
31 Dec.
2013
31 Dec.
2012
31 Dec.
2013
31 Dec.
2012
31 Dec.
2013
31 Dec.
2012
31 Dec.
2013
31 Dec.
2012
Assets
Assets held for trading 1 569 2 852 10 935 13 580 16 – 12 520 16 432
Debt securities and other fixed-interest securities 1 519 2 705 2 032 115 – – 3 551 2 820
Shares and other non fixed-interest securities 46 27 – – – – 46 27
Positive fair values from derivatives 4 4 6 599 11 799 – – 6 603 11 803
Interest-rate risks 1 1 5 697 10 770 – – 5 698 10 771
Currency risks 3 2 720 951 – – 723 953
Share-price and other price risks – 1 169 60 – – 169 61
Credit derivatives – – 13 18 – – 13 18
Trading portfolio claims – 116 2 304 1 666 16 – 2 320 1 782
Financial assets as at fair value through profit or loss 111 871 910 617 – – 1 021 1 488
Loans and advances to banks – – 6 16 – – 6 16
Loans and advances to customers – – 240 349 – – 240 349
Financial assets 111 871 664 252 – – 775 1 123
Debt securities and other fixed-interest securities 101 860 664 252 – – 765 1 112
Shares and other non fixed-interest securities 10 11 – – – – 10 11
Positive fair values from hedge accounting derivatives – – 3 872 4 924 – – 3 872 4 924
Positive fair values from employedmicro fair value hedge derivatives – – 2 116 3 073 – – 2 116 3 073
Interest-rate risks – – 1 948 2 824 – – 1 948 2 824
Currency risks – – 168 249 – – 168 249
Positive fair values from employedportfolio fair value hedge derivatives – – 1 756 1 851 – – 1 756 1 851
Interest-rate risks – – 1 756 1 851 – – 1 756 1 851
Financial assets at fair value 9 259 43 183 34 213 4 907 407 423 43 879 48 513
Debt securities and other fixed-interest securities 8 681 42 575 34 147 4 871 57 60 42 885 47 506
Shares and other non fixed-interest securities 527 443 9 10 – – 536 453
Shares in companies (not consolidated) 43 55 25 26 227 217 295 298
Other financial assets classified as AfS 8 110 32 – 123 146 163 256
Other assets recorded at for value 17 – 8 16 – – 25 16
Total 10 956 46 906 49 938 24 044 423 423 61 317 71 373

F-76
(in € million)
Level 1 Level 2 Level 3 Total
31 Dec.
2013
31 Dec.
2012
31 Dec.
2013
31 Dec.
2012
31 Dec.
2013
31 Dec.
2012
31 Dec.
2013
31 Dec.
2012
Liabilities
Trading liabilities 41 215 6 242 11 116 5 4 6 288 11 335
Negative fair values from derivatives relating to 4 1 6 169 11 116 5 4 6 178 11 121
– interest-rate risks 2 – 5 664 10 105 – – 5 666 10 105
– currency risks – – 442 820 1 – 443 820
– share-price and other price risks 2 1 1 26 – – 3 27
– credit derivatives – – 62 165 4 4 66 169
Delivery obligations from short-salesand other trading assets 37 214 73 – – – 110 214
Financial liabilities reported at fair value 100 222 8 735 9 167 8 – 8 843 9 389
Liabilities to banks – – 590 593 – – 590 593
Liabilities to customers – – 5 090 5 327 – – 5 090 5 327
Securitised liabilities 100 222 3 030 3 221 8 – 3 138 3 443
Subordinated capital – – 25 26 – – 25 26
Negative Fair Values aus Hedge-Accounting-Derivaten – – 3 344 4 908 – – 3 344 4 908
Negative fair values from employedmicro fair value hedge derivatives – – 2 498 3 829 – – 2 498 3 829
– Interest-rate risks – – 2 268 3 351 – – 2 268 3 351
– Currency risks – – 230 478 – – 230 478
Negative fair values from employedportfolio fair value hedge derivatives – – 846 1 079 – – 846 1 079
Interest-rate risks – – 846 1 079 – – 846 1 079
Total 141 437 18 321 25 191 13 4 18 475 25 632
The trading assets and liabilities of Level 3 include among other things CDS for illiquid basic risks and CDS which
were concluded on the basis of old International Swaps and Derivatives Association (ISDA) framework agreements.
The fair value of the latter is calculated based on the indicative spreads quoted for similar CDS in accordance with the
new ISDA framework agreements. In the process security spreads of liquid bonds of reference entities are included.
As a result when establishing the fair value it is considered that, in accordance with the old ISDA agreements,
settlement is made physically in the event of a credit event, i. e. with the delivery of a bond.

F-77
The transfers within the fair value hierarchy are summarised as follows:
2013
(in € million)
from Level 1
to Level 2
from Level 1
to Level 3
from Level 2
to Level 1
from Level 2
to Level 3
from Level 3
to Level 1
from Level 3
to Level 2
Assets held for trading 239 – – 16 – –
Debt securities and other fixed-interest securities 239 – – – – –
Loans and advances to trading and other trading assets – – – 16 – –
Designated financial assets reported at fair value 444 – 12 – – –
Financial assets 444 – 12 – – –
– Debt securities and other fixed-interest securities 444 – 12 – – –
Financial assets at fair value 27 516 5 53 6 – 3
Debt securities and other fixed-interest securities 27 484 – 53 – – 2
Shares in companies (not consolidated) – 5 – 6 – 1
Other financial assets classified as AfS 32 – – – – –
Trading liabilities – – – – 3 – –
Negative fair values from derivatives relating to – – – – 3 – –
– currency risks – – – – 1 – –
– interest-rate risks – – – – 2 – –
Designated financial liabilities reported at fair value – 160 – – 53 – 5 – –
Securitised liabilities – 160 – – 53 – 5 – –

F-78
The transfers within the fair value hierarchy are summarised as follows:
2012
(in € million)
from Level 1
to Level 2
from Level 1
to Level 3
from Level 2
to Level 1
from Level 2
to Level 3
from Level 3
to Level 1
from Level 3
to Level 2
Assets held for trading 279 – – – 37 7
Debt securities and other fixed-interest securities – – – – 37 –
Positive fair values from derivatives – – – – – 7
– credit derivatives – – – – – 7
Delivery obligations from short-sales and other trading liabilities 279 – – – – –
Designated financial assets reported at fair value – – 187 – 151 257
Loans and advances to banks – – – – – 6
Financial assets – – 187 – 151 251
– Debt securities and other fixed-interest securities – – 187 – 151 251
Financial assets at fair value 300 2 1 560 – 771 1 805
Debt securities and other fixed-interest securities 300 2 1 560 – 729 1 778
Shares and other non fixed-interest securities – – – – 12 –
Shares in companies (not consolidated) – – – – – 27
Other financial assets classified as AfS – – – – 30 –
Trading liabilities – – – – – 97
Negative fair values from derivatives relating to – – – – – 97
– credit derivatives – – – – – 97
Designated financial liabilities reported at fair value – 1 350 – – – – –
Securitised liabilities – 1 350 – – – – –
For asset-side financial instruments, a level assessment takes place on an individual transaction basis. As at the
balance sheet date the transfers have been mostly from Level 1 to Level 2 compared to the previous end-of-year
reporting date. This is the result of the application with retrospective effect of 31 December 2013 of HFA 47, which
was published at the start of 2014. This specifies how financial instruments are to be classified in the various levels.
Accordingly, (mixed) prices calculated by price service agencies on the basis of reported prices are to be allocated to
Level 2. Broker quotations have to come from an “active market” in order to be allocated to Level 1. If there are only
a few broker quotations or if these involve big bid-ask spreads or price differences, it is assumed that there is no
active market.

F-79
When measuring the bank’s own structured issues (dFV), the use of market prices is reviewed as at the reporting
date. Following this review, some issues generally move between Level 1 and 2 due to a change in trading activity.
The transfer from Level 2 to Level 3 is based on a revised assessment of historical volatility following the first-time
application of IFRS 13 with effect of 1 January 2013.
The transfer date for the transfers between the individual levels is the end of the reporting period.
Financial assets and liabilities in Level 3 of the fair value hierarchy developed as follows:
(in € million)
Trading assets
Debt securities and other
fixed-interest securities
Positive fair values from
derivatives
Credit derivatives
Loans and advances
to trading and other
trading assets
2013 2012 2013 2012 2013 2012
1 January – 52 – 7 – –
Effect on the income statement 1) – – 1 – – – –
Effect on the equity capital – – – – – –
Addition from purchase or issuance – 9 – – – –
Disposal from sale – 9 – – – –
Repayment/ exercise – 14 – – – –
Addition from Level 1 and 2 – – – – 16 –
Disposal to Level 1 and 2 – 37 – 7 – –
Changes due to mergers – – – – – –
Changes in foreign exchange rates – – – – – –
31 December – – – – 16 –
Profit / losses result from measurement effects, realisation and deferred interest and are shown in the respective items in the income statement 1) – – – – – 1 –
1) The effects reported include valuation gains / losses, realised profit / loss and deferred interest; these are reported in the income statement under the items (21) Net interest income and (24) Profit / loss from financial instruments at fair value through profit or loss.
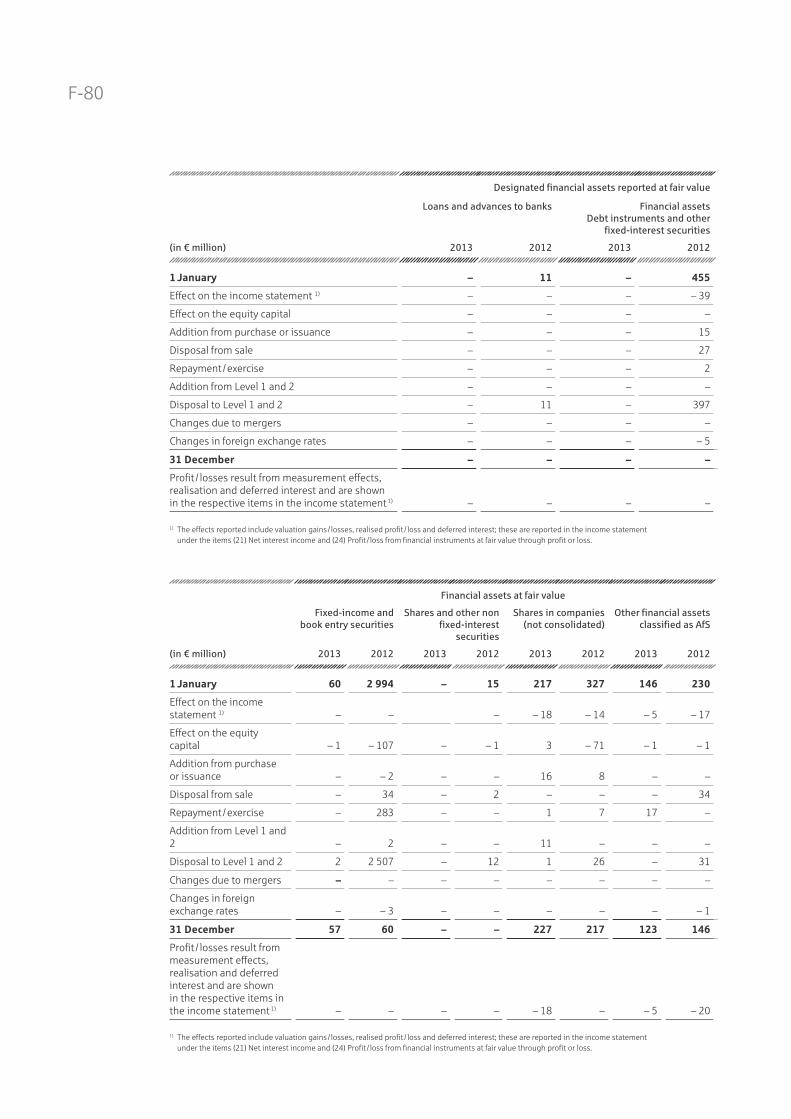
F-80
(in € million)
Financial assets at fair value
Fixed-income and
book entry securities
Shares and other non
fixed-interest
securities
Shares in companies
(not consolidated)
Other financial assets
classified as AfS
2013 2012 2013 2012 2013 2012 2013 2012
1 January 60 2 994 – 15 217 327 146 230
Effect on the income statement 1) – – – – 18 – 14 – 5 – 17
Effect on the equity capital – 1 – 107 – – 1 3 – 71 – 1 – 1
Addition from purchase or issuance – – 2 – – 16 8 – –
Disposal from sale – 34 – 2 – – – 34
Repayment / exercise – 283 – – 1 7 17 –
Addition from Level 1 and 2 – 2 – – 11 – – –
Disposal to Level 1 and 2 2 2 507 – 12 1 26 – 31
Changes due to mergers – – – – – – – –
Changes in foreign exchange rates – – 3 – – – – – – 1
31 December 57 60 – – 227 217 123 146
Profit / losses result from measurement effects, realisation and deferred interest and are shown in the respective items in the income statement 1) – – – – – 18 – – 5 – 20
1) The effects reported include valuation gains / losses, realised profit / loss and deferred interest; these are reported in the income statement under the items (21) Net interest income and (24) Profit / loss from financial instruments at fair value through profit or loss.
(in € million)
Designated financial assets reported at fair value
Loans and advances to banks Financial assets
Debt instruments and other
fixed-interest securities
2013 2012 2013 2012
1 January – 11 – 455
Effect on the income statement 1) – – – – 39
Effect on the equity capital – – – –
Addition from purchase or issuance – – – 15
Disposal from sale – – – 27
Repayment / exercise – – – 2
Addition from Level 1 and 2 – – – –
Disposal to Level 1 and 2 – 11 – 397
Changes due to mergers – – – –
Changes in foreign exchange rates – – – – 5
31 December – – – –
Profit / losses result from measurement effects, realisation and deferred interest and are shown in the respective items in the income statement 1) – – – –
1) The effects reported include valuation gains / losses, realised profit / loss and deferred interest; these are reported in the income statement under the items (21) Net interest income and (24) Profit / loss from financial instruments at fair value through profit or loss.

F-81
(in € million)
Trading liabilities
Negative fair values from
derivatives relating to
Currency risks
Negative fair values from
derivatives relating to
Credit derivatives
2013 2012 2013 2012
1 January – – 4 105
Effect on the income statement 1) – – – 3 – 2
Addition from purchase or issuance – – – –
Disposal from sale – – – –
Repayment / exercise – – – 2
Addition from Level 1 and 2 1 – 2 –
Disposal to Level 1 and 2 – – – 97
Changes due to mergers – – – –
Changes in foreign exchange rates 1 – – –
31 December 1 – 3 4
Profit / losses result from measurement effects, realisation and deferred interest and are shown in the respective items in the income statement 1) – – – – 2
1) The effects reported include valuation gains / losses, realised profit / loss and deferred interest; these are reported in the income statement under the items (21) Net interest income and (24) Profit / loss from financial instruments at fair value through profit or loss.
(in € million)
Designated financial liabilities
reported at fair value
Securitsed liabilities
2013 2012
1 January – –
Effect on the income statement 1) – –
Addition from purchase or issuance 4 –
Disposal from sale – –
Repayment / exercise – –
Addition from Level 1 and 2 5 –
Disposal to Level 1 and 2 – –
Changes due to mergers – –
Changes in foreign exchange rates – –
31 December 9 –
Profit / losses result from measurement effects, realisation and deferred interest and are shown in the respective items in the income statement 1) – –
1) The effects reported include valuation gains / losses, realised profit / loss and deferred interest; these are reported in the income statement under the items (21) Net interest income and (24) Profit / loss from financial instruments at fair value through profit or loss.

F-82
For the fair value measurement of the financial instruments in Level 3, the following significant unobservable input
data was used.
Product Fair value
31 Dec. 2013
(in € million)
Significant
non-observable input
data in the fair value
measurement
Spread of the used
input data
Weighted average
Asset Backed Securities8 ABS-Intensity-Spread
500–2500 Basispoints 1 340 Basispoints
–Weighted-
Average-Life (WAL) 0,04 – 20,08 years 8,89 years
Interest-bearing bonds 1 Intensity-Spread +/– 212 Basispoints 212 Basispoints
Silent participations 107 Credit Spread +/– 100 Basispoints +/– 100 Basispoints
Derivatives – 2CDS-Ratingshift
Factor0–5 Rating Class 2,05 Rating Class
Significant unobservable data in the fair value measurement of ABS securities are the ABS intensity spread, which is
derived from the rating and associated probability of default, and the weighted average life (WAL). Significant changes
in the input data result in a significantly higher or lower fair value. As part of the sensitivity analysis, the ABS intensity
spread and the WAL shift factor were stressed, with the rating being moved up and down a class and the WAL
increased or reduced by one year. Accordingly an imputed change in the ABS intensity spread would result in a
change in the fair values of ABS securities in Level 3 of € 1.6 million. The imputed change in the WAL shift factor
would result in a change in the fair values of ABS securities in Level 3 of € 1.6 million.
Significant unobservable data in the fair value measurement of interest-bearing securities is the intensity spread,
which is derived from the rating and associated probability of default. Significant changes in this input parameter
result in a significantly higher or lower fair value. As part of the sensitivity analysis, the intensity spread was stressed
in the measurement, with the rating being moved up and down a class. Accordingly an imputed change in the
parameter would result in a change in the fair value of the interest-bearing securities in Level 3 of € 0.02 million.
Significant unobservable data in the fair value measurement of silent participations is the credit spread. Significant
changes in this input parameter result in a significantly higher or lower fair value. As part of the sensitivity analysis,
the credit spread was stressed in the measurement by increasing or reducing it by 100 basis points. Accordingly
an imputed change in the parameter would result in a change in the fair value of all silent participations in Level 3 of
€ 6 million.
Significant unobservable input data in the fair value measurement of derivatives are the CDS rating shift factor and
historic volatilities. Details concerning the sensitivity of historic volatilities are permissibly not given, as the historic
volatilities are not calculated by the company itself, but are based on original market transactions. Significant changes
in the CDS rating shift factor result in a significantly higher or lower fair value. As part of the sensitivity analysis, the
CDS rating shift factor was stressed by being moved up and down a level. Accordingly an imputed change in the CDS
rating shift factor would result in a change in the fair values of CDS in Level 3 of € 1.5 million.
The ABS securities, interest-bearing securities and silent participations are mainly reported under financial assets,
while derivatives are reported under financial assets and liabilities at fair value through profit or loss.
For the fair value measurement of Level 3 financial instruments, there are no relevant correlations between significant
Level 3 input parameters and as a result there is no impact on the fair value.

F-83
If fair values are stated in the notes for assets and liabilities that are not measured at fair value in the balance sheet,
these are to be classified in the fair value hierarchy.
(in € million)
Level 1
31 Dec. 2013
Level 2
31 Dec. 2013
Level 3
31 Dec. 2013
Total
31 Dec. 2013
Assets
Cash reserve 1311 – – 1 311
Loans and advances to banks 755 789 26 672 28 216
Mortage loans – 47 26 73
Public-sector loans – 297 8 185 8 482
Mortage-backed loans – – 43 43
Other loans – 328 10 643 10 971
Current account and forward contracts 699 – 5 045 5 744
Other advances to banks 56 117 2 730 2 903
Loans and advances to customers 1 600 1 656 103 198 106 454
Mortage loans – 25 14 020 14 045
Public-sector loans – 1 456 33 702 35 158
Mortage-backed loans – 2 5 015 5 017
Other loans 16 173 45 960 46 149
Current account and forward contracts 118 – 4 225 4 343
Other advances to customers 1 466 – 276 1 742
Financial assets not reported at fair value 10 2 781 73 2 864
Debt securities and other fixed-interest securities 3 2 781 32 2 816
Shares in companies (not consolidated) 7 – 41 48
Investment property – 107 1 108
Other assets reported at fair value 1 – 16 17
Total 3 677 5 333 129 960 138 970

F-84
(in € million)
Level 1 Level 2 Level 3 Total
31 Dec. 2013 31 Dec. 2013 31 Dec. 2013 31 Dec. 2013
Liabilities
Liabilities to banks 325 4 393 55 118 59 836
Liabilties to customers 190 10 518 46 471 57 179
Securitsed liabilities 4 451 44 644 2 021 51 116
Issued debt securities 2 927 44 184 1 872 48 983
Money market instruments 1 524 460 149 2 133
Other liabilities not reported at fair value – – 44 44
Subordinated capital 555 2 591 1 891 5 037
Subordinated liabilities 273 2 426 1 126 3 825
Participatory capital – 86 123 209
Silent participations 282 79 634 995
Other subordinated capital – – 8 8
Total 5 521 62 146 105 545 173 212
(59) Carrying amounts by measurement category
31 Dec.2013
(in € million)
31 Dec. 2012
(in € million)
Change
(in %)
Assets
Financial assets held for trading 12 520 16 432 – 24
Financial assets reported at fair value 1 021 1 488 – 31
Available for sale assets 43 926 48 593 – 10
Loans and receivables 136 028 150 835 – 10
Total 193 495 217 348 – 11
Liabilities
Financial liabilities held for trading 6 288 11 335 – 45
Financial liabilities reported at fair value 8 843 9 389 – 6
Other liabilities 169 028 186 482 – 9
Total 184 159 207 206 – 11
Hedging instruments for hedge accounting as defined by IAS 39 and the cash reserve are not included since they are
not allocated to any measurement category.

F-85
(60) Net gains or losses by measurement category
1 Jan.– 31 Dec.
2013
(in € million)
1 Jan.– 31 Dec.
2012
(in € million)
Change
(in %)
Financial instruments held for trading – 136 517 > 100
Financial instruments reported at fair valuethrough profit or loss 219 – 640 > 100
Available for sale assets 23 – 3 > 100
Loans and receivables – 790 – 616 28
Other liabilities – 38 – 36 – 6
Total – 722 – 778 – 7
The category financial instruments held for trading relates solely to trading profit / loss, while the category financial
instruments designated at fair value through profit or loss includes the profit / loss of the fair value option. The
category available for sale assets includes the profit / loss from financial assets and the profit / loss from shares in
unconsolidated companies. The category loans and receivables comprises risk provisions, the profit / loss from LaR
financial assets and the profit / loss from disposals of receivables. The category other liabilities includes solely
earnings and expenses from the repurchase of own liabilities.
The net gains / losses of the measurement categories of financial instruments held for trading and financial
instruments designated at fair value through profit or loss include the commission income for the related trans-
actions. The hedge accounting result is not included in the gains / losses since hedge accounting is not allocated to
any of the categories.
(61) Impairments / reversals of impairment by measurement category
1 Jan.– 31. 12.
2013
(in € million)
1 Jan.– 31 Dec.
2012
(in € million)
Change
(in %)
Available for Sale Assets
Profit / loss from impairment of financial assets classified as AfS – 18 – 24 – 25
Profit / loss from shares in not consilidated companies – 25 – 13 92
– 43 – 37 16
Loans and Receivables
Profit / loss from impairment of financial assets classified as AfS – 9 3 > 100
Profit / loss from impairment of advances – 857 – 569 51
– 866 – 566 53
Total – 909 – 603 – 51

F-86
(62) Offsetting of financial assets and financial liabilities
The effects or potential effects of offsetting financial assets and liabilities are shown in the table below.
31 Dec. 2013
(in € million)
Gross
amount
before
balancing
Amount
of the
financially
balancing
Net
amount
after
balancing
Master netting arrangements
and other without financially balancing
Net
amount
Financial
instruments
Collaterals
Securities
collateral
Cash
collateral
Assets
Offsetting of current accounts 5 958 4 482 1 476 – – – 1 476
Derivatives 10 086 – 10 086 6 309 311 1 855 1 611
Securities lending and repos 3 704 – 3 704 934 2 727 2 41
Liabilities
Offsetting of current accounts 12 649 4 482 8 167 – – – 8 167
Derivatives 9 398 – 9 398 6 309 98 2 637 354
Securities lending and repos 11 565 – 11 565 934 10 599 6 26
31 Dec. 2012
(in € million)
Gross
amount
before
balancing
Amount
of the
financially
balancing
Net
amount
after
balancing
Master netting arrangements
and other without financially balancing
Net
amount
Financial
instruments
Collaterals
Securities
collateral
Cash
collateral
Assets
Offsetting of current accounts 4 755 3 391 1 364 – – – 1 364
Derivate 16 241 – 16 241 10 625 19 2 663 2 933
Securities lending and repos 6 328 – 6 328 3 163 3 150 1 14
Liabilities
Offsetting of current accounts 11 189 3 391 7 778 – – – 7 778
Derivatives 15 764 – 15 764 10 625 401 3 926 812
Securities lending and repos 20 745 – 20 745 3 163 16 776 – 806
In the NORD/LB Group the offsetting of liabilities to an account holder that are payable on demand and are not
subject to any commitments against receivables owed by the same account holder that are payable on demand is
reported under the offsetting of current accounts in accordance with § 10 of the German Accounting Regulation for
Credit and Financial Services Institutions (Kreditinstituts-Rechnungslegungsverordnung, RechKredV). This is the case
where it has been agreed for the calculation of interest and commission that the account holder is treated in the
same way as if the postings are made to a single account. This offsetting is in accordance with IAS 32.42. Receivables
and liabilities in different currencies are not offset.

F-87
Business with derivative financial instruments and repos and securities lending business is generally conducted on
the basis of bilateral framework agreements concluded with the counterparty. These only allow the offsetting of
receivables and liabilities as well as collateral provided and received under certain conditions, e. g. in the event of
a breach of contract or in the case of insolvency. There is therefore currently no right to offset in accordance with
IAS 32.42.
(63) Transfer and derecognition of financial assets
The risks and opportunities relating to transferred financial assets and associated liabilities that remain in the
NORD/LB Group are shown in the table below. The table also shows the degree to which transferees’ rights of
recourse relate only to the respective transferred assets.
31 Dec. 2013
(in € million)
Full recognition
of financial assets
despite transfer
The transferee’s right
of recourse relates only to the
respective transferred assets
Asset value
of the
assets
Asset value
of the
appropriate
liabilities
Fair value
of the
assets
Fair value
of the
appropriate
liabilities
Net
position
Loans and advances to customers 1 419 – 1 419 – 1 419
Financial assets at fair value through profit or loss 111 32 111 32 79
Financial assets reported at fair value 18 789 19 439 11 818 12 547 – 729
Total 20 319 19 471 13 348 12 579 769
31 Dec. 2012
(in € million)
Full recognition
of financial assets
despite transfer
The transferee’s right
of recourse relates only to the
respective transferred assets
Asset value
of the
assets
Asset value
of the
appropriate
liabilities
Fair value
of the
assets
Fair value
of the
appropriate
liabilities
Net
position
Financial assets at fair value through profit or loss 689 3 524 689 3 524 – 2 835
Financial assets not reported at fair value 1 248 55 – – –
Financial assets reported at fair value 15 486 11 973 11 729 9 149 2 580
Total 17 423 15 552 12 418 12 673 – 255
The transferred financial assets primarily concern genuine repos and securities lending transactions.

F-88
(64) Derivative financial instruments
The NORD/LB Group employs derivative financial instruments for securing purposes in asset / liability management.
Trading is also conducted in derivative financial transactions.
Nominal values constitute the gross volume of all purchases and sales. This item is a reference figure for calculating
reciprocally agreed equalisation payments; it does not, however, refer to receivables and liabilities which may be
recognised in the balance sheet.
The portfolio of derivative financial instruments comprises the following:
(in € million)
Nominal values Fair value positive Fair value negative
31. 12. 2013 31. 12. 2012 31. 12. 2013 31. 12. 2012 31. 12. 2013 31. 12. 2012
Interest-rate risk
Interest rate swaps 230 059 259 107 8 874 14 676 7 484 12 187
FRAs 1 729 5 185 – – – –
Interest options
Call 3 097 3 533 338 540 4 4
Put 7 934 8 856 4 4 1 101 1 941
Caps, floors 7 203 7 647 98 141 64 91
Stock exchange contracts 905 654 1 1 2 –
Other forward interest rate transactions 1 986 2 263 87 84 125 312
252 913 287 245 9 402 15 446 8 780 14 535
Currency risk
Forward exchange contracts 23 545 16 521 219 200 240 186
Currency swaps and interest rate / currency swaps 33 311 43 492 668 989 429 1 103
Currency options
Call 141 327 3 13 1 –
Put 142 309 1 – 3 9
Other currency transactions – 144 – – – –
57 139 60 793 891 1 202 673 1 298
Share price and other price risks
Share price and other price risks 290 149 167 5 1 –
Stock options
Call 87 306 2 55 – –
Put 7 258 – – 1 26
Stock exchange contracts 51 51 – 1 1 1
435 764 169 61 3 27
Credit risk
Assignor 239 462 3 14 1 1
Assignee 4 577 5 251 10 4 65 168
4 816 5 713 13 18 66 169
Total 315 303 354 515 10 475 16 727 9 522 16 029

F-89
The residual terms to maturity of the derivative financial instruments are shown below.
Nominal values
(in € million)
Interest-rate risk Currency risk Share price and
other price risk
Credit risk
31 Dec.
2013
31 Dec.
2012
31 Dec.
2013
31 Dec.
2012
31 Dec.
2013
31 Dec.
2012
31 Dec.
2013
31 Dec.
2012
Up to 3 months 25 491 27 880 20 934 14 665 85 51 61 640
More than 3 months up to 1 year 28 714 35 847 9 452 11 640 109 62 903 574
More than 1 year up to 5 years 91 805 106 282 16 253 20 862 234 643 3 429 3 790
More than 5 years 106 903 117 236 10 500 13 626 7 8 423 709
Total 252 913 287 245 57 139 60 793 435 764 4 816 5 713
The residual term is defined as the period between the balance sheet date and the contractual due date.
The table below shows the nominal values and a breakdown of the positive and negative fair values of derivative
transactions by counterparty.
(in € million)
Nominal values Fair value positive Fair value negative
31 Dec. 2013 31 Dec. 2012 31 Dec. 2013 31 Dec. 2012 31 Dec. 2013 31 Dec. 2012
Banks in the OECD 271 271 310 727 8 231 13 191 8 744 14 824
Banks outside the OECD 585 497 5 6 7 7
Public institutions in the OECD 7 380 7 670 283 439 122 123
Other counterparties (including stock exchange contracts) 36 067 35 621 1 956 3 091 649 1 075
Total 315 303 354 515 10 475 16 727 9 522 16 029
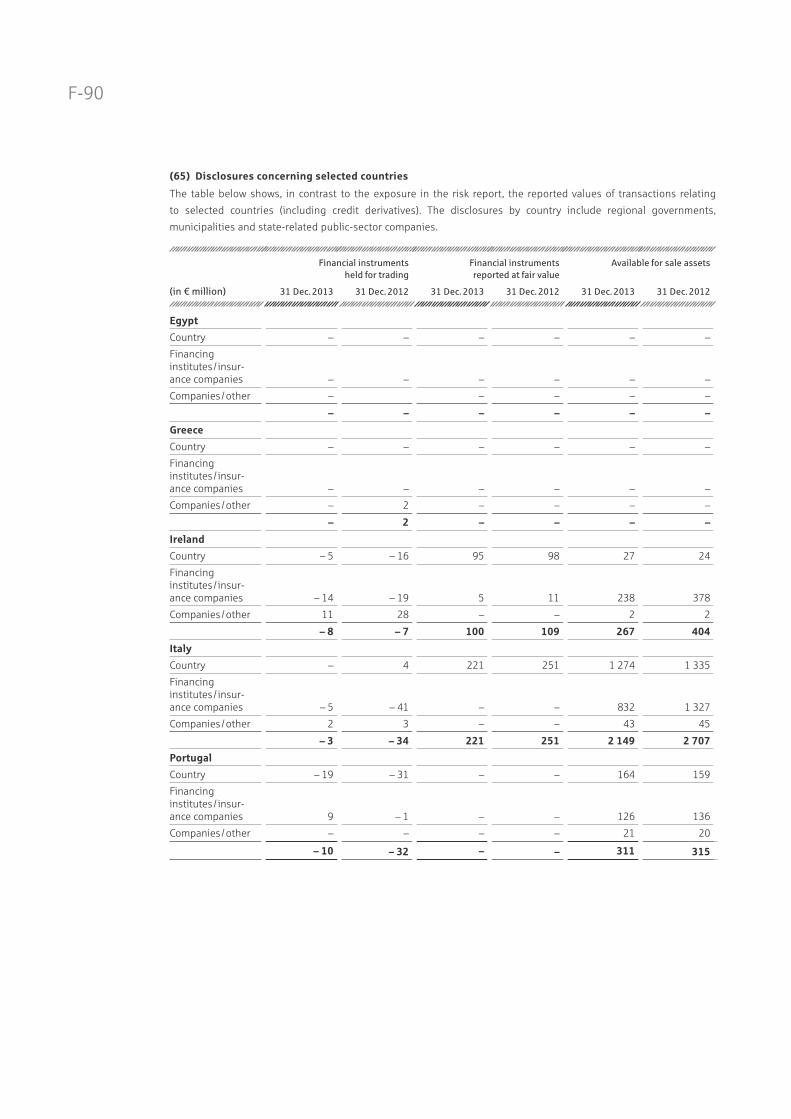
F-90
(65) Disclosures concerning selected countries
The table below shows, in contrast to the exposure in the risk report, the reported values of transactions relating
to selected countries (including credit derivatives). The disclosures by country include regional governments,
municipalities and state-related public-sector companies.
(in € million)
Financial instruments
held for trading
Financial instru ments
reported at fair value
Available for sale assets
31 Dec. 2013 31 Dec. 2012 31 Dec. 2013 31 Dec. 2012 31 Dec. 2013 31 Dec. 2012
Egypt
Country – – – – – –
Financing institutes / insur-ance companies – – – – – –
Companies / other – – – – –
– – – – – –
Greece
Country – – – – – –
Financing institutes / insur-ance companies – – – – – –
Companies / other – 2 – – – –
– 2 – – – –
Ireland
Country – 5 – 16 95 98 27 24
Financing institutes / insur-ance companies – 14 – 19 5 11 238 378
Companies / other 11 28 – – 2 2
– 8 – 7 100 109 267 404
Italy
Country – 4 221 251 1 274 1 335
Financing institutes / insur-ance companies – 5 – 41 – – 832 1 327
Companies / other 2 3 – – 43 45
– 3 – 34 221 251 2 149 2 707
Portugal
Country – 19 – 31 – – 164 159
Financing institutes / insur-ance companies 9 – 1 – – 126 136
Companies / other – – – – 21 20
– 10 – 32 – – 311 315
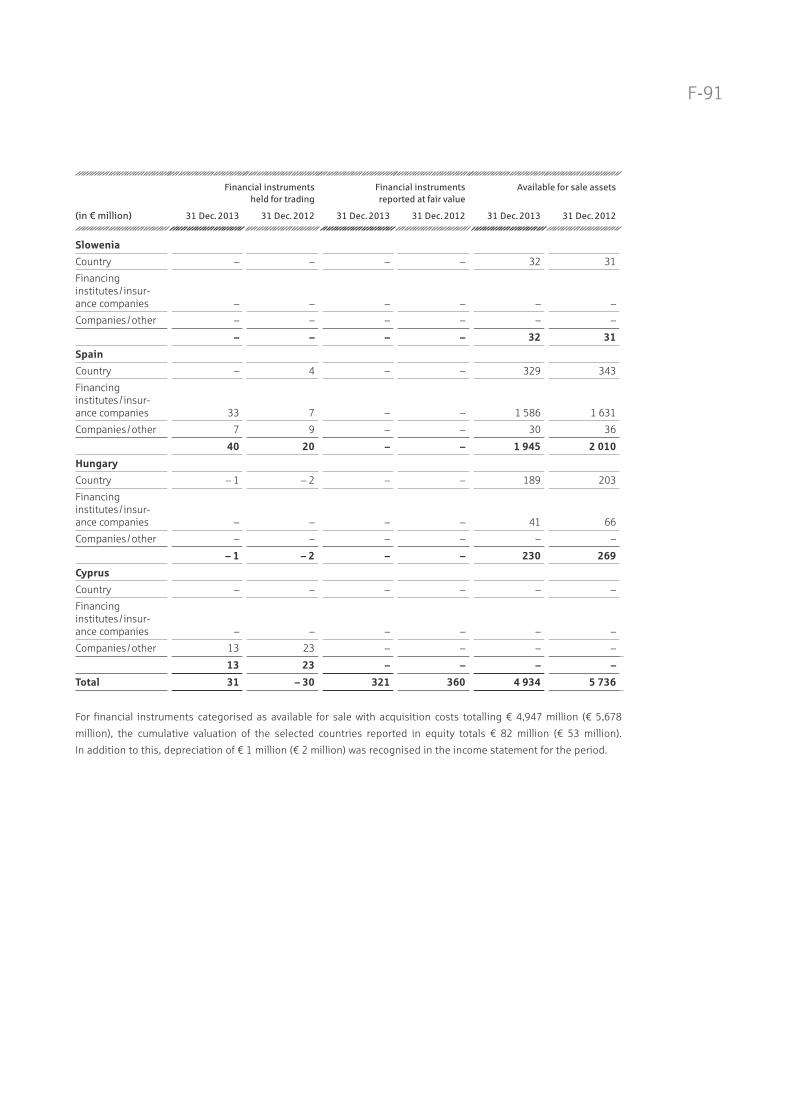
F-91
(in € million)
Financial instruments
held for trading
Financial instru ments
reported at fair value
Available for sale assets
31 Dec. 2013 31 Dec. 2012 31 Dec. 2013 31 Dec. 2012 31 Dec. 2013 31 Dec. 2012
Slowenia
Country – – – – 32 31
Financing institutes / insur-ance companies – – – – – –
Companies / other – – – – – –
– – – – 32 31
Spain
Country – 4 – – 329 343
Financing institutes / insur-ance companies 33 7 – – 1 586 1 631
Companies / other 7 9 – – 30 36
40 20 – – 1 945 2 010
Hungary
Country – 1 – 2 – – 189 203
Financing institutes / insur-ance companies – – – – 41 66
Companies / other – – – – – –
– 1 – 2 – – 230 269
Cyprus
Country – – – – – –
Financing institutes / insur-ance companies – – – – – –
Companies / other 13 23 – – – –
13 23 – – – –
Total 31 – 30 321 360 4 934 5 736
For financial instruments categorised as available for sale with acquisition costs totalling € 4,947 million (€ 5,678
million), the cumulative valuation of the selected countries reported in equity totals € 82 million (€ 53 million).
In addition to this, depreciation of € 1 million (€ 2 million) was recognised in the income statement for the period.
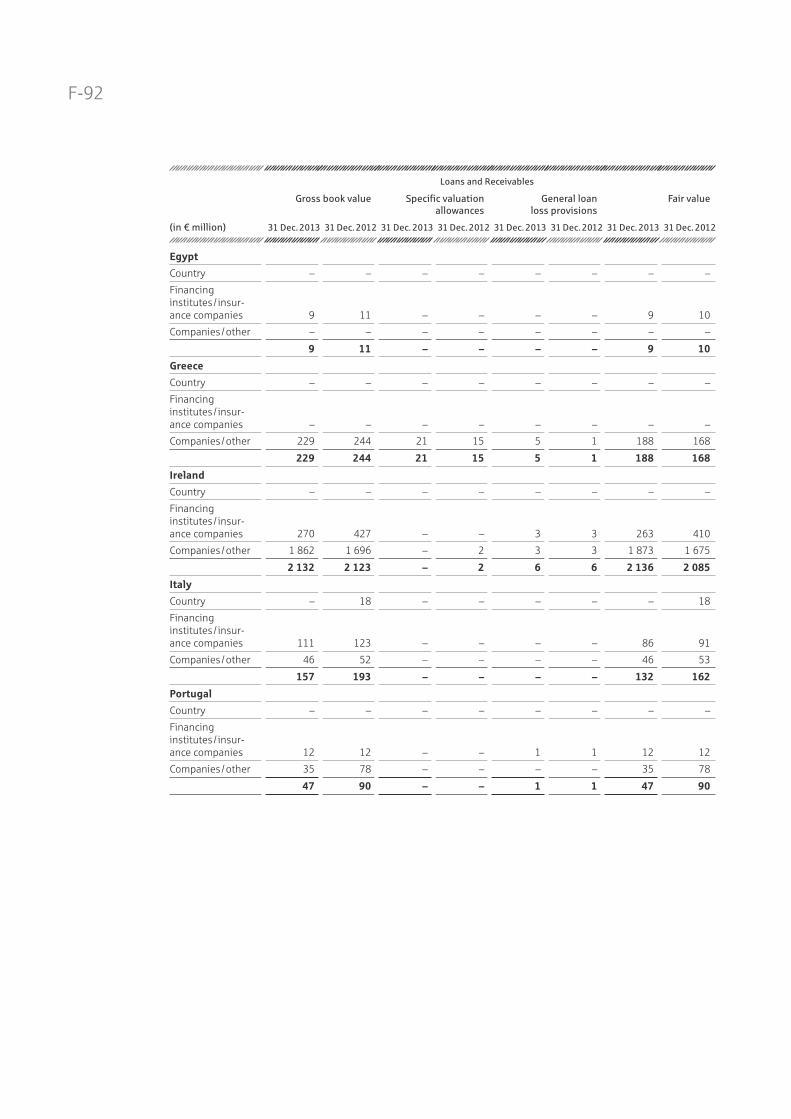
F-92
(in € million)
Loans and Receivables
Gross book value Specific valuation
allowances
General loan
loss provisions
Fair value
31 Dec. 2013 31 Dec. 2012 31 Dec. 2013 31 Dec. 2012 31 Dec. 2013 31 Dec. 2012 31 Dec. 2013 31 Dec. 2012
Egypt
Country – – – – – – – –
Financing institutes / insur-ance companies 9 11 – – – – 9 10
Companies / other – – – – – – – –
9 11 – – – – 9 10
Greece
Country – – – – – – – –
Financing institutes / insur-ance companies – – – – – – – –
Companies / other 229 244 21 15 5 1 188 168
229 244 21 15 5 1 188 168
Ireland
Country – – – – – – – –
Financing institutes / insur-ance companies 270 427 – – 3 3 263 410
Companies / other 1 862 1 696 – 2 3 3 1 873 1 675
2 132 2 123 – 2 6 6 2 136 2 085
Italy
Country – 18 – – – – – 18
Financing institutes / insur-ance companies 111 123 – – – – 86 91
Companies / other 46 52 – – – – 46 53
157 193 – – – – 132 162
Portugal
Country – – – – – – – –
Financing institutes / insur-ance companies 12 12 – – 1 1 12 12
Companies / other 35 78 – – – – 35 78
47 90 – – 1 1 47 90

F-93
(in € million)
Loans and Receivables
Gross book value Specific valuation
allowances
General loan
loss provisions
Fair value
31 Dec. 2013 31 Dec. 2012 31 Dec. 2013 31 Dec. 2012 31 Dec. 2013 31 Dec. 2012 31 Dec. 2013 31 Dec. 2012
Slowenia
Country – – – – – – – –
Financing institutes / insur-ance companies 25 25 – – – – 25 24
Companies / other – – – – – – – –
25 25 – – – – 25 24
Spain
Country 52 52 – – 1 – 53 40
Financing institutes / insur-ance companies 125 135 – – 1 – 123 131
Companies / other 442 459 44 34 1 – 425 462
619 646 44 34 3 – 601 633
Hungary
Country – – – – – – – –
Financing institutes / insur-ance companies 3 3 – – – – 3 3
Companies / other 47 10 – – – – 47 10
50 13 – – – – 50 13
Cyprus
Country – – – – – – – –
Financing institutes / insur-ance companies – – – – – – – –
Companies / other 1 156 1 146 16 23 20 6 928 1 000
1 156 1 146 16 23 20 6 928 1 000
Total 4 424 4 491 81 74 35 14 4 116 4 185
The nominal value of credit derivatives relating to the selected countries in the NORD/LB Group’s portfolio is
€ 1,446 million (1,531 million). Of this, states account for € 495 million (€ 479 million), financing institutes / insurance
companies for € 950 million (€ 1,051 million) and companies / others for € 1 million (€ 1 million). The Group acts
as both a provider and recipient of collateral. The netted fair value of the credit derivatives is € – 41 million
(€ – 118 million).
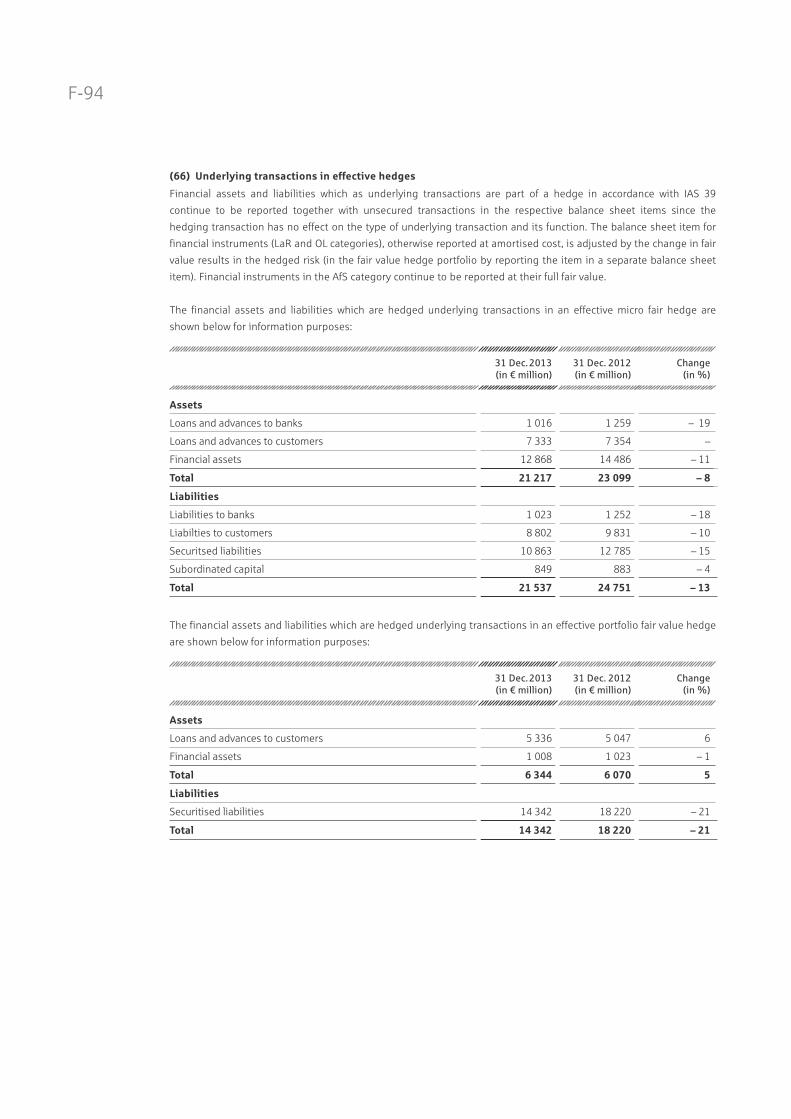
F-94
(66) Underlying transactions in effective hedges
Financial assets and liabilities which as underlying transactions are part of a hedge in accordance with IAS 39
continue to be reported together with unsecured transactions in the respective balance sheet items since the
hedging transaction has no effect on the type of underlying transaction and its function. The balance sheet item for
financial instruments (LaR and OL categories), otherwise reported at amortised cost, is adjusted by the change in fair
value results in the hedged risk (in the fair value hedge portfolio by reporting the item in a separate balance sheet
item). Financial instruments in the AfS category continue to be reported at their full fair value.
The financial assets and liabilities which are hedged underlying transactions in an effective micro fair hedge are
shown below for information purposes:
31 Dec.2013
(in € million)
31 Dec. 2012
(in € million)
Change
(in %)
Assets
Loans and advances to banks 1 016 1 259 – 19
Loans and advances to customers 7 333 7 354 –
Financial assets 12 868 14 486 – 11
Total 21 217 23 099 – 8
Liabilities
Liabilities to banks 1 023 1 252 – 18
Liabilties to customers 8 802 9 831 – 10
Securitsed liabilities 10 863 12 785 – 15
Subordinated capital 849 883 – 4
Total 21 537 24 751 – 13
The financial assets and liabilities which are hedged underlying transactions in an effective portfolio fair value hedge
are shown below for information purposes:
31 Dec.2013
(in € million)
31 Dec. 2012
(in € million)
Change
(in %)
Assets
Loans and advances to customers 5 336 5 047 6
Financial assets 1 008 1 023 – 1
Total 6 344 6 070 5
Liabilities
Securitised liabilities 14 342 18 220 – 21
Total 14 342 18 220 – 21

F-95
(67) Residual terms of financial liabilities
31 Dec. 2013
(in € million)
Up to
1 month
More than
1 month up
to 3 months
More than
3 months up
to 1 year
More than
1 year up to
5 years
More than
5 years
Total
Liabilities to banks 22 510 7 978 6 332 13 711 10 266 60 797
Liabilties to customers 19 512 2 113 6 895 12 598 19 718 60 836
Securitsed liabilities 5 881 1 475 12 950 29 443 8 924 58 673
Financial liabilities at fair value through profit or loss (no derivatives) 91 82 556 2 854 10 882 14 465
Negative fair values from derivatives held for trading 110 275 824 2 460 2 343 6 012
Negative fair values from hedge accounting derivatives 106 147 404 1 612 1 151 3 420
Subordinated capital 3 17 524 1 945 2 992 5 481
Financial guarantees 3 496 30 18 659 925 5 128
Irrevocable credit commitments 2 426 248 719 6 736 437 10 566
Total 55 135 12 365 29 222 72 018 57 638 225 378
31 Dec. 2012
(in € million)
Up to
1 month
More than
1 month up
to 3 months
More than
3 months up
to 1 year
More than
1 year up to
5 years
More than
5 years
Total
Liabilities to banks 23 594 14 903 5 630 13 653 10 197 67 977
Liabilties to customers 17 405 3 205 5 630 14 238 21 566 62 044
Securitsed liabilities 2 753 4 692 11 074 40 360 7 625 66 504
Financial liabilities at fair value through profit or loss (no derivatives) 134 35 594 4 790 7 750 13 303
Negative fair values from derivatives held for trading 333 426 1 520 5 099 4 349 11 727
Negative fair values from hedge accounting derivatives 106 122 535 2 175 1 851 4 789
Other liabilities (financial instruments only) 1 – – – – 1
Subordinated capital 60 7 394 2 287 2 963 5 711
Financial guarantees 2 803 31 107 387 1 843 5 171
Irrevocable credit commitments 2 160 53 648 5 165 1 499 9 525
Total 49 349 23 474 26 132 88 154 59 643 246 752
The residual term for undiscounted financial liabilities is defined as the period between the balance sheet date and
the contractual due date.

F-96
(68) NORD/LB Group as assignor and assignee
The following financial assets have been pledged as collateral for liabilities (carrying amounts):
31 Dec.2013
(in € million)
31 Dec. 2012
(in € million)
Change
(in %)
Loans and advances to banks 16 073 23 410 – 31
Loans and advances to customers 40 330 41 992 – 4
Financial assets at fair value through profit or loss 798 1 532 – 48
Financial assets 26 270 29 645 – 11
Total 83 471 96 579 – 14
Collateral has been provided for borrowing undertaken within the scope of genuine repos. Collateral has also been
provided for refinancing funds for specific purposes, securities lending transactions, transactions with clearing
brokers and stock exchange transactions.
Financial assets deposited as collateral for which the assignee has the contractual or customary right to sell or
re-pledge the collateral amount to € 5,101 million (€ 22,303 million).
For the following liabilities assets were assigned as collateral to the amounts shown:
31 Dec.2013
(in € million)
31 Dec. 2012
(in € million)
Change
(in %)
Liabilities to banks 21 235 23 377 – 9
Liabilties to customers 8 956 10 584 – 15
Securitsed liabilities 20 956 25 206 – 17
Financial liabilities at fair value through profit or loss 8 462 13 813 – 39
Total 59 609 72 980 – 18
For collateral received in particular for repo and securities lending transactions which may be re-pledged or re-sold
even if the assignor does not default, the fair value is € 2,702 million (€ 6,687 million).
Collateral which may be re-pledged or re-sold even if the assignor does not default was realised. The repayment
obligation at current market value is € 206 million (€ 1,691 million).

F-97
Other Notes
(69) Equity management
Equity is managed for the Group in the parent company NORD/LB. The aim is to secure an adequate supply of capital
resources in terms of quantity and quality, to achieve an adequate return on equity and to permanently comply with
regulatory minimum capital ratios at Group level in each case. Significant capital figures in equity management are or
were:
• Reported equity
• Total regulatory core capital (“core capital for solvency purposes”)
• Regulatory eligible capital
• The “core tier 1 capital” in the sense of the EU Capital Adequacy Directive (EU-CRR) applicable from the start of
2014 with and without consideration of the transition rules applicable up to and including 2021 and
• until July / August 2013 the “core tier 1 capital” as defined by the European Banking Authority (EBA).
For part of these capital figures, target capital ratios are specified for the Group for which the numerator is the respec-
tive capital figure and the denominator is respective risk-weighted assets (RWA) in accordance with the German
Solvency Regulation.
Legally-prescribed minimum capital ratios also apply. These are for total regulatory core capital 4.0 per cent to the
end of 2013 and for regulatory capital 8.0 per cent until further notice. There are also individual capital-related
requirements imposed by the EBA. With regard to core tier 1 capital as defined by the EBA, the EBA had since 30 June
2012 required of NORD/LB as one of the system-relevant banks in the EU that it maintains a minimum ratio of 9.0 per
cent. Since July / August 2013 this requirement has been lifted. Instead the EBA expects that NORD/LB maintains
a core tier 1 capital ratio in the sense of the EU-CRR of at least 7.0 per cent after the transition rules have expired.
In the year under review 2013 the core task of capital management lay in further optimising the capital structure and
in the ongoing control of capital in order to achieve the internal target capital ratios and to permanently comply with
the regulatory minimum capital ratios expected by the EBA.
At the start of 2014 the EU Capital Adequacy Directive (EU-CRR) will come into effect, transposing the so-called “Basel
III” regulations into EU law. The EU Capital Adequacy Directive provides for a gradual and in part significant increase
in regulatory minimum capital ratios for core tier 1 capital, total core capital and regulatory capital until 2019.
As a result greater requirements will also be placed on equity management in future. The most important capital
figure, in terms of both regulatory laws and control within the Group, will be the core tier 1 capital in the sense of the
EU Capital Adequacy Directive. In order to strengthen this, the capital structure of the Group will continue to be opti-
mised.
In addition to this, within the scope of capital management, targets and forecasts are prepared for the relevant capital
figures and the related capital ratios as required. Their actual and planned development is reported to management,
the supervisory bodies, the owners of the bank and / or the EBA. If these calculations indicate any risk for the defined
target capital ratios either adjustment measures are taken in terms of RWA or, with the agreement of the guarantors
of the bank, procurement or optimisation measures will be taken for individual capital figures.
In 2012 and 2013 the bank maintained the regulatory minimum capital ratios at Group level at all times. The regula-
tory overall core tier 1 capital ratio (= core capital ratio for solvency purposes) and the regulatory capital ratio (= over-
all ratio) at the end of each year are reported in Note Regulatory Data Regulatory Data. The bank has exceeded the
target set by the EBA of a core tier 1 capital ratio as defined by the EBA of at least 9.0 per cent for the period of
30 June 2012 to July / August 2013. The bank will meet hard core capital ratio in the sense of the EU-CRR expected by
the EBA since the second half of 2013 after the expiry of the transition rules of at least 7.0 per cent after the transition
rules have expired based on its capital planning.
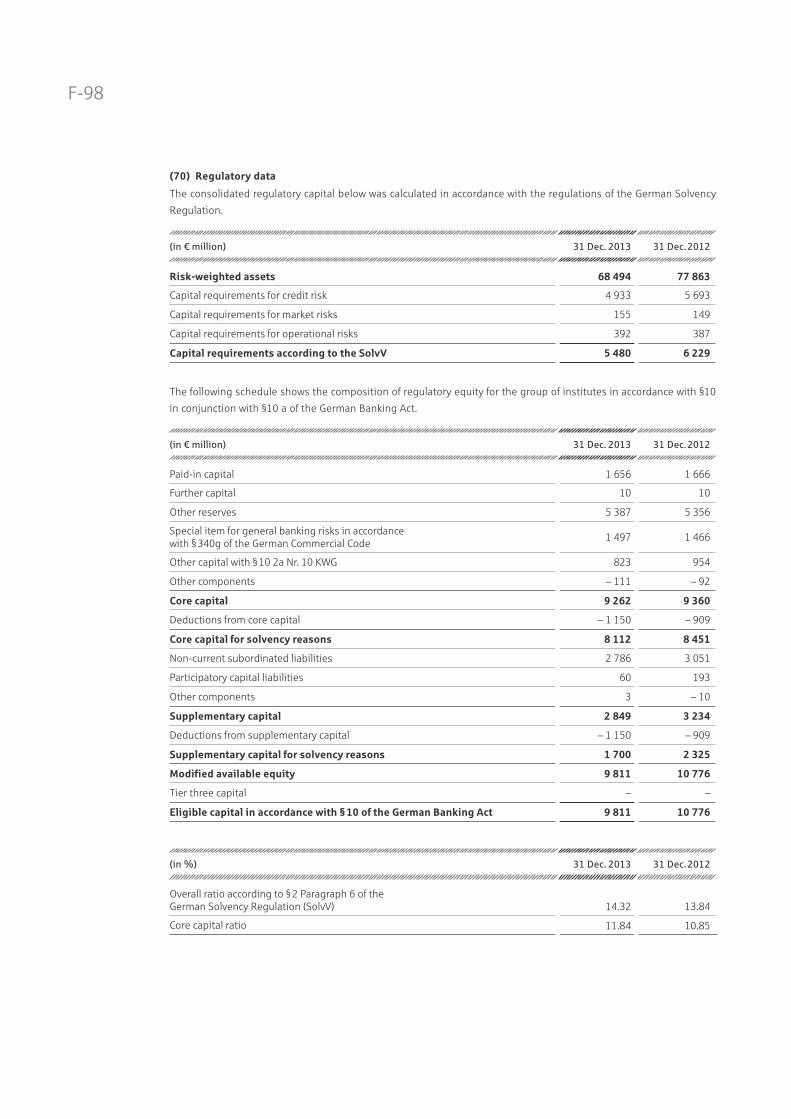
F-98
(70) Regulatory data
The consolidated regulatory capital below was calculated in accordance with the regulations of the German Solvency
Regulation.
(in € million) 31 Dec. 2013 31 Dec.2012
Risk-weighted assets 68 494 77 863
Capital requirements for credit risk 4 933 5 693
Capital requirements for market risks 155 149
Capital requirements for operational risks 392 387
Capital requirements according to the SolvV 5 480 6 229
The following schedule shows the composition of regulatory equity for the group of institutes in accordance with §10
in conjunction with §10 a of the German Banking Act.
(in € million) 31 Dec. 2013 31 Dec.2012
Paid-in capital 1 656 1 666
Further capital 10 10
Other reserves 5 387 5 356
Special item for general banking risks in accordance with § 340g of the German Commercial Code
1 497 1 466
Other capital with § 10 2a Nr. 10 KWG 823 954
Other components – 111 – 92
Core capital 9 262 9 360
Deductions from core capital – 1 150 – 909
Core capital for solvency reasons 8 112 8 451
Non-current subordinated liabilities 2 786 3 051
Participatory capital liabilities 60 193
Other components 3 – 10
Supplementary capital 2 849 3 234
Deductions from supplementary capital – 1 150 – 909
Supplementary capital for solvency reasons 1 700 2 325
Modified available equity 9 811 10 776
Tier three capital – –
Eligible capital in accordance with § 10 of the German Banking Act 9 811 10 776
(in %) 31 Dec. 2013 31 Dec.2012
Overall ratio according to § 2 Paragraph 6 of theGerman Solvency Regulation (SolvV) 14.32 13.84
Core capital ratio 11.84 10.85

F-99
(71) Foreign currency volume
As at 31 December 2013 and 31 December 2012 the NORD/LB Group had the following assets and liabilities in foreign
currency:
(in € million)
USD GBP JPY Other Total
31Dec. 2013
Total
31Dec. 2012
Assets
Loans and advances to banks 1 454 23 31 184 1 692 1 062
Loans and advances to customers 21 790 3 508 522 1 720 27 540 31 560
Risk provisioning – 376 – 30 – 11 – 10 – 427 – 422
Financial assets at fair value through profit or loss 12 992 2 088 693 2 372 18 145 18 979
Financial assets 3 054 740 363 989 5 146 5 844
Other 190 11 32 127 360 668
Total 39 104 6 340 1 630 5 382 52 456 57 691
Liabilities
Liabilities to banks 5 744 1 721 9 60 7 534 9 601
Liabilties to customers 2 398 182 5 396 2 981 2 749
Securitsed liabilities 3 678 6 887 1 301 5 872 6 643
Financial liabilities at fair value through profit or loss 23 714 3 560 912 3 016 31 202 31 996
Other 684 74 32 120 910 1 690
Total 36 218 5 543 1 845 4 893 48 499 52 679
Existing exchange rate risks are eliminated by concluding transactions with matching maturities.

F-100
(72) Longer-term assets and liabilities
For balance sheet items which include both current and longer-term assets and liabilities, the assets and liabilities
which are to be realised or settled after more than twelve months are shown below.
31 Dec.2013
(in € million)
31 Dec. 2012
(in € million)
Change
(in %)
Assets
Loans and advances to banks 16 949 17 672 – 4
Loans and advances to customers 84 145 96 540 – 13
Balancing items for financial instruments hedged in the fair value hedge portfolio – 171 – 3 > 100
Assets held for trading 5 983 14 554 – 59
Loans and advances to banks reported at fair value 6 6 –
Loans and advances to customers reported at fair value 235 248 – 5
Financial assets reported at fair value 723 622 16
Positive fair values from hedge accounting derivatives 3 273 4 455 – 27
Financial assets classified as LaR 3 052 3 686 – 17
Financial assets classified as AfS 37 277 38 017 – 2
Other assets 34 37 – 8
Total 151 506 175 834 – 14
Liabilities
Liabilities to banks 19 882 23 256 – 15
Liabilities to customers 28 105 34 489 – 19
Securitised liabilities 36 277 47 948 – 24
Balancing items for financial instruments hedged in the fair value hedge portfolio 228 837 – 73
Liabilities held for trading 5 353 10 179 – 47
Liabilities to banks reported at fair value 582 356 63
Liabilities to customers reported at fair value 4 988 4 759 5
Securitised liabilities reported at fair value 2 430 3 346 – 27
Subordinated capital reported at fair value 25 26 – 4
Negative fair values from hedge accounting derivatives 3 014 4 562 – 34
Provisions 1 812 1 724 5
Other liabilities 34 32 6
Subordinated capital 3 774 4 133 – 9
Total 106 504 135 647 – 21
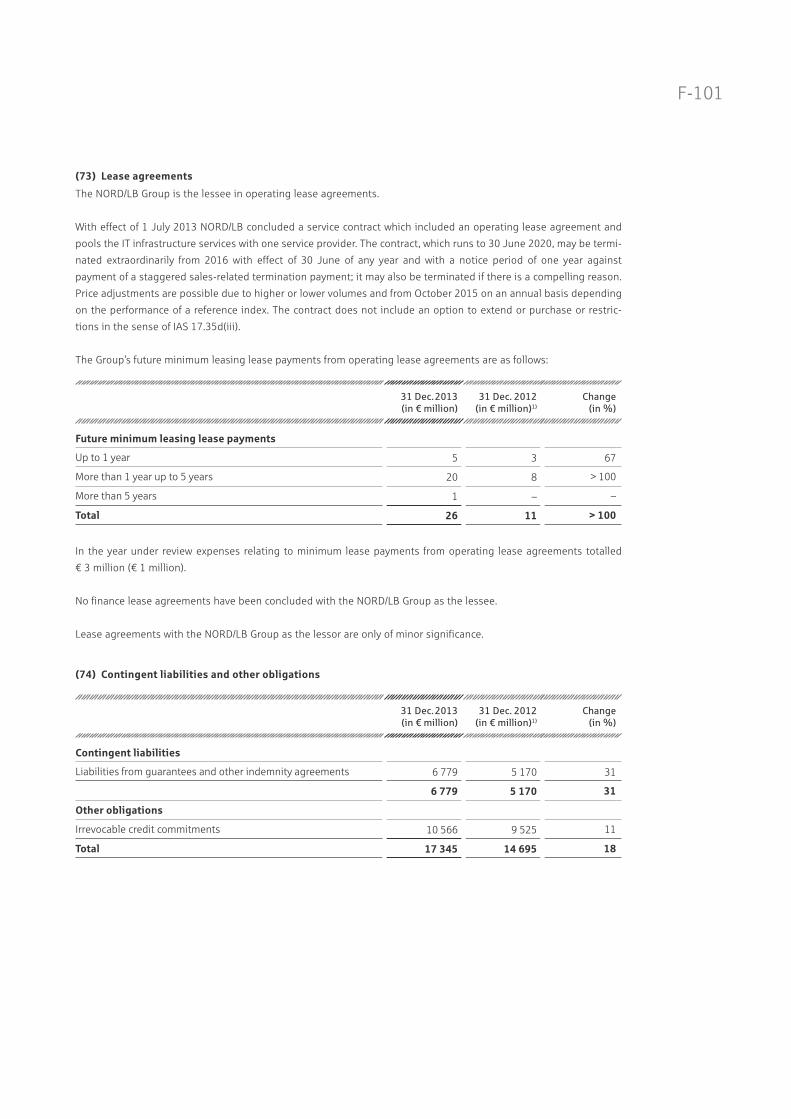
F-101
(74) Contingent liabilities and other obligations
31 Dec.2013
(in € million)
31 Dec. 2012
(in € million)1)
Change
(in %)
Contingent liabilities
Liabilities from guarantees and other indemnity agreements 6 779 5 170 31
6 779 5 170 31
Other obligations
Irrevocable credit commitments 10 566 9 525 11
Total 17 345 14 695 18
(73) Lease agreements
The NORD/LB Group is the lessee in operating lease agreements.
With effect of 1 July 2013 NORD/LB concluded a service contract which included an operating lease agreement and
pools the IT infrastructure services with one service provider. The contract, which runs to 30 June 2020, may be termi-
nated extraordinarily from 2016 with effect of 30 June of any year and with a notice period of one year against
payment of a staggered sales-related termination payment; it may also be terminated if there is a compelling reason.
Price adjustments are possible due to higher or lower volumes and from October 2015 on an annual basis depending
on the performance of a reference index. The contract does not include an option to extend or purchase or restric-
tions in the sense of IAS 17.35d(iii).
The Group’s future minimum leasing lease payments from operating lease agreements are as follows:
31 Dec.2013
(in € million)
31 Dec. 2012
(in € million)1)
Change
(in %)
Future minimum leasing lease payments
Up to 1 year 5 3 67
More than 1 year up to 5 years 20 8 > 100
More than 5 years 1 – –
Total 26 11 > 100
In the year under review expenses relating to minimum lease payments from operating lease agreements totalled
€ 3 million (€ 1 million).
No finance lease agreements have been concluded with the NORD/LB Group as the lessee.
Lease agreements with the NORD/LB Group as the lessor are only of minor significance.

F-102
Liabilities from guarantees and other indemnity agreements include credit guarantees, trade-related guarantees and
contingent liabilities from other guarantees and indemnity agreements.
NORD/LB ensures that the following companies are able to meet their obligations:
Deutsche Hypothekenbank (Actien-Gesellschaft), Hanover
NIEBA GmbH, Hanover
Norddeutsche Landesbank Luxembourg S. A., Luxembourg-Findel /Luxembourg
NORD/LB Asset Management Holding GmbH, Hanover
NORD/LB COVERED FINANCE BANK S. A., Luxembourg-Findel /Luxembourg
Skandifinanz AG, Zurich / Switzerland
Information on uncertainty concerning the amount or the timing of outflows of capital and on possible equalisation
payments is not given for reasons of practicality.
(75) Other financial obligations
The Group vouches for the obligations of the Sparkassenverband Niedersachsen (Association of the Savings Banks of
Lower Saxony) resulting from its membership in the Deutscher Sparkassen- und Giroverband (German Association of
Savings Banks and Girobanks) and the DekaBank Deutsche Girozentrale. In addition joint liability has been assumed
for DekaBank Deutsche Girozentrale with the other shareholders of this bank within the scope of the guarantor
function.
NORD/LB, together with Sparkassenverband Niedersachsen and Landesbank Berlin Holding AG, also acts as guaran-
tor for LBS Norddeutsche Landesbausparkasse Berlin-Hannover.
In connection with the acquisition of Deutsche Hypothekenbank (Actien-Gesellschaft), the Group is obliged to reim-
burse Deutscher Sparkassen- and Giroverband e.V. as the guarantor of the security reserve for landesbanks and giro
centres all expenditure including interest and interest lost for supporting measures which cannot be paid from the
fund established for Deutsche Hypothekenbank in accordance with the agreement concluded between Deutscher
Sparkassen- und Giroverband e.V and Deutsche Hypothekenbank AG on 19 December 2008.
There was also an obligation to release Bundesverband deutscher Banken e.V. (Association of German Banks) from all
losses which were a result of measures in accordance with § 2 para. 2 of the statute of the “Einlagensicherungsfond”
(deposit protection fund) for the Deutsche Hypothekenbank (Actien-Gesellschaft). The participation of Deutsche
Hypothekenbank (Actien-Gesellschaft) in the German banks’ deposit protection fund was terminated as at 31 Decem-
ber 2008. In accordance with § 6 no. 8 of the statute of the deposit protection fund NORD/LB may still be liable for
commitments previously entered into by Deutsche Hypothekenbank (Actien-Gesellschaft).
Due to its investment in Braunschweig Grund Objektgesellschaft Driebenberg mbH & Co. KG, Braunschweig, NORD/LB
is liable to the effect that the limited partners have released the general partner from liability.
In a joint participating interest with other limited partners in Immobilien Development und Beteiligungsgesellschaft
Niedersachsen mbH IDB & Co. Objekt Zietenterrassen KG, one limited partner has indemnified the general partner
from liability. In the internal relationship the Group assumes 50 per cent of obligations that may result from this
declaration of liability.
In connection with the sale of companies in the NILEG sub-group, a guarantee was made to the purchaser that taxes
for periods for which tax audits had not yet been conducted have been fully paid or adequate provisions have been
set up. In this respect NORD/LB is liable for any additional back taxes if the value exceeds € 0.5 million.

F-103
With regard to the inclusion of the shares in FinanzIT GmbH, Frankfurt am Main, the withdrawing partners NORD/LB,
Bremer Landesbank and Landesbank Saar have committed, together with the remaining partners of FinanzIT, to bear
the risks of the company from the time up to their withdrawal, provided they have actually occurred and are not
already covered by provisions which have already been made.
There is also a liability for an amount of up to € 4 million (€ 4 million) to be paid to the employees of two public-
sector insurance companies in the event of insolvency.
An obligation towards two companies (two companies) involves the granting of a shareholder loan to the amount of
€ 7 million (€ 11 million).
The Group is also obliged to make additional contributions up to an amount of € 135 million (€ 219 million) to the
security reserve for landesbanks and giro centres. In the event of a need for support these subsequent contributions
could be collected immediately.
Other obligations to make additional contributions amount to € 34 million (€ 34 million) in addition to further joint
liabilities for other shareholders towards Liquiditäts-Konsortialbank GmbH.
Furthermore obligations to make additional contributions result on the basis of memberships of protection schemes
for insurance companies to the amount of € 2 million (€ 1 million). Due to memberships in other protection schemes
within the scope of insurance business, the Group, besides being a proportionate guarantor, also bears additional
liability risks to the amount of € 4 million (€ 4 million).
The personally liable partners of a real estate investment fund have been released from their statutory liability.
Call-in obligations for shares and other interests amounted to € 64 million at year-end (€ 19 million).
In the course of normal business activities NORD/LB has provided security in the nominal amount of € 1,781 million
in the form of securities.
In connection with the measures to boost the amount of NORD/LB’s regulatory capital by converting silent
participations into share capital and reserves, NORD/LB has made a commitment to the other owners of Bremer
Landesbank that in the event of a further retention of profits and until a distribution takes place, to finance it in
advance with the funds it requires at terms that are still to be negotiated.
The Group intends, in order ease the pressure on regulatory equity, to transfer part of the credit risk of a credit port-
folio defined precisely by a finance guarantee (“PEGASUS”) to an external third party. If the finance guarantee becomes
effective as planned in 2014, this would result in a financial burden with charges of up to € 36 million incurred for
2014 and up to € 45 million per year for the remainder of the period of the guarantee.
A framework contract has been concluded with Wincor Nixdorf International GmbH, Paderborn, to regulate collabora-
tion in the area of information technology. The contract, which bundles the IT infrastructure services with one service
provider, commences with effect of 1 July 2013 and will run to 30 June 2020. The annual costs are volume-depend-
ent; the value of the contract over the entire term is approx. € 200 million.
Obligations pertaining to existing rental and lease agreements are within the scope of standard business.
In accordance with the Restructuring Fund Regulation (Restrukturierungsfonds-Verordnung, RstruktFV), the Group
has to pay a bank levy.

F-104
(76) Subordinated sssets
Assets are considered to be subordinated if they are only met after the claims of other creditors in the event of the
liquidation or the insolvency of a debtor. The following subordinated assets are included in balance sheet assets:
31 Dec.2013
(in € million)
31 Dec. 2012
(in € million)
Change
(in %)
Loans and advances to banks and customers 14 20 – 30
Financial assets at fair value through profit or loss 79 182 – 57
Financial assets 580 745 – 22
Total 673 947 – 29
(77) Trust activities
In compliance with IFRS regulations, trust activities are not shown in the consolidated balance sheet of the NORD/LB
Group; however, they are present in the Group.
Trust activities are broken down as follows:
31 Dec.2013
(in € million)
31 Dec. 2012
(in € million)
Change
(in %)
Assets held in trust
Loans and advances to customers 65 75 – 13
Financial instruments at fair value through profit or loss 10 11 – 9
Other assets held in trust 55 67 – 18
Total 130 153 – 15
Liabilities held in trust
Liabilities to banks 44 51 – 14
Liabilities to customers 31 34 – 9
Other liabilities held in trust 55 68 – 19
Total 130 153 – 15
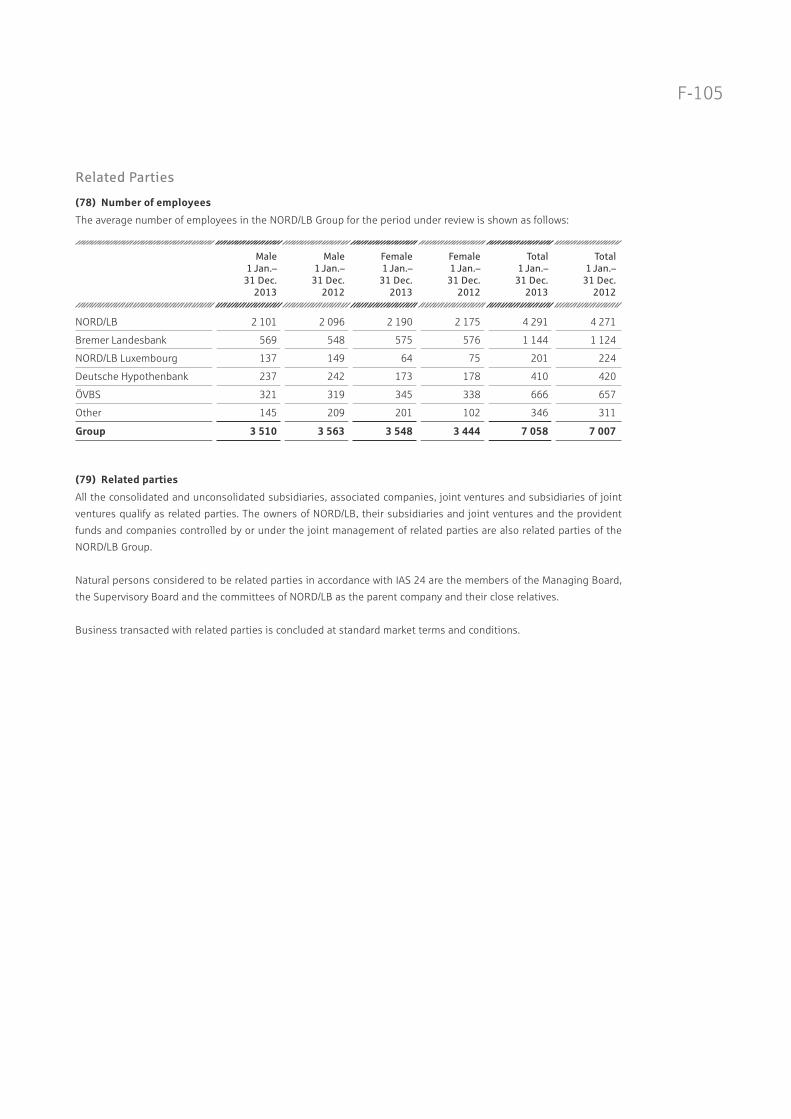
F-105
Related Parties
(78) Number of employees
The average number of employees in the NORD/LB Group for the period under review is shown as follows:
Male
1 Jan.–
31 Dec.
2013
Male
1 Jan.–
31 Dec.
2012
Female
1 Jan.–
31 Dec.
2013
Female
1 Jan.–
31 Dec.
2012
Total
1 Jan.–
31 Dec.
2013
Total
1 Jan.–
31 Dec.
2012
NORD/LB 2 101 2 096 2 190 2 175 4 291 4 271
Bremer Landesbank 569 548 575 576 1 144 1 124
NORD/LB Luxembourg 137 149 64 75 201 224
Deutsche Hypothenbank 237 242 173 178 410 420
ÖVBS 321 319 345 338 666 657
Other 145 209 201 102 346 311
Group 3 510 3 563 3 548 3 444 7 058 7 007
(79) Related parties
All the consolidated and unconsolidated subsidiaries, associated companies, joint ventures and subsidiaries of joint
ventures qualify as related parties. The owners of NORD/LB, their subsidiaries and joint ventures and the provident
funds and companies controlled by or under the joint management of related parties are also related parties of the
NORD/LB Group.
Natural persons considered to be related parties in accordance with IAS 24 are the members of the Managing Board,
the Supervisory Board and the committees of NORD/LB as the parent company and their close relatives.
Business transacted with related parties is concluded at standard market terms and conditions.

F-106
The scope of transactions conducted with related parties in 2012 and 2013, excluding those to be eliminated under
consolidation, can be seen in the following statements:
31 Dec. 2013
(in € million)
Companies
with
significant
influence
Subsidaries Joint
Ventures
Affiliated
companies
Persons
in key
positions
Other
related
parties
Assets
Loans and advances to banks – – – 602 – 228
of which: money market transcations – – – 205 – –
of which: loans – – – 397 – 228
of which: public-sector loans – – – – – 13
of which: other loans – – – 397 – 215
Loans and advances to customers 3 010 40 8 326 1 917
of which: money market transcations 39 – – – – 36
of which: loans 2 971 39 8 326 1 881
public-sector loans 2 915 – – 16 – 820
mortage-backed loans – 15 – 106 – 27
other loans 56 24 8 204 1 34
Financial assets at fair value through profit or loss 270 – – 48 – 91
of which: Debt securities and other fixed-interest securities 215 – – – – –
of which: Positive fair values from derivatives 30 – – 48 – 3
of which: Trading portfolio claims 24 – – – – 88
Positive fair values from hedge accounting derivatives 47 – – – – –
Financial assets 2 250 – – 17 – –
of which: Debt securities and other fixed-interest securities 2 250 – – – – –
of which: Shares and other non fixed-interest securities – – – 17 – –
Total 5 577 40 8 993 1 1 236

F-107
31 Dec. 2013
(in € million)
Companies
with
significant
influence
Subsidaries Joint
Ventures
Affiliated
companies
Persons
in key
positions
Other
related
parties
Liabilities
Liabilities to banks – – – 452 – 118
of which: money market transcations – – – – – 53
of which: deposits from other banks – – – 134 – 13
Liabilities to customers 347 33 85 282 3 288
of which: money market transcations 26 16 – 21 – 152
Securitsed liabilities – – – – – 1
Financial liabilities at fair value through profit or loss 39 – – – – 134
of which: negative fair values from derivatives 15 – – – – 11
Negative fair values from hedge accounting derivatives 9 – – – – –
Subordinated capital 1 496 3 – – 15
Total 396 529 88 734 3 556
Guarantees / sureties received 2 541 – – – – –
Guarantees / sureties granted 3 000 1 1 11 – 8
1 Jan.–31 Dec. 2013
(in € million)
Companies
with
significant
influence
Subsidaries Joint
Ventures
Affiliated
companies
Persons
in key
positions
Other
related
parties
Interest expense 40 49 – 36 – 16
Interest income 160 3 1 38 – 42
Commission expense 18 – – – – –
Other income and expenses – 136 – – – 13 – 5 13
Total – 34 – 46 1 – 11 – 5 39
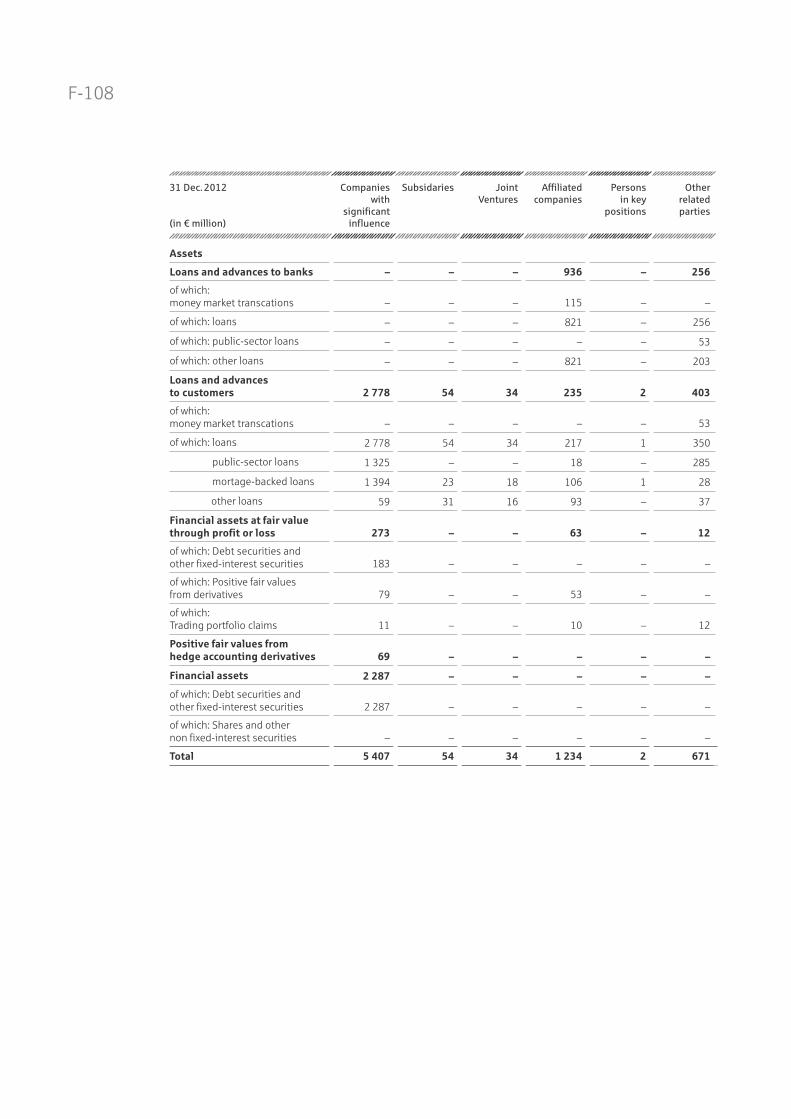
F-108
31 Dec. 2012
(in € million)
Companies
with
significant
influence
Subsidaries Joint
Ventures
Affiliated
companies
Persons
in key
positions
Other
related
parties
Assets
Loans and advances to banks – – – 936 – 256
of which: money market transcations – – – 115 – –
of which: loans – – – 821 – 256
of which: public-sector loans – – – – – 53
of which: other loans – – – 821 – 203
Loans and advances to customers 2 778 54 34 235 2 403
of which: money market transcations – – – – – 53
of which: loans 2 778 54 34 217 1 350
public-sector loans 1 325 – – 18 – 285
mortage-backed loans 1 394 23 18 106 1 28
other loans 59 31 16 93 – 37
Financial assets at fair value through profit or loss 273 – – 63 – 12
of which: Debt securities and other fixed-interest securities 183 – – – – –
of which: Positive fair values from derivatives 79 – – 53 – –
of which: Trading portfolio claims 11 – – 10 – 12
Positive fair values from hedge accounting derivatives 69 – – – – –
Financial assets 2 287 – – – – –
of which: Debt securities and other fixed-interest securities 2 287 – – – – –
of which: Shares and other non fixed-interest securities – – – – – –
Total 5 407 54 34 1 234 2 671

F-109
31 Dec. 2012
(in € million)
Companies
with
significant
influence
Subsidaries Joint
Ventures
Affiliated
companies
Persons
in key
positions
Other
related
parties
Liabilities
Loans and advances to customers – – – 472 – 128
of which: deposits from other banks – – – 158 – 16
Liabilities to customers 260 33 120 101 3 296
of which: money market transcations 45 23 – 21 – 30
Financial liabilities at fair value through profit or loss 51 – – – – 165
of which: negative fair values from derivatives 27 – – – – 16
Subordinated capital – 512 – – – –
Total 311 545 120 573 3 589
Guarantees / sureties received 4 194 – – 5 – –
Guarantees / sureties granted 5251 1 1 12 – 11
1 Jan.–31 Dec. 2012
(in € million)
Companies
with
significant
influence
Subsidaries Joint
Ventures
Affiliated
companies
Persons
in key
positions
Other
related
parties
Interest expenses 45 76 – 29 – 18
Interest income 181 3 1 45 – 23
Commission expenses 24 – – – – –
Commission income – – – 1 – –
Other income and expenses 113 – – – 2 – 5 – 16
Total contributions to income 225 – 73 1 15 – 5 – 11

F-110
As at the balance sheet date there are allowances for loans and advances to associated companies in the amount of
€ 2 million (€ 2 million). Expenses for risk provisioning in the period under review total € 0 million (€ 1 million).
In the item guarantees and sureties received from companies with a significant influence, guarantees in the amount
of € 2,000 million (€ 3,500 million) are reported; these relate to an issue programme (G-MTN) guaranteed
by the states of Lower Saxony and Saxony-Anhalt which serves for the refinancing of the NORD/LB Group. In the
item guarantees and sureties granted to companies with a significant influence, guarantees in the amount of
€ 3,000 million (€ 5,250 million) are reported; these relate to a security pool of loans and advances with which the
aforementioned guarantees received from the states of Lower Saxony and Saxony-Anhalt are secured. The maximum
term of the guarantees is five years.
The table blow shows the maximum balances for NORD/LB transactions with related parties in the period under
review and the previous year.
(in € million) 2013 2012
Assets
Loans and advances to banks 1 037 1 192
Loans and advances to customers 4 302 3 726
Other unsettled assets 2 776 2 936
Total 8 115 7 854
Liabilities
Liabilities to banks 575 791
Liabilties to customers 1 152 2 942
Other unsettled assets 723 1 515
Total 2 450 5 248
Guarantees and sureties received 4 194 4 225
Guarantees and sureties granted 5 271 5 332
The remuneration of persons in key positions is broken down as follows:
(in € million) 31 Dec. 2013 31 Dec. 2012
Employment-related payments due in the short term 5 4
Post-employment payments 1 1
Total remuneration 6 5
Total remuneration of and loans to governing bodies in accordance with commercial law are presented in Note (81)
Remuneration of and Loans to Governing Bodies Remuneration of and Loans to Governing Bodies.

F-111
2. Members of the Supervisory Board
Peter-Jürgen Schneider (Chairman)
Minister of Finance, State of Lower Saxony
(since 19 February 2013)
Hartmut Möllring (Chairman)
(until 19 February 2013)
Thomas Mang (First Deputy Chairman)
President, Association of Savings Bank in Lower Saxony
Jens Bullerjahn (Second Deputy Chairman)
Minister of Finance, State of Saxony-Anhalt
Frank Berg
Chairman of the Managing Board,
OstseeSparkasse Rostock
Norbert Dierkes
Chairman of the Managing Board,
Sparkasse Jerichower Land
Edda Döpke
Bank employee,
NORD/LB Hannover
Ralf Dörries
Senior Vice President,
NORD/LB Hannover
Hans-Heinrich Hahne
Chairman of the Managing Board,
Sparkasse Schaumburg
Frank Hildebrandt
Bank employee,
NORD/LB Braunschweig
Martin Kind
Managing Director
KIND Hörgeräte GmbH & Co. KG
Frank Klingebiel
Mayor, City of Salzgitter
Prof. Dr. Susanne Knorre
Management consultant
(since 1 May 2013)
Ulrich Mädge
Mayor, City of Hansestadt Lüneburg
Antje Niewisch-Lennartz
Minister of Justice, State of Lower Saxony
(since 1 July 2013)
Heinrich von Nathusius
IFA ROTORION – Holding GmbH
Freddy Pedersen
ver.di Vereinte Dienstleistungsgewerkschaft
Jörg Reinbrecht
ver.di Vereinte Dienstleistungsgewerkschaft
Ilse Thonagel
Bank employee
Landesförderinstitut Mecklenburg-Western Pomerania
Mirja Viertelhaus-Koschig
Deputy Chairman of the Managing Board, VIEROL AG
(until 26 April 2013)
Klaus-Peter Wennemann
Management consultant
(until 30 June 2013)
(80) Members of governing bodies and list of mandates
1. Members of the Managing Board
Dr. Gunter Dunkel
(Chairman)
Dr. Johannes-Jörg Riegler
(Deputy Chairman until 28 February 2014)
Ulrike Brouzi
Eckhard Forst
Dr. Hinrich Holm
Christoph Schulz
Thomas Bürkle
(since 1 January 2014)
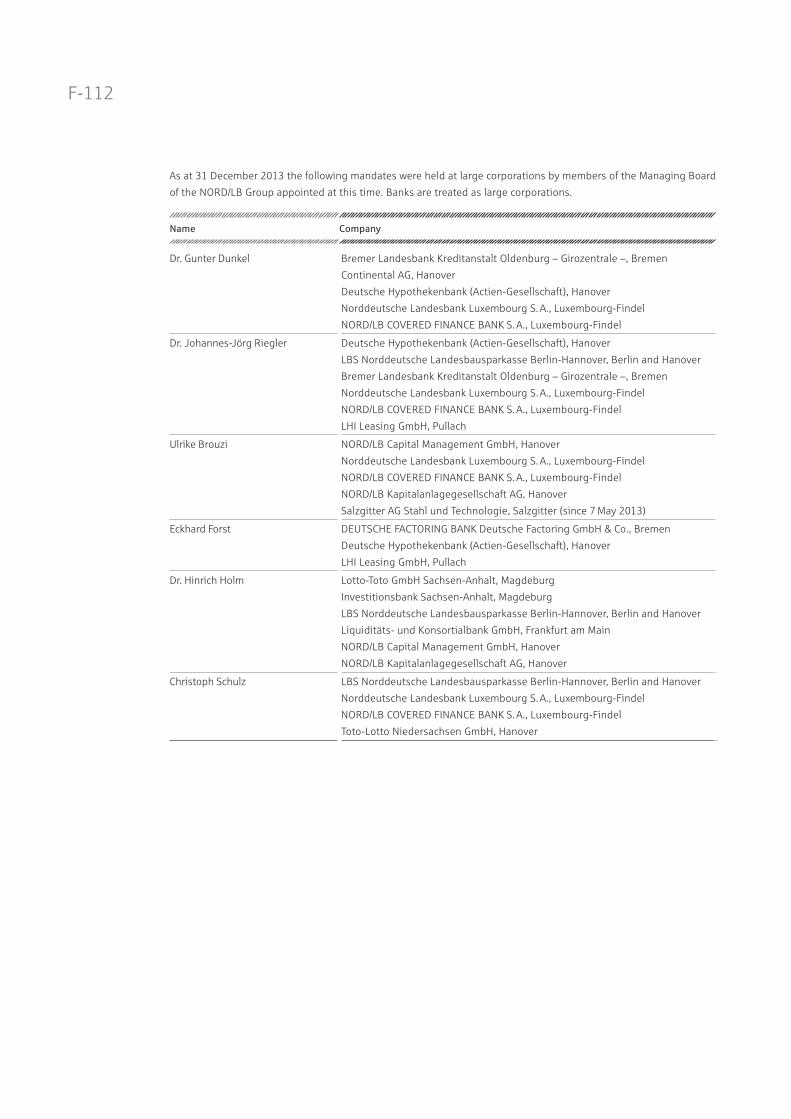
F-112
As at 31 December 2013 the following mandates were held at large corporations by members of the Managing Board
of the NORD/LB Group appointed at this time. Banks are treated as large corporations.
Name Company
Dr. Gunter Dunkel Bremer Landesbank Kreditanstalt Oldenburg – Girozentrale –, Bremen
Continental AG, Hanover
Deutsche Hypothekenbank (Actien-Gesellschaft), Hanover
Norddeutsche Landesbank Luxembourg S. A., Luxembourg-Findel
NORD/LB COVERED FINANCE BANK S. A., Luxembourg-Findel
Dr. Johannes-Jörg Riegler Deutsche Hypothekenbank (Actien-Gesellschaft), Hanover
LBS Norddeutsche Landesbausparkasse Berlin-Hannover, Berlin and Hanover
Bremer Landesbank Kreditanstalt Oldenburg – Girozentrale –, Bremen
Norddeutsche Landesbank Luxembourg S. A., Luxembourg-Findel
NORD/LB COVERED FINANCE BANK S. A., Luxembourg-Findel
LHI Leasing GmbH, Pullach
Ulrike Brouzi NORD/LB Capital Management GmbH, Hanover
Norddeutsche Landesbank Luxembourg S. A., Luxembourg-Findel
NORD/LB COVERED FINANCE BANK S. A., Luxembourg-Findel
NORD/LB Kapitalanlagegesellschaft AG, Hanover
Salzgitter AG Stahl und Technologie, Salzgitter (since 7 May 2013)
Eckhard Forst DEUTSCHE FACTORING BANK Deutsche Factoring GmbH & Co., Bremen
Deutsche Hypothekenbank (Actien-Gesellschaft), Hanover
LHI Leasing GmbH, Pullach
Dr. Hinrich Holm Lotto-Toto GmbH Sachsen-Anhalt, Magdeburg
Investitionsbank Sachsen-Anhalt, Magdeburg
LBS Norddeutsche Landesbausparkasse Berlin-Hannover, Berlin and Hanover
Liquiditäts- und Konsortialbank GmbH, Frankfurt am Main
NORD/LB Capital Management GmbH, Hanover
NORD/LB Kapitalanlagegesellschaft AG, Hanover
Christoph Schulz LBS Norddeutsche Landesbausparkasse Berlin-Hannover, Berlin and Hanover
Norddeutsche Landesbank Luxembourg S. A., Luxembourg-Findel
NORD/LB COVERED FINANCE BANK S. A., Luxembourg-Findel
Toto-Lotto Niedersachsen GmbH, Hanover

F-113
(81) Remuneration of and loans to governing bodies
(in € million) 31 Dec. 2013 31 Dec. 2012
Total emoluments paid to active members of governing bodies
Managing Board 4 4
4 4
Total emoluments paid to former members of governing bodies and their dependants
Managing Board 4 4
4 4
Advance payments, loans and contingencies
Managing Board 1 1
Supervisory Board – 1
1 2
In 2013 commitments were made for remuneration which are not dependent on the occurrence or expiry of future
conditions (€ 1 million).
Pension obligations to previous board members and their surviving dependants exist in the amount of € 52 million
(€ 53 million).
(82) Group auditor’s fees
(in € 000) 31 Dec. 2013 31 Dec. 2012
Group Auditor’s Fees for
the statutory audit 5 187 5 147
other audit-related services 2 098 2 431
tax services – –
other services 1 761 608

F-114
(83) Equity holdings
The list of equity holdings includes all of the companies includes in the consolidated financial statements, the
non-consolidated companies, joint ventures, associated companies and other equity holdings from 20 per cent. The
information on the companies was taken from the most recent available annual financial statements which have been
adopted. The information provided on equity holdings is additional information in accordance with § 315 a of the
German Commercial Code. The previous year’s figures are therefore not reported.
Company name and registered office Shares (%)
direct
Shares (%)
indirect
a) Companies included in the consolidated financial statements
aa) Subsidiaries included in the consolidated financial statements
BLB Grundbesitz KG, Bremen 100.00 –
BLBI Investment GmbH & Co. KG, Bremen 100.00 –
BLB Immobilien GmbH, Bremen 100.00 –
BLB Leasing GmbH, Oldenburg 100.00 –
Braunschweig-Informationstechnologie-GmbH, Braunschweig 100.00 –
Bremer Landesbank Kreditanstalt Oldenburg – Girozentrale –, Bremen – 54.83
Bremische Grundstücks-GmbH, Bremen 100.00 –
Deutsche Hypothekenbank (Actien-Gesellschaft), Hanover – 100.00
KreditServices Nord GmbH, Braunschweig 2) – 100.00
MALIBO GmbH & Co. Unternehmensbeteiligungs KG, Pullach im Isartal – 77.81
Nieba GmbH, Hanover 2) – 100.00
Norddeutsche Landesbank Luxembourg S. A., Luxembourg-Findel / Luxembourg – 100.00
NORD/FM Norddeutsche Facility Management GmbH, Hanover 2) – 100.00
NORD/LB Asset Management Holding GmbH, Hanover – 100.00
NORD/LB Capital Management GmbH, Hanover 100.00 –
NORD/LB COVERED FINANCE BANK S. A., Luxembourg-Findel / Luxembourg 100.00 –
NORD/LB G-MTN S. A., Luxembourg-Findel / Luxembourg – 100.00
NORD/LB Kapitalanlagegesellschaft AG, Hanover 100.00 –
Nord-Ostdeutsche Bankbeteiligungs GmbH, Hanover 2) – 100.00
NORDWEST VERMÖGEN Bremische Grundstücks-GmbH & Co. KG, Bremen 100.00 –
NORDWEST VERMÖGEN Vermietungs-GmbH & Co. KG, Bremen 100.00 –
Öffentliche Facility Management GmbH, Braunschweig 100.00 –
Öffentliche Facility Management Leben GmbH & Co. KG, Braunschweig 100.00 –
Öffentliche Facility Management Sach GmbH & Co. KG, Braunschweig 100.00 –
Öffentliche Lebensversicherung Braunschweig, Braunschweig – 75.00
Öffentliche Sachversicherung Braunschweig, Braunschweig – 75.00
Skandifinanz AG, Zurich / Switzerland 100.00 –

F-115
Company name and registered office Shares (%)
direct
Shares (%)
indirect
ab) Special Purpose Entities included in the consolidated financial statements
Beteiligungs-Kommanditgesellschaft MS „Buxmelody“ Verwaltungs- und Bereederungs GmbH & Co., Buxtehude
– –
DEMURO Grundstücks-Verwaltungsgesellschaft mbH & Co. KG, Pullach im Isartal – –
Fürstenberg Capital Erste GmbH, Fürstenberg – –
Fürstenberg Capital II. GmbH, Fürstenberg – –
GEBAB Ocean Shipping II GmbH & Co. KG, Hamburg – –
GEBAB Ocean Shipping III GmbH & Co. KG, Hamburg – –
Hannover Funding Company LLC, Dover (Delaware) / USA – –
KMU Shipping Invest GmbH, Hamburg – –
MT „BALTIC CHAMPION“ Tankschiffahrtsgesellschaft mbH & Co. KG, Hamburg – –
MT „BALTIC COMMODORE“ Tankschiffahrtsgesellschaft mbH & Co. KG, Hamburg – –
MT „NORDIC SCORPIUS“ Tankschiffahrtsgesellschaft mbH & Co. KG, Hamburg – –
MT „NORDIC SOLAR“ Tankschiffahrtsgesellschaft mbH & Co. KG, Hamburg – –
MT „NORDIC STAR“ Tankschiffahrtsgesellschaft mbH & Co. KG, Hamburg – –
NORD/LB Immobilien-Holding GmbH & Co. Objekt Magdeburg KG, Pullach im Isartal – –
„OLIVIA“ Beteiligungsgesellschaft mbH & Co. KG, Elsfleth – –
„OLYMPIA“ Beteiligungsgesellschaft mbH & Co. KG, Elsfleth – –
„PANDORA“ Beteiligungsgesellschaft mbH & Co. KG, Elsfleth – –
„PRIMAVERA“ Beteiligungsgesellschaft mbH & Co. KG, Elsfleth – –
„QUADRIGA“ Beteiligungsgesellschaft mbH & Co. KG, Elsfleth – –
ac) Investment funds included in the consolidated financial statements
NORD/LB AM 65 – 100.00
NORD/LB AM ALCO – 100.00
NORD/LB AM OELB 100.00 –
NORD/LB AM OESB 100.00 –
ad) Companies / investment funds accounted for in the consolidated financial statements using the equity method
Joint ventures
LHI Leasing GmbH, Pullach im Isartal 5) 43.00 6.00
Affiliated companies
Ammerländer Wohnungsbau-Gesellschaft mbH, Westerstede 32.26 –
BREBAU GmbH, Bremen 48.84 –
Deutsche Factoring Bank Deutsche Factoring GmbH & Co., Bremen 27.50 –
GSG Oldenburg Bau- und Wohngesellschaft mit beschränkter Haftung, Oldenburg 22.22 –
LBS Norddeutsche Landesbausparkasse Berlin-Hannover, Hanover 44.00 –
LINOVO Productions GmbH & Co. KG, Pöcking – 45.17
NORD KB Beteiligungsgesellschaft mit beschränkter Haftung, Hanover – 28.66
SALEG Sachsen-Anhaltinische-Landesentwicklungsgesellschaft mbH, Magdeburg 6) – 56.61
Toto-Lotto Niedersachsen GmbH, Hanover – 49.85
Investment funds
Lazard-Sparkassen Rendite-Plus-Fonds 49.18 –

F-116
Company name and registered office Share of
capital
held (in %)
Equity 1)
(in € 000)
Profit / Loss
(in € 000)
b) Companies not included in the consolidated financial statements with an equity capital of greater or equal +/– € 1 million
BGG Oldenburg GmbH & Co. KG, Bremen 11) 100.00 7 815 910
Braunschweig-Beteiligungsgesellschaft mbH, Braunschweig 12) 100.00 8 597 0
Braunschweig Gesellschaft mit beschränkter Haftung, Braunschweig 2) 11) 100.00 9 061 0
Deutsche Hypo Delaware Blocker Inc,, Wilmington (Delaware) /USA 12) 100.00 7 059 – 2 463
LHI Leasing GmbH & Co. Immobilien KG, Pullach im Isartal 12) 90.00 1 015 21
Norddeutsche Investitionen Beteiligungsgesellschaft mbH, Hanover 12) 100.00 15 290 22
NORD/LB RP Investments LLC, Wilmington (Delaware) / USA 12) 100.00 6 321 3 147
Porzellanmanufaktur FÜRSTENBERG GmbH, Fürstenberg/Weser 2) 11) 98.00 3 088 0
Schiffsbetriebs-Gesellschaft Bremen mbH, Bremen 12) 100.00 1 107 12
Themis 1 Inc., Wilmington (Delaware) / USA 12) 100.00 3 896 – 23
Unterstützungseinrichtung der Bremer Landesbank Kreditanstalt Oldenburg GmbH, Bremen 12) 100.00 32 603 2 215
Vermögensverwaltungsgesellschaft Thiede mit beschränkter Haftung, Braunschweig 2) 11) 100.00 1 278 0
Vermögensverwaltungsgesellschaft Thiede GmbH & Co. Objekt Celle-Altenhagen Vermietungs-KG, Hanover 10) 12) 72.70 – 3 186 523
Vermögensverwaltungsgesellschaft Thiede GmbH & Co. Tiefgarage Stade Vermietungs KG, Hanover 10) 12) 90.00 – 2 834 18
c) Capital share of greater or equal 20 % in companies with an equity capital of greater or equal +/– € 1 million
Joint ventures / affiliated companies / other
Adler Funding LLC, Dover / USA 12) 21.88 5 800 9 802
Bremer Spielcasino GmbH & Co. Kommanditgesellschaft, Bremen 3) 49.00 – –
Brocken Verwaltungs- und Vermietungs-GmbH & Co. KG, Wernigerode 12) 50.00 4 500 415
Bürgschaftsbank Mecklenburg-Vorpommern GmbH, Schwerin 12) 20.89 15 488 192
Bürgschaftsbank Sachsen-Anhalt GmbH, Magdeburg 12) 20.44 12 625 760
Gewobau Gesellschaft für Wohnungsbau, Vechta, mbH, Vechta 12) 20.46 10 854 688
Grundstücksgemeinschaft Escherweg 5 GbR, Bremen 11) 50.00 – 2 319 – 378
Immobilien Development und Beteiligungsgesellschaft Niedersachsen mit beschränkter Haftung IDB & Co. – Objekt Zietenterrassen – KG, Göttingen 7) 12) 52.56 3 353 627
INI International Neuroscience Institute Hannover GmbH, Hanover 15) 22.70 – 11 857 – 726
LUNI Productions GmbH & Co. KG, Pöcking 4) 10) 12) 24.29 – 115 653 – 83
Medical Park Hannover GmbH, Hanover 12) 50.00 2 484 233
Medicis Nexus GmbH & Co. KG, Icking 8) 14) 66.01 9 224 720
Mittelständische Beteiligungsgesellschaft Mecklenburg-Vorpommern mbH, Schwerin 12) 26.00 11 040 837
Mittelständische Beteiligungsgesellschaft Niedersachsen (MBG) mit beschränkter Haftung, Hanover 12) 39.82 10 437 770
NBV Beteiligungs-GmbH, Hamburg 12) 42.66 19 862 2 211
Öffentliche Versicherung Bremen, Bremen 12) 20.00 6 020 60
USPF III Beteiligungsgesellschaft mbH & Co. KG, Düsseldorf 13) 42.86 1 818 338
Wohnungsbaugesellschaft Wesermarsch mit beschränkter Haftung, Brake 12) 21.72 18 785 380
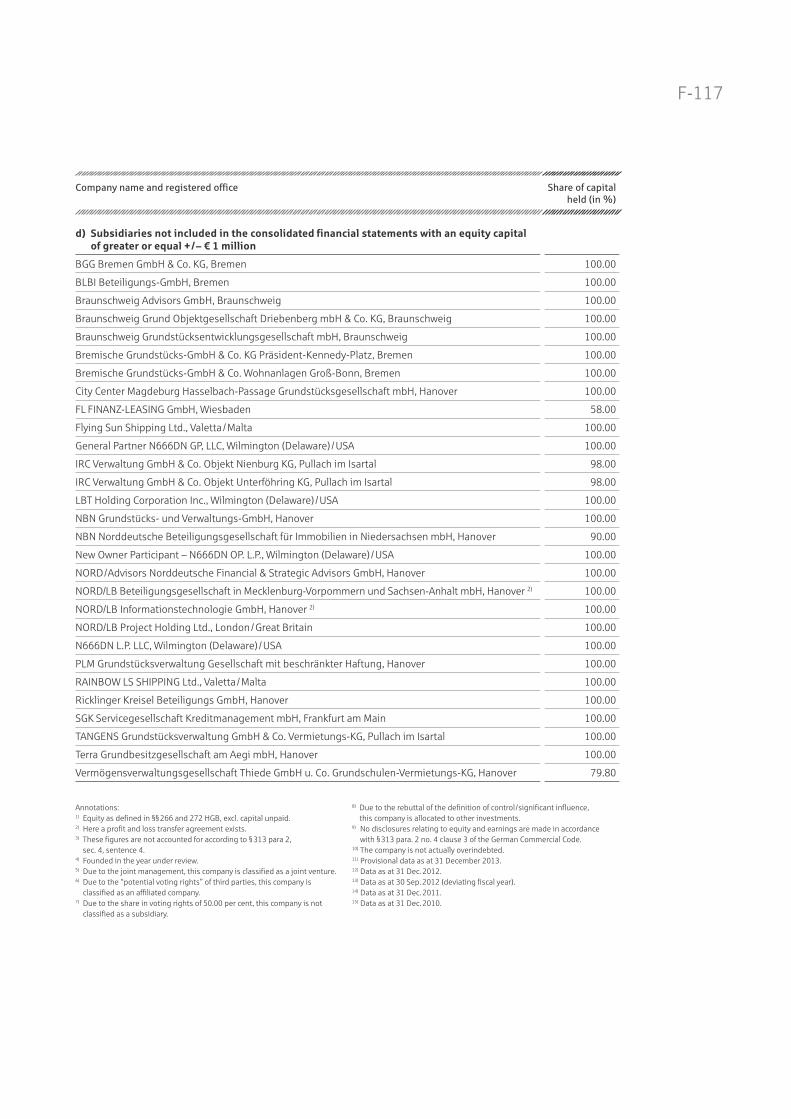
F-117
Company name and registered office Share of capital
held (in %)
d) Subsidiaries not included in the consolidated financial statements with an equity capital of greater or equal +/– € 1 million
BGG Bremen GmbH & Co. KG, Bremen 100.00
BLBI Beteiligungs-GmbH, Bremen 100.00
Braunschweig Advisors GmbH, Braunschweig 100.00
Braunschweig Grund Objektgesellschaft Driebenberg mbH & Co. KG, Braunschweig 100.00
Braunschweig Grundstücksentwicklungsgesellschaft mbH, Braunschweig 100.00
Bremische Grundstücks-GmbH & Co. KG Präsident-Kennedy-Platz, Bremen 100.00
Bremische Grundstücks-GmbH & Co. Wohnanlagen Groß-Bonn, Bremen 100.00
City Center Magdeburg Hasselbach-Passage Grundstücksgesellschaft mbH, Hanover 100.00
FL FINANZ-LEASING GmbH, Wiesbaden 58.00
Flying Sun Shipping Ltd., Valetta / Malta 100.00
General Partner N666DN GP, LLC, Wilmington (Delaware) / USA 100.00
IRC Verwaltung GmbH & Co. Objekt Nienburg KG, Pullach im Isartal 98.00
IRC Verwaltung GmbH & Co. Objekt Unterföhring KG, Pullach im Isartal 98.00
LBT Holding Corporation Inc., Wilmington (Delaware) / USA 100.00
NBN Grundstücks- und Verwaltungs-GmbH, Hanover 100.00
NBN Norddeutsche Beteiligungsgesellschaft für Immobilien in Niedersachsen mbH, Hanover 90.00
New Owner Participant – N666DN OP. L.P., Wilmington (Delaware) / USA 100.00
NORD/Advisors Norddeutsche Financial & Strategic Advisors GmbH, Hanover 100.00
NORD/LB Beteiligungsgesellschaft in Mecklenburg-Vorpommern und Sachsen-Anhalt mbH, Hanover 2) 100.00
NORD/LB Informationstechnologie GmbH, Hanover 2) 100.00
NORD/LB Project Holding Ltd., London / Great Britain 100.00
N666DN L.P. LLC, Wilmington (Delaware) / USA 100.00
PLM Grundstücksverwaltung Gesellschaft mit beschränkter Haftung, Hanover 100.00
RAINBOW LS SHIPPING Ltd., Valetta / Malta 100.00
Ricklinger Kreisel Beteiligungs GmbH, Hanover 100.00
SGK Servicegesellschaft Kreditmanagement mbH, Frankfurt am Main 100.00
TANGENS Grundstücksverwaltung GmbH & Co. Vermietungs-KG, Pullach im Isartal 100.00
Terra Grundbesitzgesellschaft am Aegi mbH, Hanover 100.00
Vermögensverwaltungsgesellschaft Thiede GmbH u. Co. Grundschulen-Vermietungs-KG, Hanover 79.80
Annotations: 1) Equity as defined in §§ 266 and 272 HGB, excl. capital unpaid.2) Here a profit and loss transfer agreement exists.3) These figures are not accounted for according to § 313 para 2,
sec. 4, sentence 4.4) Founded in the year under review.5) Due to the joint management, this company is classified as a joint venture.6) Due to the “potential voting rights” of third parties, this company is
classified as an affiliated company.7) Due to the share in voting rights of 50.00 per cent, this company is not
classified as a subsidiary.
8) Due to the rebuttal of the definition of control /significant influence, this company is allocated to other investments.
9) No disclosures relating to equity and earnings are made in accordance with § 313 para. 2 no. 4 clause 3 of the German Commercial Code.
10) The company is not actually overindebted.11) Provisional data as at 31 December 2013.12) Data as at 31 Dec. 2012.13) Data as at 30 Sep. 2012 (deviating fiscal year).14) Data as at 31 Dec. 2011.15) Data as at 31 Dec. 2010.

F-118
The group management report is neither included nor
incorporated by reference into this Prospectus.

F-119
AUDITOR’S REPORT
“We have audited the consolidated financial statements prepared by the Norddeutsche Landesbank – Girozentrale –,
Hanover, Braunschweig and Magdeburg (NORD/LB), comprising the balance sheet, the income statement, the notes
to the financial statements, the cash-flow statement and the statement of changes in equity, as well as the Group
management report for the business year from 1 January to 31 December 2013. The preparation of the consolidated
financial statements and the Group management report in accordance with IFRSs, as adopted by the EU, and
the additional requirements of German commercial law pursuant to § 315a Abs. 1 HGB (Handelsgesetzbuch “German
Commercial Code”) and the supplementary provisions of the articles of incorporation are the responsibility of the
parent company’s management. Our responsibility is to express an opinion on the consolidated financial statements
and the on Group management report based on our audit.
We conducted our audit of the consolidated financial statements in accordance with § 317 HGB (Handelsgesetzbuch
“German Commercial Code”) and German generally accepted standards for the audit of financial statements
promulgated by the Institut der Wirtschaftsprüfer (Institute of Public Auditors in Germany) (IDW). These standards
require that we plan and conduct the audit such that misstatements materially affecting the presentation of the net
assets, financial position and results of operations in the consolidated financial statements in accordance with the
applicable financial reporting framework and in the Group management report are detected with reasonable
assurance. Knowledge of the business activities and the economic and legal environment of the Group and expecta-
tions as to possible misstatements are taken into account in the determination of audit procedures. The effectiveness
of the accounting-related internal control system and the evidence supporting the disclosures in the consolidated
financial statements and the Group management report are examined primarily on a test basis within the framework
of the audit. The audit includes assessing the annual financial statements of those entities included in consolidation,
the determination of entities to be included in consolidation, the accounting and consolidation principles used and
significant estimates made by management, as well as evaluating the overall presentation of the consolidated
financial statements and the Group management report. We believe that our audit provides a reasonable basis for
our opinion.
Our audit has not led to any reservations.
In our report, based on the findings of our audit, the consolidated financial statements comply with IFRSs, as adopted
by the EU, and additional requirements of German commercial law pursuant to § 315a Abs. 1 HGB as well as the
supplementary provisions of the articles of incorporation and give a true and fair view of the net assets, financial
position and results of operations of the Group in accordance with these requirements. The Group management
report is consistent with the consolidated financial statements and as a whole provides a suitable view of the Group’s
position and suitably presents the opportunities and risks of future development.”
Hanover, 31 March 2014
KPMG AG
Wirtschaftsprüfungsgesellschaft
Ufer
Wirtschaftsprüfer
[German Public Auditor]
Leitz
Wirtschaftsprüfer
[German Public Auditor]

F-120 (page intentionally left blank)
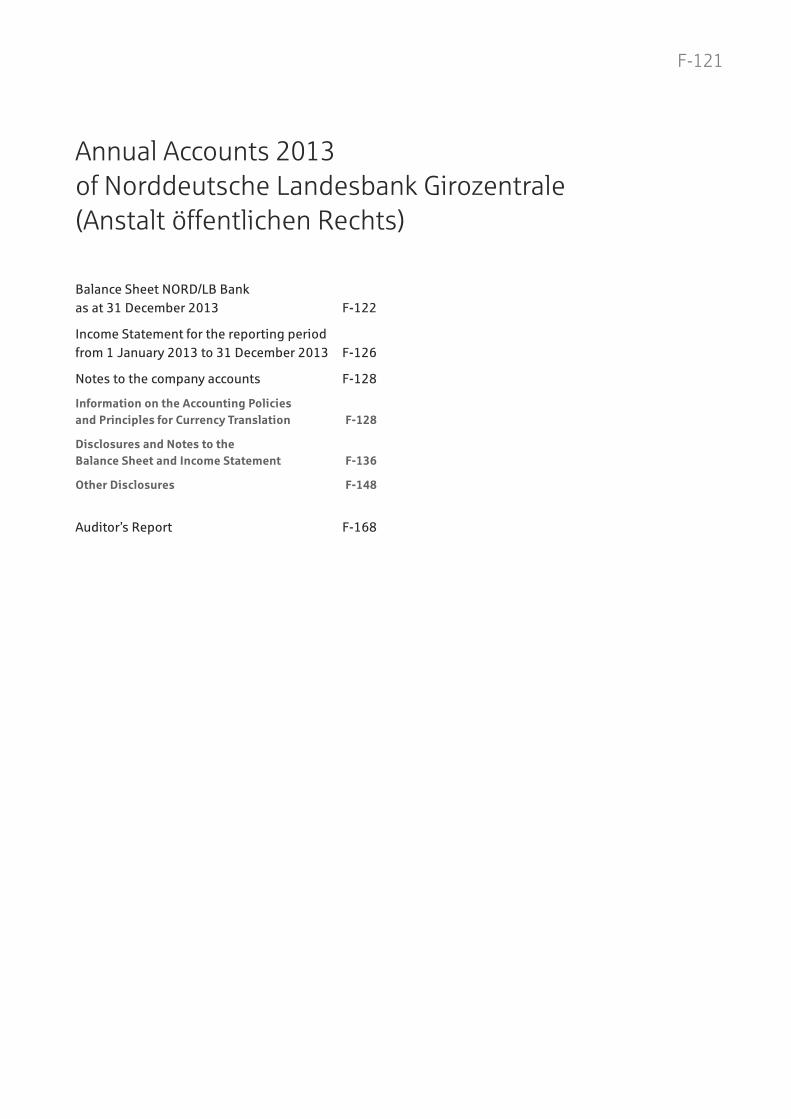
F-121
Annual Accounts 2013of Norddeutsche Landesbank Girozentrale(Anstalt öffentlichen Rechts)
Balance Sheet NORD/LB Bank
as at 31 December 2013 F-122
Income Statement for the reporting period
from 1 January 2013 to 31 December 2013 F-126
Notes to the company accounts F-128
Information on the Accounting Policies
and Principles for Currency Translation F-128
Disclosures and Notes to the
Balance Sheet and Income Statement F-136
Other Disclosures F-148
Auditor!s Report F-168
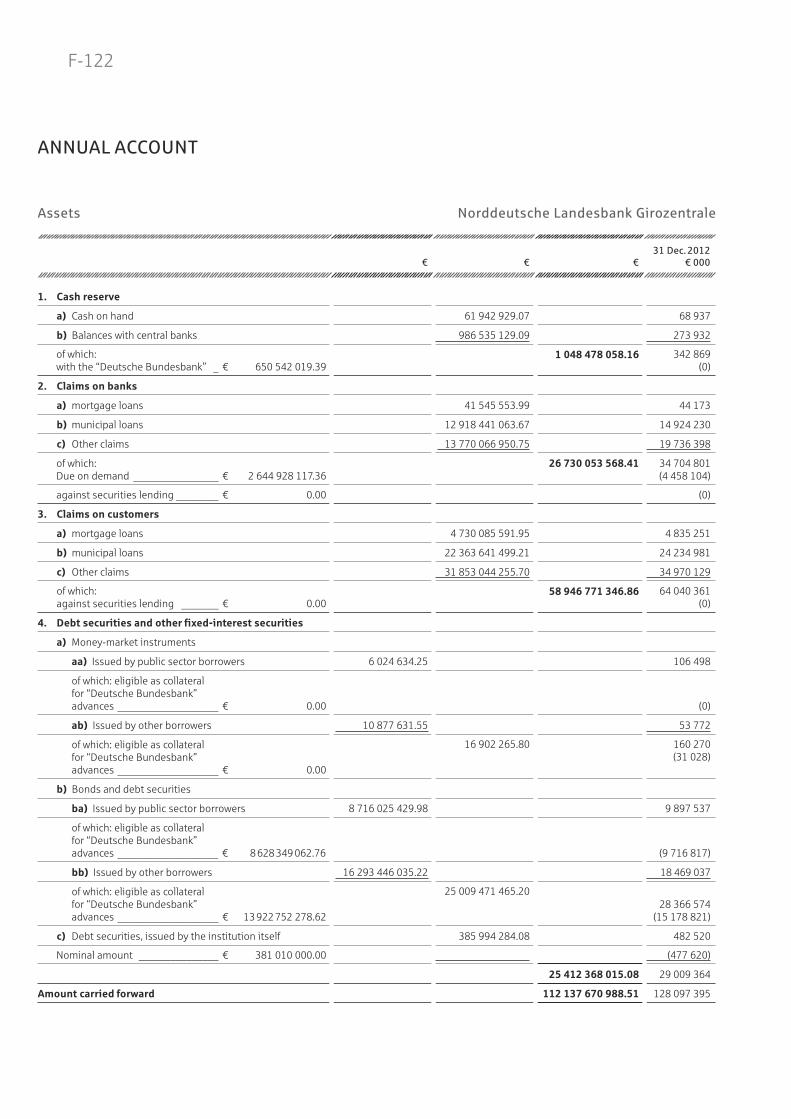
F-122
Assets Norddeutsche Landesbank Girozentrale
€ € €
31 Dec. 2012
€ 000
1. Cash reserve
a) Cash on hand 61 942 929.07 68 937
b) Balances with central banks 986 535 129.09 273 932
of which: with the “Deutsche Bundesbank” _ € 650 542 019.39
1 048 478 058.16 342 869 (0)
2. Claims on banks
a) mortgage loans 41 545 553.99 44 173
b) municipal loans 12 918 441 063.67 14 924 230
c) Other claims 13 770 066 950.75 19 736 398
of which: Due on demand ________________ € 2 644 928 117.36
26 730 053 568.41 34 704 801 (4 458 104)
against securities lending ________ € 0.00 (0)
3. Claims on customers
a) mortgage loans 4 730 085 591.95 4 835 251
b) municipal loans 22 363 641 499.21 24 234 981
c) Other claims 31 853 044 255.70 34 970 129
of which: against securities lending _______ € 0.00
58 946 771 346.86 64 040 361(0)
4. Debt securities and other fixed-interest securities
a) Money-market instruments
aa) Issued by public sector borrowers 6 024 634.25 106 498
of which: eligible as collateral for “Deutsche Bundesbank” advances ___________________ € 0.00 (0)
ab) Issued by other borrowers 10 877 631.55 53 772
of which: eligible as collateral for “Deutsche Bundesbank” advances ___________________ € 0.00
16 902 265.80 160 270 (31 028)
b) Bonds and debt securities
ba) Issued by public sector borrowers 8 716 025 429.98 9 897 537
of which: eligible as collateral for “Deutsche Bundesbank” advances ___________________ € 8 628 349 062.76 (9 716 817)
bb) Issued by other borrowers 16 293 446 035.22 18 469 037
of which: eligible as collateral for “Deutsche Bundesbank” advances ___________________ € 13 922 752 278.62
25 009 471 465.2028 366 574
(15 178 821)
c) Debt securities, issued by the institution itself 385 994 284.08 482 520
Nominal amount _______________ € 381 010 000.00 (477 620)
25 412 368 015.08 29 009 364
Amount carried forward 112 137 670 988.51 128 097 395
ANNUAL ACCOUNT

F-123
Balance Sheet NORD/LB Bank as at 31 December 2013 Assets
€ € €
31 Dec. 2012
€ 000
Amount carried forward 112 137 670 988.51 128 097 395
5. Shares and other non fixed-interest securities 1 208 606 134.06 1 200 973
5a. Trading portfolio 8 827 061 040.36 9 520 524
6. Participating interests 94 779 775.19 110 755
of which: in banks ______________________ € 4 197 333.41 (4 197)
in financial institutions __________ € 2 226 223.31 (1 984)
7. Investments in affiliated companies 1 952 346 089.45 1 966 728
of which: in banks ______________________ € 1 407 729 003.38 (1 407 729)
in financial institutions __________ € 0.00 (0)
8. Assets held in trust 4 542 444 137.83 4 546 438
of which: loans on a trust basis ___ € 4 542 444 137.83 (4 546 438 )
9. Intangible assets
a) internally generated industrial property rights and similar rights and values 50 230 967.55 56 288
b) Concessions, industrial property rights and similar rights and values including its licences against payment 32 511 529.83 17 299
c) Goodwill 0.00 0
d) Advance payments made 68 351.5982 810 848.97
5873 645
10. Tangible assets 218 857 871.15 212 901
11. Other assets 1 432 221 223.37 1 962 118
12. Prepaid expenses
a) from new issue and lending business 449 638 115.67 524 967
b) other 673 648 403.001 123 286 518.67
629 878 1 154 845
Total assets 131 620 084 627.56 148 846 322

F-124
Liabilities Norddeutsche Landesbank Girozentrale
€ € €
31 Dec. 2012
€ 000
1. Liabilities to banks
a) issued registered mortgage Pfandbriefe 50 865 490.41 25 310
b) issued registered public sector Pfandbriefe 1 245 552 229.64 1 795 130
c) other liabilities 39 535 971 386.69 44 853 235
40 832 389 106.74 46 673 675
of which:Due on demand _______________ € 5 111 391 163.09 (6 891 043)
ensuring loans taken up registered mortgage Pfandbriefe
transferred to lender ___________ € 0.00 (0)
and registered public sector Pfandbriefe ___________________ € 342 405 906.16 (710 558)
2. Liabilities to customers
a) issued registered mortgage Pfandbriefe 360 524 329.53 401 118
b) issued registered public sector Pfandbriefe 9 838 050 761.78 10 691 486
c) Savings deposits
ca) with an agreed notice period more than three months 1 369 325 463.27 750 718
cb) with an agreed notice period more than three months 332 392 228.47 1 701 717 691.74 394 510
d) Other liabilities 25 209 432 688.48 24 702 122
37 109 725 471.53 36 939 954
of which:Due on demand _______________ € 12 248 846 833.33 (11 180 159)
ensuring loans taken up
registered mortgage Pfandbriefe transferred to lender ___________ € 0.00 (0)
and registered public sectorPfandbriefe ___________________ € 0.00 (96)
3. Securitised liabilities
a) Issued debt securities
aa) mortgage Pfandbriefe 1 742 123 594.88 2 104 137
ab) public sector Pfandbriefe 8 575 028 612.38 10 833 267
ac) other debentures 21 886 320 253.60 32 203 472 460.86 27 659 847
b) Other securitised liabilities 418 855 163.65 320 569
32 622 327 624.51 40 917 820
of which:money-market instruments _____ € 234 652 940.52 (124 827)
3a. Trading portfolio 2 295 562 207.46 4 568 551
4. Liabilities held in trust 4 542 444 137.83 4 546 438
of which: loans on a trust basis __ € 4 542 444 137.83 (4 546 438)
5. Other liabilities 1 483 912 600.64 2 366 328
Amount carried forward 118 886 361 148.71 136 012 766

F-125
Balance Sheet NORD/LB Bank as at 31 December 2013 Liabilities
€ € €
31 Dec. 2012
€ 000
Amount carried forward 118 886 361 148.71 136 012 766
6. Deferred income
a) from new issue and lending business 521 200 873.48 397 794
b) other 406 736 653.94 491 407
927 937 527.42 889 201
7. Provisions
a) Provisions for pensions and similar obligations 828 704 123.55 761 295
b) Tax provisions 105 260 263.48 154 643
c) Other provisions 418 010 205.93 415 681
1 351 974 592.96 1 331 619
8. Subordinated liabilities 2 667 537 538.89 2 525 938
9. Participatory capital 115 000 000.00 115 000
of which: there of falling duein less than two years __________ € 55 000 000.00 (20 000)
10. Funds for general banking risks 927 632 805.66 927 633
of which: special item for general banking risks in accordance with § 340e, para. 4 of the German Commercial Code _ € 75 000 000.00 (75 000)
11. Equity
a) Subscribed capital
aa) Share capital 1 607 257 810.00 1 607 258
ab) Capital contribution as per § 15 para. 1 State treaty 0.00 0
ac) Other Capital contributions 896 270 092.14 2 503 527 902.14 1 351 423
b) Capital reserves
ba) Contribution as per § 15 para. 1 State treaty 0.00 0
bb) other reserves 3 324 313 451.76 3 324 313 451.76 3 324 313
c) Retained earnings 692 571 355.06 687 502
d) Profit shown on the balance sheet after appropriation to or transfer from reserves 223 228 304.96 73 669
6 743 641 013.92 7 044 165
Total liabilities 131 620 084 627.56 148 846 322
1. Contingent liabilities
a) Contingent liabilities under rediscounted bills of exchange 0.00 0
b) Liabilities from guarantees andother indemnity agreements 5 288 696 191.04 5 839 988
c) Liabilities from assets pledged as collateralfor third-party liabilities 0.00 0
5 288 696 191.04 5 839 988
2. Other obligations
a) Repurchase obligations from non-genuinepartial repurchase agreements 0.00 0
b) Placement and underwriting obligations 0.00 0
c) Irrevocable credit commitments 8 229 815 062.00 7 009 802
8 229 815 062.00 7 009 802
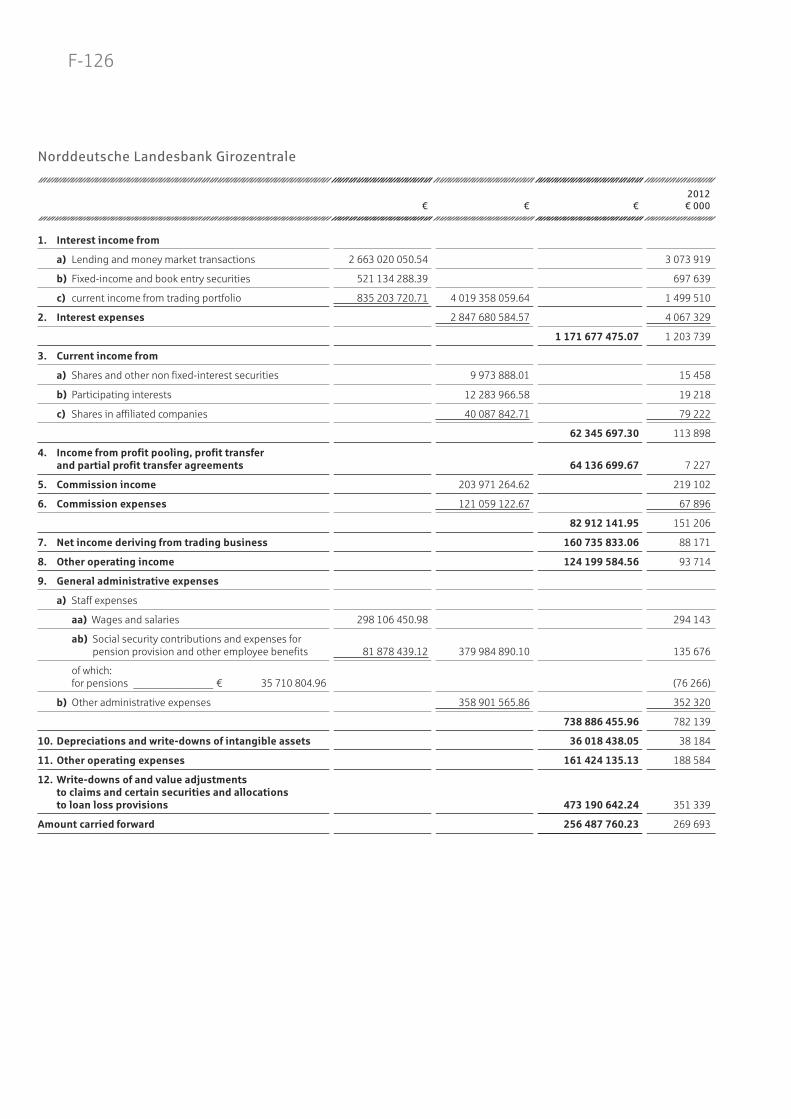
F-126
Norddeutsche Landesbank Girozentrale
€ € €
2012
€ 000
1. Interest income from
a) Lending and money market transactions 2 663 020 050.54 3 073 919
b) Fixed-income and book entry securities 521 134 288.39 697 639
c) current income from trading portfolio 835 203 720.71 4 019 358 059.64 1 499 510
2. Interest expenses 2 847 680 584.57 4 067 329
1 171 677 475.07 1 203 739
3. Current income from
a) Shares and other non fixed-interest securities 9 973 888.01 15 458
b) Participating interests 12 283 966.58 19 218
c) Shares in affiliated companies 40 087 842.71 79 222
62 345 697.30 113 898
4. Income from profit pooling, profit transfer and partial profit transfer agreements 64 136 699.67 7 227
5. Commission income 203 971 264.62 219 102
6. Commission expenses 121 059 122.67 67 896
82 912 141.95 151 206
7. Net income deriving from trading business 160 735 833.06 88 171
8. Other operating income 124 199 584.56 93 714
9. General administrative expenses
a) Staff expenses
aa) Wages and salaries 298 106 450.98 294 143
ab) Social security contributions and expenses for pension provision and other employee benefits 81 878 439.12 379 984 890.10 135 676
of which:for pensions _______________ € 35 710 804.96 (76 266)
b) Other administrative expenses 358 901 565.86 352 320
738 886 455.96 782 139
10. Depreciations and write-downs of intangible assets 36 018 438.05 38 184
11. Other operating expenses 161 424 135.13 188 584
12. Write-downs of and value adjustments to claims and certain securities and allocations to loan loss provisions 473 190 642.24 351 339
Amount carried forward 256 487 760.23 269 693

F-127
Income Statement for the reporting period from 1 January 2013 to 31 December 2013
€ € €
2012
€ 000
Amount carried forward 256 487 760.23 269 693
13. Depreciations and write-downs to investments, investments in affiliated companiesand securities treated as fixed assets 0.00 18 042
14. Earnings from write-ups to claims and certain securities and allocations to loan loss provisions 9 257 376.26 0
15. Expenses on assumption of losses 7 845 094.21 9 974
16. Profit on ordinary activities 257 900 042.28 269 693
17. Extraordinary income 0.00 0
18. Extraordinary expenses 46 546 440.32 42 035
19. Extraordinary result – 46 546 440.32 – 42 035
20. Refund from income taxes – 6 766 228.03 55 928
21. Refund from other taxes not show under item 11 – 7 138 370.32 1 651
– 13 904 598.35 57 579
22. Income from profit pooling, profit transfer and partial profit transfer agreements 70 629 895.35 97 341
23. Annual profit 154 628 304.96 72 738
24. Earnings brought forward from the previous year 68 600 000.00 931
25. Profit 223 228 304.96 73 669

F-128
I. INFORMATION ON THE ACCOUNTING POLICIES AND
PRINCIPLES FOR CURRENCY TRANSLATION
(Previous year figures for the 2013 accounting period or as at 31 December 2012 are shown in brackets.)
Principles for the Preparation of the Annual Financial Statements
The annual financial statements of Norddeutsche Landesbank Girozentrale Hannover, Braunschweig, Magdeburg,
(NORD/LB) as at 31 December 2013 were prepared in accordance with the regulations of the German Commercial
Code (Handelsgesetzbuch, HGB), the German Accounting Regulation for Credit and Financial Services Institutions
(Kredit instituts-Rechnungslegungsverordnung, RechKredV) and the Covered Bond Act (Pfandbriefgesetz, PfandBG).
The structure of the balance sheet and the income statement is based on the RechKredV.
The balance sheet has been prepared in accordance with § 268 para. 1 of the German Commercial Code taking into
account partial appropriation of the annual profit.
Against the background of the European Banking Authority’s (EBA) tighter requirements concerning minimum core
capital for banks and the future Basel III requirements, NORD/LB has agreed a capital-boosting programme with its
owners. Significant components of this capital-boosting programme from 2012 were continued in the year under
review (limiting of risk-weighted assets, the retention of profits, optimisation of the equity structure). In order for the
capital measures to be implemented in 2012, the measures needed to be reviewed and approved by the EU Commis-
sion on the basis of a restructuring plan submitted by NORD/LB. One of these measures concerns the guaranteed
provided by the states of Lower Saxony and Saxony-Anhalt for the mezzanine tranch of a credit portfolio of NORD/LB
brought into a securitisation structure. The guarantee will be paid for by NORD/LB in the form of a premium to be
reported under commission expenses. Further commitments by NORD/LB in connection with the restructuring plan
continued to have an effect in 2013. These include in particular the requirement that the profits for 2012 and 2013 be
retained and an efficiency improvement programme, for which costs were again incurred in 2013 and which are
reported in restructuring expenses.

F-129
Accounting Policies – Trading Portfolio
Financial instruments in the trading portfolio are valued in accordance with § 340e para. 3 clause 1 of the German
Commercial Code at fair value less a risk premium. The change in fair value compared to the previous balance sheet
date or compared to the acquisition cost, the valuation result, is recorded under the item net income or net expenses
of the trading portfolio. Expenses relating to the allocation to the special item in accordance with § 340e para. 4 of the
German Commercial Code are not reported under net income or net expenses of the trading portfolio, but under the
item “expenses relating to the allocation to the funds for general banking risks”. As regards the calculation of the fair
values, the chapter “Calculation of fair values” is referred to.
The current interest income and expenses relating to trading transactions are shown under interest income. Dividend
income from trading transactions is recorded under the item “current income from shares and other non fixed-interest
securities”.
As there is currently no difference in terms of balance between the trading portfolio reported in the balance sheet and
the regulatory trading book, NORD/LB has used the Value-at-Risk (VaR) calculated for regulatory purposes directly
as a risk premium in terms of § 340e para. 3 clause 1 of the German Commercial Code, i.e. it has deducted the VaR
value calculated for regulatory purposes from trading assets. The method used to calculate the VaR is the historical
simulation method.
The VaR parameters used in accordance with banking regulations, and which are therefore also relevant for reporting
in accordance with commercial law, are:
• Use of a correlated VaR for the following risk types:
– General interest-rate risk
– Specific interest-rate risk (issuer-specific credit-spread risk, no risk of default)
– Currency risk
– Share-price risk
– Option price risk
• Confidence level: 99 %
• Holding period: 10 days
• Monitoring period: 1 year
The average rate is used for the valuation of the trading portfolio. The effects of the inclusion of counterparty-specific
default risks for OTC derivatives are also reported. The bank also uses OIS discounting for the valuation of secured OTC
derivatives where OIS discounting has developed at the current market standard.
F-130
Accounting Policies – Non-Trading Portfolio (Banking Book)
The cash reserve is reported at nominal value.
Loans and advances to customers and banks are reported at nominal value or at acquisition cost. If there are differ-
ences between the nominal values and the amounts paid out for mortgage loans and other loans and advances which
are of an interest nature, the items are reported at nominal value in accordance with § 340e para. 2 of the German
Commercial Code. The differences are reported under prepaid expenses and are liquidated in a scheduled write-back.
Sufficient consideration is given to identifiable risks in lending business by making specific valuation allowances
and provisions. The provisions for national loan loss provisions risks were calculated based on principles which have
not changed. Appropriate lumpsum loan loss provisions have been made for other general credit risks. Lumpsum
loan loss provisions are still calculated in accordance with the communiqués of the BFA 1 /1990 and the BMF Circular
of 10 January 1994.
Securities in the liquidity reserve are valued in accordance with the strict lower-of-cost-or-market principle. Securities
in fixed assets are valued at acquisition cost in accordance with the mitigated lower-of-cost-or-market principle
provided that they are not the subject of a likely permanent loss in value.
Structured products are broken down into their components (basic instrument and embedded derivatives) in accord-
ance with IDW RS HFA 22 and reported separately. The relevant accounting methods are applied for the components.
The separate derivatives are considered in the loss-free valuation of the banking book or included in valuation units.
Structured products that are valued at fair value or in accordance with the strict lower-of-cost-or-market principle are
not reported separately.
Option premiums and future-margin payments relating to transactions not yet due and pro-rata interest relating to
interest rate swap transactions are reported under other assets or other liabilities; amounts relating to interest rate
caps which have not yet been amortised and up-front amounts relating to interest rate swap transactions are included
under prepaid expenses.
Credit default swaps (CDS) where the bank is the provider of security are treated in the balance sheet using the same
procedure as for contingent assets and liabilities relating to sureties and guarantees. If it is expected that a CDS will
be used, a provision is made. Earnings components relating to CDS where the bank is the provider of security are
reported under commission income. If CDS were transacted to hedge securities (the bank is the provider of security),
the hedge effect of the CDS is considered when assessing the write-down requirement for the security. The risk of a
doubtful credit rating for the provider of security (the counterparty in the CDS contract) is to be considered separately;
this is done using the same procedure as for a guarantee. Earnings components relating to CDS where the bank is the
recipient of security are reported under interest income.
In cases in which risks from the non-trading portfolio are transferred to the trading portfolio, internal transactions are,
like external transactions, considered under commercial law in accordance with the deputisation principle.
Investments and investments in affiliated companies are reported at acquisition cost or at the lower fair value in the
case of permanent impairment. If the reasons for unscheduled depreciation no longer exist, the value is written up to
no more than the acquisition cost.
The Öffentliche Versicherung Braunschweig (ÖVBS) dividend concerns the constant payment of interest on the
respective guarantor capital which is only slightly dependent on the business performance of ÖVBS. This fact is taken
into account by the change in the valuation method in the form of the underlying discounting factor.

F-131
Property, plant and equipment are reported at acquisition cost and, if they have a finite useful life, are subject to
scheduled depreciation. The useful life is based on the tax options. There was no unscheduled depreciation in
accordance with § 253 para. 3 clause 3 of the German Commercial Code in the year under review. Fixed assets with an
acquisition cost of between € 150 and € 1,000 are capitalised under a collective item and depreciated at a flat rate of
20 per cent per annum over five years. Low-value fixed assets with an acquisition cost of up to € 150 are written off
completely in the year of acquisition.
NORD/LB has made use of the option in accordance with § 248 para. 2 of the German Commercial Code and reported
self-made intangible fixed assets. Here the external costs incurred during the development phase and internal
development services are recognised. The useful life of self-made software is set at five years.
Where it is likely that a permanent loss in value has occurred, NORD/LB reduces the value with unscheduled deprecia-
tion. If the reasons for this no longer exist, the value is written up to no more than the amortised cost.
Liabilities to customers and banks are reported at their settlement values. The differences between borrowing and
repayment amounts of an interest nature are reported under prepaid expenses and are liquidated according to
schedule.
Zero bonds are reported at their market price when issued plus a mark-up for interest in line with the yield on the
acquisition price.
Provisions are valued at the necessary settlement value based on reasonable commercial assessment. Provisions with
a term of more than one year are discounted using the average market interest rate relevant for the residual term
calculated and published by the Deutsche Bundesbank in accordance with the Provisions Discounting Regulation
(Rückstellungsabzinsungsverordnung, RückAbzinsV). Income and expenses from the discounting of provisions are
reported under other operating income and expenses.
The bank makes use of the option to offset expenses and income in accordance with § 340 f para. 3 of the German
Commercial Code.
Unlike in the previous year, interest income from valuation allowances on loans (unwinding) in the amount of
$ 45.1 million ($ 33.6 million) are no longer reported under “income from write-ups of receivables and certain securi-
ties and the reversal of loan loss provisions”, but under “interest income from lending and money market trans-
actions”, to achieve a better transparency and for controlling the net interest income.
Calculation of Fair Values
Fair values have to be calculated on the one hand for accounting purposes (valuation of derivative and non-derivative
financial instruments in the trading portfolio at fair value) and on the other hand for disclosure purposes (disclosure
of the fair value for derivative financial instruments in the asset portfolio). For both purposes the fair values are
calculated in the same way as follows.
For financial instruments traded on an active market the fair value corresponds directly to the stock-exchange or
market price, i.e. in this case no adjustments or present value calculations are made to calculate the fair value.
If publicly-listed stock-exchange prices are available, these are used; otherwise other price sources are used
(e.g. prices quoted by market makers). Examples of financial instruments traded on an active market at NORD/LB are
securities, options and futures traded on the stock exchange.

F-132
In all other cases the fair value is calculated using generally accepted valuation methods. The generally accepted
valuation methods used by NORD/LB include in the area of derivative and non-derivative trading transactions the
following methods:
Valuation method Application Significant input parameters
Discounted Cashflow Method
Illiquid interest-bearing Securities Swap curves, Credit rating information
Credit Default Swaps Swap curves, credit-spreads and where applicable credit rating information
Interest-rate swaps, FRAs Swap curves
Securities forward contracts Contract data, specific securities forward prices, swap curves
Interest-rate currency swaps, Forward exchange contracts
transactions
Swap curves in the currencies exchanged, basic swap spreads, exchange rate
Hull & White Model for Options
Bermudan swaptions Volatility of the underlying market price, risk-free interest rate, swap rate, mean reversion
Black-Scholes Model FX options Exchange rates volatility of the underlying market price,
risk-free interest rate for both currencies
OTC share options(European)
Volatility of the underlying market price, risk-free interest rate, underlying (share), dividends
Barone-Adesi, Whaley-Modell
OTC share options(American)
Volatility of the underlying market price, risk-free interest rate, underlying (share), dividends
Black-76 Model Caps and floorsSwaptions
Bond options
Exchange rates volatility of the underlying market price,
risk-free interest rate
CVA/DVA Add-On Method All derivatives Internal ratings, swap curves
The significant input parameters were reliably established for all of the trading transactions valued using the
above-mentioned valuation methods; there were no cases at NORD/LB where it was not possible to calculate the
fair value.
Accounting of Securities Lending
NORD/LB assigns the beneficial ownership in securities lending to the lender. The consequence of this is that lent
securities remain in the balance sheet of NORD/LB and are valued in accordance with the valuation rules of the
respective security category (they often concern securities in the trading portfolio). If NORD/LB borrows securities, the
securities are not reported by NORD/LB as the economic benefit has not been assigned to it.
Pension Obligations
NORD/LB’s pension obligations have been valued in accordance with the projected unit credit method since the
German Accounting Law Modernisation Act (Bilanzrechtsmodernisierungsgesetz, BilMoG) came into effect. Using this
method current pensions as at the balance sheet date and the part apportioned to the period of employment served
to date, the defined benefit obligation, are valued. Increases which are expected in the future due to increases in sal-
ary or pension adjustments which are apportionable here are also considered. The defined benefit obligation is calcu-
lated by the expected future benefit (the settlement value in terms of § 253 para. 1 clause 2 of the German Commercial
Code) being discounted in accordance with § 253 para. 2 of the German Commercial Code with the average market
interest rate for the previous seven years. In the process the simplification rule in accordance with § 253 para. 2 clause
2 of the German Commercial Code is used and the interest rate is set at a flat rate for a remaining term of 15 years.

F-133
When calculating the pension obligations the following assumptions were used for the bank in Germany:
31 Dec. 2013 31 Dec.2012
Interest rate 4.88 % 5.04 % 1)
Salary increases 2.00 % p.a. 2.00 % p.a.
Pension increases 2.75 %/2.87 %/1.00 % 2.75 %/2.87 %/1.00 %
Fluctuation 3.00 % 3.00 %
1) A portion in the amount of € 53.054 million was calculated with an interest rate of 5.07 per cent.
NORD/LB’s pension obligation was valued based on the “Richttafeln 2005 G” mortality tables published by Dr. Klaus
Heubeck.
For the branch in New York, the bank has offset the cover assets against the related pension obligations in accordance
with § 246 para. 2 of the German Commercial Code (new version). The settlement value of the pension obligation
(converted into euros) as at the balance sheet date was € 4.298 million. This is seen alongside the fair value of the
cover assets as at 31 December 2013 in the amount of € 2.986 million. Acquisition costs amount to total € 2.443 mil-
lion.
The allocation to the pension obligation for 2013 was € 0.178 million. This is seen alongside income generated from
the cover assets in the amount of € 0.088 million.
For the indirect pension obligations of the London branch there was a shortfall as at 31 December 2013 of
€ 2.022 million.
Based on a service agreement, the employees of NORD/LB have the option of placing the credit balance of time
credits and deferred remuneration in long-term working time credit accounts which are invested in a special fund by
a trustee.
This is a securities-linked commitment, so that in accordance with § 253 para. 1 of the German Commercial Code the
relevant provision is to be set in the amount of the fair value of the fund assets and netted with the cover assets.
As at 31 December 2013 the fair value of the special fund is € 4.1 million against an acquisition cost of € 4.1 million.
The expenses and income from the cover assets and the corresponding provisions are offset under other operating
income.
As at 1 January 2013 the present value of pension obligations in accordance with the German Accounting Law
Modernisation Act (BilMoG) was € 999.965 million. The difference resulting from the change in the valuation of
pension obligations in accordance with the German Accounting Law Modernisation Act (BilMoG) as at 1 January 2010
totals € 301.921 million for the registered public institute. Using the simplification rule in accordance with art. 67 para.
1 clause 1 Introductory Act of the German Commercial Code (EGHGB), the allocation will be spread over 15 years. The
value in 2013, after taking into account repayments, was € 18.745 million and was shown under extraordinary
expenses. The first-time effect for the New York branch, however, was already recognised in full through profit or loss
in 2010. The provision as at 31 December 2013 was € 828.704 million, whereby an obligation of € 215.880 million is
not shown in the balance sheet.

F-134
Currency Translation
The currency translation takes place in the non-trading portfolio in accordance with the principles of § 256a in
conjunction with § 340h of the German Commercial Code (“special cover”) and the statement made by the “Banken-
fachausschuss” (Banking Committee) of the “Institut der Wirtschaftsprüfer” (Institute of Public Auditors in Germany)
(IDW RS BFA 4), as the bank controls currency risk via separate currency positions and carries the individual currency
items in the currency positions. The special cover comprises all assets, liabilities and pending transactions which are
not allocated to the trading portfolio, are financial instruments and are in a foreign currency.
The assets and liabilities and the valuation of forward foreign exchange transactions and spot exchange transactions
which have not yet been completed are translated using the average spot exchange rate (ECB reference exchange
rate) or rates from other reliable sources on the balance sheet date.
For futures transactions in the non-trading portfolio, the pro-rata, swap mark-ups/mark-downs which have not yet
been amortised are valued at the current swap rates for the remaining term of the transactions.
The results from the valuation of the remaining positions are added by currency; losses are deducted. Any remaining
positive results, such as unrealised profits from open items, are not considered.
For financial instruments in the trading portfolio the currency translation takes place in accordance with the relevant
accounting policies. The results of the currency translations are reported under the item net income or net expenses
of the trading portfolio.
Overall the value of NORD/LB’s assets and liabilities in foreign currencies totals € 41,043.1 million (€ 44,834.5 million)
and € 41,119.9 million (€ 44 783.7 million) respectively.
Formation and Accounting of Valuation Units
At NORD/LB in the following cases economic hedging relationships are shown in the balance sheet by forming
valuation units:
• Individual-transaction-specific interest hedges of fixed-interest securities in the liquidity reserve with interest rate
swaps (€ 831.768 million; previous year € 64.500 million);
• Individual-transaction-specific hedges of the underlying share price or currency exchange rate risks of certain
structured issues with share-price or currency-exchange-rate-specific derivatives (€ 313.047 million; previous year:
€ 625.694 million);
• Individual-transaction-specific hedge of the currency risk of the highly likely repayment of a hybrid capital bond
issued in USD with a currency swap (€ 362.555 million; previous year: € 378.960 million);
• Individual-transaction-specific passing on of inflation risk hedged against customers to the market (€ 142.679 mil-
lion; previous year: € 152.488 million).
F-135
In addition to the above-mentioned hedging relationships shown as valuation units, there are the following economic
hedging relationships which are not shown in the balance sheet by forming valuation units, but by the measures
below:
• Currency hedges in the banking book. The economic hedging relationship is presented in the balance sheet by the
translation of the foreign-currency assets, foreign-currency liabilities and pending currency transactions in accord-
ance with § 256a in conjunction with § 340h of the German Commercial Code.
• Hedging of general interest-rate risk in the banking book within the scope of asset / liability management (Overall
Bank Management). The economic control relationship is taken into account when assessing whether the require-
ments for loss-free valuation in the banking book have been complied with by considering all of the interest-bear-
ing banking book assets and liabilities and all interest derivatives in the banking book.
• Hedging of the default risk relating to banking book assets with CDS contracts. The economic hedging relationship
is presented in the balance sheet by the hedge effect of the CDS contracts being considered in the calculation of
the revaluation requirement for the hedged assets like a loan security.
Where valuation units are formed, at NORD/LB the net hedge presentation method is used.
Loss-free Valuation of Interest-rate-based Transactions in the Banking Book
(Interest Book)
Interest-rate-based financial instruments in the banking book (interest book) are subject to a loss-free valuation in
accordance with IDW RS BFA 3. If the value of the payment obligation from the interest-bearing transaction is greater
than the value of the counterperformance, a provision for anticipated loss in the amount of the net liability is to be
made.
In the present value approach, NORD/LB compares the cashflows, discounted as at the balance sheet date, of all
on-balance-sheet and off-balance-sheet interest-rate-based financial instruments not in the trading portfolio with
their book values taking into account the expected refinancing, risk and administrative expenses. As at the balance
sheet date there is no net liability.
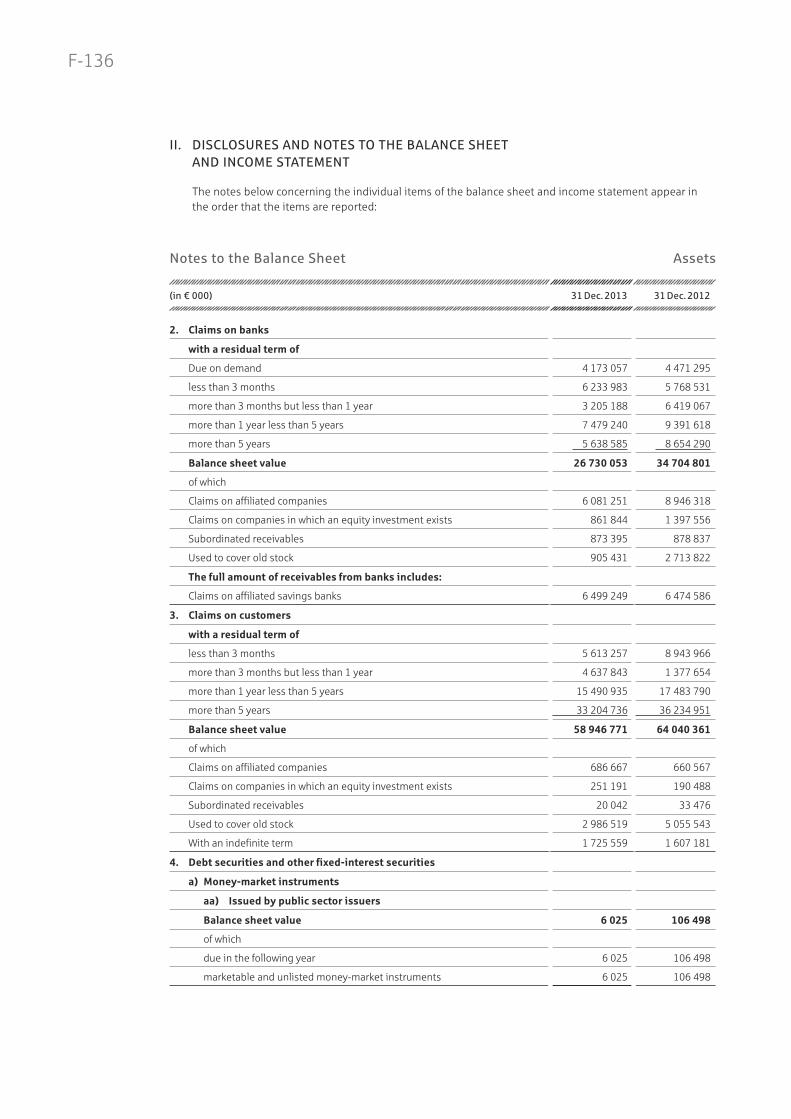
F-136
II. DISCLOSURES AND NOTES TO THE BALANCE SHEET
AND INCOME STATEMENT
The notes below concerning the individual items of the balance sheet and income statement appear in the order that the items are reported:
Notes to the Balance Sheet Assets
(in € 000) 31 Dec. 2013 31 Dec. 2012
2. Claims on banks
with a residual term of
Due on demand 4 173 057 4 471 295
less than 3 months 6 233 983 5 768 531
more than 3 months but less than 1 year 3 205 188 6 419 067
more than 1 year less than 5 years 7 479 240 9 391 618
more than 5 years 5 638 585 8 654 290
Balance sheet value 26 730 053 34 704 801
of which
Claims on affiliated companies 6 081 251 8 946 318
Claims on companies in which an equity investment exists 861 844 1 397 556
Subordinated receivables 873 395 878 837
Used to cover old stock 905 431 2 713 822
The full amount of receivables from banks includes:
Claims on affiliated savings banks 6 499 249 6 474 586
3. Claims on customers
with a residual term of
less than 3 months 5 613 257 8 943 966
more than 3 months but less than 1 year 4 637 843 1 377 654
more than 1 year less than 5 years 15 490 935 17 483 790
more than 5 years 33 204 736 36 234 951
Balance sheet value 58 946 771 64 040 361
of which
Claims on affiliated companies 686 667 660 567
Claims on companies in which an equity investment exists 251 191 190 488
Subordinated receivables 20 042 33 476
Used to cover old stock 2 986 519 5 055 543
With an indefinite term 1 725 559 1 607 181
4. Debt securities and other fixed-interest securities
a) Money-market instruments
aa) Issued by public sector issuers
Balance sheet value 6 025 106 498
of which
due in the following year 6 025 106 498
marketable and unlisted money-market instruments 6 025 106 498

F-137
Assets
(in € 000) 31 Dec. 2013 31 Dec. 2012
ab) Issued by other issuers
Balance sheet value 10 878 53 772
of which
due in the following year 10 878 53 772
marketable and listed money-market instruments 10 878 53 772
b) Bonds and debt securities
ba) Issued by public sector issuers
Balance sheet value 8 716 025 9 897 537
of which
due in the following year 1 369 817 2 559 487
marketable and listed money-market instruments 8 676 004 9 586 836
marketable and unlisted money-market instruments 40 022 310 701
Used to cover old stock 395 378 413 373
bb) Issued by other issuers
Balance sheet value 16 293 446 18 469 037
of which
due in the following year 2 756 390 3 402 492
marketable and listed money-market instruments 15 524 896 17 524 282
marketable and unlisted money-market instruments 768 772 944 755
Affiliated company securities 2 582 616 3 075 975
Subordinated debt securities 665 908 1 340 385
c) Debt securities, issued by the institution itself
Balance sheet value 385 994 482 520
of which
due in the following year 137 561 176 791
marketable and listed money-market instruments 385 994 482 520
5. Shares and other non fixed-interest securities
Balance sheet value 1 208 606 1 200 973
of which
marketable and listed shares and other non fixed-interest securities 1 460 1 710
5a. Trading portfolio
Balance sheet value 8 827 061 9 520 524
of which
Derivative financial instruments 2 380 065 4 534 425
Claims 2 437 830 1 902 454
Debt securities and other fixed-interest securities 3 872 995 2 994 305
Shares and other non fixed-interest securities 139 505 97 506
Risk discount 3 333 8 166

F-138
Assets
(in € 000) 31 Dec. 2013 31 Dec. 2012
6. Participations
Balance sheet value 94 780 110 755
of which
Marketable unlisted shares 10 836 13 994
The equity holding is shown in III. Paragraph 9
7. Investments in affiliated companies
Balance sheet value 1 952 346 1 966 728
of which
Marketable unlisted shares 1 003 391 930 011
The equity holding is shown in III. Paragraph 9
8. Assets held in trust
Balance sheet value 4 542 444 4 546 438
of which
Claims on banks 526 018 522 855
Claims on customers 4 016 426 4 023 583
9. Intangible assets
Balance sheet value 82 811 73 645
of which
internally generated software 50 231 56 288
In the 2013 year under review there are development costs for software in the amount of € 7.0 million but not any research costs.
12. Other assets
Balance sheet value 1 432 221 1 962 118
of which
The following are reported as significant items:
Interest and interest due from interest-rate swaps 735 142 901 438
Option premiums and margins 612 077 886 352
Claims against fiscal authorities 42 797 12 523
Reported assets on interim accounts 18 595 139 366
Pro rata interest claims from flat-traded securities of the trading portfolio 14 234 10 196
As a result of the reorganisation of the process for the accounting treatment of interim accounts, various interim accounts were closed and reclassified in the financial year. Loans and advances to and liabilities to banks and customers were affected significantly by this. This resulted in reductions in “other assets” and “other liabilities”.
13. Deferred expenses and accrued income
Balance sheet value 1 123 287 1 154 845
of which
deferred premiums in accordance with § 340e Paragraph 2 HGB 358 061 397 251
discounts and maturing premiums 91 577 127 716

F-139
Assets
The table below shows the changes to fixed assets:
(in € 000)
Aquisition/
manufac-
turing cost
Additions Disposals Accu-
mulative
depreciation
Balance
sheet value
31 Dec.
2013
Balance
sheet value
31 Dec.
2012
Deprecia-
tion for the
account-
ing-period
Intangible assets 157 865 26 482 1 014 100 522 82 811 73 645 17 357
Tangible assets 454 334 24 800 3 838 256 438 218 858 212 901 18 661
Change 1)
Participatinginterests – 15 975 94 780 110 755
Investments in affiliated companies – 14 382 1 952 346 1 966 728
Securities in fixed assets – 2 853 119 10 811 282 13 664 401
of which:
Bonds and debt securities – 2 413 490 10 687 897 13 101 387
Shares – 439 630 123 384 563 014
1) The possibility of a summary according to § 34, para. 3 RechKredV was used.

F-140
Liabilities
(in € 000) 31 Dec. 2013 31 Dec. 2012
1. Liabilities to banks
a) Due on demand
Balance sheet value 5 111 391 6 891 043
of which
Liabilities to affiliated companies 111 978 42 519
b) With an agreed term or notice period
of which with a residual term of
less than 3 months 18 517 190 18 467 756
more than 3 months but less than 1 year 2 565 580 5 457 345
more than 1 year but less than 5 years 5 157 624 5 085 545
more than 5 years 9 480 604 10 771 986
Balance sheet value 35 720 998 39 782 632
of which
Liabilities to affiliated companies 356 944 677 173
Liabilities to companies in which an equity investment exists 320 093 481 002
Assets pledged as collateral 16 800 243 14 647 173
The full amount of bank loans and overdrafts includes:
Liabilities to affiliated savings banks 1 731 376 3 448 073
2. Liabilities to customers
a) Savings deposits
aa) with an agreed notice period of three months
Balance sheet value 1 369 325 750 718
ab) Savings deposits with an agreed notice period of more than three months
of which with a residual term of
less than 3 months 39 716 48 987
more than 3 months but less than 1 year 238 139 40 666
more than 1 year but less than 5 years 54 346 303 882
more than 5 years 191 975
Balance sheet value 332 392 394 510
1) The previous year’s figure for assets assignet as collateral under liabilities to banks was adjusted.2) Collateral has been provided for borrowing undertaken within the scope of genuine repos. Collateral has also been provided for refinancing funds for specific
purposes and open market transactions to the Deutsche Bundesbank.

F-141
Liabilities
(in € 000) 31 Dec. 2013 31 Dec. 2012
b) Other liabilities
ba) Due on demand
Balance sheet value 12 248 847 11 180 159
of which
Liabilities to affiliated companies 68 831 69 504
Liabilities to companies in which an equity investment exists 88 095 84 499
bb) With an agreed term or notice period
of which with a residual term of
less than 3 months 4 112 797 5 805 950
more than 3 months but less than 1 year 2 610 038 1 179 056
more than 1 year but less than 5 years 4 797 545 5 119 083
more than 5 years 11 638 781 12 510 478
Balance sheet value 23 159 161 24 614 567
of which
Liabilities to affiliated companies 135 371 154 860
Liabilities to companies in which an equity investment exists 329 462 157 215
3. Securitised liabilities
a) Issued debt securities
Balance sheet value 32 203 472 40 597 251
of which
Due in the following year 10 658 128 10 860 191
Liabilities to affiliated companies 3 557 602 537 743
Liabilities to companies in which an equity investment exists 77 508 198 723
b) Other securitised liabilities
of which with a residual term of
less than 3 months 154 649 –
more than 3 months but less than 1 year 80 004 126 575
more than 1 year but less than 5 years 111 290 121 082
more than 5 years 72 912 72 912
Balance sheet value 418 855 320 569
3a. Trading portfolio
Balance sheet value 2 295 562 4 568 551
of which
Derivative financial instruments 2 185 602 4 354 550
Liabilities (for short-term securities) 109 960 214 001
4. Liabilities held in trust
Balance sheet value 4 542 444 4 546 438
of which
Liabilities to banks 1) 1 605 103 1 622 932
Liabilities to customers 2 937 341 2 923 506
1) Investitionsbank Sachsen-Anhalt equity to the amount of € 143.5 million is included in the figures and for the Group.
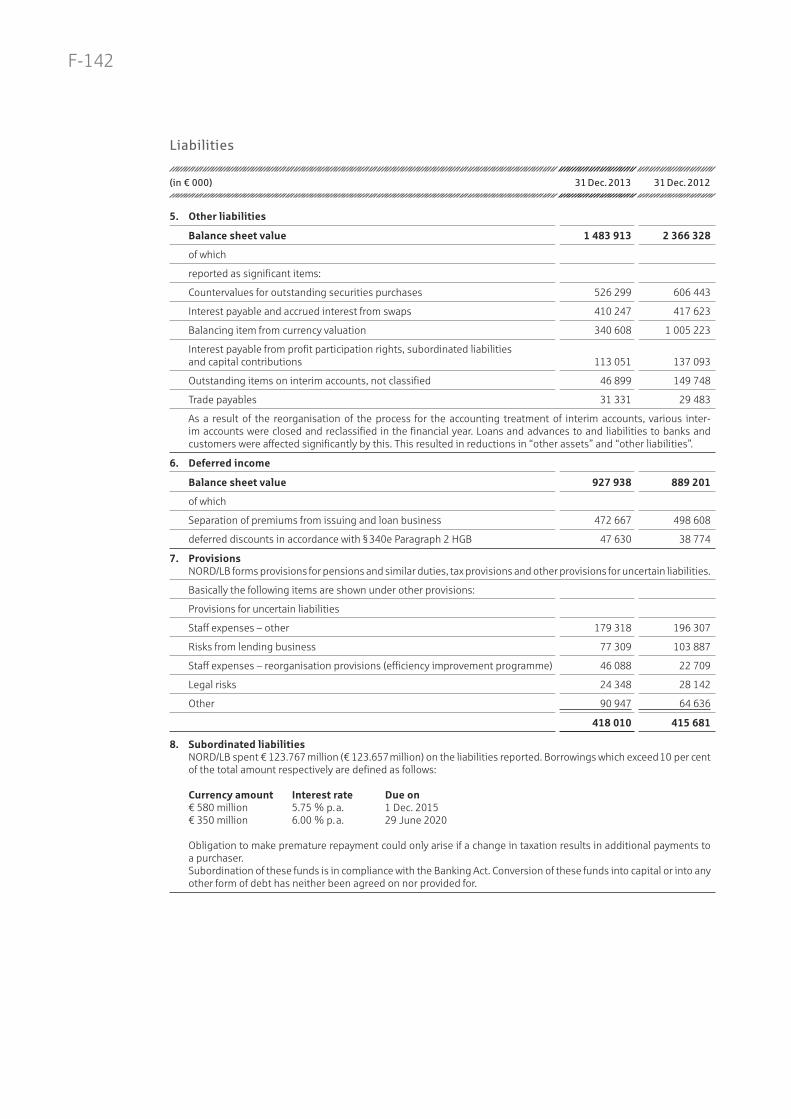
F-142
Liabilities
(in € 000) 31 Dec. 2013 31 Dec. 2012
5. Other liabilities
Balance sheet value 1 483 913 2 366 328
of which
reported as significant items:
Countervalues for outstanding securities purchases 526 299 606 443
Interest payable and accrued interest from swaps 410 247 417 623
Balancing item from currency valuation 340 608 1 005 223
Interest payable from profit participation rights, subordinated liabilitiesand capital contributions 113 051 137 093
Outstanding items on interim accounts, not classified 46 899 149 748
Trade payables 31 331 29 483
As a result of the reorganisation of the process for the accounting treatment of interim accounts, various inter-im accounts were closed and reclassified in the financial year. Loans and advances to and liabilities to banks and customers were affected significantly by this. This resulted in reductions in “other assets” and “other liabilities”.
6. Deferred income
Balance sheet value 927 938 889 201
of which
Separation of premiums from issuing and loan business 472 667 498 608
deferred discounts in accordance with § 340e Paragraph 2 HGB 47 630 38 774
7. Provisions NORD/LB forms provisions for pensions and similar duties, tax provisions and other provisions for uncertain liabilities.
Basically the following items are shown under other provisions:
Provisions for uncertain liabilities
Staff expenses – other 179 318 196 307
Risks from lending business 77 309 103 887
Staff expenses – reorganisation provisions (efficiency improvement programme) 46 088 22 709
Legal risks 24 348 28 142
Other 90 947 64 636
418 010 415 681
8. Subordinated liabilities NORD/LB spent € 123.767 million (€ 123.657 million) on the liabilities reported. Borrowings which exceed 10 per cent
of the total amount respectively are defined as follows:
Currency amount Interest rate Due on€ 580 million 5.75 % p.a. 1 Dec. 2015€ 350 million 6.00 % p.a. 29 June 2020
Obligation to make premature repayment could only arise if a change in taxation results in additional payments to a purchaser.Subordination of these funds is in compliance with the Banking Act. Conversion of these funds into capital or into any other form of debt has neither been agreed on nor provided for.

F-143
Liabilities
(in € 000) 31 Dec. 2013 31 Dec. 2012
10. Participatory capital
Balance sheet value 115 000 115 000
of which
there of falling due in less than two years 55 000 20 000
With the exception of those capital components which have a maturity of less than two years, the other tranches of the participatory capital issued by NORD/LB meet in full the conditions of § 10 para. 5 of the German Banking Act and are therefore to be allowed for.
11. Equity The balance sheet profit includes the profit carried forward from the previous year in the amount of € 68,600,000.00.
Of the silent participations in NORD/LB’s portfolio which are reported in the balance sheet under other capital contributions, as at 31 December 2013 participations in the nominal amount of € 0.0 million have been cancelled.
As part of the scope of the capital-boosting measures, NORD/LB acquired capital notes in the amount of € 400 mil-lion held indirectly by the state of Lower Saxony in 2012. These securities were issued by special purpose entities in order to refinance silent participations at NORD/LB. In the past financial year the capital notes purchased in 2012 by NORD/LB were recalled and repaid by the special purpose entities Fürstenberg Capital Erste GmbH and Fürstenberg Capital II GmbH. At the same time silent participations held by the two special purpose entities were cancelled in the same amount.
Furthermore, NORD/LB has purchased in 2013 by way of a tender for the remaining capital notes of the three special purpose entities based in Fürstenberg securities in the amount of € 99.2 million. Like the capital notes purchased in 2012, these securities were reported by NORD/LB on the assets side under debt securities at the time they were recalled and repaid.
Beforehand NORD/LB took on subordinated liabilities in the amount of € 300 million in order to implement a banking regulatory requirement; it had to ensure that it had adequate replacement capital in accordance with regulatory law for the silent participations lost due to the purchase of the capital notes.
1. Contingent liabilities Under contingent liabilities there are as at 31 December 2013 nine significant liabilities relating to sureties
and guarantees. The individual values range from € 48.1 million to € 199.8 million.
NORD/LB’s maximum liability to customers from guarantees is € 3,796.6 million and from letters of credit € 199.4 million.
The risk of the contingent liabilities being used is considered to be low as the liabilities are arranged and monitored on a credit-related basis. A risk provisioning in the amount of € 50.0 million (€ 63.8 million) has been allocated.
2. Other obligations The irrevocable credit commitments in the reporting period 2013 are broken down as follows:
– Commercial enterprises 6 526– Banks 1 110– Public households 510
– Private customers 84
Based on credit rating analyses that have been conducted, it is largely expected that the borrowers will meet their obligations. Risks may arise from a drop in the customers’ credit ratings, for which an appropriate provision has been made. The provision is € 6.7 million (€ 21.7 million).
3. Hard letter of comfort NORD/LB ensures that the following companies are able to meet their obligations: – Deutsche Hypothekenbank (Actien-Gesellschaft), Hanover, – Nieba GmbH, Hanover, – Norddeutsche Landesbank Luxembourg S.A., Luxembourg-Findel /Luxembourg, – NORD/LB Asset Management Holding GmbH, Hanover, – NORD/LB COVERED FINANCE BANK S.A., Luxembourg-Findel /Luxembourg, – Skandifinanz AG, Zurich/Switzerland

F-144
Notes to the Income Statement
The total balance of the income statement items 1, 3, 5, 7 and 8 is spread across the following regions:
(in € 000)
Federal
Republic of
Germany
Europe (excl. of
Federal Republic
of Germany)
North America Asia Total
1. Net interest income3 713 362
(4 842 067)93 200
(131 043) 117 270
(164 689) 95 526
(133 269) 4 019 358
(5 271 068)
3. Current income62 346
(113 898)0
(0)0
(0)0
(0)62 346
(113 898)
5. Net commision income162 847
(173 498)14 447
(12 125)21 916
(23 794)4 761
(9 686)203 971
(219 103)
7. Net profit of trading portfolio159 606
(106 658)– 196 (257)
1 629 (– 19 471)
– 303 (727)
160 736 (88 171)
8. Other operating income123 547 (92 331)
234 (481)
207 (554)
212 (349)
124 200 (93 715)
Income statement items4 221 708
(5 328 452)107 685
(143 906)141 022
(169 566)100 196
(144 031)4 570 611
(5 785 955)
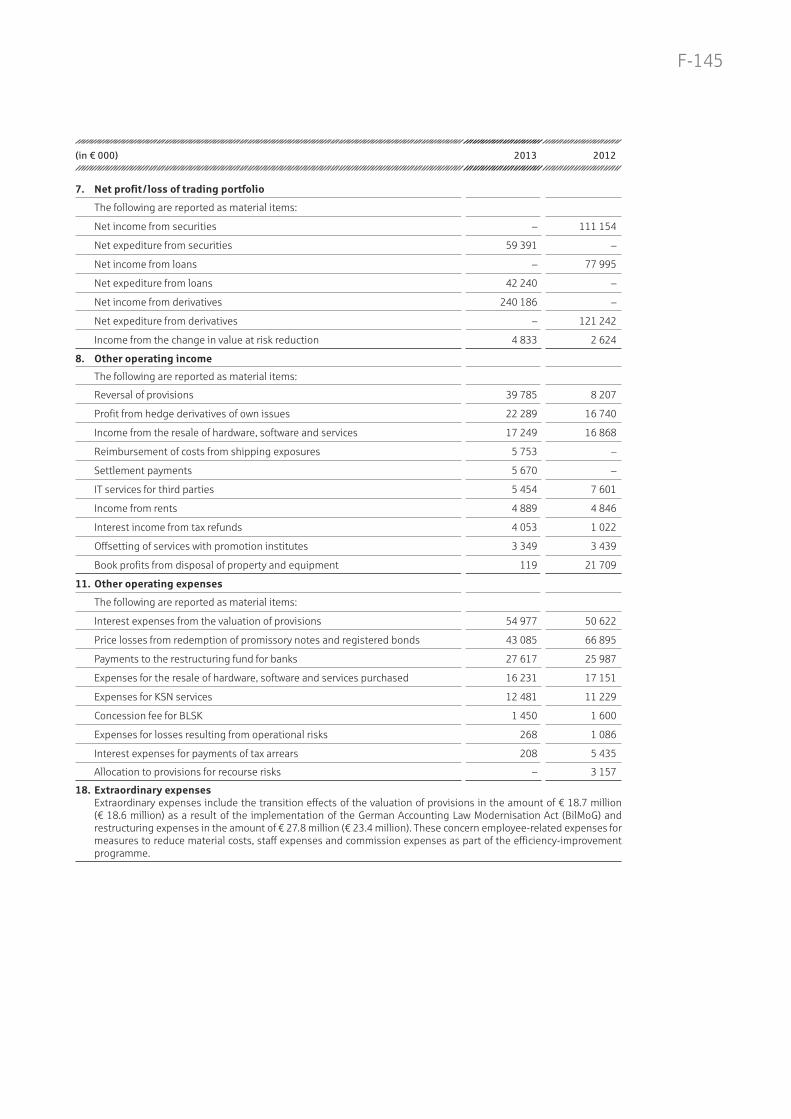
F-145
(in € 000) 2013 2012
7. Net profit/ loss of trading portfolio
The following are reported as material items:
Net income from securities – 111 154
Net expediture from securities 59 391 –
Net income from loans – 77 995
Net expediture from loans 42 240 –
Net income from derivatives 240 186 –
Net expediture from derivatives – 121 242
Income from the change in value at risk reduction 4 833 2 624
8. Other operating income
The following are reported as material items:
Reversal of provisions 39 785 8 207
Profit from hedge derivatives of own issues 22 289 16 740
Income from the resale of hardware, software and services 17 249 16 868
Reimbursement of costs from shipping exposures 5 753 –
Settlement payments 5 670 –
IT services for third parties 5 454 7 601
Income from rents 4 889 4 846
Interest income from tax refunds 4 053 1 022
Offsetting of services with promotion institutes 3 349 3 439
Book profits from disposal of property and equipment 119 21 709
11. Other operating expenses
The following are reported as material items:
Interest expenses from the valuation of provisions 54 977 50 622
Price losses from redemption of promissory notes and registered bonds 43 085 66 895
Payments to the restructuring fund for banks 27 617 25 987
Expenses for the resale of hardware, software and services purchased 16 231 17 151
Expenses for KSN services 12 481 11 229
Concession fee for BLSK 1 450 1 600
Expenses for losses resulting from operational risks 268 1 086
Interest expenses for payments of tax arrears 208 5 435
Allocation to provisions for recourse risks – 3 157
18. Extraordinary expenses Extraordinary expenses include the transition effects of the valuation of provisions in the amount of € 18.7 million
(€ 18.6 million) as a result of the implementation of the German Accounting Law Modernisation Act (BilMoG) and restructuring expenses in the amount of € 27.8 million (€ 23.4 million). These concern employee-related expenses for measures to reduce material costs, staff expenses and commission expenses as part of the efficiency-improvement programme.

F-146
Other Financial Obligations
With regard to the security reserve for landesbanks, NORD/LB’s maximum obligation to make additional contributions
is € 57.9 million (€ 159.6 million). In the event of a need for support these subsequent contributions could be
collected immediately.
NORD/LB has further obligations to make additional contributions to the amount of € 30.5 million (previous year
€ 30.5 million) in addition to extra joint liabilities for other partners on the part of Liquiditätskonsortialbank GmbH.
NORD/LB furthermore vouches for the obligations of the Sparkassenverband Niedersachsen (Association of the
Savings Banks of Lower Saxony) resulting from its membership in the Deutscher Sparkassen- und Giroverband
(German Association of Savings Banks and Girobanks) and the DekaBank Deutsche Girozentrale. In addition joint
liability has been assumed for DekaBank Deutsche Girozentrale with the other shareholders of this bank within the
scope of the guarantor function.
Furthermore NORD/LB is, alongside the state of Bremen, guarantor of Bremer Landesbank Kreditanstalt Oldenburg –
Girozentrale –, Bremen, and, together with Sparkassenverband Niedersachsen (SVN) and Landesbank Berlin Holding
AG, also acts as guarantor for LBS Norddeutsche Landesbausparkasse Berlin-Hannover.
NORD/LB has a 100 per cent holding in Deutsche Hypothekenbank (Actien-Gesellschaft). It is obliged to reimburse
Deutscher Sparkassen- and Giroverband e.V. as the guarantor of the security reserve for landesbanks and giro centres
all expenditure including interest and interest lost for supporting measures which cannot be paid from the fund
established for Deutsche Hypothekenbank in accordance with the agreement concluded between Deutscher Sparkas-
sen- und Giroverband e.V. and Deutsche Hypothekenbank AG on 19 December 2008.
NORD/LB had undertaken to release the Bundesverband deutscher Banken e.V. (Association of German Banks) from all
losses which were a result of the measures in accordance with § 2 paragraph 2 of the statute of the “Einlagen-
sicherungsfond” (deposit protection fund) for the Deutsche Hypothekenbank (Actien-Gesellschaft). The participation
of Deutsche Hypothekenbank (Actien-Gesellschaft) in the German banks’ deposit protection fund was terminated as
at 31 December 2008. In accordance with § 6 no. 8 of the statute of the deposit protection fund NORD/LB may still be
liable for commitments previously entered into by Deutsche Hypothekenbank (Actien-Gesellschaft).
With regard to NORD KB Beteiligungsgesellschaft mbH and NORD KB Dachfonds II Beteiligungsgesellschaft mbH,
NORD/LB has an obligation to grant partnership loans totalling approximately € 7.0 million (€ 11.0 million).
NORD/LB also holds an interest with other limited partners in Immobilien Development und Beteiligungsgesellschaft
Niedersachsen mbH IDB & Co. Objekt Zietenterrassen KG. One limited partner has indemnified the general partner
from liability. In the internal relationship NORD/LB assumes 50 per cent of the possible obligations from this declara-
tion of liability.
NORD/LB has released the personally liable partners of a real estate investment fund from their statutory liability.
NORD/LB has, together with the other limited partner Braunschweig Grund Objektgesellschaft Driebenberg mbH &
Co. KG, indemnified the general partner from liability.

F-147
In connection with the sale of companies in the NILEG sub-group, NORD/LB guarantees the purchaser that taxes for
periods for which tax audits had not yet been conducted have been fully paid or adequate provisions have been set
up. In this respect NORD/LB is liable for any additional back taxes if the value exceeds € 0.5 million.
With regard to the inclusion of the shares in FinanzIT GmbH, the withdrawing partners NORD/LB, Bremer Landesbank
and Landesbank Saar have committed, together with the remaining partners of FinanzIT, to bear the risks of the
company from the time up to their withdrawal, provided they have actually occurred and are not already covered by
provisions which have already been made.
Call-in obligations for shares and other interests amounted to € 12,8 million at year-end (€ 13.4 million).
In the course of normal business activities NORD/LB has provided security in the nominal amount of € 2,138.2 million
(€ 2,778.5 million) in the form of securities.
In connection with the measures to boost the amount of NORD/LB’s regulatory capital by converting silent participa-
tions into share capital and reserves, NORD/LB has made a commitment to the other owners of Bremer Landesbank
that in the event of a further retention of profits and until a distribution takes place, to finance it in advance with the
funds it requires at terms that are still to be negotiated.
NORD/LB intends, in order ease the pressure on regulatory equity, to transfer part of the credit risk of a credit portfolio
defined precisely by a finance guarantee (“PEGASUS”) to an external third party. If the finance guarantee becomes
effective as planned in 2014, this would result in a financial burden with charges of up to € 36 million incurred for
2014 and up to € 45 million per year for the remainder of the period of the guarantee.
NORD/LB has concluded a framework contract with Wincor Nixdorf International GmbH, Paderborn, to regulate the
collaboration in the area of information technology. The contract, which bundles the IT infrastructure services with
one service provider, commences with effect of 1 July 2013 and will run to 30 June 2020. The annual costs are
volume-dependent; the value of the contract over the entire term is approx. € 200 million.
NORD/LB has obligations from long-term rental and lease agreements for land and buildings to 2024 in the nominal
amount of € 340.9 million (€ 366.4 million), € 293.4 million (€ 307.7 million) of which towards affiliated companies.
In accordance with the Restructuring Fund Regulation (Restrukturierungsfonds-Verordnung, RstruktFV), NORD/LB has
to pay a bank levy.

F-148
III. OTHER DISCLOSURES
1. Members of the Managing Board
Dr. Gunter Dunkel
(Chairman)
Dr. Johannes-Jörg Riegler
(Deputy Chairman until 1 March 2014)
Ulrike Brouzi
Eckhard Forst
Dr. Hinrich Holm
Christoph Schulz
Thomas Bürkle
(since 1 January 2014)
2. Members of the Supervisory Board
Peter-Jürgen Schneider (Chairman)
Minister of Finance, State of Lower Saxony
(since 19 February 2013)
Hartmut Möllring (Chairman)
(until 19 February 2013)
Thomas Mang (First Deputy Chairman)
President, Association of Savings Bank in Lower Saxony
Jens Bullerjahn (Second Deputy Chairman)
Minister of Finance, State of Saxony-Anhalt
Frank Berg
Chairman of the Managing Board,
OstseeSparkasse Rostock
Norbert Dierkes
Chairman of the Managing Board,
Sparkasse Jerichower Land
Edda Döpke
Bank employee,
NORD/LB Hannover
Ralf Dörries
Senior Vice President,
NORD/LB Hannover
Hans-Heinrich Hahne
Chairman of the Managing Board,
Sparkasse Schaumburg
Frank Hildebrandt
Bank employee,
NORD/LB Braunschweig
Martin Kind
Managing Director
KIND Hörgeräte GmbH & Co. KG
Frank Klingebiel
Mayor, City of Salzgitter
Prof. Dr. Susanne Knorre
Management consultant
(since 1 May 2013)
Ulrich Mädge
Mayor, City of Hansestadt Lüneburg
Antje Niewisch-Lennartz
Minister of Justice, State of Lower Saxony
(since 1 July 2013)
Heinrich von Nathusius
IFA ROTORION – Holding GmbH
Freddy Pedersen
ver.di Vereinte Dienstleistungsgewerkschaft
Jörg Reinbrecht
ver.di Vereinte Dienstleistungsgewerkschaft
Ilse Thonagel
Bank employee
Landesförderinstitut Mecklenburg-Western Pomerania
Mirja Viertelhaus-Koschig
Deputy Chairman of the Managing Board, VIEROL AG
(until 26 April 2013)
Klaus-Peter Wennemann
Management consultant
(until 30 June 2013)
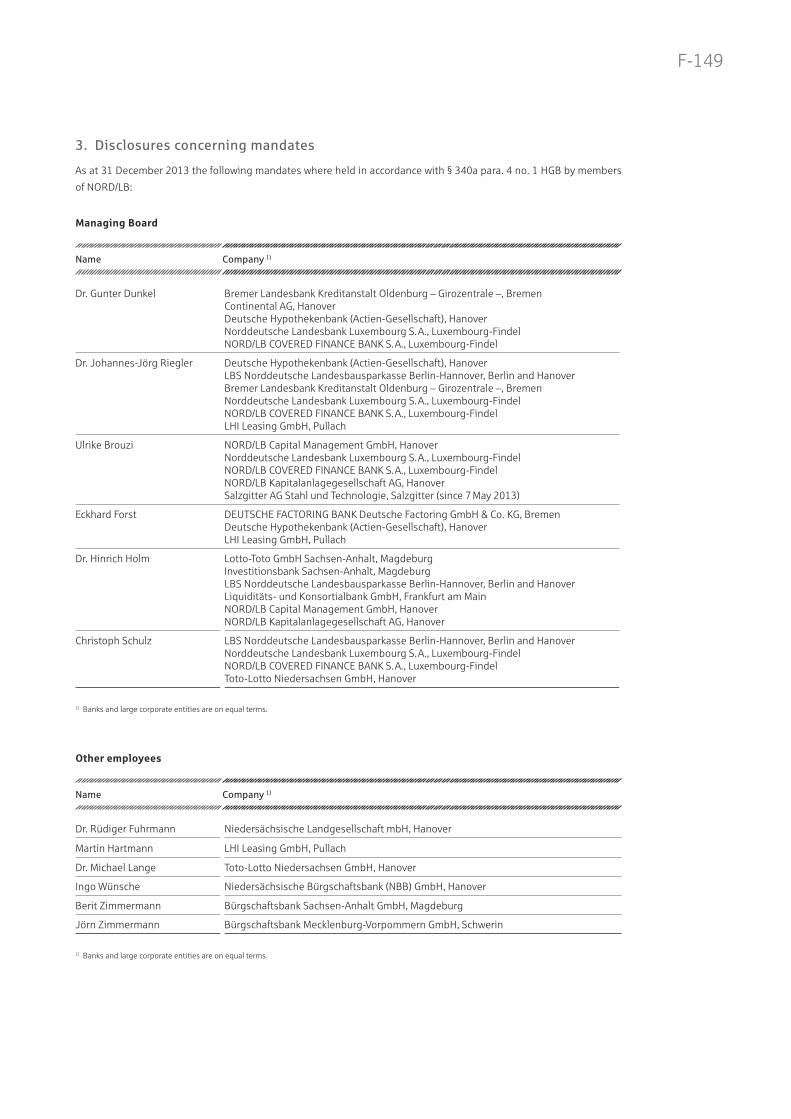
F-149
3. Disclosures concerning mandates
As at 31 December 2013 the following mandates where held in accordance with § 340a para. 4 no. 1 HGB by members
of NORD/LB:
Managing Board
Name Company 1)
Dr. Gunter Dunkel Bremer Landesbank Kreditanstalt Oldenburg – Girozentrale –, BremenContinental AG, HanoverDeutsche Hypothekenbank (Actien-Gesellschaft), HanoverNorddeutsche Landesbank Luxembourg S.A., Luxembourg-FindelNORD/LB COVERED FINANCE BANK S.A., Luxembourg-Findel
Dr. Johannes-Jörg Riegler Deutsche Hypothekenbank (Actien-Gesellschaft), HanoverLBS Norddeutsche Landesbausparkasse Berlin-Hannover, Berlin and HanoverBremer Landesbank Kreditanstalt Oldenburg – Girozentrale –, BremenNorddeutsche Landesbank Luxembourg S.A., Luxembourg-FindelNORD/LB COVERED FINANCE BANK S.A., Luxembourg-FindelLHI Leasing GmbH, Pullach
Ulrike Brouzi NORD/LB Capital Management GmbH, HanoverNorddeutsche Landesbank Luxembourg S.A., Luxembourg-FindelNORD/LB COVERED FINANCE BANK S.A., Luxembourg-FindelNORD/LB Kapitalanlagegesellschaft AG, HanoverSalzgitter AG Stahl und Technologie, Salzgitter (since 7 May 2013)
Eckhard Forst DEUTSCHE FACTORING BANK Deutsche Factoring GmbH & Co. KG, BremenDeutsche Hypothekenbank (Actien-Gesellschaft), HanoverLHI Leasing GmbH, Pullach
Dr. Hinrich Holm Lotto-Toto GmbH Sachsen-Anhalt, Magdeburg Investitionsbank Sachsen-Anhalt, MagdeburgLBS Norddeutsche Landesbausparkasse Berlin-Hannover, Berlin and HanoverLiquiditäts- und Konsortialbank GmbH, Frankfurt am MainNORD/LB Capital Management GmbH, HanoverNORD/LB Kapitalanlagegesellschaft AG, Hanover
Christoph Schulz LBS Norddeutsche Landesbausparkasse Berlin-Hannover, Berlin and HanoverNorddeutsche Landesbank Luxembourg S.A., Luxembourg-FindelNORD/LB COVERED FINANCE BANK S.A., Luxembourg-FindelToto-Lotto Niedersachsen GmbH, Hanover
1) Banks and large corporate entities are on equal terms.
Other employees
Name Company 1)
Dr. Rüdiger Fuhrmann Niedersächsische Landgesellschaft mbH, Hanover
Martin Hartmann LHI Leasing GmbH, Pullach
Dr. Michael Lange Toto-Lotto Niedersachsen GmbH, Hanover
Ingo Wünsche Niedersächsische Bürgschaftsbank (NBB) GmbH, Hanover
Berit Zimmermann Bürgschaftsbank Sachsen-Anhalt GmbH, Magdeburg
Jörn Zimmermann Bürgschaftsbank Mecklenburg-Vorpommern GmbH, Schwerin
1) Banks and large corporate entities are on equal terms.

F-150
4. Remuneration and Loans to Governing Bodies
(in € 000) 2013 2012
Emoluments paid to active members of executive bodies
Board of Management 3 335 3 757
Supervisory Board 386 361
3 721 4 118
Emoluments paid to former members of the executive bodies and their dependants
Board of Management 4 081 4 146
Advances payments and loans
Board of Management 1 331 1 397
Supervisory Board 60 614
€ 33.599 million (€ 32.785 million) was put back for pension obligations towards former members of governing bodies
and their surviving dependents, whereby an obligation of € 12.275 million (€ 12.234 million) is not reported in the
balance sheet.
5. Auditor’s fees
NORD/LB has made use of the option in accordance with 285 no. 17 of the German Commercial Code of reporting the
auditor’s fees in the consolidated financial statements.
6. Average number of employees
Male 2013 Male 2012 Female 2013 Female 2012 Total 2013 Total 2012
Employees 2 101 2 096 2 190 2 175 4 291 4 271
Investitionsbank Sachsen-Anhalt and Landesförderinstitut Mecklenburg-Vorpommern account for an additional
619 employees (608 employees).
7. Further disclosures
Services performed for third parties
Significant services performed for third parties concern:
– the management of trust assets
– the management of custodian accounts
– the brokering building loan contracts, investment products, loans and insurance
– the brokering of foreign notes and coins and precious metals for associated savings banks
– asset management
– the brokering of loans and investment products.

F-151
Omitted depreciations to lower fair value
The items “debt securities and other fixed-interest securities” and “shares and other non fixed-interest securities”
include securities valued like fixed assets which have not been written down to their lower fair value. These concern
the following securities (all book values and fair values disclosed do not include accumulated interest):
(in € 000)
Book values
31 Dec. 2013
Fair values
31 Dec. 2013
omitted
depriation
31 Dec. 2013
Book values
31 Dec. 2012
Fair values
31 Dec. 2012
omitted
depriation
31 Dec. 2012
Bonds and debt securities 2 817 125 2 734 870 82 255 5 685 498 5 480 818 204 680
Shares 0 0 0 563 014 554 307 8 707
NORD/LB assumes with all bonds and debt securities that the loss of value is not permanent as the securities are held
to final maturity and the issuers are all issuers with first-class credit ratings. If as at the balance sheet date there are
valuation units consisting of interest-bearing securities and interest rate swaps, the net fair value of the security and
interest rate swap are entered in the above table as the fair value of the security.
The intention is to hold the shares long term. Write-downs are only to be made if there is a likely permanent loss in
value. There were no reasons for a write-down to lower fair value as at the balance sheet date.
The following securities in fixed assets include hidden reserves, i.e. the fair value is above the book value (all book
values and fair values disclosed do not include accumulated interest):
(in € 000)
Book values
31 Dec. 2013
Fair values
31 Dec. 2013
Book values
31 Dec. 2012
Fair values
31 Dec. 2012
Bonds and debt securities 6 545 680 6 873 573 6 336 572 6 816 207
Shares 123 384 125 226 – –
Marketable securities not valued at lower of cost or market
The items “debt securities and other fixed-interest securities” and “shares and other non fixed-interest securities”
include marketable securities not valued at lower of cost or market, i.e. they are treated as fixed assets (book values
do not include accumulated interest).
(in € 000) 31 Dec. 2013 31 Dec. 2012
Debt securities and other fixed-interest securities 10 665 237 12 967 410
Shares and other non fixed-interest securities 0 0
The marketable securities not valued at lower of cost or market were separated from the marketable securities valued
at lower of cost or market on the basis of the asset category deposited in the portfolio and the valuation method
chosen.
The tables below also include the disclosures in accordance with § 36 of the RechKredV concerning the foreign
currency, interest-based and other futures transactions which have not yet been completed as at the balance sheet
date.

F-152
Derivatives not valued at fair value in external relations (derivatives in the non-trading portfolio)
(in € million)
Nominal values
31 Dec. 2013
Positive
fair values
31 Dec. 2013
Negative
fair values
31 Dec. 2013
Book values
31 Dec. 2013
Recorded
in balance
sheet item
31 Dec. 2013
Interest-rate risks
Interest-rate swaps 4 903 897 – 106 300 Assets 13. / Liabilities 6.
FRAs – – – – –
Interest-rate options
purchases 5 033 906 – 515 Assets 12.
sales 1 767 – – 496 – 349 Liabilities 5.
Caps, Floors 3 714 29 – 72 – 33 Assets 13. / Liabilities 6.
Stock-exchange contracts – – – – –
Other forward interest rate transactions
782 0 – 107 – –
Interest-rate risks – total – 16 199 1 832 – 781 433
Currency risks
Forward foreign exchangetransactions
899 8 – 12 – 15 Liabilities 5.
Currency swaps /interest-rate currency swaps
525 45 – 10 31 Assets 13. / Liabilities 5. /Liabilities 6.
Currency options
purchases – – – – –
sales – – – – –
Currency risks – total – 1 424 53 – 22 16
Shares and other price risks
Share futures contracts – – – – –
Share swaps – – – – –
Share options
purchases – – – – –
sales – – – – –
Stock-exchange contracts 4 – – 0 –
Shares and other price risks– total –
4 – – 0 –
Credit derivatives
Assignor 57 – – 1 – Assets
Assignee 1 343 9 – 1 6 Assets
Credit derivatives – total – 1 400 9 – 2 6
Derivatives not valued at fair value – total
19 027 1 894 – 805 455
The derivatives primarily concern transactions which were completed to cover interest rate, exchange rate and other
market-price risk positions in the asset portfolio.
Nominal values constitute the gross volume of all purchases and sales and long and short positions. With share
options, to calculate the nominal value the closing rate of the underlying transaction is multiplied by the number of
shares. For all contracts, fair values and book values excluding accrued interest are shown. Positive and negative fair
values of contracts with the same counterparty were not offset against each other.

F-153
All of the fair values included in the above table were calculated reliably. Concerning the valuation methods used,
the section “Calculation of fair values” is referred to.
Derivatives valued at fair value in external relations (derivatives in the trading portfolio)
Derivatives valued at fair value – broken down by risk type and transaction type
(in € million)
Nominal values
31 Dec. 2013
Interest-rate risks
Interest-rate swaps 152 109
FRAs 1 029
Interest-rate options
purchases 2 995
sales 5 820
Caps, Floors 4 769
Stock-exchange contracts –
Other forward interest rate transactions 1 079
Interest-rate risks – total – 167 801
Currency risks
Forward foreign exchange transactions 19 080
Currency swaps/ interest-rate currency swaps 26 666
Currency options
purchases 117
sales 119
Currency risks – total – 45 982
Shares and other price risks
Share futures contracts –
Share swaps –
Share options
purchases 61
sales –
Stock-exchange contracts 35
Shares and other price risks – total – 96
Credit derivatives – total –
Assignor 32
Assignee 27
Credit derivatives – total – 59
Derivatives valued at fair value – total 213 938
Nominal values constitute the gross volume of all purchases and sales and long and short positions. With share
options, to calculate the nominal value the closing rate of the underlying transaction is multiplied by the number of
shares.
The amount, dates and reliability of future cashflows relating to derivatives are uncertain. The main factors which
affect this are the future development of interest rates, exchange rates and share prices. Counterparty risk also exists.
The tables below provide an overview of the volumes affected by these factors.

F-154
Derivatives valued at fair value – broken down by risk type and residual term to maturity
(in € million)
Nominal values
31 Dec. 2013
Interest-rate risks
Residual terms to maturity
up to 3 months 14 594
up to 1 year 17 366
up to 5 years 58 584
more than 5 years 77 257
167 801
Currency risks
Residual terms to maturity
up to 3 months 16 015
up to 1 year 7 604
up to 5 years 12 980
more than 5 years 9 383
45 982
Shares and other price risks
Residual terms to maturity
up to 3 months 66
up to 1 year 27
up to 5 years 3
more than 5 years –
96
Credit derivatives
Residual terms to maturity
up to 3 months 3
up to 1 year 10
up to 5 years 46
more than 5 years –
59
The maturity breakdown is based on residual terms to maturity. With interest-rate risk contracts, the term of the
underlying interest-bearing transaction (e.g. futures) is used and with the remaining risks the contract term is used.
Derivatives valued at fair value – broken down by counterparty
(in € million)
Nominal values
31 Dec. 2013
Banks in the OECD 178 280
Banks outside the OECD 163
Public institutions in the OECD 7 118
Other counterparties1) 28 377
Total 213 938
1) including stock exchange contracts

F-155
Disclosures concerning valuation units
NORD/LB has included the following assets, liabilities and pending transactions as underlying transactions in valua-
tion units (assets and liabilities disclosed at book value not including accumulated interest; pending transactions dis-
closed in nominal volume):
(in € 000)
31 Dec. 2013
Underlying transaction hedged against
Interest
rate risk
Share
price risk
Inflation
risk
Currency
risk
Assets
Fixed-interest securities for the liquidity reserve 880 150 – – –
Assets – total 880 150 – – –
Pending transactions
Derivatives separated from structured issues
share-price-related derivatives – 308 047 – –
exchange-rate-related derivatives – – – 5 000
Other – – 142 679 –
Pending transactions – total – 308 047 142 679 5 000
Transactions expected with a high probability1)
Repayment of an issued USD hybrid capital bond – – – 362 555
Transactions expected with a high probability – total – – – 362 555
Valuation units – total 880 150 308 047 142 679 367 555
1) The transaction expected with high probability concerns the repayment of a hybrid capital bond issued by NORD/LB in US-Dollars. The repayment of the bond will with high probability be made at the earliest possible time (30 June 2020), as otherwise the interest coupon to be paid would increase (so-called step-up).
The total of all underlying transactions included in valuation units is therefore € 1,330.876 million.
The prospective and retrospective effectiveness of all valuation units is measured using the Critical Terms Match
method. Basically the final maturity of the underlying transactions corresponds to the final maturity of the hedging
instrument. The underlying transactions will mature between 2013 and 2019.
Deferred taxes
The deferred taxes of NORD/LB in Germany are measured using the tax rate which is applicable as at the balance
sheet date and also in the future of 31.5 per cent. This combined income tax rate comprises corporation tax, trade tax
and the solidarity surcharge. Different tax rates apply for the foreign branches.
Deferred tax liabilities relating to the different tax approach for debt securities, intangible assets, property, plant and
equipment, the trading portfolio and other liabilities were offset with deferred tax assets against temporary differ-
ences in loans and advances to customers, pension provisions and other provisions.
The recoverable deferred tax assets were offset against deferred tax liabilities. Deferred tax assets beyond those
offset are not reported in accordance with the option provided for in § 274 para. 1 clause 2 of the German Commercial
Code.
Values subject to dividend payout restrictions
After the deduction of deferred tax liabilities, self-made intangible fixed assets in the amount of € 34.4 million remain.
The difference between the present value and the acquisition cost of the cover assets after the deduction of deferred
tax liabilities is € 0.3 million. The dividend payout restriction for such values enshrined in § 268 para. 8 of the German
Commercial Code does not affect the profit for the financial year 2013 as the disposable reserves plus the profit
carried forward are greater than the intangible fixed assets and the cover assets.

F-156
Repos
Repos are reported in accordance with § 340b of the German Commercial Code. Only genuine repos are completed.
Securities and other assets with a book value totalling € 3,889.3 million (€ 12,858.4 million) were committed by
NORD/LB within the scope of genuine repos. The counterparty risk is manageable.
Special investment assets
Name of the special asset NORD/LB AM 65 NORD/LB AM ALCO
Former NORDCON-Fonds SP 56 –
Type of special asset Special asset Special asset
Investment objective The objective of the fund is diversified investment in asset-backed securities.
The asset-backed securities of the fund are part of the ABS-Workout portfolio of
NORD/LB Anstalt öffentlichen Rechts.
The fund is part of the ALCO-portfolio and thus part of the
strategic investments.
Reporting date 31 Dec. 2013 31 Dec. 2013
Special assets (in € 000) 125 231 1 089 613
Shares – total 1 253 136 10 562 800
Currency of shares EUR EUR
Shares of NORD/LB as at the reporting date 1 253 136 10 562 800
Values of the shares according to § 26 of the German Investment Act (InvG) as at reporting date 99.93 103.15
Carrying amount (in € 000) 123 384 1 083 762
Difference between fair value and carrying amount (in € 000) 1 847 5 852
Dividends paid out in the final year acc. to shares of NORD/LB (gross in € 000) – 4 667
Reporting year of NORD/LB 1 Jan. – 31 Dez. 1 Jan. – 31 Dez.
Reporting year of the special asset 1 Jan. – 31 Dez. 1 Jan. – 31 Dez.
Restrictions in the possibility of daily return None None
Reasons for no write-down § 253 para. 3 clause 4 of the German Commercial Code – –
Pointers for the loss of value not being permanent – –

F-157
8. Cover statement (Old portfolio / issues before 19 July 2005)
(in € 000) 31 Dec. 2013 31 Dec. 2012
Mortgage bond coverage
Liabilities requiring cover
Pfandbriefe 0 1 027 000
discharged and cancelled items 0 0
Registered Pfandbriefe (as security on loans taken up) 0 0
0 1 027 000
Covering assets
Loans to customers secured by mortgages 0 1 033 226
Public issuer securities 0 200 000
Substitute credit institution cover 0 130 000
0 1 363 226
Surplus cover 0 336 226
Municipal cover
Liabilities requiring cover
Municipal debentures 2 787 210 4 776 820
discharged and cancelled items 0 0
Registered municipal debentures (to secure loans taken up) 300 962 664 027
3 088 172 5 440 847
Covering assets
Municipal loans
to financial institutions 905 431 1 773 714
to customers 2 886 519 4 022 317
Public issuer securities 395 378 413 373
Fixed deposits from public-sector banks 0 0
Substitute credit institution cover 100 000 810 108
4 287 329 7 019 512
Surplus cover 1 199 157 1 578 665
This old portfolio (cover and in circulation) was encapsulated in accordance with § 51 of the Covered Bond Act and
is held separately from the new cover in accordance with the regulations applicable up until the Covered Bond Act
came into effect.
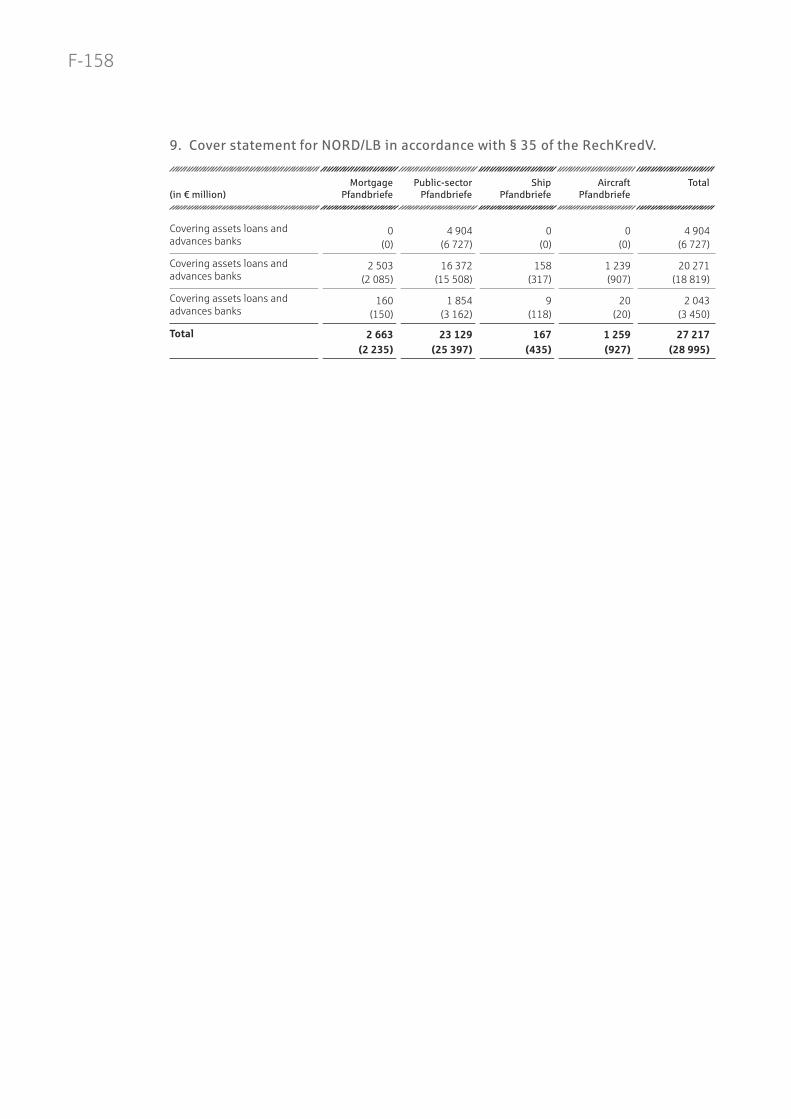
F-158
9. Cover statement for NORD/LB in accordance with § 35 of the RechKredV.
(in € million)
Mortgage
Pfandbriefe
Public-sector
Pfandbriefe
Ship
Pfandbriefe
Aircraft
Pfandbriefe
Total
Covering assets loans and advances banks
0 4 904 0 0 4 904 (0) (6 727) (0) (0) (6 727)
Covering assets loans and advances banks
2 503 16 372 158 1 239 20 271 (2 085) (15 508) (317) (907) (18 819)
Covering assets loans and advances banks
160 1 854 9 20 2 043 (150) (3 162) (118) (20) (3 450)
Total 2 663 23 129 167 1 259 27 217
(2 235) (25 397) (435) (927) (28 995)

F-159
10. Pfandbriefe for NORD/LB in accordance with § 28 of the Covered Bond Act
Pfandbriefe in circulation and cover pools:
(in € million)
Nominal Cash value Risk cash asset
+ 250 bp
Risk cash asset
– 250 bp
Risk cash asset
of currency
Mortgage Pfandbriefe
Total circulation 1 543 1 611 1 560 1 640 1 560 (755) (839) (780) (864) (780)
Guarantee fund total 1) 2 663 2 884 2 704 2 995 2 687 (2 235) (2 459) (2 309) (2 517) (2 280)
Excess coverage 1 120 1 273 1 144 1 355 1 127
(1 480) (1 620) (1 529) (1 653) (1 500)
Excess coverage in per cent 73 79 73 83 72 (196) (193) (196) (191) (192)
Public-sector Pfandbriefe
Total circulation 16 519 18 475 16 321 20 645 16 827 (18 080) (20 784) (18 360) (22 609) (18 756)
Guarantee fund total 2) 23 129 25 427 22 811 28 026 22 911 (25 397) (28 730) (25 723) (30 928) (25 817)
Excess coverage 6 610 6 952 6 490 7 380 6 084
(7 317) (7 946) (7 363) (8 319) (7 061)
Excess coverage in per cent 40 38 40 36 36 (40) (38) (40) (37) (38)
Ship Pfandbriefe
Total circulation 90 89 82 93 82 (200) (201) (191) (205) (191)
Guarantee fund total 3) 167 174 165 179 138 (435) (450) (429) (455) (375)
Excess coverage 77 85 84 86 57
(235) (249) (238) (250) (184)
Excess coverage in per cent 85 95 103 93 70 (118) (124) (125) (122) (96)
Aircraft Pfandbriefe
Total circulation 506 522 479 539 479 (506) (530) (476) (547) (476)
Guarantee fund total 4) 1 259 1 355 1 242 1 442 1 048 (927) (1 042) (951) (1 086) (806)
Excess coverage 753 832 763 903 568
(421) (511) (475) (539) (330)
Excess coverage in per cent 149 159 159 167 119 (83) (97) (100) (99) (70)
1) Amounts acc. to § 19, para. 1, no. 2 and 3 are not included in the cover pool.2) Amounts acc. to § 20, para. 2, no. 2 are included in the cover pool in the amount of € 673 million (€ 811 million).3) Amounts acc. to § 26, para. 1, no. 3 and 4 are not included in the cover pool.4) Amounts acc. to § 26f, para. 1, no. 3 and 4 are not included in the cover pool.
Derivatives acc. to § 19, para 1, no. 4 in connection with § 20, para. 2, no. 3 and § 26, para. 1, no. 5 are not included in
the cover pool.

F-160
Maturity structure of the Pfandbriefe in circulation, fixed interest periods and cover pools:
(in € million)
less than
1 year
more than
1 year but
less than
2 years
more than
2 years but
less than
3 years
more than
3 years but
less than
4 years
more than
4 years but
less than
5 years
more than
5 years but
less than
10 years
more than
10 years
Mortgage Pfandbriefe
30 74 258 0 0 1 131 50 (204) (50) (63) (257) (0) (131) (50)
Guarantee fund total
373 313 367 297 228 1 045 39 (424) (265) (278) (291) (219) (744) (14)
Public-sector Pfandbriefe
2 172 1 891 2 156 832 1 069 5 001 3 399
(2 833) (2 047) (1 953) (2 129) (899) (4 583) (3 636)
Guarantee fund total
2 823 2 889 2 259 2 438 1 703 6 472 4 544 (2 433) (3 006) (4 479) (2 038) (2 247) (6 747) (4 447)
Ship Pfandbriefe
10 0 0 50 30 0 0 (110) (10) (0) (0) (50) (30) (0)
Guarantee fund total
58 42 26 15 8 11 6 (195) (72) (54) (47) (30) (37) (0)
Aircraft Pfandbriefe
0 0 0 501 0 5 0
(0) (0) (0) (0) (501) (5) (0)
Guarantee fund total
192 146 166 148 213 393 0 (124) (188) (88) (109) (90) (287) (41)
Receivables used to cover Pfandbriefe by size:
(in € million)
Covering
assets
Over-colla-
teralisation
Securing
liquidity
Total
Mortgage Pfandbriefe
Less than € 0.3 million1 032 0 0 1 032 (973) (0) (0) (973)
More than € 0.3 million and less than € 5 million645 0 0 645
(480) (0) (0) (480)
More than € 5 million826 50 110 986
(632) (40) (110) (782)
2 503 50 110 2 663 (2 085) (40) (110) (2 235)
Ship Pfandbriefe (ocean-going vessels only)
Less than € 0.5 million3 0 0 3
(1) (0) (0) (1)
More than € 0.5 million and less than € 5 million79 0 3 82
(180) (5) (5) (190)
More than € 5 million75 6 0 81
(137) (8) (100) (245)
158 6 3 167 (318) (13) (105) (435)
Aircraft Pfandbriefe
Less than € 0.5 million0 0 0 0
(0) (0) (0) (0)
More than € 0.5 million and less than € 5 million157 0 0 157 (94) (0) (0) (94)
More than € 5 million1 081 20 0 1 101 (814) (20) (0) (834)
1 239 20 0 1 259 (908) (20) (0) (927)

F-161
Receivables used to cover mortgage Pfandbriefe by country in which the land securities are located and by type
of use:
(in € million) Germany Luxembourg Austria Poland USA Total
Covering assets commercial
Office Buildings 266 116 0 0 92 474 (252) (117) (0) (23) (164) (556)
Nonresidential Building 160 0 9 0 0 169 (130) (0) (9) (0) (0) (139)
Industrial Building 11 0 0 0 0 11 (5) (0) (0) (0) (0) (5)
Other commercialreal estate
175 0 0 0 0 175 (180) (0) (0) (0) (0) (180)
Unfinished and Non-ProductiveNew Buildings
0 0 0 0 0 0 (0) (0) (0) (0) (0) (0)
Building sites 0 0 0 0 4 4 (0) (0) (0) (0) (0) (0)
Covering assets residential
Condominiums 183 0 0 0 0 183 (175) (0) (0) (0) (0) (175)
One- and Twofamily houses 655 0 0 0 0 655 (621) (0) (0) (0) (0) (621)
Apartment Buildings 831 0 0 0 0 831 (409) (0) (0) (0) (0) (409)
Unfinished and Non-ProductiveNew Buildings
0 0 0 0 0 0 (0) (0) (0) (0) (0) (0)
Building sites 1 0 0 0 0 1 (0) (0) (0) (0) (0) (0)
Subtotal 2 282 116 9 0 96 2 503
(1 772) (117) (9) (23) (164) (2 085)
Over-collateralisation 50 0 0 0 0 50 (40) (0) (0) (0) (0) (40)
Securing liquidity 110 0 0 0 0 110 (110) (0) (0) (0) (0) (110)
Total 2 442 116 9 0 96 2 663
(1 922) (117) (9) (23) (164) (2 235)
The value of receivables used to cover mortgage Pfandbriefe which were outstanding by at least 90 days was
€ 34 thousand (€ 8 thousand) for land securities in Germany.
There were no cases of forced sale, forced receivership or takeovers of land to prevent losses. The total arrears
on interest to be paid by mortgage debtors were € 0.042 million (€ 0.003 million) for commercial property and
€ 0.439 million (€ 0.111 million) for residential property.

F-162
Receivables used to cover public sector Pfandbriefe by type of debtor or granting authority and their location:
(in € million)
Country Regional local
authorities
Public local
authorities
Other
debtors 1)
Total
Germany 1 324 7 243 4 904 6 184 19 655 (1 288) (7 227) (4 982) (9 269) (22 766)
Belgium 4 0 0 0 4 (0) (0) (0) (0) (0)
Great Britain 54 0 0 0 54 (63) (0) (0) (0) (63)
Finnland 26 0 0 0 26 (62) (0) (0) (0) (62)
Canada 77 0 0 0 77 (0) (0) (0) (0) (0)
Latvia 0 0 43 0 43 (0) (0) (45) (0) (45)
Luxembourg 0 0 0 0 0 (0) (0) (0) (106) (106)
Austria 120 0 0 164 284 (157) (0) (0) (258) (415)
Switzerland 4 0 0 0 4 (5) (0) (0) (0) (5)
USA 445 0 0 12 457 (483) (0) (0) (0) (483)
1) The additional coverage in accordance with § 20, sec. 2, No. 2, the over-collateralisation acc. to § 4, No. 1 and the securing liquidity
acc. to § 4, sec. 1a PfandBG are not taken into account any longer.
As in the previous year, no receivables were used to cover mortgage Pfandbriefe which were outstanding by
90 days or more.
Receivables used to cover ship Pfandbriefe by country in which the ships and shipbuilding yards lent against are
registered, broken down by ship type:
(in € million)
Covering assets
Maritime
navigation
31 Dec. 2013
Maritime
navigation
31 Dec. 2012
Inland
shipping
navigation
31 Dec. 2013
Inland
shipping
navigation
31 Dec. 2012
Other
31 Dec. 2013
Other
31 Dec. 2012
Germany 119 254 0 0 9 118
Cyprus 38 63 0 0 0 0
There were no cases of forced sale, forced receivership or takeovers of ships or shipbuilding to prevent losses. The
total arrears on interest to be paid by loan debtors were € 0.0 million (€ 0.0 million) for ocean-going ships and
€ 0.0 million (€ 0.0 million) for inland ships
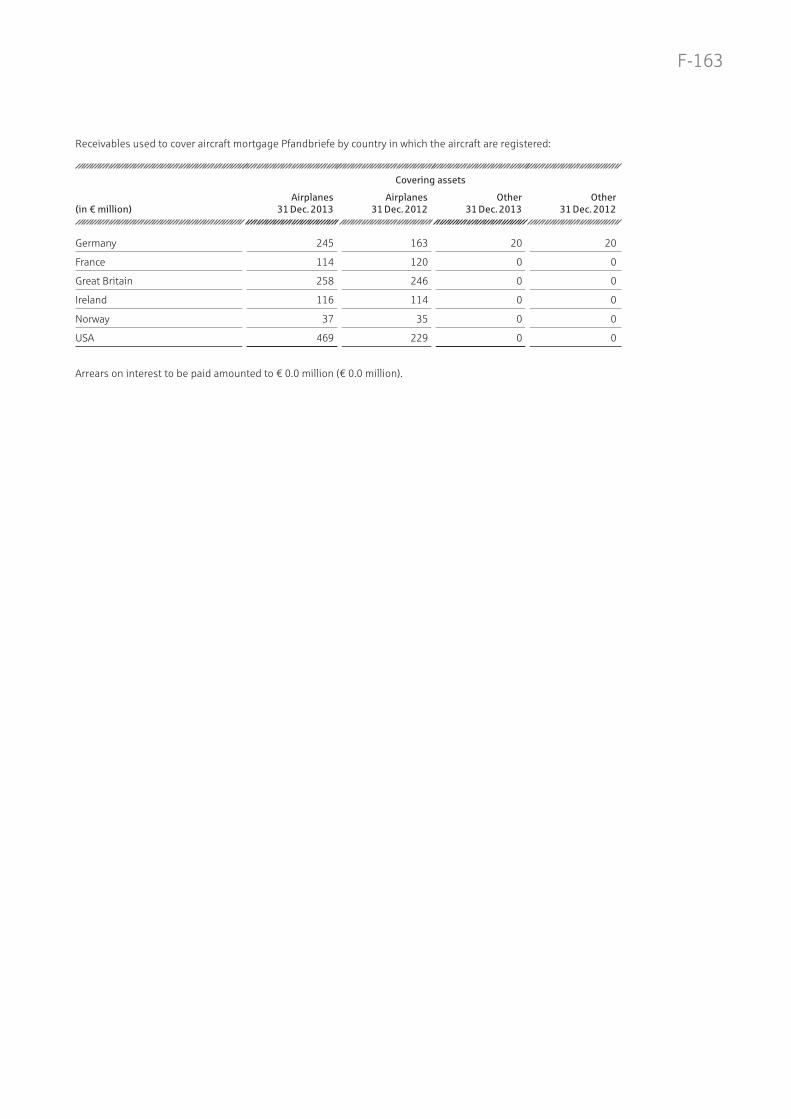
F-163
Receivables used to cover aircraft mortgage Pfandbriefe by country in which the aircraft are registered:
(in € million)
Covering assets
Airplanes
31 Dec. 2013
Airplanes
31 Dec. 2012
Other
31 Dec. 2013
Other
31 Dec. 2012
Germany 245 163 20 20
France 114 120 0 0
Great Britain 258 246 0 0
Ireland 116 114 0 0
Norway 37 35 0 0
USA 469 229 0 0
Arrears on interest to be paid amounted to € 0.0 million (€ 0.0 million).

F-164
11. List of equity holdings
The list below contains the equity holdings in accordance with § 285 no. 11 and 11a HGB and investments in terms of
§ 340a para. 4 no. 2 HGB. Included are all companies in which there is an equity holding of 20 per cent or more, unless
they are of minor significance for the presentation of the assets, financial and earnings position, and investments in
large corporations which exceed 5 per cent of the voting rights.
No. Name / registered office Share of
capital
held
(in %)
Equity
(in € 000)
Profit /Loss
(in € 000)
Affiliated companies
1 BGG Bremen GmbH & Co. KG, Bremen 1) 8) 100.00 141 – 7
2 BGG Oldenburg GmbH & Co. KG, Bremen 1) 8) 100.00 7 815 910
3 BLB Grundbesitz KG, Bremen 1) 8) 100.00 47 800 473
4 BLB Immobilien GmbH, Bremen 1) 8) 100.00 15 386 0
5 BLB Leasing GmbH, Oldenburg 1) 8) 10) 100.00 511 0
6 BLBI Beteiligungs-GmbH, Bremen 1) 8) 100.00 65 7
7 BLBI Investment GmbH & Co. KG, Bremen 1) 8) 100.00 42 400 3 664
8 Braunschweig Advisors GmbH, Braunschweig 1) 7) 100.00 89 44
9 Braunschweig Gesellschaft mit beschränkter Haftung, Braunschweig 3) 8) 100.00 9 061 0
10 Braunschweig Grund Objektgesellschaft Driebenberg mbH & Co. KG, Braunschweig 2) 7) 100.00 608 220
11 Braunschweig Grundstücksentwicklungsgesellschaft mbH, Braunschweig 1) 7) 100.00 31 2
12 Braunschweig-Beteiligungsgesellschaft mbH, Braunschweig 1) 7) 100.00 8 597 0
13 Braunschweig-Informationstechnologie-GmbH, Braunschweig 1) 8) 100.00 3 160 0
14 Bremer Landesbank Kreditanstalt Oldenburg – Girozentrale –, Bremen 8) 10) 54.83 1 343 069 36 300
15 Bremische Grundstücks-GmbH, Bremen 1) 8) 100.00 56 841 2 600
16 Bremische Grundstücks-GmbH & Co. KG Präsident-Kennedy-Platz, Bremen 1) 8) 100.00 100 797
17 Bremische Grundstücks-GmbH & Co. Wohnanlagen Groß-Bonn, Bremen 1) 8) 100.00 150 59
18 City Center Magdeburg Hasselbach-Passage Grundstücksgesellschaft mbH, Hanover 7) 100.00 1 1
19 Deutsche Hypo Delaware Blocker Inc., Wilmington, USA 1) 7) 100.00 7 059 – 2 463
20 Deutsche Hypothekenbank (Actien-Gesellschaft), Hanover 3) 8) 10) 100.00 913 172 0
21 FL FINANZ-LEASING GmbH, Wiesbaden 2) 8) 58.00 105 – 102
22 Flying Sun Shipping Ltd., Valletta, Malta 1) 13) 100.00 – –
23 General Partner N666DN GP, LLC, Wilmington, USA 13) 100.00 – –
24 IRC Verwaltung GmbH & Co. Objekt Nienburg KG, Pullach i. Isartal 1) 7) 98.00 24 0
25 IRC Verwaltung GmbH & Co. Objekt Unterföhring KG, Pullach i. Isartal 1) 7) 98.00 23 0
26 KreditServices Nord GmbH, Braunschweig 3) 8) 100.00 581 0
27 LBT Holding Corporation Inc., Wilmington, USA 7) 100.00 885 1 239
28 LHI Leasing GmbH & Co. Immobilien KG, Pullach i. Isartal 2) 7) 90.00 1 015 21
29 MALIBO GmbH & Co. Unternehmensbeteiligungs KG, Pullach i. Isartal 8) 77.81 7 302 581
30 NBN Grundstücks- und Verwaltungs-GmbH, Hanover 1) 7) 100.00 735 5
31 NBN Norddeutsche Beteiligungsgesellschaft für Immobilien in Niedersachsen mbH, Hanover 2) 7) 90.00 946 – 57
32 New Owner Participant – N666DN OP, L. P., Wilmington, USA 2) 13) 100.00 – –
33 Nieba GmbH, Hanover 3) 8) 100.00 162 700 0
34 NORD/Advisors Norddeutsche Financial & Strategic Advisors GmbH, Hanover 7) 100.00 39 – 1
35 NORD/FM Norddeutsche Facility Management GmbH, Hanover 3) 8) 100.00 636 0
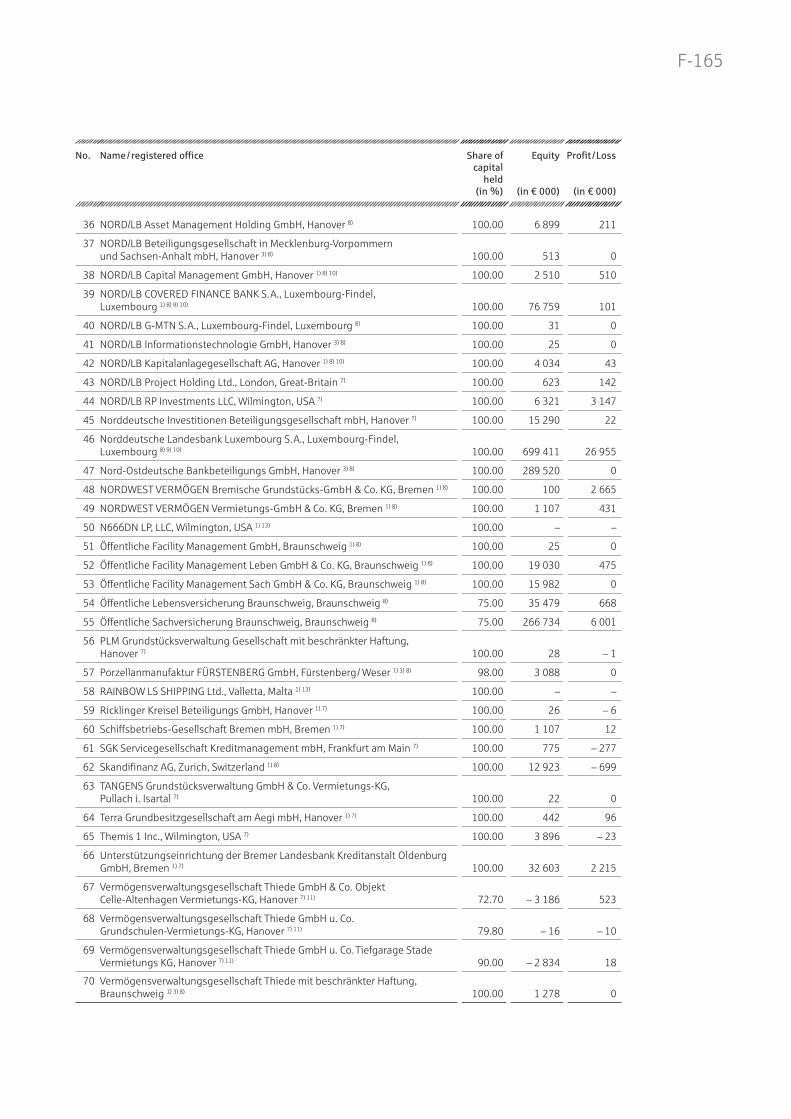
F-165
No. Name / registered office Share of
capital
held
(in %)
Equity
(in € 000)
Profit /Loss
(in € 000)
36 NORD/LB Asset Management Holding GmbH, Hanover 8) 100.00 6 899 211
37 NORD/LB Beteiligungsgesellschaft in Mecklenburg-Vorpommern und Sachsen-Anhalt mbH, Hanover 3) 8) 100.00 513 0
38 NORD/LB Capital Management GmbH, Hanover 1) 8) 10) 100.00 2 510 510
39 NORD/LB COVERED FINANCE BANK S.A., Luxembourg-Findel, Luxembourg 1) 8) 9) 10) 100.00 76 759 101
40 NORD/LB G-MTN S.A., Luxembourg-Findel, Luxembourg 8) 100.00 31 0
41 NORD/LB Informationstechnologie GmbH, Hanover 3) 8) 100.00 25 0
42 NORD/LB Kapitalanlagegesellschaft AG, Hanover 1) 8) 10) 100.00 4 034 43
43 NORD/LB Project Holding Ltd., London, Great-Britain 7) 100.00 623 142
44 NORD/LB RP Investments LLC, Wilmington, USA 7) 100.00 6 321 3 147
45 Norddeutsche Investitionen Beteiligungsgesellschaft mbH, Hanover 7) 100.00 15 290 22
46 Norddeutsche Landesbank Luxembourg S.A., Luxembourg-Findel, Luxembourg 8) 9) 10) 100.00 699 411 26 955
47 Nord-Ostdeutsche Bankbeteiligungs GmbH, Hanover 3) 8) 100.00 289 520 0
48 NORDWEST VERMÖGEN Bremische Grundstücks-GmbH & Co. KG, Bremen 1) 8) 100.00 100 2 665
49 NORDWEST VERMÖGEN Vermietungs-GmbH & Co. KG, Bremen 1) 8) 100.00 1 107 431
50 N666DN LP, LLC, Wilmington, USA 1) 13) 100.00 – –
51 Öffentliche Facility Management GmbH, Braunschweig 1) 8) 100.00 25 0
52 Öffentliche Facility Management Leben GmbH & Co. KG, Braunschweig 1) 8) 100.00 19 030 475
53 Öffentliche Facility Management Sach GmbH & Co. KG, Braunschweig 1) 8) 100.00 15 982 0
54 Öffentliche Lebensversicherung Braunschweig, Braunschweig 8) 75.00 35 479 668
55 Öffentliche Sachversicherung Braunschweig, Braunschweig 8) 75.00 266 734 6 001
56 PLM Grundstücksverwaltung Gesellschaft mit beschränkter Haftung, Hanover 7) 100.00 28 – 1
57 Porzellanmanufaktur FÜRSTENBERG GmbH, Fürstenberg/ Weser 1) 3) 8) 98.00 3 088 0
58 RAINBOW LS SHIPPING Ltd., Valletta, Malta 1) 13) 100.00 – –
59 Ricklinger Kreisel Beteiligungs GmbH, Hanover 1) 7) 100.00 26 – 6
60 Schiffsbetriebs-Gesellschaft Bremen mbH, Bremen 1) 7) 100.00 1 107 12
61 SGK Servicegesellschaft Kreditmanagement mbH, Frankfurt am Main 7) 100.00 775 – 277
62 Skandifinanz AG, Zurich, Switzerland 1) 8) 100.00 12 923 – 699
63 TANGENS Grundstücksverwaltung GmbH & Co. Vermietungs-KG, Pullach i. Isartal 7) 100.00 22 0
64 Terra Grundbesitzgesellschaft am Aegi mbH, Hanover 1) 7) 100.00 442 96
65 Themis 1 Inc., Wilmington, USA 7) 100.00 3 896 – 23
66 Unterstützungseinrichtung der Bremer Landesbank Kreditanstalt Oldenburg GmbH, Bremen 1) 7) 100.00 32 603 2 215
67 Vermögensverwaltungsgesellschaft Thiede GmbH & Co. Objekt Celle-Altenhagen Vermietungs-KG, Hanover 7) 11) 72.70 – 3 186 523
68 Vermögensverwaltungsgesellschaft Thiede GmbH u. Co. Grundschulen-Vermietungs-KG, Hanover 7) 11) 79.80 – 16 – 10
69 Vermögensverwaltungsgesellschaft Thiede GmbH u. Co. Tiefgarage Stade Vermietungs KG, Hanover 7) 11) 90.00 – 2 834 18
70 Vermögensverwaltungsgesellschaft Thiede mit beschränkter Haftung, Braunschweig 1) 3) 8) 100.00 1 278 0

F-166
1) Held indirectly. 2) Including shares held indirectly. 3) Letter of comfort exists. 4) Data as at 31 Dec. 2010 is available.5) Data as at 31 Dec. 2011 is available.6) Data as at 30 Sep. 2012 is available (different financial year).7) Data as at 30 Dec. 2012 is available.8) Preliminary data as at 31 Dec. 2013.
9) Values in the financial statements in accordance with IAS / IFRS.10) Disclosure also in accordance with § 340a para. 4 no. 2 of the German
Commercial Code (banks are interpreted as large corporate entities). 11) The company is not actually overindebted.12) No disclosure in accordance with § 286 para. 3 clause 2 of the German
Commercial Code.13) Equidity as defined in §§ 266 and 272 HGB of the German Commercial
Code less outstanding contributions.
No. Name / registered office Share of
capital
held
(in %)
Equity
(in € 000)
Profit /Loss
(in € 000)
Other companies of min. 20 per cent share
1 Adler Funding LLC, Dover, USA 1) 7) 21.88 5 800 9 802
2 Ammerländer Wohnungsbau-Gesellschaft mbH, Westerstede 1) 7) 32.26 29 466 1 319
3 BREBAU GmbH, Bremen 1) 7) 10) 48.84 55 361 7 672
4 Bremer Spielcasino GmbH & Co. Kommanditgesellschaft, Bremen 1) 7) 12) 49.00 – –
5 Brocken Verwaltungs- und Vermietungs-GmbH & Co. KG, Wernigerode 7) 50.00 4 500 415
6 Bürgschaftsbank Mecklenburg-Vorpommern GmbH, Schwerin 7) 10) 20.89 15 488 192
7 Bürgschaftsbank Sachsen-Anhalt GmbH, Magdeburg 7) 10) 20.44 12 625 760
8 Deutsche Factoring Bank Deutsche Factoring GmbH & Co., Bremen 1) 7) 10) 27.50 102 366 24 197
9 Gewobau Gesellschaft für Wohnungsbau, Vechta, mbH, Vechta 1) 7) 20.46 10 854 688
10 GSG Oldenburg Bau- und Wohngesellschaft mit beschränkter Haftung, Oldenburg 1) 7) 10) 22.22 82 437 3 496
11 Grundstücksgemeinschaft Escherweg 5 GbR, Bremen 1) 8) 50.00 – 2 319 – 378
12 Immobilien Development und Beteiligungsgesellschaft Niedersachsen mit beschränkter Haftung IDB & Co. – Objekt Zietenterrassen – KG, Göttingen 2) 7) 52.56 3 353 627
13 INI International Neuroscience Institute Hannover GmbH, Hanover 1) 4) 22.70 – 11 857 – 726
14 LBS Norddeutsche Landesbausparkasse Berlin-Hannover, Hanover 1) 7) 10) 44.00 297 458 0
15 LHI Leasing GmbH, Pullach i. Isartal 2) 8) 10) 49.00 50 339 6 589
16 LINOVO Productions GmbH & Co. KG, Pöcking 7) 11) 45.17 – 47 113 984
17 LUNI Productions GmbH & Co. KG, Pöcking 7) 11) 24.29 – 115 653 – 83
18 Medical Park Hannover GmbH, Hanover 1) 7) 50.00 2 484 233
19 Medicis Nexus GmbH & Co. KG, Icking 5) 66.01 9 224 720
20 Mittelständische Beteiligungsgesellschaft Mecklenburg-Vorpommern mbH, Schwerin 7) 26.00 11 040 837
21 Mittelständische Beteiligungsgesellschaft Niedersachsen (MBG) mit beschränkter Haftung, Hanover 7) 39.82 10 437 770
22 NBV Beteiligungs-GmbH, Hamburg 2) 7) 42.66 19 862 2 211
23 NORD KB Beteiligungsgesellschaft mit beschränkter Haftung, Hanover 7) 28.66 4 405 2 283
24 Öffentliche Versicherung Bremen, Bremen 1) 7) 20.00 6 020 60
25 SALEG Sachsen-Anhaltinische-Landesentwicklungsgesellschaft mbH, Magdeburg 7) 56.61 14 010 545
26 Toto-Lotto Niedersachsen GmbH, Hanover 7) 10) 49.85 29 392 19 163
27 USPF III Beteiligungsgesellschaft mbH & Co. KG, Düsseldorf 1) 6) 42.86 1 818 338
28 Wohnungsbaugesellschaft Wesermarsch mit beschränkter Haftung, Brake 1) 7) 21.72 18 785 380
NORD/LB is a partner with unlimited liability in the following company (§ 285 no. 11a HGB)
1 GLB GmbH & Co. OHG, Frankfurt am Main
Investments in terms of § 340a para. 4 no. 2 of the German Commercial Code,unless reported as an affiliated company or other shareholding
1 HCI HAMMONIA SHIPPING AG, Hamburg
2 Niedersächsische Bürgschaftsbank (NBB) Gesellschaft mit beschränkter Haftung, Hanover

F-167
The management report is neither included
nor incorporated by reference into this Prospectus.

F-168
The following is an English translation of the auditor’s report, which has been prepared on the basis of the German
language version of the Financial Statements and the Management Report.
AUDITOR’S REPORT
“We have audited the annual financial statements, consisting of the balance sheet, income statement and notes, tak-
ing into account the accounting and the management report of Norddeutsche Landesbank – Girozentrale –, Hannover,
Braunschweig and Magdeburg (NORD/LB) for the financial year from 1 January to 31 December 2013. Under German
commercial law, NORD/LB’s Managing Board is responsible for the accounting and preparing the annual financial
statements and management report. Our responsibility is to express an opinion on the annual financial statements
including the accounting and the management report based on our audit.
We conducted our audit of the annual financial statements in accordance with § 317 of the German Commercial Code
(HGB) and the generally accepted German standards for the audit of financial statements promulgated by the Institut
der Wirtschaftsprüfer (Institute of Public Auditors in Germany) (IDW). These standards require that we plan and con-
duct the audit such that misstatements materially affecting the presentation of the assets, financial and earnings
position in the annual financial statements taking into account generally accepted accounting principles and in the
management report are detected with reasonable assurance. Knowledge of the business activities and the economic
and legal environment of NORD/LB and expectations as to possible misstatements are taken into account in the
determination of audit procedures. The effectiveness of the accounting-related internal control system and the evi-
dence supporting the information in the accounting, annual financial statements management report are examined
primarily on a test basis within the framework of the audit. The audit includes assessing the accounting principles
used and significant estimates made by the Managing Board, as well as evaluating the overall presentation of the
annual financial statements and the management report. We believe that our audit provides a reasonable basis for
our opinion.
Our audit has not led to any reservations.
In our opinion, based on the findings of our audit, the annual financial statements comply with the legal regulations
and taking into account generally accepted accounting principles give a true and fair view of the assets, financial and
earnings position of NORD/LB in accordance with these requirements. The management report is consistent with the
annual financial statements and overall provides an accurate view of the position of NORD/LB and accurately presents
the opportunities and risks concerning future development.”
Hanover, 21 February 2014
KPMG AG
Wirtschaftsprüfungsgesellschaft
Ufer
Wirtschaftsprüfer
[German Public Auditor]
Leitz
Wirtschaftsprüfer
[German Public Auditor]

page 190 of 190
VII. RESPONSIBILITY Norddeutsche Landesbank – Girozentrale – with its registered Office at 30159 Hanover, Friedrichswall 10, accepts responsibility for the information contained in this Supplement No. 1 of 16 May 2014. To the best of the knowledge and belief of the Norddeutsche Landesbank – Girozentrale – (which has taken all reasonable care to ensure that such is the case) the information contained in this Supplement No. 1 of 16 May 2014 is in accordance with the facts and does not omit anything likely to affect the import of such information. Hanover, 16 May 2014 NORDDEUTSCHE LANDESBANK GIROZENTRALE Dr. Lotze Zachlod