nonlinear analysis to evaluate damage of rc structures … · nonlinear analysis to evaluate damage...
TRANSCRIPT
NONLINEAR ANALYSIS TO EVALUATE DAMAGE OF RC STRUCTURES DUE TO EARTHQUAKE
Hikaru NAKAMURA1
SUMMARY
A destructive damage which leads to the loss of human life shall be prevented against a strong earthquake ground motions. In addition, from social and economic points of view, livelihood and productive activities of inhabitants after the earthquake should be restored smoothly with rapid restoration of the structures. This paper presents the damage of concrete structures due to recent earthquakes and the brief outline of the JSCE Standard Specifications for Seismic Performance Verification published in 2002. Then two topics related with the damage were discussed. First, the strain localization problems of nonlinear finite element analysis were described and an advanced method based on non-local continuum theory to obtain the reliable local strain was proposed. Second, the influence of the buckling on seismic performance was discussed. Keywords: seismic performance verification; restoration; strain localization; non-local theory; buckling; dynamic response.
INTRODUCTION
It was observed the destructive damages of many concrete structures in the The Hanshin-Awaji (Kobe) Earthquake in January, 1995. As the result, the JSCE Standard Specification for 'Seismic Design' was established in 1996[JSCE 1996], in which the methods for seismic performance verification of concrete structures were described. The specification was revised in 2002 based on the concept of the performance based design and was published as renamed 'Seismic Performance Verification'[JSCE 2002]. In the specification, the nonlinear analysis, in principle, is performed to verify the seismic performance with modeling of the structures and the ground. In past two decades, nonlinear finite element analysis for concrete structures has advanced remarkably with the developments of sophisticated constitutive models, robust numerical
1 Professor, Department of Civil Engineering, Nagoya University, JAPAN, e-mail: [email protected]
algorisms and analytical theories. At present, the nonlinear analysis are used to simulate most behaviors of concrete structures, such as the cracking, the stress flow, the load carrying capacity, the deformation capacity, the failure behavior and so on. Moreover, it became a most powerful tool to verify the required performance of concrete structures in performance based design. Especially, seismic performance permit yielding of member and some damages considering energy absorption for strong earthquakes. Then, the nonlinear analysis is useful to simulate post yielding and further post peak behavior. Advanced nonlinear analysis is possible to simulate dynamic behavior such as load displacement relationships, time response displacement and so on even in post peak region. The restoration ability as well as dynamic behavior is important in seismic performances. Then, it is desirable to simulate the local damage occurred in the concrete structures. The damage of concrete structures is classified with the spalling of cover concrete, the buckling of longitudinal reinforcement, the compression failure of concrete and so on. The simulation of the behaviors is, however, insufficient, especially relating with the local damage. This paper presents the damage of concrete structures due to recent earthquakes and the brief outline of the JSCE Standard Specifications for Seismic Performance Verification published in 2002. Then two topics related with the damage are discussed. First, the strain localization problems[Bazant et al. 1998, Jirasek et al. 2001] of nonlinear finite element analysis are described. In the problems, the influence on the reliability of numerical results related to the mesh sensitivity in local continuum theory are discussed. Then, an advanced method based on non-local continuum theory[Bazant et al. 1994, Borst et al. 1992] to obtain the reliable local strain is proposed and the effectiveness is discussed. Second, the influence of the buckling on seismic performance is simulated and is compared with test results. The necessity to consider the buckling of re-bars are shown.
DAMAGE OF CONCRETE STRUCTURES DUE TO RECENT EARTHQUAKES After the Hanshin-Awaji Earthquake on January 17, 1995, which was magnitude (Mj) of 7.2, the concrete structures have been damaged several earthquakes in Japan as listed in Table 1. In this chapter, the damage of concrete structures, especially the damage of railway and highway bridges, due to recent earthquakes in Japan are presented[JSCE 2004].
Table.1 Information of recent earthquakes Date Magnitude
(Mj) Type Recorded max.
acceleration Hanshin-Awaji Earthquake Jan. 17, 1995 7.2 inland 818 cm/s2 Geiyo Earthquake Mar. 24, 2001 6.7 intraslab 830 cm/s2 South of Sanriku-Oki Earthquake
May 26, 2003 7.1 intraslab 1106 cm/s2
Tokachi-Oki Earthquake Sept. 26, 2003 8.0 inter-plate 972 cm/s2 Niigata-ken Chuetsu Earthquake
Oct. 23, 2004 6.8 inland 1722 cm/s2
Noto-Hanto Earthquake May 25, 2007 6.9 inland 945 cm/s2 Niigata-ken Chuetsu-Oki Earthquake July 16, 2007 6.6 inland 813 cm/s2

South of Sanriku-Oki Earthquake on May 26, 2003 The South of Sanriku-Oki Earthquake on May 26, 2003, occurred at Off Miyagi Prefecture and the magnitude was 7.1. It was intraslab type earthquake in The Pacific Ocean plate. The epicenter was deep and it was about 71km. The recorded maximum acceleration was more than 1100cm/s2. The feature of the earthquake ground motion is that short-period wave is dominant. The severe damages in 5 one story RC elevated bridges of Tohoku Shinkansen were observed. The feature of these damages was that the end columns which is shorter than intermediate columns were mainly damaged. Photo.1 shows damaged Dai-san Otagi Bridge R2 of Tohoku Shinkansen which was constructed in 1977 to 1978. This is four bay one story RC frame elevated bridge. The end columns have severe condition for shear failure, since they are shorter than intermediate columns. Two of the end columns failed in shear with the spalling of cover concrete, while others were observed diagonal cracks. The damage due to flexure, however, were hardly observed. Tokachi-Oki Earthquake on September 26, 2003 The Tokachi-Oki Earthquake on September 26, 2003, occurred at Kushiro-Oki (southeast offshore of Hokkaido) and the magnitude was 8.0. Tsunami was also observed. It was typical inter-plate type earthquake. The recorded maximum acceleration was about 1000cm/s2. Around the focal area, an earthquake of magnitude 8.2 occurred on March 4, 1952, and an earthquake of magnitude 7.9 occurred on May 16, 1968 at south of this area. The feature of the earthquake ground motion was that long-period wave is dominant and the duration time is long. A fire of the oil storage tank caused by the sloshing occurred and the effect of the long-period wave was paid to attention. The concrete structures were mainly damaged in superstructure and substructure of railway and highway bridges. Toshibetsu-gawa railway bridge of Nemuro Line was constructed in 1966 to 1969. This is 13 spans girder PC bridge of 416m bridge length with RC piers of circular section. This bridge was damaged around the supports at The Kushiro-Oki Earthquake in 1993. Photo.2(a) shows damaged pier in which the spalling of concrete cover and the buckling of longitudinal re-bars were observed. Photo.2(b) shows the damage of the floor slab at the end of girder which occurred due to the collision between girders. Similar damage of bridge piers were observed in Uroho-gawa railway bridge. This is 4 spans PC bridge of 128m bridge length with RC piers of circular section. Photo.3 shows a damaged pier in which the spalling of concrete cover and the buckling of longitudinal re-bars were observed at cut-off section of the longitudinal re-bars. Photo.4 shows damaged Chiyoda highway bridge which consists of middle bridge of 5 spans warren truss constructed in 1954 and side bridge of 5 spans PC girder constructed in 1966. The flexural failure in the piers of PC girder bridge as shown in Photo.4(a) and the punching shear failure at a support of warren truss bridge due to horizontal force from anchor as shown in Photo.4(b) occurred. The feature of the damage of the piers was the flexural cracks, the spalling of concrete cover and the buckling of longitudinal re-bars. Similar failure at support was already observed in The Hanshin-Awaji Earthquake. Niigata-ken Chuetsu Earthquake on October 23, 2004
The Niigata-ken Chuetsu Earthquake on October 23, 2004, occurred at Mid Niigata Prefecture and the magnitude was 6.8. It was caused by inland active fault. The depth of the epicenter was about 13km. The recorded maximum acceleration was more than 1500cm/s2. The recorded maximum acceleration for this earthquake is much greater than that for The Hanshin-Awaji Earthquake. The feature of the earthquake was that many aftershocks including some magnitude 6 class events have been following. Aftershocks were distributed along the northeast and southwest direction with a length of about 30km. Several concrete structures of railway and highway bridges were damaged. Photo.5 shows the damage of Uono-gawa bridge of Joetsu Shinkansen, which is three spans box girder PC bridge. In 2P and 3P with circular RC section of 6.5m diameter, the spalling of concrete cover and buckling of longitudinal re-bars were observed at the mid height. Lateral ties at the location were found to detach. The failure occurred at the location of cut-off section of the longitudinal re-bars. Three steel arcs with central angle little more than 120 degree were used to make circular ties. No hooks were provided in the lateral ties. Photo.6 shows the damage of Dai-san Wanazu bridge R1 of Joetsu Shinkansen, which is three bay one story RC frame elevated bridge. One of the end columns failed in shear as shown in Photo.6, while another one showed diagonal cracks. The end columns have severe condition for shear failure, since they are shorter than intermediate columns. This failure is the same as the one observed in The South of Sanriku-Oki Earthquake. These were designed by the same specifications for Shinkansen published in 1970 and 1972. It is noted that some columns of elevated bridge of Joetsu Shinkansen were strengthened by the steel jacketing before the earthquake as shown in Photo.7. As for them, no damage was observed and the effect of strengthening was confirmed.
JSCE STANDARD SPECIFICATION FOR CONCRETE STRUCTURES-2002 “SEISMIC PERFORMANCE VERIFICATION”
Outline of Seismic Performance Verification The provisions concerning the seismic performance of concrete structures had been specified as one chapter of the JSCE Standard Specification for Design until 1991 version. A similar form was planned to be adopted at the revision in 1996. However, it was necessary to present the specification based on a new design concept, since concrete structures were damaged destructively in The Hanshin-Awaji Earthquake 1995. Therefore, the specification for Seismic Design was established in 1996, in which the methods for seismic performance verification of concrete structures was described basically. In Seismic Design(1996), the modeling and the analytical method of the structures were not described enough. In Seismic Performance Verification(2002), these items were enhanced based on the knowledge of seismic performance and the advancement of the analytical technique afterwards. Especially, the items of (1)Loads (earthquake ground motion in verification), (2) Evaluation for the effect of ground, (3) Verification technique(analytical method) and (4) Structural details were enhanced. Moreover, it was systematized that the more reasonable seismic performance verification becomes possible. In order to indicate their

contents clearly, the specification 'Seismic Design' was renamed as 'Seismic Performance Verification'. Fig.1 shows the general procedure to verify the seismic performance based on Seismic Performance Verification(2002). Seismic Performance The required seismic performance for concrete structures was defined as described in Table 2. When setting seismic performance of a structure, it should be better to take its response characteristics into account according to the magnitude of an expected earthquake, as well as its behaviors during the earthquake and restoration ability after the earthquake. Needless to say that a destructive damage which leads to the loss of human life shall be prevented against a strong earthquake ground motion that has a rare probability of occurrence within the lifetime of a structure. In addition, from social and economic points of view, deterioration in functions of the structure should be avoided as much as possible, and livelihood and productive activities of inhabitants after the earthquake should be restored smoothly. Therefore, the seismic performances are related to the necessity of repair and/or strengthening and to the serviceability after an earthquake. The seismic performances are decided by the combination with serviceability, restoration ability and safety.
Table 2 Definition of seismic performance Seismic Performance 1
Function of the structure during an earthquake is maintained, and the structure is functional and usable without any repair after the earthquake.
Seismic Performance 2
Function of the structure can be restored within a short period after an earthquake and no strengthening is required.
Seismic Performance 3
There is no overall collapse of the structural system due to an earthquake even though the structure does not remain functional at the end of the earthquake.
Seismic Performance 1 means that the residual deformation of a structure after an earthquake remains sufficiently small. The performance is related to serviceability. Seismic Performance 2 is that load carrying capacity does not deteriorate after an earthquake. In general, this performance may be thought to be satisfied in case that each constitutive member of a structure does not fail in shear during an earthquake and response deformation does not reach its ultimate one. In case of structures such as wall type ones in which earthquake force acts mainly as in-plane force, large deformation capacity cannot be expected. In the design of such structures, it is necessary to provide sufficient shear capacity so that brittle failure may not occur. The performance is strongly related to serviceability and restoration ability. Seismic Performance 3 requires that whole structural systems do not collapse due to self and imposed masses, earth pressure, hydraulic (liquid) pressure, and so on, even if the structure becomes un-restorable after an earthquake. In case of concrete structures, generally Seismic Performance 3 can be satisfied if each constitutive member has enough safety against shear failure. In some structural systems, however, displacement of the whole structure becomes excessive, and the additional bending moment as well as longitudinal displacement increase due to the self weight. These may lead to self-overturning or collapse mechanism. The performance is related to safety.
Verification technique(analytical method) The performance verification techniques of concrete structures that used a nonlinear analysis have improved with the advancement of analytical environment after The Hanshin-Awaji Earthquake. It became possible to analyze the structure and the ground together. Analytical method is applied by finite element method based on the background of advancement of such technology. Structures should be modeled as an assembly of member models in which columns and beams are modeled as linear members and members with planar spread such as wall or floor are modeled as planer members. Basically, the linear member is modeled using beam element and planar member is modeled using plate or layered shell element. Strictly speaking, structures should be modeled three dimensionally, because it is composed of members connected in three dimensions. Two dimensional modeling of the structure may, however, be applied if only the response behavior in a two dimensional is considered according to the direction of input earthquake ground motion and characteristics of structural response. It is possible to model a linear member using plate or layered shell element. In general, however, modeling by using beam element is effective, since the computation time becomes shorter and accuracy does not decrease much. The beam element with fiber technique can consider the material nonlinearities easily in which the uni-axial stress-strain relationships of materials in each fiber cell are applied. Shell structures such as tank structures should be modeled as an assembly of shell elements for the whole structure, since the structure consists of one member. The pull-out of re-bar at joint of members is usually negligible. It is, however, desirable to use a joint element between members, when it is necessary to consider the effect of the pull-out of re-bar if the diameter of the re-bar is relatively large compared with the member size. In finite element method, mechanical model of materials are applied. Therefore, the constitutive model of concrete, reinforcing bar, and soil are described with those hysteresis and with notes to use. The hysteresis of concrete in compression and reinforcing bar are shown in Fig.2 and Fig.3, respectively.
REQUIREMENT AGAINST NONLINEAR ANALYSIS TO VERIFY SEISMIC PERFORMANCE
The nonlinear finite element analysis for concrete structures has advanced remarkably with the developments of sophisticated constitutive models, robust numerical algorisms and analytical theories. The importance of the nonlinear analysis has been increased in the performance based design and it became a most powerful tool to verify the required performance of concrete structures. Especially, seismic performance permit yielding of member and some damage considering energy absorption for strong earthquakes. It was described in previous chapter that the use of nonlinear analysis was already specified in JSCE Standard for the seismic performance verification. At present, the seismic performance of many structures are verified by the dynamic nonlinear analysis. Then, the safety during an earthquake are mainly checked by the response displacement and the shear resistance capacity. Seismic Performance 2 is generally satisfied, unless members fail in shear and unless the displacement reaches the ultimate displacement during an earthquake. These factors are
defined from mechanical view points. On the other hand, the important view points come from social and economic. The seismic performances are related to the restoration ability with the necessity of repair and/or strengthening and to the serviceability after an earthquake. Therefore, the restoration ability within a short period after an earthquake should be evaluated, because the damage of the structures can not avoid from a strong earthquake. The examples of repair after the earthquakes are shown in Photo.8 and Photo.9. Photo.8 shows repair process of a column of Tohoku Shinkansen damaged by The South of Sanriku-Oki Earthquake. The damaged column was repaired by injection of epoxy resin, cross sectional restoration and steel jacketing. Photo.9 shows a damaged and a repaired pier of Uroho-gawa railway bridge after The Tokachi-Oki Earthquake. The damaged column was repaired by injection of epoxy resin, cross sectional restoration and RC jacketing. In order to evaluate the restoration ability, the damage of concrete structures as well as the plastic deformation should be evaluated accurately. Although the plastic deformation which is a index corresponding to structure behavior, is often identified with damage index indirectly, the damage which is local behavior in the structures should be evaluated directly. The damage of concrete structures is classified with spalling of cover concrete, buckling of longitudinal reinforcement, compression failure of concrete and so on. They will occur in a localized area such as plastic hinge. Therefore, a requirement against nonlinear analysis for the restoration is to make clear the localized area and the local strain as a damage index for the damage evaluation. Other requirements are listed such as a) the behavior of the damaged structures during an earthquake and aftershocks, b) the seismic performance of the repaired structures, and so on. The behavior of the structures depends on the type of earthquake. The earthquake ground motion waveforms for inland type usually show large maximum acceleration and short dominant period with short duration time. On the other hand, the waveforms for inter-plate type usually show long dominant period with long duration time. We have to consider the relationship between the dominant periods of the structure and ground motion wave. It is noted that the dominant period of structure will change due to the damage during an earthquake. The influence on the dominant period of the damage usually becomes remarkably after the buckling of the longitudinal re-bars occur in plastic hinge. The change of the dominant period is also important to verify the performance during aftershocks. The bucking of re-bars have been often observed in the damaged structure. The buckling behavior, however, have not been considered in nonlinear analysis. From the discussion of above mentioned, the local strain evaluation based on non-local continuum theory and the influence on the seismic performance of buckling will present in next chapters.
STRAIN LOCALIZATION PROBLEM AND ITS SOLUTION Strain Localization Problem for Strain Softening Material The localized area and the local strain as a damage index are required in damage evaluation. Therefore, the strain localization problem should be solve in the nonlinear analysis of
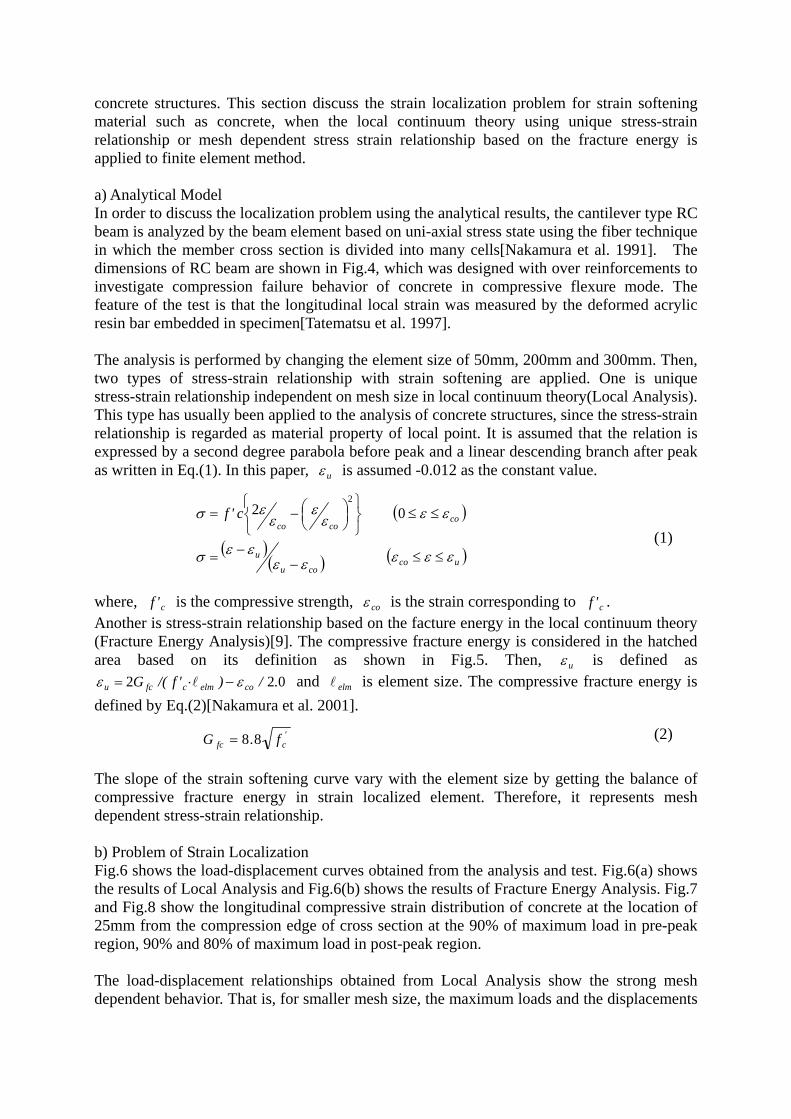
concrete structures. This section discuss the strain localization problem for strain softening material such as concrete, when the local continuum theory using unique stress-strain relationship or mesh dependent stress strain relationship based on the fracture energy is applied to finite element method. a) Analytical Model In order to discuss the localization problem using the analytical results, the cantilever type RC beam is analyzed by the beam element based on uni-axial stress state using the fiber technique in which the member cross section is divided into many cells[Nakamura et al. 1991]. The dimensions of RC beam are shown in Fig.4, which was designed with over reinforcements to investigate compression failure behavior of concrete in compressive flexure mode. The feature of the test is that the longitudinal local strain was measured by the deformed acrylic resin bar embedded in specimen[Tatematsu et al. 1997].
The analysis is performed by changing the element size of 50mm, 200mm and 300mm. Then, two types of stress-strain relationship with strain softening are applied. One is unique stress-strain relationship independent on mesh size in local continuum theory(Local Analysis). This type has usually been applied to the analysis of concrete structures, since the stress-strain relationship is regarded as material property of local point. It is assumed that the relation is expressed by a second degree parabola before peak and a linear descending branch after peak as written in Eq.(1). In this paper, uε is assumed -0.012 as the constant value. where, c'f is the compressive strength, coε is the strain corresponding to c'f . Another is stress-strain relationship based on the facture energy in the local continuum theory (Fracture Energy Analysis)[9]. The compressive fracture energy is considered in the hatched area based on its definition as shown in Fig.5. Then, uε is defined as
022 ./)'f/(G coelmcfcu εε −⋅= l and elml is element size. The compressive fracture energy is defined by Eq.(2)[Nakamura et al. 2001]. The slope of the strain softening curve vary with the element size by getting the balance of compressive fracture energy in strain localized element. Therefore, it represents mesh dependent stress-strain relationship. b) Problem of Strain Localization Fig.6 shows the load-displacement curves obtained from the analysis and test. Fig.6(a) shows the results of Local Analysis and Fig.6(b) shows the results of Fracture Energy Analysis. Fig.7 and Fig.8 show the longitudinal compressive strain distribution of concrete at the location of 25mm from the compression edge of cross section at the 90% of maximum load in pre-peak region, 90% and 80% of maximum load in post-peak region. The load-displacement relationships obtained from Local Analysis show the strong mesh dependent behavior. That is, for smaller mesh size, the maximum loads and the displacements
( )
( )( ) ( )uco
couu
cococo
c'f
εεεεεεεσ
εεεε
εεσ
≤≤−−=
≤≤⎭⎬⎫
⎩⎨⎧
⎟⎠⎞⎜
⎝⎛−=
022
'cfc f.G 88=
(1)
(2)

corresponding to the maximum load become smaller and the brittle post-peak behaviors appear. Moreover, the longitudinal compressive strain distribution also depends on the mesh size after the peak point in which strain localize in a mesh and the localized strain show quite larger values for smaller element size. It has been well known that the localization problem occurs for post-peak behavior of strain softening material in local continuum theory. The absorbed energy in the localized element become smaller for the smaller element size, when unique stress strain relationship independent on mesh size is applied. A method to solve the problem is to use stress strain relationship based on fracture energy. The load-displacement relationships obtained from Fracture Energy Analysis show the similar behavior independent on mesh size. This is reason that the absorbed energy in localized element become constant due to adjustment of the softening behavior of stress strain relationship based on fracture energy. That is, the softening curve become milder in proportion with the mesh size for smaller mesh size. Therefore, reliable load-displacement relationships are obtained independent on mesh size. The longitudinal compressive strain distributions, however, depend on the mesh size similar with the results of Local Analysis as shown in Fig.8. It is difficult to solve the mesh sensitivity problem of the local strain as far as the local continuum theory is applied in finite element method for strain softening material. The local strain values have a close relationship with the local damage of structures and provide important information for the restoration ability of RC structures. Therefore, more advanced method based on nonlocal type constitutive law is presented in next section to obtain reliable numerical solution decreasing the mesh sensitivity of both displacement and strain. Integral Type Nonlocal Constitutive Law a) Basic Concept In local continuum theory as discussed in previous section, stress at a local point is given by only the mechanical information at the point. On the other hand, nonlocal constitutive laws assume that the local state of material at a given point may not be sufficient to evaluate the stress at the point. This assumption allows including characteristic length scale in the nonlocal formulation. In case of strain field, nonlocal formulation consists in replacing local strain )(ξε by its nonlocal strain )(xε characterizing the strain softening of material[Bazant et al. 1988]. The nonlocal response of strain is defined as
where, ),( ξxW is the normalized nonlocal operator, defined as
),(0 ξα x is weight function which has symmetric function around the point x , )(xVr is the
representative volume for the nonlocalization space, defined as Eq.(5).
where, x is the arbitrary coordinate of received point in the analytical field. ξ ,ζ are the coordinate of a points in the representative volume. The normalized nonlocal operator
),( ξxW is determined by satisfying the following normalized condition.
∫= V)(dV)(),x(W)x( ξξεξε
)x(V),x(),x(W
r
ξαξ 0=
∫ −=Vr )(dV)x()x(V ζζα0
1=∫V )(dV),x(W ξξ
(3)
(4)
(5)
(6)
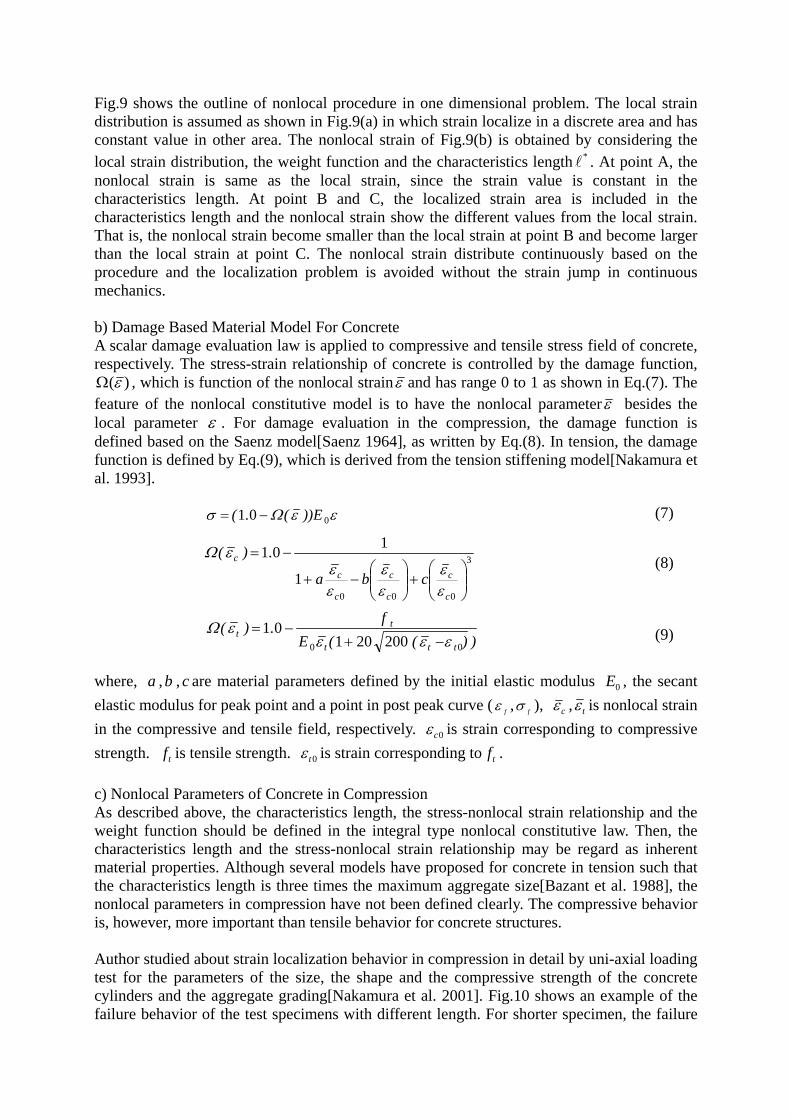
Fig.9 shows the outline of nonlocal procedure in one dimensional problem. The local strain distribution is assumed as shown in Fig.9(a) in which strain localize in a discrete area and has constant value in other area. The nonlocal strain of Fig.9(b) is obtained by considering the local strain distribution, the weight function and the characteristics length *l . At point A, the nonlocal strain is same as the local strain, since the strain value is constant in the characteristics length. At point B and C, the localized strain area is included in the characteristics length and the nonlocal strain show the different values from the local strain. That is, the nonlocal strain become smaller than the local strain at point B and become larger than the local strain at point C. The nonlocal strain distribute continuously based on the procedure and the localization problem is avoided without the strain jump in continuous mechanics. b) Damage Based Material Model For Concrete A scalar damage evaluation law is applied to compressive and tensile stress field of concrete, respectively. The stress-strain relationship of concrete is controlled by the damage function,
)(εΩ , which is function of the nonlocal strainε and has range 0 to 1 as shown in Eq.(7). The feature of the nonlocal constitutive model is to have the nonlocal parameterε besides the local parameter ε . For damage evaluation in the compression, the damage function is defined based on the Saenz model[Saenz 1964], as written by Eq.(8). In tension, the damage function is defined by Eq.(9), which is derived from the tension stiffening model[Nakamura et al. 1993].
where, a ,b , c are material parameters defined by the initial elastic modulus 0E , the secant elastic modulus for peak point and a point in post peak curve ( fε , fσ ), cε , tε is nonlocal strain in the compressive and tensile field, respectively. 0cε is strain corresponding to compressive strength. tf is tensile strength. 0tε is strain corresponding to tf . c) Nonlocal Parameters of Concrete in Compression As described above, the characteristics length, the stress-nonlocal strain relationship and the weight function should be defined in the integral type nonlocal constitutive law. Then, the characteristics length and the stress-nonlocal strain relationship may be regard as inherent material properties. Although several models have proposed for concrete in tension such that the characteristics length is three times the maximum aggregate size[Bazant et al. 1988], the nonlocal parameters in compression have not been defined clearly. The compressive behavior is, however, more important than tensile behavior for concrete structures. Author studied about strain localization behavior in compression in detail by uni-axial loading test for the parameters of the size, the shape and the compressive strength of the concrete cylinders and the aggregate grading[Nakamura et al. 2001]. Fig.10 shows an example of the failure behavior of the test specimens with different length. For shorter specimen, the failure
εεΩσ 001 E))(.( −=
3
0001
101
⎟⎟⎠
⎞⎜⎜⎝
⎛+⎟⎟
⎠
⎞⎜⎜⎝
⎛−+
−=
c
c
c
c
c
c
c
cba
.)(
εε
εε
εε
εΩ
))((Ef.)(
ttt
tt
00 20020101
εεεεΩ
−+−=
(7)
(8)
(9)

behavior is observed to extend into the entire specimen. On the other hand, the failure behavior is localized in a particular length for longer specimens. Using these test results, the nonlocal parameters in compression are identified by the inverse analysis[Kwon 2006]. The stress-nonlocal strain relationship using Saenz model is defined by comparing with the test result of the cylinder specimen having the diameter of 150mm and the height of 150mm, since the strain distribution was uniform over the height even in post peak behavior and the stress-average strain relationship was identified with the local relationship as the material property. Then, parameter of Saenz model to define the softening behavior is identified with ( fε , fσ )= ( c. ε40 , c. σ40 ). Fig.11 shows the comparison between the test and the model of the stress-strain relationship and a good agreement can be seen from the figure. The characteristics length and the weight function are identified by the comparing with the test results for longer specimens which show the localized behavior in a particular zone of the specimens. Based on the inverse analysis, it is defined that the characteristics length in compression is 250mm and the weight function is rectangular shape. Fig.12 show the load- displacement relationship and local strain distribution along the specimen height for the specimen having the diameter of 150mm and the height of 600mm. The result obtained from the nonlocal constitutive law can evaluate accurately the localized strain distribution as well as the stress-strain relationship. d) Applicability to RC Beam The Integral type nonlocal constitutive law using the nonlocal parameters in compression is applied to the RC beam of Fig.4. Fig.13 shows the load-displacement relationship obtained from the analysis with different mesh size and test. Fig.14 shows the longitudinal compressive strain distribution of concrete at the location of 25mm from the compression edge of cross section at the 90% of maximum load in pre-peak region, 90% and 80% of maximum load in post-peak region. The load-displacement relationships are independent on mesh size and show the similar behavior with the results of Fracture Energy Analysis as shown in Fig.6(b), though a unique stress strain relationship is used. Moreover, the longitudinal compressive strain distributions is also independent on mesh size. The results show the similar strain distribution and progress of strain with test results. It is understood that the model can evaluate a realistic and an unique displacement and strain distributions. This indicate that the local damage of concrete structures become possible to evaluate analytically and it provides us useful information for restoration.
INFLUENCE ON SEISMIC PERFORMANCE OF BUCKLING OF RE-BARS Buckling Model Several stress strain relationships of reinforcing bar considering the buckling have been proposed[Monti et al. 1992, Gones et al. 1997, Nakamura eta al. 2001]. In this paper, the model proposed by Tanoue et al. is used in which the hysteresis behavior after the buckling was modeled accurately[Tanoue et al. 2002]. The model before buckling is assumed Tri-linear model considering isotropic and kinematic hardening as shown in Fig.15 . The buckling stress is calculated theoretically by Euler's theory for the elastic buckling and Engesser-Karman's theory for the plastic buckling. The stress in compression after buckling gradually decrease
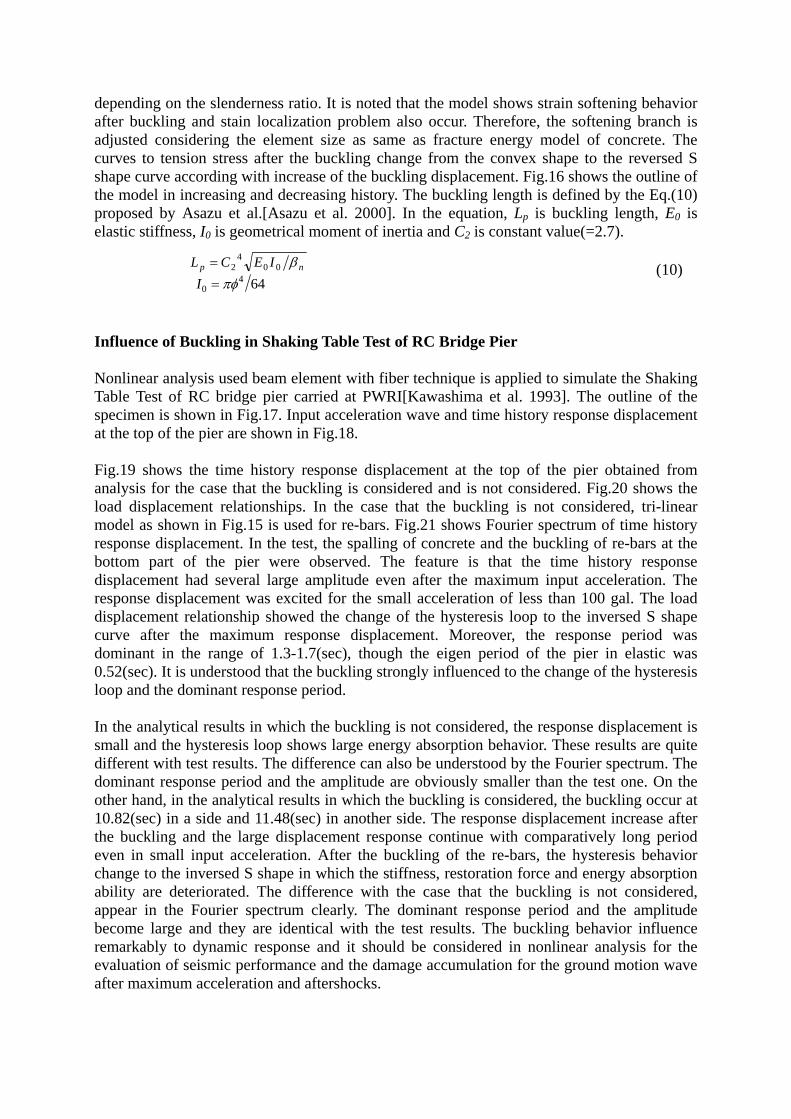
depending on the slenderness ratio. It is noted that the model shows strain softening behavior after buckling and stain localization problem also occur. Therefore, the softening branch is adjusted considering the element size as same as fracture energy model of concrete. The curves to tension stress after the buckling change from the convex shape to the reversed S shape curve according with increase of the buckling displacement. Fig.16 shows the outline of the model in increasing and decreasing history. The buckling length is defined by the Eq.(10) proposed by Asazu et al.[Asazu et al. 2000]. In the equation, Lp is buckling length, E0 is elastic stiffness, I0 is geometrical moment of inertia and C2 is constant value(=2.7). Influence of Buckling in Shaking Table Test of RC Bridge Pier Nonlinear analysis used beam element with fiber technique is applied to simulate the Shaking Table Test of RC bridge pier carried at PWRI[Kawashima et al. 1993]. The outline of the specimen is shown in Fig.17. Input acceleration wave and time history response displacement at the top of the pier are shown in Fig.18. Fig.19 shows the time history response displacement at the top of the pier obtained from analysis for the case that the buckling is considered and is not considered. Fig.20 shows the load displacement relationships. In the case that the buckling is not considered, tri-linear model as shown in Fig.15 is used for re-bars. Fig.21 shows Fourier spectrum of time history response displacement. In the test, the spalling of concrete and the buckling of re-bars at the bottom part of the pier were observed. The feature is that the time history response displacement had several large amplitude even after the maximum input acceleration. The response displacement was excited for the small acceleration of less than 100 gal. The load displacement relationship showed the change of the hysteresis loop to the inversed S shape curve after the maximum response displacement. Moreover, the response period was dominant in the range of 1.3-1.7(sec), though the eigen period of the pier in elastic was 0.52(sec). It is understood that the buckling strongly influenced to the change of the hysteresis loop and the dominant response period. In the analytical results in which the buckling is not considered, the response displacement is small and the hysteresis loop shows large energy absorption behavior. These results are quite different with test results. The difference can also be understood by the Fourier spectrum. The dominant response period and the amplitude are obviously smaller than the test one. On the other hand, in the analytical results in which the buckling is considered, the buckling occur at 10.82(sec) in a side and 11.48(sec) in another side. The response displacement increase after the buckling and the large displacement response continue with comparatively long period even in small input acceleration. After the buckling of the re-bars, the hysteresis behavior change to the inversed S shape in which the stiffness, restoration force and energy absorption ability are deteriorated. The difference with the case that the buckling is not considered, appear in the Fourier spectrum clearly. The dominant response period and the amplitude become large and they are identical with the test results. The buckling behavior influence remarkably to dynamic response and it should be considered in nonlinear analysis for the evaluation of seismic performance and the damage accumulation for the ground motion wave after maximum acceleration and aftershocks.
np IECL β004
2=
6440 πφ=I
(10)

CONCLUDING REMARKS The seismic design in Japan changed greatly after The Hanshin-Awaji Earthquake. The damages of most concrete structures in the Earthquake were caused by the shear failure. As the result, the structural details were greatly revised and large plastic deformation has been required in flexural failure mode. Moreover, the performance based design has been adopted, and the nonlinear analysis, in principle, is performed to verify the seismic performance. Fig.22 shows the typical damage events on skeleton curve of a concrete member. Although these are the limit values for the required performance and some events can be simulated reasonably by the advancement of nonlinear analysis, several events remain to be evaluated yet. The damage can not be prevented for a strong earthquake. Then, functions of the structure should be restored as soon as possible smoothly from social and economic points of view. To do so, restoration ability after an earthquake is important. That is, it is important to make clear the relationships among damage, restoration ability and seismic performance after an earthquake as well as the performance during an earthquake. The damage is closely related to local behavior in members and structures. Typical observed damage of concrete structures after recent strong earthquakes were diagonal shear cracks, spalling of concrete cover, buckling of longitudinal re-bars as shown in this paper. The damage, spalling of concrete cover, buckling of longitudinal re-bars are events in localized area such as plastic hinge. Therefore, the localized behavior in concrete structures should be simulated by nonlinear analysis to evaluate damage. In this paper, the problem to simulate the localized behavior were discussed. The method based on local continuum theory which is generally used can not avoid mesh sensitivity for post peak behavior. When unique stress strain relationship independent on mesh size is applied, the load displacement and strain distribution depend on the mesh size. When mesh dependent stress-strain relationship based on fracture energy is applied, reliable load-displacement relationships can be obtained independent of mesh size. Strain distribution, however, depend on the mesh size. On the other hand, the integral type nonlocal constitutive law can avoid the strain localization problem and evaluate the local damage such as localized area and strain as well as displacement of concrete structures accurately. The influence on seismic performance of buckling of longitudinal re-bars were discussed. When the stress strain relationship considering the buckling is applied, the behavior after the buckling can simulate reasonably. The buckling greatly influence the seismic performance and the hysteresis behavior change to the inversed S shape in which the stiffness, restoration force and energy absorption ability are deteriorated. As the results, the dominant response period and the amplitude become large. Therefore, the buckling behavior should be considered in nonlinear analysis. It will provide the knowledge about damage accumulation for the ground motion wave after maximum acceleration and aftershocks.
REFERENCES Asazu N., Unjoh S. and Hoshikuma J. "Prediction of buckling length of longitudinal
reinforcement in full-scale RC bridge columns", Proc. of JCI, Vol.22, No.3, pp.1477-1482,
2000 (in Japanese). Bazant, Z. P., and Pijaudier-Cabot, G. ‘‘Nonlocal continuum damage, localization instability
and convergence.’’ J. Appl. Mech., 55, 287–293, 1988.
Bazant, Z. P. ‘‘Nonlocal damage theory based on micromechanics of crack interactions.’’ J. Eng. Mech., 120(3), 593–617, 1994.
Bazant, Z. P., and Planas, J. Fracture and size effect in concrete and other quas-ibrittle
materials, CRC Press, 1998. de Borst ,R., Muhlhaus, H. B.:Gradient-dependent plasticity ; Formulation and Algorithmic
aspects, Int. J. Numer. Methods Eng., Vol.35, pp.521-539, 1992. Gomes A. and Appleton J. "Nonlinear Cyclic Stress-Strain Relationship of Reinforcement Bar
Including Buckling", Engineering Structures, 19(10), pp.822-826, 1997. Japan Society of Civil Engineering, “Standard specifications for Seismic Design,” 1996. Japan Society of Civil Engineering, “Standard specifications for concrete structures-2002,
Seismic Performance verification,” 2002. Japan Society of Civil Engineering, “Damage analysis of concrete structures due to the
Earthquakes in 2003”, Concrete Library 114, 2004 (in Japanese). Jirasek, M., and Bazant, Z. P. Inelastic analysis of structures, Wiley, Chichester, U.K. 2001. Kawashima, K et. al. "Seismic design method of reinforced concrete bridge piers based on
dynamic strength and ductility", Report of Public Works Research Institute Ministry of Construction, Vol.190, 1993(in Japanese).
Kwon Y. "Damage evaluation of RC members base on nonlocal constitutive law and averaged
strain", Doctoral dissertation of Nagoya University, 2006(in Japanese). Niigata-ken Chuetsu Earthquake Damage Investigation Committee(Concrete structures),
Niigata-ken Chuetsu Earthquake (Oct. 2004) - A Report on Investigation of Damage on Concrete Structures, http://www.saitama-u.ac.jp/material/niigata-eq/, 2004.
Nakamura H., Niwa J. and Tanabe T. "Analytical Study on the Ultimate Deformation Capacity
of RC columns", Concrete Library International,No.17, pp.63-76, 1991. Nakamura H. and Higai T. "Evaluation of Shear Strength of RC Beam Section based on
Extended Compression Field Theory", Concrete Library International, No.25, pp.93-106, 1995.
Nakamura H. and Higai T. "Modeling of Nonlinear Cyclic Behavior of Reinforcing Bars, Finite Element Analysis of Reinforced Concrete Structures", ACI-SP205, pp.273-292, 2001
Nakamura H. and Higai T. "Compressive Fracture Energy and Fracture Zone Length of
Concrete", Modeling of Inelastic Behavior of RC Structures under Seismic Loads, ASCE, pp.471-487, 2001.
Monti, G. and Camillo N., "Nonlinear Cyclic Behavior of Reinforcing Bars Including
Buckling", Journal of Structural Engineering, ASCE, Vol.18, No.12, pp.3268-3284, 1992. Saenz, L.P. "Discussion of Equation for the stress-strain curve of concrete by desayi and
krishman", J. Am. Concr. Inst., Vol.61, pp.1229-1235, 1964. Tanoue K., Nakamura H., Saitoh S. and Higai T. "Modeling of stress-average strain
relationship of buckled reinforcing bars under cyclic loading", Proc. of JCI, Vol.24, No.2, pp.223-228, 2002 (in Japanese).
Tatematsu H., Nakamura H. and Higai T. "Experimental study on compressive fracture zone
for concrete of Joint of RC column", Proc. of JCI, Vol.19, No.2, pp.897-903, 1997 (in Japanese).

SB ( spalling of cover
SC ( crack width >
SD ( crack lwidth <
no observedk
b
a
(a) damage of end column (view from a) (b) damage of intermediate column (view from b)Photo.1 Damage of Dai-san Otagi Bridge R2 of Tohoku Shinkansen
Photo.3 Damage of Uroho-gawa railway bridge
(a) Damage of a pier (b) Damage of a floor slab
Photo.2 Damage of Toshibetsu-gawa railway bridge
(a) Panorama of Uono-gawa bridge (b) Failure at mid height in pier Photo.5 Damage of Uono-gawa bridge of Joetsu Shinkansen
Photo.6 Damage of end column (both sides of a column)
Photo.7 Strengthened column by the steel jacketing
(b) Damage at a support (a) Damage of a pier Photo.4 Damage of Chiyoda highway bridge

Verification
Response Analysis
Setting Structure
Modeling of Structure and Ground
Setting Seismic Performance
Setting Limiting Values
Setting Ground Motion
Estimation of Response Values
END Fig.1 Verification procedure of seismic performance
(a) Damage column (b) Cross sectional restoration (c) Steel Jacket Photo.8 Repair process of a column of Tohoku Shinkansen
Photo.9 Uroho-gawa railway bridge (a) Damaged pier (b) Repaired pier

Fig.2 A hysteresis model of concrete Fig.3 A hysteresis model of reinforcing bar
PC bar
Flame for measuring of displacement
Loading plate 80mm
1200 250450
200
900
Unit : mm
Reaction bed
Jack
Test specimen
Φ22
200
150
150
Fig.4 Outline of test specimen
(a) Dimension of test specimen
Measurement length 450mm
Square bar of Acrylic
10mm
Strain gauges
(b) Outline of strain measurement
Fig.5 Stress-strain relationship based on fracture energy
σ
ε
Compression
0.85fc’
ft
εt
εu εc0
Tension Stiffening Introduce Fracture

Fig.6 Load-displacement relationship with different element size (a) Local Analysis (b) Fracture Energy Analysis
Fig.7 Longitudinal strain distribution obtained from Local Analysis
(a) 90% of pre peak (b) 90% of post peak (c) 70% of post peak
Fig.8 Longitudinal strain distribution obtained from Fracture Energy Analysis
(a) 90% of pre peak (b) 90% of post peak (c) 70% of post peak
Location
Location
Strain
Strain A’
B’ C’
A
B
C
(a) Local straindistribution
(b) Nonlocal straindistribution
Fig.9 Concept of non-localization
weight
10 20 30 40
10
20
0
Load
(kN
)
Displacement ( mm )50
5
15
25
10 20 30 40
10
20
0
Load
(kN
)
Displacement ( mm )50
5
15
25
10
20
0
Load
(kN
)
5
15
25
10 20 30 40Displacement ( mm )
50
Test ResultL= 25(mm)L= 50(mm)L=100(mm)
10
20
0
Load
(kN
)
5
15
25
10
20
0
Load
(kN
)
5
15
25
10 20 30 40Displacement ( mm )
50
Test ResultL= 25(mm)L= 50(mm)L=100(mm)
Test ResultTest ResultL= 25(mm)L= 25(mm)L= 50(mm)L= 50(mm)L=100(mm)L=100(mm)
100 200 300 400
1000
2000
3000
4000
5000
0Location ( mm )
Stra
in ( μ
)
Test Result L=25(mm) L=50(mm) L=100(mm)
100 200 300 400
10000
20000
30000
40000
50000
0Location ( mm )
Stra
in ( μ
)
0 100 200 300 4000
10000
20000
30000
40000
50000
Location ( mm )St
rain
( μ
)
100 200 300 400
1000
2000
3000
4000
5000
0Location ( mm )
Stra
in ( μ
)
Test Result L=25(mm) L=50(mm) L=100(mm)
100 200 300 400
10000
20000
30000
40000
0Location ( mm )
Stra
in ( μ
)
100 200 300 400
10000
20000
30000
40000
0Location ( mm )
Stra
in ( μ
)
*l
*l*l
Fig.10 Fracture length of cylinder test for different size Fig.11 Stress-strain relationship
Fig.12 Result from Nonlocal Analysis for compression test
(a) Load-displacement relationship (b) Strain distribution
Fig.13 Load-displacement relationship of Nonlocal Analysis
Fig.14 Longitudinal strain distribution obtained from Nonlocal Analysis (a) 90% of pre peak (b) 90% of post peak (c) 70% of post peak
Stre
ss (M
Pa)
Strain (μ)
10
15
20
25
0 10000 20000
5
Stre
ss (M
Pa)
Strain (μ)
10
15
20
25
0 10000 20000
5
TestAnalysisTestAnalysis
Strain (μ)
2000 4000 6000 100000
100
200
500
600
Hei
ght (
mm
) 400
300
8000
Strain (μ)
2000 4000 6000 100000
100
200
500
600
Hei
ght (
mm
) 400
300
8000
TestAnalysisTestAnalysis
Displacement (mm)
1 2 3 40
100
200
300
400
Load
(kN
)
Displacement (mm)
1 2 3 40
100
200
300
400
Load
(kN
)
TestAnalysisTestAnalysis
10 20 30 40
10
20
0
Load
(kN
)
Displacement ( mm )50
5
15
25
Test ResultL= 25(mm)L= 50(mm)L=100(mm)
10 20 30 40
10
20
0
Load
(kN
)
Displacement ( mm )50
5
15
25
Test ResultL= 25(mm)L= 50(mm)L=100(mm)
Test ResultTest ResultL= 25(mm)L= 50(mm)L=100(mm)
100 200 300 400
5000
10000
15000
0Location ( mm )
Stra
in ( μ
)
100 200 300 400
1000
2000
3000
4000
5000
0Location ( mm )
Stra
in ( μ
)
Test Result L=25(mm) L=50(mm) L=100(mm)
100 200 300 400
5000
10000
15000
0Location ( mm )
Stra
in ( μ
)
100 200 300 400
5000
10000
15000
0Location ( mm )
Stra
in ( μ
)
100 200 300 400
1000
2000
3000
4000
5000
0Location ( mm )
Stra
in ( μ
)
Test Result L=25(mm) L=50(mm) L=100(mm)
100 200 300 400
5000
10000
15000
0Location ( mm )
Stra
in ( μ
)
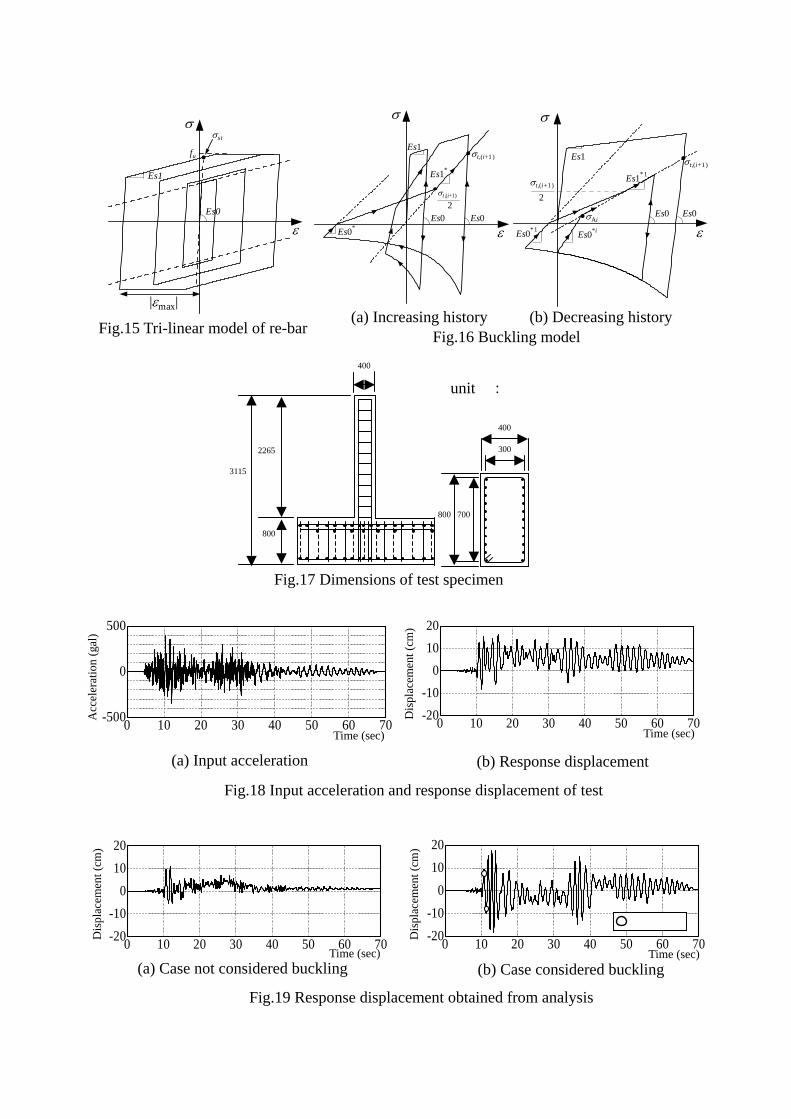
Fig.15 Tri-linear model of re-bar (a) Increasing history
Fig.16 Buckling model (b) Decreasing history
800
3115
2265
400
800 700
300
400
unit :
Fig.17 Dimensions of test specimen
Acc
eler
atio
n (g
al)
Time (sec) Time (sec)
Dis
plac
emen
t (cm
)
(a) Input acceleration (b) Response displacement
Fig.18 Input acceleration and response displacement of test
Time (sec)
Dis
plac
emen
t (cm
)
Time (sec)
Dis
plac
emen
t (cm
)
Fig.19 Response displacement obtained from analysis
(a) Case not considered buckling (b) Case considered buckling
buckling
fu
σst
ε
σ
|εmax|
Es0
Es1
σ
ε
σt,(i+1)
Es1*
Es0*Es0
Es1
Es0
σt ,(i+1)
2
ε
σ
Es0
Es0*i
Es1*1
σt,(i+1)
Es0*1
Es1
σt,(i+1)
2
σAiEs0
0 10 20 30 40 50 60 70-500
0
500
0 10 20 30 40 50 60 70-20-10
01020
0 10 20 30 40 50 60 70-20-10
01020
0 10 20 30 40 50 60 70-20-10
01020

period (sec)
Am
plitu
de sp
ectru
m (c
m・se
c)
Fig.21 Fourier spectrum of response displacement
testno bucklingbuckling
Displacement (cm)
Load
(kN
)
Load
(kN
)
Displacement (cm)
Load
(kN
)
Displacement (cm)
(a) Test (b) Analysis of no buckling (c) Analysis of buckling
Fig.20 Load displacement relationships
buckling
yield load
Load
Displacement
a
c f b
g,h
yield disp. ultimate disp
shear failure
shear failure after yielding
a: crackingb: yield of longitudinal re-bar c: yield of member d: buckling of longitudinal re-bar e: spalling of concrete cover f: ultimate deformation g: compressive failure of core concreteh: rupture of longitudinal re-bar
d,e
Fig.22 An example of skeleton curve of member
flexuralfailure
0.5 1 5 100
20
40
60
80
100
-20 -10 0 10 20-150
-100
-50
0
50
100
150
-20 -10 0 10 20-150
-100
-50
0
50
100
150
-20 -10 0 10 20-150
-100
-50
0
50
100
150