noninvasive partial rebreathing cardiac output for ...1.3.1 invasive cardiac output monitoring...
TRANSCRIPT

Noninvasive Partial Rebreathing Cardiac Output
for Nonintubated Subjects
by
Lara M. Brewer
A thesis submitted to the faculty of The University of Utah
in partial fulfillment of the requirements for the degree of
Master of Science
The Department of Bioengineering
The University of Utah
August 2001

Copyright © Lara M. Brewer 2001
All Rights Reserved

ABSTRACT
The conventional partial rebreathing technique for noninvasive cardiac output
measurement is limited to patients with mechanical and mixed ventilation. It would be
advantageous to extend monitor utility to gain access to reliable, noninvasive measures of
cardiac health is settings such as intensive care units and cardiac outpatient clinics. However,
the original partial rebreathing technique did not have adequate reliability for clinical use when
tested on spontaneously breathing, nonintubated volunteers. Hardware and software
modifications made during the course of this research led to a new means of signal acquisition
and processing for cardiac output estimation so the monitor could be used on spontaneously
breathing subjects.
Several challenges were anticipated for the monitoring of cardiac output during
spontaneous ventilation, and corresponding solutions were developed during a testing phase
with spontaneously breathing volunteers at rest. Changes were made to the patient interface so
that respiratory measurements could be made from a face mask during oxygen delivery.
Algorithms were altered such that the rebreathing period was shortened. The new, shorter
partial rebreathing period provided sufficient data for cardiac output estimation while
minimizing the uncomfortable effects of CO2 rebreathing for the subject.
Measurements from the modified noninvasive device were compared with those of an
invasive reference method (thermodilution) in twenty-seven spontaneously breathing post
cardiac surgery patients. Performance of the device from this clinical trial was promising. For
a mean cardiac output (thermodilution) of 5.21 L/min, the bias was -0.34 L/min, the standard

v
deviation was 1.21 L/min (±46%), and the limits of agreement were -2.76 and 2.08 L/min. The
correlation coefficient of a linear regression analysis was 0.408, while the slope was 0.875.
Following the clinical trials, additional refinements were made to face mask and
algorithms in order to improve both the bias and the precision of the device. New data
processing algorithms and a shorter rebreathing period were among the critical advancements.
The new device was tested for safety and feasibility in an animal comparison study (during
mechanical ventilation) and in a study on spontaneously breathing human volunteers. Cardiac
output estimates from the new algorithm compared well with those of thermodilution in the
animal study; bias was -0.059 L/min, SD was 0.58 L/min (±24%), and limits of agreement were
1.08 and -1.19 L/min). This performance is within published clinical acceptance standards for
cardiac output monitoring.
It was concluded that because the performance of this device was improved compared
to the original device for mechanically ventilated subjects, further development and testing on
spontaneously breathing subjects is warranted. This conclusion was further supported by the
results of the clinical trial and the volunteer feasibility study.

TABLE OF CONTENTS
ABSTRACT ............................................................................................................................iv
LIST OF TABLES .................................................................................................................iix
LIST OF SYMBOLS ..............................................................................................................ix
ACKNOWLEDGMENTS........................................................................................................x
CHAPTER
1 INTRODUCTION...............................................................................................................1
1.1 Objectives ..........................................................................................................1 1.2 Motivation .........................................................................................................1 1.3 Review and Limitations of Current Monitors....................................................4 1.4 Earlier Work with the Fick Principle and Rebreathing ...................................13 1.5 The Noninvasive Cardiac Output (NICO2) Technology..................................19 1.6 Overview of this Thesis...................................................................................26
2 PREPARATION FOR CLINICAL STUDIES..................................................................29
2.1 Introduction .....................................................................................................29 2.2 Patient Interface: Mask vs. Mouthpiece .........................................................30 2.3 Face Mask Selection........................................................................................35 2.4 Amount of Rebreathing ...................................................................................38 2.5 Length of Rebreathing Time............................................................................48 2.6 Oxygen Delivery Mask with the METI Human Patient Simulator .................53 2.7 Anesthesia Face Mask Oxygen Delivery with the METI Patient Simulator ...59 2.8 Oxygen Delivery to Human Subjects ..............................................................68 2.9 Feasibility Tests: Measurement During O2 Delivery to Human Subjects ......76 2.10 Discussion .......................................................................................................79
3 EVALUATION OF THE MODIFIED NICO2 CARDIAC OUTPUT MEASUREMENTS IN NONINTUBATED PATIENTS.................................................85
3.1 Introduction .....................................................................................................85 3.2 Material and Method .......................................................................................85 3.3 Results .............................................................................................................87 3.4 Discussion .......................................................................................................87
4 ISSUES IDENTIFIED BY THE CLINICAL STUDY .....................................................92
vii
4.1 Redesign of the Patient Interface.....................................................................92 4.2 Further Algorithm Development .....................................................................98
5 FEASIBILITY TESTING OF THE MODIFIED SYSTEM ...........................................113 5.1 Feasibility Testing in an Animal Model of a Partial CO2
Rebreathing System with a Shorter Measurement Cycle ..............................113 5.2 Feasibility Testing of the Modified System in Human Volunteers ...............118
6 CONCLUSION ...............................................................................................................122
6.1 Monitor Performance.....................................................................................123 6.2 Monitor Utility...............................................................................................125 6.3 Future Enhancements ....................................................................................126
REFERENCES.....................................................................................................................128

LIST OF TABLES
Table Page
1.1 Desirable Characteristics of Cardiac Output Monitors.................................................5 1.2 Twenty-Two Studies Reporting the Performance of the Partial CO2
Rebreathing Techniques ............................................................................................18
2.1 Volume of expired air measured for various attachments ..........................................34 2.2 Measurements of systolic and diastolic cuff blood pressure, noninvasive
cardiac output, and noninvasive blood oxygen saturation for four subjects in two positions, standing and supine ...........................................................................40
2.3 Results for seven subjects during large percent rebreathing, as measured with noninvasive means ............................................................................................44
2.4 Subject oxygenation and mainstream end tidal CO2 measurements in response to oxygen delivery at various flow rates ................................................71
5.1 Cardiac Output Measurements from Modified NICO2 Monitor.............................120

CHAPTER 1
INTRODUCTION
1.1 Objectives
The objective of the work described in this thesis was to extend the functionality of a
conventional partial CO2 rebreathing cardiac output monitor (NICO2, Wallingford, CT) from
mechanically ventilated patients to spontaneously ventilated patients. To accomplish this, the
work comprised four main goals: modify the hardware and the algorithm of the original NICO2
so that it would be compatible with spontaneously breathing subjects; test the modified system
on spontaneously breathing postoperative ICU patients; improve the modified NICO2 device
according to what was learned from the clinical studies; and conduct preliminary feasibility
tests on the new NICO2, first on mechanically ventilated patients, and then on spontaneously
breathing volunteers.
1.2 Motivation
Cardiac output (C.O.), measured as the volume of blood pumped by the heart per unit
of time, is an important indicator of a patient’s cardiovascular status. Knowledge of the cardiac
output of a patient can help in hemodynamic evaluation and management of therapeutic
interventions, and is crucial information for some critical care decisions. Indications for
monitoring C.O. include: management of positive end-expiratory pressure (PEEP) and volume
therapy, distinguishing between cardiogenic and noncardiogenic pulmonary edema, diagnosis
of unresponsive congestive heart failure, diagnosis and monitoring of pulmonary hypertension,

major cardiac surgery, and complicated myocardial infarction.1-2 In these settings, clinicians
use the cardiac output measurements as a tool for diagnosing problems or predicting trends of
cardiopulmonary status.3
Acute perioperative and postoperative cardiac morbidity affects more than 1.5 million
cardiac surgical patients annually in the United States,4 and it is the leading cause of death
following anesthesia and surgery. The health care costs related to cardiac morbidity and
mortality are tremendous. The estimated amount spent world-wide on cardiac output
monitoring equipment5 rose 17% to $97.9 million from 1997 to 1999. In addition, an estimated
7-8 million noncardiac surgical patients who are currently not monitored are at risk each year
for cardiac morbidity or mortality.5 This unmonitored group of people is at risk on the basis of
diagnosed cardiovascular disease (1M), two or more risk factors (2-3M), or an age over 65
(4M). Due to changing demographics and increasing numbers of noncardiac elective surgeries,
this number is expected to double within the next 30 years.6,7 There is clinical interest in
diagnosing and treating cardiovascular disease earlier and with less overall health care cost (i.e.,
with shorter hospital stays and noninvasive monitoring), 5 which leads to an expectation for the
cardiac output market to grow 15% annually (primarily through growth in the noninvasive
segment) to reach $195 million by 2004.
Cardiac output monitoring is a vital part of the management and prevention of
perioperative cardiac morbidity in these patients. However, conventional thermodilution
methods for measuring cardiac output bear considerable risk. This is because many
complications exist with the use of pulmonary artery (PA) catheters, including infection,8
intracardiac knotting,9 catheter perforation of the pulmonary artery causing cardiac
tamponade,10 hemorrhage,11 ventricular arrhythmia,12 and complete heart block.13 In addition,
use is restricted to infrequent measurements to avoid volume overloading of the patient.
Another study14 showed that catheterization was associated with increased mortality and

increased resource use. In light of these concerns, the use of the thermodilution method is
generally limited to patients who are at risk for perioperative cardiac morbidity and other cases
of overt high risks of severe cardiovascular complications.15 Even when the risk to benefit ratio
does warrant catheterization, there is evidence that the catheter should not be left in place for
longer than 72 hours, as recognized by the American Society of Anesthesiologists Task Force
on Pulmonary Artery Catheterization.15 Thermodilution cardiac output monitoring is used in
less than 15% of the 7-8 million at-risk surgical patients mentioned above16 and is not suitable
for application outside of the operating room or intensive care unit.
Indeed, the invasive nature of this method, the resulting potential for harm to the
patient, the high health care costs, and concerns regarding the precision and accuracy of this
method have prompted some to seek noninvasive methods of measurement. Noninvasive
methods of cardiac output estimation could be used on patients for whom the risk of an invasive
method is too great. The advantages held by the noninvasive cardiac output monitors are
predicted to have a large impact on health care in the future; noninvasive monitors5 comprised
only 10% of the market in 1999, but by 2004, they are expected to comprise 44%. A cardiac
output estimate could replace subjective guesswork about the patient's cardiac status with
objective, quantitative information to allow earlier and more appropriate intervention.
There is a clinical need for a cardiac output monitor that is reliable, noninvasive, simple
to use, and inexpensive enough for regular use. The original NICO2 monitor satisfies many of
the clinical needs for cardiac output monitoring. However, the technology is currently limited
to use on mechanically ventilated patients. This limitation may make one reluctant to use the
rebreathing monitor in the operating room in place of conventional thermodilution and
subsequently have few viable alternatives for C.O. monitoring postextubation. Technological
advancements could make the device available for use throughout the continuum of care to the
patient, from diagnosis to surgery and from recovery to follow up treatment. The alternative

technology would not replace the conventional PA catheter completely, but could provide the
health care community with safer and noninvasive choices for monitoring cardiac output.
1.3 Review and Limitations of Current Monitors
Because cardiac output is a difficult parameter to measure, no method currently
balances the ideal properties of a continuous, noninvasive measurement that is automated,
operator independent, patient specific, cost effective, easy to use, and accurate for sedated and
nonsedated patients of many sizes and of many cardiac output levels. Several competing
methods of noninvasive cardiac output measurement techniques are currently being developed.
A comparison of the clinically most commonly used methods and desirable characteristics of
cardiac output monitors is shown in Table 1.1. The current monitors can be divided into three
categories: invasive, minimally invasive, and noninvasive.
1.3.1 Invasive Cardiac Output Monitoring
1.3.1.1 Thermodilution. Currently, the most widely used and clinically accepted
standard for cardiac output measurements is the bolus thermodilution technique (TDCO).17,18
Setup for the thermodilution technique includes the introduction of a balloon-tipped, flow
directed Swan-Ganz pulmonary artery (PA) catheter.19 A known quantity of fluid (saline) at a
known temperature is injected into the blood through the PA catheter at a specific location and
the change in temperature of the blood downstream is measured and integrated. This method
assumes ideal, perfect ventricular mixing of the indicator and that cardiac output does not
change during the course of the measurement. The performance of the technique is extensively
documented,20 with correlation coefficients typically between 0.8 and 0.9 when compared with
other methods. The published accuracy generally varies widely (between ±3 and ±30%)
because of sensitivity to noise and operator technique.21,22

Approximately 1-2 million patients are monitored with thermodilution each year in the
United States.23,24 The major disadvantage is that a skilled clinician must insert a catheter in the
right heart and pulmonary artery, which is associated with considerable morbidity and mortality
risks.25,26 Because the technique is associated with considerable morbidity and mortality, it is
not justified to monitor all patients by using invasive pulmonary artery catheters, even if
knowledge of cardiac output would be clinically valuable. 14,27,28
1.3.1.2 Continuous cardiac output (CCO). CCO is a variation of the thermodilution
technique that also uses a pulmonary artery catheter to deliver and record temperature changes.
Instead of introducing a bolus of cool fluid to the blood, the method employs the addition of a
small amount of heat. A heating filament mounted on the catheter adds heat in a pseudo-
random binary sequence, and the downstream temperature is measured by a thermistor on the
same catheter. The binary sequence is used to estimate the impulse response function of the
system, which is used to derive the dilution curve. Cardiac output is calculated from the power
level, the physiologic constants, the pseudo-random binary sequence, and the measured
temperature difference.29,30 An example of this system is the Baxter Vigiliance System (Baxter,
Deerfield, Illinois).
In selected studies reporting the performance of the CCO systems compared to
conventional TD, the bias ranges between -0.07 and 0.31 L/min, and the precision is within 1
L/min.31-34 Limits of agreement (mean difference +/- 1.96 SD) are reported to be between -2.1
and 2.0 L/min.
This system is more clinically accepted than other TD Bolus alternatives, perhaps
because of the already familiar use of a catheter and the convenience of not requiring manual
injections. However, several concerns are also related to the method. First, cardiac output
measurements are highly averaged (3 to 6 minutes) and therefore, changes are detected only
slowly. Second, body temperature changes, such as during recovery from bypass surgery and

respiration35 (0.2° C), can compete with the temperature changes initiated by the filament,
adding complication to the measurement. Third, catheter placement introduces risk of infection
to the patient.
1.3.1.3 Pulse contour analysis calibrated with thermodilution. The pulse contour
method is based on the relationship between arterial pressure waveform measurements and
stroke volume, which therefore implies a relationship to cardiac output. The stroke volume is
computed as the ratio of the systolic area of the aortic pressure tracing and the vascular
impedance. The vascular impedance can be estimated with empirically derived nomograms
that include heart rate, age and mean arterial pressure.
An example of a device that uses this method is the PiCCO monitor by Pulsion
(Cornelius, NC). This device is new, and was approved for marketing by the FDA in June,
2000. The device combines thermodilution with pulse contour analysis to provide continuous
cardiac output monitoring.36 It does not require (but can be used with) a PA catheter. Instead, a
central venous catheter is used for injection and a peripheral artery catheter is used for
temperature curve sampling. The PiCCO device uses arterial thermodilution-calibrated pulse
contour analysis to estimate continuous cardiac output. The monitor also provides physiologic
variables related to volume and, using the arterial access, blood pressure and systemic vascular
resistance.
This device is less invasive than conventional thermodilution. It is also considered
semi-continuous, since it can provide information with each heart beat. However, the pulse
contour method may not work if systemic vascular resistance or arterial compliance has
changed since the calibration.36 Furthermore, the method still requires a central venous and a
peripheral arterial catheter, since it cannot be calibrated without thermodilution.
1.3.2 Minimally Invasive Cardiac Output Technologies
1.3.2.1 Transpulmonary dilution. This type of method is less invasive because it
eliminates the need for placing a catheter through the right heart and valves. An example of a
device employing transpulmonary dilution is the Lithium Dilution Cardiac Output monitor by
LiDCO Ltd (Williamsville, NY). A bolus of lithium chloride is injected through a central
venous catheter, and a 3 mL sample of blood is automatically pulled from a peripheral arterial
catheter (at a rate of 4 mL/min) for concentration measurements by a lithium-selective
electrode. A lithium dilution curve is then constructed from the concentration measurements.
Cardiac output, C.O., is calculated as:
where LiCl Dose is in mmol; "Area" is the integral of the primary curve (mM.s); and PCV is
packed cell volume, calculated as hemoglobin concentration (g/dl) ÷ 34. The (1-PCV)
correction is needed because lithium is distributed in the plasma.
The arterial lithium dilution measurement can be made only once every 12 hours due to
safety concerns. Therefore, if something were to function incorrectly, the dilution
measurement could not be repeated, and the device would be unusable for 12 hours. The
cardiac output measurements are made continuous by using pulse contour, which relies on the
assumption that the SVR does not change in between dilution measurements. The toxicity of
lithium results in contraindications for use during the first trimester of pregnancy or for patients
already being treated with lithium therapy; the background lithium would prevent a sufficient
signal/noise ratio. Another disadvantage is that a blood sample is required to measure packed
cell volume; this categorizes the method as minimally invasive rather than noninvasive. As
with all indicator dilution methods, abnormal shunts could result in erroneous cardiac output
(1.1) ,PCV)(1(Area)60LiClDoseC.O.
−××
=

measurements. LiDCO has found that the electrodes drift in the presence of competitive
muscle relaxants, and they hope to overcome this problem.
1.3.3 Noninvasive Cardiac Output Technologies
Noninvasive cardiac output techniques are more desirable, not only because they pose
fewer risks than placing a PA catheter and removing blood samples, but also because they
generally require less training, less set up time, and are less painful. The main noninvasive
cardiac output methods currently competing for clinical acceptance include tracheal
bioimpedance, transesophageal Doppler ultrasound, and rebreathing. Each of these methods is
reviewed, with special attention being paid to patient comfort, ease of use, and the ability to be
used in a noncritical care environment where the patient may be only lightly sedated or not
sedated.
Transthoracic electrical impedance is one of the oldest principles used for continuous
and noninvasive cardiac output measurement. Despite many years of development, reliable
estimates of cardiac output have not been uniformly reported and the technique will require
continued refinement before achieving widespread clinical use. Transesophageal
echocardiography ultrasound relies on very expensive and sensitive sensors and image
processing technology, which must be managed by a highly skilled operator. These methods
are not included in this review.
1.3.3.1 Tracheal bioimpedance. This is a very new method for cardiac output
measurements. For the measurement, a multi-electrode array on the cuff of an endotracheal
tube injects high frequency electrical current, and the resulting voltage drop is measured. The
voltage signal is thought to be related to aortic blood flow. An example of a device that uses
this technology is the ECOM by Imagyn (Irvine, CA). Reported values are heart rate, stroke
volume, C.O., and electrical impedance values. This monitor is still at an early stage with
respect to the engineering, regulatory process, educational effort, and marketing strategy. At
this time, algorithms have been mainly developed for use in swine; algorithms for humans are
in the process of being developed.
In an animal study of 10 swine,37 the measurements from this method were compared
with transit time flow probe measurements. Linear regression analysis showed an r2 of 0.77
and a slope of 0.94. The reported bias was 0.15 L/min, and the limits of agreement were –2.53
to 2.82 L/min.
Use of this device is limited to intubated patients, and among these patients, possible
problems exist with over-inflated or under-inflated cuffs, since electrode contact may be lost. If
multiple electrodes lose contact with the wall, the signal is lost. The signal may deteriorate
with extended periods of intubation (> 24 hrs) due to accumulation of mucous between the
tracheal wall and the ET cuff. Patients with stiff lungs and resultant high airway pressures will
cause an under-inflated cuff to loose contact with the tracheal wall. Because of the requirement
for patient intubation, use of this method is limited beyond critical care settings. Also, this
method cannot be used for small pediatrics and infants since their small endotracheal tubes do
not have cuffs.
1.3.3.2 Transesophageal Doppler ultrasound. This technique estimates cardiac
output by measuring blood velocity in the descending aorta. To convert this to cardiac output,
the following assumptions are necessary: 1) the velocity profile is known and constant; 2)
maximum aortic cross-sectional area has been identified, is constant, and is of circular shape (in
some devices this assumption must be accomplished with empirically derived nomograms); and
3) distribution between ascending and descending aortic blood flow is known and constant.
Typically, the device assumes that 70% of the cardiac output passes through the descending
aorta.

Performance of the Doppler method has recently been reported.38 In comparison with
standard thermodilution, multiple regression showed a correlation coefficient of 0.96. Bland-
Altman data analysis also revealed a mean difference between the techniques (bias) of –0.01
L/min and limits of agreement of 1.12 L/min. In another representative study,39 correlation
coefficients between transesophageal Doppler and thermodilution, thermodilution and Fick, and
transesophageal Doppler and Fick were 0.846, 0.746, and 0.811, respectively.
The CardioQ by Deltex (Branford, CT) is an example of a monitor that uses esophageal
Doppler ultrasound to monitor cardiac output and other parameters related to left ventricular
performance. To estimate the aortic diameter with a nomogram, the user enters patient weight,
height, and age. The CardioQ software also has a mode that automatically adjusts the gain of
the Doppler signal. In the past, this had to be done manually. An automatic gain might
improve the consistency of cardiac output estimations.
The Hemosonics 100 by Arrow (Reading, PA) is another device that employs the same
theory. In addition to the Doppler transducer, it has an M-Mode transducer for the
measurement of aortic diameter and to help in the positioning of the probe. This additional
capability can reduce the problems associated with the user and position dependent nature of
the measurements.
The hemodynamic assessment is performed on a beat-to-beat basis, which can be a
clear advantage over other methods. The method also holds the potential to infer other
hemodynamic parameters, such as contractility and afterload, from the measurements. Changes
observed in these variables may provide clinicians with better information for clinical
decisions, such as when optimizing fluid management.
The method is noninvasive, but to tolerate the esophageal probe, the patient needs to be
heavily sedated. The precise position of the transducer is critical for this technique and may
require frequent adjustment, especially in the presence of motion. Anatomical differences
between a specific patient and published norm can also lead to errors. Because of these
limitations, the device is not compatible with use outside of critical care environments.
1.3.3.3 NICO2 rebreathing monitor. The original NICO2 partial rebreathing
technology uses an automated, noninvasive method that provides cardiac output measurements
every three minutes. The technique is based on the well-accepted Fick principle (described in
detail in Section 1.4); changes in CO2 elimination and partial pressure of end-tidal CO2 in
response to a brief change in effective ventilation are used to measure cardiac output. In
addition to noninvasive cardiac output monitoring, the NICO2 technology also provides
important information about respiratory function (e.g., V.CO2, end-tidal CO2, airway resistance,
respiratory compliance, etc.).
Clinical studies have shown that the noninvasive cardiac output system performs well
in intubated, mechanically ventilated patients. In studies comparing the NICO2, the
bioimpedance and the Doppler methods with thermodilution, NICO2 system showed better
limits of agreement (± 28%) than either impedance (± 37%) or Doppler (± 65%).40-46
Because it is based on an automated partial rebreathing differential Fick method, the
NICO2 system is noninvasive, easy to use, comfortable for the subject, and is based on
commonly monitored clinical signals. Use of the monitor is contraindicated for patients with
severe pulmonary disease and patients who cannot tolerate elevation of arterial CO2 levels. At
this stage of development, NICO2 is limited to use on mechanically ventilated patients and
patients with mixed ventilation. However, with shorter periods of measurement and other
hardware and software modifications, it appears possible to extend the application to
spontaneously ventilated patients. If the application of the technology were successfully
expanded to spontaneously ventilated patients, the system would have the unique advantage
over other methods of being available for monitoring throughout the continuum of care
delivered to the patient.


1.4 Earlier Work with the Fick Principle and Rebreathing
1.4.1 Original CO2-Based Direct Fick Equation for Cardiac Output Measurement
The current NICO2 method for measurement of cardiac output is based on the steady
state mass balance principle stated by Adolf Fick in 1870.47 Fick postulated that at steady state,
the amount of O2 transferred from the lungs to the blood is equal to the quantity of the gas
gained by the blood as it flows through the pulmonary capillaries and participates in gas
exchange. In more general terms, the production or uptake of an indicator gas divided by the
arterial-venous gradient of that gas yields the cardiac output. The Fick equation expressed with
CO2 as the indicator gas is:
where Q.
t is the cardiac output in L/min, V.CO2 is the rate of carbon dioxide elimination in
mL/min, CaCO2 is the arterial carbon dioxide content in mL CO2/liter blood, and CvCO2 is the
mixed venous carbon dioxide content in mL CO2/liter blood.
The direct Fick technique has long been a standard by which other methods of
determining cardiac output have been evaluated. However, in its original form, the Fick
method is an invasive method that requires catheterization to sample the blood gas
concentrations. Because of this the direct Fick method is not widely used clinically, although
its accuracy makes it a commonly chosen method for research. A measurement with the direct
Fick method requires steady state, i.e., cardiac output and metabolic rate do not change. In
addition, measurement error was a challenge when this method was commonly used because
the technique of measuring blood gas concentrations often contained large error. Therefore,
estimations when the cardiac output was high were closer to the true value than measurements
,COCCOC
COVQ2a2v
2t −=
&& (1.2)

of low cardiac output, largely due to the larger venous-arterial gradient. Obtaining mixed
venous blood samples was difficult because they were often drawn from the right atrium, where
the blood returning from different parts of the body was mixing for the first time. Later,
samples were also taken from the pulmonary arteries by feeding the catheter through the
heart18.
1.4.2 Indirect Fick Method: Total Rebreathing
Rather than using a catheter to directly measure mixed venous and arterial CO2 content,
these values can be estimated noninvasively from the respiratory gases; this is termed the
indirect Fick method. An example of an indirect Fick method is the total rebreathing
technique48-51 in which end-tidal CO2 partial pressure (PETCO2) is monitored during both normal
breathing and total rebreathing periods. The PETCO2 can be related to the blood concentration
with the CO2 dissociation curve52. In the numerous variants of the total rebreathing method, the
common objective is to allow the subject to rebreathe until the CO2 accumulates or reaches a
plateau, such that mixed venous CO2 content can be estimated. During rebreathing, equilibrium
is reached, and the partial pressure of CO2 in the end pulmonary capillary blood can be assumed
to be equal to the partial pressure of CO2 in the alveoli; the CO2 elimination from the lungs
approaches zero (V.CO2 ≈ 0). The normal breathing period is used to estimate the arterial CO2
content.
In the total rebreathing indirect Fick method, the noninvasive variables are expressed in
terms of alveolar instead of arterial blood gas concentrations. When alveolar or end-capillary
CO2 content (CACO2) is used in the Fick equation rather than arterial CO2 content, the
pulmonary capillary blood flow (Q.
PCBF) (i.e., the nonshunted blood flow that participates in gas
exchange) is measured instead of cardiac output (Q.
t):

where Q.
PCBF is the pulmonary capillary blood flow (the part of the cardiac output actually
participating in the gas exchange in the lungs), V.CO2 is the rate of carbon dioxide elimination
in mL/min, CACO2 is the alveolar carbon dioxide content in mL CO2/liter, and CvCO2 is the
mixed venous carbon dioxide content in mL CO2/liter. Note that the diffusion gradient is
typically adequate for end-capillary and alveolar CO2 to equilibrate.
The total cardiac output can be calculated from Q.
PCBF by estimating the fraction of
cardiac output bypassing the lung (shunt fraction) and adding it to Q.
PCBF:
where Q.
t is the total cardiac output in L/min, Q.
s is the portion of the cardiac output in L/min
that bypasses the blood gas exchange surfaces in the alveoli of the lungs, called the
intrapulmonary shunt blood flow, and Q.
PCBF is the pulmonary capillary blood flow in L/min.
The total rebreathing method was often applied to healthy subjects with high cardiac
outputs (i.e., as in during exercise). Because the normal shunt fraction for a healthy adult is
only about 5 percent of the total cardiac output, the Q.
s component was typically ignored.
Problems with the total rebreathing techniques include the need for patient cooperation
during breathing, including special rhythms and breath holding, the need to breathe from a bag
with CO2 accumulating, and the requirement of steady state equilibrium during the
measurement.
,COCCOC
COVQ2A2v
2PCBF −
=&
& (1.3)
(1.4) ,QQQ PCBFst&&& +=

1.4.3 Differential Fick Partial Rebreathing Method
The differential Fick partial rebreathing method is a variation of the traditional
rebreathing methods. Like the indirect Fick method, it uses both normal breathing and
rebreathing periods, as well as the respiratory gases. In contrast to traditional rebreathing
methods, the differential partial rebreathing method eliminates the need to know mixed venous
CO2 content and can be used with ventilated patients where patient cooperation is not always
possible.52-55 The partial rebreathing technique employs a differential form of the Fick equation
to calculate cardiac output, wherein the ratio of the change in the numerator and the
denominator during a brief change in effective ventilation denotes the cardiac output level.
The partial rebreathing method described by both Gedeon53 and Capek52 calls for
adding a serial dead space to the breathing circuit to temporarily alter effective ventilation.
Measurements of the V.CO2 and CACO2 are made during both normal and rebreathing periods.
This method requires that the patient inhale only some of the air that was previously exhaled.
Because the cardiac output is assumed to remain the same within the measurement
cycle, the indirect Fick equations for the rebreathing and nonrebreathing periods can be set to
be equal:
where R is rebreathing and N is nonrebreathing, Q.
PCBF is the pulmonary capillary blood flow, V.
CO2 is the volume of CO2 excreted by the lungs per minute and CACO2 and Cv-CO2 are the
alveolar and mixed venous CO2 contents, respectively. Equation 1.5 can be rearranged to
obtain:
,COCCOC
COVCOCCOC
COVQ
2RA2Rv
2R
2NA2Nv
2NPCBF −
=−
=&&
&
.)COCCO(C)COCCO(C
COVCOVQ
2RA2Rv2NA2Nv
2R2NPCBF −−−
−=
&&&
(1.5)
(1.6)

Because of the relatively large size of the CO2 stores in the body and the slow time constant of
the CO2 stores relative to the length of time of rebreathing, it can be assumed that the mixed
venous CO2 content does not change during a brief change in effective ventilation52 (Cv-CO2R =
Cv-CO2N). Equation 1.6 can then be reduced to:
where ∆V.CO2 = V
.CO2N – V
.CO2R and ∆CACO2 = CACO2N – CACO2R.
If partial pressure of end-tidal CO2 (PETCO2) measured at the mouth is corrected for
alveolar dead space, it can be assumed to be equal to alveolar CO2 partial pressure which is in
equilibrium with partial pressure of CO2 in the end capillary blood. Equation 1.7 can then be
written as:
where S is the slope of the CO2 dissociation curve in mL CO2/liter blood/mmHg.
To summarize the assumptions necessary for the differential Fick partial rebreathing
technique, cardiac output and Cv-CO2 do not change during the measurement period and Vd/Vt
is constant. The performance (Table 1.2) of partial CO2 rebreathing has been studied
extensively.41-46, 52, 53, 56-68
,CO∆C
COV∆Q2A
2PCBF
&& =
,∆P S
COV∆Q2
2PCBF
ETCO
&& =
(1.7)
(1.8)
1.5 The Noninvasive Cardiac Output (NICO2) Technology
In its original form, the NICO2 system was developed to measure cardiac output in
intubated patients using an automated CO2 differential Fick partial rebreathing technique63, 69.
Clinical research to date shows sufficient accuracy and reliability of NICO2 cardiac output
measurements in intubated, mechanically ventilated subjects, where regular breathing patterns
are exhibited and the good seal of the endotracheal tube is achieved.66-68 Setup time for the
noninvasive device is less than 5 minutes.
1.5.1 Mainstream Gas Sensors
The NICO2 mainstream sensors use nondispersive infrared (NDIR) absorption and dual
wavelength ratiometric-single beam optics to detect CO2. The measurement range is 0-150
mmHg (0-20 kPa). The response time is less than 60 ms. Accuracy is 2 mmHg for readings
between 0 and 40 mmHg, 5% of the reading for the range of 41-70 mmHg, and 8% of the
reading for CO2 in the range of 71-150 mmHg.
The airflow during respiration is monitored with a differential pressure sensor. The
flow range of the flow sensor is 2-180 L/min at a barometric pressure of 760 mmHg, room air,
35° C. The flow sensor accuracy is the greater of 3% of the reading or 0.5 L/min.
The flow and CO2 signals are sampled at 100 Hz with a resolution of 0.1 L/min for
flow and 0.1 mmHg for PETCO2. The NICO2 monitor computes V.CO2 as the product of the
integrated flow and CO2 signals and displays V.CO2 and PETCO2 data on a breath-to-breath basis.
1.5.2 Pulse Oximeter
The reusable pulse oximeter can measure blood oxygen saturation levels from any
digit. A separate attachment can be used to measure saturation of the blood at the ear lobe.

The oximeter calculates SpO2 with a two-second average and is accurate within 2% for
oxygenation levels of 80-100%.
1.5.3 Pneumatic Valve
During mechanical ventilation, the NICO2 rebreathing valve assembly is connected
between the patient's breathing circuit (at the wye piece) and the patient's endotracheal tube.
The NICO2 rebreathing valve contains a dual diaphragm and is pneumatically controlled, such
that a return spring keeps the valve in the nonrebreathing position unless pneumatic positive
pressure is applied (See Figure 1.1). The NICO2 monitor controls the operation of the
pneumatic valve by application of positive pressure. In its default position, the pneumatic valve
causes gas from the breathing circuit to bypass the adjustable deadspace. When actuated, the
pneumatic valve inserts the adjustable deadspace (150-450 mL) in the breathing circuit serially
between the wye piece of the breathing circuit and the endotracheal tube connected to the
patient. This causes the patient to rebreathe a portion of previously exhaled CO2. By the end of
the inspiratory period, the subject is inhaling fresh air. Therefore, the subject is only
rebreathing part of the previously exhaled CO2. Partial rebreathing does not require patient
cooperation and has only a small impact on ventilation.
1.5.4 Measurement Cycle
Each NICO2 measurement cycle lasts 3 minutes, and is comprised of a 60 second
baseline period, a 50 second rebreathing period, and a 70 second recovery period (Figure 1.2).
During rebreathing, the increase in inhaled CO2 due to rebreathing causes a reduction in the
CO2 volume eliminated from the lung (decrease in V.CO2) and a corresponding increase in
alveolar and arterial CO2 tension (increase in PACO2 and PETCO2). The changes in the
respiratory signals can be seen in a signal vs. time plot (Figure 1.3).

In the original NICO2 monitor, which was developed specifically for mechanical
ventilation, baseline values for V.CO2 and PETCO2 are calculated as the average of a group of
samples taken 27 seconds before the start of the rebreathing process. During rebreathing,
values for V.CO2 and PETCO2 are calculated as the average of the samples taken during the last
25 seconds of the rebreathing period. These average values are chosen because they are the
plateau points of the signal during the rebreathing and nonrebreathing periods. The regularity
of mechanical ventilation aids in the identification of the plateaus in the signal at baseline and
rebreathing levels. Using the Fick equations, the changes in PETCO2 and V.CO2 are then used to
calculate the pulmonary capillary blood flow (Q.
PCBF).
Alternatively, PETCO2 can first be converted to pulmonary end-capillary concentration
of carbon dioxide (Cc′CO2) with the following CO2 dissociation curve equation52:
where PACO2 is approximated by PETCO2 and is measured in mmHg. The resultant value of
Cc′CO2 is measured in mL CO2/L blood. The two signals (V.CO2 and Cc′CO2) can then be
plotted against each other (Figure 1.4). In this case, the negative value of the slope of the line
formed by the data points collected during one measurement cycle represents the pulmonary
capillary blood flow (Q.
PCBF). This is because there is a linear relationship between V.CO2 and
Cc′CO2, as described by the Fick equation (Equation 1.2). In other words, when a ventilation
change such as rebreathing is initiated, V.CO2 drops dramatically because much of the
previously exhaled CO2 is again inhaled. With more rebreathing breaths, this slowly leads to a
lower diffusion gradient for CO2 in the alveoli and therefore a slowly raising CO2 content in the
blood. If total rebreathing were accomplished, the V.CO2 and Cc′CO2 signals would continue to
follow the line of slope -Q. until no CO2 would move from blood to alveoli (V
.CO2 = 0
),COP*0.1933ln(1*175cC 2A2CO +=′ (1.9)

mL/breath). At this point, the line of slope -Q. intercepts the x-axis and represents the venous
blood CO2 content, since the alveolar CO2 content is the same as venous.
1.5.5 Shunt correction accuracy
The percentage of cardiac output bypassing the lung (shunt fraction) is determined
based on Nunn's iso-shunt plots from the inspired O2 fraction (FIO2) values and the average
blood oxygen saturation values (SpO2), determined noninvasively by a pulse oximeter70.
Cardiac output is then calculated from Q.
PCBF and shunt fraction (Equation 1.4).
The limited accuracy of pulse oximetry SpO2 measurements (±1-2%) and the steep
oxygen tension saturation curve (especially for SpO2 > 95%) may lead to inaccuracies in the
estimates of noninvasive shunt fraction. In most cases, the shunt fraction is very small, so even
a large relative error in the estimate of shunt fraction leads to a small error in cardiac output. It
was previously shown that these noninvasive estimates of intrapulmonary shunt compare well
with invasive estimates.71 An accuracy of ± 20% in the estimation of shunt fraction is sufficient
to ensure that the error in the estimation of cardiac output71 is less than ±5%.
1.6 Overview of this Thesis
The objective of this study was to modify the original NICO2 system for use on
spontaneously ventilated subjects. Both the hardware and the software were modified to
accomplish this objective since they had first been specifically designed for mechanically
ventilated subjects. The hardware was modified to accommodate nonintubated subjects during
oxygen delivery. The software was modified by adding new data analysis parameters,
shortening the rebreathing periods, and employing a new calculation algorithm. The hardware
and software changes taken together would provide patient comfort, improved performance,

and ease of use of a noninvasive monitor unique in its capacity to be used on awake,
spontaneously ventilated subjects.
In the first part of the study, several challenges to monitoring spontaneously ventilated
patients were anticipated and met. These challenges included: 1) face mask leaks, preventing
reliable PETCO2 and V.CO2 measurements; 2) spontaneous breaths, which are much more
irregular than mechanical breaths; and 3) variability in effective end-expiratory lung volume,
causing wildly varying functional residual capacity from one breath to the next and associated
changes in gas measurements unrelated to cardiac output.
The patient interface of the NICO2 cardiac output monitor was improved so that it
could accommodate spontaneously breathing patients. Commercially available face masks and
mouthpieces were evaluated for suitability in signal acquisition. An oxygen delivery system
was developed which would not hamper concurrent mainstream gas monitoring. The suggested
volume and length of time of rebreathing required for an acceptable signal to noise ratio were
also investigated. The newly enhanced rebreathing system was tested for feasibility of use in
awake, nonintubated volunteers. The feasibility tests would examine the plausibility and
reproducibility of measurements and the effect of rebreathing on spontaneous ventilation,
patient comfort, anxiety, and blood oxygen saturation.
In the clinical ICU trial undertaken as part of this research, which involved twenty-
seven awake, recently extubated spontaneously breathing human subjects, the measurements of
the modified NICO2 system were compared with those from a reference standard
(thermodilution). This clinical trial also served as a respiratory data collection period. The
author oversaw the data collection for this study. The data were later replayed and reanalyzed
for further algorithm development. With these data, new challenges to monitoring
spontaneously ventilated subjects were identified.

In response to the clinical data, a colleague refined the NICO2 algorithm. Additional
data processing and algorithm techniques were investigated to address the challenges
ascertained from the results of the patient study. A new component of the algorithm was
developed to compensate for irregular tidal volume and decreased signal to noise levels.
Statistics used to evaluate the performance of the device in the clinical trial included
Bland-Altman plots and linear regression. Device modification decisions were based on
evaluation by standard statistics methods such as average, average difference, and standard
deviation.

REFERENCES 1. Goldenheim PD, Kazemi H. Cardiopulmonary monitoring of critically ill patients. 2. N
Engl J Med. Sep 20, 1984;311(12):776-80. Review. 2. Goldenheim PD, Kazemi H. Current concepts. Cardiopulmonary monitoring of
critically ill patients. 1. N Engl J Med. Sep 13, 1984;311(11):717-20. Review. 3. Hicks KN, Lynch K. Monitoring Cardiac Outputs. AARC Times. May 2000:40-42. 4. Mangano DT. Preoperative assessment of the patient with cardiac disease. Curr Opin
Cardiol. Sep 1995;10(5):530-42. Review. 5. Heartening News: Noninvasive segment will spearhead growth in the cardiac output
monitoring equipment market. Available at: http://www.devicelink.com/news/ market.html#aed. Accessed February 16, 2001.
6. Mangano DT. Perioperative cardiac morbidity. Anesthesiology. 1990;72(1):153-84. 7. Mangano DT. Cardiac anesthesia risk management. Multicenter outcome research. J
Cardiothorac Vasc Anesth. 1994:8(suppl 1):10-12. 8. Rowley KM, Clubb KS, Smith GJ, Cabin HS. Right-sided infective endocarditis as a
consequence of flow-directed pulmonary-artery catheterization. A clinicopathological study of 55 autopsied patients. N Engl J Med. 1984;311(18):1152-56.
9. Lipp H, O'Donoghue K, Resnekov L. Intracardiac knotting of a flow-directed balloon
catheter. N Engl J Med. Jan 28, 1971;284(4):220. 10. Greenbaum EI, Marcus HS. Catheter perforation of the pulmonary artery with resultant
cardiac tamponade. Chest. Jul 1972;62(1):105-7. 11. Pellegrini RV, Marcelli G, Di Marco RF, Bekoe S, Grant K, Marrangoni AG. Swan-
Ganz catheter induced pulmonary hemorrhage. J Cardiovasc Surg (Torino). Nov-Dec 1987;28(6):646-9.
12. Sprung CL, Jacobs LJ, Caralis PV, Karpf M. Ventricular arrhythmias during Swan-
Ganz catheterization of the critically ill. Chest. Apr 1981;79(4):413-5. 13. Abernathy WS. Complete heart block caused by the Swan-Ganz catheter. Chest. Mar
1974;65(3):349. 14. Connors AF Jr, Speroff T, Dawson NV, et al. The effectiveness of right heart
catheterization in the initial care of critically ill patients. JAMA. Sep 18, 1996;276(11):889-97.
15. Practice guidelines for pulmonary artery catheterization. A report by the American
Society of Anesthesiologists Task Force on Pulmonary Artery Catheterization. Anesthesiology. Feb 1993;78(2):380-94.
16. Tuman KJ, Ivankovich AD. High-Cost, High-Tech Medicine: Are We Getting Our
Money's Worth ? J Clin Anesth. 1993;5:168-77. 17. Nishikawa T, Dohi S. Errors in the measurement of cardiac output by thermodilution.
Can J Anaesth. 1993:40(2):142-53. 18. Levett JM, Replogle RL. Thermodilution cardiac output: a critical analysis and review
of the literature. J Surg Res. 1979 Dec;27(6):392-404. 19. Ganz W, Swan HJC. Measurement of blood flow thermodilution. Am J Cardiol.
1972;29:241-6. 20. Kadota LT. Theory and application of thermodilution cardiac output measurement: a
review. Heart Lung. 1985:14:605-14. 21. Kadota LT. Reproducibility of thermodilution cardiac output measurements. Heart
Lung. 1986:15:618-22. 22. Runciman WB, Iisley AH, Roberts JG. An evaluation of thermodilution cardiac output
measurement using the Swan-Ganz catheter. Anaseth Intensive Care. 1981:9:208-20. 23. Swan HJ. The pulmonary artery catheter. Dis Mon. Aug 1991;37(8):473-543. 24. Shoemaker WC, Kram HB, Appel PL, Fleming AW. The efficacy of central venous
and pulmonary artery catheters and therapy based upon them in reducing mortality and morbidity. Arch Surg. Oct 1990;125(10):1332-7; discussion 1337-8.
25. Damen J, Bolton D. A Prospective Analysis of 1400 Pulmonary Artery Catheterization
in Patients Undergoing Cardiac Surgery. Acta Anaesthesiol Scand. 1986:30:386-92. 26. Gore JM, Goldberg RJ, Spodick DH, Alpert JS, Dalen JE. A Community-Wide
Assessment of the Use of Pulmonary Artery Catheters in Patients with Acute Myocardial Infarction. Chest. 1987:92:721-7.
27. Sola JE, Bender JS. Use of the pulmonary artery catheter to reduce operative
complications. Surg Clin N America. April 1993;73(2):253-64. 28. Dalen JE, Bone RC. Is it time to pull the pulmonary artery catheter. JAMA.
1996:276(11):916-8. 29. Yelderman M. Continuous measurement of cardiac output with the use of stochastic
system identification techniques. J Clin Monit. 1990:6: 322-32. 30. Yelderman ML, Quinn MD, McKown RC. Thermal safety of a filamented pulmonary
artery catheter. J Clin Monit. 1992:8:147-49.

31. Boyle M. Assessment of the agreement between cardiac output measured by bolus
thermodilution and continuous methods, with particular reference to the effect of heart rhythm. Aust Crit Care. 1997:10: 5-8.
32. Andresen EB. Continuous measurements of cardiac output in the perioperative period.
Ugeskr Laeger. 1997:159: 1094-1097. 33. Le Tulzo T, Belghith M, Seguin P, Dall’Ava J, Monchi M, Thomas R, Dhainaut J-F.
Reproducibility of thermodilution cardiac output determination in critically ill patients: Comparison between bolus and continuous method. J Clin Monit. 1996:12: 379-85.
34. Seguin P, Colcanap P, Le Rouzo A, Tanguy M, Guillou YM, Malledant Y. Evaluation
of a new semi-continuous cardiac output system in the intensive care unit. Can J Anaesth. 1998:45:578-83.
35. Wessel HU, James Gw, Paul HM. Effects of respiration and circulation on central
blood temperature of the dog. Am J Physiol. 1966:211:1403-12. 36. Mahutte CK, Jaffe MB, Sassoon CSH, Wong DH. Cardiac output from carbon dioxide
production and arterial and venous oximetry. Crit Care Med. 1991:19: 1270-77. 37. Wallace AW, Salahieh A, Lawrence A, Spector K, Owens C, Alonso D: Endotracheal
cardiac output monitor. Anesthesiology. 2000 Jan;92(1):178-89. 38. Perrino AC Jr, Harris SN, Luther MA. Intraoperative determination of cardiac output
using multiplane transesophageal echocardiography: a comparison to thermodilution. Anesthesiology. 1998 Aug;89(2):350-7.
39. Cuschieri J, Rivers E, Caruzo J, et al. A comparison of transesophageal Doppler,
thermodilution and Fick cardiac output measurements in critically ill patients [abstract]. Crit Care Med. 1998:26:62A.
40. Critchley LAH, Critchley JAJH. A meta-analysis of studies using bias and precision
statistics to compare cardiac output measurement techniques. J Clin Monit. 1999:15:85-91.
41. Orr JA, Westenskow DR, Haryadi DG, Kofoed S. Evaluation of partial re-breathing
cardiac output measurement in animals. Joint Meeting of Society for Technology in Anesthesia & Rochester Simulator Symposium 1998:#25 (Tucson, Arizona).
42. Johnson KB, Haryadi DG, Orr JA, McJames S, Kuck K, Westenskow DR. Influence of
pulmonary edema on noninvasive measurements of cardiac output using partial CO2 rebreathing in a canine model. Anesthesiology. 1998:89(3A):A535.
43. Haryadi DG, Orr JA, Kuck K, McJames S, Westenskow DR. Evaluation of a partial
CO2 rebreathing fick technique for measurement of cardiac output. Anesthesiology. 1998:89(3A):A534.
44. Watt RC, Loeb RG, Orr JA. Comparison of a new non-invasive cardiac output

technique with invasive bolus and continuous thermodilution. Anesthesiology. 1998:89(3A):A536.
45. Kuck K, Haryadi DG, Orr J, Bailey PL. Evaluation of partial re-breathing cardiac
output measurement during surgery. Anesthesiology. 1998:89(3A):A542. 46. Guzzi L, Jaffe MB, Orr JA. Clinical evaluation of a new noninvasive method of cardiac
output measurement - preliminary results in CABG patients. Anesthesiology. 1998:89(3A):A543.
47. Fick A. Über die Messung des Blutquantums in den Herzventrikeln. Sitzungsbericht
der Physikalisch-Medizinischen Gesellschaft zu Würzburg. 1870:36. 48. Collier CR. Determination of mixed venous CO2 tensions by rebreathing. J Appl
Physiol. 1956:9:25-29. 49. Ceretelli P, Cruz JC, Farhi LE, Rahn H. Determination of mixed venous O2 and CO2
tensions and cardiac output by rebreathing method. Respir Physiol. 1966:1:258-264. 50. Franciosa JA. Evaluation of the CO2 rebreathing cardiac output method in seriously ill
patients. Circulation. Mar 1977:55(3):449-55. 51. Sackner MA. Measurement of cardiac output by alveolar gas exchange. In: Handbook
of Physiology. The respiratory system IV. Bethesda, MD: Waverly Press, Inc; 1987:233-255.
52. Capek JM, Roy RJ. Noninvasive measurement of cardiac output using partial CO2
rebreathing. IEEE Trans Biomed Eng. Sept 1988;35(9):653-61. 53. Gedeon A, Forslund L, Hedenstierna G, Romano E. A new method for non-invasive
bedside determination of pulmonary blood flow. Med Biol Eng Comp. Jul 1980;18:411-9.
54. Gedeon A. Noninvasive pulmonary blood flow for optimal PEEP. Clin Physiol. 1985;5
(suppl 3):49-58. 55. Capek JM, Roy RJ. Fick techniques. In: Encyclopedia of Medical Devices and
Instrumentation, Vol. 2. New York: Editor-in-chief: John G. Webster John Wiley and Sons; 1988:1302-1314.
56. Blomqvist H, Frostell C, Hedenstrierna G. A non-invasive technique for measurement
of lung perfusion. Intensive Care Med. 1986:12:172. 57. Capek JM, Roy RJ. Noninvasive measurement of cardiac output using partial CO2
rebreathing. Anesthesiology. 1985;63:3A:A172. 58. Capek JM. Noninvasive Measurement of Cardiac Output Using Partial CO2
Rebreathing [dissertation]. Rensselaer Polytechnic Institute, 1988:351.

59. Bosman RJ, Stoutenbeek CP, Zandstra DF. Non-invasive pulmonary blood flow
measurement by means of CO2 analysis of expiratory gases. Intensive Care Med. 1991:17(2):98-102.
60. Gedeon A, Krill P, Kristensen J, Gottlieb I. Noninvasive cardiac output determined
with a new method based on gas exchange measurements and carbon dioxide rebreathing: A study in animals/pigs. J Clin Monit. 1992:8:267-78.
61. Osterlund B, Gedeon A, Krill P, Johansson G, Reiz S. A new method of using gas
exchange measurements for the noninvasive determination of cardiac output: clinical experiences in adults following cardiac surgery. Acta Anaesthesiol Scand. 1995:39(6):727-32.
62. Gama de Abreu M, Quintel M, Ragaller M, Michael D. Partial carbon dioxide
rebreathing: A reliable technique for noninvasive measurement of nonshunted pulmonary capillary blood flow. Crit Care Med. 1997:25(4):675-83.
63. Orr J, Westenskow D, Kofoed S, Turner R. A non-invasive cardiac output system using
the partial re-breathing Fick method. J Clin Monit. Nov 1996;12(6):464-5. 64. Bailey PL, Haryadi DG, Orr JA. Partial CO2 rebreathing fick technique for
noninvasive measurement of cardiac output. Anesth Analg. 1998:86:SCA92. 65. Jopling MW. Noninvasive cardiac output determination utilizing the method of partial
CO2 re-breathing. A comparison with continuous and bolus thermodilution cardiac output. Anesthesiology. 1998:89(3A):A544.
66. Orr JA, Kuck K, Haryadi DG, Jaffe MB. Clinical validation of a new noninvasive
breath-to- breath Fick method for cardiac output estimation. Society of Technology in Anesthesia, 1999 Annual Meeting 1999:#12.
67. Haryadi DG, Bailey PL, Kück K, Orr JA, Westenskow DR. Clinical evaluation of
partial CO2 rebreathing Fick technique for noninvasive measurement of cardiac output. Society of Technology in Anesthesia, 1999 Annual Meeting 1999:#35.
68. Loeb RG, Watt RC, DiNardo JA, Orr J. Comparison of noninvasive, partial rebreathing
cardiac output with invasive bolus and continuous thermodilution. Society of Technology in Anesthesia, 1999 Annual Meeting 1999:#12.
69. Jaffe MB. Partial CO2 Rebreathing Cardiac Output - Operating Principles of the
NICOTM System. J Clin Monit. 1999:15:(6):387-401. 70. Haryadi DG. Partial CO2 Rebreathing Indirect Fick Technique for Non-Invasive
Measurement of Cardiac Output. [dissertation]. Salt Lake City, UT: Department of Bioengineering, University of Utah [pending].
71. Haryadi D G, Orr JA, Johnson KB, Kück K, Westenskow DR. Influence of error in
estimation of intrapulmonary shunt on the measurement of cardiac output using rebreathing techniques. Society of Technology in Anesthesia, 1999 Annual Meeting 1999.
72. Healey CM. New methods of continuous cardiac output monitoring using
thermodilution [master’s thesis]. Salt Lake City, UT: Univeristy of Utah. 1995. 73. Bilfinger TV, Lin CY, Anagnostopoulos CE. In vitro determination of accuracy of
cardiac output measurements by thermodilution. J Surg Res. 1982:33:409-414. 74. MacKenzie JD, Haites NE, Rawles JM. Method of assessing the reproducibility of
blood flow measurement: factors influencing the performance of thermodilution cardiac output computers. Br Heart J. 1986:55:14-24.
75. Stetz CW, Miller RG, Kelly GE, Raffin TA. Reliability of the thermodilution method
in the determination of cardiac output in clinical practice. Am Rev Respirat Dis. 1982:126: 1001-1004.

Table 1.1
Desirable Characteristics of Cardiac Output Monitors
Desirable Characteristics Bioim-pedance
Thermo-dilution Doppler Original
NICO2 Proposed NICO2
Sedation not required ● ●
Intubation not required ●† ● ● ●
Estimates reproducible within 1 L/min ● ● ●‡
Noninvasive ● ● ● ●
Independent of anatomical differences ● ● ●
Currently in clinical use ● ● ● ●
Minimal clinician training needed ● ●
Resistant to blood temp. changes ● ● ● ●
Resistant to patient repositioning ● ●
FDA Approved ● ● ● ●
Short setup time ● ●
† Depends on the method application ‡ Requires more testing

Table 1.2
Twenty-Two Studies Reporting the Performance of the Partial CO2 Rebreathing Techniques
Ref
Method
Subjects
# of
samples
TDco Range L/min
Correl. Coeff.
r
Bias
L/min
Precision
L/min
53
Hyperhypoventil.
5 dogs 6 patients
35 6
0.5-6.5 2.5-5.0
NR NR
NR NR
20% 8%
57
Switched SerialDS
25 dogs
322
1.5-7.0
0.91
NR
NR
56 DS for 8 breaths
14 dogs
NR
Mean 2.14
0.94
0.17
CV=12%
52
Switched serial DS
29 patients
329
NR
0.70
NR
NR
58
Oleic acid lavage
16 dogs
458
1.5-7.5
0.91
0.01
0.51
59
Hyper/hypoventil. Switched SerialDS
44 CABG pts
40 41
3.2-9.6
0.40 0.93
-0.12 0.18
0.57 0.57
60
Rebreathing
6 pigs
64
1.5-11.5
0.92
-0.13
0.78
61
Rebreathing
40 card pts
80
1.8-8.9
0.81
-0.14
0.77
62
Switched serial DS
15 sheep
23
2.7-10.9
0.54
-1.69
1.90
63
Switched serial DS
5 dogs
272
1.8-13.5
0.92
NR
0.96
41
Switched serial DS
5 dogs
176
1.0-8.0
0.94
-1.1
0.62
64
Switched serial DS
7 CABG pts
44
2.5-9.4
0.90
0.07
0.85
43
Switched serial DS
4 dogs
115
1.9-12.2
0.91
0.21
0.76
42
Oleic acid lavage
4 dogs
41
1.8-6.5
0.83
0.02
0.65
44
Switched serial DS
5 CABG pts
NR
NR
NR
0.20
0.79
54
Switched serial DS
10 CABG pts
36
2.61-8.1
0.92
0.02
0.70
46
Switched serial DS
27 CABG pts
69
NR
0.85
-0.01
0.62
65
Switched serial DS
NR
48
NR
NR
0.26
NR
66
Switched serial DS
42 CABG pts
117
2.6-8.2
NR
0.07
0.81
67
Switched serial DS
10 CABG pts
48
1.9-7.8
NR
0.46
0.85
68
Switched serial DS
21 CABG pts
NR
3.0-10.0
NR
0.11
0.95
NR=Not Reported
CV=Coefficient of Variation
DS=Dead Space y=rebreathing cardiac output, x=TDco

Figure 1.1. The NICO2 pneumatic rebreathing valve assembly manufactured by Novametrix Inc.

Figure 1.2. One three minute measurement cycle.

Figure 1.3. Typical change in carbon dioxide elimination and end-tidal CO2 signals during one three minute rebreathing cardiac output measurement.
100
150
200
250
300
1 3 5 7 9 11 13 15 17 19 21 23 25 27 29 31 33 35 37 39 41 43 45 47 49 51 53 55 57
Breath Number (RR = 15/min)
VC
O2
(mL/
min
)
34
35
36
37
38
petC
O2
(mm
Hg)
petCO2
VCO2
RebreathingNon-RebreathingNon-Rebreathing
PETCO2
V.CO2
V. CO
2 (m
L/m
in)
PETC
O2 (
mm
Hg)
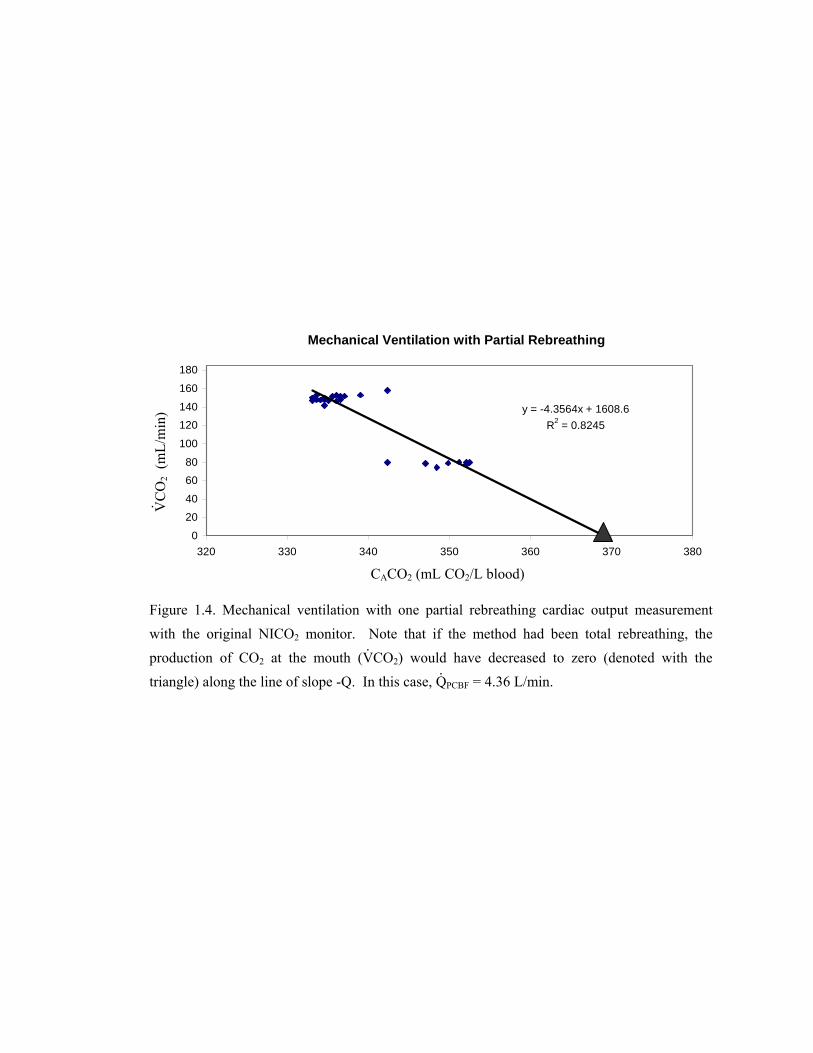
Figure 1.4. Mechanical ventilation with one partial rebreathing cardiac output measurement with the original NICO2 monitor. Note that if the method had been total rebreathing, the production of CO2 at the mouth (V
.CO2) would have decreased to zero (denoted with the
triangle) along the line of slope -Q. In this case, Q.
PCBF = 4.36 L/min.
Mechanical Ventilation with Partial Rebreathing
y = -4.3564x + 1608.6R2 = 0.8245
0
20
40
6080
100
120140
160
180
320 330 340 350 360 370 380
CACO2 (mL CO2/L blood)
V. CO
2 (m
L/m
in)

CHAPTER 2
PREPARATION FOR CLINICAL STUDIES
Because of difficulties with inconsistent ventilation, the original NICO2 system was
designed for mechanically ventilated patients and patients with mixed breathing. Several
challenges were anticipated for the modification of the original monitor for spontaneously
ventilated patients. This chapter reports the hardware and software alterations made to the
device in preparation for the subsequent clinical study.
2.1 Introduction
In its original configuration, the NICO2 monitor was developed for mechanically
ventilated patients who have regular breathing patterns. During mechanical ventilation, tidal
volume and respiratory rate may be constant for a matter of hours. The ventilator controls
inspiratory and expiratory pauses, inhalation rate, and inspired gases. Thus, the respiratory
signal is quite reliable and free of many artifacts. When partial rebreathing is initiated,
ventilatory drive by the patient does not affect the measurement. This allows the signal to be
very predictable during and following partial rebreathing maneuvers.
Mixed breathing is largely controlled by the ventilator, but occasional patient
respiratory efforts and assisted breaths may be inserted in between the mechanical breaths.
Algorithm refinements to the original NICO2 made the cardiac output (CO) estimations reliable
despite this small amount of irregularity in the respiratory signals.
In contrast to mechanical and mixed ventilation, spontaneous ventilation is irregular.
The recorded data can include sighs, coughs, snoring, and talking. Inspiratory and expiratory

pauses, rates, and volumes may change with each breath. A large breath may be followed by a
small breath, or small and big breaths can even be divided among several inspiratory and
expiratory periods. These changes in ventilation are based primarily on carbon dioxide and
secondarily on oxygen levels in the blood. Because a spontaneously breathing subject adjusts
ventilation to control CO2 and O2, a long rebreathing period may cause the body to counteract
the rebreathing maneuver by increasing ventilation.
The irregular nature of spontaneous ventilation rendered the original NICO2 cardiac
output estimations inconsistent. With the normal deviations in the respiratory pattern, the
PETCO2 and V.CO2 signals were altered, such that they were not necessarily indicative of the
cardiac output, but rather of the changes in ventilation and various components of the lung
physiology, including anatomic dead space and diffusion of the gases during differing
inspiratory pause lengths. The standard deviation of an average V.CO2 of 405 mL/min was 215
mL/min, while an average PETCO2 of 38.5 mmHg had a standard deviation of 5.5 mmHg.
This chapter describes the hardware and software alterations made to the original
system in preparation for the subsequent clinical patient study. The foreseen challenges to
signal acquisition in spontaneously ventilated subjects fell into three main categories: patient
interface, irregular signal, and lower percentage of inspired oxygen levels (room air is 21%
oxygen, compared to typical ventilator settings of 70%). These changes were needed to assure
adequate oxygenation and to improve signal acquisition during spontaneous respiration so that
cardiac output estimates could be more reliably made from irregular spontaneous ventilation
signals.
2.2 Patient Interface: Mask vs. Mouthpiece
2.2.1 Introduction
In preparation for the preliminary volunteer studies and subsequent algorithm
development, the choice of an appropriate patient interface had to be made. The best options

for measurements on spontaneously breathing subjects were a mouthpiece and a face mask.
Advantages of the mouthpiece potentially included a better expiratory gas signal to noise ratio
and a smaller deadspace. Advantages of the mask potentially included more patient comfort
during the measurement, the ability to swallow (absence of a nose clip), a better fit for more
face shapes, less cooperation required from the patient, and the ability to monitor both mouth
and nasal ventilation, as in during sleep. It was proposed that the clinician could have the
flexibility to use either attachment, the mask or the mouthpiece, as determined by the needs of
the patient. This would require that the monitor be capable of detecting which attachment was
in place. In addition, it was important to know whether the mouthpiece and masks could be
used interchangeably to measure mainstream PETCO2 accurately. The purpose of these studies
was to determine whether one type of interface must be used rather than the other, or whether
either type of attachment would be acceptable.
2.2.2 Materials and Methods
Following IRB approval and informed subject consent, two healthy, spontaneously
breathing volunteers were monitored alternatively with a small face mask, a small mask
together with a nose clip, a medium mask, a medium mask with a nose clip, a mouthpiece with
a nose clip, and a nose clip with no extra attachment. The nose clip was used together with the
face masks to observe whether the deadspace estimations could be improved by reducing the
mixing induced by nasal breathing. The mask type in these studies was a disposable medium
adult anesthesiology face mask with inflation valve and hook ring (Sims, Smiths Industries,
Fort Myers, FL). Each attachment was directly attached to a NICO2 sensor. The NICO2
monitor was used to measure the PETCO2 and estimate the deadspace of each of the attachments.
This is done with a single breath FECO2 vs. volume curve (Figure 2.1), the area under which (A
+ p) can be summed for all the breaths in a minute to calculate V.CO2 in mL/min. Airway
deadspace (Vd) is estimated from the start of expiration to the point in a single breath FECO2 vs.

volume plot where the area under the curve (p) is equal to the area between the waveform and
the asymptotic line drawn at the maximum level of FECO2 (q).
In a second phase of the study, subjects were monitored with a single medium adult
mask and NICO2 sensor. A Datex anesthesia monitoring system, the Capnomac Ultima
(Division of Instrumentarium Corp., Helsinki, Finland) was used to measure the reference
PETCO2 values at various positions near the patient’s mouth. These positions were at the NICO2
sensor window, at the distal end of the NICO2 rebreathing assembly, parallel with the subject’s
teeth, and at the distal end of the face mask deadspace. Because there are small errors
associated with the measurements of each monitor, the numbers from the NICO2 monitor were
adjusted to match those of the Datex monitor when the Datex probe was at the same position as
the NICO2 sensor window. This was the zero point of the values for the comparisons in this
study, and all subsequent NICO2 measurements were adjusted by this amount. The PETCO2
values were recorded during nonrebreathing periods and at the end of 50 second partial
rebreathing periods.
2.2.3 Results
The NICO2 monitor did not consistently estimate the deadspace, even when mixing
within the deadspace was minimized with a nose clip. The deadspace measurement results are
shown in Table 2.1. The monitor could therefore not detect which attachment, the mouthpiece,
small mask, or medium mask, was in place.
End-tidal CO2 measurements were not observed to change when different attachments
were in place, and all PETCO2 measurements were within the manufacturer specification limits
for accuracy (less than two mmHg difference at 0-40 mmHg) when compared to the Datex
measurements.
In the second phase of the study, the two monitors recorded the same ∆ PETCO2 initiated
by each of the rebreathing maneuvers. The average difference between the fixed position

mainstream NICO2 and the variable position sidestream Datex PETCO2 measurements was 0.48
mmHg with a standard deviation of 0.35 mmHg.
2.2.4 Discussion
For cardiac output estimation by the NICO2 rebreathing algorithm, it is less important
whether the absolute PETCO2 measurement is accurate; it is very important to measure the
change in PETCO2 accurately. The fixed-position NICO2 sensor satisfactorily measured the
same rebreathing-induced ∆ PETCO2 as the Datex probe, which was placed in several different
positions close to the mouth. Neither the mouthpiece nor the face mask was found to be
substantially better than the other for measurement of PETCO2 in these tests.
Making two types of patient interfaces available to the clinician would introduce an
extra level of complication to the data analysis portion of the work. It was hoped that the
monitor could detect which attachment was in place so the two groups could be separated from
each other during analysis if necessary. Because the NICO2 monitor did not distinguish
between the tested attachments based on measurements of deadspace or end-tidal CO2, it was
necessary to choose one type of attachment for the future clinical studies. The face mask
performed well for PETCO2 measurements on the volunteers, and since it offered more
advantages in comfort and fit over the mouthpiece, it was decided to pursue the face mask as
the preferred attachment for future studies.
2.3 Face Mask Selection
2.3.1 Introduction
Face masks are widely used throughout medical practice. For the purpose of a clinical
cardiac output data collection and comparison trial, it was decided to choose one of the
commonly available commercial face masks rather than developing a new mask.
2.3.2 Materials and Methods
Commercially available masks were researched, evaluated, and the best one chosen.
The desired criteria were as follows: comfortable fit for most people, low airway resistance to
minimize work of breathing, good seal with the face that minimizes leaks during both
inspiration and expiration, low deadspace compared to VT, low price, widely available, able to
capture both nasal and oral respiratory signals, easy to wear when sick or sleepy, quick and easy
to strap on or hold in place, and useful even on people with facial trauma or beards. Local
physicians were asked to contribute their opinions and experience during the evaluation
process. An internet and product catalog search was performed. Following this search, the best
masks were tried on for comfort and to test the quality of the seal formed.
2.3.3 Results
Based on the decision criteria, the commonly used anesthesiology face mask with
inflation valve and hook ring (Sims, Smiths Industries, Fort Myers, FL) was chosen for
subsequent clinical studies (Figure 2.2). This mask had the advantages of being widely
available, comfortable, forming a leak-free seal with most faces quite easily, being cheaper than
many other masks, and being available in small, medium, and large adult and pediatric sizes.
The deadspace of the face mask was approximately 100-150 mL when the appropriately sized
mask was placed on the subject’s face. The anesthesiology face mask had an air-filled
membrane encircling the perimeter of the mask. This membrane was inflatable and, when
pressed against the face, formed a virtually leak-free seal. A head strap could be used to hold
the mask in place. The NICO2 sensor could be easily attached directly to the mask to obtain
respiratory measurements.
2.3.4 Discussion
Although the face mask chosen had many advantages, a main disadvantage was that it
was rather large and made the apparatus appear much more bulky than necessary when it was
placed on the subject. The large deadspace volume of the mask occasionally made some
volunteers feel like they needed to breathe more rapidly or with larger tidal volumes than
normal. It was decided that despite this disadvantage, this mask was the best mask available for
the clinical trials.
2.4 Amount of Rebreathing
2.4.1 Introduction
In preparation for the subsequent clinical studies, the rebreathing system was tested on
healthy, spontaneously breathing volunteers. It was known that a small percent of rebreathing
(less than approximately 40% of the average breath size) was typically enough to obtain an
acceptable signal to noise ratio and cardiac output estimate for mechanically ventilated subjects,
but it was not clear how the system originally designed for intubated patients would perform on
spontaneously ventilated patients. Furthermore, it was known that the respiratory signal of the
spontaneously breathing subject was much more irregular than that of the mechanically
ventilated patient. This section of the chapter presents the effect of differing amounts of
rebreathing on the quality of the acquired signal and the resultant cardiac output estimate. A
small percent of rebreathing, a large percent of rebreathing, and total rebreathing were tested.
In addition, these trials were used to develop, in part, the final protocol for the clinical study.
2.4.2 Small Percent Rebreathing
2.4.2.1 Materials and methods. Following IRB approval and informed subject
consent, four healthy volunteers were instructed to complete approximately 60 minutes of
cardiac output monitoring and data collection during spontaneous respiration through the face
mask selected in section 2.3. The face mask was an anesthesiology face mask (Sims, Smiths
Industries, Fort Myers, FL) and was tightly secured with a head strap. The rebreathing volume
was set to approximately 200 mL and was introduced automatically for 50 seconds every three
minutes by the original NICO2 monitor. The data collection took place automatically with the
NICO2 monitor during this period, and the data were later analyzed off-line. A reusable pulse
oximeter (Novametrix Medical Systems, Wallingford, CT) was affixed to the index finger.
Noninvasive blood pressure, NICO2 cardiac output values, and SpO2 were also manually
recorded every three minutes. During the study, volunteers watched a movie as a distraction
from the study.
The protocol was broken into three phases. First, for 20 minutes, the volunteers lay
supine on a hospital bed with the head raised approximately 30 degrees. Then they stood next
to the bed for 20 minutes. During the third period of twenty minutes, the volunteers performed
light exercise, consisting of stepping onto and then off of a two-inch step.
2.4.2.2 Results. Motion artifact was present in the pulse oximeter and respiratory
signals during the light exercise portion of the study. The exercise motion also caused mask
leaks and incorrect CO2 measurements. The data from this portion of experiments was
therefore eliminated.
During each of the first two periods, the blood pressure did not trend up or down for
any of the subjects monitored. Average blood pressure, cardiac output, and SpO2 values, as
well as the corresponding standard deviations for each subject are shown in Table 2.2.
The respiratory data obtained from the spontaneously ventilated subjects was much
more variable and less predictable than the data recorded during cases with mechanical
ventilation. In these tests, the percent of rebreathing was determined to be 20 to 33 percent,
depending on the tidal volume. From the CO2 and V.CO2 signals, it appeared that a small
percent of rebreathing was not enough to cause a change in V.CO2 and CO2 to make a good
cardiac output estimation. In some cycles, the baseline signal before and after rebreathing was
quite stable, which aided in making a reasonable cardiac output estimation. However, the
estimations for each individual were not consistent. None of the cycles showed the preferable
PETCO2 plateau during rebreathing, and end-tidal CO2 was only increased by an average of 2.32
mmHg with a standard deviation of 0.85 mmHg. The signal was so poor during most cycles

that it was very difficult to distinguish the rebreathing periods from the nonrebreathing periods;
the standard deviation of the baseline PETCO2 signal was 0.97 mmHg. An example of the V.CO2
versus PETCO2 plot is shown in Figure 2.3.
2.4.2.3 Discussion. There was too much motion artifact introduced during exercise to
collect meaningful data, so the exercise portion of subsequent data collection protocols was
postponed until the device had been further developed for spontaneously breathing subjects.
Since no cardiac output comparison method was available for the healthy volunteers,
the other variables such as blood pressure had to be used to describe the general clinical picture.
The blood pressure did not change in any of the subjects tested, so it was deduced that cardiac
output was probably not changing drastically during the study periods. Therefore, the estimates
from the NICO2 should not have been changing drastically over the course of the measurement
period.
The quality of the respiratory signal was also manually studied since the data rejection
algorithm had not been improved to analyze spontaneous breaths. It was observed that the
small percent of rebreathing was too easily overcome by the changes in ventilatory drive
response displayed by the spontaneously breathing volunteers. This was because with each
large breath, the subjects inspired a copious amount of fresh air, which diluted the amount of
rebreathing so that very little change in either end-tidal CO2 or V.CO2 was achieved during the
rebreathing maneuver. The amount of change in the signal initiated by rebreathing was much
smaller than the changes inherent in the signal during most spontaneous breaths. Therefore, a
larger percent of rebreathing was necessary to achieve meaningful cardiac output estimations.
2.4.3 Large Percent Rebreathing
2.4.3.1 Materials and methods. Following IRB approval and informed subject
consent, seven volunteers were instructed to watch a video during approximately 60 minutes of
cardiac output monitoring and data collection. Volunteers were spontaneously breathing while
wearing the previously selected face mask and NICO2 sensor. The face mask was snugly

secured with a head strap. The rebreathing volume was set to approximately 450 mL
(approximately 60% of the tidal volume of most breaths) and was introduced automatically for
50 seconds every three minutes by the NICO2 monitor. A reusable pulse oximeter was affixed
to the index finger. The NICO2 monitor automatically collected the respiratory data during this
period, and the data were later analyzed off-site. Blood pressure, cardiac output, and SpO2
values were also manually recorded every three minutes. For the first 35-45 minutes, the
volunteers lay in the supine position with the upper body elevated thirty degrees. The
remaining 15 minutes were spent standing in place next to the bed.
Following the data collection period, the information was examined for consistency,
signal clarity, sources of noise, and potential for repeatable cardiac output estimations.
Different periods during rebreathing and before and after rebreathing were used to calculate the
cardiac output. With spreadsheet software, cardiac output was manually calculated, and the
best periods for consistent calculation determined.
2.4.3.2 Results. The results for the manually recorded values, blood pressure, cardiac
output, and SpO2, are shown in Table 2.3. An excessive amount of motion artifact was present
in the CO2 signal during the standing phase of the study, requiring this portion of the data to be
eliminated from analysis.
The change in the end-tidal CO2 signal initiated by rebreathing was 4.82 mmHg with a
standard deviation of 0.81 mmHg. The baseline PETCO2 signal had a standard deviation of 0.54
mmHg. A recognizable plateau in the end-tidal CO2 signal was observed during rebreathing.
The data appeared to be more regular than the data obtained during the small percent
rebreathing study (Section 2.4.2). Some cycles in this data set appeared to produce reasonable
estimations based on the blood pressure and clinical picture, while others did not. It was
determined that the best periods for cardiac output calculation were periods with high levels of
stability, such as during the plateau of rebreathing and the period just prior to rebreathing.
When there was great uniformity in the signal, a distinguishable plateau was created in the end-
tidal component. Periods where this occurred were partially attributed to stable CvCO2 and

partially to stable breath size, respiratory rate, and otherwise stable breathing patterns, as
observed in the recorded data.
2.4.3.3 Discussion. The large percent of rebreathing was found to be much more
appropriate than the small percent of rebreathing for producing clinically useful measurements
in spontaneously breathing subjects. The changes in both CO2 and V.CO2 signals initiated by
the large percent of rebreathing were greater than those initiated by the small percent of
rebreathing, and the change was enough to result in cardiac output estimates with a lower
standard deviation than in the small percent rebreathing tests. The period of the data collected
when the subjects were standing contained the most inconsistency and error. Because this
portion of the data had to be eliminated, it was decided to pursue data collection in the supine
position in all subsequent studies.
As the data were examined, it was determined that the signal processing program and
data rejection algorithm needed to be altered. As the program was initially written, there was
no indication of time within each cycle, and there was no relation of the data points to each
other. Periods of rebreathing were not distinguished from periods of nonrebreathing. The
number of points evaluated within each measurement period was set, and it was impossible to
weight some points more heavily than others. An example of the original presentation of the
large percent rebreathing data is shown in Figure 2.4. Processes to improve the data processing
and presentation were begun, and it was decided that the implemented changes would be based
on the data collected from the clinical study. These processes are described in detail in chapter
four.
The larger and more frequently varying tidal volumes of most spontaneously breathing
people necessitated this larger rebreathing volume in order to achieve a measurable change in
the end-tidal CO2 and V.CO2 signals. More of the cardiac output estimates made from large
rebreathing volumes were reasonable values for people at rest with stable blood pressure,
although this could not be confirmed with a reference method. Based on the results of this
study and the newly developed data processing algorithms, the large amount of rebreathing was
preliminarily chosen for the clinical ICU studies. It was hoped that this configuration would
provide clinical data that would be useful during replay for further algorithm refinement. A set
of experiments for volunteers with total rebreathing was also developed in the event that the
data from total rebreathing was markedly better for cardiac output estimations than large
percent rebreathing data.
2.4.4 Total Rebreathing
2.4.4.1 Materials and methods. Following IRB approval and informed subject
consent, three healthy volunteers were requested to breathe through the previously selected face
mask and NICO2 assembly during automated rebreathing maneuvers. A reusable pulse oximeter
was affixed to the index finger. Cycles lasted three minutes and were repeated sequentially,
with 50 seconds of total rebreathing in each cycle. Each study lasted approximately 30
minutes. The data were collected automatically and saved for later analysis.
2.4.4.2 Results. The change in the end-tidal CO2 signal was larger during total
rebreathing than during partial rebreathing (average change 9.05 mmHg, standard deviation
1.56 mmHg). The standard deviation of the baseline signal was 0.95 mmHg. As in partial
rebreathing, some cycles displayed a plateau in the PETCO2 values, while other cycles were
highly irregular in shape. During the 50 seconds of total rebreathing, the oxygen levels, as
monitored by the pulse oximeter, regularly dropped on average from 98% to 93%. During the
recovery period after rebreathing, the strong respiratory drive response caused hyperventilation
and an associated tendency to reduce the PETCO2 to lower than normal levels, resulting in an
unstable baseline respiratory signal. In most cases, the periodic shape of the signal, which was
caused by the cyclical alterations in ventilation, ceased before the next rebreathing maneuver
began. The SpO2 level returned to normal levels between rebreathing maneuvers. The subjects
uniformly commented that total rebreathing was uncomfortable after 20-35 seconds.
2.4.4.3 Discussion. No reference standard was used in this study, so cardiac output
estimation performance could not be directly evaluated. Total rebreathing was found to provide

the best signal to noise ratio with the unaltered algorithm. The changes initiated in end-tidal
CO2 and V.CO2 in response to rebreathing were significant in comparison to the noise generated
by spontaneous ventilation. However, total rebreathing was more of a disturbance to the
subjects’ ventilation and comfort level, and it initiated a stronger respiratory drive response in
spontaneously breathing subjects than the partial rebreathing measurements did. The response
of respiratory drive initiated by total rebreathing caused more extreme variation in the signal,
which negatively impacted the repeatability of the measurements. Subsequent studies were
designed to determine whether the strong signal and clear PETCO2 plateau produced during total
rebreathing could be used in conjunction with a shorter rebreathing period.
It was concluded that 50 seconds of total rebreathing was too long for the comfort and
safety of most spontaneously breathing subjects. The hemoglobin saturation drop observed in
healthy, spontaneously breathing subjects indicated that this total rebreathing setup was not safe
for sick patients who potentially could not efficiently perform gas exchange. Because of the
oxygen saturation drop during rebreathing, studies were also planned for oxygen delivery
during measurement periods.
2.5 Length of Rebreathing Time
2.5.1 Introduction
These tests were developed to test whether a total rebreathing maneuver could be used
in conjunction with a shorter rebreathing period to create large enough changes in end-tidal CO2
and V.CO2 to make good estimates of cardiac output while minimizing the respiratory drive
response.
2.5.2 Variable Length of Total Rebreathing ( 1200 mL deadspace)
2.5.2.1 Materials and methods. Following IRB review and informed subject consent,
five healthy volunteers at rest in a supine position were asked to breathe through the previously

selected face mask and the NICO2 rebreathing assembly. Rebreathing was set in increments of
five from 10 to 40 seconds within a three-minute measurement period. A reusable pulse
oximeter was affixed to the index finger. The data collection process lasted approximately 25
minutes for each subject. SpO2, PETCO2, and V.CO2 were monitored and recorded automatically
for later analysis and data playback.
2.5.2.2 Results. Total rebreathing periods between 20-30 seconds provided the best
data for cardiac output calculation, but with total rebreathing periods, SpO2 dropped
significantly in most subjects, from an average of 98% to 93% saturation. The end-tidal CO2
measurements reached the maximum level, or plateau (change in PETCO2 signal between
subsequent breaths less than approximately 0.5 mmHg), during rebreathing when the
rebreathing was at least 20 seconds or longer. An example graph of a 25 second rebreathing
period that displayed the desired plateau of the CO2 signal is shown in Figure 2.5. In some
files, the end-tidal CO2 reached a plateau during rebreathing, but then was reduced to a lower
level after 30 seconds of rebreathing due to the ventilatory drive response initiated by long total
rebreathing periods. Periods of rebreathing shorter than 20 seconds did not produce a
meaningful signal for cardiac output calculation (resultant C.O. estimates ± >100%). An
example plot of the end-tidal CO2 for a 15 second period of rebreathing is shown in Figure 2.6.
Subjects reported that rebreathing periods shorter than 25-30 seconds were not uncomfortable.
2.5.3 Variable Length of Partial (60-80%) Rebreathing
2.5.3.1 Materials and methods. Following IRB review and informed subject consent,
volunteers were asked to breathe through the previously selected face mask and the NICO2
rebreathing assembly. Partial rebreathing (60-80% of the average tidal volumes) was set in
increments of five from 20 to 40 seconds within a three-minute measurement period. A
reusable pulse oximeter was affixed to the index finger. The data collection process lasted
approximately 25 minutes for each subject. SpO2, PETCO2, and V.CO2 were monitored and
recorded automatically for later analysis and data playback.

2.5.3.2 Results. The SpO2 did not drop significantly in the subjects tested (average
drop from 98 to 97 percent). Partial rebreathing periods of 35 seconds with this setup were long
enough for the end-tidal CO2 signal to reach a plateau (change in signal between subsequent
breaths less than approximately 0.5 mmHg) for a cardiac output calculation. A strong
ventilatory response to the rebreathing was not evident in the resultant respiratory signal. The
average change of PETCO2 within one measurement cycle was 4.5 ± 0.9 mmHg, while the
average change in V.CO2 was 162 ± 25 mL/min.
2.5.4 Discussion
In contrast to the original NICO2 50 second rebreathing method, shorter periods of
partial and total rebreathing were found to be sufficient to create significant changes in end-
tidal CO2 and V.CO2. Since the patient comfort was much greater during partial rebreathing
than during total rebreathing, and because the signal quality did not increase substantially in
total rebreathing, partial rebreathing was selected for the subsequent patient studies. To balance
the needs of patient comfort and signal quality, partial rebreathing periods of 35 seconds were
selected for the subsequent clinical data collection study.
Another disadvantage of the total rebreathing was that it generally caused a reduction in
the oxygenation levels of the blood. The reduction of oxygenation levels from 98 to 97 percent
during rebreathing periods did not pose a threat to healthy volunteers, but the saturation levels
of sick patients may have decreased further if they were subjected to the total rebreathing
maneuvers. Therefore, the safety feature of an oxygen delivery system was considered for
development for the clinical trials. This was considered a relevant precaution for clinical
testing of shorter partial rebreathing maneuvers on spontaneously breathing subjects.

2.6 Oxygen Delivery Mask with the METI
Human Patient Simulator
2.6.1 Introduction
Because healthy volunteers experienced a slight drop in the oxygenation levels of the
blood during preliminary testing, oxygen delivery was determined to be a prudent precaution
for the clinical testing phase of the modified NICO2 system. It was not known whether the
delivery of oxygen during respiratory measurements would affect the mainstream capnometer,
flow sensors, or cardiac output estimates. The following tests allowed for the development of
an oxygen delivery system that did not hamper any of the components of mainstream signal
acquisition. Two types of mask were chosen for these experiments: an adult oxygen delivery
mask (Hudson Oxygen Therapy Sales Co., Temecula, CA) and an anesthesiology mask (Sims,
Smiths Industries, Fort Myers, FL), as described above.
These tests were initially performed on a patient simulator (METI, Sarasota, FL)
because the mixing chamber of the METI lungs is sidestream sampled and analyzed with an HP
oxygen sensor (Hewlett Packard M1025B, Palo Alto, CA). This allows one to sample the gas
concentrations in the alveoli and gain a better understanding of what gas is being delivered to
the mask. Once these tests were completed, the best setups were verified on human subjects.
The purpose of the first set of studies was to determine whether an O2 delivery mask
provided a sufficient means of simultaneous mainstream signal acquisition and oxygen
delivery.
2.6.2 Basic Setup
2.6.2.1 Materials and methods. Measurements were made with a human patient
simulator as the subject. The patient simulator’s internal oxygen sensor allowed for the
measurement of alveolar oxygen levels. As when monitoring a patient, one can also measure
PETCO2 and FETO2 expired from the mannequin’s mouth and nose with mainstream or sidestream
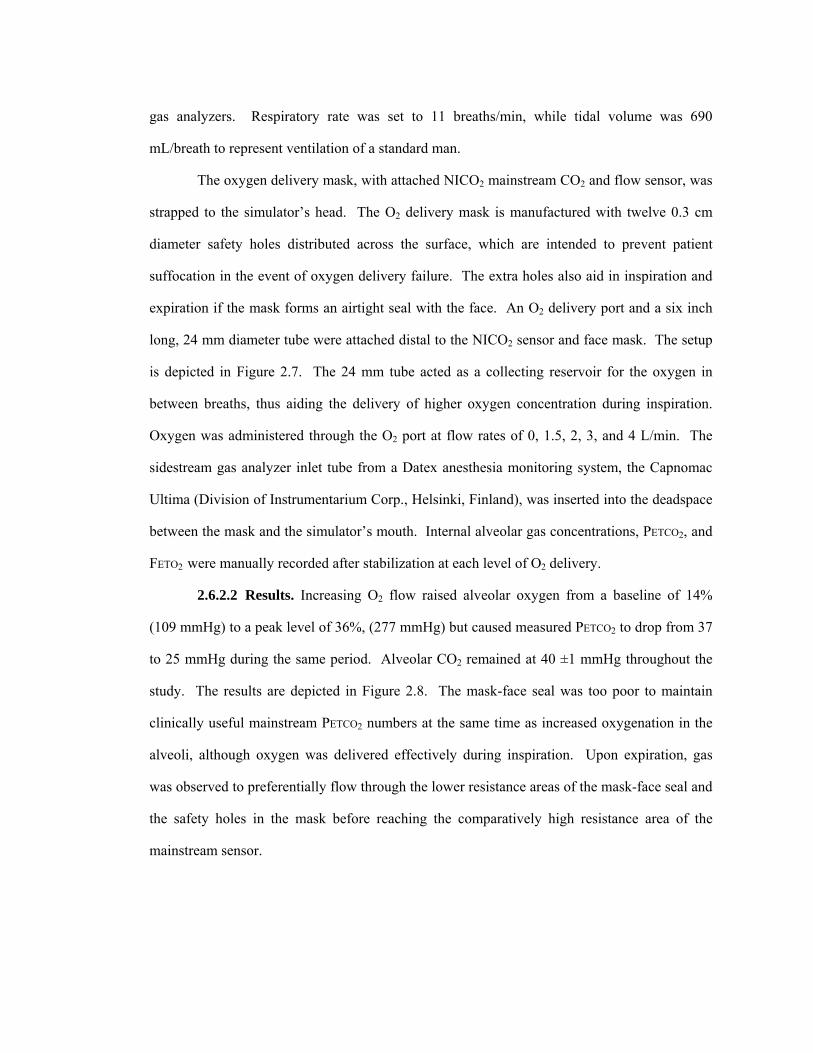
gas analyzers. Respiratory rate was set to 11 breaths/min, while tidal volume was 690
mL/breath to represent ventilation of a standard man.
The oxygen delivery mask, with attached NICO2 mainstream CO2 and flow sensor, was
strapped to the simulator’s head. The O2 delivery mask is manufactured with twelve 0.3 cm
diameter safety holes distributed across the surface, which are intended to prevent patient
suffocation in the event of oxygen delivery failure. The extra holes also aid in inspiration and
expiration if the mask forms an airtight seal with the face. An O2 delivery port and a six inch
long, 24 mm diameter tube were attached distal to the NICO2 sensor and face mask. The setup
is depicted in Figure 2.7. The 24 mm tube acted as a collecting reservoir for the oxygen in
between breaths, thus aiding the delivery of higher oxygen concentration during inspiration.
Oxygen was administered through the O2 port at flow rates of 0, 1.5, 2, 3, and 4 L/min. The
sidestream gas analyzer inlet tube from a Datex anesthesia monitoring system, the Capnomac
Ultima (Division of Instrumentarium Corp., Helsinki, Finland), was inserted into the deadspace
between the mask and the simulator’s mouth. Internal alveolar gas concentrations, PETCO2, and
FETO2 were manually recorded after stabilization at each level of O2 delivery.
2.6.2.2 Results. Increasing O2 flow raised alveolar oxygen from a baseline of 14%
(109 mmHg) to a peak level of 36%, (277 mmHg) but caused measured PETCO2 to drop from 37
to 25 mmHg during the same period. Alveolar CO2 remained at 40 ±1 mmHg throughout the
study. The results are depicted in Figure 2.8. The mask-face seal was too poor to maintain
clinically useful mainstream PETCO2 numbers at the same time as increased oxygenation in the
alveoli, although oxygen was delivered effectively during inspiration. Upon expiration, gas
was observed to preferentially flow through the lower resistance areas of the mask-face seal and
the safety holes in the mask before reaching the comparatively high resistance area of the
mainstream sensor.

2.6.3 Airflow Prevented During Inspiration
2.6.3.1 Materials and methods. The basic setup (section 2.6.2.1) was altered such
that the holes in the mask were covered externally with plastic tabs that prevented airflow
during inspiration, but allowed some passage of air during expiration, albeit at a higher initial
resistance. This setup was intended to force more airflow past the mainstream sensor than the
basic setup in order to produce a better mainstream PETCO2 signal.
2.6.3.2 Results. This setup yielded poor mainstream PETCO2 readings during periods
of elevated oxygen delivery. Alveolar oxygen levels increased from 14% (103 mmHg) to 32%
(245 mmHg), but measured PETCO2 dropped from 37 to 20 mmHg during the same period
(Figure 2.9). Both oxygenation and PETCO2 levels were worse with this setup than the basic
setup.
2.6.4 Airflow Prevented During Inspiration, No O2 Reservoir
2.6.4.1 Materials and methods. The previous setup (section 2.6.3.1) was altered such
that the six inch oxygen reservoir tube was detached. The NICO2 assembly was replaced with a
simple Capnostat® and flow sensor window. This setup was intended to reduce the resistance
to flow past the mainstream sensor of the previous setups and thereby obtain a better PETCO2
signal concurrent with oxygenation. Oxygen was administered through the delivery port at
flow rates of 0, 1.5, and 2 L/min.
2.6.4.2 Results. Mainstream PETCO2 measurements fell from 45 to 12 mmHg with only
2 L/min O2 flow. The face seal was extremely poor, allowing much of the expired gas to escape
before reaching the mainstream sensor. Gas was observed to preferentially flow through the
safety holes of the mask.
2.6.5 Airflow Prevented During Inspiration and Expiration
2.6.5.1 Materials and methods. The holes in the O2 delivery mask of the basic setup
(2.6.2.1) were sealed closed during both inspiration and expiration for this study. All other

components of the basic setup were maintained the same. This setup was intended to force
more expired air past the mainstream sensor.
2.6.5.2 Results. Again, poor mainstream PETCO2 readings were observed during
periods of elevated oxygen delivery. Upon exhalation, gas was observed to preferentially flow
past the poor face seal, thereby reducing the mainstream PETCO2 signal. Alveolar oxygen levels
increased from 14% (107 mmHg) to 29% (226 mmHg), but measured PETCO2 dropped from
baseline 37 to 23 mmHg (Figure 2.10). In this experiment, oxygenation was worse than in
previous experiments, and measured PETCO2 numbers remained clinically unacceptable.
2.6.6 Discussion
The oxygen delivery mask was found to be unacceptable for simultaneous oxygen
delivery and mainstream PETCO2 signal acquisition on the patient simulator. An excessive
volume of the exhaled gas flowed past the mask-face seal and through the safety holes, thereby
preventing accurate mainstream PETCO2 readings. Respiration could still be detected via the
diminished PETCO2 signal, but for the purpose of CO2 production and cardiac output
calculations, these setups were inadequate.
2.7 Anesthesia Face Mask Oxygen Delivery
with the METI Patient Simulator
2.7.1 Introduction
The purpose of this set of studies was to determine whether the face mask chosen in
section 2.3 as tested in differing conformations would provide a better face seal and thereby
maintain a mainstream PETCO2 signal concurrent with oxygen delivery. These tests were
performed on the METI human patient simulator.
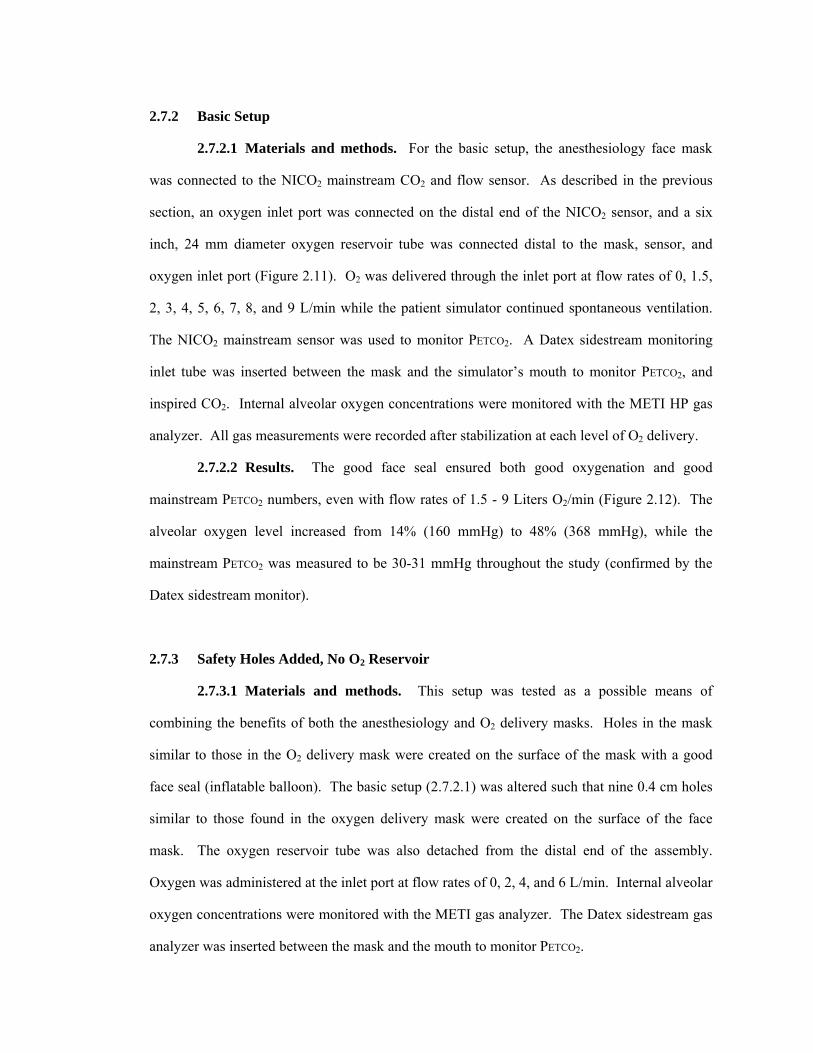
2.7.2 Basic Setup
2.7.2.1 Materials and methods. For the basic setup, the anesthesiology face mask
was connected to the NICO2 mainstream CO2 and flow sensor. As described in the previous
section, an oxygen inlet port was connected on the distal end of the NICO2 sensor, and a six
inch, 24 mm diameter oxygen reservoir tube was connected distal to the mask, sensor, and
oxygen inlet port (Figure 2.11). O2 was delivered through the inlet port at flow rates of 0, 1.5,
2, 3, 4, 5, 6, 7, 8, and 9 L/min while the patient simulator continued spontaneous ventilation.
The NICO2 mainstream sensor was used to monitor PETCO2. A Datex sidestream monitoring
inlet tube was inserted between the mask and the simulator’s mouth to monitor PETCO2, and
inspired CO2. Internal alveolar oxygen concentrations were monitored with the METI HP gas
analyzer. All gas measurements were recorded after stabilization at each level of O2 delivery.
2.7.2.2 Results. The good face seal ensured both good oxygenation and good
mainstream PETCO2 numbers, even with flow rates of 1.5 - 9 Liters O2/min (Figure 2.12). The
alveolar oxygen level increased from 14% (160 mmHg) to 48% (368 mmHg), while the
mainstream PETCO2 was measured to be 30-31 mmHg throughout the study (confirmed by the
Datex sidestream monitor).
2.7.3 Safety Holes Added, No O2 Reservoir
2.7.3.1 Materials and methods. This setup was tested as a possible means of
combining the benefits of both the anesthesiology and O2 delivery masks. Holes in the mask
similar to those in the O2 delivery mask were created on the surface of the mask with a good
face seal (inflatable balloon). The basic setup (2.7.2.1) was altered such that nine 0.4 cm holes
similar to those found in the oxygen delivery mask were created on the surface of the face
mask. The oxygen reservoir tube was also detached from the distal end of the assembly.
Oxygen was administered at the inlet port at flow rates of 0, 2, 4, and 6 L/min. Internal alveolar
oxygen concentrations were monitored with the METI gas analyzer. The Datex sidestream gas
analyzer was inserted between the mask and the mouth to monitor PETCO2.

2.7.3.2 Results. Mainstream PETCO2 measurements was reduced from 44 to 23 mmHg,
compared to Datex PETCO2, which fell from 46 to 44 mmHg as O2 flow rates were increased
from 0 to 6 L/min. Alveolar oxygenation increased linearly, from 13% to 28%, as O2 flow was
increased (Figure 2.13).
2.7.4 Capnostat® Sensor Window and Safety Holes, No O2 Reservoir
2.7.4.1 Materials and methods. The setup from the previous section (2.7.3.1) was
altered such that the NICO2 assembly was replaced with a simple Capnostat® and flow sensor
window. This was done to test whether the turbulent flow through the NICO2 assembly itself
caused the poor mainstream PETCO2 readings. Oxygen delivery flow rates were set to 0, 2, 4,
and 6 L/min.
2.7.4.2 Results. Mainstream PETCO2 measurements fell from 39 to 26 mmHg with
increased O2 flow rates, but did not fall as sharply at 2 L/min as it did in the previous setup.
However, the Datex sidestream PETCO2 levels remained at about 45 mmHg throughout the
study. Alveolar oxygenation increased almost linearly, from 13% to 27% as O2 delivery flow
was increased (Figure 2.14).
2.7.5 Capnostat® Sensor Window and Safety Holes with O2 Reservoir
2.7.5.1 Materials and methods. The anesthesiology mask setup from section 2.7.4.1
was altered such that a six inch long, 24 mm diameter tube was attached proximal to the sensor
window. Oxygen collected in this tube during the end-expiratory pause, thus aiding the
delivery of higher oxygen concentration during inspiration. As in the previous setup, O2 was
administered at 0, 2, 4, and 6 L/min.
2.7.5.2 Results. Mainstream PETCO2 measurements fell from 40 mmHg to 20 mmHg
with increased O2 flow rates. Internal alveolar oxygenation increased almost linearly, from
13% to 35%, which was higher than previous setups with holes in the anesthesiology face mask
(Figure 2.15).
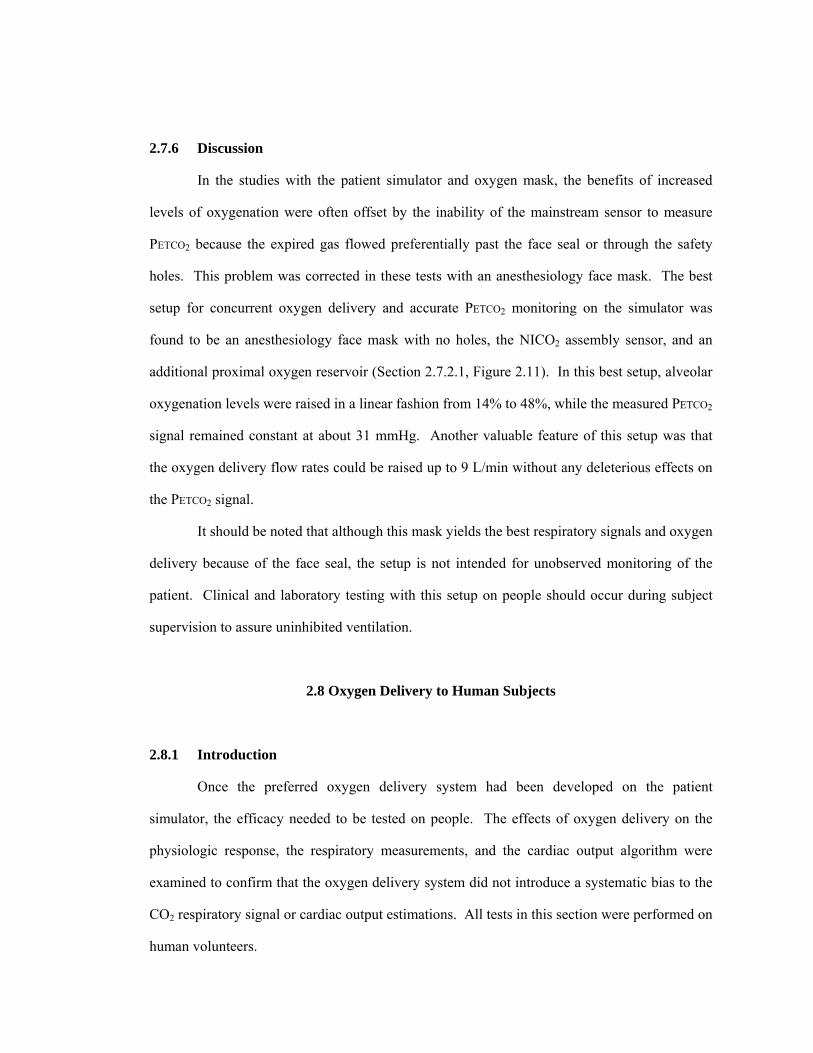
2.7.6 Discussion
In the studies with the patient simulator and oxygen mask, the benefits of increased
levels of oxygenation were often offset by the inability of the mainstream sensor to measure
PETCO2 because the expired gas flowed preferentially past the face seal or through the safety
holes. This problem was corrected in these tests with an anesthesiology face mask. The best
setup for concurrent oxygen delivery and accurate PETCO2 monitoring on the simulator was
found to be an anesthesiology face mask with no holes, the NICO2 assembly sensor, and an
additional proximal oxygen reservoir (Section 2.7.2.1, Figure 2.11). In this best setup, alveolar
oxygenation levels were raised in a linear fashion from 14% to 48%, while the measured PETCO2
signal remained constant at about 31 mmHg. Another valuable feature of this setup was that
the oxygen delivery flow rates could be raised up to 9 L/min without any deleterious effects on
the PETCO2 signal.
It should be noted that although this mask yields the best respiratory signals and oxygen
delivery because of the face seal, the setup is not intended for unobserved monitoring of the
patient. Clinical and laboratory testing with this setup on people should occur during subject
supervision to assure uninhibited ventilation.
2.8 Oxygen Delivery to Human Subjects
2.8.1 Introduction
Once the preferred oxygen delivery system had been developed on the patient
simulator, the efficacy needed to be tested on people. The effects of oxygen delivery on the
physiologic response, the respiratory measurements, and the cardiac output algorithm were
examined to confirm that the oxygen delivery system did not introduce a systematic bias to the
CO2 respiratory signal or cardiac output estimations. All tests in this section were performed on
human volunteers.
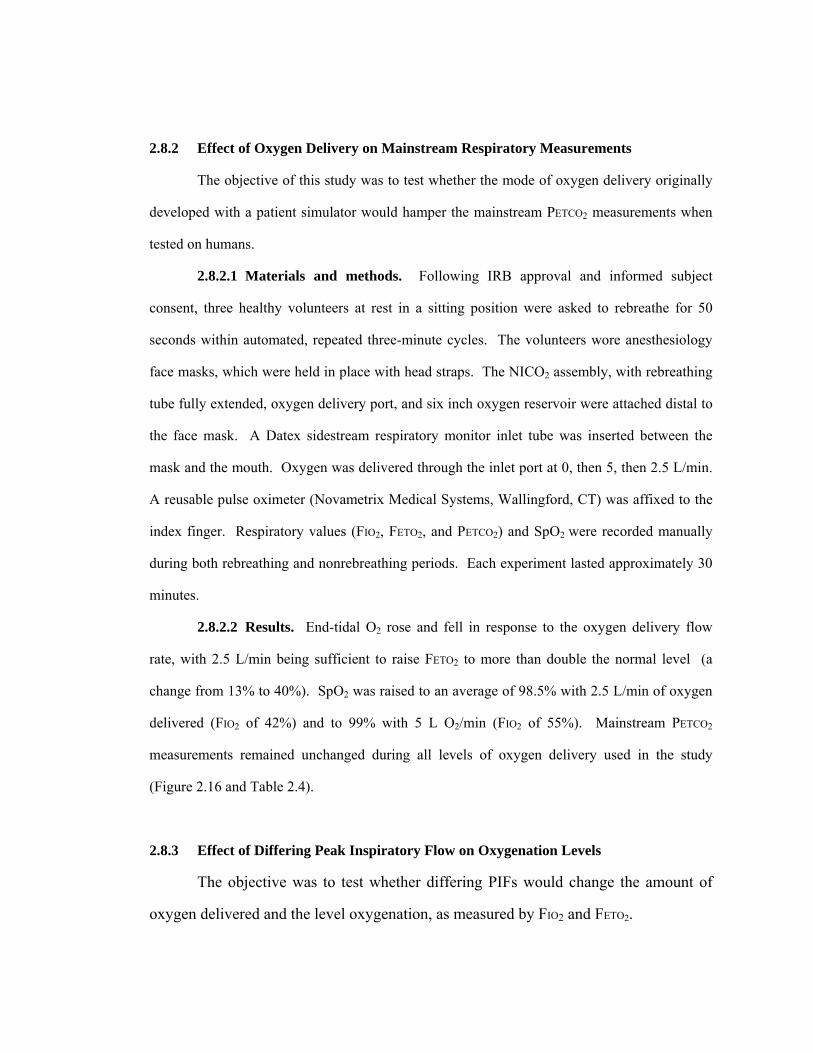
2.8.2 Effect of Oxygen Delivery on Mainstream Respiratory Measurements
The objective of this study was to test whether the mode of oxygen delivery originally
developed with a patient simulator would hamper the mainstream PETCO2 measurements when
tested on humans.
2.8.2.1 Materials and methods. Following IRB approval and informed subject
consent, three healthy volunteers at rest in a sitting position were asked to rebreathe for 50
seconds within automated, repeated three-minute cycles. The volunteers wore anesthesiology
face masks, which were held in place with head straps. The NICO2 assembly, with rebreathing
tube fully extended, oxygen delivery port, and six inch oxygen reservoir were attached distal to
the face mask. A Datex sidestream respiratory monitor inlet tube was inserted between the
mask and the mouth. Oxygen was delivered through the inlet port at 0, then 5, then 2.5 L/min.
A reusable pulse oximeter (Novametrix Medical Systems, Wallingford, CT) was affixed to the
index finger. Respiratory values (FIO2, FETO2, and PETCO2) and SpO2 were recorded manually
during both rebreathing and nonrebreathing periods. Each experiment lasted approximately 30
minutes.
2.8.2.2 Results. End-tidal O2 rose and fell in response to the oxygen delivery flow
rate, with 2.5 L/min being sufficient to raise FETO2 to more than double the normal level (a
change from 13% to 40%). SpO2 was raised to an average of 98.5% with 2.5 L/min of oxygen
delivered (FIO2 of 42%) and to 99% with 5 L O2/min (FIO2 of 55%). Mainstream PETCO2
measurements remained unchanged during all levels of oxygen delivery used in the study
(Figure 2.16 and Table 2.4).
2.8.3 Effect of Differing Peak Inspiratory Flow on Oxygenation Levels
The objective was to test whether differing PIFs would change the amount of
oxygen delivered and the level oxygenation, as measured by FIO2 and FETO2.

2.8.3.1 Materials and methods. Following IRB approval and informed subject
consent, one healthy volunteer at rest in a supine position was asked to breathe through the
NICO2 assembly and anesthesiology face mask. Distal to the NICO2 assembly was an oxygen
delivery port, where oxygen flow rates were set to 4, 7, and 10 L/min. No oxygen reservoir was
connected distal to the NICO2 assembly in this study. A Datex sidestream respiratory monitor
inlet tube was inserted between the mask and the mouth as described above. The volunteer
altered the peak inspiratory flow according to verbal instructions so that a full range of peak
inspiratory flows (PIFs) from 19 to 70 L/min was investigated.
2.8.3.2 Results. Oxygenation levels were increased for all oxygen delivery flow rates
tested when compared to room air. As expected, PIFs less than or equal to 30 L/min (the
normal level, when no verbal instructions were given) showed the best increases in
oxygenation, as measured by both FIO2 and FETO2. At an O2 flow rate of 4 L/min, a PIF of 20
L/min resulted in an FIO2 of 54% and an FETO2 of 34%; at 10 L/min, the same PIF resulted in an
FIO2 of 90% and an FETO2 of 61%. The results for all combinations of PIFs and O2 delivery
rates can be seen in Figure 2.17.
2.8.4 Effect of Differing O2 Flow Rates on Oxygenation Levels and Mainstream
Respiratory Monitoring in Human Subjects and with Rebreathing
The objective was to test whether this setup with various O2 flow rates and absence of
oxygen reservoir could concurrently increase FETO2 and allow for a useful mainstream PETCO2
signal for cardiac output determination in human subjects. This setup would be safer in the
event of oxygen delivery failure because it would minimize deadspace during the
nonrebreathing portion of the measurement. Respiratory rate was also monitored for possible
changes induced by the changes in gas concentrations.
2.8.4.1 Materials and methods. After IRB approval and informed subject consent,
one volunteer was asked to breathe through an anesthesiology face mask with head strap and
the NICO2 assembly, with the standard rebreathing loop fully extended (approximately 450 mL

deadspace). Distal to the NICO2 assembly was an oxygen delivery port, where oxygen gas flow
rates were set to 0, 4, 6, 8, 10, and then 0 L/min. Partial rebreathing was actuated by NICO for
30 seconds every three minutes.
2.8.4.2 Results. The results are shown in Figure 2.18. Mainstream end-tidal CO2
measurements and respiratory rate remained constant throughout the study, while FETO2
increased linearly from 16% to 52% with flow rates of 0, 4, 6, 8, and 10 L/min. Delivered
oxygen (FIO2) was also increased linearly, from 22% to 62%. This setup for oxygen delivery
without the extra reservoir was thereby verified to function satisfactorily for concurrent oxygen
delivery and mainstream PETCO2 measurements on human subjects and was selected for the
subsequent clinical patient studies.
2.8.5 Modified Oxygen Delivery Mask
The objective was to test for a better face seal and resultant respiratory measurements
than what was observed during the tests on the patient simulator. This would determine
whether simultaneous oxygen delivery and mainstream monitoring could be accomplished with
the oxygen delivery mask instead of the anesthesiology mask on humans. The oxygen delivery
mask would have the advantage of not requiring direct supervision during the measurements.
2.8.5.1 Materials and methods. A simple flow and CO2 sensor window was attached
to an oxygen delivery mask. The O2 delivery mask holes were lightly covered externally with a
plastic tab that sealed the holes during inspiration, but moved to allow airflow during
expiration. Distal to the sensor window, an oxygen inlet port was connected, where O2 was
dispensed at flow rates of 0 to 10 L/min in increments of 2 L/min. After IRB approval and
informed consent, one healthy volunteer was asked to breathe through the assembly for
approximately 30 minutes. A Datex sidestream monitor inlet tube was inserted between the
mask deadspace and the mouth for comparison measurements.
2.8.5.2 Results. Mainstream PETCO2 measurements of 40 mmHg during no oxygen
flow were reduced to 36 mmHg at high O2 flow rates of 8 and 10 L/min. The Datex monitor

registered a similar change in PETCO2 measurements (36 to 31 mmHg), signifying that the
changes observed were due to true changes rather than problems associated with simultaneous
O2 delivery and mainstream monitoring. Datex sidestream FETO2 measurements increased from
16% to 60% with oxygen gas flow rates of 0 to 10 L/min during the same period. The results
are shown in Figure 2.19. This performance was much better than the performance observed
with the human simulator, and was attributed to the better face seal obtained with real skin
instead of plastic. However, the reduction in PETCO2 was greater than with the anesthesiology
mask setup.
2.8.6 Discussion
A modified version of the best oxygen delivery system as tested on the simulator was
confirmed to perform the best for human subjects, as well. Section 2.8.4 describes the best
system for concurrent oxygen delivery and signal acquisition on humans. The oxygen delivery
mask worked well for oxygen delivery on people and moderately well for end-tidal CO2 signal
collection, but the anesthesiology mask and sensor combination was found to be best for
concurrent signal acquisition and oxygen delivery. The configuration with the safety feature of
oxygen delivery was selected for the human clinical studies, contingent upon good results from
the study described in Section 2.9.
2.9 Feasibility Tests: Measurement During O2 Delivery to Human Subjects
2.9.1 Introduction
Previous studies had shown that a large percent of rebreathing during a long period (50
seconds every three minutes) caused a greater change in PETCO2 and V.CO2 (thus producing the
best signal to noise ratio) than a small percent of rebreathing. Other studies had shown shorter
rebreathing periods to be sufficient for cardiac output calculation with a very large percent of
rebreathing. Still other tests had suggested that oxygen delivery provided additional safety

during measurements with a face mask while allowing for concurrent mainstream CO2
measurements. This study was performed to evaluate whether the individual findings held true
when they were combined during cardiac output monitoring. This study design was the pilot
study for the upcoming clinical trial, and as such, the rebreathing volume was set to three sizes
to simulate a clinician adjusting the deadspace according to the instructions on the monitor
screen for optimal measurements. Varying the deadspace during measurements on each person
would also verify that cardiac output estimates were not directly related to rebreathing volume.
The estimated cardiac output value, the pulmonary capillary blood flow estimates (PCBF), the
PETCO2, and the SpO2 were monitored in spontaneously breathing subjects.
2.9.2 Materials and Methods
After informed subject consent and IRB approval, four healthy volunteers were
requested to breathe through the anesthesiology face mask and NICO2 rebreathing assembly for
30 second rebreathing periods within repeated, three minute cycles, for approximately 35
minutes. Oxygen was delivered at 4 L/min through the oxygen delivery port and reservoir. The
rebreathing volume was set to three different levels, small, medium, and large. The small
volume was approximately 150 mL, the medium volume was approximately 300 mL, and the
largest volume was approximately 450 mL of rebreathing deadspace. A reusable pulse
oximeter was affixed to the index finger. During the thirty-minute tests, the SpO2, cardiac
output estimates, pulmonary capillary blood flow estimates, and mainstream PETCO2 levels were
monitored to observe whether they were altered by the various percentages of partial
rebreathing during spontaneous respiration.
The original algorithms (designed for mechanical and mixed ventilation) were used for
the calculation of cardiac output and PCBF. The rebreathing volume was set to three different
sizes (small, medium, and large).

2.9.3 Results
There were no observed differences in the SpO2, the cardiac output estimates, the
pulmonary capillary blood flow estimates, or mainstream PETCO2 measurements related to the
changing volume of rebreathing deadspace. The results for each of the subjects can be seen in
Figures 2.20-2.23.
2.9.4 Discussion
Since there were no observed differences in any of the monitored critical values
associated with altering the rebreathing volume during spontaneous respiration, it was decided
that the setup was ready for data collection in human clinical studies.
2.10 Discussion
The experiments described in this chapter suggested that the best patient interface
configuration for the subsequent clinical studies would be an anesthesiology face mask with
head strap, the NICO2 rebreathing assembly (with standard loop appropriately extended to
deliver a large percent of rebreathing), and an oxygen delivery port as a safety measure.
Considerations for this finding included patient comfort, NICO2 performance, patient safety,
and optimal signal acquisition. For clinical data collection, oxygen could be administered at
rates from 2-10 L/min without affecting the quality of the respiratory signal or the cardiac
output estimations. The oxygen reservoir was optional, since the oxygenation level achieved
without it was found to be acceptable.
Large percent rebreathing was loosely defined such that patients with large tidal
volumes (approximately 650-900 mL/breath) would require large rebreathing volumes (roughly
450 mL), and patients with small tidal volumes (400-600 mL/breath) would require small
rebreathing volumes (about 200 mL). That is, the goal was defined to be approximately 60%-
80% rebreathing to achieve a large enough change in respiratory signals for good C.O.

estimations. In the clinical study, patients would be monitored with 35 seconds of partial
rebreathing actuated within a three-minute, repeated measurement cycle.
The tests described were performed on simulators and healthy subjects, so the
performance of the system with this setup on sick ICU patients would have to be tested in the
clinical patient study. It remained to be seen in the clinical trials whether the device was easy
to set up and comfortable for sick subjects.

Figure 2.1. The measurement of physiologic deadspace in a single exhalation period. Physiologic deadspace is measured as the point on the exhaled volume axis at which the vertical line creates equal areas, “p” and “q”.
Exhaled Tidal Volume
Airway Deadspace
p
q
Exhaled Volume
A
FEC
O2

Figure 2.2. The anesthesiology face mask with inflation valve and hook ring chosen for clinical studies.
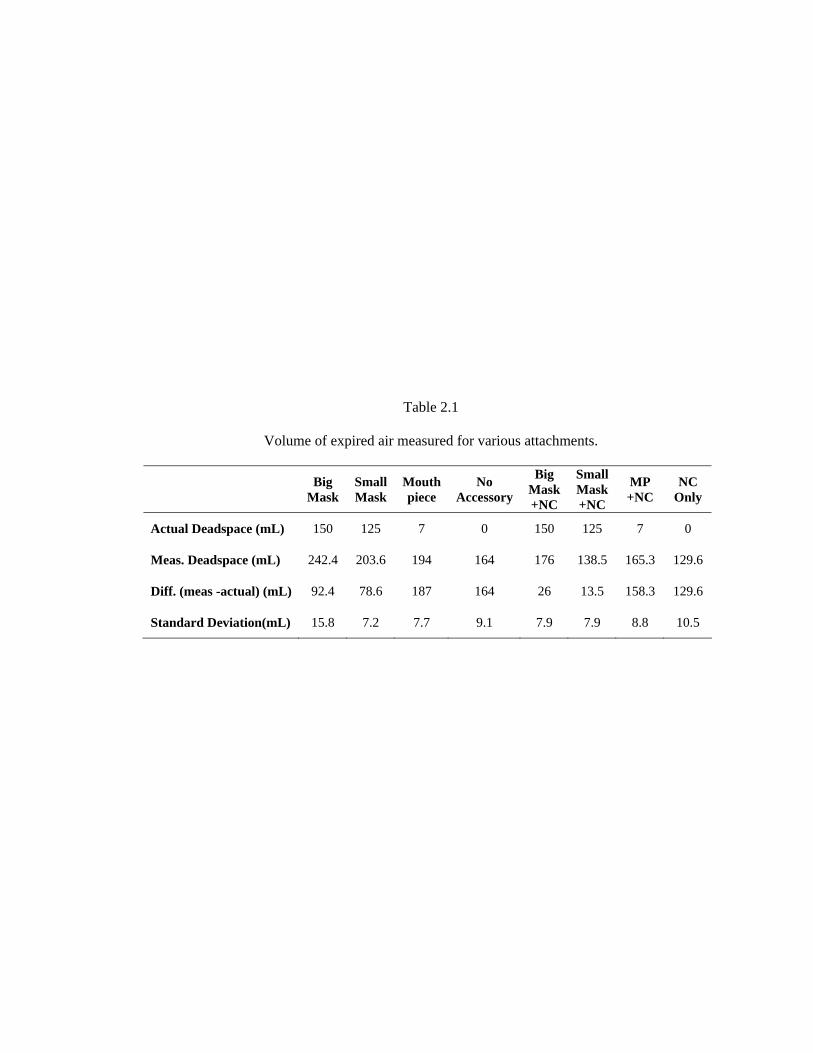
Table 2.1
Volume of expired air measured for various attachments.
Big Mask
Small Mask
Mouth piece
No Accessory
Big Mask +NC
Small Mask +NC
MP +NC
NC Only
Actual Deadspace (mL) 150 125 7 0 150 125 7 0
Meas. Deadspace (mL) 242.4 203.6 194 164 176 138.5 165.3 129.6
Diff. (meas -actual) (mL) 92.4 78.6 187 164 26 13.5 158.3 129.6
Standard Deviation(mL) 15.8 7.2 7.7 9.1 7.9 7.9 8.8 10.5

Table 2.2
Measurements of systolic and diastolic cuff blood pressure, noninvasive cardiac output,
and noninvasive blood oxygen saturation for four subjects in two
positions, standing and supine.
Subject Supine Systolic BP (mmHg)
Supine Diastolic BP (mmHg)
Supine C.O. (L/min)
Supine SpO2 (%)
Ave StDev Ave StDev Ave StDev Ave StDev 1 114.0 2.9 57.9 3.5 6.0 2.0 96.0 0 2 130.9 2.6 83.8 4.2 6.5 0.8 96.5 0.5 3 129.8 5.9 62.3 6.4 9.0 1.5 97.0 0 4 126.7 6.4 73.5 3.3 8.3 1.8 96.3 0.5
Subject Standing Syst. BP (mmHg)
Standing Diast. BP (mmHg)
Standing C.O. (L/min)
Standing SpO2 (%)
Ave StDev Ave StDev Ave StDev Ave StDev 1 116.1 9.5 65.4 3.5 9.3 1.4 96.0 0 2 129.9 1.6 80.0 1.9 6.9 0.2 95.9 0.4 3 132.5 5.7 76.5 6.6 9.5 2.6 96.5 0.5 4 133.6 7.9 78.2 9.4 8.7 1.2 96.2 0.4
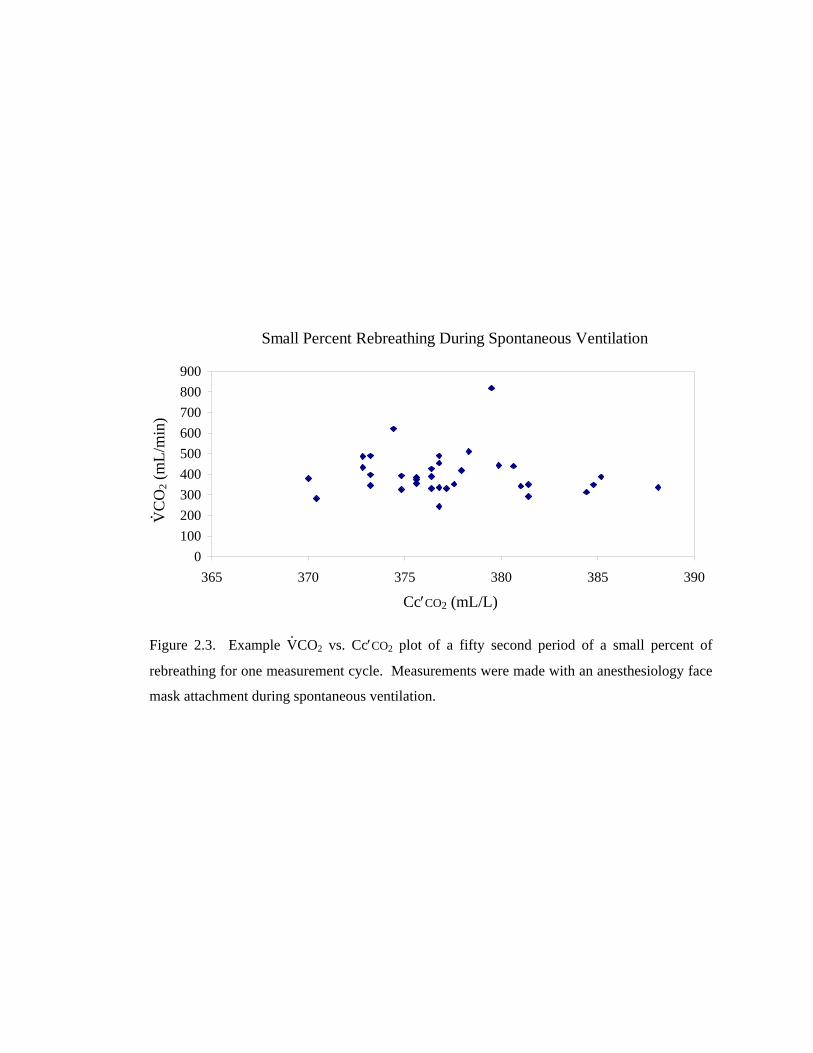
Figure 2.3. Example V.CO2 vs. Cc′CO2 plot of a fifty second period of a small percent of
rebreathing for one measurement cycle. Measurements were made with an anesthesiology face
mask attachment during spontaneous ventilation.
Small Percent Rebreathing During Spontaneous Ventilation
0100200300400500600700800900
365 370 375 380 385 390
cCO2 (mL/L)
VC
O2 (
mL/
min
)
Cc′CO2 (mL/L)
V. CO
2 (m
L/m
in)

Table 2.3
Results for seven subjects during large percent rebreathing,
as measured with noninvasive means.
Subject Systolic BP (mmHg)
Diastolic BP (mmHg)
Cardiac Output (L/min)
SpO2 (% saturation)
Ave StDev Ave StDev Ave StDev Ave StDev
1 132.8 7.8 77.2 5.1 7.9 1.3 96.9 0.6
2 101.6 6.3 68.6 3.2 7.4 0.4 96.9 0.4
3 115.9 6.7 72.6 4.5 10.9 0.5 96.8 0.4
4 100.6 2.9 73.4 2.2 8.4 0.6 96.2 0.4
5 124.8 3.3 72.0 3.0 10.8 0.7 96.4 0.5
6 116.6 6.9 71.4 4.5 9.4 0.3 96.4 0.5
7 111.4 5.5 64.4 3.0 5.4 0.7 96 0
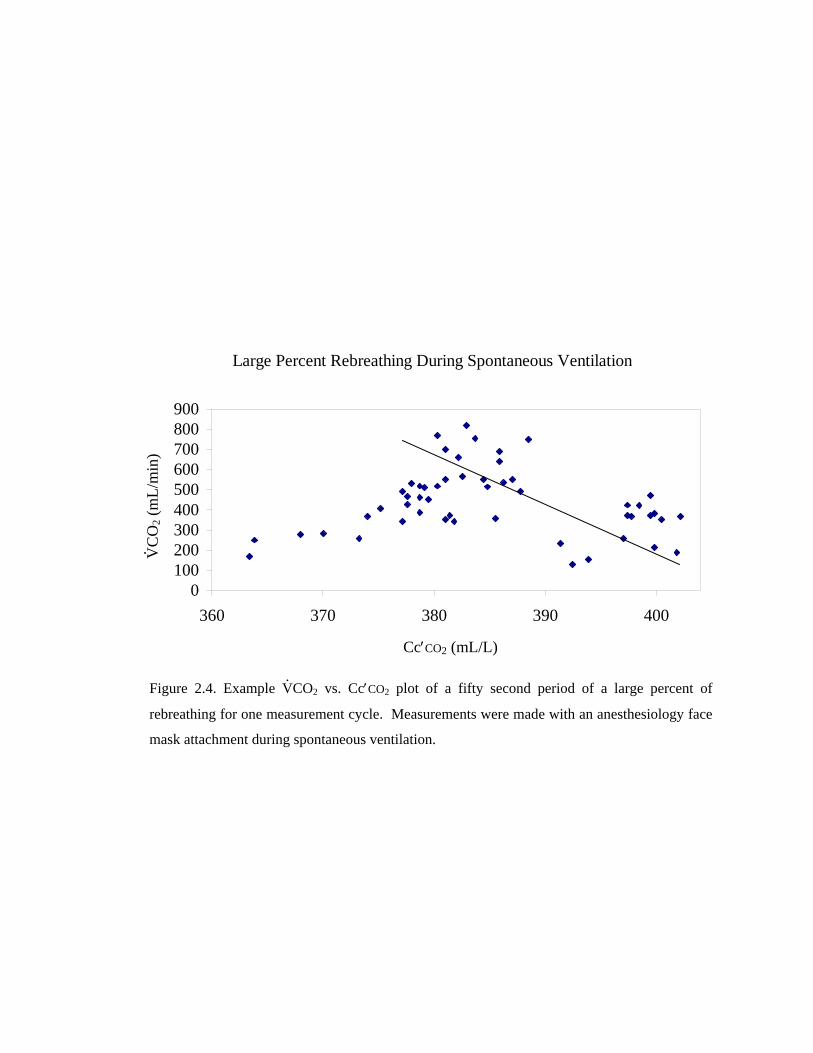
Figure 2.4. Example V.CO2 vs. Cc′CO2 plot of a fifty second period of a large percent of
rebreathing for one measurement cycle. Measurements were made with an anesthesiology face
mask attachment during spontaneous ventilation.
Large Percent Rebreathing During Spontaneous Ventilation
0100200300400500600700800900
360 370 380 390 400
cCO2 (mL/L)
VC
O2 (
mL/
min
)
Cc′CO2 (mL/L)
V. CO
2 (m
L/m
in)

Figure 2.5. Example of data collected during twenty-five seconds of total rebreathing. Note that the rebreathing period is easily distinguished from the baseline period and that a plateau is formed in the PETCO2 signal at the end of the rebreathing period.
25 Seconds of Total Rebreathing
0100200300400500600700800
2 37 72 107 142 176
Time (Seconds)
VC
O2 (
mL/
min
)
25
30
35
40
45
50
EtC
O2 (
mm
Hg)
VCO2
EtCO
Plateau
V. CO
2 (m
L/m
in)
PETC
O2 (
mm
Hg)
V.CO2
PETCO2

Figure 2.6. Example of data collected during fifteen seconds of total rebreathing. Note that the rebreathing period is more difficult to separate from the baseline period than it was in the longer period of rebreathing. Note that the plateau in the PETCO2 signal during rebreathing was not met before the rebreathing period was over.
15 Seconds of Total Rebreathing
0
200
400
600
800
2 37 72 107 142 176
Time (Seconds)
VC
O2
(mL/
min
)
25
30
35
40
45
50
EtC
O2
(mm
Hg)
VCO2EtCO2
V.CO2
PETCO2
PETC
O2 (
mm
Hg)
V. CO
2 (m
L/m
in)

Figure 2.7. The basic setup for oxygen delivery.
O2 delivery mask Connector
piece Sensor
O2 in through
small inlet 24 mm diameter oxygen reservoir, 6 inches long

Figure 2.8. Test on human patient simulator with O2 delivery mask with holes and oxygen reservoir.
O2 Delivery Mask with Holes and Reservoir on Simulator
0
10
20
30
40
50
0 1.5 2 3 4
O2 Flow (L/min)
CO
2 (m
mH
g)
0
100
200
300
400
Alv
eola
r O2
(mm
Hg)
etCO2Alv O2
PETCO2 Alv O2
CO
2 (m
mH
g)
Alv
eola
r O2 (
mm
Hg)

Figure 2.9. O2 delivery mask with reservoir and no holes on simulator.
O2 Delivery Mask with no Holes, Reservoir on Simulator
0
10
20
30
40
50
0 1.5 2 3 4
O2 Flow (L/min)
CO
2 (m
mH
g)
0
100
200
300
400
Alv
eola
r O2
(mm
Hg)
etCO2Alv O2
PETC
O2 (
mm
Hg)
Alv
eola
r O2 (
mm
Hg)
PETCO2 Alv O2

Figure 2.10. O2 delivery mask on simulator with holes completely covered.
O2 Delivery Mask with Reservoir on Simulator
0
10
20
30
40
50
0 1.5 2 3 4
O2 Flow (L/min)
CO
2 (m
mH
g)
050100150200250300350400
Alv
eola
r O2
(mm
Hg)
etCO2Alv O2PETCO2 Alv O2
PETC
O2 (
mm
Hg)
Alv
eola
r O2 (
mm
Hg)
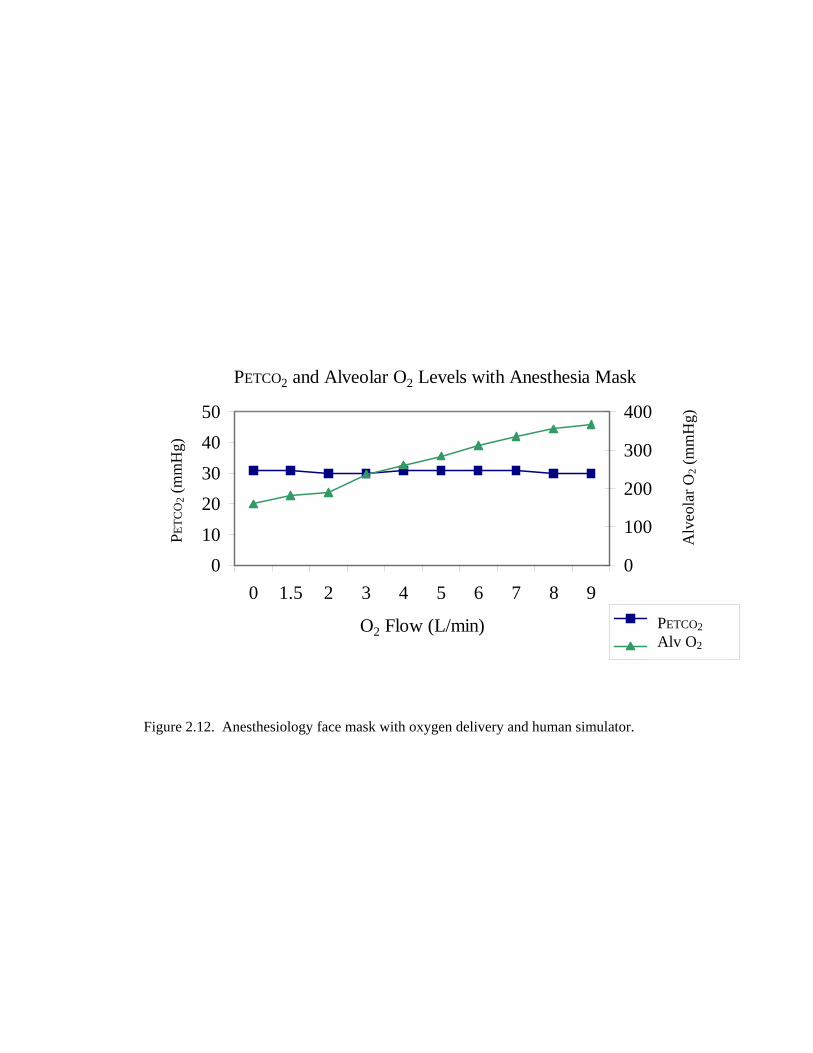
Figure 2.12. Anesthesiology face mask with oxygen delivery and human simulator.
PETCO2 and Alveolar O2 Levels with Anesthesia Mask
01020304050
0 1.5 2 3 4 5 6 7 8 9
O2 Flow (L/min)
CO
2 (m
mH
g)
0
100
200
300
400
Alv
eola
r O2
(mm
Hg)
etCO2Alveol. O2PETCO2 Alv O2
Alv
eola
r O2 (
mm
Hg)
PETC
O2 (
mm
Hg)

Figure 2.13. Combining the benefits of the anesthesiology and O2 delivery masks by adding holes to the anesthesiology mask.
NICO Sensor, O2 Delivery, and Human Simulator
01020304050
0 2 4 6 0
O2 Flow (L/min)
CO
2 (m
mH
g )
051015202530
nico co2datex co2eto2
PETC
O2 (
mm
Hg)
PETO
2 (m
mH
g)
NICO PETCO2
Datex PETCO2
PETO2

Figure 2.14. Replacing the setup from 2.7.3 with a Capnostat CO2 sensor window.
Capnostat, O2 Delivery, Human Simulator
01020304050
0 2 4 6 0
O2 Flow (L/min)
CO
2 (m
mH
g )
051015202530
nico co2datex co2eto2
NICO PETCO2
Datex PETCO2
PETO2
PETC
O2 (
mm
Hg)
PETO
2 (m
mH
g)
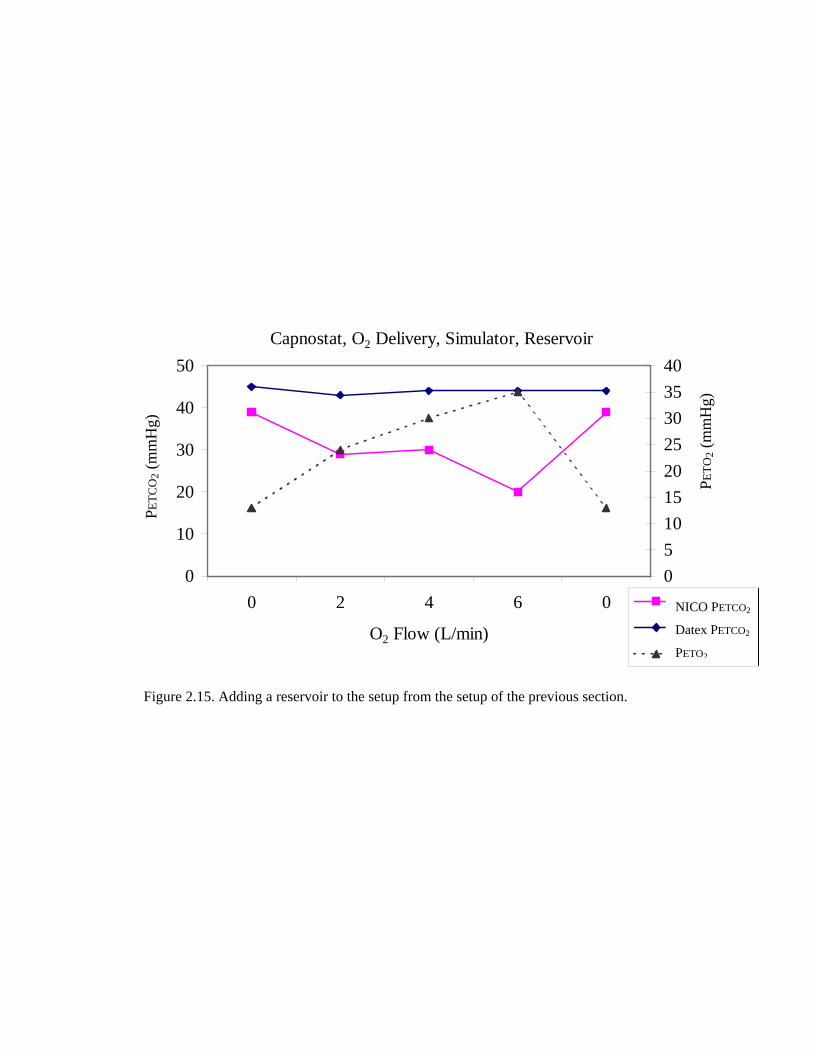
Figure 2.15. Adding a reservoir to the setup from the setup of the previous section.
Capnostat, O2 Delivery, Simulator, Reservoir
0
10
20
30
40
50
0 2 4 6 0
O2 Flow (L/min)
CO
2 (m
mH
g )
0510152025303540
nico co2datex co2eto2
NICO PETCO2
Datex PETCO2
PETO2
PETC
O2 (
mm
Hg)
PETO
2 (m
mH
g)

Figure 2.11. Optimal setup for oxygen delivery on patient simulator.
24 mm diameter oxygen reservoir, 6 inches long
O2 in through small inlet
Sensor
Connector piece
Anesthesiology mask
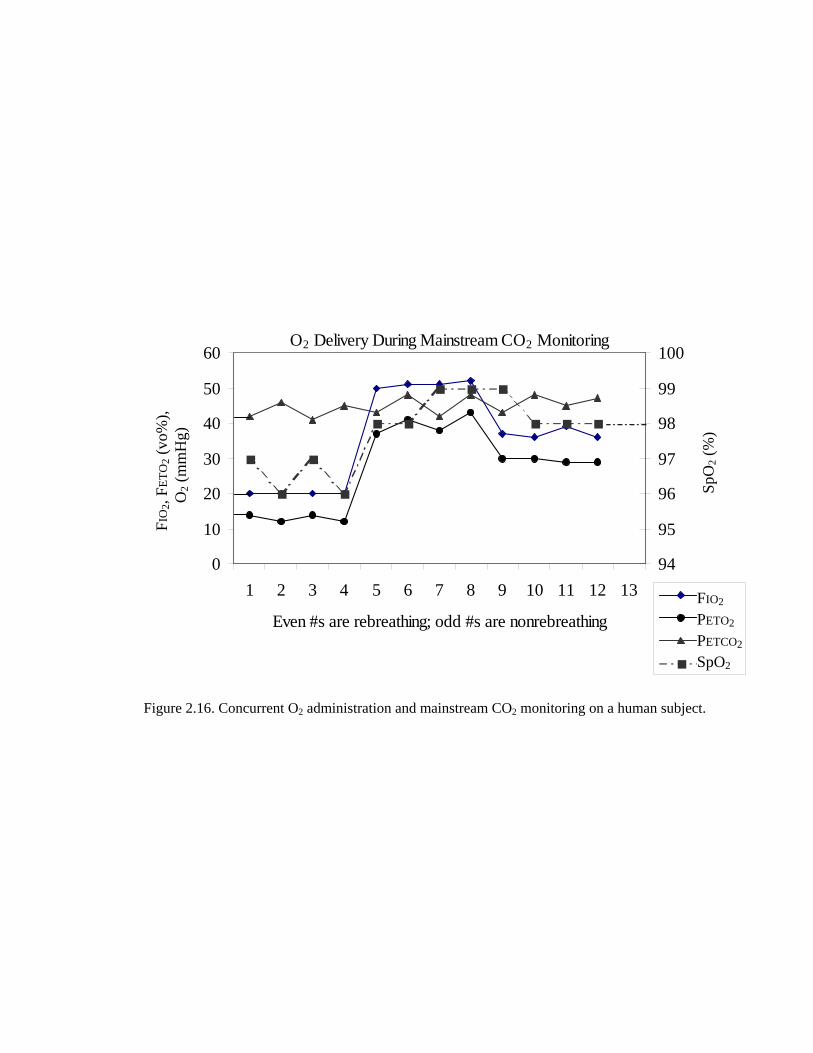
Figure 2.16. Concurrent O2 administration and mainstream CO2 monitoring on a human subject.
O2 Delivery During Mainstream CO2 Monitoring
0
10
20
30
40
50
60
1 2 3 4 5 6 7 8 9 10 11 12 13
Even #s are rebreathing; odd #s are nonrebreathing
FiO
2, F
etO
2 (v
ol %
)O
2 (m
mH
g)
94
95
96
97
98
99
100
SpO
2 (%
)
FiO2etO2etCO2SpO2
FIO2 PETO2 PETCO2
SpO2
FIO
2, FE
TO2 (
vo%
),
O
2 (m
mH
g)
SpO
2 (%
)
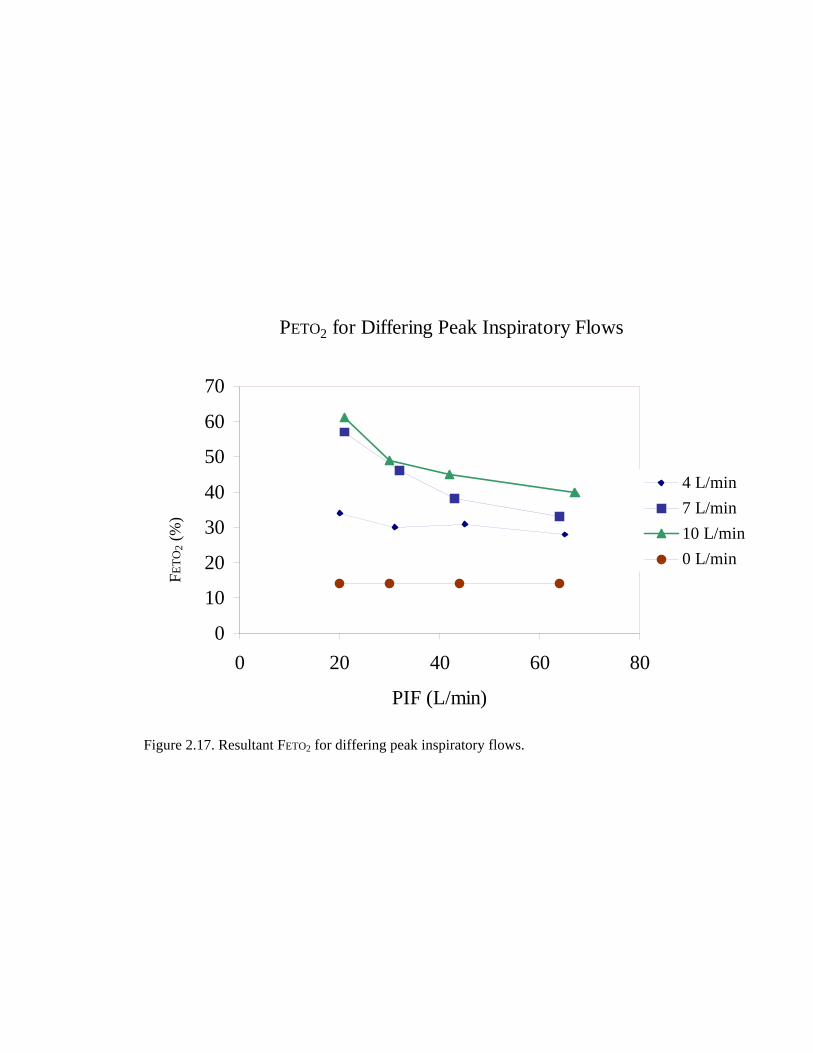
Figure 2.17. Resultant FETO2 for differing peak inspiratory flows.
PETO2 for Differing Peak Inspiratory Flows
0
10
20
30
40
50
60
70
0 20 40 60 80
PIF (L/min)
end
tidal
O2
(%)
4 L/min7 L/min10 L/min0 L/min
FETO
2 (%
)

Figure 2.18. Response in PETCO2, FETO2, and RR to differing O2 administration flow rates.
Response to Differing O2 Flow Rates
05
1015202530354045
0 2 4 6 8 10 12
O2 Flow (L/min)
Max
. etC
O2
(mm
Hg)
0
10
20
30
40
50
60
70
Fi O
2 an
d Et
O2
(%)
max etCO2RRetO2FiO2
PETCO2 RR FETO2 FIO2
Max
PET
CO
2 (m
mH
g)
FIO
2 and
FET
O2 (
%)
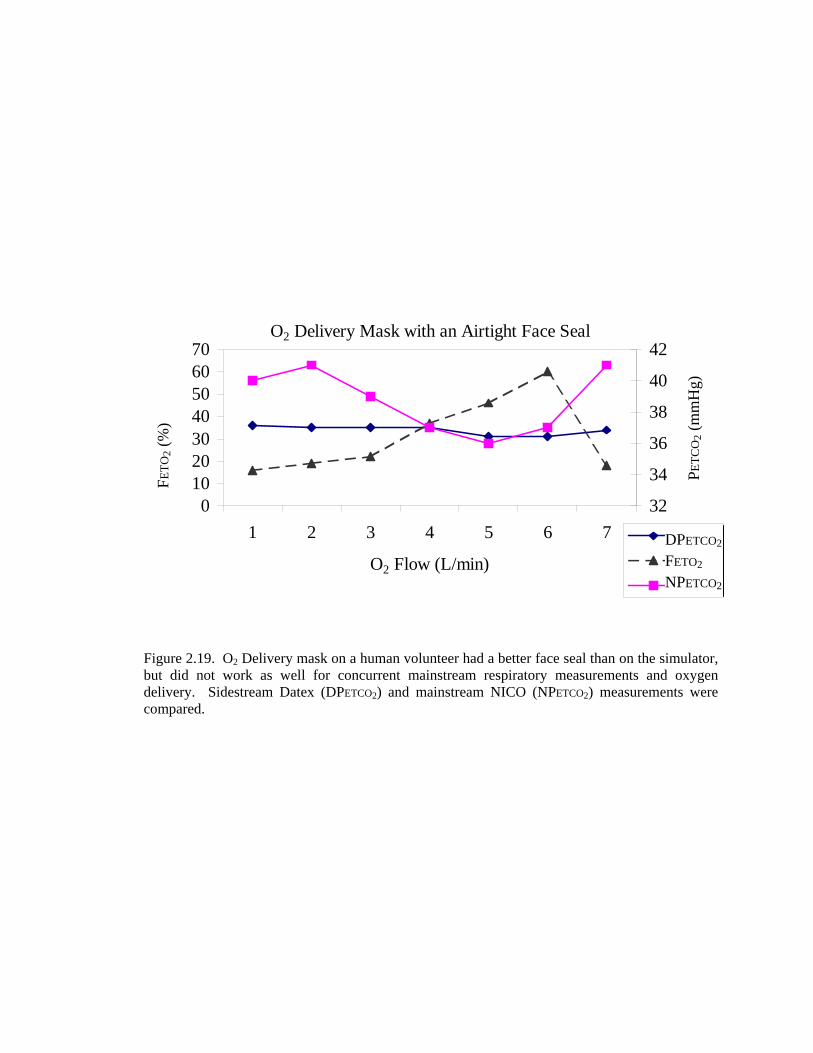
Figure 2.19. O2 Delivery mask on a human volunteer had a better face seal than on the simulator, but did not work as well for concurrent mainstream respiratory measurements and oxygen delivery. Sidestream Datex (DPETCO2) and mainstream NICO (NPETCO2) measurements were compared.
O2 Delivery Mask with an Airtight Face Seal
010203040506070
1 2 3 4 5 6 7
O2 Flow (L/min)
etO
2 or
FiO
2 (%
)
32
34
36
38
40
42
CO
2 (m
mH
g)
datexetO2nico
DPETCO2 FETO2 NPETCO2
FETO
2 (%
)
PETC
O2 (
mm
Hg)

Figure 2.20. Response of SpO2, PETCO2, C.O., and PCBF during monitoring of first volunteer with rebreathing volumes of various sizes.
Volunteer 1
35455565758595
1 2 3 4 5 6 7 8 9
Cycle #
SpO
2 (%
) and
etC
O2
(mm
Hg)
024681012141618
1 2 3 4 5 6 7 8 9
CO
and
PC
BF
(L/m
in)
SpO2etCO2COPCBF
150 mL 300 mL 450 mL
SpO2 PETCO2
C.O. PCBF
SpO
2 (%
) and
PET
CO
2 (m
mH
g)
C.O
. and
PC
BF
(L/m
in)

Figure 2.21. Response of SpO2, PETCO2, C.O., and PCBF during monitoring of second volunteer with rebreathing volumes of various sizes.
Volunteer 2
35455565758595
1 2 3 4 5 6 7 8 9 10 11
Cycle #
SpO
2 (%
) and
etC
O2
(mm
Hg)
0
5
10
15
201 2 3 4 5 6 7 8 9 10 11
CO
and
PC
BF
(L/m
in)
SpO2etCO2COPCBF
SpO2 PETCO2
C.O. PCBF
SpO
2 (%
) and
PET
CO
2 (m
mH
g)
C.O
. and
PC
BF
(L/m
in)
150 mL 300 mL 450 mL

Figure 2.22. Response of SpO2, PETCO2, C.O., and PCBF during monitoring of third volunteer with rebreathing volumes of various sizes.
Volunteer 3
35455565758595
1 2 3 4 5 6 7 8 9 10 11 12
Cycle #
SpO
2 (%
) and
etC
O2
(mm
Hg)
0
5
10
15
20
251 2 3 4 5 6 7 8 9 10 11 12
CO
and
PC
BF
(L/m
in)
SpO2etCO2COPCBF
SpO2 PETCO2
C.O. PCBF
SpO
2 (%
) and
PET
CO
2 (m
mH
g)
C.O
. and
PC
BF
(L/m
in)
150 mL 300 mL 450 mL

Figure 2.23. Response of SpO2, PETCO2, C.O., and PCBF during monitoring of fourth volunteer with rebreathing volumes of various sizes.
Volunteer 4
35
45
55
65
75
85
95
1 2 3 4 5 6 7 8 9 10 11 12
Cycle #
SpO
2 (%
) and
etC
O2
(mm
Hg)
024681012141618
1 2 3 4 5 6 7 8 9 10 11 12
CO
and
PC
BF
(L/m
in)
SpO2etCO2COPCBF
C.O
. and
PC
BF
(L/m
in)
SpO
2 (%
) and
PET
CO
2 (m
mH
g)
SpO2 PETCO2
C.O. PCBF
150 mL 300 mL 450 mL

Table 2.4
Subject oxygenation and mainstream end-tidal CO2 measurements
in response to oxygen delivery at various flow rates.
0.0 Liters/minute O22.5 Liters/minute
O2 5 Liters/minute
O2 Rebr. Non-rebr. Rebr. Non-rebr. Rebr. Non-rebr.
Average SpO2 (%) 96 97.4 98 98.3 98.8 98.8
Standard Dev. SpO2 (%) 0 0.23 0 0.25 0.25 0.25
Ave. Mainstream PETCO2 (mmHg) 45.5 40.4 46.5 41.7 46.3 40.7
Standard Dev. PETCO2(mmHg) 0.25 0.82 0.63 1.1 1.1 1.2
Average FiO2(%) 20.1 20 39.7 43.7 51.2 54.8
Standard Dev. FiO2(%) 0.5 0 2.1 3.3 2.1 2.9
Average FETO2(%) 12.5 14 29.7 29.2 38 37.7
Standard Dev. FETO2(%) 0.5 0 0.4 0.4 2.2 1.5

CHAPTER 3
EVALUATION OF THE MODIFIED NICO2 CARDIAC OUTPUT
MEASUREMENTS IN NONINTUBATED PATIENTS
3.1 Introduction
This chapter describes a performance evaluation of the partial rebreathing system
described in chapter two when used on clinical patients. This study was the first to compare the
modified system with a reference method (conventional thermodilution cardiac output) in
recently extubated, spontaneously breathing patients. Because the system had not previously
been studied with spontaneously breathing subjects, a second objective of this study was to
identify challenges associated with monitoring cardiac output in this patient population. Third,
input was sought from the clinicians regarding the usefulness of and clinical need for a
noninvasive cardiac output monitor that could be used to assess the cardiac health of patients
who were spontaneously breathing.
3.2 Materials and Methods
Following IRB approval, each of 28 intensive care patients was monitored in the ICU
post cardiac surgery for up to sixty minutes with the modified mask-based version of the
noninvasive partial rebreathing cardiac output monitor (NICO2, Novametrix Medical Systems,
Wallingford, CT). Patients were included in the study if they had a pulmonary artery catheter
in place and they had been extubated. Patients with severe pulmonary disease were not
monitored.
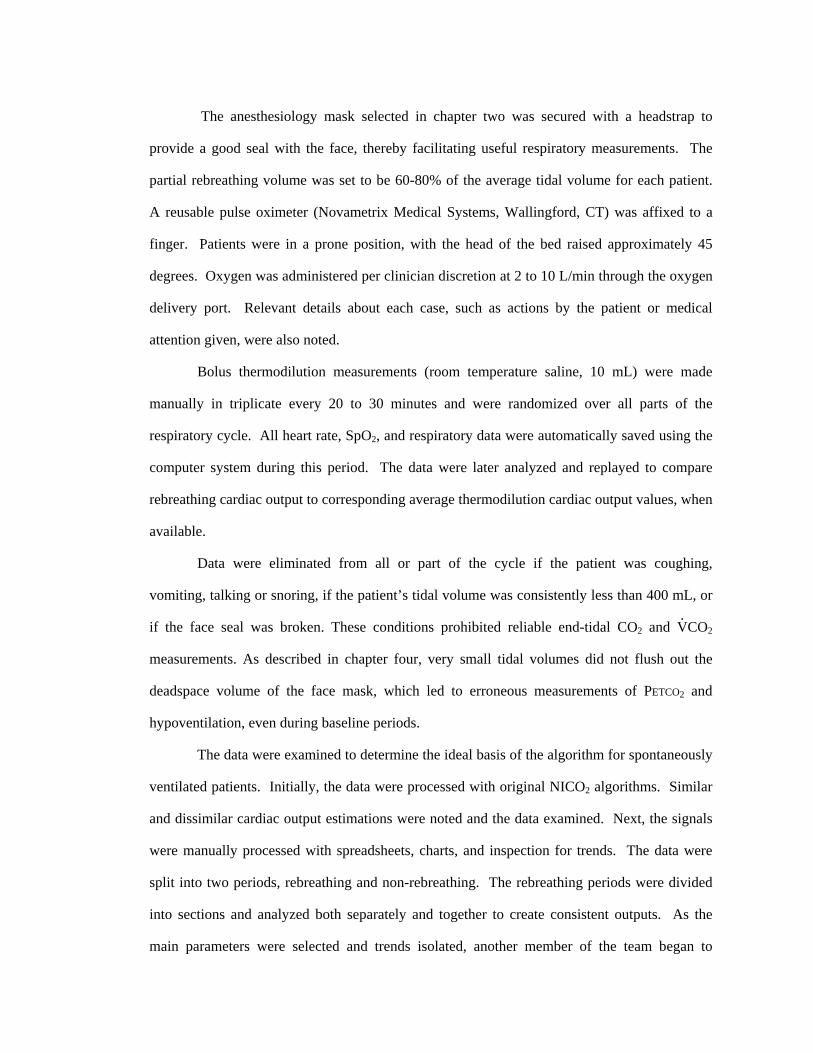
The anesthesiology mask selected in chapter two was secured with a headstrap to
provide a good seal with the face, thereby facilitating useful respiratory measurements. The
partial rebreathing volume was set to be 60-80% of the average tidal volume for each patient.
A reusable pulse oximeter (Novametrix Medical Systems, Wallingford, CT) was affixed to a
finger. Patients were in a prone position, with the head of the bed raised approximately 45
degrees. Oxygen was administered per clinician discretion at 2 to 10 L/min through the oxygen
delivery port. Relevant details about each case, such as actions by the patient or medical
attention given, were also noted.
Bolus thermodilution measurements (room temperature saline, 10 mL) were made
manually in triplicate every 20 to 30 minutes and were randomized over all parts of the
respiratory cycle. All heart rate, SpO2, and respiratory data were automatically saved using the
computer system during this period. The data were later analyzed and replayed to compare
rebreathing cardiac output to corresponding average thermodilution cardiac output values, when
available.
Data were eliminated from all or part of the cycle if the patient was coughing,
vomiting, talking or snoring, if the patient’s tidal volume was consistently less than 400 mL, or
if the face seal was broken. These conditions prohibited reliable end-tidal CO2 and V.CO2
measurements. As described in chapter four, very small tidal volumes did not flush out the
deadspace volume of the face mask, which led to erroneous measurements of PETCO2 and
hypoventilation, even during baseline periods.
The data were examined to determine the ideal basis of the algorithm for spontaneously
ventilated patients. Initially, the data were processed with original NICO2 algorithms. Similar
and dissimilar cardiac output estimations were noted and the data examined. Next, the signals
were manually processed with spreadsheets, charts, and inspection for trends. The data were
split into two periods, rebreathing and non-rebreathing. The rebreathing periods were divided
into sections and analyzed both separately and together to create consistent outputs. As the
main parameters were selected and trends isolated, another member of the team began to

automate the manual data processing techniques. A more detailed description of the data
analysis methods created in response to the information gleaned from the clinical study can be
found in chapter four. To the extent possible, comparison results reported here were processed
with the modified NICO2 algorithms as described in the following chapter.
3.3 Results
Patients generally reported being comfortable during monitoring. However, one patient
did begin to hyperventilate when the mask with the large deadspace was in place. This file was
eliminated from analysis.
The face mask seal performed satisfactorily in all patients monitored. Oxygenation was
maintained at an acceptable level during the monitoring phase for each patient, as determined
by the clinician present during the study. Clinicians uniformly commented that the prototype
device looked too large and bulky for routine clinical use.
Linear correlation of the paired cardiac output measurements (n=59) showed a
correlation coefficient of 0.408 and a slope of 0.875 (Figure 3.1).
Bland-Altman tests on the paired cardiac output measurements (n=59) from twenty-
seven patients (Figure 3.2) (mean TD = 5.21 L/min) revealed a standard deviation of the
difference (rebreathing-thermodilution) of 1.21 L/min (±46%), limits of agreement of -2.76 and
2.08, and a bias of -0.34 L/min.
3.4 Discussion
This study revealed that some of the anticipated challenges of monitoring
spontaneously ventilated patients were met successfully, while others were only partially met.
Numerous areas for improvement and future modifications were also identified during the
clinical study, and those areas provided the foundation of the work to improve the rebreathing
method for future clinical trials.

The patient population in this study was found to be a difficult one. Some subjects had
been extubated within one hour of being monitored; for these patients stable breathing was
difficult. Some of the breaths were smaller than about 400 mL, which was found to be too
small to get a good signal with the face mask. Further studies were planned to ascertain the
reason for the signal deterioration and the smallest tidal volume acceptable for monitoring.
Because of the tendency for very recently extubated, post-surgery patients to ventilate with
quite small breaths, it was determined that it would have been preferable to wait two to three
more hours after extubation to begin monitoring for this preliminary study. The mask worked
well for PETCO2 readings in cases with a tidal volume greater than 400 mL. This observation
was further addressed, as described in the following chapter.
The oxygen delivery system described in chapter two worked well for these sick
patients; oxygen saturation was maintained at safe levels, even during rebreathing periods, for
each of the patients studied. In most cases, this was accomplished with oxygen flow rates
between 2 and 4 liters/min.
The thirty-five second rebreathing period was long enough to initiate a meaningful
change in the CO2 and V.CO2 signals in many cases. Insufficient signal clarity was often caused
by other factors, such as sporadic respiration, and interfered with the readings at baseline or
rebreathing levels. It was observed that in many cases where signal clarity was diminished, the
preceding or following cycle would often estimate a value close to the thermodilution value.
Because the algorithm and rebreathing method used in this study were largely
developed for mechanically ventilated patients, the preliminary performance of the modified
rebreathing system was viewed as somewhat favorable, although not yet ready for clinical use.
One should keep in mind the proper perspective on the performance of this first attempt to
noninvasively monitor spontaneously ventilated patients. Even when two similar methods,
continuous cardiac output (CCO) and thermodilution (TDCO), share the same catheter and
therefore the same placement and mixing conditions, the standard deviation is approximately
0.8 L/min72. It should also be remembered that typical thermodilution measurements73,74,75 are

only accurate within ±10 to 20%. Therefore, precision of 1.21 L/min (±46%) in the first trial
indicates that the method warrants further development.
During this study, several potential software and hardware improvements were
identified which should lead to a noninvasive cardiac output monitor for spontaneously
breathing patients with improved bias and precision performance. Substantial algorithm
development and data filtering were found to be necessary since some cycles during
spontaneous ventilation were still too irregular for cardiac output determination. Many small
breaths were detected during the data collection from ICU patients; the artifact rejection filter
would likely eliminate these breaths in future algorithm developments. Hardware and software
that would perform well in the presence of small tidal volumes and irregular breathing patterns
would be a useful modification for the ICU setting.
As mentioned earlier, some of the challenges encountered were due to the timing of the
study period for some subjects. For the purpose of device refinement, future studies with the
rebreathing monitor will no longer target use immediately following extubation, but rather two
to three hours after extubation and beyond. The first two hours following extubation denote a
period when respiration is too irregular for initial data collection and algorithm development.
There is a clinical need for a monitor that can be used throughout the course of medical
treament, so the goal would be to refine the monitor first on typical data from spontaneous
breaths, and later on unstable respiration. A possible solution for periods of unstable breathing
or clinical need that would not require continuous monitoring for many hours would be a spot
check monitor. Such a monitor could conceivably be used to monitor the patient for ten
minutes and then produce a measurement. Short setup times for this device would make a spot
check mode of operation practical.
Some patients were uncomfortable after 20 to 30 minutes of data collection, so it would
be desirable if the measurement period required for meaningful estimations could be shortened.
It is hoped that the rebreathing maneuver can be made less intrusive to patient comfort and
ventilation. Efforts for the future development aimed at this goal are detailed in chapter four.
Figure 3.1. Linear regression of partial rebreathing cardiac output (NICO2) and Thermodilution (TD) for twenty-seven recently extubated post cardiac surgery patients. Correlation coefficient = 0.41, slope = 0.875.
Cardiac Output Measurements for Twenty-seven ICU Patients
y = 0.8753x + 0.3093R2 = 0.4084
0
1
2
3
4
5
6
7
8
9
10
0 1 2 3 4 5 6 7 8 9 10
Thermodilution CO (L/min)
Reb
reat
hing
CO
(L/m
in)
Reb
reat
hing
C.O
. (L
/min
)
Thermodilution C.O. (L/min)

Figure 3.2. Bland-Altman comparison for partial rebreathing cardiac output (NICO2) and Thermodilution (TD) for twenty-seven recently extubated post cardiac surgery patients. Results for the paired measurements (n=59) from twenty-seven patts (mean TD = 5.21 L/min) revealed a standard deviation of 1.21 L/min (±46%), limits of agreement of -2.76 and 2.08, and a bias of -0.34 L/min.
Bland-Altman Comparison of Cardiac Output Measurements
-4
-3
-2
-1
0
1
2
3
4
0 2 4 6 8 10Average of NICO2 and TD [ L/min ]
(NIC
O2-
TD
co)
[ L/m
in ]
Mean + 2 SD
Mean - 2 SD
Mean

CHAPTER 4
ISSUES IDENTIFIED BY THE CLINICAL STUDY
4.1 Redesign of the Patient Interface
The clinical studies revealed that the patient interface selected for spontaneously
breathing subjects was incompatible with the small tidal volumes typical of some sick patients.
Because the target setting of the cardiac output monitor for spontaneously ventilated patients
includes the ICU environment, the patient interface needed to be re-designed to accommodate
tidal volumes of all sizes. This section describes the confirmation of and hardware solution for
the problem of tidal volumes smaller than 400 mL.
4.1.1 Single Breath CO2 Measurements
4.1.1.1 Introduction. When a large deadspace volume is placed between the patient
and the capnometer, a small tidal volume will cause the PETCO2 measurements to appear smaller
than they should. The reduced reliability of the measurements means that the monitor functions
more like an apnea monitor, since the gas measurements are incorrect. This is because the first
part of the expired breath mixes with the air in the deadspace, thereby diluting the concentration
of the gas being measured. The choice of the face mask for the clinical study described in
chapter three was based on good performance in healthy volunteers and the assumption that the
150 mL deadspace would be flushed out during expiration and allow a reliable respiratory
signal, even with small tidal volumes. It became evident during the clinical study that tidal
volumes smaller than 400 mL were not sufficient to provide dependable respiratory signals.

This study was designed to determine the reasons for this observation and to identify the point
at which respiratory measurements from a large face mask were reliable.
4.1.1.2 Materials and methods. A disposable medium adult anesthesiology face
mask with inflation valve and hook rings and approximately 150 mL of deadspace volume
(Smiths Industries, Fort Myers, FL) and a mouthpiece with approximately 7 mL of deadspace,
were each used to monitor the end-tidal CO2 of spontaneously breathing human volunteers.
The mouthpiece was used in conjunction with a nose clip. All respiratory measurements were
made with a NICO2 monitor (Novametrix Medical Systems, Wallingford, CT). The FECO2 vs.
volume plots were examined for each set of breaths with each attachment. The volume of
expired air required for a true PETCO2 measurement with each attachment was recorded.
4.1.1.3 Results. For the face mask with 150 mL of deadspace, approximately 500 mL
of expired air were required to flush out enough dead space to obtain a reliable end-tidal CO2
measurement (Figure 4.1). This is indicated as the point in the FECO2 vs. volume plot where the
curve begins to flatten out and plateau at a high level. The slope of the plateau is called the
phase 3 slope. Approximately 270 mL of expired air were required to obtain a reliable
measurement from the mouthpiece (Figure 4.2). A comparison of the phase 3 slopes for a face
mask and for a mouthpiece can be seen in Figure 4.3.
4.1.1.4 Discussion. Results from this study verified the necessity to eliminate breaths
smaller than 400 mL for analysis of the clinical data. In fact, it would have been justified to
remove breaths as large as 500 mL for the analysis. The deadspace within the mask of 150 mL
mixed with the expired breath via turbulent flow; therefore an expired volume two to three
times as large as the deadspace was required to flush out the air from the previous breath and
record a reliable measurement. This indicated that the face mask selected for the clinical study
was not appropriate for the small tidal volumes of some sick patients. The mouthpiece did not
add significant deadspace during nonrebreathing periods and allowed reliable PETCO2
measurements for breaths as small as 300 mL. Efforts to design a modified mask with a small
deadspace that combines the benefits of a mouthpiece and a standard mask are described in
Section 4.1.2.
4.1.2 Minimized Deadspace Volume Mask
4.1.2.1 Introduction. The mouthpiece has a very small deadspace volume of 7 mL,
which provides reliable and consistent respiratory data, but is difficult to wear for extended
periods. Proper use of the mouthpiece requires concurrent use of a nose clip to prevent expired
air from escaping without being measured by the gas monitor. Patient discomfort, mainly
related to the inability to swallow and the effort required to hold the mouthpiece in place, is the
most important disadvantage of the attachment.
In contrast to the mouthpiece, a standard face mask is comfortable and can maintain a
good seal with the face even without patient interaction. Swallowing is comfortable, and
expired air can be measured if it exits through the mouth or the nose. The main disadvantage of
the commercially available face masks is that those which provide a good seal with the face
have a very large deadspace volume. It was observed (Section 4.1.1) that small tidal volumes
prohibit meaningful respiratory measurements when a face mask with a large deadspace volume
is chosen as the patient interface. This section describes the development of a comfortable
mask with a small deadspace volume that would allow respiratory measurements equivalent to
those obtained from a mouthpiece. The performance of the modified mask was determined by
comparing the CO2 vs. volume curves of single breaths with the same curves for a mouthpiece.
4.1.2.2 Materials and methods. A disposable medium adult anesthesiology face
mask with inflation valve and hook rings and approximately 150 mL of deadspace volume
(Smiths Industries, Fort Myers, FL) was modified to minimize the deadspace around the
patient’s face. This was done by filling the deadspace with tape and foam padding, such that
approximately 15 mL of deadspace remained. A mouthpiece with approximately 7 mL of
deadspace was also tested in conjunction with a nose clip. Each of the attachments was used to

monitor the end-tidal CO2 of spontaneously breathing human volunteers. All respiratory
measurements were made with a NICO2 monitor (Novametrix Medical Systems, Wallingford,
CT). The CO2 vs. volume plots and the phase 3 slopes were examined for each set of breaths
with each attachment. The volume of expired air required for a true PETCO2 measurement with
each attachment was recorded.
4.1.2.3 Results. There was no significant difference between the improved mask and
the mouthpiece in the PETCO2 measurements recorded, and the FECO2 vs. volume curves for both
attachments displayed a steep phase 3 slope and a plateau (onset of phase 3 slope) within 280
mL of expired tidal volume. See Figure 4.4 for the FECO2 vs. volume curve from a modified
mask. A graph showing equivalent performance of the mouthpiece and the modified mask as
demonstrated by the phase 3 slopes can be seen in Figure 4.5.
4.1.2.4 Discussion. The modified mask performed as well as the mouthpiece for
producing reliable PETCO2 measurements at small tidal volumes. Thus, future experiments for
spontaneously breathing patients were planned with the modified mask in place of the original
mask.
4.2 Further Algorithm Development
4.2.1 Introduction
The comparison studies in the clinical setting revealed a number of areas for
improvement of the cardiac output estimation algorithm. 35% of the cycles remained too
irregular for proper analysis, and some study participants commented it would have been
preferable to have shorter data collection periods. As the signal processing program was
initially written, there was no indication of time within each cycle, and there was no relation of
the data points to each other. Periods of rebreathing were not distinguished from periods of
nonrebreathing. The number of points evaluated within each period was set, and it was
impossible to weight some points more heavily than others.

Several methods of data processing and analysis were developed to detect the important
information within the irregular cycles. The most important of these processes are outlined in
this section. They include identifying and eliminating useless information, changing the
algorithm to weight the most important data the most heavily, data filtering, and developing
methods of calculation that were not corrupted by extraneous points. Specific parts of the
recorded data were analyzed independently and together in many combinations to develop
algorithms for calculation and data rejection. A new, abbreviated method for measurement,
which was based on the important components of these observations, was developed for future
studies.
4.2.2 Identifying Important Signal Components
4.2.2.1 Introduction. The irregular nature of the respiratory signals acquired during
spontaneous ventilation necessitated more robust data processing capabilities for reliable
cardiac output estimations than the signals generated during mechanical ventilation did. This
section details the work to understand why the signal was irregular and to develop an
understanding of how the data were affected by the rebreathing and nonrebreathing periods.
4.2.2.2 Materials and methods. Respiratory data on file from the previous patient,
animal, and volunteer studies were analyzed. In order to determine why the signal was
irregular and to develop an understanding of how the data were related to the rebreathing
period, the data were presented in a way that expressed the relationship among the various
points and time. The relationship among the points and events was later used to select the most
important data for consistent measurements. Since the most important data for the conventional
method of rebreathing cardiac output was the data during the plateaus in the signals, plateaus
were also sought. The data before, during, and after rebreathing were analyzed both together
and separately to identify consistent cardiac output estimation. Differing lengths of time of the
measurement cycle (e.g., 10 to 180 seconds) were selected to determine the best consistency of
cardiac output calculation. A second criterion for evaluating the reliability of estimations was
the regression value of the slope of the V.CO2 vs. Cc′CO2 data, with lower values being less
reliable. The data from the files were repeatedly replayed and examined for evident trends.
4.2.2.3 Results. An example of a single cycle of a V.CO2 vs. Cc′CO2 plot that relates
the sequential points with each other is shown in Figure 4.6. Plotting the two signals this way
made it evident that even during irregular spontaneous respiration, there was a general pattern
of the signals forming a loop about the ideal line described by the Fick equation (Chapter 1). It
was observed that, while a majority of the data points occurred at either the nonrebreathing or
the partial rebreathing position on the line, there were many data points in the vicinity of the
line during the transition to and from the rebreathing periods.
An example plot from several sequential measurement cycles is shown in Figure 4.7.
The data are separated into rebreathing and nonrebreathing components. With repeated
estimations using the V.CO2 vs. Cc′CO2 regression approach and with knowledge of the
proportion of the data in each period, it became apparent that too many data points were
collected during the nonrebreathing period. It was theorized that it was not necessary to record
all these data for a reliable cardiac output measurement, since many of them appeared at the
same general location on the regression plot. Cardiac output calculations that only took small
portions of the data into account were made with the regression approach.
The most consistent calculation of cardiac output was achieved with a small portion of
the data (20-30 data points) that incorporated information from before, during and after
rebreathing, as well as the transitions to and from rebreathing periods. Evaluating only the
points closest to the rebreathing periods (e.g., within 10 to 15 seconds) enhanced the
consistency of the measurements and the reliability as measured by the correlation coefficient.
The standard deviation for measurements derived from all data per measurement cycle in six
volunteers was 2.37 L/min, while the SD for measurements for data from the 25 data points
closest to rebreathing periods was 1.32 L/min. The correlation coefficient fell from an average
of 0.51 to 0.26 when all nonrebreathing data were included in the cardiac output estimation.
4.2.2.4 Discussion. The results of this analysis were somewhat unexpected. It was
previously assumed that a long baseline period contributed to the reliability of the
measurement, since there was less frequent perturbation of the system with long baseline
periods. In fact, rebreathing cardiac output estimations are mostly dependent on the
information gathered during rebreathing and the transition to and from rebreathing periods. The
data collected during the long baseline period of no rebreathing contain mostly redundant
information. Eliminating a portion of the baseline data for cardiac output estimation enhanced
consistency.
The observation that the most important data were found near the rebreathing periods,
especially the transitions to and from rebreathing, meant that some of the baseline period of no
rebreathing was wasted time in between measurements. For a monitor that is based on
continuous measurements over a period of hours, three minutes per measurement may be an
adequate rate. However, one of the target uses of a monitor for spontaneously ventilated
patients is a spot check monitor that has a pre-set beginning and ending point for the
measurement process. Such a monitor would preferably produce the first estimate sooner than
three minutes. Cutting the baseline period to last only as long as required for the measurement
would mean that a measurement period could be much shorter.
The original theory of rebreathing relied on the fact that one could make a baseline and
a rebreathing measurement and from those two points, calculate the cardiac output. The
irregular nature of the data from the spontaneously ventilated patients led to the idea that
perhaps multiple breaths before and during rebreathing would need to be averaged together at
each level in order to obtain reliable data for cardiac output calculation. Upon examination of
this theory, however, it became clear that this could not work because the data in the transition
between the two states was also important. Because of the spontaneous nature of the breaths,
the signal during the transition was rather irregular, but removing it from the calculation meant
that only two to four data points at the plateau level were used for the measurement. Thus, for
spontaneous ventilation, it was considered best to use the transitional data.

Another observation related to the transition period was that the V.CO2 signal appeared
more irregular than the PETCO2 signal. Shifting the V.CO2 signal by one to two breaths with
respect to the PETCO2 signal resulted in slightly different outputs, but did not make a clear
difference in the calculated estimates. It was observed that the PETCO2 signal was slower to
change in response to the ventilation change than the V.CO2 signal was. This observation led to
the developments described in Section 4.2.3.
4.2.3 Algorithm Modification
4.2.3.1 Introduction. Information important to the measurement is generated
throughout the partial rebreathing process. It was also observed that the V.CO2 signal appeared
more irregular than the PETCO2 signal during rebreathing and that this was a large contributor to
the inconsistency of the cardiac output estimates. Shifting the V.CO2 signal forward or
backward two breaths relative to the PETCO2 signal did not solve this problem, but it led to other
developments.
The detection of the signal change created during rebreathing is different for the two
signals. The V.CO2 signal appears to change immediately in response to the ventilation change
because at the onset of rebreathing, the inspired CO2 is subtracted from the expired CO2. In
contrast, the onset of rebreathing in the PETCO2 signal is not immediately evident. This is
because the change in the PETCO2 signal is a result of physiologic changes occurring at the
alveolar level, while V.CO2 is measured at the mouth and includes a component of the CO2
stores of the body. The PETCO2 signal is slow to change because the concentration change of
CO2 in the alveolar gas is not immediate. The CO2 buffering capacity of the lung tissue acts as
a low pass filter.
Another member of the team recognized that this difference in the signals could be
resolved by applying a low pass filter to the V.CO2 signal measured at the mouth,
(n),COVα)(11)(nVα(n)V 2CO2LPCO2LP&&& −+−= (4.1)
where alpha with a value between 0 and 1 is a parameter that affects the amount of low pass
filtering that takes place and V.
CO2LP is the CO2 production after the low pass filter has been
applied.
When this filter has been applied, some of the hysteresis and irregularity observed in
the V.
CO2LP signal at the onset of rebreathing is minimized, and the two signals appear to be
inversely related to each other (Figures 4.8 and 4.9). The work in this section dealt with
choosing the appropriate values for the filter that would work for all patients and with all
measurement cycles.
A second component of the work of this section had to do with identifying which
measurement cycles were more reliable than others. As the data was replayed and the estimates
compared with the reference method values, decisions were made as to which data were outliers
and should therefore be eliminated before cardiac output calculation.
4.2.3.2 Materials and methods. As the data were replayed and examined, multiple
values for the alpha variable in the low pass filter were tested for the best reliability of cardiac
output calculation when applied to the V.CO2 signal. A method was sought to automatically and
reliably remove the respiratory data that were usually recognizable by a person manually
processing the data as being outliers. This method of removing the unimportant data and
weighting the important data more heavily was mainly done after the low pass filter had been
applied to the V.CO2 signal.
4.2.3.3 Results. The ideal alpha variable required for the low pass filter was found to
change with each measurement cycle for each patient (as determined by the largest correlation
coefficient obtained for each measurement cycle). First, the correlation coefficient of the
regression of the two signals (V.CO2 and PETCO2) was calculated. Then, the low pass filter was
iteratively adapted until the correlation coefficient was maximized for each cycle. An example
of the application of the low pass filter to the V.CO2 signal during one measurement cycle is
shown in Figures 4.10 and 4.11. The data used to calculate the correlation coefficient were
defined to be the ones closest to each other; the user could define the distance between the

accepted points. The method of using the points closest to each other was chosen because often
the outliers were very far away from the reliable data.
4.2.3.4 Discussion. The implementation of the adaptive low pass filter led to the
theory that thirty-five seconds of rebreathing was longer than necessary. It was decided this
shorter period of rebreathing could possibly be combined with a shorter period of
nonrebreathing to make a faster measurement cycle. A shorter cycle could be repeated more
frequently so that the data from three rebreathing periods could be collected in the same time
originally required for one measurement.
4.2.4 Discussion
As result of the clinical study, both the hardware and the algorithms were altered
significantly. With the new changes in place, it was apparent that both the baseline and
rebreathing periods in the first clinical study may have been longer than necessary for
consistent measurements. Originally, it was hoped that the data from the clinical study could be
used for all algorithm development and testing. However, the changes proposed in this chapter
were significant enough to require new animal and clinical trials. A new study was planned to
test the performance of the new algorithm approach when used on mechanically ventilated
dogs. The new measurement cycle, composed of 30 seconds of rebreathing and 30 seconds of
nonrebreathing, would be tested. Stated another way, one complete measurement would be
composed of a 15 second baseline period, a thirty second partial rebreathing period, and a 15
second recovery period of no rebreathing.

6.8
1.7
3.4
5.1
Figure 4.1. FETCO2 vs. volume plot of a face mask with 150 mL of deadspace. Note that approximately 500 mL of expired volume were required to flush out enough deadspace to obtain a reliable PETCO2 measurement.
645 1290
Volume Expired (mL)
FEC
O2 (
%)

6.8
1.7
3.4
5.1
Figure 4.2. FETCO2vs. volume plot with a mouthpiece containing 7 mL of deadspace. Note that approximately 270 mL of expired volume were required to flush out enough deadspace to obtain a reliable PETCO2 measurement.
645 1290
Volume Expired (mL)
FEC
O2 (
%)

Figure 4.3. Phase three slope of the FECO2 vs. expired volume curve while breathing first with a nose clip and mouthpiece, then with the unmodified mask.
CO2 Phase 3 slope
02468
10
1 27 53 79 105
131
157
183
209
235
261
287
313
339
Breath Number
Slop
e

6.8
1.7
3.4
5.1
Figure 4.4. FECO2 vs. volume plot with a modified face mask containing 15 mL of deadspace. Note that approximately 280 mL of expired volume were required to flush out enough deadspace to obtain a reliable PETCO2 measurement.
645 1290
Volume Expired (mL)
FEC
O2 (
%)
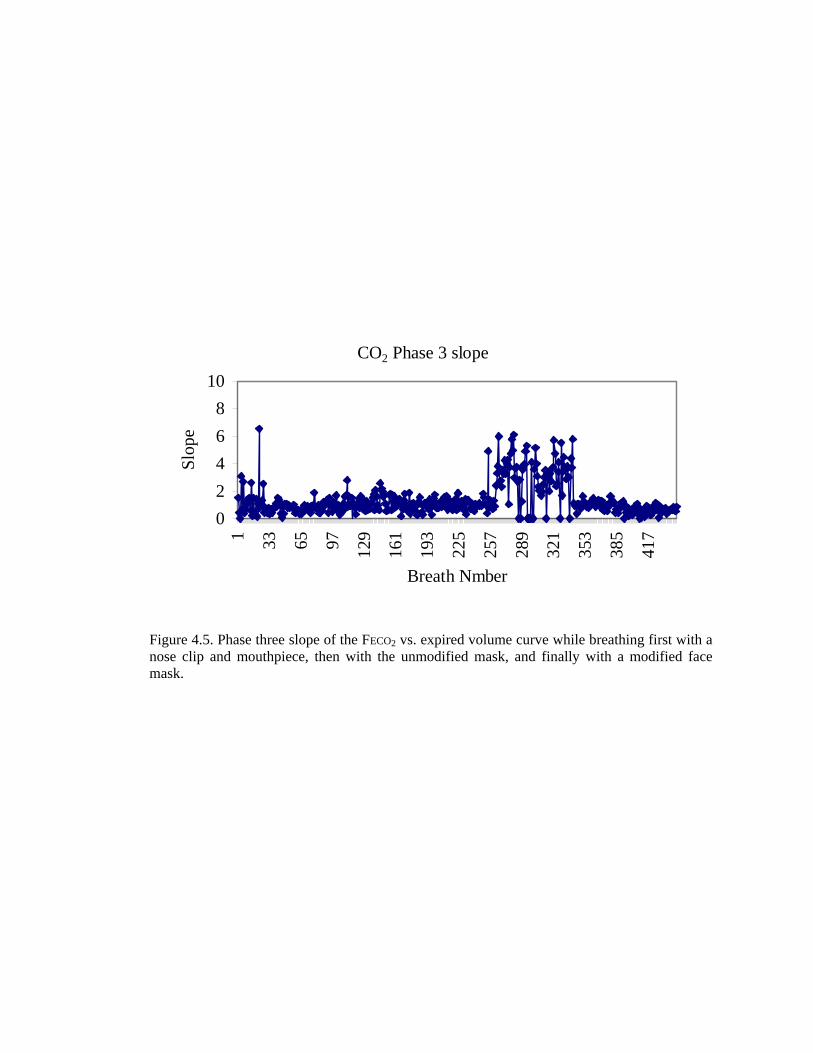
Figure 4.5. Phase three slope of the FECO2 vs. expired volume curve while breathing first with a nose clip and mouthpiece, then with the unmodified mask, and finally with a modified face mask.
CO2 Phase 3 slope
02468
10
1 33 65 97 129
161
193
225
257
289
321
353
385
417
Breath Nmber
Slop
e

Figure 4.6. Example of regression plot relating the points to each other.
Cc′CO2 (mL/L)
V. CO
2 (m
L/br
eath
)

Figure 4.7. Data from several measurement cycles, separated into two groups, rebreathing (dark circles) and nonrebreathing (light diamonds).
Multiple Rebreathing Cycles
-200
0
200
400
600
800
1000
340 350 360 370 380 390 400 410
cCO2 (mL/L)
VC
O2
(mL/
brea
th)
NonrebrRebr
Cc′CO2 (mL/L)
V. CO
2 (m
L/br
eath
)

Figure 4.8. Respiratory signals of one cycle from spontaneous ventilation without low pass filtering.
Unfiltered VCO2 respiratory signal
050
100150200250300350400450500
1 3 5 7 9 11 13 15 17 19 21 23Breath Number
VC
O2
(mL/
brea
th)
350355360365370375380385390395400
etC
O2
(mm
Hg)
VCO2etCO2
V. CO
2 (m
L/br
eath
)
Unfiltered V.CO2 Respiratory Signal
PETC
O2 (
mm
Hg)
V.CO2
PETCO2

Figure 4.9. Respiratory signals of one cycle with spontaneous respiration (same cycle as Figure 4.8) after low pass filtering.
Low Pass Filtered VCO2 respiratory signal
050
100150200250300350400450500
1 3 5 7 9 11 13 15 17 19 21 23Breath Number
VC
O2
(mL/
brea
th)
350355360365370375380385390395400
etC
O2
(mm
Hg)
VCO2etCO2
Low Pass Filtered V.CO2 Respiratory Signal
PETC
O2 (
mm
Hg)
V. CO
2 (m
L/br
eath
)
V.CO2
PETCO2

Figure 4.10. Before application of linear regression-determined low pass filter application (same cycle as Figures 4.8 and 4.9).
Unfiltered Regression Approach for C.O. Estimation
y = -10.195x + 4121.3R2 = 0.6712
050
100150200250300350400450
365 370 375 380 385 390 395
cCO2 (mL/L blood)
VC
O2
(mL/
brea
th)
Cc′CO2 (mL/L)
V. CO
2 (m
L/br
eath
)
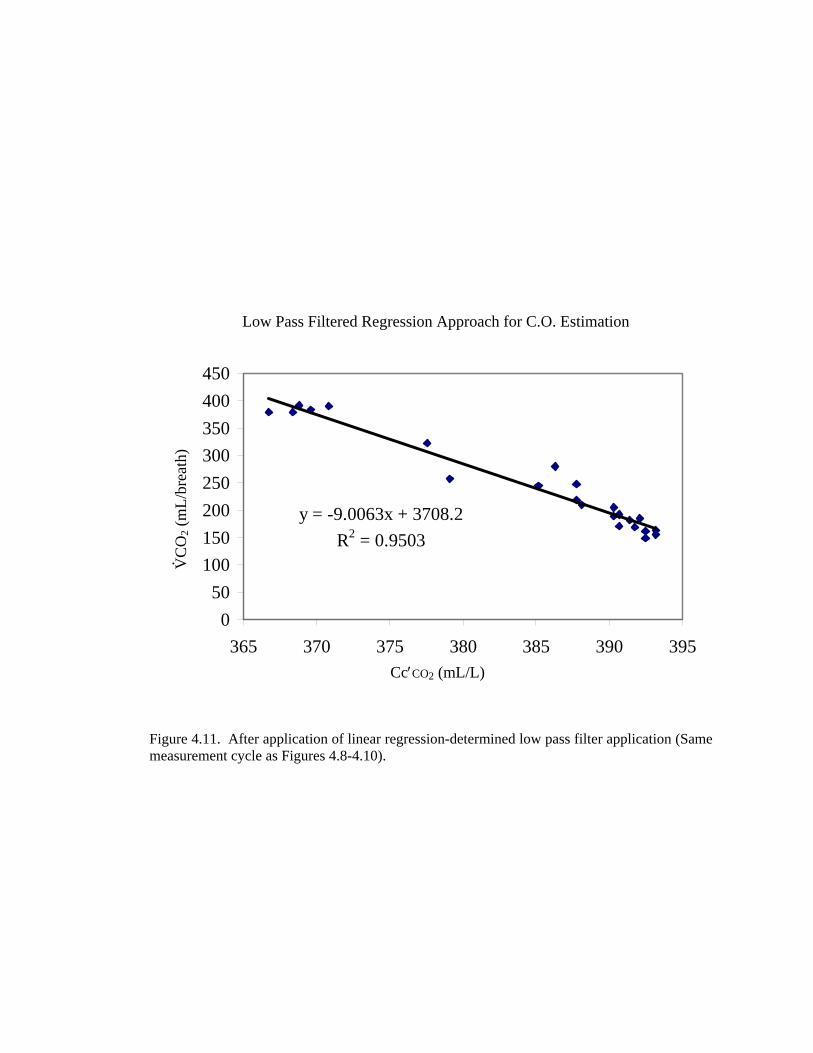
Figure 4.11. After application of linear regression-determined low pass filter application (Same measurement cycle as Figures 4.8-4.10).
Low Pass Filtered RegressioApproach for C.O. Estimation
y = -9.0063x + 3708.2R2 = 0.9503
050
100150200250300350400450
365 370 375 380 385 390 395
cCO2 (mL/L blood)
VC
O2
(mL/
brea
th)
Cc′CO2 (mL/L)
V. CO
2 (m
L/br
eath
)
Low Pass Filtered Regression Approach for C.O. Estimation

CHAPTER 5
FEASIBILITY TESTING OF THE MODIFIED SYSTEM
5.1 Feasibility Testing in an Animal Model of a Partial CO2 Rebreathing
System with a Shorter Measurement Cycle
After testing and development of the system as described in chapters two, three and
four, the modified system was readied for feasibility testing. The new system was not known to
pose any threats to the safety of subjects; however, safety precautions called for the first tests to
be performed in an animal model with mechanical ventilation. After successful testing in an
animal model, the system was used to monitor spontaneously breathing volunteers. No
reference method for cardiac output determination was used on the volunteer subjects, as this
would have been considered too risky for healthy subjects. Upon satisfactory performance of
the new system in volunteers, further testing would be planned for spontaneously ventilated
subjects who had a reference method in place.
5.1.1 Introduction
The NICO2 noninvasive cardiac output monitor presently available for purchase uses
50 seconds of partial rebreathing within a three-minute measurement cycle to calculate cardiac
output. Based on the findings described in chapters three and four, it would be desirable to
shorten both the rebreathing period and the measurement cycle. A shortened cycle could be
repeated more frequently, thereby improving the reliability of the measurements and providing
better support for clinical decisions. It also provides more data so that averaging can be
applied. For this preliminary study, the NICO2 monitor was altered so that the rebreathing

period lasted only 30 seconds within a repeated one minute measurement cycle. Three cycles
were analyzed together for one cardiac output estimation. Corresponding cardiac output
estimations from modified NICO2 and thermodilution cardiac output (TDCO) were compared
in five mechanically ventilated dogs.
5.1.2 Materials and Methods
Using an IACUC approved protocol, five mongrel dogs (25.75kg - 42.4 kg) were
induced with tiletamine and zolazepam, then intubated and mechanically ventilated. Anesthesia
was maintained with halothane and isoflurane. A DualTherm (B. Braun, Bethlehem, PA)
pulmonary artery catheter was placed for thermodilution cardiac output and central pressure
measurements.
The sensor for the NICO2 noninvasive cardiac output monitor was attached between the
endo-tracheal tube and the breathing circuit wye piece. Respiratory data from the NICO2
monitor were automatically recorded to a disk for subsequent analysis. Rebreathing and
nonrebreathing periods were set to be 30 seconds each.
Cardiac output changes (TD ranging from 0.64 to 10.88 L/min) were initiated with
dobutamine, halothane, and xylazine. Thermodilution cardiac output measurements (iced
saline, 10 ml) were made in triplicate every 10 minutes at random times during the respiratory
cycle.
5.1.3 Results
The correlation coefficient for the linear regression (Figure 5.1) between NICO2 and
thermodilution cardiac output measurements was r2 = 0.966 (n = 96). Bland-Altman
comparisons for mean TDCO of 4.88 L/min (Figure 5.2) showed a bias of -0.059 L/min,
standard deviation of 0.58 L/min (±24%) and limits of agreement of (-1.19 and 1.08L/min).

5.1.4 Discussion
Cardiac output estimations based on a shorter rebreathing period correlated well with
thermodilution in this animal study. The performance of the modified device in this study was
improved from the observed performance of the original NICO device (bias = -1.1 L/min, s.d. =
0.62 L/min) 41. Although the rebreathing period of the modified device was shorter, it still
provided sufficient data for cardiac output estimates because the transition data were
incorporated into the calculation. Previously, the transition data were eliminated so that only
the information recorded during steady state was considered. The shorter nonrebreathing
period allowed the rebreathing period to be repeated more frequently, which provided more
data for averaging. Because more data were collected, occasional spurious breaths could be
better identified and eliminated. With further algorithm refinements and clinical testing in
patients, the precision may be increased and it may be possible to reduce the measurement
period from three minutes to one minute. The increase in frequency of cardiac output
measurements using the NICO2 could help make earlier clinical decisions during episodes of
hemodynamic instability. A faster measurement cycle of one minute would also be of great
help to clinicians when performing fluid challenges.
Safety of the new device did not differ from the original device. The ratio of
rebreathing time to nonrebreathing time was increased compared to the original device (i.e.,
from 1:2.6 to 1:1). This small reduction in ventilation was not considered unsafe, since oxygen
levels remained high throughout the studies. Because the signal to noise ratio was quite high, it
may also be possible to reduce the rebreathing volume and still obtain reliable estimates. It
would be useful to observe how the change in ventilation affects the oxygen and carbon dioxide
levels in spontaneously breathing subjects after surgery, as the changes may be smaller with
spontaneous ventilation.
The more robust nature of the modified algorithm may be adequate for noninvasively
monitoring cardiac output of spontaneously breathing patients. The study described in the

following section tested whether the modified device was able to report consistent estimates for
healthy, spontaneously breathing human volunteers.
5.2 Feasibility Testing of the Modified System in Human Volunteers
5.2.1 Introduction
The modified NICO2 system (Chapter four) was designed to have improved
performance and patient comfort when monitoring the cardiac output of spontaneously
ventilated human subjects. Following acceptable safety and performance of the modified
system in an animal model, tests were developed to demonstrate feasibility of use in
spontaneously ventilated human volunteers.
5.2.2 Materials and Methods
After IRB approval and subject consent, five healthy human volunteers were asked to
breathe spontaneously (without instruction regarding respiratory pattern) through a mouthpiece
version of a new prototype NICO2 monitor (described in Chapter 4) while wearing a nose clip.
A pulse oximeter was attached to the finger to monitor blood oxygen saturation. Partial
rebreathing maneuvers were actuated automatically every thirty seconds. Subjects were
monitored for fifteen minutes each, and all data were automatically saved with the computer
system for further analysis. Data from three subsequent rebreathing periods of thirty seconds
each and the corresponding nonrebreathing periods (total of three minutes of data) were
analyzed together for each C.O. estimation. Cardiac output values and the quality of the
recorded signals were reviewed. Because the number of subjects and sets of readings are small
in this study,40 bias and precision statistics were not applied to determine the significance of
variability present.

5.2.3 Results
The cardiac output estimations for each subject are shown in Table 5.1. The average
standard deviation of the mean cardiac output (15.33 L/min) was 1.95 L/min (± 12.7%). SpO2
remained between 96% and 99% for each volunteer monitored. An example of the appearance
of the respiratory signals, plotted as V.CO2 vs. Cc′CO2, (after converting from PETCO2) is shown
in Figure 5.3.
5.2.4 Discussion
The cardiac output calculated by this modified system seems to be higher than expected
for resting individuals; it is clinically accepted that an adult at rest has a cardiac output of 5
L/min and that during exercise, the cardiac output may increase up to 35-45 L/min. The
volunteers in this test were healthy and young (20-30 yrs), and they had not received any drugs
that would lower CO. Because of the risk associated with inserting catheters, no reference
method was used for these volunteer feasibility tests. It can therefore not be said how accurate
the rebreathing cardiac output values were, but the variability within each subject was improved
when compared to that of the original partial rebreathing device. The average standard
deviation for the original system with spontaneously breathing subjects was 5.5 L/min. With
the modified system, the performance was somewhat improved to have a standard deviation of
1.95 L/min.
Given the acceptable performance in the mechanically ventilated dogs and the
appearance of lower standard deviation in this study on humans, further testing is planned to
improve the standard deviation and to test the bias and precision. Future tests of the modified
system should be performed on spontaneously ventilated human subjects who already have a
reference method such as a thermodilution catheter in place.

Comparison of Modified NICO2 and TD in an Animal Model
Figure 5.1. A linear regression plot for data from five mongrel dogs (25.75kg - 42.4 kg) monitored during mechanical ventilation. The correlation coefficient was found to be 0.966, and the slope was 0.866.
y = 0.8662x + 0.7119R2 = 0.9658
0123456789
101112
0 1 2 3 4 5 6 7 8 9 10 11 12TD [ L/min ]
NIC
O [
L/m
in ]

Measurements from Modified NICO2 and TD in an Animal Model
Figure 5.2. Bland-Altman for measurements from five mechanically ventilated mongrel dogs (25.75kg - 42.4 kg). Average (TD) C.O. was 4.88 L/min. Bias was -0.059 L/min, standard deviation (SD) was 0.58 L/min (±24%) and limits of agreement were (-1.19 and 1.08L/min).
-3
-1
1
3
0 2 4 6 8 10 12Average of NICO and TD [ L/min ]
(NIC
O-T
DC
O)
[ L/m
in ] Mean + 2SD
Mean
Mean - 2SD
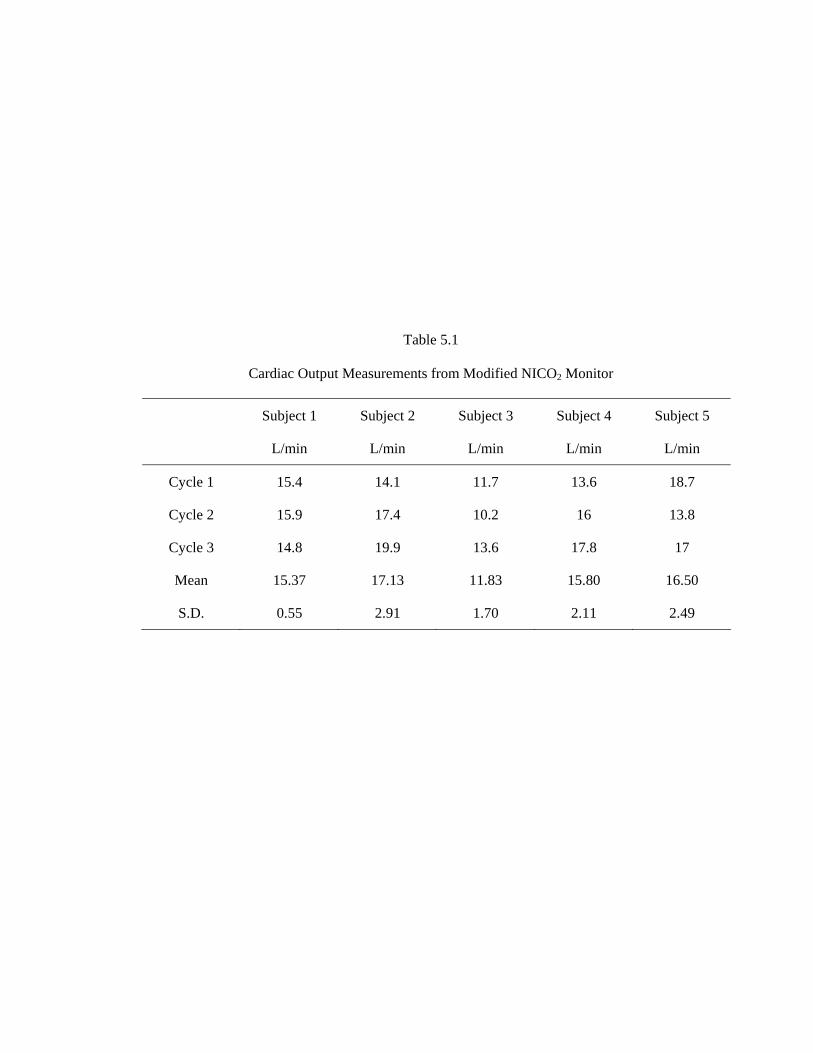
Table 5.1
Cardiac Output Measurements from Modified NICO2 Monitor
Subject 1 Subject 2 Subject 3 Subject 4 Subject 5
L/min L/min L/min L/min L/min
Cycle 1 15.4 14.1 11.7 13.6 18.7
Cycle 2 15.9 17.4 10.2 16 13.8
Cycle 3 14.8 19.9 13.6 17.8 17
Mean 15.37 17.13 11.83 15.80 16.50
S.D. 0.55 2.91 1.70 2.11 2.49

Figure 5.3. Example of respiratory data measured during spontaneous ventilation of a human subject, as monitored with the modified NICO2 system and mouthpiece attachment. The signals are plotted in the regression style for analysis.
cCO2 (mL CO2 / L blood) Original signal Modified signal
VC
O2 (
mL/
min
) V. C
O2 (
mL/
brea
th)
Cc′CO2 (mL CO2/L blood)

CHAPTER 6
CONCLUSION
The advancements made to the partial rebreathing technique during the course of this
research led to a new means of signal acquisition and processing for cardiac output estimation.
The new method no longer requires patient sedation, mechanical ventilation, or long periods of
measurement for estimation of cardiac output. Hardware modifications provided a new patient
interface for nonintubated subjects. Together, the algorithm and hardware changes expand the
utility of the noninvasive device to ICUs and outpatient clinics where patients are
spontaneously breathing. Furthermore, the new method allows for more frequent updates
(every minute rather than every three minutes), shorter rebreathing periods, shorter time
required for reliable measurements, and more comfort for the subject because of reduced
ventilatory drive in response to CO2 rebreathing. Preliminary studies indicate the new method
is safe, may be more accurate, and may have a faster response time than the original monitor.
The irregular nature of spontaneous ventilation was a significant challenge to the
development of a reliable monitor. The work outlined in this thesis includes the critical
observation that the information recorded during the transition to and from the rebreathing state
is important for reliable cardiac output measurements in spontaneously ventilated patients. The
original Fick-based theories of rebreathing focused on deriving the cardiac output from two
steady states: rebreathing and baseline. Now it is evident that the information during the
transition should be included in the analysis, especially in the case of spontaneous ventilation,
because the data are irregular and the short rebreathing periods do not allow for substantial data
collection during the rebreathing period. Without the data obtained during the transition,

irregular breaths within a short measurement cycle can corrupt the measurements, and the
resulting cardiac output estimation can be unreliable. By filtering and analyzing the respiratory
data obtained during transitional periods rather than waiting for a steady state period after
perturbation of the system, the difference in timing of the respiratory signals due to the inability
of the sensors to directly measure the gas within the alveoli is resolved.
With older rebreathing techniques, one had to wait 3 minutes or longer before another
estimate could be made. In addition, the total rebreathing techniques made subjects feel very
uncomfortable, such that immediate or continuous repetition of the measurement was difficult.
This modified partial rebreathing setup has the advantages of a short rebreathing period (30
seconds) and the option to administer oxygen to assure that sick patients can be adequately
oxygenated.
6.1 Monitor Performance
A comparison study between thermodilution and NICO2 was performed in the ICU
with twenty-seven post cardiac surgery patients who were spontaneously breathing. Linear
correlation of the paired measurements (n=59) showed an r2 of 0.408 and a slope of 0.875.
Bland-Altman tests on the paired measurements (n=59) (TD mean = 5.21 L/min) showed a
standard deviation of the difference (rebreathing-thermodilution) of 1.21 L/min (±46%) and a
bias of -0.34 L/min.
Following the ICU study, additional modifications were made, and the new system was
tested on five mechanically ventilated mongrel dogs. The correlation coefficient for the linear
regression between the new NICO2 and thermodilution cardiac output measurements was r2 =
0.966 (n = 96). Bland-Altman comparisons (mean TD of 4.88 L/min) revealed a bias of -0.059
L/min and a standard deviation of 0.58 L/min (±24%). Compared to the performance of the
original device41 on mechanically ventilated animals (bias = -1.1 L/min, S.D. = 0.62 L/min,
±30%), the cardiac output estimates of the modified system were improved.

The new system was then preliminarily tested on five spontaneously breathing
volunteers. Estimates were not compared with those of an invasive method for safety reasons.
The device was safe with regard to oxygenation levels of the blood (as measured with a pulse
oximeter). The standard deviation of the modified system in spontaneously breathing humans
was 1.95 L/min, compared to the s.d. of the original device of 5.5 L/min.
The performance of the modified NICO2 monitor in these studies demonstrated that the
modified monitor performs at least as well as other commercially available techniques. When
the measurements from the original NICO2 monitor (three minute measurement cycle) were
compared to conventional TDCO in three clinical studies66-68, they had a bias between 0.07 and
0.46 L/min and precision of 0.81 to 0.95 (±30%) L/min. When bioimpedance measurements
were compared to transit time flow probe measurements, bias was reported to be 0.15 L/min,
and the limits of agreement (mean difference ±1.96 × SD) were -2.53 to 2.82 L/min37. When
compared to thermodilution, bioimpedance had limits of agreement40 of ±37%. Doppler has
been shown to have a bias of -0.01 L/min and limits of agreement of 1.12 L/min (±65%) when
compared to conventional thermodilution38,40. Because clinical cardiac output techniques have
an inherent lack of precision, limits of agreement between the new and the reference technique
of up to ±30% are currently regarded as clinically acceptable40.
Partial rebreathing may fulfill a need for clinicians who want a noninvasive option for
monitoring cardiac health, especially when other monitors are too expensive, unavailable, or
too risky. It seems likely that a device can be developed for both spot checks and long-term
monitoring of the hemodynamic function.
A limitation of these studies was that the spontaneously ventilated patients, in whom a
reference method was in place, had recently undergone cardiac surgery. Thus, the cardiac
output values were not distributed over a wide range. Many patients were experiencing a
significant amount of pain and therefore tended to have smaller tidal volumes than healthy
people. It would have been preferable to test a larger group of patients. Another limitation was

that the volunteer tests were all performed on healthy people. Sick or very old volunteers may
have reacted to the monitoring differently.
The reference method (TD) chosen for this study is only accurate73,74 within 10%.
Also, in an analysis of data from fourteen comparison studies, Stetz found that there is a 22%
error for single measurements of TD, but that the error could be reduced to 13% if triplicate
measurements were averaged75. Therefore, the performance of the new system is difficult to
evaluate in some cases. Future trials with other standards, such as the Fick method or an
electromagnetic flow meter may yield additional useful information about the performance of
the system.
6.2 Monitor Utility
Intubation is not required for the modified device. This allows for use in more settings
and on more types of patients. The noninvasive monitor is ideal for patients for whom the
other methods of monitoring are too dangerous, invasive, or expensive. For example, patients
who have undergone surgery or have questionable cardiac health may benefit from being
monitored noninvasively. Often, these patients are well enough to be spontaneously breathing
and are not in critical care environments. They may be receiving health care in emergency
rooms, family clinics, rest homes, or at home.
Use of the monitor does not require excessive training or special skills, so a wide
variety of clinicians could easily set it up and begin monitoring. Some other methods require
specialized training for setup and monitoring; invasive methods often require long setup
periods. Setup time for this monitor is less than three minutes, so it could be beneficial in
emergency cases.
The device is not intended for patients with severe lung disease or patients who cannot
tolerate higher levels of CO2. The method also has the disadvantage of not providing the
clinician with wedge pressure measurements as a PA catheter would. The wedge pressure is

usually used to assess the volume status of the patient; volume status could alternatively be
inferred from the change in cardiac output in response to a fluid challenge to the patient.
Measurements from this new method of cardiac output estimation are always made at
the same time within the respiratory cycle. Other methods such as thermodilution can be
subject to changes in cardiac output caused by the increased intra-thoracic pressure that occurs
when the lungs are filled. This is especially of concern when the patient is hypovolemic and
respiration adds significant variation in the preload of the heart. It can be difficult for clinicians
to determine whether their treatments have been effective if the respiratory cycle alters the
cardiac output within each breath. The respiratory data obtained during rebreathing
measurements all originate from the time just before exhalation, so all measurements are based
on this point in time relative to the respiratory cycle. This can be an advantage to clinicians
watching for small changes in response to medical treatments they may have administered.
The one minute measurement cycle makes the monitor as fast as or faster than many
other currently available methods for cardiac output determination. Minute by minute
information about the cardiac function could form the basis for clinical decisions in times of
hemodynamic instability. For example, clinicians could use the monitor to gauge the response
of the cardiac output to various treatments. Understanding how the heart responds to medical
treatment would allow physicians to quickly diagnose and treat patients rather than trying
multiple approaches to treatment over a longer period.
6.3 Future Enhancements
Further testing is required to determine the performance of the modified monitor in
spontaneously ventilated human subjects. In addition, it is likely that the modified algorithm
will provide improvement to the performance of the monitor in mechanically ventilated and
mixed ventilation cases. These studies should also be undertaken. Following the comparison
studies, additional algorithm enhancement and data filtering should be done during data

playback. It would also be clinically relevant to examine the relationship between arterial CO2
content and the new rebreathing method.
It may be possible for the partial rebreathing system to estimate the patient’s venous
CO2 levels. Future implications could be that one could noninvasively estimate this blood gas
level and possibly use it for clinical procedures or monitoring. Future tests on the feasibility of
this process should also be undertaken.
With additional hardware modification, a cardiac stress test C.O. monitor using this
technology could be developed. Currently, the resistance to airflow prohibits the copious
volumes of airflow required for exercise. If this limitation could be eliminated, it may be
possible to determine whether the cardiovascular health of patients scheduled for catheter lab
treatment really warranted catheterization. It may be valuable to do such a study as the
technology development allows.
Future device development could include a hand-held monitor. A monitor designed for
use on spontaneously ventilated patients in clinics and outpatient settings would be the most
convenient if it were a small, hand-held unit that produced results in 10-15 minutes. To this
end, several design suggestions for a hand-held unit were put forth. The ideal properties of a
hand-held unit include a handle, a simple patient interface, and a lightweight, minimal size.
The best two choices for the patient interface were considered to be a mouthpiece or a modified
mask. Several design prototypes were built that adhered to these specifications.
With further testing and development, the new partial rebreathing system has the
potential to become more clinically accepted in the OR and to begin to be used in new areas,
such as emergency rooms, intensive care units, and outpatient clinics. Compared to current
modes of monitoring, the new device holds promise of support for targeted medical treatment,
reduced costs in healthcare, and reduced patient morbidity.

LIST OF SYMBOLS
C.O. Cardiac output (L/min)
CACO2 Carbon dioxide content of alveolar blood (mL CO2/liter blood)
CaCO2 Carbon dioxide content of arterial blood (mL CO2/liter blood)
Cc′CO2 Pulmonary end-capillary concentration of carbon dioxide (mL CO2/liter blood)
CvCO2 Carbon dioxide content of mixed venous blood (mL CO2/liter blood)
FIO2 O2 concentration of the inspired gas (fraction)
FECO2 CO2 concentration of the expired gas (fraction)
FETO2 O2 concentration of the end-tidal gas (fraction)
PETCO2 Partial pressure of end-tidal CO2 (mmHg)
Q.
t Cardiac output, total (L/min)
Q.
PCBF Pulmonary capillary blood flow (L/min)
Q.
s Intrapulmonary shunt blood flow (L/min)
V.CO2 Volume of CO2 excreted per minute, as measured at the mouth (mL/min)