nonemployer start-up puzzle - small business … start-up puzzle... · nonemployer start-up puzzle...
TRANSCRIPT

Nonemployer Start-up Puzzle
A Working Paper
by
Zoltan J. Acs, Brian Headd and Hezekiah Agwara*
for
Under contract no. SBAHQ-08-M-0195
Release Date: December 2009
* Zoltan J. Acs is University Professor at George Mason University and Director of the Center for Entrepreneurship and Public Policy, Brian Headd is an economist with the Office of Advocacy, U.S. Small Business Administration and Hezekiah Agwara is a graduate student at George Mason University.
This report was developed under a contract with the Small Business Administration, Office of Advocacy, and contains information and analysis that was reviewed and edited by officials of the Office of Advocacy. However, the final conclusions of the report do not necessarily reflect the views of the Office of Advocacy.
The Nonemployer Start-up Puzzle
An Office of Advocacy Working paper by
Zoltan J. Acs, Brian Headd and Hezekiah Agwara * Abstract – Understanding the dynamics of nonemployer firms has been an unsolved puzzle because of a dearth of data. Nonemployer firms represent three-quarters of the businesses in the United States but only 3 percent of business receipts. While they represent a relatively small share of economic activity, nonemployer firms are important as a gateway to becoming employer firms, providing flexible work opportunities and a path to economic prosperity. Using special tabulations from the U.S. Census Bureau’s annual nonemployer firm program, we find nonemployers have a startup rate nearly three times the rate of employer firms, 35 percent and 13 percent, respectively. Analysis of the determinants of nonemployer start-up rates across states and industries indicates that they seem countercyclical with respect to the labor market, while employer start-up rates move in line with the overall economic cycles. The determinants of start-ups have disparate effects on employer and nonemployer firms. JEL: L26; C81, D21, L11, O3 Key Words: Firm Dynamics, Entrepreneurship, Agglomeration, Nonemployer firms * Zoltan J. Acs is University Professor at George Mason University and Director of the Center for Entrepreneurship and Public Policy, Brian Headd is an economist with the Office of Advocacy, U.S. Small Business Administration and Hezekiah Agwara is a graduate student at George Mason University. This report was developed under a contract with the Small Business Administration, Office of Advocacy, and contains information and analysis that was reviewed and edited by officials of the Office of Advocacy. However, the final conclusions of the report do not necessarily reflect the views of the Office of Advocacy.

Table of Contents 1 Introduction ............................................................................................................................. 12 Background ............................................................................................................................. 23 Review of Literature on Nonemployer Businesses and Data ................................................. 34 The Theory .............................................................................................................................. 75 Firm Birth and Death Results ................................................................................................. 86 Caveats and Future Research Needs ..................................................................................... 207 Conclusion ............................................................................................................................ 21References ..................................................................................................................................... 22Appendix ....................................................................................................................................... 23
1 Introduction A large body of literature exists on regional variation in firm birth rates. Most of these studies focus on different time periods, indicators, sectors, countries, and units of analysis. Over the years more and more sophisticated databases have been developed that can better identify firm birth rates. While many studies of firm birth rates have used employer data—for example, data from the U. S. Census Bureau or the self-employment rate—we have not been able to examine a unique aspect of new firm formation, nonemployer births.1
Nonemployers represent a population more than three times that of employer firms. Census figures for 2006 report 21 million nonemployers and 6 million employers. While they constituted three-quarters of the businesses, nonemployers earned only 3.5 percent of receipts in 2002 (the latest year available). Nonemployers are not smaller versions of employer firms. They have unique characteristics; therefore, the determinants of employer start-ups are not likely to apply to nonemployer start-ups (Headd and Saade, 2008). In the past it was difficult if not impossible to examine this population because of the commingling of the data. For example, the self-employment data include both employer and nonemployer firms and the employer data do not include any nonemployer firms. However, incorporated firms may or may not include both. This paper uses a unique data set to examine the nonemployer population based on the U.S. Census Bureau’s annual statistics on nonemployer businesses. The published annual figures show the overall change in the nonemployer universe across years, but do not separately identify entries, continuations, and exits. The U.S. Small Business Administration, Office of Advocacy requested special tabulations from Census for entries, continuations, and exits for data years 2003 and 2004. The tables contain summary cells that provide the number of nonemployer businesses and the associated receipts.2
While recent studies have examined the role of human capital in employer firm formation rates, (Acs and Armington, 2004) none have looked at the impact of human capital on nonemployer firms. The purpose of this paper is to document the firm birth rate for employer and nonemployer firms and to compare the determinants of both populations. The next section looks at the background of the Census program. Section three looks at the literature on nonemployer firms and the fourth section examines descriptive statistics and the determinants of new firm formation. Caveats and next steps are followed by a conclusion.
1 More details are offered in the background section, but self-employment represents owners, while nonemployers represent businesses. This is not a one-to-one relationship, as owners can have more than one business and a business can have more than one owner. 2 The authors would like to thank Bureau of the Census staff members Paul Hanczaryk and Cynthia Wrenn-Yorker for their efforts in producing the special tabulations. The special tabulations were produced as a trial project to determine the feasibility and value of the data. The data have a lag of a few years and as of now could be updated to 2007.
2
2 Background Nonemployers are businesses with no employees other than the owner(s), and can include part-time, home-based businesses in which the owner(s) work for less than 40 hours per week. The Census Bureau’s nonemployer definition is restricted to entities with business receipts of at least $1,000, but without paid employees.3
A nonemployer business is a concept similar to, but different from self-employment. A nonemployer is a business and the self-employed are the owners. A nonemployer can equal self-employment. Unlike nonemployer businesses, self-employment is a labor market status, and the Bureau of Labor Statistics often reports individuals as self-employed if that is their primary occupation (often only focusing on the unincorporated). Some nonemployers, often those with relatively low receipts, are primarily wage-sector workers (Boden and Nucci, 2004). Moreover, the restrictive definition of nonemployer business excludes self-employed individuals with paid employees. Nonemployers are important in creating the stock of businesses from which employers arise; in providing learning opportunities for future businesses or expansions; and in generating flexible work options, economic cushion, and empowerment. The 2002 Survey of Business Owners (SBO) surveyed about 2 million businesses or 9 percent of the estimated 23 million nonfarm firms in the United States.4
Of the 23 million firms, about 75.5 percent are nonemployers. The underlying data were also used by Davis et al. (2007), which found about 5.4 million nonfarm employer and 15.5 million nonemployer firms as of the year 2000, when the data are matched to produce longitudinal results.
Tabulations by Boden and Nucci (2004) found that a majority of nonemployer entities (and their aggregate receipts) reflected sole proprietorships.5
Partnerships and corporations, however, recorded significantly higher revenues, on average. As expected, Boden and Nucci found nonemployer entry and exit activity prevalent in the nonindustrial sector. The longitudinal nonemployer data have presented other empirical regularities showing that nonemployer partnerships and corporations are more likely to become employers than are sole proprietorships. Also, partnerships and corporations exhibit median survival rates that exceed those of sole proprietorships.
The 2002 SBO also found that about half of the respondent firms were home-based, with variations depending on the type of business, employer status, and size of firm. Nonemployer businesses were more likely to be home-based: 58 percent, compared with 22 percent of employer firms. The survey further found that the likelihood of a business operating from home decreased sharply with size. For example, it found that about 29 percent of firms with 1 to 4 employees were home-based in 2002, compared with 11 percent of those with 5 to 9 employees and 6 percent of the 10- to 19-employee group. Four industries accounted for the largest share of home-based businesses: professional, scientific, and technical services (19 percent); construction (16 percent); retail trade (11 percent); and other services (10 percent). 3 There is a construction exception; see www.census.gov/econ/nonemployer/overview.htm for details. 4 The 2002 SBO is the latest available. The 2007 SBO is currently underway, see www.census.gov/econ/sbo/ for details. 5 Sole proprietorships constituted 85 to 90 percent of all nonemployer entrants.
3
The Census Bureau Nonemployer Data Program The Census Bureau maintains a Business Register (BR) that includes all employer and nonemployer businesses in the United States. Census has maintained the annual nonemployer file on the Business Register based on the North American Industry Classification System (NAICS) since data year 2002. Census has produced annual nonemployer counts starting with data year 1997. By tracking the nonemployer businesses from data years 2002 through 2004, the Census Bureau was able to produce nonemployer entry, continuation, and exit statistics for data years 2003 and 2004 at the U.S. and state levels, for the total and for each industry sector level. The BR processing assigns unique identification numbers to each nonemployer business. This unique numbering system is useful in conducting longitudinal studies. The same identification number is assigned to the same nonemployer business across years. Nonemployer businesses without receipts in the preceding year are considered business entries; those without receipts in the succeeding year are considered exits; and those with receipts in consecutive years are considered business continuations. A business could be excluded from the nonemployer universe based on several factors, including lack of positive revenues for the year; having paid employees in the given year; or having had excessive revenues above the maximum cutoff (generally $1 million in receipts, although it could be higher; see www.census.gov/econ/nonemployer/methodology.htm
for details).
3 Review of Literature on Nonemployer Businesses and Data A number of studies have attempted to quantify and analyze trends in the nonemployer business universe. The available data series include those derived from household surveys and business registers by the Census Bureau. The household-based data include the Survey of Income and Program Participation (SIPP), the Panel Study of Income Dynamics (PSID), various National Longitudinal Surveys (NLS), and the Current Population Survey (CPS). In addition, Wells Fargo and the National Federation of Independent Business (NFIB) initiated annual surveys of 36,000 households in 1995 to measure business entry. The sections that follow detail the different projects quantifying business formation and terminations.
1. NFIB’s Business Starts and Stops6
The NFIB study quantified total business formations and terminations over time from monthly interviews of 3,000 households (36,000 per year). This was a departure from traditional accounting approaches that count only “new employers” or “new incorporations.” It first screened for business starts/stops over a period of six months prior to the interview. The study modified the preferred methodology for measuring business “stops” by counting business terminations resulting from financial losses to the investor, instead of losses to creditors. It also 6 The study was conducted by Gallup International in November 1999 and funded by Wells Fargo. It is available at www.nfib.com/object/2752733.html.
4
counted otherwise profitable business establishments that closed due to other factors. This approach produced estimates of business starts and stops that were higher than the traditional measures and, hence, reflective of significantly greater business formation activity. The method, however, excluded the very small firms, but measured all starts, including purchases and inheritances of existing businesses, and all
stops, including “sold” businesses. In terms of accuracy, therefore, it is likely that the measure overestimated business starts and stops.
2. Fairlie’s Kauffman Index
The Kauffman Index of Entrepreneurial Activity by Robert Fairlie measures the percentage of adult non-business-owner population (aged 20 to 64 years) starting a business by matching monthly longitudinal data from the Current Population Survey (CPS). The U.S. Bureau of Census and the Bureau of Labor Statistics conduct the CPS monthly on samples of more than 130,000 people. The CPS uses a four-month rotational survey method that interviews individuals in three batches every year to create a panel of monthly data for up to 75 percent of respondents. The twelve-month series for 2007 contained 700,000 adult samples and the twelve-year series up to 2007 had about 8 million individuals. The index captures all individuals who own a business as their main job, defined as dedicating at least
15 hours per week to the business. It captures new business owners in their first month of significant business activity and separates them into different demographic groups, states, and regions. It then matches the CPS monthly files to estimate the rate of business formation for each individual, which it averages across households. While the Kauffman index is technically not an index, the formation rates are used as a proxy for monthly entrepreneurial activity rates. The index measures “flows into business” instead of the number of existing businesses at a given time. Although dynamic, it does not capture the evolution of firms over time.
The latest index, using the 2007 CPS data, investigated trends in entrepreneurial activity over the twelve-year period between 1996 and 2007 and found a stable rate of entrepreneurial activity, but changing demographic and regional trends. It found that about 4 percent of the adult non-business-owner population creates new businesses every year (0.30 percent per month). The monthly entrepreneurial rates fluctuated within a stable band of 0.27 to 0.32 percent over the twelve-year period. It found immigrants substantially more likely to start a business than native-born Americans (0.46 percent, compared with 0.27 percent for natives); immigrants’ monthly business starts increased from 0.37 percent in 2006 to 0.46 percent in 2007. Western and Southern states recorded the highest entrepreneurial activity rates, compared with the Midwest and Northeast. While the index is an interesting metric, some caveats need to be considered:
1. It does not distinguish between employer and nonemployer or between incorporated and nonincorporated business statuses;
2. It does not capture when a “serial entrepreneur” opens a new business beyond their original business.
3. Its benchmark survey includes part-time business owners broadly defined, but excludes those working less than 15 hours on the business.
4. It captures seasonal entries (opening in the spring, closing in the fall) as entrepreneurship churn.

5
5. It excludes individuals whose primary job is wage work but who are self-employed as a secondary occupation.
6. Unlike the Global Entrepreneurship Monitor’s (GEM) Total Entrepreneurial Activity Index,7
which counts businesses younger than 42 months, this index captures entrepreneurs only once, when they first create a business, and does not include metrics for the performance of the venture.
3. Longitudinal Linking of Nonemployer Data to Nonemployer Data and the Business Register
over Time, by Boden and Nucci (2004) The study attempted to integrate nonemployer "entities" into the Census Bureau's longitudinal business data series contained in the Longitudinal Business Database (LBD) file and Census’s internal Statistics of U.S. Businesses (SUSB) longitudinal employer file, Business Information Tracking Series. The data project sought to supplement the household-based measure of the dynamics of self-employment and nascent entrepreneurship. Its main objective was to construct a comprehensive source of data to investigate U.S. business entry and exit and provide information on employer "births" from nonemployer entities, thereby attempting to correct business age data in the LBD. The project involved utilizing three Census data series—namely, the Business Register (formerly known as the SSEL), the annual nonemployer data beginning in 1994, and the Longitudinal Business Database (LBD). The study constructed data from 1992 through 1999 (excluding 1993, due to data unavailability). Its preliminary tabulations found that between 100,000 and 200,000 nonemployer entities transition into employers every year.
4. Nonemployer dataset, by Davis et al. The paper studied the dynamics of young and small businesses using a preliminary Integrated Longitudinal Business Database (ILBD) that combined administrative records and survey data for all (employer and nonemployer) businesses for the periods 1992 and 1994-2000. It was an extension of the project by Boden and Nucci (2004) with the objective of correcting the issues introduced by data that target only large mature firms. Its advantages include:
1. Capturing more accurately the systematic variation in the response to economic shocks by business size or age.
2. Facilitating the measurement and study of early life cycle dynamics and evaluating theories of business formation, selection, and growth.
It integrated the data and tracked transitions from nonemployer to employer status, thereby introducing a new frontier in the study of business formation, early life cycle dynamics, and the process of job creation.
7 GEM is a multi-country effort to evaluate entrepreneurial activity. See www.gemconsortium.org/.
6
It used data from the Census Bureau’s employer Business Register (payroll, corporate and individual income tax returns, applications for Employer Identification Number, or EIN) and various business surveys, like the quinquennial Economic Census, Company Organization Surveys, and Annual Surveys. For nonemployers, it utilized tax filings. The four-step data construction approach involved:
1. Constructing longitudinal links for business units within each category using various identifiers;
2. Integrating (non) employer categories year by year, counting each business entity only once; 3. Constructing contemporaneous and dynamic ownership links across the categories using the
EIN-federal government ID crosswalk and exact literal matches on the business name; 4. Aggregating the establishment data within an industry to the firm level, which separates
multi-unit firms operating in different industries. The study categorized businesses into single- and multi-unit establishments and found that 182,000 multi-unit employer establishments accounted for 61 percent of total U.S. business revenues. Single-unit employer establishments accounted for 35 percent; nonemployer businesses accounted for the remainder. The study selected 40 industries (with large numbers and relatively high revenue shares of young and small businesses), which accounted for 50 percent of nonemployers and 36 percent of nonemployer revenues. Nonemployer firms accounted for 14 percent of business revenues in the selected industries and only 4 percent of total U.S. business revenue in 2000. The most important finding showed that a proportion of employers start as nonemployers, grow over time, and eventually transition to employer status. It found about 3 percent of the nonemployers became employers (“migrants”) by hiring paid workers within three years of operation. These “migrants” accounted for 28 percent of firms and 20 percent of revenues among young employers (at most three years since first hire). About 2 percent of employers (2 percent of revenue) migrated to nonemployer status. The study also found that revenues of “migrant” firms grew rapidly in the year prior to migration (31 percent) and in the transition year (101 percent), which was much higher than contemporaneous growth among other nonemployers. Like other studies, it found higher death rates for nonemployer firms than for employers.
5. Survey of Business Owners 2002 The 2002 SBO was part of the Economic Census. These databases are constructed from the 2002 tax filings of individual proprietorships, partnerships, or any type of corporation with at least $1,000 in revenues. This is different from the Kauffman Index, which uses household survey data on individuals. The survey captured numbers of existing businesses—changes over time reflect more (or less) business formation, less (or more) business terminations, or a combination. This contrasts with the Kauffman Index, which captures only “entry.”

7
The SBO included all firms with receipts of $1,000 or more, which could include side businesses owned by wage/salaried workers, the unemployed, and the retired; these are excluded in the Kauffman Index, which uses time allocation as a screening criterion. Unlike the Kauffman Index, it excluded agricultural and other types of business. The following paragraphs summarize the important findings of the SBO. The results show that about 60 percent of U.S. businesses were self-financed—those using their own or family finances or assets to start or acquire businesses. Employers were most likely to be self-made (77.3 percent), compared with nonemployers (59.2 percent). Self-financed firms were prevalent in four industries: accommodation and food services (79 percent); manufacturing (78 percent); wholesale trade (74 percent); and retail trade (72 percent). About 9 percent of all businesses used credit card debt and at least 11 percent (22 percent of employers and 8 percent of nonemployers) took bank loans. Most surprisingly, almost 28 percent of all businesses (12 percent of employers and 33 percent of nonemployers) started or acquired their business with no capital at all. The respondent businesses employed workers from different sources. Permanent employment was the most preferred but other methods supplemented the labor needs of businesses. For example, about 34 percent of all employers (60 percent in the construction industry) used contractors, subcontractors, independent contractors, and/or outside consultants to supplement their workforces. Other preferred staffing methods included paid day laborers and temporary staffing from leasing services or professional organizations. About 17 percent of manufacturing and 12 percent of wholesale trade employers used temporary help services. People formed businesses for various reasons. Approximately two-fifths of the nonemployer firms reported being in business either as an income-generating hobby (9.2 percent) or to supplement their income (29 percent).
4 The Theory It was perhaps Boyan Jovanovic (1982) who first posited a theory of firm selection and industry evolution where agents select into entrepreneurship. A central feature of the model is that a new firm does not know what its cost function is—that is, its relative efficiency—but rather discovers this through the process of learning from its actual post-entry performance. In particular, entrepreneurs are unsure about their ability to manage a new-firm start-up and therefore their prospects for success. Although entrepreneurs may launch a new firm based on a vague sense of expected post-entry performance, they only discover their true ability once their business is established. Two other issues influence the start-up decision. First, because of asymmetric information, agents and organizations differ on their capacity and abilities to form opinions about the value of information. Second, because economic agents are heterogeneous, the tendency toward different beliefs in evaluating certain information does not converge. Agents have varied personal characteristics and different experiences that shape the lens through which they evaluate where to get new information and how to assess it. That is, reasonable people confronted with the same information may evaluate it very differently (Audretsch, 1995).
8
This diversity is a source of a high degree of turbulence in the economy and a symptom of the skewed size distribution of firms, that is, the large number of very small firms and the small number of larger firms. This supports a view of industry evolution where firms start out at a very small scale of output and exit (revolving door) unless they can overcome the underlying technological, scale, and demand conditions in the economy. Therefore, nonemployer firms may represent a gateway in the post-entry performance of firms as employer firms.
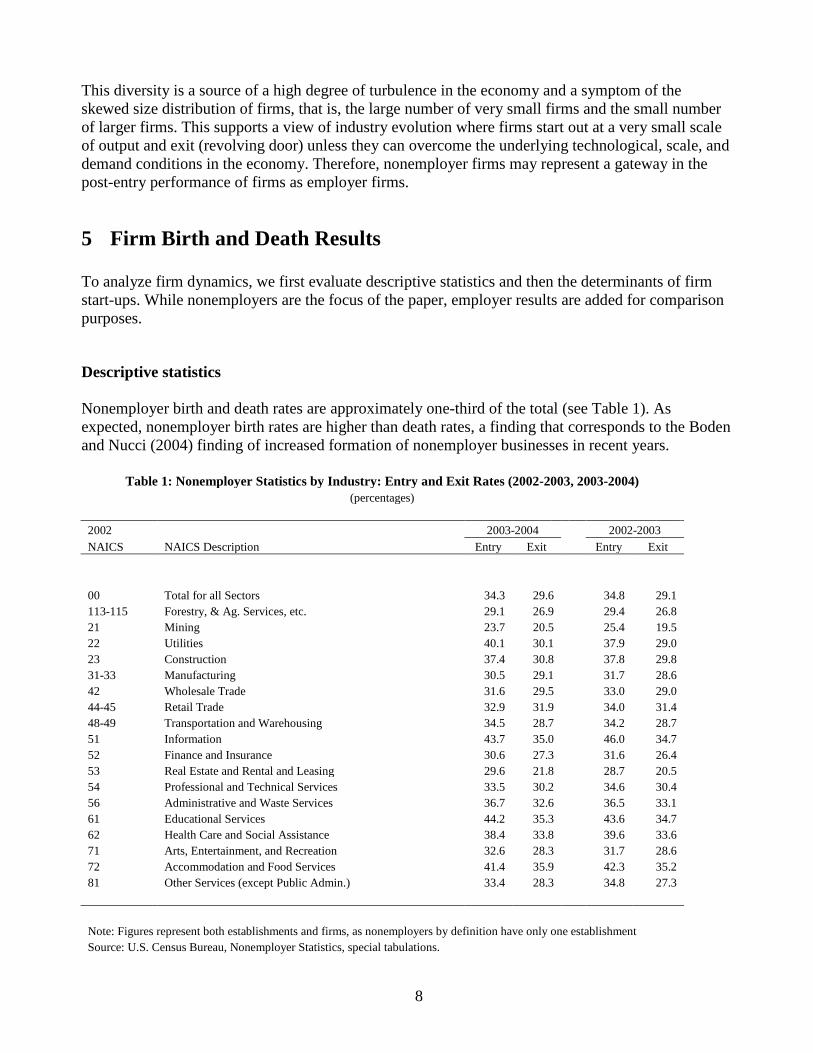
5 Firm Birth and Death Results To analyze firm dynamics, we first evaluate descriptive statistics and then the determinants of firm start-ups. While nonemployers are the focus of the paper, employer results are added for comparison purposes. Descriptive statistics Nonemployer birth and death rates are approximately one-third of the total (see Table 1). As expected, nonemployer birth rates are higher than death rates, a finding that corresponds to the Boden and Nucci (2004) finding of increased formation of nonemployer businesses in recent years.
Table 1: Nonemployer Statistics by Industry: Entry and Exit Rates (2002-2003, 2003-2004) (percentages)
2002 2003-2004 2002-2003 NAICS NAICS Description Entry Exit Entry Exit 00 Total for all Sectors 34.3 29.6 34.8 29.1 113-115 Forestry, & Ag. Services, etc. 29.1 26.9 29.4 26.8 21 Mining 23.7 20.5 25.4 19.5 22 Utilities 40.1 30.1 37.9 29.0 23 Construction 37.4 30.8 37.8 29.8 31-33 Manufacturing 30.5 29.1 31.7 28.6 42 Wholesale Trade 31.6 29.5 33.0 29.0 44-45 Retail Trade 32.9 31.9 34.0 31.4 48-49 Transportation and Warehousing 34.5 28.7 34.2 28.7 51 Information 43.7 35.0 46.0 34.7 52 Finance and Insurance 30.6 27.3 31.6 26.4 53 Real Estate and Rental and Leasing 29.6 21.8 28.7 20.5 54 Professional and Technical Services 33.5 30.2 34.6 30.4 56 Administrative and Waste Services 36.7 32.6 36.5 33.1 61 Educational Services 44.2 35.3 43.6 34.7 62 Health Care and Social Assistance 38.4 33.8 39.6 33.6 71 Arts, Entertainment, and Recreation 32.6 28.3 31.7 28.6 72 Accommodation and Food Services 41.4 35.9 42.3 35.2 81 Other Services (except Public Admin.) 33.4 28.3 34.8 27.3
Note: Figures represent both establishments and firms, as nonemployers by definition have only one establishment Source: U.S. Census Bureau, Nonemployer Statistics, special tabulations.
9
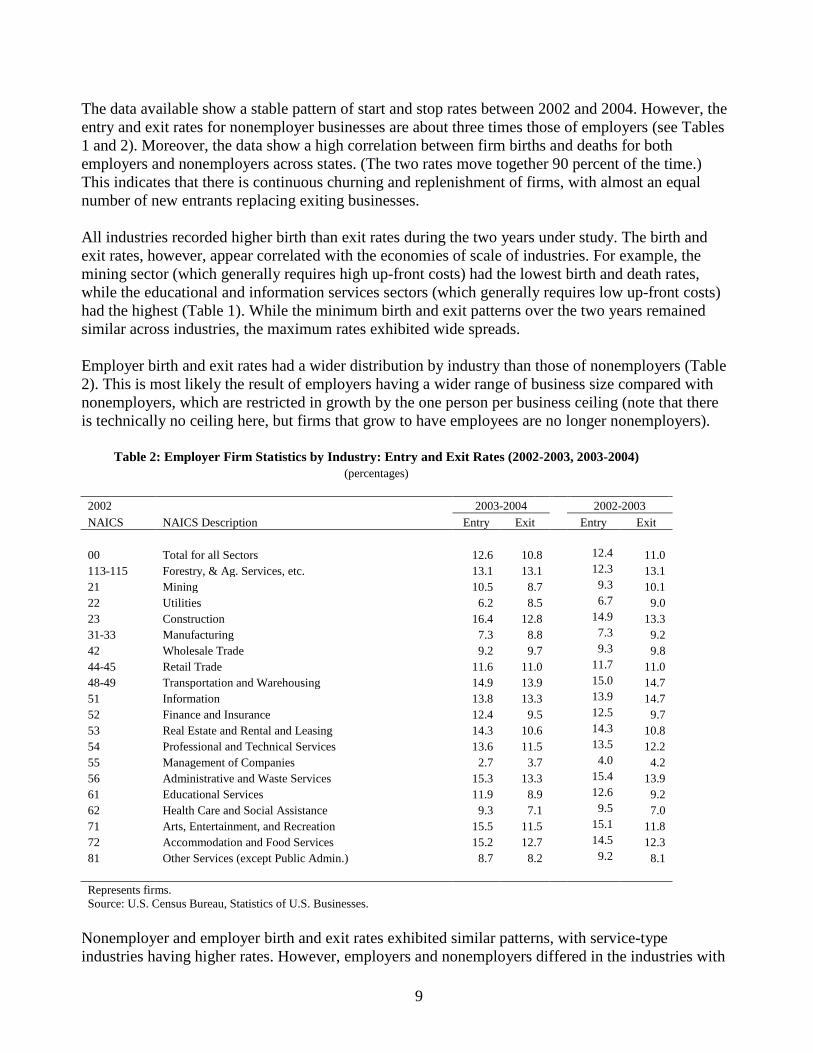
The data available show a stable pattern of start and stop rates between 2002 and 2004. However, the entry and exit rates for nonemployer businesses are about three times those of employers (see Tables 1 and 2). Moreover, the data show a high correlation between firm births and deaths for both employers and nonemployers across states. (The two rates move together 90 percent of the time.) This indicates that there is continuous churning and replenishment of firms, with almost an equal number of new entrants replacing exiting businesses. All industries recorded higher birth than exit rates during the two years under study. The birth and exit rates, however, appear correlated with the economies of scale of industries. For example, the mining sector (which generally requires high up-front costs) had the lowest birth and death rates, while the educational and information services sectors (which generally requires low up-front costs) had the highest (Table 1). While the minimum birth and exit patterns over the two years remained similar across industries, the maximum rates exhibited wide spreads. Employer birth and exit rates had a wider distribution by industry than those of nonemployers (Table 2). This is most likely the result of employers having a wider range of business size compared with nonemployers, which are restricted in growth by the one person per business ceiling (note that there is technically no ceiling here, but firms that grow to have employees are no longer nonemployers).
Table 2: Employer Firm Statistics by Industry: Entry and Exit Rates (2002-2003, 2003-2004) (percentages)
2002 2003-2004 2002-2003 NAICS NAICS Description Entry Exit Entry Exit 00 Total for all Sectors 12.6 10.8 12.4 11.0 113-115 Forestry, & Ag. Services, etc. 13.1 13.1 12.3 13.1 21 Mining 10.5 8.7 9.3 10.1 22 Utilities 6.2 8.5 6.7 9.0 23 Construction 16.4 12.8 14.9 13.3 31-33 Manufacturing 7.3 8.8 7.3 9.2 42 Wholesale Trade 9.2 9.7 9.3 9.8 44-45 Retail Trade 11.6 11.0 11.7 11.0 48-49 Transportation and Warehousing 14.9 13.9 15.0 14.7 51 Information 13.8 13.3 13.9 14.7 52 Finance and Insurance 12.4 9.5 12.5 9.7 53 Real Estate and Rental and Leasing 14.3 10.6 14.3 10.8 54 Professional and Technical Services 13.6 11.5 13.5 12.2 55 Management of Companies 2.7 3.7 4.0 4.2 56 Administrative and Waste Services 15.3 13.3 15.4 13.9 61 Educational Services 11.9 8.9 12.6 9.2 62 Health Care and Social Assistance 9.3 7.1 9.5 7.0 71 Arts, Entertainment, and Recreation 15.5 11.5 15.1 11.8 72 Accommodation and Food Services 15.2 12.7 14.5 12.3 81 Other Services (except Public Admin.) 8.7 8.2 9.2 8.1 Represents firms. Source: U.S. Census Bureau, Statistics of U.S. Businesses.
Nonemployer and employer birth and exit rates exhibited similar patterns, with service-type industries having higher rates. However, employers and nonemployers differed in the industries with
10
the highest and lowest rates (Tables 1 and 2). For employers, construction, transportation and warehousing, and administrative and waste services had the highest employer birth and exit rates (Table 2). The management of companies and health care and social assistance industries recorded the lowest entry and exit rates among employers. States reported wide variations in business formation and terminations. Florida and Nevada reported the highest birth and exit rates for both employers and nonemployers over the period of analysis (Tables 3 and 4). The most likely explanation for this pattern would be the economic structure of the states, which favors service-type industries and their rapid economic growth. Vermont and Maine, in contrast, had the lowest rates. It is clear from the data that states in warmer climes in general had higher turnover. Georgia and Texas joined Florida and Nevada in the top five states with the highest turnover rates, while the East Coast states reported low turnover rates, with Pennsylvania and Connecticut in the five states with the lowest turnover rates.

11
Table 3: Nonemployer Statistics by State: Entry and Exit Rates (2002-2003, 2003-2004) (percentages)
2003-2004 2002-2003 2003-2004 2002-2003 Entry Exit Entry Exit Entry Exit Entry Exit United States 34.3 29.6 34.8 29.1 Alabama 36.8 31.8 37.1 31.4 Montana 30.3 27.4 31.1 26.9 Alaska 33.2 30.4 34.3 30.1 Nebraska 31.1 27.6 31.1 27.7 Arizona 36.8 31.5 38.6 31.2 Nevada 39.6 33.6 41.3 32.8 Arkansas 34.1 30.1 34.7 30.0 New Hampshire 28.9 25.7 30.8 25.2 California 34.0 28.5 34.4 28.1 New Jersey 32.2 28.6 33.1 27.9 Colorado 34.4 30.2 35.6 30.0 New Mexico 34.2 30.2 34.3 30.7 Connecticut 29.0 25.4 29.7 25.2 New York 32.8 29.0 33.7 28.2 Delaware 32.7 28.8 34.2 28.1 North Carolina 34.7 29.5 35.1 29.5 District of Columbia 38.9 33.9 38.0 35.0 North Dakota 29.7 26.2 28.8 26.7 Florida 41.4 34.1 39.6 34.0 Ohio 32.4 28.7 32.7 28.3 Georgia 40.1 32.9 41.0 32.4 Oklahoma 33.4 29.7 34.4 29.4 Hawaii 31.0 26.9 31.5 26.6 Oregon 32.0 27.9 31.8 28.2 Idaho 34.3 30.0 35.3 29.6 Pennsylvania 29.1 25.5 29.2 25.1 Illinois 34.8 29.6 35.4 29.1 Rhode Island 30.1 27.2 30.8 26.9 Indiana 32.5 29.4 32.9 29.3 South Carolina 34.6 30.2 35.3 29.8 Iowa 29.7 26.3 30.1 26.4 South Dakota 30.6 26.9 30.1 26.7 Kansas 31.4 28.0 31.9 27.8 Tennessee 33.9 29.5 35.2 29.3 Kentucky 32.2 28.9 33.1 28.3 Texas 37.4 32.0 39.3 31.4 Louisiana 35.5 33.6 36.8 30.9 Utah 37.6 31.7 38.4 31.8 Maine 27.7 24.2 28.1 24.2 Vermont 26.0 23.2 27.3 23.3 Maryland 34.9 30.1 35.6 29.3 Virginia 35.1 30.0 36.2 29.4 Massachusetts 30.0 26.2 30.7 25.5 Washington 33.3 28.8 33.6 28.6 Michigan 34.3 29.3 34.4 29.3 West Virginia 30.3 28.7 31.1 28.6 Minnesota 31.1 27.5 32.2 27.3 Wisconsin 29.7 25.1 29.7 25.0 Mississippi 35.6 33.9 37.0 31.6 Wyoming 32.4 29.3 33.1 29.5 Missouri 33.3 29.2 34.3 29.1
Note: Figures represent both establishments and firms as nonemployers by definition have only one establishment. Source: U.S. Census Bureau, Nonemployer Statistics special tabulations.
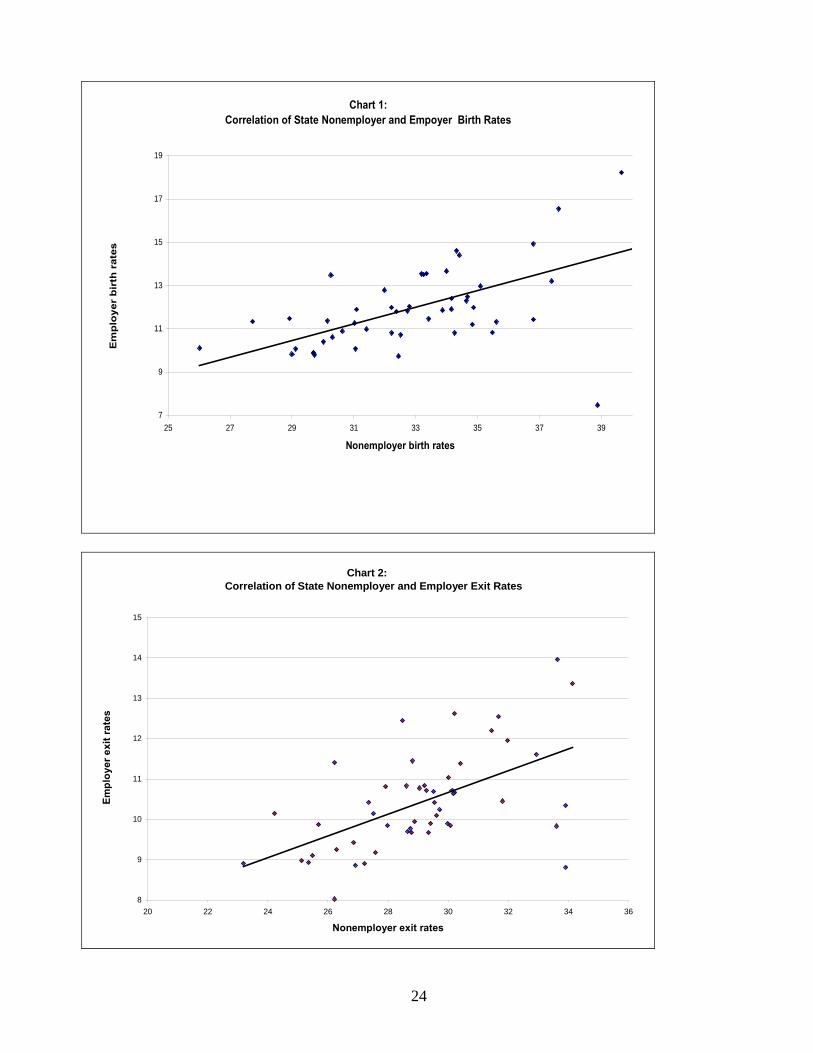
Like the industry findings, state birth and exit rates were similar and highly correlated in both periods of analysis (see Charts 1 and 2 in the appendix). Exit rates exhibited a wider distribution (Chart 2), indicating differences not only in industry structure but also in economic conditions.

12
Table 4: Employer Statistics Estimated by State: Entry and Exit Rates (2002-2003, 2003-2004) (percentages)
2003-2004 2002-2003 2003-2004 2002-2003 Entry Exit Entry Exit Entry Exit Entry Exit United States 13.0 11.3 13.0 11.7 Alabama 11.4 10.5 11.7 11.0 Montana 13.5 10.4 12.8 10.4 Alaska 13.5 11.4 13.8 12.1 Nebraska 10.1 9.2 10.3 9.2 Arizona 14.9 12.2 14.9 13.1 Nevada 18.2 14.0 18.7 13.9 Arkansas 11.9 10.7 12.3 11.0 New Hampshire 11.5 9.9 10.9 10.4 California 13.7 12.4 14.1 12.5 New Jersey 12.0 10.8 11.7 11.2 Colorado 14.4 12.6 14.6 13.0 New Mexico 12.4 10.7 12.3 11.2 Connecticut 9.8 8.9 9.2 9.7 New York 12.0 10.8 12.2 10.7 Delaware 11.8 9.7 12.0 10.1 North Carolina 12.5 10.7 12.3 11.4 District of Columbia 7.5 8.8 8.1 8.7 North Dakota 9.9 8.0 8.9 8.4 Florida 18.4 13.4 17.1 13.7 Ohio 9.7 9.7 9.9 10.1 Georgia 14.5 11.6 14.5 12.5 Oklahoma 11.5 10.2 11.7 10.9 Hawaii 11.3 9.4 11.7 9.7 Oregon 12.8 10.8 13.1 11.2 Idaho 14.6 11.0 15.1 11.7 Pennsylvania 10.1 9.1 9.8 9.6 Illinois 11.2 10.1 10.9 10.3 Rhode Island 11.4 8.9 10.7 9.5 Indiana 10.7 9.9 10.7 10.3 South Carolina 12.3 10.6 12.5 11.1 Iowa 9.8 9.2 10.1 9.4 South Dakota 10.9 8.9 10.6 9.8 Kansas 11.0 9.8 11.1 10.6 Tennessee 11.9 10.4 11.7 11.4 Kentucky 10.8 9.9 10.6 10.5 Texas 13.2 12.0 13.6 12.3 Louisiana 10.8 9.8 11.1 10.2 Utah 16.5 12.5 17.0 13.2 Maine 11.3 10.2 11.4 10.1 Vermont 10.1 8.9 10.5 9.3 Maryland 12.0 9.8 12.0 10.1 Virginia 13.0 9.9 12.4 10.7 Massachusetts 10.4 11.4 11.5 9.7 Washington 13.6 11.4 13.6 12.1 Michigan 10.8 10.7 11.0 10.8 West Virginia 10.6 9.8 10.0 10.7 Minnesota 11.9 10.1 12.0 10.3 Wisconsin 9.9 9.0 9.9 9.8 Mississippi 11.3 10.3 11.9 11.0 Wyoming 11.8 9.7 12.0 10.6 Missouri 13.5 10.8 13.0 11.3
Establishment births to firms with fewer than 500 employees are used a proxy for total firm births. The accuracy of this estimation method can be seen by comparing the U.S. figure in Table 2. Source: U.S. Census Bureau, Statistics of U.S. Businesses.
Similar to employer firm births and exits, the average size (in total annual receipts) of nonemployer exits is greater then the average size of nonemployer births (Table 5). This is not surprising, as firms tend to start in measured steps and likely were not in business for the entire first calendar year. Receipt sizes for births by industry had a wide range and averaged about $55,400. The smallest businesses ($8,000) entered the educational services sector and the largest entries ($63,000) were in the wholesale trade sector.
13
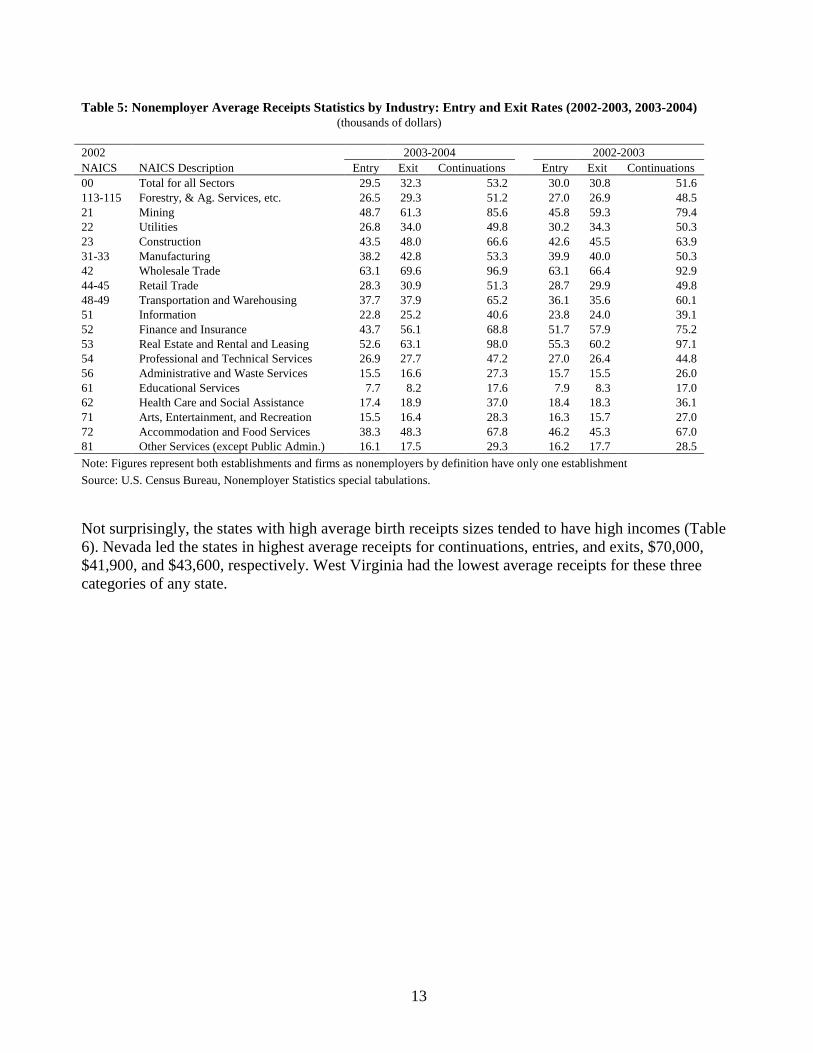
Table 5: Nonemployer Average Receipts Statistics by Industry: Entry and Exit Rates (2002-2003, 2003-2004)
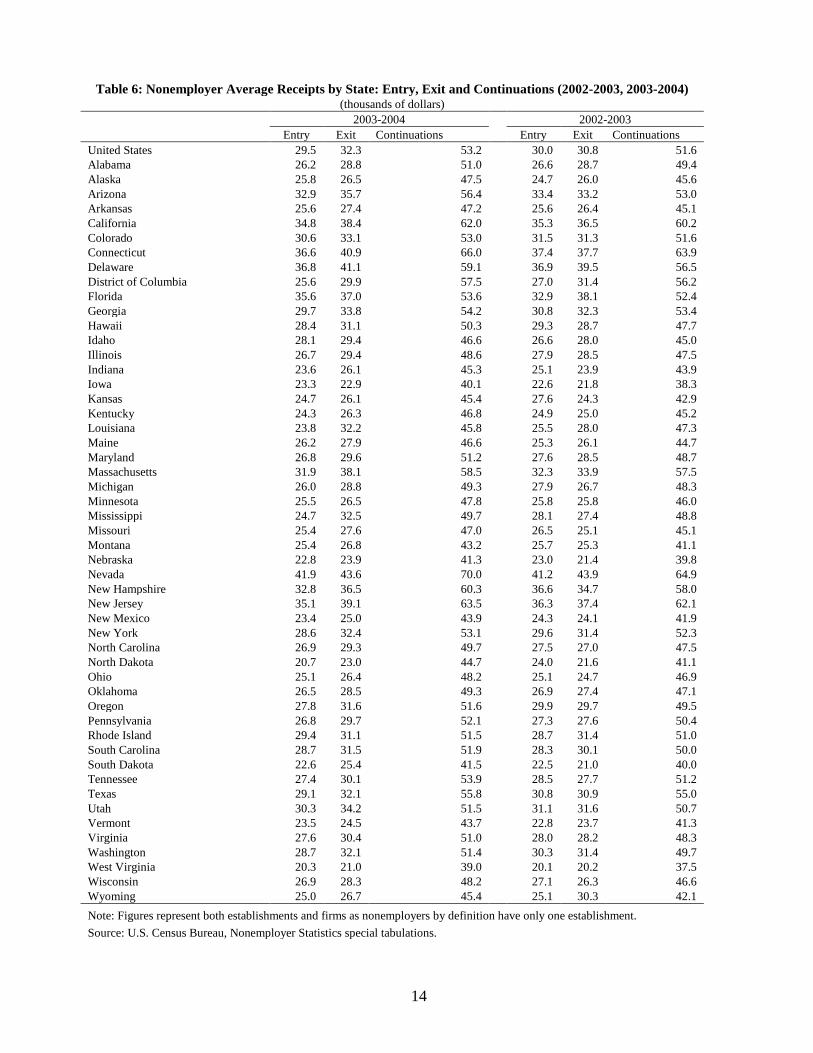
(thousands of dollars) 2002 2003-2004 2002-2003 NAICS NAICS Description Entry Exit Continuations Entry Exit Continuations 00 Total for all Sectors 29.5 32.3 53.2 30.0 30.8 51.6 113-115 Forestry, & Ag. Services, etc. 26.5 29.3 51.2 27.0 26.9 48.5 21 Mining 48.7 61.3 85.6 45.8 59.3 79.4 22 Utilities 26.8 34.0 49.8 30.2 34.3 50.3 23 Construction 43.5 48.0 66.6 42.6 45.5 63.9 31-33 Manufacturing 38.2 42.8 53.3 39.9 40.0 50.3 42 Wholesale Trade 63.1 69.6 96.9 63.1 66.4 92.9 44-45 Retail Trade 28.3 30.9 51.3 28.7 29.9 49.8 48-49 Transportation and Warehousing 37.7 37.9 65.2 36.1 35.6 60.1 51 Information 22.8 25.2 40.6 23.8 24.0 39.1 52 Finance and Insurance 43.7 56.1 68.8 51.7 57.9 75.2 53 Real Estate and Rental and Leasing 52.6 63.1 98.0 55.3 60.2 97.1 54 Professional and Technical Services 26.9 27.7 47.2 27.0 26.4 44.8 56 Administrative and Waste Services 15.5 16.6 27.3 15.7 15.5 26.0 61 Educational Services 7.7 8.2 17.6 7.9 8.3 17.0 62 Health Care and Social Assistance 17.4 18.9 37.0 18.4 18.3 36.1 71 Arts, Entertainment, and Recreation 15.5 16.4 28.3 16.3 15.7 27.0 72 Accommodation and Food Services 38.3 48.3 67.8 46.2 45.3 67.0 81 Other Services (except Public Admin.) 16.1 17.5 29.3 16.2 17.7 28.5 Note: Figures represent both establishments and firms as nonemployers by definition have only one establishment Source: U.S. Census Bureau, Nonemployer Statistics special tabulations. Not surprisingly, the states with high average birth receipts sizes tended to have high incomes (Table 6). Nevada led the states in highest average receipts for continuations, entries, and exits, $70,000, $41,900, and $43,600, respectively. West Virginia had the lowest average receipts for these three categories of any state.
14
Table 6: Nonemployer Average Receipts by State: Entry, Exit and Continuations (2002-2003, 2003-2004) (thousands of dollars)
2003-2004 2002-2003 Entry Exit Continuations Entry Exit Continuations United States 29.5 32.3 53.2 30.0 30.8 51.6 Alabama 26.2 28.8 51.0 26.6 28.7 49.4 Alaska 25.8 26.5 47.5 24.7 26.0 45.6 Arizona 32.9 35.7 56.4 33.4 33.2 53.0 Arkansas 25.6 27.4 47.2 25.6 26.4 45.1 California 34.8 38.4 62.0 35.3 36.5 60.2 Colorado 30.6 33.1 53.0 31.5 31.3 51.6 Connecticut 36.6 40.9 66.0 37.4 37.7 63.9 Delaware 36.8 41.1 59.1 36.9 39.5 56.5 District of Columbia 25.6 29.9 57.5 27.0 31.4 56.2 Florida 35.6 37.0 53.6 32.9 38.1 52.4 Georgia 29.7 33.8 54.2 30.8 32.3 53.4 Hawaii 28.4 31.1 50.3 29.3 28.7 47.7 Idaho 28.1 29.4 46.6 26.6 28.0 45.0 Illinois 26.7 29.4 48.6 27.9 28.5 47.5 Indiana 23.6 26.1 45.3 25.1 23.9 43.9 Iowa 23.3 22.9 40.1 22.6 21.8 38.3 Kansas 24.7 26.1 45.4 27.6 24.3 42.9 Kentucky 24.3 26.3 46.8 24.9 25.0 45.2 Louisiana 23.8 32.2 45.8 25.5 28.0 47.3 Maine 26.2 27.9 46.6 25.3 26.1 44.7 Maryland 26.8 29.6 51.2 27.6 28.5 48.7 Massachusetts 31.9 38.1 58.5 32.3 33.9 57.5 Michigan 26.0 28.8 49.3 27.9 26.7 48.3 Minnesota 25.5 26.5 47.8 25.8 25.8 46.0 Mississippi 24.7 32.5 49.7 28.1 27.4 48.8 Missouri 25.4 27.6 47.0 26.5 25.1 45.1 Montana 25.4 26.8 43.2 25.7 25.3 41.1 Nebraska 22.8 23.9 41.3 23.0 21.4 39.8 Nevada 41.9 43.6 70.0 41.2 43.9 64.9 New Hampshire 32.8 36.5 60.3 36.6 34.7 58.0 New Jersey 35.1 39.1 63.5 36.3 37.4 62.1 New Mexico 23.4 25.0 43.9 24.3 24.1 41.9 New York 28.6 32.4 53.1 29.6 31.4 52.3 North Carolina 26.9 29.3 49.7 27.5 27.0 47.5 North Dakota 20.7 23.0 44.7 24.0 21.6 41.1 Ohio 25.1 26.4 48.2 25.1 24.7 46.9 Oklahoma 26.5 28.5 49.3 26.9 27.4 47.1 Oregon 27.8 31.6 51.6 29.9 29.7 49.5 Pennsylvania 26.8 29.7 52.1 27.3 27.6 50.4 Rhode Island 29.4 31.1 51.5 28.7 31.4 51.0 South Carolina 28.7 31.5 51.9 28.3 30.1 50.0 South Dakota 22.6 25.4 41.5 22.5 21.0 40.0 Tennessee 27.4 30.1 53.9 28.5 27.7 51.2 Texas 29.1 32.1 55.8 30.8 30.9 55.0 Utah 30.3 34.2 51.5 31.1 31.6 50.7 Vermont 23.5 24.5 43.7 22.8 23.7 41.3 Virginia 27.6 30.4 51.0 28.0 28.2 48.3 Washington 28.7 32.1 51.4 30.3 31.4 49.7 West Virginia 20.3 21.0 39.0 20.1 20.2 37.5 Wisconsin 26.9 28.3 48.2 27.1 26.3 46.6 Wyoming 25.0 26.7 45.4 25.1 30.3 42.1 Note: Figures represent both establishments and firms as nonemployers by definition have only one establishment. Source: U.S. Census Bureau, Nonemployer Statistics special tabulations.
15
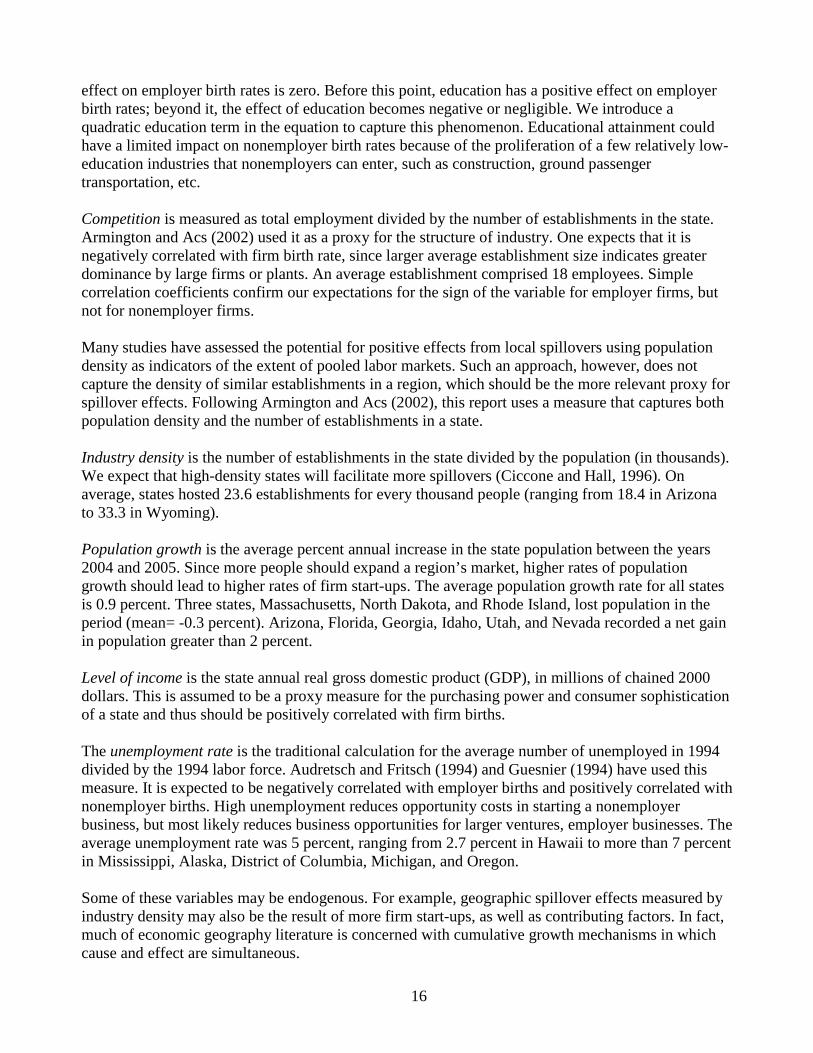
Regression estimation results To investigate the determinants of firm start-ups, we estimated a model where the dependent variable is the annual firm birth rate regressed on selected independent variables. The independent variables capture the human capital of a geographic region and control for local economic conditions. We expect employer firm start-ups and nonemployer firm start-ups to have differing determinants. The Census Survey of Business Owners shows that employer firms and nonemployer firms have different characteristics. Nonemployers tend to be younger, have younger owners, are more likely to be home-based, and are less likely to rely upon financing. Dependent variable Our dependent variable is firm birth rates, measured in two ways. The first measure takes the “labor market” approach by dividing the number of firm births by the labor force (in thousands). This is analogous to the method used by Keeble and Walker, 1994; Davidson et al., 1994; and Armington and Acs, 2002. The second measure uses the “ecological” approach, which divides the total firm births by the total establishments in the state (in percentages). Armington and Acs (2002) used the latter approach and it is the preferred one for the present report. The average firm birth rate across states was 11.3 percent for employers and 33.5 percent for nonemployers. The employer birth rates vary from 9 percent in Iowa to 17 percent in Nevada. Vermont has the lowest nonemployer firm birth rate at 26 percent and New Hampshire and Florida have the highest rates at about 41 percent. Description of the independent variables Human Capital is a proxy for the technological conditions in the economy. The first measure is the share of adults with high school degree or none, defined as the number of adults with at most a high school degree in 2003 divided by the number of adults. An education level of high school or less has been used as a proxy for unskilled and semi-skilled labor, and should be negatively related to the birth rate. In 2003, the mean percentage of the population with at most a high school degree was 45 percent across states. Its simple correlation with the firm birth rate is significantly negative—minus 0.27 (minus 0.20 using the labor force approach) for employer firms and negligible and not significant for nonemployer firms. The second measure of the average educational attainment of a state is the share of college graduates, defined as the number of adults with bachelor’s degrees in 2003 divided by the total number of adults. This measure is a proxy for both the technical skills necessary for economic growth and the skill needed to start and build a business. In 2003 an average of 25.3 percent of the adult population held at least a bachelors degree, but this measure varied greatly across states (from a low of 15 percent in Wyoming to a high of 52.1 percent in Delaware). However, its simple correlation with the birth rates is negative and negligible for both employer and nonemployer firms. In our regression estimations, we assumed that educational attainment has a diminishing effect on employer birth rates. That is, there is always a positive value of educational attainment where the
16
effect on employer birth rates is zero. Before this point, education has a positive effect on employer birth rates; beyond it, the effect of education becomes negative or negligible. We introduce a quadratic education term in the equation to capture this phenomenon. Educational attainment could have a limited impact on nonemployer birth rates because of the proliferation of a few relatively low-education industries that nonemployers can enter, such as construction, ground passenger transportation, etc. Competition is measured as total employment divided by the number of establishments in the state. Armington and Acs (2002) used it as a proxy for the structure of industry. One expects that it is negatively correlated with firm birth rate, since larger average establishment size indicates greater dominance by large firms or plants. An average establishment comprised 18 employees. Simple correlation coefficients confirm our expectations for the sign of the variable for employer firms, but not for nonemployer firms. Many studies have assessed the potential for positive effects from local spillovers using population density as indicators of the extent of pooled labor markets. Such an approach, however, does not capture the density of similar establishments in a region, which should be the more relevant proxy for spillover effects. Following Armington and Acs (2002), this report uses a measure that captures both population density and the number of establishments in a state. Industry density is the number of establishments in the state divided by the population (in thousands). We expect that high-density states will facilitate more spillovers (Ciccone and Hall, 1996). On average, states hosted 23.6 establishments for every thousand people (ranging from 18.4 in Arizona to 33.3 in Wyoming). Population growth is the average percent annual increase in the state population between the years 2004 and 2005. Since more people should expand a region’s market, higher rates of population growth should lead to higher rates of firm start-ups. The average population growth rate for all states is 0.9 percent. Three states, Massachusetts, North Dakota, and Rhode Island, lost population in the period (mean= -0.3 percent). Arizona, Florida, Georgia, Idaho, Utah, and Nevada recorded a net gain in population greater than 2 percent. Level of income is the state annual real gross domestic product (GDP), in millions of chained 2000 dollars. This is assumed to be a proxy measure for the purchasing power and consumer sophistication of a state and thus should be positively correlated with firm births. The unemployment rate is the traditional calculation for the average number of unemployed in 1994 divided by the 1994 labor force. Audretsch and Fritsch (1994) and Guesnier (1994) have used this measure. It is expected to be negatively correlated with employer births and positively correlated with nonemployer births. High unemployment reduces opportunity costs in starting a nonemployer business, but most likely reduces business opportunities for larger ventures, employer businesses. The average unemployment rate was 5 percent, ranging from 2.7 percent in Hawaii to more than 7 percent in Mississippi, Alaska, District of Columbia, Michigan, and Oregon. Some of these variables may be endogenous. For example, geographic spillover effects measured by industry density may also be the result of more firm start-ups, as well as contributing factors. In fact, much of economic geography literature is concerned with cumulative growth mechanisms in which cause and effect are simultaneous.
17
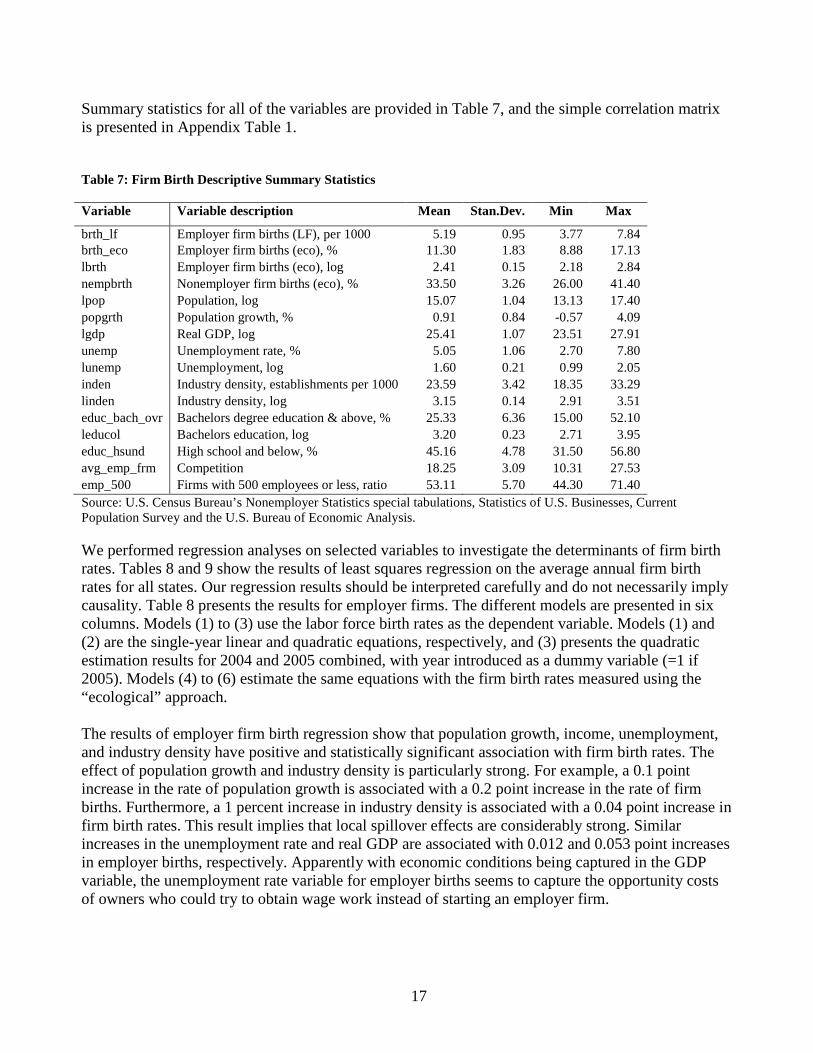
Summary statistics for all of the variables are provided in Table 7, and the simple correlation matrix is presented in Appendix Table 1. Table 7: Firm Birth Descriptive Summary Statistics Variable Variable description Mean Stan.Dev. Min Max
brth_lf Employer firm births (LF), per 1000 5.19 0.95 3.77 7.84 brth_eco Employer firm births (eco), % 11.30 1.83 8.88 17.13 lbrth Employer firm births (eco), log 2.41 0.15 2.18 2.84 nempbrth Nonemployer firm births (eco), % 33.50 3.26 26.00 41.40 lpop Population, log 15.07 1.04 13.13 17.40 popgrth Population growth, % 0.91 0.84 -0.57 4.09 lgdp Real GDP, log 25.41 1.07 23.51 27.91 unemp Unemployment rate, % 5.05 1.06 2.70 7.80 lunemp Unemployment, log 1.60 0.21 0.99 2.05 inden Industry density, establishments per 1000 23.59 3.42 18.35 33.29 linden Industry density, log 3.15 0.14 2.91 3.51 educ_bach_ovr Bachelors degree education & above, % 25.33 6.36 15.00 52.10 leducol Bachelors education, log 3.20 0.23 2.71 3.95 educ_hsund High school and below, % 45.16 4.78 31.50 56.80 avg_emp_frm Competition 18.25 3.09 10.31 27.53 emp_500 Firms with 500 employees or less, ratio 53.11 5.70 44.30 71.40 Source: U.S. Census Bureau’s Nonemployer Statistics special tabulations, Statistics of U.S. Businesses, Current Population Survey and the U.S. Bureau of Economic Analysis. We performed regression analyses on selected variables to investigate the determinants of firm birth rates. Tables 8 and 9 show the results of least squares regression on the average annual firm birth rates for all states. Our regression results should be interpreted carefully and do not necessarily imply causality. Table 8 presents the results for employer firms. The different models are presented in six columns. Models (1) to (3) use the labor force birth rates as the dependent variable. Models (1) and (2) are the single-year linear and quadratic equations, respectively, and (3) presents the quadratic estimation results for 2004 and 2005 combined, with year introduced as a dummy variable (=1 if 2005). Models (4) to (6) estimate the same equations with the firm birth rates measured using the “ecological” approach. The results of employer firm birth regression show that population growth, income, unemployment, and industry density have positive and statistically significant association with firm birth rates. The effect of population growth and industry density is particularly strong. For example, a 0.1 point increase in the rate of population growth is associated with a 0.2 point increase in the rate of firm births. Furthermore, a 1 percent increase in industry density is associated with a 0.04 point increase in firm birth rates. This result implies that local spillover effects are considerably strong. Similar increases in the unemployment rate and real GDP are associated with 0.012 and 0.053 point increases in employer births, respectively. Apparently with economic conditions being captured in the GDP variable, the unemployment rate variable for employer births seems to capture the opportunity costs of owners who could try to obtain wage work instead of starting an employer firm.

18
Table 8: Determinants of Employer Firm Births, by State (1) (2) (3) (4) (5) (6)
Yr2005,
LF lin.
Yr2005,
LF quad.
All years,
LF quad.
Yr2005,
eco lin.
Yr2005,
eco quad.
All years,
eco quad.
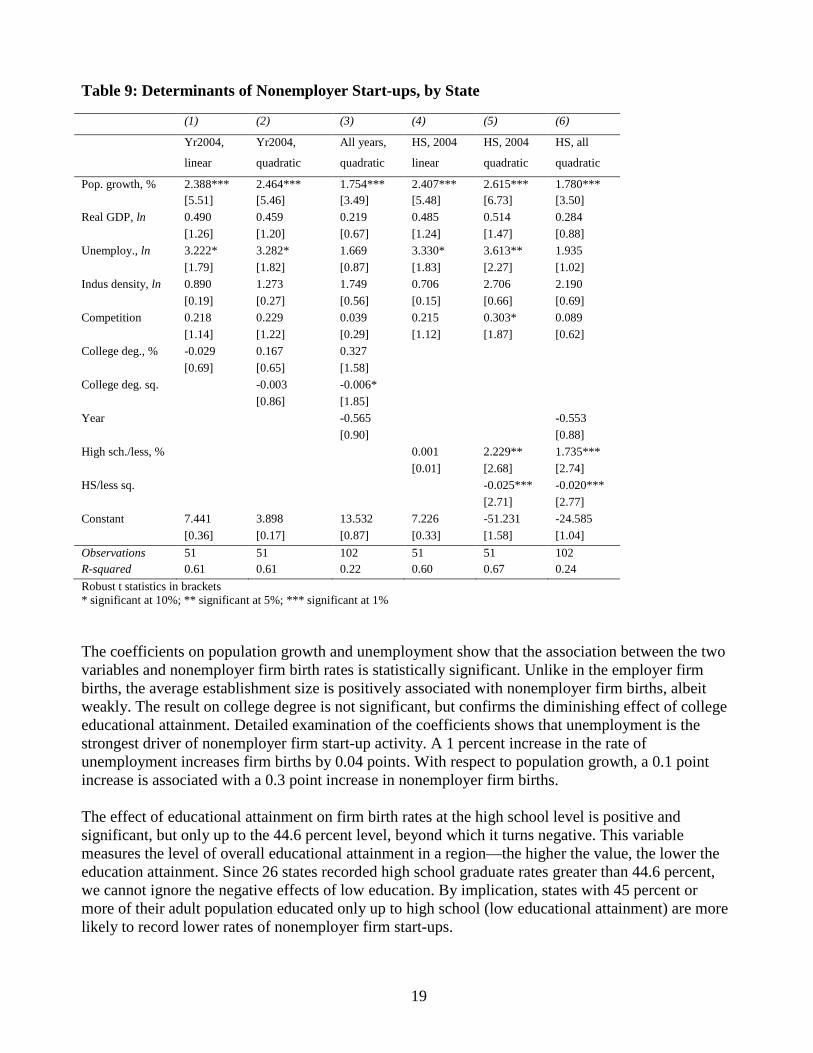
Pop. growth, % 0.843*** 0.865*** 0.846*** 1.921*** 2.001*** 2.020*** [8.06] [7.91] [11.29] [8.86] [9.89] [14.69] Real GDP, ln 0.229** 0.220** 0.218*** 0.562*** 0.529*** 0.536*** [2.32] [2.23] [3.20] [3.49] [3.39] [5.08] Unemployment, ln 0.847** 0.864** 0.812*** 1.097* 1.161** 1.089*** [2.06] [2.12] [2.85] [1.94] [2.22] [2.81] Industry density, ln 5.145*** 5.252*** 4.457*** 3.280* 3.684** 2.422** [4.04] [4.14] [5.61] [1.78] [2.26] [2.21] Competition -0.094* -0.091* -0.111*** -0.145* -0.134* -0.169*** [1.78] [1.77] [3.39] [1.75] [1.84] [3.58] College degree, % -0.004 0.050 0.013 -0.003 0.205** 0.133* [0.49] [0.91] [0.32] [0.11] [2.47] [1.92] College degree sq. -0.001 -0.000 -0.003*** -0.002* [1.09] [0.27] [2.80] [1.79] Year 0.092 0.182 [0.95] [1.16] Constant -17.076*** -18.064*** -14.682*** -14.024* -17.767** -12.518** [3.10] [3.11] [4.00] [1.73] [2.33] [2.45] Observations 51 51 102 51 51 102 R-squared 0.77 0.78 0.77 0.81 0.83 0.83 Robust t statistics in brackets * significant at 10%; ** significant at 5%; *** significant at 1% As expected, establishment size has a negative and significant effect on firm birth rates. Finally, the association between college educational attainment and firm birth is positive and significant. The effect of education, however, diminishes beyond 34.2 percent (the turning point). Four outlier states, with bachelors’ degree holders greater than 34.2 percent of the adult population, influence this behavior. The states include Connecticut, Delaware, Maine, and New Mexico. The magnitude of the effect of college education, however, is not economically significant. The coefficients on the two education terms show that a 1 percentage point increase in the level of college education is associated with a 0.02 percent point increase in firm births. Table 9 presents the regression results for the nonemployer firm birth rates for the years 2003 and 2004. The equation specifications in models (1) to (6) are the same as in Table 2, with the exception of the education variable. Models (1) to (3) use college educational attainment, while models (4) to (6) use the proportion of adults with a high school degree or less. Model (5) is the preferred regression estimation for this analysis.
19
Table 9: Determinants of Nonemployer Start-ups, by State (1) (2) (3) (4) (5) (6)
Yr2004,
linear
Yr2004,
quadratic
All years,
quadratic
HS, 2004
linear
HS, 2004
quadratic
HS, all
quadratic
Pop. growth, % 2.388*** 2.464*** 1.754*** 2.407*** 2.615*** 1.780*** [5.51] [5.46] [3.49] [5.48] [6.73] [3.50] Real GDP, ln 0.490 0.459 0.219 0.485 0.514 0.284 [1.26] [1.20] [0.67] [1.24] [1.47] [0.88] Unemploy., ln 3.222* 3.282* 1.669 3.330* 3.613** 1.935 [1.79] [1.82] [0.87] [1.83] [2.27] [1.02] Indus density, ln 0.890 1.273 1.749 0.706 2.706 2.190 [0.19] [0.27] [0.56] [0.15] [0.66] [0.69] Competition 0.218 0.229 0.039 0.215 0.303* 0.089 [1.14] [1.22] [0.29] [1.12] [1.87] [0.62] College deg., % -0.029 0.167 0.327 [0.69] [0.65] [1.58] College deg. sq. -0.003 -0.006* [0.86] [1.85] Year -0.565 -0.553 [0.90] [0.88] High sch./less, % 0.001 2.229** 1.735*** [0.01] [2.68] [2.74] HS/less sq. -0.025*** -0.020*** [2.71] [2.77] Constant 7.441 3.898 13.532 7.226 -51.231 -24.585 [0.36] [0.17] [0.87] [0.33] [1.58] [1.04] Observations 51 51 102 51 51 102 R-squared 0.61 0.61 0.22 0.60 0.67 0.24 Robust t statistics in brackets * significant at 10%; ** significant at 5%; *** significant at 1% The coefficients on population growth and unemployment show that the association between the two variables and nonemployer firm birth rates is statistically significant. Unlike in the employer firm births, the average establishment size is positively associated with nonemployer firm births, albeit weakly. The result on college degree is not significant, but confirms the diminishing effect of college educational attainment. Detailed examination of the coefficients shows that unemployment is the strongest driver of nonemployer firm start-up activity. A 1 percent increase in the rate of unemployment increases firm births by 0.04 points. With respect to population growth, a 0.1 point increase is associated with a 0.3 point increase in nonemployer firm births. The effect of educational attainment on firm birth rates at the high school level is positive and significant, but only up to the 44.6 percent level, beyond which it turns negative. This variable measures the level of overall educational attainment in a region—the higher the value, the lower the education attainment. Since 26 states recorded high school graduate rates greater than 44.6 percent, we cannot ignore the negative effects of low education. By implication, states with 45 percent or more of their adult population educated only up to high school (low educational attainment) are more likely to record lower rates of nonemployer firm start-ups.
20
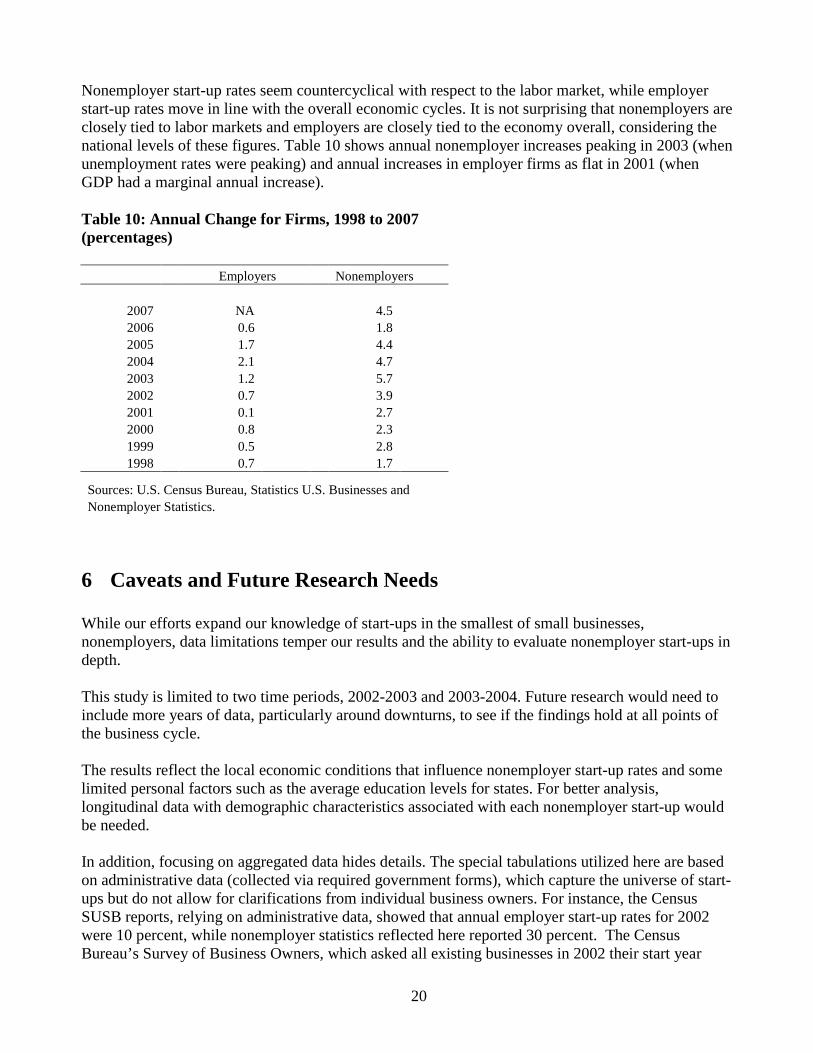
Nonemployer start-up rates seem countercyclical with respect to the labor market, while employer start-up rates move in line with the overall economic cycles. It is not surprising that nonemployers are closely tied to labor markets and employers are closely tied to the economy overall, considering the national levels of these figures. Table 10 shows annual nonemployer increases peaking in 2003 (when unemployment rates were peaking) and annual increases in employer firms as flat in 2001 (when GDP had a marginal annual increase). Table 10: Annual Change for Firms, 1998 to 2007 (percentages) Employers Nonemployers
2007 NA 4.5 2006 0.6 1.8 2005 1.7 4.4 2004 2.1 4.7 2003 1.2 5.7 2002 0.7 3.9 2001 0.1 2.7 2000 0.8 2.3 1999 0.5 2.8 1998 0.7 1.7
Sources: U.S. Census Bureau, Statistics U.S. Businesses and Nonemployer Statistics.
6 Caveats and Future Research Needs While our efforts expand our knowledge of start-ups in the smallest of small businesses, nonemployers, data limitations temper our results and the ability to evaluate nonemployer start-ups in depth. This study is limited to two time periods, 2002-2003 and 2003-2004. Future research would need to include more years of data, particularly around downturns, to see if the findings hold at all points of the business cycle. The results reflect the local economic conditions that influence nonemployer start-up rates and some limited personal factors such as the average education levels for states. For better analysis, longitudinal data with demographic characteristics associated with each nonemployer start-up would be needed. In addition, focusing on aggregated data hides details. The special tabulations utilized here are based on administrative data (collected via required government forms), which capture the universe of start-ups but do not allow for clarifications from individual business owners. For instance, the Census SUSB reports, relying on administrative data, showed that annual employer start-up rates for 2002 were 10 percent, while nonemployer statistics reflected here reported 30 percent. The Census Bureau’s Survey of Business Owners, which asked all existing businesses in 2002 their start year
21
instead of determining it through administrative records, found employer and nonemployer start-up rates were 5 percent and 15.4 percent, respectively. It seems administrative data start-ups often capture the rebirth of shuttered businesses.8
Another angle for future research could focus on the intensity or size of nonemployer start-ups by, for example, aggregated receipts rather than by the number of start-ups, to determine their impact on an industry or local economy.
7 Conclusion This paper documents firm birth rates for nonemployer and employer firms and examines the determinants of both populations. This study is unique in that it focuses not only on employer firm births, but also on the elusive nonemployer births, which are the gateway to entrepreneurship for most. Special tabulations from the U.S. Census Bureau show that nonemployers had an entry rate of 34.3 percent and an exit rate of 29.6 percent from 2003 to 2004. This rate is nearly three times the entry rate of employer firms, which is not surprising, considering that nonemployer ventures are often much smaller ventures. Nonemployer births tended to emulate employer births in some respects but they differed in others. For both nonemployers and employers, birth and death rates across state and industry are highly correlated, with birth rates being higher than death rates. Service-type industries tended to have higher rates for both groups. And the size of firms at death was larger than at birth for both groups. However, employer birth and death rates by industry had a wider distribution than those of nonemployers. A model of the determinants of start-ups for both nonemployers and employers found the most compelling difference between the two groups. Nonemployer start-ups follow and are heavily affected by a state’s unemployment rate. Employer start-ups are also correlated to unemployment rates, but they are also very affected by a state’s overall economic conditions, such as gross domestic product, density of firms, and average size of firms. While this study focused on only two years of data, it did utilize the universe of both nonemployer and employer births. More years of data containing at least a full business cycle would be needed to verify the findings presented here.
8 This is not to say that the rebirth of businesses is not a true birth, but only recognition that administrative data do not allow much in the way of definitional latitude.
22
References Acs, Z. J. & Armington C.
2004. “The impact of geographic differences in human capital on service firm formation rates,” Journal of Urban Economics, 56, 244-78.
Armington, C. & Acs Z. J
., 2002. “The determinants of regional variation in new firm formation,” Reg. Studies 36, 33–45.
Audretsch, D. B., 1995. Innovation and industry evolution, Cambridge: Cambridge University Press. Audretsch, D. B. & Fritsch M
., 1994. “The geography of firm births in Germany,” Reg. Studies 28(4), 359–65.
Boden, R. & Nucci A.
, 2004. “Longitudinal linking of nonemployer data to nonemployer data and the Business Register over time: Some preliminary findings,” Paper Presented at the Eastern Economic Association Annual Meeting, Washington, D.C., February 20, 2004.
Ciccone, C. & Hall, R. E
., 1996. “Productivity and the density of economic activity,” Am. Econ. Rev. 86(1), 54–70.
Davidson, P., Lindmark, L. & Olofsson, C
., 1994. “New firm formation and regional development in Sweden,” Reg. Studies 28(4), 395–410.
Davis, S., Haltiwanger, J., Jarmin, R., Krizan, C.J., Miranda, J., Nucci, A. & Sandusky
, K., 2007. "Measuring the dynamics of young and small businesses: Integrating the employer and nonemployer universes," NBER Working Papers 13226, National Bureau of Economic Research, Inc.
Fairlie, Robert W
., 2008. “Kauffman Index of Entrepreneurial Activity: 1996-2007” (April 24, 2008). Available at SSRN: http://ssrn.com/abstract=1124683.
Glaeser, E. L, Kerr, W. l. R.& Ponzetto, G. 2009. “Creating clusters of entrepreneurship: amenities, education and historical accidents,” Journal of Urban Economics, in press. Guesnier, B
., 1994. “Regional variations in new firm formation in France,” Reg. Studies 28(4), 347–58.
Jovanovic, B. 1982. “Selection and evolution of industry,” Econometrica, 50, 649-670. Headd, B. & Saade, R., 2008, “Do business definition decisions distort small business research results?,” U.S. Small Business Administration, Office of Advocacy working paper. Keeble, D. & Walker, S
., 1994. “New firms, small firms and dead firms: spatial patterns and determinants in the United Kingdom,” Reg. Studies 28(4), 411–27.

23
Appendix Table 1: Correlation matrix of selected variables (1) (2) (3) (4) (5) (6) (7) (8) (9) (10) (1) brth_lf Emp. births, LF 1.00 (2) brth_eco Emp. birth, eco 0.79 1.00 (0.00) (3) nempbrth Nonemp. birth 0.27 0.42 1.00 (0.01) (0.00) (4) popgrth Pop. growth 0.53 0.84 0.40 1.00 (0.00) (0.00) (0.00) (5) lgdp Real GDP -0.21 0.16 0.13 0.04 1.00 (0.04) (0.12) (0.18) (0.69) (6) linden Ind. density 0.42 -0.16 -0.19 -0.30 -0.55 1.00 (0.00) (0.11) (0.05) (0.00) (0.00) (7) lunemp Unemployment -0.21 -0.05 0.10 -0.13 0.37 -0.38 1.00 (0.03) (0.59) (0.32) (0.19) (0.00) (0.00) (8) educ_bach_ovr College educ. 0.03 -0.06 -0.13 -0.10 -0.08 0.18 -0.18 1.00 (0.76) (0.57) (0.18) (0.32) (0.44) (0.07) (0.07) (9) educ_hsund High sch./less -0.27 -0.20 -0.02 -0.06 0.13 -0.20 0.23 -0.77 1.00 (0.01) (0.04) (0.87) (0.52) (0.20) (0.05) (0.02) (0.00) (10) avg_emp_frm Competition -0.51 -0.15 0.09 0.02 0.53 -0.54 0.35 -0.07 0.26 1.00 (0.00) (0.12) (0.35) (0.83) (0.00) (0.00) (0.00) (0.49) (0.01) p-values in parentheses
24
Chart 1: Correlation of State Nonemployer and Empoyer Birth Rates
7
9
11
13
15
17
19
25 27 29 31 33 35 37 39
Nonemployer birth rates
Em
plo
yer
bir
th r
ates
8
9
10
11
12
13
14
15
20 22 24 26 28 30 32 34 36
Nonemployer exit rates
Empl
oyer
exi
t rat
es
Chart 2:Correlation of State Nonemployer and Employer Exit Rates