non-tariff measures in aseanasean.i-tip.org/...non-tariff_measures_in_asean.pdf · chapter 2...
TRANSCRIPT


Non-Tariff Measures in ASEAN
edited by
Lili Yan Ing
and
Santiago Fernandez de Cordoba


© Economic Research Institute for ASEAN and East Asia and United Nations Conference
on Trade and Development, 2016
Published April 2016 The findings, interpretations, and conclusions expressed herein do not necessarily reflect the views and policies of the Economic Research Institute for ASEAN and East Asia, its Governing Board, Academic Advisory Council, or the Institutions and governments they represent. All rights reserved. Material in this publication may be freely quoted or reprinted with proper acknowledgement.
National Library of Indonesia Cataloguing in Publication Data ERIA Research Project FY2015 No.01 ISBN: 978-602-8660-89-1
Cover Art by Artmosphere

iii
Foreword [ERIA]
Over the years, multilateral trade negotiations have helped to substantially reduce
tariff rates. While tariffs have been reduced, the number of non-tariff measures (NTMs) is
increasing and is often blamed to be a source of the lack of integration in ASEAN. Yet, in
spite of their growing number, we generally have little understanding and information,
and thus there is an urgent need to develop a better understanding and transparency of
existing NTMs.
The Economic Research Institute for ASEAN and East Asia (ERIA), in collaboration
with the United Nations Conference for Trade and Development (UNCTAD), and ASEAN
national teams consisting of economists and government officials of ASEAN countries
collected and classified NTMs in the 10 ASEAN countries (Brunei Darussalam, Cambodia,
Indonesia, Lao PDR, Malaysia, Myanmar, the Philippines, Singapore, Thailand, and Viet
Nam) based on the latest Multi Agency Support Team February 2012 classification. They
worked on all regulations and official documents, including international conventions
adopted by countries which had been in effect by January 2015.
The project is led by Lili Yan Ing (ERIA) and Santiago Fernandez de Cordoba
(UNCTAD). The report editing team consists of Rizqy Anandhika and Ruth Elisabeth. The
core team consists of Michelle Ayu Chinta Kristy, Chi Le Ngo, Maxim Gubarev, Fabien
Dumesnil, and Denise Penello-Rial. The project is advanced through the supervision and
comments from Shujiro Urata (ERIA), Olivier Cadot (Lausanne University), Ralf Peters
(UNCTAD), Ponciano Intal, Jr. (ERIA), and Guillermo Valles Galmes (UNCTAD). The
successful work would not have been possible without the invaluable work of national
teams composed of the economists and government officials of ASEAN countries.
The project consists of two phases: NTM data collection (the data were released in
January 2016) and country report (April 2016) and data analyses on how NTMs will affect
trade in the region (January 2017). The project aims to (i) collect, validate, and store
NTM data from official sources; (ii) improve the general understanding of these measures
and their impact on world trade; and (iii) provide insights on NTMs in ASEAN countries.
The project also significantly benefited from the supervision and support of ASEAN
government officials, particularly Sta. Rebecca Fatimah (MITI Malaysia), Sulaimah
Mahmood (MTI Singapore), Donna Gultom (MOT Indonesia), Phuong Van Hoang (MIT

iv
Vietnam), and Mark Ng (MTI Singapore). Along the way of conducting the project, the
initial work and preliminary findings were well endorsed and accepted at the ASEAN’s
Senior Economic Officials Meeting in August 2015 in Kuala Lumpur, at the ASEAN’s High
Level Task Force in January 2016 in Vientiane and East Asian Senior Economic Officials
Meeting in April 2016 in Kuala Lumpur.
This initiative is only the beginning of the journey of ASEAN to improve the
transparency of NTMs. ERIA and UNCTAD will work hand in hand with ASEAN member
states in improving NTM transparency and overall trade environment.
Professor Hidetoshi Nishimura
President of ERIA
Jakarta, April 2016

v
Foreword [UNCTAD]
The ability to gain market access opportunities and to benefit from them,
increasingly depends on compliance with non-tariff measures (NTMs), such as sanitary
and phytosanitary measures and technical regulations. Although many NTMs have
primarily non-trade objectives, such as the protection of public health or the environment,
they may affect trade and represent a major challenge for exporters, importers and
policymakers. It is therefore important to understand the use of NTMs and their
implications for the formulation and implementation of effective development strategies.
Comprehensive, systematic and reliable information about NTMs is unfortunately
scarce to obtain. The collection of NTM data is a highly resource-intensive task and
requires specific, technical knowledge. In this context, the International Classification of
NTMs was developed by several international organizations, the Multi-Agency Support
Team1, in 2006. The collection, classification and analysis of NTMs as well as the
coordination of the global effort to enhance the transparency of NTMs have been a
regular activity of UNCTAD. We are aiming to collect data on NTMs covering at least 90
per cent of world trade by the end of 2016.
ASEAN member countries have resolved to work on the elimination of non-tariff
barriers. The need to create a standardized, high quality, and comprehensive NTMs
dataset of the region called for close cooperation between the Economic Research
Institute for ASEAN and East Asia (ERIA) and UNCTAD.
Since December 2014, ERIA and UNCTAD have collaborated to create a
comprehensive NTMs database of all ASEAN countries. The database presents official
regulations that are currently imposed affecting imported and exported products.
Regulations are classified according to types of measures, affected products at the tariff
line level and partner countries. This enables easy and well-structured access to the
information. It also allows for case-specific and more systemized analysis and research
as well as effective support to policymakers for their efforts in regional and global
economic integration.
1 MAST Group is composed of: Food and Agriculture Organization of the United Nations, International
Monetary Fund, International Trade Centre, Organization for Economic Cooperation and Development, United Nations Conference on Trade and Development, United Nations Industrial Development Organization, World Bank and World Trade Organization.

vi
I am delighted to welcome the publication of this book, which highlights the
accomplishments of this cooperation. It will be an asset for government officials,
researchers and representatives of the private sector aiming to strengthen their
understanding of NTMs, and policy makers involved in the design or negotiation of
policies related to NTMs, even beyond the ASEAN region.
Guillermo Valles Galmes
Director
Division on International Trade
in Goods and Services, and Commodities
United Nations Conference on Trade and Development

vii
Acknowledgements
While tariffs have been reduced, the number of non-tariff measures (NTMs) is
increasing and is often blamed to be a source of the lack of integration in ASEAN. For
NTMs, disciplines on transparency are the key, and regional and multilateral NTM mutual
recognition and harmonisation are the answers. Turning back to 2013, when we started
the project to develop an NTM database for all 10 ASEAN countries within one year was a
kind of ‘mission impossible’. But now, we have successfully developed the NTM database;
above all, we have likewise developed NTM expertise in this region.
The project is led by Lili Yan Ing (ERIA) and Santiago Fernandez de Cordoba
(UNCTAD). The core team consists of Michelle Ayu Chinta Kristy, Rizqy Anandhika, Chi Le
Ngo, Maxim Gubarev, Fabien Dumesnil, and Denise Penello-Rial. The project is advanced
by supervision and comments from Shujiro Urata (ERIA), Olivier Cadot (Lausanne
University), Ponciano Intal, Jr. (ERIA), and Ralf Peters (UNCTAD), Guillermo Valles Galmes
(UNCTAD).
This mission would have definitely been impossible without hard work and
dedication of ASEAN national teams: Brunei Darussalam (Christina Ruth Elisabeth,
Mohammad Yusri Yahya, Noramali dato Jumat); Cambodia (Chap Sotarith, Christina Ruth
Elisabeth, Anika Widiana, Neth Nero, Uy Rthiymony); Indonesia (Ernawati Munadi, Indah
Rahayu, Samroni Salim, Titis Kusuma Lestari, Ayu Shinta Saputri); Lao PDR (Ampahphone
Sayasenh, Saygnasak Sengaloun, Phonesavanth Sittideth, Sonemala Naouanthasing,
Vangchai Vang); Malaysia (Evelyn Shymala Devadason, VGR Chandran, Tang Tuck Cheong,
Ezral Uzaimi); Myanmar (Zin Naing, Cho Thein, Win Min Phyoe); Philippines (Loreli C. de
Dios, Paul Felicitano); Singapore (Hank Lim, Anika Widiana, Bernard Aw, and government
officials); Thailand (Chedtha Intaravitak, Nuttawut Lasanapanyakul, Urairat Jantaraisiri,
Maichanok Krapookthong, Wittawat Prayookwong, Challee Khanksiri); and Viet Nam (Vo
Tri Thanh, Anh Doung Nguyen, Than Binh Minh, Phuong Van Hoang).
The project also significantly benefited from the supervision and support of ASEAN
government officials, particularly Sta. Rebecca Fatimah (MITI Malaysia), Sulaimah
Mahmood (MTI Singapore), Donna Gultom (MOT Indonesia), Phuong Van Hoang (MIT
Vietnam), and Mark Ng (MTI Singapore). Along the way of conducting the project,

viii
Regional Leaders well endorsed and accepted the initial work and preliminary findings at
the ASEAN’s Senior Economic Officials Meeting (SEOM) in August 2015 in Kuala Lumpur,
ASEAN’s High Level Task Force in January 2016 in Vientianne, and lately at the East Asian
SEOM in KL in April 2016.
We would also like to thank the editorial team—Maria Priscila del Rosario, Ainslie
Smith, Fadriani Trianingsih, and Chrestella Budyanto—for putting these country reports
nicely, and our angel, Elisa Ayu, who provided valuable administration support for this
project.
We would also like to extend our gratitude to all ASEAN Member States and
government officials who significantly contributed to the success of this project and
worked together with us to support governments and the business community to have
more transparent NTMs, to have a better understanding of NTMs, to design better NTMs,
to implement NTMs better, and to move forward for better trade and investment policy
and regulations.

ix
List of Project Members
Project Coordinators
Lili Yan Ing (Project Leader): Economic Research Institute for ASEAN and East Asia, Jakarta, Indonesia.
Santiago Fernandez de Cordoba (Project Leader): United Nations Conference on Trade and Development (UNCTAD).
Shujiro Urata (Project Advisor): Waseda University and Economic Research Institute for ASEAN and East Asia (ERIA).
Ralf Peters (Project Advisor): United Nations Conference on Trade and Development (UNCTAD), Geneva, Switzerland.
Project Members
Oliver Cadot : Professor, University of Laussane, CEPR and FERDI. Muhammad Rizqy Anandhika: Economic Research Institute for ASEAN and East Asia,
Jakarta, Indonesia.
Chi Le Ngo: United Nations Conference on Trade and Development (UNCTAD), Geneva, Switzerland.
Denise Penello-Rial: United Nations Conference on Trade and Development (UNCTAD), Geneva, Switzerland.
Fabien Dumesnil: United Nations Conference on Trade and Development (UNCTAD), Geneva, Switzerland.
Maxim Gubarev: United Nations Conference on Trade and Development (UNCTAD), Geneva, Switzerland.
Michelle Kristy: United Nations Conference on Trade and Development (UNCTAD), Geneva, Switzerland.
Brunei Darussalam Christina Ruth Elisabeth: Center for Inclusive and Sustainable
Development (CISDEV) Prasetya Mulya School of Business and Economics, Indonesia.
Cambodia Chap Sotharith: Cambodian Institute for Cooperation and Peace (CICP), Cambodia.
Christina Ruth Elisabeth: Center for Inclusive and Sustainable Development (CISDEV) Prasetya Mulya School of Business and Economics, Indonesia
Anika Widiana: Center for Inclusive and Sustainable Development (CISDEV) Prasetya Mulya School of Business and Economics, Indonesia

x
Indonesia Ernawati Munadi: Wijaya Kusuma University, Surabaya, Indonesia
Lao PDR Amphaphone Sayasenh: National Economic Research Institute, Lao PDR.
Malaysia Evelyn S. Devadason: Faculty of Economics and Administration, University of Malaya, Malaysia.
VGR Chandran: Faculty of Economics and Administration, University of Malaya, Malaysia.
Tang Tuck Cheong: Faculty of Economics and Administration, University of Malaya, Malaysia.
Myanmar Cho Cho Thein: Yangon University of Economics, Myanmar.
Zin Zin Naing: Yangon University of Economics, Myanmar.
Philippines Loreli C. de Dios: Center for the Advancement of Trade Integration and Facilitation, Philippines.
Paul Felicitano: Center for the Advancement of Trade Integration and Facilitation, Philippines.
Singapore Hank Lim: Singapore Institute of International Affairs, Singapore.
Bernard Aw: Singapore Institute of International Affairs, Singapore.
Thailand Chedtha Intaravitak: Thailand Development Research Institute, Thailand.
Viet Nam Vo Tri Thanh: Central Institute for Economic Management, Viet Nam.
Nguyen Anh Duong: Central Institute for Economic Management, Viet Nam.
Tran Binh Minh: Central Institute for Economic Management, Viet Nam.
xi
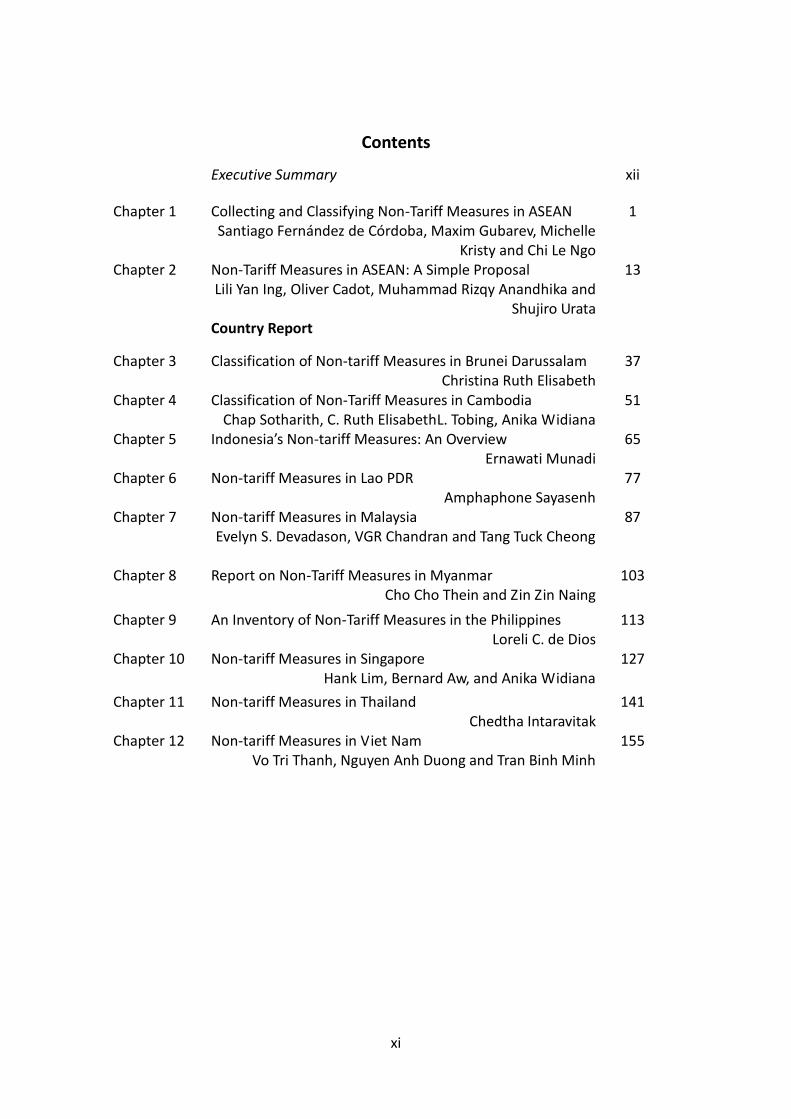
Contents
Executive Summary xii
Chapter 1 Collecting and Classifying Non-Tariff Measures in ASEAN 1 Santiago Fernández de Córdoba, Maxim Gubarev, Michelle
Kristy and Chi Le Ngo
Chapter 2 Non-Tariff Measures in ASEAN: A Simple Proposal 13 Lili Yan Ing, Oliver Cadot, Muhammad Rizqy Anandhika and
Shujiro Urata
Country Report
Chapter 3 Classification of Non-tariff Measures in Brunei Darussalam 37 Christina Ruth Elisabeth Chapter 4 Classification of Non-Tariff Measures in Cambodia 51 Chap Sotharith, C. Ruth ElisabethL. Tobing, Anika Widiana Chapter 5 Indonesia’s Non-tariff Measures: An Overview 65 Ernawati Munadi Chapter 6 Non-tariff Measures in Lao PDR 77 Amphaphone Sayasenh Chapter 7 Non-tariff Measures in Malaysia 87 Evelyn S. Devadason, VGR Chandran and Tang Tuck Cheong Chapter 8 Report on Non-Tariff Measures in Myanmar 103 Cho Cho Thein and Zin Zin Naing
Chapter 9 An Inventory of Non-Tariff Measures in the Philippines 113 Loreli C. de Dios Chapter 10 Non-tariff Measures in Singapore 127 Hank Lim, Bernard Aw, and Anika Widiana
Chapter 11 Non-tariff Measures in Thailand 141 Chedtha Intaravitak Chapter 12 Non-tariff Measures in Viet Nam 155
Vo Tri Thanh, Nguyen Anh Duong and Tran Binh Minh

xii
Executive Summary
Tariffs on regional trade are generally low as they have been progressively
liberalised first under the auspices of the General Agreement on Tariffs and
Trade/World Trade Organization (GATT/WTO) and, subsequently, in the context of
regional and bilateral preferential trade agreements. ASEAN member countries have
made significant progress in the lowering of intra-regional tariffs. The fact that tariff
liberalisation alone has generally been proven insufficient in providing genuine
regional economic integration for many developing countries has drawn further
attention to non-tariff measures (NTMs), of which the WTO disciplines are
comparatively weak. The use of NTMs, especially complex technical, sanitary and
phytosanitary measures, has increased significantly.
As the average tariff rates of ASEAN countries decreased from 8.9 percent in
2000 to 4.5 percent in 2015, the number of NTMs had increased from 1,634 measures
to 5,975 measures over the same period. The increase of NTMs was notable not only in
ASEAN but also around the world, particularly, between 2008 and 2011. The total
number of NTMs in the 10 ASEAN countries was 5,975 measures in 2015 of which 33.2
percent of total measures were in the form of SPS, 43.1 percent were TBT, 12.8 percent
were export measures, and the rest of 10.9 percent were in the form of various
measures.
A country with a relatively higher number of measures does not mean it is
relatively more protectionist than others. Even if a country has a relatively higher
number of percentage of affected products to total products, it does not necessarily
mean it will have relatively lower trade than the others.
Does this mean that all NTMs are benign? Not really. Many regulations are
poorly designed, failing to protect the public while unnecessarily complicating business.
For instance, many countries have complicated rules for pharmaceutical imports that
nevertheless fail to prevent widespread traffic of counterfeits. There are several
reasons for this. First, the governments know little about incentives and even less
about how to design market-based regulations, confusing effective with cumbersome.

xiii
Second, regulations are often enforced in punitive ways, reflecting the anti-business
culture of many administrations. Third, NTMs typically span the competencies of
several ministries, with no coordination mechanisms to make the necessary trade-offs.
A simple proposal in place is NTM streamlining to the national level by
implementing ‘dynamic disciplines’ that review trade and investment policy and
regulations regularly. This could be started by establishing a National Economic Council
(NEC) consisting of divisions on Trade Facilitation, Non-Tariff Measures, National Single
Window, Investment and Trade Agreement/Economic Cooperation. Regional disciplines
on transparency are the key, and NTM mutual recognition and harmonisation are the
answers.


1
CHAPTER 1
Collecting and Classifying Non-tariff Measures in ASEAN
Santiago Fernandez de Cordoba, Maxim Gubarev, Michelle Ayu Chinta
Kristy, and Chi Le Ngo
United Nations Conference on Trade and Development
1.1. Background
Many developing countries have greatly benefited from the integration in the
global economy through international trade in goods and services. In the past, developing
countries’ integration in international markets was made possible by appropriate policies
such as tariff liberalization, as well as initiatives related to trade facilitation and aid for
trade. Today, deeper integration in the global economy depends not only on liberal tariffs
and supportive policies but increasingly requires policy responses to various forms of
complex trade-related regional economic integration. The rising specialization and
fragmentation of production led increasingly to trade in intermediate goods and in
particular regional value chains.
Tariffs on regional trade are generally low, as they have been progressively
liberalized, first under the auspices of the General Agreement on Tariffs and Trade
(GATT)/World Trade Organization (WTO) and subsequently in the context of regional and
bilateral preferential trade agreements. The Association of Southeast Asian Nations
(ASEAN) member countries have made significant progress in the lowering of intra-
regional tariffs. The fact that tariff liberalization alone has proven insufficient in providing
genuine regional economic integration for many developing countries has drawn further
attention to non-tariff measures (NTMs) as major determinants in developing economies
growth. The use of NTMs, especially complex technical, and sanitary and phytosanitary
measures, has spread significantly. ASEAN member countries have resolved to work on
the elimination of non-tariff barriers.

Non-Tariff Measures in ASEAN
2
1.2. NTMs and NTM data collection
A country's participation in regional and international trade in goods and services
is affected by the combination of policies such as tariffs, quantity control measures,
sanitary and phytosanitary restrictions, or technical regulations. In recent years, countries
have not only significantly reduced tariff levels in most lines of products, but they have
also been promoting trade facilitation, preferential market access, and aid for trade.
Further attention is now drawn on non-tariff trade regulatory measures, or NTMs, which
are considered to have an impact on the ability of countries to gain and to benefit from
market access.
NTMs are policy measures, other than ordinary customs tariffs, that can
potentially have an economic effect on international trade in goods, changing quantities
traded, or prices or both (UNCTAD, 2010). NTMs thus include a wide and diverse array of
policies that countries apply to imported and exported goods. Some NTMs are manifestly
employed as instruments of commercial policy (for example, subsidies and trade defence
measures), while others stem from non-trade policy objectives for example, public heath,
food safety, and environmental protection). However, even legitimate NTMs that have
non-trade objectives are thought to have important restrictive and distorting effects on
international trade.
NTMs are of particular relevance to developing countries, especially the
implications that NTMs have on their market access. One concern is that developing
countries often have a more limited capacity and incur higher compliancy costs for
meeting NTM requirements in their export markets. This is due to less advanced
production process technology, weaker trade-related infrastructure, and inadequate
export services. Another concern is that NTMs are frequently applied to product groups
of particular export interest to developing countries. Evidence shows that small and
medium size enterprises and countries as well as less developed countries are
disproportionately affected by NTMs. Access to information is a significant challenge, as
many developing countries do not always have the resources to assess the nature and
implications of the NTMs that their exports face as well as of the ones they apply to their
own imports.
Understanding the uses and implications of these trade policy instruments is
crucial for the formulation and implementation of effective development strategies.
Chapter 1
3
1.3. The need for NTM data collection
Despite the widespread use of NTMs, there is a significant transparency gap.
Systematic and comparable information about the use of NTMs are generally not
available. Furthermore, NTMs are complex and their effect on regional and international
trade is often indirect and very case-specific. The scarce knowledge of the implications of
NTMs is particularly troubling for policymakers, trade negotiators, and development
agencies, which need information and analysis so as to direct their efforts for maximum
gains.
Relevant information on NTMs generally originates from various regulatory
agencies and is often buried in legal and regulatory documents, which makes the
gathering of relevant data difficult and costly. The United Nations Conference on Trade
and Development (UNCTAD) classifies and collects NTM data together with its partners
and regional organizations from all over the world. UNCTAD leads and coordinates the
global effort on NTMs, the Transparency in Trade Initiative.1 The collected data are based
on a comprehensive set of mandatory and official regulations that are currently imposed
by the country and that affect imported or exported merchandise products. Detailed
information for each NTM comprises the sources of information, the measures, and the
affected products and countries that have been gathered and translated into a qualitative
and quantitative database for easier access to all policy measures that might have an
economic impact on trade.
1.4. The methodology and process of NTM data collection
The collection of data on NTMs requires the classification of legal documents
(regulations, directives, and rules, among others) to appropriate predefined NTM codes.
These codes are provided in the UNCTAD publication on the Classification of Non-tariff
Measures (UNCTAD, 2013).
The classification of NTMs was developed and agreed by several international
organizations in the context of a multi-agency initiative on NTMs led by UNCTAD. The
classification is designed to facilitate the collection, analysis and dissemination of data on
NTMs, with the final objective of increasing transparency and understanding about the
subject.
1 Joint multi-year programme launched and implemented by UNCTAD, the World Bank, the International
Trade Centre, and the African Development Bank.

Non-Tariff Measures in ASEAN
4
The data that are collected are official measures currently imposed by the country
and that affect imported or exported products. As a rule of thumb, such measures would
be checked at the customs point to allow entry or exit of the product. Every measure
stemmed from the official mandatory regulations is to be collected and classified.
1.5. Scope, coverage, and disaggregation of measures
From the text of all official mandatory regulations, any policy measure, other than
ordinary customs tariffs, which can have an economic effect on international trade, is
collected and classified. The measures cover all topics and sectors such as Agriculture,
Arms and Ammunition, and Pharmaceutical, of all Harmonized System (HS) codes ranging
from Chapters 01 to 97, and of groups of products that are covered in international
conventions such as the Rotterdam or Stockholm Conventions.
The NTM classification categorizes measures into 16 chapters (A to P) based on
the purposes of the measures. Each chapter is further differentiated into groups and
subgroups, with most chapters reaching the 2-digit level of disaggregation and others
reaching the 3-digit level.
The last chapter, Chapter P, describes the measures imposed on exported
products. Chapters A to O reflect the requirements of the importing countries for their
imported products. Chapters A to C comprise technical measures: sanitary and
phytosanitary measures (SPS), technical barriers to trade (TBT), and pre-shipment
inspection as well as other formalities. Chapters D to O cover non-technical measures
such as licensing, price control, subsidies, and rules of origin.
Box 1 presents the list of chapters with their brief descriptions.

Chapter 1
5
Box 1: Description of Each Chapter in the Classification
Chapter A on SPS measures refers to measures affecting areas such as restrictions for substances, hygienic
requirements, or other measures for preventing dissemination of diseases. It also includes all conformity assessment
measures related to food safety, such as certification, testing and inspection, and quarantine.
Chapter B on technical measures refers to measures such as labelling and other measures to protect the
environment. It also includes conformity assessment that relates to technical requirements such as certification,
testing and inspection.
Chapter C classifies the measures related to pre-shipment inspection and other formalities performed in the
exporting country prior to shipment.
Chapter D refers to contingent measures, which are measures implemented to counteract particular adverse effects
of imports in the market of the importing country, including measures aimed at unfair foreign trade practices. They
include antidumping, countervailing, and safeguards measures.
Chapter E includes licensing, quotas, and other quantity control measures, group measures that have the intention
of limiting the quantity traded, such as quotas. It also covers those licences and import prohibitions which are not
SPS or TBT related.
Chapter F includes price control measures, which are those implemented to control or affect the prices of imported
goods in order to, inter alia, support the domestic price of certain products when the import prices of these goods
are lower; establish the domestic price of certain products because of price fluctuation in domestic markets, or price
instability in a foreign market; or to increase or preserve tax revenue. This category also includes measures, other
than tariff measures, that increase the cost of imports in a similar manner (para-tariff measures).
Chapter G concerns finance measures, referring to measures restricting the payments of imports, for example when
the access and cost of foreign exchange is regulated. This chapter also includes restrictions on the terms of payment.
Chapter H concerns measures affecting competition. These measures grant exclusive or special preferences or
privileges to one or more limited group of economic operators. They refer mainly to monopolistic measures, such as
state trading, or sole importing agencies, or compulsory use of national services or transport.
Chapter I concerns trade-related investment measures, group measures that restrict investment by requiring local
content or requesting that investment should be related to export to balance imports.
Chapter J includes distribution restrictions, referring to restrictive measures related to internal distribution of
imported products.
Chapter K concerns restriction on post-sales services, for example, restrictions in the provision of accessory services.
Chapter L contains measures that relate to subsidies that affect trade.
Chapter M containing government procurement restriction measures, refers to the restrictions bidders may find
when trying to sell their products to a foreign Government.
Chapter N concerns restrictions related to intellectual property measures and intellectual property rights.2
Chapter O on rules of origin, groups the measures that restrict the origin of products, or their inputs.
Chapter P includes export measures, grouping the measures a country applies to its exports. It includes export taxes,
export quotas, or export prohibitions.
Source: UNCTAD (2013).
2 Please note that those trading activities involving imitations or copies are classified in Chapter E, under
E315 for prohibition of copies or imitations of patented or trademarked products.

Non-Tariff Measures in ASEAN
6
2. ASEAN NTM data collection and analysis project
The ASEAN NTM data collection and analysis project (the project) is an ambitious
yet fruitful team effort initiated by UNCTAD and the Economic and Research Institute for
ASEAN and East Asia (ERIA). The project aims to conduct thorough studies of the trade-
related legislation of all 10 ASEAN countries (Brunei Darussalam, Cambodia, Indonesia,
Lao People’s Democratic Republic (Lao PDR), Malaysia, Myanmar, Philippines, Singapore,
Thailand, and Viet Nam), to collect the NTM data and to classify the identified NTMs
based on the aforementioned methodology. A rather unique nature of the project was
predetermined by its scope, the diversity of the legal systems under consideration,
accessibility of legal texts, as well as by tight deadlines targeted by ERIA and UNCTAD.
2.1. Project's timeline
The project was initiated in late 2014 through the signing of a memorandum of
understanding between ERIA and UNCTAD with a desire to complete the undertaking by
the end of 2015. The project was finished according to the schedule (Figure 1.1), while its
active stage, including the collection and classification of the NTMs, took only 9 months,
and successfully progressed into the data analysis stage.
The first 2 months were dedicated to the selection of national consultants and
their training by UNCTAD experts. Over the next 7 months the local consultants were able
to collect and register NTM data in three consecutive batches, while the UNCTAD team
was engaged in reviewing the submissions and guiding the national consultants in
incorporating UNCTAD comments and improving the quality of data collection. Over the
last 3 months, the collected data were reviewed in their entirety, and multiple
submissions were consolidated. Both the UNCTAD team and national consultants worked
on ensuring legal comprehensiveness (including cross-checking of countries’ international
obligations under conventions and elimination of overlaps and duplication across
multiple submissions by national consultants). A meticulous work of HS classification of
the affected products was also accomplished in this stage.

Chapter 1
7
Figure 1.1: Timeline of the Project
HS = Harmonized System; UNCTAD = United Nations Conference on Trade and Development.
Source: Prepared by the authors.
2.2. Methodology of the project
Selection of local consultants and training
As mentioned above, the project was a collective effort by ERIA, UNCTAD, and
selected local consultants in each of the 10 ASEAN countries. From the inception of the
project, both UNCTAD and ERIA shared a common understanding that the selection of
highly qualified national consultants was the key to the project's success. Therefore, the
best national trade think tanks and research institutions in ASEAN countries were
contacted in order to identify suitable candidates. At the same time, ERIA and UNCTAD
were also keen on obtaining support from the respective governments. The assistance
from the authorities of each country proved to be a valuable asset for the project's
comprehensiveness, which will be elaborated below.
The selected candidates of each ASEAN country had to take the UNCTAD online
course on NTM data collection and pass an online exam. The objective of the course was
to provide participants with the knowledge and tools required to identify, classify, and
collect information about NTMs in their respective countries. The course included the
following five modules: ‘Introduction to NTMs and data collection’, ‘Classification of
NTMs’, ‘Product classification’, ‘Guidelines for the collection of data on official NTMs’,
and ‘Data classification and storage template’. The candidates with passing grades were
Data analysis and preparation of the Final Report
December 2014–
January 2015
Selection of national
consultants, online course
& quizzes, preliminary
data colleciton
February 2015
Training of the selected
national consultants, workshop by
UNCTAD
22 April 2015
First submission
of the collected
NTMs data
22 June 2015 Second
submission
31 August 2015
Third submission
September–October
2015
Final review of the
collected data,
validation workshop
November–December
2015
Finalizing the HS
classification of the
affected products,
data processing

Non-Tariff Measures in ASEAN
8
invited to join the project and participate in the workshop conducted by UNCTAD.
Data collection
Upon the formation of the national teams, national consultants began the actual
NTM data collection, which they submitted to UNCTAD for review in three batches over
the span of 7 months. Each submission contained an Excel template, in which consultants
registered all the identified NTMs with their appropriate NTM codes respectively, as well
as the legislation containing those NTMs. For each submission the UNCTAD team
provided thorough feedback, identified the shortcomings and revised the wrong entries.
The identification of the relevant legislation as sources of NTMs, and the NTMs from the
identified legislation was conducted through several methods: (i) research in the publicly
available sources, trade portals, legal databases, and official gazettes, among others; and
(ii) queries to the relevant government authorities.
Scope of the project
The scope of consultants' work was limited to Chapters A-I (SPS and TBT measures;
pre-shipment inspection and formalities; non-automatic licensing, quotas, prohibitions,
and quantity-control measures other than for SPS and TBT reasons; price-control
measures, including additional taxes and charges; finance measures; measures affecting
competition; trade-related investment measures); and Chapter P (export-related
measures). UNCTAD used its own resources to cover Chapter D (contingent trade
protective measures).
Difficulties encountered
The quality of submissions varied from country to country. However, the major
obstacle in achieving uniformity, coherence, and comprehensiveness of the collected
data often lay beyond the control of the national consultants. While supervising the
consultants, UNCTAD encountered the following difficulties:
1. Limited access to implementing regulations
In some countries, a general regulation may be governed further by a few
implementing regulations, which might not be readily available in the public
domain or not available to the public at all. This situation implies difficulty to
collect and register corresponding NTM data. Such situations revealed the
importance of the established cooperation between ERIA, local consultants, and
national government authorities.
2. Development level of legal systems

Chapter 1
9
The legal systems in the 10 ASEAN countries are not equally developed. In the
case of Myanmar, for example, the country is currently in the process of revision
and reconstruction of its whole legal system. Presently, its legal system is a
combination of laws from several different epochs of state development, that is,
British rule, those from the time of military rule, and the most recent democratic
transition periods. Accordingly, the laws are available both in English and Burmese.
Those in Burmese are often a mere translation of the previous English written
laws. Though such ‘translated’ laws could introduce certain addenda to the British
Burma legislation, the former does not necessarily revoke the latter. Such a
situation creates an obstacle for the project, as it is not clear what scope of laws
the consultant needs to collect and analyse (legal comprehensiveness).
3. Structure of legislation
Depending on the level of legal development, the legislation in the ASEAN
countries vary from non-systemized and scattered collections of legal acts to well-
codified and coherent systems of norms. While this project did not aim to
evaluate legal systems or suggest any improvements, the aforementioned
diversity often does not fit into the system of measures/regulations/documents
registration developed by UNCTAD. This system implies that certain NTMs are to
be found in a regulation, which forms a part of an issued government document
(code and/or decree, among others). This model, common among many countries
around the world, is not necessarily the same in certain ASEAN countries, where
an NTM can be a single measure established under a decree enacted specifically
for this NTM. In such a situation, the terms ‘measure’, ‘document’, and ‘regulation’
may overlap, which does not provide for the technical ease of registering NTMs
and corresponding documents and regulations.
Ensuring legal comprehensiveness
Legal comprehensiveness, that is, the entirety of collected laws and regulations,
including international obligations of each country containing NTMs, was a pivotal point
in conducting the project. The UNCTAD team, together with national consultants, used
several tools in order to ensure the comprehensiveness of the data collected. These tools
included:
Trade Policy Reviews (TPRs) of the WTO: WTO TPRs are useful tools to identify the
scope of the relevant regulatory framework. They were the starting point of
research for all ASEAN countries except Lao PDR, for which no TPR has been
conducted to date.
Generally regulated product groups: Based on the experience of UNCTAD experts,
a list of generally regulated products was established. This list includes the

Non-Tariff Measures in ASEAN
10
following product groups: food products, animals and animal products, plants and
plant products, endangered species, controlled and hazardous chemicals,
pharmaceutical products, medicines and drugs, narcotics and psychotropic
substances and precursors, biological materials, ozone depleting substances,
pesticides, fertilizers, motor vehicles, radio-transmitting equipment, diamonds
and other precious stones and metals, tobacco products, alcoholic beverages,
hazardous wastes, arms, ammunition, explosives, nuclear materials, and dual use
products. If, while reviewing the collected data, an UNCTAD expert did not find
any NTMs imposed on one of the products in the list, a national consultant
conducted additional research regarding the uncovered product.
International conventions: All of the ASEAN countries are members to several
international conventions imposing certain restrictions/requirements on
importation/exportation of certain products/substances. Depending on the legal
system, ASEAN countries either recognize direct application of those treaties
domestically, or incorporate them by passing domestic legislation that gives effect
to the treaties. Some countries chose an intermediate approach. Regardless of the
type of the particular legal system, the project's task was to identify all NTMs
deriving from a country's international obligations. Among such treaties, special
attention was paid to the Montreal Protocol, the Chemical Weapons Convention,
the Basel Convention, the Rotterdam Convention, the Stockholm Convention, the
Kimberly Process, the CITIES Convention, the Single Convention on Narcotic Drugs,
the Convention on Psychotropic Substances, and the Convention against Illicit
Traffic on Narcotic Drugs and Psychotropic Substances.
Finally, the UNCTAD team conducted thorough cross-checking in order to
eliminate all the possible duplications of similar measures and double counting.
Data processing and dissemination
The last step in the ASEAN NTM data collection methodology relates to data
processing and dissemination. Before they can be made public, the collected NTM data
are further processed and normalized by UNCTAD experts and then loaded in a central
SQL server database, the UNCTAD Trade Analysis Information System (TRAINS). This
process ensures the coherence of submitted NTM data between all worksheets. It is also
needed to guarantee the referential integrity with existing data in the central database
and to make sure that all dimensions conform to reference tables such as country codes
or national product classifications. Any inconsistency causes a failure in the uploading of
the data into the TRAINS database and consequently requires another review of the data.
The NTM data are then disseminated from the TRAINS database to several web

Chapter 1
11
applications, inter alia:
1. World Integrated Trade Solution (WITS)
WITS is a web application developed by the World Bank to provide access to
several international databases on merchandise trade, tariffs, and NTMs such as
the United Nations (UN) Commodity Trade Statistics Database (COMTRADE),
UNCTAD TRAINS, and the WTO Integrated Data Base (IDB). WITS is accessible at
wits.worldbank.org/
2. Integrated Trade Intelligence Portal (I-TIP)
I-TIP is a WTO application that has been shared with UNCTAD to provide
comprehensive information on official NTMs applied in merchandise trade as well
as analytical tools. WTO I-TIP and UNCTAD ITIP are available at www.i-tip.org/ (the
UNCTAD version was launched in early 2016).
References
United Nations Conference on Trade and Development (UNCTAD) (2013), Classification of Non-tariff Measures. February 2012 Version. UNCTAD/DITC/TAB/2012/2. New York and Geneva: United Nations.
United Nations Conference on Trade and Development (UNCTAD) (2010), Non-tariff Measures: Evidence from Selected Developing Countries and Future Research Agenda. UNCTAD/DITC/TAB/2009/3. New York and Geneva: United Nations.


13
CHAPTER 2
Non-Tariff Measures in ASEAN: A Simple Proposal3
Lili Yan Ing Economic Research Institute for ASEAN and East Asia (ERIA)
Olivier Cadot University of Lausanne, CEPR and FERDI
Rizqy Anandhika Economic Research Institute for ASEAN and East Asia (ERIA)
Shujiro Urata Waseda University and Economic Research Institute for ASEAN and East Asia (ERIA)
1. Introduction
After close to 70 years of trade liberalization, a series of recent events suggests
that the tide may well be turning. International trade as a proportion of global gross
domestic product (GDP) has stopped growing in the last decade, in what Constantinescu
et al. (2015) dub the ‘Great Trade Slowdown’. Momentum for trade liberalization at the
multilateral level has stumbled on the Doha round’s failure, with limited hopes for
revival. Even regional trade agreements, sometimes seen as alternatives to multilateral
liberalization, are under heavy attack by politicians of all strides in the United States,
traditionally the bulwark of free trade. Last but not least, while the 2008–2009 global
financial crisis did not lead to the explosion of protectionism feared by many, the use of
temporary trade measures by emerging countries has been markedly rising (Didier et al.,
2016).
In a volatile international political context, these converging trends should be
taken seriously. A cycle of globalization followed by a political backlash would be nothing
new: between 1870 and 1890, a rise of protectionist forces in all advanced countries
nearly brought to an end the cycle of globalization that had started in the middle of the
19th century. If trade kept on growing because of shrinking transport costs, all countries
3 The authors are grateful for the discussion with ASEAN Senior Economic Officers.

Non-Tariff Measures in ASEAN
14
except the United Kingdom erected stiff trade barriers (Bairoch and Kozul-Wright, 1996)
and, more ominously, a semantic drift in political discourses led from protectionism to
xenophobia and, ultimately, war.
One key difference between now and then is the existence of the World Trade
Organization (WTO) and of its treaties, which today impose disciplines on what countries
can and cannot do, together with better knowledge of the harm that protectionism can
do. However, there is one area where WTO disciplines are comparatively weak: non-tariff
measures (NTMs).
NTMs are defined in general as policy measures, other than tariffs, that can affect
international trade. The term covers sanitary and phytosanitary (SPS) regulations,
technical barriers to trade (TBT) regulations, and a wide and diverse array of policy
interventions affecting trade flows and prices such as, inter alia, rules of origin, licensing,
price-control measures, or distribution restrictions (UNCTAD, 2013). While many NTMs
stem from non-trade policy objectives (for example, food safety or environmental
protection), they can also be used as instruments of commercial policy; even NTMs
pursuing legitimate, non-trade objectives can have restrictive or distortionary effects on
international trade.
NTMs are more complex policy instruments than tariffs not just because of
multiple objectives: They are also, in themselves, technically complex (this is particularly
true, for instance, of technical and sanitary regulations). Moreover, unlike tariffs that
have essentially rent-shifting effects, NTMs can affect market structure in intricate ways
(Asprilla et al., 2016). Their opacity, the indirect nature of their effects, and the frequent
involvement of the private sector in their design make them vulnerable to capture by
special interests, in particular in view of the relatively weak disciplines that the WTO
imposes on them.
Disciplines on regulations were established during the Uruguay Round, in
particular in the SPS and TBT agreements. For instance, Article 5.2 of the SPS agreement
requires sanitary regulations to be science-based. Likewise, the TBT agreement requires
technical regulations to be necessary and proportionate to the problem at hand. Taken
seriously, those disciplines are not trivial; in some cases they can even go against
consensual societal choices, as in the case of the European Union’s (EU) hormones
regulation. However, many measures can still go under the radar screen; most

Chapter 2
15
importantly, the system has not been tested against a general breakdown of goodwill.
Thus, in a deteriorating political environment, NTMs might prove to be a weak spot of
regional and multilateral trading systems.
For all the danger of hidden protectionism, an exclusive focus on the effect of
NTMs on trade and doing-business costs may miss an important part of their motivation
and may even run contrary to equally important public policy objectives. In a trend that
started in industrial countries and has since spread around the world, public demand for
insurance against health, consumption-related or environmental hazards has been rising
(Vogel, 1996), leading to increased ‘regulatory demand’. Failure to respond to this public
demand because of real or alleged trade constraints would only fuel the current anti-
globalization backlash.
The message of this chapter is that the solution to this dilemma is not to try – yet
again – to ‘negotiate down’ NTMs, but rather to take the issue back to the country level
and to embed it in a drive for better regulations. As the WTO’s ‘static’ (rules-based)
disciplines may not prove sufficient to ensure that regulations correctly balance
regulatory demands against economic efficiency, we argue that ‘dynamic’ disciplines
should be put in place in the form of quality control on regulatory processes. By quality
control, we mean essentially two things. First, good regulations should pass a basic test of
economic rationality, that is, set correct incentives from a societal point of view. This
would weed out most of the regulations pushed by special interests against the common
good. Second, they should fully internalize externalities between different areas of
government intervention, trade-related or not; for instance, the productivity gain
expected from a subsidy to agricultural inputs (pesticides and fertilizers) should be
balanced against its environmental cost. Few governments have structures in place to do
this kind of trade-offs explicitly.
Institutionally, the quality-control systems we advocate would take the form of
regulatory supervision bodies or National Economic Council (NEC), possibly building on
the NTM committees set up under the WTO’s Trade Facilitation Agreement, with strong
in-house analytical capabilities and the power to review and screen all existing and
proposed regulations. This is the direction that Cambodia, Myanmar, and Lao People’s
Democratic Republic (Lao PDR) have been taking recently.

Non-Tariff Measures in ASEAN
16
Because of the externalities that NTMs exert on trade partners, regional bodies
such as the ASEAN Secretariat could play a key role in encouraging and coordinating the
creation of NEC and providing common training to their staff (with support from
development partners), thus fostering a climate of regional cooperation at the technical
level. In turn, technical cooperation in the design and review of regulations would
facilitate the emergence of ‘regulatory convergence’ and thus contribute to make
regional agreements mutually compatible.
Last but not least, as recent research underscores the impact of NTMs on market
structure, NEC should ultimately be merged with competition commissions in order to
coordinate regulatory and anti-trust supervision, which deal with similar issues and draw
on similar staff skills. Combined regulatory and antitrust supervision bodies would have
more resources and clout, having a balanced view and mandate to discipline both the
private and the public sectors.
Against this background, this chapter provides an overview of the state of play in
the Association of Southeast Asian Nations (ASEAN) member states in the area of NTMs4,
together with an outline of the proposed policy architecture. Section 2 discusses
conceptually the channels through which NTMs affect trade and market structure.
Section 3 describes recent trends in tariffs and non-tariff measures in ASEAN, detailing
non-tariff measures in ASEAN by type of NTM, issuing agency, and product. Section 4
outlines our key policy proposal. Section 5 concludes.
2. How NTMs affect trade and market structure
The costs imposed by NTMs on businesses can be decomposed into three broad
classes: enforcement costs, sourcing costs, and process-adaptation costs. In this section,
we argue that these costs affect simultaneously trade flows and market structure.
Beyond ‘economies of scope’ at the level of supervisory agencies, this linkage between
trade and market-structure effects is our rationale for proposing joint regulatory and
antitrust supervision.
Enforcement costs relate to the effort that private companies must expend to
show compliance with NTMs. This may involve staff devoted to processing paperwork,
4 A previous study on NTMs in ASEAN using the 2009 ASEAN NTM database, Cadot, et al., 2015.

Chapter 2
17
inspections by officials from enforcement agencies, or efforts to encourage the
certification of foreign suppliers under national standards. Because these costs are largely
fixed, they weigh more heavily on small firms than on larger ones. They might also weigh
more heavily on foreign firms less familiar with local administrative processes, although
foreign firms tend to be larger ones who can purchase legal/consulting assistance locally.
Thus, through enforcement costs, NTMs may affect differentially local vs. foreign firms
and small vs. large ones.
Sourcing costs are generated by the switch from low-grade intermediate sources
to high-grade ones in order to meet NTM standards. A given standard can have different
effects depending on products and users. For instance, Indonesia’s steel standard,
adopted in 2009, set maximum levels of carbon, manganese, phosphorous and sulphur
for flat products and hot-rolled coils. For users of low-grade long products in the
construction sector (Harmonized System [HS] code 7207), the standard was binding and
involved changes in procurement choices. By contrast, for users of high-grade flat
products in the automobile industry (HS code 7208), company standards were generally
higher than those mandated by the regulation, so no sourcing changes were involved. In
their case, supplier certification requirements, being redundant, were perceived as just a
nuisance.
Sourcing costs are essentially variable costs, as they affect every unit produced. If
the standard is non-discriminatory, they affect domestic firms and importers in the same
way. However, intermediate producers from different countries may have unequal
abilities to comply with NTMs due to variations in the effectiveness of national SPS and
quality infrastructure. As a result, an NTM may affect sourcing patterns with complex
effects. For instance, Mauritius’ regulation on pigments used in paints forced domestic
producers to switch from their traditional supply sources to more expensive German-
made pigments. In general, Disdier et al. (2015) show that harmonization clauses in
North-South agreements, which typically mean a stiffening of standards for the Southern
partners, tend to reduce South-South trade. This ‘shutting-door’ effect on imports from
Southern third-party suppliers may be so large as to raise the profitability of home
intermediate producers, as was the case in Morocco after harmonization with EU
standards (Augier et al., 2016).

Non-Tariff Measures in ASEAN
18
Process-adaptation costs relate to changes in capital equipment needed to meet
NTM standards. For instance, dairy standards force farmers to buy expensive equipment
to ensure that milk is not contaminated by bacteria before being pumped into tank
trucks. Investment in compliant capital equipment typically requires also the upgrading of
operator skills. These costs are similar to the costs typically incurred by firms when they
start exporting. They involve the hiring of white-collar workers and engineers and, most
importantly, higher skill levels in every occupation (Verhoogen, 2008; Bustos, 2011).
Process-adaptation costs are essentially fixed costs and therefore affect small
firms more than larger ones, again potentially affecting market structure. This market-
structure effect can interact in subtle ways with traditional rent-shifting effects. To see
this, consider a world with symmetric firms and transport costs. Because of transport
costs, firms sell systematically smaller volumes on their export markets than on their
home markets. Suppose now that each country sets a particular (different) standard.
Then firms spread country-specific process-adaptation costs on smaller volumes on their
export markets than on their home markets; it is as if home firms were always larger than
foreign ones, in spite of the initial symmetry. In that case, NTMs mechanically generate a
home bias even if they are not de jure discriminatory. The picture becomes more complex
with heterogeneous firms, as process-adaptation costs induce the exit of the smallest
firms, both foreign and domestic, allowing larger ones (again both foreign and domestic)
to expand market shares. As a result, foreign firms may find themselves better off, a
conjecture that is documented empirically by Asprilla et al. (2016).
If quality upgrading takes place on a sufficiently large scale in the economy (say,
because a wave of new NTMs are adopted following a trade agreement) the
complementarity between recent-vintage capital and skills can raise the skill premium in
the whole economy, resulting in a widening of wage inequalities between educated and
non-educated workers. This effect, documented in the case of an expansion of export
opportunities by Bustos (2011), can induce a sorting of firms, with the largest upgrading
and expanding, while the smallest are forced to exit, squeezed by the NTM’s
requirements and the rising cost of skilled manpower.
While the scale of these effects varies across contexts and is, as yet, not widely
documented, a good rule of thumb is that variable costs matter for aggregate trade flows
while fixed costs matter for market structure.

Chapter 2
19
The underlying reasoning is illustrated in Figure 2.1. Consider a two-country world
where country A imposes an NTM affecting B’s exporters. Figure 2.1 plots the frequency
of B’s exporters (f) and the corresponding cumulative trade flow (g) as a function of a
parameter indexing both their productivity and their size. The shape of f is chosen to
correspond loosely to a Pareto distribution (Freund and Pierola, 2015); intuitively, as
increases, the density of firms goes down (there are fewer firms at high levels of
productivity). By contrast, g is upward-sloping and concave because, as one adds
increasingly larger/more productive firms, each contributes more and more to aggregate
output.
Figure 2.1 illustrates qualitatively the NTM’s effect on fixed and variable costs. An
increase in fixed costs induces the exit of firms between min and *, shifting the g
function horizontally from g0 to g1. This extensive-margin effect alters the market’s
structure. However, even if the exit movement is large (as shown), the effect on trade
flows is small because the exiting firms represent a small fraction of the aggregate flow
(although the horizontal shift of the g function is large, it vertical shift is small). By
contrast, an increase in variable costs affects the whole distribution, rotating g from g0 to
g2, including the top firms that account for the bulk of trade flows.5 Thus, market
structure does not change (all firms reduce their flows proportionately), but aggregate
flows change markedly.
Figure 2.1: Fixed-cost and Variable-cost Effects with Heterogeneous Firms
5 Freund and Pierola (2015) document that the top 1 percent of firms account for roughly half of export flows.

Non-Tariff Measures in ASEAN
20
Source: Cadot and Ing (2015).
The argument illustrated above has important implications for the empirical
analysis of NTMs and its policy implications. Currently, practically all work on NTMs is
focused on estimating their ad-valorem equivalents (AVEs) based on how they affect
trade flows. The idea is to use AVEs estimated by product and country as a basis for the
calculation of welfare gains to be expected from trade agreements through the use of
computable general equilibrium (CGE) models, and as a basis for negotiated reductions.
This approach is wrong on at least two counts.
First, as illustrated here, effects on trade flows are only part of the story; effects
on market structure may be equally important. In other words, a 10 percent reduction in
trade flows can have very different implications if it is an equi-proportionate reduction in
the exports of all active firms or if half the firms exit the market, leaving the remaining
ones with expanded market shares and reinforced market power (Asprilla et al., 2016).
Second, AVEs measure only the gross costs of NTMs, although the WTO’s
necessity and proportionality tests logically imply that society should be concerned by
their net cost, that is, by the difference between regulatory costs and benefits.6 The
benefits of SPS regulations can be, for instance, fatalities and diseases avoided, which can
be priced statistically through a variety of techniques (see for example, Hall and Jones,
6 The recall of nearly eight million vehicles from ten automakers including Toyota and of more than five million
from Honda since 2013, through national and regional actions for the potentially deadly Takata airbag inflators, the 2015 discovery of Volkswagen’s large-scale cheating with US emissions tests, or Singapore’s February 2016 ban on Mars chocolate products due to the possible presence of plastic, serve as reminders that regulatory benefits (or, alternatively, the costs of non-enforced or ineffective regulations) might well be substantial relative to lost ‘Harberger triangles’.
Chapter 2
21
2007). Likewise, environmental benefits can be evaluated for example, through the
valuation of ecosystem services (Pearce et al., 2006). However, in spite of the availability
of analytical tools, regulatory benefits are rarely quantified (Renda et al., 2013). With only
one-sided quantification, NTM rankings in terms of their gross costs (AVEs) could be very
distorted, leading to biased CGE estimates of the welfare gains from trade agreements.
As a result, AVEs may provide poor guidance to policymaking and hence to negotiations.
All in all, our message here is that NTMs, which are currently viewed primarily
through a trade-only prism, might well be viewed instead from a triple angle: (i) trade
(the traditional one), (ii) competition policy, and (iii) public-good provision and valuation.
Against this background, we now turn to a description of the state of play in ASEAN in
terms of NTMs.
3. Recent trends in tariffs and non-tariff measures in ASEAN
Import tariffs have been successfully reduced through multilateral and regional
negotiations, with ASEAN tariffs declining from 8.9 percent in 2000 to 4.5 percent in
2015. By 2010, tariffs had been outright eliminated on 98 percent of the product lines in
the ASEAN-6 countries,7 with Cambodia, Lao PDR, Myanmar, and Viet Nam to follow by
2018.
In spite of these tariff reductions, intra-ASEAN trade increased merely from 23.0
percent of member states’ total trade in 2000 to 25.3 percent in 2014, with ASEAN Trade
in Goods Agreement preferences suffering from chronic under-utilization. Besides rules
of origin (Cadot and Ing, forthcoming), NTMs, whose number swelled from 1,634 to 5,975
between 2000 and 2015 may be the ‘missing factor’ explaining the slow rise of intra-
ASEAN trade.
Indeed, most traded products are today covered by one measure or another.
Table 2.1 shows coverage ratios, that is, the percentage of imports covered by one
measure or another, using whichever source of trade data is available (direct or
mirrored). Coverage ratios are all high, with a number of countries having all imports
covered (100 percent coverage ratios).
Table 2.1: NTM Import Coverage Ratios in ASEAN, 2015
7 The ASEAN-6 are Brunei Darussalam, Indonesia, Malaysia, the Philippines, Singapore, and Thailand.

Non-Tariff Measures in ASEAN
22
NTM Coverage (simple
average)a
NTM Coverage (weighted average)b
Trade Year Usedc Remarks
Brunei Darussalam 65% 57% 2014
Cambodia 100% 100% 2014 (mirrored) NTMs on all products since 2008
Indonesia 75% 72% 2014 Lao PDR 100% 100% 2014 (mirrored) NTMs on all products since 2012
Malaysia 71% 69% 2014 Myanmar 42% 42% 2014 (mirrored) Philippines 100% 100% 2014 (mirrored) NTMs on all products since 1976
Singapore 100% 100% 2014 NTMs on all products since 1999
Thailand 100% 100% 2014 NTMs on all products since 1992
Viet Nam 100% 100% 2014 NTMs on all products since 2007 ASEAN = Association of Southeast Asian Nations; Lao PDR = Lao People’s Democratic Republic; NTM = non-tariff measure. Notes: a/
Simple tariff line means we treat 1 NTM in national tariff line as 1 NTM in 6-digit Harmonized System (HS) code. b/
Weighted tariff line means we treat 1 NTM in national tariff line as 1 divided by number of national lines in the respective 6-digit HS code. c/
Trade year used is based on latest available import data for HS-6 digit from WITS, World Bank.

Chapter 2
23
ASEAN’s high coverage ratios reflect a spectacular rise in the number of NTMs
during a period where tariffs, both most favoured nation (MFN) and preferential, were
steadily cut (Figure 2.2). One can read the scissor-blade movement in tariffs and NTMs
apparent in Figure 2.2 in two alternative ways, with sharply different implications.
Figure 2.2: Trends of Tariff and Non-tariff Measures in ASEAN, 2000–2015
ASEAN = Association of Southeast Asian Nations; NTM = non-tariff measure; SPS = sanitary and phytosanitary; TBT = technical barriers to trade. Source: Authors’ calculation based on 2015 ASEAN-ERIA-UNCTAD Database.
First, the number of NTMs could have risen as a substitute for shrinking tariffs.
The substitutability of tariffs and non-tariff barriers (NTBs) is an old idea in trade theory
and empirics (Deardorff and Stern, 1997). The idea is that, as tariffs are constraints by
bindings (although, for many developing countries, there is substantial water in the
tariffs) or by regional commitments, countries may resort to NTBs to perform an
equivalent protectionist function. Observing such substitutability in ASEAN data between
tariffs and the broad array of measures called NTMs (which include many measures that
Average Tariff (%)Number of NTMs

Non-Tariff Measures in ASEAN
24
are not NTBs) might betray an intention to use them as trade-protection instruments to
replace tariffs; we will call this the ‘political-economy (PE) hypothesis’.
Alternatively, shrinking tariffs (opening up) and expanding numbers of NTMs
(regulatory expansion) are two parallel symptoms of a modernizing economy, with
consumers demanding both more product variety and more product safety. This
hypothesis is in line with both theory and empirics. It has been observed that the average
unit value of a country’s imports tends to rise with its level of income (Hummels and
Lugovskyy, 2009). Thus, with or without standards, consumers naturally tend to switch to
higher-quality and safer products when their incomes rise. Expanding regulations may
simply reflect this shift in preferences, as risk-averse regulatory agencies seek to
minimize the risk of incidents in increasingly mediatized and safety-sensitive
environments. As for the negative relationship with tariffs, first note that trade
liberalization may reflect a growing demand for product variety as incomes rise. In that
case, the correlation between trade liberalization (decreasing tariffs) and regulatory
inflation would reflect a common factor (rising income). But there may be also a direct
causal mechanism. As trade liberalization leads to more variety in terms of import
sources, quality heterogeneity can be expected to rise (unit values vary not just by
importer income but by exporter income as well; see Schott 2004, and Bernard et al.,
2011); in particular, as market access improves for low-income exporters with deficient
SPS and product-safety infrastructure, importing countries may choose to scrutinize
imports more carefully. In that case, trade liberalization leads to import-quality
heterogeneity which itself causes regulatory controls. Whether due to a common factor
or to a direct causal mechanism, we will call this the ‘income-effect (IE) hypothesis’.
The breakdown by type of measure shown in Figure 2.2 helps to discriminate
between the PE and IE hypotheses. Under the IE hypothesis, NTM inflation should be
attributable primarily to instruments targeting the quality of products – SPS and TBT
regulations. Figure 2.2 shows that this is true on average; indeed SPS and TBT measures
together account today for 76.3 percent of the stock of NTMs (Table 2.2 and 2.3).

Chapter 2
25
Table 2.2: NTMs by Type in ASEAN, 2015
Code NTM by Type Number of
NTMs %
A Sanitary and phytosanitary (SPS) measures 1984 33.2%
B Technical barriers to trade TBT) 2573 43.1%
C Pre-shipment inspection and other formalities 153 2.6%
D Contingent trade protective measures 112 1.9%
E
Non-automatic licensing, quotas, prohibitions and quantity control measures other than SPS or TBT reasons 159 2.7%
F Price control measures including additional taxes and charges 195 3.3%
G Finance measures 15 0.3%
H Measures affecting competition 16 0.3%
I Trade-related investment measures 0 0.0%
J Distribution restrictions 2 0.0%
K Restriction on post-sales services 0 0.0%
L Subsidies (excluding export subsidies under P7) 0 0.0%
M Government procurement restrictions 0 0.0%
N Intellectual property 0 0.0%
O Rules of origin 0 0.0%
P Export-related measures 766 12.8%
Total coded NTMs 5975 100% ASEAN = Association of Southeast Asian Nations; NTM =non-tariff measure. Source: Authors’ calculation based on the 2015 ASEAN–ERIA–UNCTAD Database.
Table 2.3: NTMs by Type and by Country in ASEAN, 2015
Country Total SPS TBT Export-related
Measures (%) Others (%)
(number) (%) (%)
Brunei Darussalam 516 31 56 9 4
Cambodia 243 15 50 29 7
Indonesia 638 20 51 12 18
Lao PDR 301 13 30 27 30
Malaysia 713 36 47 10 7
Myanmar 172 44 24 20 12
Philippines 854 27 42 17 13
Singapore 529 24 59 9 7
Thailand 1630 48 34 8 9
Viet Nam 379 37 37 17 8
Total/average 5975 29 43 16 12
ASEAN = Association of Southeast Asian Nations; Lao PDR = Lao People’s Democratic Republic; NTM = non-tariff measure; SPS = sanitary and phytosanitary; TBT = technical barriers to trade. Source: Authors’ calculation based on the 2015 ASEAN–ERIA–UNCTAD Database.

Non-Tariff Measures in ASEAN
26
Figure 2.3 reproduces Figure 2.2 by ASEAN member country. Trends by county
offer a diverse picture in terms of profile and timing of the decrease in tariffs and
concomitant rise in NTMs, although the overall trend is qualitatively the same for many.
Interestingly, Singapore has seen a rise in the number of its NTMs (today, Singapore has
529 measures covering the entirety of its imports) even though it had no tariffs to
eliminate at the start (Singapore, a service economy, also has relatively few
manufacturing jobs to protect). Thus, the PE hypothesis cannot hold in the case of
Singapore. Indonesia, Malaysia, and the Philippines are three cases of moderate
decreases in preferential tariffs with largely unchanged MFN ones. In all three cases, the
rise in the number of NTMs has been steady, albeit from a high base in Malaysia.
Cambodia, Viet Nam, and Thailand have undergone more energetic tariff reductions as all
three started from high levels. They have also had substantial rises in the number of
NTMs. Other cases (Myanmar, Lao PDR, Brunei Darussalam) are in between or have
idiosyncratic profiles.
In terms of composition, the rise in NTMs is driven by SPS and TBT measures in
the Philippines, Singapore, Thailand and Viet Nam. By contrast, in Cambodia, Indonesia,
Myanmar, and Lao PDR, export-related and other measures that have nothing to do with
product safety have also been on the rise, suggesting more support for the PE hypothesis.
Figure 2.3: Tariffs and Non-tariff Measures by ASEAN Member, 20002015
(a) Brunei Darussalam (b) Cambodia
00.511.522.533.544.5
0
100
200
300
400
500
600
Tariff (%) Number of NTMs
0
5
10
15
20
0
50
100
150
200
250
300
20
00
20
02
20
04
20
06
20
08
20
10
20
12
20
14
Tariff (%) Number of NTMs

Chapter 2
27
(c) Indonesia (d) Lao PDR
(e) Malaysia (f) Myanmar
(g) Philippines (h) Singapore
0
2
4
6
8
10
0
100
200
300
400
500
600
700
Tariff (%) Number of NTMs
0
2
4
6
8
10
12
0
50
100
150
200
250
300
350
20
00
20
02
20
04
20
06
20
08
20
10
20
12
20
14
Tariff (%) Number of NTMs
0
2
4
6
8
10
0100200300400500600700800
20
00
20
02
20
04
20
06
20
08
20
10
20
12
20
14
Tariff (%) Number of
NTMs
0
1
2
3
4
5
6
0
50
100
150
200
20
00
20
02
20
04
20
06
20
08
20
10
20
12
20
14
Tariff (%) Number of
NTMs
012345678
0100200300400500600700800900
Tariff (%) Number of NTMs
0
0.2
0.4
0.6
0.8
1
0
100
200
300
400
500
600
Tariff (%) Number of
NTMs

Non-Tariff Measures in ASEAN
28
(i) Thailand (j) Viet Nam
ASEAN = Association of Southeast Asian Nations; Lao PDR = Lao People’s Democratic Republic; NTM = non-tariff measure. Note: Number of NTMs measured on the LHS; tariff (in %) measured on the RHS. Colour coding of NTMs and tariff types is as in Figure2.2. Sources: Authors’ calculations based on COMTRADE data on tariffs and 2015 ASEAN–ERIA–UNCTAD NTM Database.
A breakdown of the number of measures by product category in Table 2.4 also
suggests a mixed picture. Among the most heavily regulated products (three or more
NTMs), one finds both products that are clearly sensitive from a public-health perspective
(animal products, foodstuffs, chemicals) but also products where the rationale for state
regulation is less clear. For instance, machinery/electrical equipment covers sensitive
products such as consumer electrical equipment and appliances but also machinery, a
highly differentiated category of products typically purchased by corporate buyers with
the capability to assess quality by themselves, perhaps even better than government
agencies. Yet it is one of the most heavily regulated sectors. It is also, together with
automobile (another heavily regulated sector) an important provider of jobs in middle-
income countries, and hence a strategic sector from a PE perspective. Textiles is also an
economically strategic sector but one where safety standards are of secondary
importance; yet it is substantially affected by NTMs.
0
5
10
15
20
0
500
1000
1500
2000
20
00
20
02
20
04
20
06
20
08
20
10
20
12
20
14
Tariff (%) Number of NTMs
0
5
10
15
20
050
100150200250300350400
20
00
20
02
20
04
20
06
20
08
20
10
20
12
20
14
Tariff (%) Number of NTMs

Chapter 2
29
Table 2.4: NTMs by Product Group and by Number of Measures in ASEAN, 2015
HS Code
Product Group
Affected by 1 NTM
Affected by 2 NTMs
Affected by 3 NTMs or more
01-05 Animal & animal products 0% 0% 7%
06-15 Vegetable products 0% 0% 8%
16-24 Foodstuffs 0% 0% 6%
25-27 Mineral products 0% 0% 2%
28-38 Chemicals & allied industries 2% 2% 9%
39-40 Plastics/rubbers 1% 1% 2%
41-43 Raw hides, skins, leather, & furs 0% 0% 1%
44-49 Wood & wood products 0% 1% 6%
50-63 Textiles 1% 2% 6%
64-67 Footwear/headgear 0% 0% 0%
68-71 Stone/glass 1% 1% 1%
72-83 Metals 1% 2% 4%
84-85 Machinery/electrical 3% 6% 11%
86-89 Transportation 1% 1% 5%
90-99 Miscellaneous 1% 1% 3% ASEAN = Association of Southeast Asian Nations; HS = Harmonized System; NTM = non-tariff measure. Source: Authors’ calculation based on the 2015 ASEAN-ERIA-UNCTAD Database.
Table 2.5 sheds additional light on the issue by looking at who is responsible for
the issuance of NTMs. Under the PE hypothesis, one would expect trade and industry
ministries to account for a substantial fraction of NTMs. By contrast, under the IE
hypothesis one would expect the health and environment ministries to loom large.
Measures issued by agriculture ministries could fit under both hypotheses, as agri-food
products are both health sensitive and the object of strong protectionist pressures.
Health and environment ministries together account for about one-third of all NTMs
(34.3 percent). By contrast, trade and industry ministries account for less than 15 percent
of the measures. Thus, a raw count of where measures originate from suggests more
weight for the IE hypothesis.

Non-Tariff Measures in ASEAN
30
Table 2.5: NTMs by Issuing Agency in ASEAN, 2015
Number Ministry/agency Number of
NTMs
Total Number of NTMs
(%)
1 Ministry of Health 1868 31.3%
2 Ministry of Agriculture (including forestry, plantation, fisheries) 1865 31.2%
3 Ministry of Trade 468 7.8% 4
Other institutions (not mentioned in countries' table) 463 7.7%
5 Ministry of Industry 425 7.1%
6 Ministry of Environment, environmental agencies 178 3.0%
7 Government Office 175 2.9%
8 World Trade Organization (provided by WTO) 87 1.5%
9 Ministry of Finance 86 1.4%
10 Ministry of Energy, energy agency 64 1.1%
11 Other institutions 296 5.0%
Total NTMs 5975 100.0% ASEAN = Association of Southeast Asian Nations; NTM = non-tariff measure. Note: Data on measures of Antidumping, countervailing duties and safeguards are provided by the WTO. The WTO does not issue any regulations. Source: Authors’ calculation based on the 2015 ASEAN-ERIA-UNCTAD Database.
All in all, this brief overview of NTMs in ASEAN suggests that exclusive focus on
the PE hypothesis is unlikely to do justice to the variety of motivations that preside,
across countries, over the issuance of NTMs.
The data in Table 2.5 also highlight one of the distinguishing features of NTMs;
namely, that authority over them, unlike tariffs, is fragmented and spread over a large
spectrum of government agencies. Moreover, these agencies have different mandates,
and their personnel are unlikely to have much in common in terms of training or vision.
Thus, the narrow, trade-centred prism through which economists look at NTMs stands in
sharp contrast with the diverse constituencies that have a say in their making. This may
be one of the reasons why they are still so poorly understood.
Also, the fragmentation of authority over NTMs may reproduce at the country
level a problem that has been long noticed at the supra-national level. When a country
adopts a trade-policy measure, NTM or other, it is likely to affect its trade partners in one
way or another. Without a supra-national coordination mechanism, these so-called
‘externalities’ would not be taken into account in national decision-making, and the
outcome would not be collectively optimal. The WTO, its agreements, and its dispute-

Chapter 2
31
settlement body provide a forum and mechanism to discuss and internalize the
externalities.
A somewhat similar – if less acute – coordination problem exists within countries
in the area of NTMs. While all the agencies that form a government share, in principle, a
stake in the pursuit of the common good, each has, in practice, a particular and possibly
narrow mandate. While measures (in particular, NTMs) taken by one agency may well
have implications that spill over to other areas, there is typically no forum or mechanism
to discuss and resolve them. Spillovers (say, from environmental protection to
competitiveness, or from liberalization to product safety) are typically ignored, or, when
recognized, solved in ad-hoc fashion by bargaining between ministries, with the most
powerful one winning the case. Correctly resolving the trade-offs generated by cross-area
spillovers would require, instead, an institutional setup geared toward their explicit
recognition and their resolution in the pursuit of the common good rather than through
bargaining.
4. A simple proposal
Our brief and very preliminary overview of the state of play in NTMs in ASEAN
suggests that neither the PE hypothesis nor the IE one can be ruled out with certainty.
Therefore, appropriate policy guidance should take into account both types of
motivations and offer a balanced policy mix with both ‘disciplines’ in a traditional trade
sense and tools to facilitate trade-offs between conflicting objectives at the sub-national
(agency) level.
The WTO SPS and TBT agreements offer rules that governments can rely on to
solve certain trade-offs. They are useful, but they are not enough, because rules are
never ‘complete contracts’ – they cannot cover all possible situations. What we propose
here is to complement the rules with a standard institutional set up which, up to a certain
degree of adaptation to fit national realities, could provide a common blueprint to
resolve trade-offs and ensure regulatory coherence both within and between countries.
The setup is simple. We establish a National Economic Council (NEC) (the name
can vary in each country) that has a direct mandate from the president or prime minister.
It consists of related in-line ministers and high-level government officials with a technical

Non-Tariff Measures in ASEAN
32
secretariat. The mandate is to review and design strategic trade and investment policies
and regulations. The NEC consists of divisions of trade facilitation, NTMs, national single
window, investment procedure and regulations, and free trade agreements/ economic
cooperation.
The NTM division will review all existing and upcoming NTMs. The key aspect of
our proposal is the NEC’s technical secretariat. In order to add value, the NEC needs two
things. First, to be endowed with independent research capabilities in order to identify
where real problems are and recommend feasible and socially optimal solutions. For that,
the secretariat must be staffed with knowledgeable economists and trade and
investment lawyers capable of conducting logical, factual, and quantitative analysis and
of defending it effectively, which also requires a mixture of junior and senior staffing.
Second and equally important, it needs to have a dispute settlement mechanism capable
of resolving disputes for the common good and not just through bargaining.8 This may
entail either a collective-decision procedure or higher-level arbitrage, or both.
The proposed setup is illustrated in Figure 2.4. The left-hand side of the figure
shows the entry points into the process, which may include suggestions from private
sector, non-government organizations, and other segments of civil society. It is also
important that the NEC be allowed to seize cases on its own initiative, in particular in the
early stages of its life where it may have low visibility and private-sector complaints may
be slow to come. The upper part of the figure shows higher levels (for example, president
or prime minister’s office), which may be where all reviews and decisions on trade and
investment policy and regulations will be agreed and set. Colour codes illustrate possible
areas of NEC competence, although more can be included, in particular through a merger
with the antitrust body (more on this below).
8 There is a parallel here with the evolution of dispute-settlement at the WTO. While the first panels resolved
disputes essentially through bargaining in order to avert the recourse to force, with time, the system evolved toward third-party arbitration, and ultimately to one where disputes are resolved in a way that ensures consistency, see Jackson (1997).

Chapter 2
33
Figure 2.1: Proposed Institutional Setup
NGO = nongovernment organization. Source: Prepared by the authors.
The setup illustrated in Figure 2.4 is merely a blueprint. Although an appropriate
institutional setup is key, an NTM streamlining process, like any reform process, is only
worth the political goodwill and commitment that is placed in it. The case of Mexico is
telling in this regard. The drive for regulatory reform in Mexico came in early 1995 when
the December 1994 ‘Tequila Crisis’ underscored the need to modernize the economy.
The country embarked in a top-down regulatory reform driven by a small group of
technocrats with strong support from the presidency. The process was institutionalized
through the creation of a regulatory-simplification agency, the Unidad de Desregulacion
Economica (UDE), placed under the Secretariat of Trade’s authority, but given, by
presidential decree, a broader authority than the secretariat itself. UDE gathered
credibility and clout by starting with ‘low-hanging fruits’ – regulatory reforms that were
easy and widely seen as urgent – and then embarked on an ambitious reform agenda.
UDE required all ministries not just to notify regulations, but also to justify them, leading
to the outright elimination of 45 percent of all regulations (many of them useless). UDE
was then transformed into a formal federal agency, Comisión Federal de Mejora
Regulatoria or Federal Commission on Regulatory Improvement (COFEMER), with a staff
of 60 professionals, a budget of $5 million, and an independent status with a president-
NEC

Non-Tariff Measures in ASEAN
34
appointed head. The law’s objective was to ensure that new regulations would obey
transparency and rationality standards. However, in spite of the reform’s
institutionalization, it was only as strong as the president’s political backing. When
elections returned a hostile parliamentary majority, partisan politics and reform fatigue
in the face of disappointing growth eroded political support for further regulatory reform.
In 2003, COFEMER lost a key battle against the telecommunications sector; the same
year, its head was abruptly replaced, and it lost most of its clout (Cadot, 2015). Mexico’s
regulatory reform emphasized deregulation because of its particular legacy of over-
regulation. As we made clear at the outset, the present chapter does not promote de-
regulation as a universal fix; quite the opposite—our premise is that regulations are a
basic and legitimate public demand that should be taken as a given. What Mexico’s story
of reform and backtracking highlights, instead, is the need to ensure that the reform
process –whatever its ultimate aim— gathers clout as it matures, rather than lose steam
in increasingly difficult battles.
In order for the process to be anchored and stable, it needs what was partially
lacking in Mexico – outside support and commitment. The ASEAN Secretariat has a key
role to play in this regard in setting up regional dynamics that encourage and fuel the
NTM streamlining process simultaneously in several – if not all – member states. Support
could come through common training and technical assistance, possibly with the
involvement of development partners. Familiarity acquired through common training
would have the added advantage of fostering the emergence of a common vision among
national NEC, facilitating informal communication at the technical level between
commonly-trained staff in different NEC. Technical cooperation between staff at similar
levels of responsibility, and below the radar screen of the media and politicians, was the
hallmark of Franco–German cooperation in the early days of European integration; it
proved a powerful tool to prevent tensions. In an ASEAN context, it would facilitate
regional regulatory coherence and could also contribute to convergence across
overlapping blocs (for example, ASEAN and TPP) through the adoption of regulatory best
practices.
Ultimately, the reform process should lead to a convergence of regulatory
supervision and antitrust. Regulations do harm when they create monopoly positions. In
turn, to be stable, monopoly positions often need regulatory barriers to entry. We

Chapter 2
35
already discussed in this chapter how NTMs affect market structure. This
interdependence needs to be recognized explicitly and ‘internalized’. The best way to do
this would be to have a single regulatory and antitrust supervision body (e.g. National
Economic Council, NEC). This would have two key advantages. First, it would leverage
economies of scale, as the staff skills needed for antitrust and regulatory analysis are
broadly of the same nature – law and economics and, within economics, ‘industrial
organization’. Second, a joint NEC with both the private and public sectors under its
supervision would be perceived as more balanced than either of its components, which
would contribute to its clout.
5. Concluding remarks
We argued in this chapter that the belief, widely shared in the trade community,
that NTMs can be somehow ‘reduced’ through trade negotiations, is doomed. Many
NTMs are not just trade instruments – notwithstanding the analogy with tariffs that is
implicit in their name. Regulatory systems have become increasingly risk-averse in a
mediatized and safety-conscious world; not only will NTMs not be reduced – they will
keep on proliferating. Because of their potential dual use (for consumer-safety and job-
protection purposes) and the relatively weak disciplines to which they are subjected,
their proliferation creates a systemic risk for regional and multilateral trading systems.
However, finger pointing is counterproductive, as NTM reforms are held back by the
perception that they would be concessions to trade partners, like tariff reductions, and
should therefore be undertaken only as part of a negotiated quid pro quo.
What we propose, instead, is to take back NTM streamlining to the country level,
with the ASEAN Secretariat providing support in various ways, e.g. through regular NTM
reviews at the regional level. Regional disciplines on transparency also have a key role to
play, together with momentum toward mutual recognition and, whenever feasible,
harmonization. The key aspect of our proposal is its dynamic aspect: instead of rules and
constraints, we propose the adoption of simple institutional setups at the country level
that would be conducive to the emergence of best practices. These could be called
‘dynamic disciplines’.

Non-Tariff Measures in ASEAN
36
Practically, a possible roadmap to implement our proposal would blend regional
and multilateral approaches. At the multilateral level, the WTO’s Trade Facilitation
Agreement mandates that each country set up a trade portal and a trade facilitation
committee. An ambitious reading of the agreement would make the trade portal an
open-access repository of all NTMs, in local languages and in English. This would be a
tremendous step towards transparency, and it would be politically acceptable if it were
clear that posting was not the first step toward negotiated elimination. Likewise, trade
facilitation committees could be used as stepping-stones towards the creation of our
proposed National Economic Council, coordinating trade facilitation, non-tariff measures,
national single windows, investment and trade-related regulations and procedures. Thus,
the streamlining and harmonization of NTMs would make headway at all three levels—
national, regional and multilateral, contributing to (paraphrasing Baldwin and Thornton,
2008 and Baldwin and Kawai, 2013) “multilateralize” Asian regionalism.
References
ASEAN–ERIA–UNCTAD (2015), ASEAN–ERIA–UNCTAD 2015 Database on Non-tariff Measures. The updated version of the data will be available at http://asean.i-tip.org.
Asprilla, A., N. Berman, O. Cadot, and M. Jaud (2016), ‘Trade Policy and Market Structure: Firm-level Evidence’. Unpublished. Lausanne.
Augier, P., O. Cadot, and M. Dovis (2016), ‘Can NTM Harmonization Have Anti-Competitive Effects? Firm-level Evidence from Morocco’. Unpublished. GREQAM.
Bairoch, P. and R. Kozul-Wright (1996), ‘Globalization Myths: Some Historical Reflections on Integration, Industrialization and Growth in the World Economy’, UNCTAD Discussion Paper OSG/DP/113; Geneva: United Nations.
Baldwin, R. and P. Thornton (2008), Multilateralising regionalism: Ideas for a WTO action plan on regionalism; London, UK: CEPR.
Baldwin, R. and M. Kawai (2013), “Multilateralizing Asian Regionalism”; ADBI working paper 431; Tokyo: Asian Development Bank Institute.
Bustos, P. (2011), ‘The Impact of Trade Liberalization on Skill Upgrading: Evidence from Argentina’, Unpublished. Universitat Pompeu Fabra.
Cadot, O. (2015), Empirical Methods to Quantify the Economic Impact of Non-tariff Measures: Regulatory Distance and Competitiveness Effects. Washington, DC: World Bank.
Cadot, O. and L.Y. Ing (forthcoming), How Restrictive Are ASEAN’s RoOs?, Asian Economic Papers.

Chapter 2
37
Cadot, O., E. Munadi, and L.Y. Ing (2015) ‘Non-tariff Measures in ASEAN: The Way Forward’, Asian Economic Papers, 14(1), 35 –70.
Cadot, O. and L.Y. Ing (2015), ‘NTM Harmonization in RCEP’, ERIA Discussion Paper no.61, Jakarta: ERIA.
Constantinescu, C., A. Mattoo, and M. Ruta (2015), ‘The Great Trade Slowdown: Cyclical or Structural?’ IMF Staff Working Paper WP/15/6, Washington, DC: International Monetary Fund.
Deardorff, A., and R. Stern (1997), ‘Measurement of Non-tariff Barriers’, OECD Economic Department Working Paper 179, Paris: OECD.
Didier, T., M.A. Kose, F. Ohnsorge, and L.S. Ye (2016), ‘Slowdown in Emerging Markets: Rough Patch or Prolonged Weakness?’, CEPR Discussion Paper 11065, London: Centre for Economic Policy Research.
Disdier, A-C., L. Fontagné, and O. Cadot (2015), ‘North-South Standards Harmonization and International Trade’, World Bank Economic Review, 29(2015), pp.327–352.
Freund, C., and M.D. Pierola (2015), ‘Export Superstars’, Review of Economics and Statistics, 97, pp.1023–1032.
Hall, R.E. and C. Jones (2007), ‘The Value of Life and the Rise in Health Spending’, Quarterly Journal of Economics, 122, pp.39–72.
Hummels, D., and V. Lugovskyy (2009), ‘International Pricing in a Generalized Model of Ideal Variety’, Journal of Money, Credit and Banking, 41, pp.3–33.
Jackson, J. (1997), The World Trading System: Law and Policy of International Economic Relations. Second edition. Cambridge, MA: MIT Press,
Pearce, D., G. Atkinson, and S. Mourato (2006), Cost–Benefit Analysis and the Environment: Recent Developments. Paris: OECD.
Renda, A., L. Schrefler, G. Luchetta, and R. Zavatta (2013), Assessing the Costs and Benefits of Regulation; Study for the European Commission, Secretariat General. Brussels: European Commission.
Schott, P.K. (2004), ‘Across-product versus Within-product Specialization in International Trade’, Quarterly Journal of Economics, 119, pp.647–678.
UNCTAD (2013), Classification of Non-Tariff Measures February 2012 Version, New York and Geneva: UNCTAD.
Verhoogen, E. (2008), ‘Trade, Quality Upgrading, and Wage Inequality in the Mexican Manufacturing Sector’, Quarterly Journal of Economics, 123, pp.489–529.
Vogel, S. (1996), Freer Markets, More Rules: Regulatory Reform in Advanced Countries. Ithaka, NY: Cornell University Press.


37
CHAPTER 3
Classification of Non-tariff Measures in Brunei Darussalam9
Christina Ruth Elisabeth
Center for Inclusive and Sustainable Development, Prasetiya Mulya School of Business and
Economics, Indonesia
1. Overview of Brunei Darussalam’s economy
Brunei Darussalam (hereinafter, Brunei) has one of the highest levels of income
per capita in Southeast Asia with the lowest population and abundant oil and gas
resources. However, in the last decade, Brunei had the lowest economic growth rate in
the region due to its dependence on the oil and gas sector. The sector contributes more
than 60 percent of its gross domestic product (GDP) and more than 90 percent of its
exports (OECD, 2014).
Brunei’s dependency on oil and gas caused the government to have a significant
role, while limiting the role of the private sector. This condition is further strengthened by
the combination of high wages and low productivity of the private sector that makes the
private sector is uncompetitive internationally (Lawrey, 2010).
Realising this condition, on January 2008, the Brunei government issued a long-
term development policy package, known as Wawasan Brunei 2035 (Vision Brunei 2035).
The policy consisted of a structural development package to accelerate sustainable
economic growth. The emphasis of the package is to accelerate economic growth
through high productivity to achieve the target of 6 percent average annual economic
growth. High economic growth was expected to come from economic diversification and
an increasing role of the private sector.
In order to support the structural programme, the government promotes
investment inflow in the export-oriented and labour-intensive sectors. Those sectors are
agri-food, downstream oil and gas and energy-intensive industries, information and
communication technology, life sciences (pharmaceutical, cosmetics, and functional
9 The author would like to thank B. Realino Yudianto (Center for Inclusive and Sustainable Development,
Prasetiya Mulya) for his useful assistance in collecting the regulations and Steven Leonardo (Prasetiya Mulya) for his dedicated assistance in data processing.

Non-Tariff Measures in ASEAN
38
health food and health supplements); light manufacturing, services such as financial
services, logistics, and tourism and activities that may be driven by technology
development (Brunei Economic Development Board website).
Recently, Brunei has viewed the regional partnership as a complement of
multilateral partnership. The regional trade agreements (RTAs) have increased market
access and investment to support economic diversification. In 2013, merchandise trade
with RTA partners consisted of 75 percent of Brunei’s imports and 99.6 percent of its
exports.
In 2013, the ratio of merchandise trade (exports and imports) to GDP was 104.1
percent. Mineral fuels, which include petroleum and natural gas, represented 96.5
percent of total merchandise exports. The remaining exports are manufactured goods,
led by machinery and transport equipment (1.1 percent of total merchandise exports in
2013) and chemicals (0.8 percent) Brunei's merchandise exports are mainly destined for
the East Asian region. Japan remains Brunei's largest export partner, followed by the
Republic of Korea (WTO, 2015).
Brunei's imports were dominated by manufactured goods; the most important
category was machinery and transport equipment, accounting for 36.6 percent of total
imports in 2013 followed by other manufactured imports such as chemicals. The share of
food in total merchandise imports increased from 12.3 percent in 2008 to 13.3 percent in
2013.
Most of Brunei's merchandise imports came from East Asia, with Malaysia
accounting for the largest source of imports, 21.9 percent, and followed by Singapore at
19.1 percent in 2013. Imports from ASEAN countries accounted for 50.9 percent in 2013.
Currently, Brunei applies low tariffs on imported goods. There are import and
excise duties but no value-added tax. The average applied most favoured nation (MFN)
applied tariff is around 1.7 percent, with no tariffs on agriculture and 2 percent on non-
agricultural products. Tariff rates range up to 30 percent, with chemicals and related
products subject to the highest tariff protection.
As tariffs are low, non-tariff measures (NTMs) have become the focus in Brunei.
According to a study conducted by Ando and Obashi (2010) NTMs have been
implemented on some products in Brunei. All tariff lines for chemicals and related
products are subject to automatic licensing measures, 70 percent of which are also

Chapter 3
39
subject to non-automatic licensing simultaneously. More than 95 percent of animals,
plants, and food products group are subject to technical regulations. All machineries
products are subject to either quantity control or automatic licensing. Nearly 90 percent
of wood and wood products are subject to a combination of automatic licensing and
quantity control measures. A study conducted by Ando and Obashi (2010) uses 2008
UNCTAD classifications.
As NTM numbers and types have evolved, UNCTAD developed a new and more
comprehensive NTM classification in 2012. This study uses the 2012 UNCTAD
classification in classifying and analysing NTM applied in Brunei.
2. Legal comprehensiveness
Brunei applies a number of non-tariff measures (NTMs) in its international trade.
These NTMs are spread across several types of legal documents issued by government
agencies in Brunei. Most of these documents can be accessed through a centralised
source, namely the website of the Attorney General’s Chamber (www.agc.gov.bn). The
website publishes all legal documents issued in Brunei, including all regulations related to
international trade. In some cases, NTM regulations can also be found in other online
sources, such as ministries’ websites, departments’ websites, and in World Trade
Organization (WTO) notifications.
One hundred regulations with indications of NTMs were found during the
collection and review process. However, only 58 regulations were found to contain NTMs.
Most of these regulations are written in English, with only two in Malay. Most NTMs are
found in rules and regulations, while a few are found in acts. The rules and regulations
generally provide more detailed information of the measures and the affected products
than the acts.
In order to validate legal comprehensiveness, six international conventions
relating to international trade were reviewed. Four international conventions have been
ratified into regulations in Brunei:
1) Montreal Protocol, ratified in the Customs (Prohibition and Restriction on Import
and Export) Order, 2005
2) Basel Convention, ratified in the Hazardous Waste (Control of Export, Import and
Transit) Order, 2013
3) CITES Convention, ratified in the Wild Fauna and Flora Order, 2007

Non-Tariff Measures in ASEAN
40
4) Single Convention on Narcotic Drugs, the Convention on Psychotropic Substances;
the Convention against Illicit Traffic in Narcotic Drugs and Psychotropic
Substances: ratified in the Misuse of Drugs Act, 1978
Two international conventions are not yet ratified, namely the Stockholm
Convention and the Chemical Weapons Convention.
Table 3.1 shows the comprehensiveness of Brunei’s NTMs. There are 58 NTM
regulations containing NTMs, but only two that have been notified to the WTO – the
Public Health (Food) Regulations and the Halal Meat Rules. A total of 29 government
institutions issue NTM regulations. The total number of coded NTMs is 516, affecting
5,613 products (Harmonized System [HS] code), or 56.6 percent of the total products
traded in Brunei.
Table 3.1: Comprehensiveness of Non-tariff Measures in Brunei Darussalam
Number Comprehensiveness Number
1 Total number of coded regulations 58
2 Total number of coded regulations reported to the WTO 2
3 Total number of coded NTMs 516
4 Total affected products (HS lines, national tariff lines)
a. Total number of affected products a/ 5,613
b. Share of the number of affected products to the number of total products (%) b/
56.6%
5 Total number of issuing institutions 29
Notes: a/
One product may be affected by more than one measure, but the same HS-coded product will be counted as one product, e.g., HS 840731 has three NTMs, so it is counted as ‘one affected product’. b/
Brunei adopts the HS-10 digit at national tariff lines and it has 9,916 tariff lines. Among these 9,916 products, 5,613 products are affected by NTMs, so the share of the affected products to the number of total products is 56.6 percent. Source: Authors’ calculation based on the newly constructed 2015 NTM database ASEAN-ERIA-UNCTAD raw data 3. Issuing institutions
The Ministry of Health issued more than half of the NTM regulations (57.5
percent), followed by the Ministry of Industry and Primary Resources (8.6 percent), and
the Department of Agriculture and Agrifood (6.6 percent) (Table 3.2). There are 168
NTMs issued jointly by more than one institution.

Chapter 3
41
Table 3.2: Proportion of Non-tariff Measures by Issuing Institution (Single Institutions)
Number. Issuing Institution Number of NTMs
Total Number of
NTMs (%)
1 Ministry of Health 393 57.46
2 Ministry of Industry and Primary Resources 59 8.63
3 Department of Agriculture and Agrifood 45 6.58
4 Ministry of Religious Affairs 26 3.80
5 Royal Customs and Excise Department 25 3.65
6 Ministry of Finance 18 2.63
7 Department of Forestry 16 2.34
8 Authority for Info-communications Technology Industry 11 1.61
9 Ministry of Communication 10 1.46
10 Department of Land Transport 9 1.32
11 Other institutions 72 10.53
Total 684* 100 Note: Total number of NTMs is 516, of which 168 were jointly issued by institutions. Source: Authors’ calculation based on the newly constructed 2015 NTM database ASEAN-ERIA-UNCTAD raw data
Table 3.3: Proportion of Non-tariff Measures by Issuing Institution (Single and Joint Institutions) Number Issuing Institution Number
of NTMs Total
Number of NTMs
(%)
1 Ministry of Health 354 51.75
2 Ministry of Health, Ministry of Religious Affairs, Department of Agriculture and Agrifood, Ministry of Industry and Primary Resources
23 3.36
3 Department of Agriculture and Agrifood 17 2.49
4 Department of Forestry, Ministry of Industry and Primary Resources
16 2.34
5 Authority for Info-communications Technology Industry 9 1.32
6 Fisheries Department, Ministry of Industry and Primary Resources
9 1.32
7 Ministry of Health and Royal Customs and Excise Department, Ministry of Finance
9 1.32
8 Royal Brunei Police Force 9 1.32
9 Ministry of Health, Ministry of Home Affairs 7 1.02
10 Brunei Museums Department 6 0.88
11 Other institutions 57 8.33
Total 516 100
Source: Authors’ calculation based on the newly constructed 2015 NTM database ASEAN-ERIA-UNCTAD raw data
As shown in Table 3.3, out of the top 10 institutions, 3.4 percent of NTMs were
jointly issued by the Ministry of Health, the Ministry of Religious Affairs, the Department

Non-Tariff Measures in ASEAN
42
of Agriculture and Agrifood, the Ministry of Industry and Primary Resources, while 1.3
percent were jointly issued by the Ministry of Health and the Royal Customs and Excise
Department, and 1.0 percent were jointly issued by the Ministry of Health and the
Ministry of Home Affairs.
4. NTM classification by type
As shown in Table 3.4, the most commonly identified types of NTMs are technical
barriers to trade (TBT) (Type B), sanitary and phytosanitary (SPS) measures (Type A), and
price control measures (Type F). TBT measures accounted for 55.8 percent of total NTMs.
Table 3.4: Non-tariff Measure Classification by Type Code NTM by Type Number of NTMs %
A Sanitary and phytosanitary (SPS) measures 161 31.2
B Technical barriers to trade (TBT) 288 55.8
C Pre-shipment inspection and other formalities 1 0.2
D Contingent trade protective measures 0 0.0
E
Non-automatic licensing, quotas, prohibitions, and quantity control measures other than SPS or TBT reasons 2 0.4
F Price control measures including additional taxes and charges 18 3.5
G Finance measures 0 0.0
H Measures affecting competition 0 0.0
I Trade-related investment measures 0 0.0
J Distribution restrictions 0 0.0
K Restriction on post-sales services 0 0.0
L Subsidies (excluding export subsidies under P7) 0 0.0
M Government procurement restrictions 0 0.0
N Intellectual property 0 0.0
O Rules of origin 0 0.0
P Export-related measures 46 8.9
Total coded NTMs 516 100
Source: Authors’ calculation based on the newly constructed 2015 NTM database ASEAN-ERIA-UNCTAD raw
data
Figure 3.1 shows that 70 percent of the TBT measures originated from public
health (food) regulations, while regulations concerning poisonous products, drugs,
medicine, cement, and halal meat each contributed around 2 percent to TBT measures.
Out of 288 TBT measures, 44 percent were B7 (product quality), followed by B31

Chapter 3
43
(labelling requirements) and B6 (product identity). B7 (product quality) was mostly
applied to food products.
Figure 3.1: Technical Barriers to Trade Measures by Regulation
Source: Authors’ calculation based on the newly constructed 2015 NTM database ASEAN-ERIA-UNCTAD raw data
SPS measures were the second-largest group of NTMs, accounting for 31.2
percent of total NTMs. As shown in Figure 3.2, 84 percent of SPS measures concerned
public health (food). Other significant sources were quarantine regulations, wholesome
food orders, and guidelines to apply for import permits for mineral water. The objective
of most SPS measures is the protection of human health.
Out of 161 SPS NTMs, the most frequently applied NTM was A22 (restricted use of
certain substances in foods and feeds), which accounted for 47 percent, followed by A31
(labelling requirements) accounted for 20 percent, A21 (tolerance limit of residues or
contaminations) accounted for 6 percent, and A64 (storage and transport conditions)
accounted for 6 percent.
2%
2%
2%
2%
2%
70%
20%
Guidelines to Apply Permit to Import Cement
Halal Meat Act
Medicines (Licensing, Standard and Fees)Regulations
Misuse of Drugs Act
Poison Act
Public Health (Food) Regulations
Other Regulations

Non-Tariff Measures in ASEAN
44
Figure 3.2: Sanitary and Phytosanitary Measures by Regulation
Source: Authors’ calculation based on the newly constructed 2015 NTM database ASEAN-ERIA-UNCTAD raw data
Overall, NTM Types A, B, and C (so-called technical measures) were the most
commonly applied NTMs in Brunei, accounting for 87.2 percent of total NTMs.
Meanwhile, non-technical measures accounted for 19.7 percent of total NTMs. The non-
technical measures most applied in Brunei were Type E (non-automatic licensing, quotas,
prohibitions, and quantity control measures other than for SPS or TBT reasons) and Type
F (price control measures including additional taxes and charges). NTM Type F mostly
affected food products, motor vehicles and trailers, and endangered species.
Meanwhile, export measures covered 8.9 percent of total NTMs. Products most
affected by export measures were those regulated by international conventions, such as
hazardous waste, wild flora and fauna, and arms and explosives. Export measures were
also imposed on animal products, oil and mining, and products exported through
government incentive schemes.
If NTM types are broken down into a more detailed code or into sub-chapters of
classifications, 53 types of NTMs were applied in Brunei (Table 3.5). Among these, B7 was
the most frequently applied NTM, accounting for 24.4 percent, followed by A22 (14.5
percent), and B31 (8.9 percent). Most of the B7 NTMs were applied to foodstuffs.
2%
1%
1%
3%
1%
84%
6%
3%
Agricultural Pests and Noxious Plants Act
Customs Order 2006
Fisheries Order 2009
Guidelines to apply import permit of mineral water
Halal Meat Act
Public Health (Food) Regulations
Quarantine and Prevention of Disease (Animals) Act
Wholesome Meat Order 2011

Chapter 3
45
Table 3.5: Non-tariff Measure Classification by Detailed Type of NTM
Number Sub- Chapter of NTM
Amount % Number Sub- Chapter of NTM
Amount %
1 A14 5 0.97 28 B6 37 7.17
2 A15 3 0.58 29 B7 126 24.42
3 A19 2 0.39 30 B81 2 0.39
4 A21 10 1.94 31 B82 4 0.78
5 A22 75 14.53 32 B83 6 1.16
6 A31 32 6.20 33 B84 8 1.55
7 A33 1 0.19 34 B85 10 1.94
8 A41 3 0.58 35 B9 2 0.39
9 A42 1 0.19 36 C3 1 0.19
10 A51 2 0.39 37 E113 1 0.19
11 A63 2 0.39 38 E321 1 0.19
12 A64 10 1.94 39 F11 1 0.19
13 A81 1 0.19 40 F19 1 0.19
14 A82 1 0.19 41 F65 6 1.16
15 A83 7 1.36 42 F69 9 1.74
16 A84 4 0.78 43 F72 1 0.19
17 A85 1 0.19 44 P11 2 0.39
18 A86 1 0.19 45 P13 17 3.29
19 B11 6 1.16 46 P14 2 0.39
20 B14 22 4.26 47 P21 1 0.19
21 B15 6 1.16 48 P5 8 1.55
22 B21 1 0.19 49 P61 6 1.16
23 B22 5 0.97 50 P62 4 0.78
24 B31 46 8.91 51 P69 4 0.78
25 B33 3 0.58 52 P7 1 0.19
26 B41 1 0.19 53 P9 1 0.19
27 B42 3 0.58 TOTAL 516 100 Source: Authors’ calculation based on the newly constructed 2015 NTM database ASEAN-ERIA-UNCTAD raw data
As shown in Table 3.6, among the top 10 NTMs, nine were SPS and TBT, and only
one was an export measure, which licences or governs permits required for export (P13).
Out of 126 Type B7 NTMs, only one NTM did not relate to food regulations. This NTM
comes from a regulation concerning the quality of imported used cars.

Non-Tariff Measures in ASEAN
46
Table 3.6: Top 10 Non-tariff Measure Codes
Number NTM by Type Amount %
1 B7 126 24.42
2 A22 75 14.53
3 B31 46 8.91
4 B6 37 7.17
5 A31 32 6.20
6 B14 22 4.26
7 P13 17 3.29
8 A21 10 1.94
9 A64 10 1.94
10 B85 10 1.94 11 Others 131 25.39
Source: Authors’ calculation based on the newly constructed 2015 NTM database ASEAN-ERIA-UNCTAD raw data
5. NTM classification by affected product
Furthermore, to identify the intensity of NTMs on products, this study classifies
the number of NTMs applied. The results are shown in Tables 3.7 and 3.8 and Figure 3.3.
Products that were most affected (by at least three NTMs) were in transportation (11.8
percent), vegetable products (11.1 percent), animals and animal products (8.9 percent),
and foodstuffs (7.4 percent). Most machinery products were affected by two NTMs (28.5
percent), while plastics/rubber products were mostly affected by just one NTM.
NTMs affecting transportation products consisted of product registration, company
registration, certification, documentation requirements, licensing, inspection, product
quality, import licence fees, additional charges, and excise tax. The objective of the
measures on transportation products is mostly to ensure public safety related to
transportation.
Although the transportation products group was the most affected by three or
more NTMs, on average the animals and animal-product group had the highest average
number of NTMs. As shown in Figure 3.4, on average this product group was affected by
19.8 NTMs, while the transportation product group was affected by 11.8 NTMs. Other
product groups that had high average NTMs were vegetable products (11.4), foodstuffs
(10.2), and wood and wood products (9.2). The plastics/rubber product group had the
lowest average number of NTMs, at only 1.2.
Overall, NTMs were applied intensively on affected products in Brunei. As shown
in Table 3.8, 56.48 percent of affected products were affected by at least three NTMs,
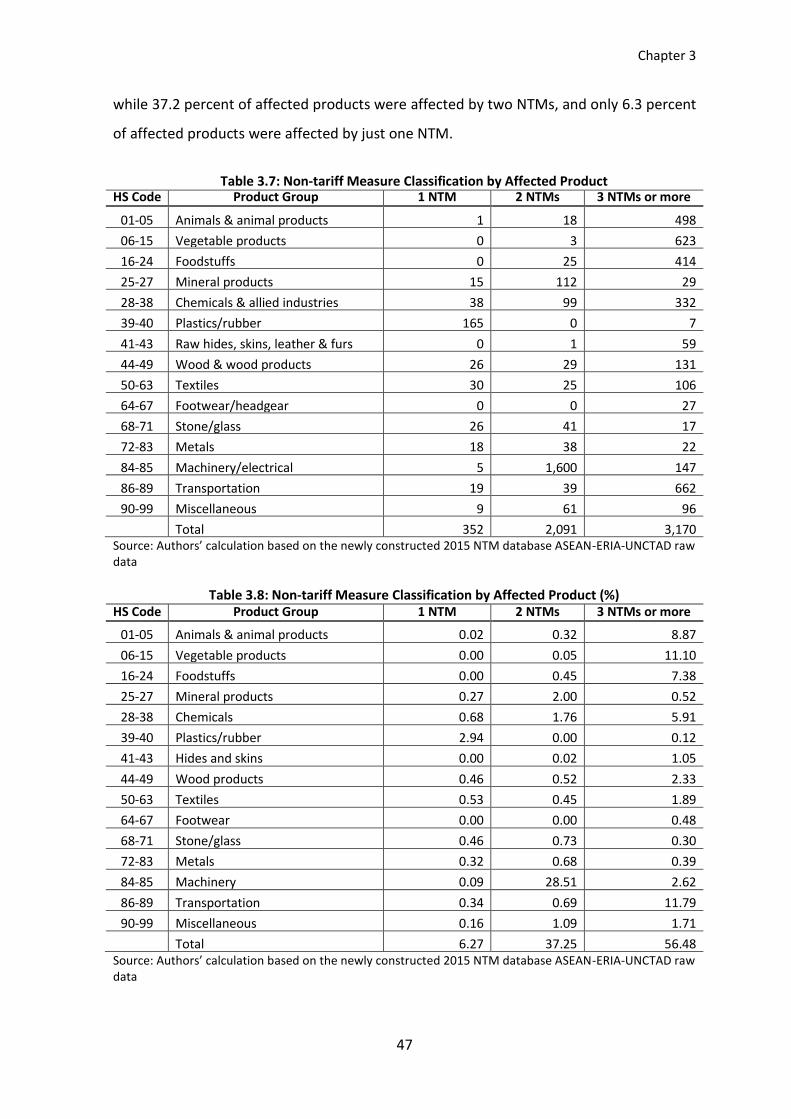
Chapter 3
47
while 37.2 percent of affected products were affected by two NTMs, and only 6.3 percent
of affected products were affected by just one NTM.
Table 3.7: Non-tariff Measure Classification by Affected Product
HS Code Product Group 1 NTM 2 NTMs 3 NTMs or more
01-05 Animals & animal products 1 18 498
06-15 Vegetable products 0 3 623
16-24 Foodstuffs 0 25 414
25-27 Mineral products 15 112 29
28-38 Chemicals & allied industries 38 99 332
39-40 Plastics/rubber 165 0 7
41-43 Raw hides, skins, leather & furs 0 1 59
44-49 Wood & wood products 26 29 131
50-63 Textiles 30 25 106
64-67 Footwear/headgear 0 0 27
68-71 Stone/glass 26 41 17
72-83 Metals 18 38 22
84-85 Machinery/electrical 5 1,600 147
86-89 Transportation 19 39 662
90-99 Miscellaneous 9 61 96
Total 352 2,091 3,170 Source: Authors’ calculation based on the newly constructed 2015 NTM database ASEAN-ERIA-UNCTAD raw data
Table 3.8: Non-tariff Measure Classification by Affected Product (%) HS Code Product Group 1 NTM 2 NTMs 3 NTMs or more
01-05 Animals & animal products 0.02 0.32 8.87
06-15 Vegetable products 0.00 0.05 11.10
16-24 Foodstuffs 0.00 0.45 7.38
25-27 Mineral products 0.27 2.00 0.52
28-38 Chemicals 0.68 1.76 5.91
39-40 Plastics/rubber 2.94 0.00 0.12
41-43 Hides and skins 0.00 0.02 1.05
44-49 Wood products 0.46 0.52 2.33
50-63 Textiles 0.53 0.45 1.89
64-67 Footwear 0.00 0.00 0.48
68-71 Stone/glass 0.46 0.73 0.30
72-83 Metals 0.32 0.68 0.39
84-85 Machinery 0.09 28.51 2.62
86-89 Transportation 0.34 0.69 11.79
90-99 Miscellaneous 0.16 1.09 1.71
Total 6.27 37.25 56.48
Source: Authors’ calculation based on the newly constructed 2015 NTM database ASEAN-ERIA-UNCTAD raw data

Non-Tariff Measures in ASEAN
48
Figure 3.3: Non-tariff Measure Classification by Affected Product
Source: Authors’ calculation based on the newly constructed 2015 NTM database ASEAN-ERIA-UNCTAD raw data
Figure 3.4: Average Number of Non-tariff Measures by Product Group
Source: Authors’ calculation based on the newly constructed 2015 NTM database ASEAN-ERIA-UNCTAD raw data
19.8
11.4
10.2
2.5
7.8
1.2
8.0
9.2
5.8
8.0
2.6
3.1
2.5
11.8
4.8
Animal & Animal Products
Vegetable Products
Foodstuffs
Mineral Products
Chemicals & Allied Industries
Plastics / Rubbers
Raw Hides, Skins, Leather, & Furs
Wood & Wood Products
Textiles
Footwear / Headgear
Stone / Glass
Metals
Machinery / Electrical
Transportation
Miscellaneous

Chapter 3
49
6. Main findings
From 58 regulations, 516 NTMs affect 5,613 products (HS codes).
The Ministry of Health issued the most NTM regulations.
Technical measures were the most frequently applied NTMs in Brunei,
accounting for 87.2 percent of total NTMs. From these numbers, TBT measures
covered 55.8 percent of total NTMs and SPS measures accounted for 31.2
percent of total NTMs.
Product quality (B7) was the most frequent NTM. This measure mostly applies to
food products.
Export measures covered 8.9 percent of the total. The most frequently affected
products by export measures were those products regulated by international
conventions.
Products that were most affected by three or more NTMs were transportation,
vegetable products, animals and animal products, and foodstuffs.
On average, the animals and animal product group was the group most
frequently affected by NTMs.
7. Policy recommendations
In order to increase NTM transparency, the government should increase the
number of notifications to the WTO. Currently, only two regulations (out of 58)
have been notified to the WTO.
Further study is needed to understand whether the intensive use of NTMs on
several products tends to lower or to increase trade volumes in Brunei
Darussalam.
References
Ando, M. and A. Obashi (2010), ‘The Pervasiveness of Non-tariff Measures in ASEAN –
Evidence from the Inventory Approach’, in M. Mikic (ed.), Rising Non-Tariff
Protectionism and Crisis Recovery, Bangkok: Studies in Trade and Investment,
United Nations Economic and Social Commision for Asia and the Pasific (ESCAP),
October, 27–55.
Brunei Economic Development Board website. Available at: http://www.bedb.com.bn
Lawrey, R. N. (2010), ‘An Economist’s Perspective on Economic Diversification in Brunei
Darussalam’, CSPS Strategy and Policy Journal, 1, pp.13–28.
Organisation for Economic Co-operation and Development (OECD) (2014), Economic
Outlook for Southeast Asia, China and India 2014: Beyond the Middle-Income Trap,
http://dx.doi.org/10.1787/saeo-2014-en

Non-Tariff Measures in ASEAN
50
World Trade Organization (WTO) (2015), Trade Policy Review Brunei Darussalam 2014.
Geneva: World Trade Organization.


Non-Tariff Measures in ASEAN
51
CHAPTER 4
Classification of Non-tariff Measures in Cambodia
Chap Sotharith Cambodian Institute for Cooperation and Peace
Phnom Penh, Cambodia
C. Ruth Elisabeth L. Tobing Center for Inclusive and Sustainable Development
Prasetiya Mulya Business School, Jakarta, Indonesia
Anika Widiana Center for Inclusive and Sustainable Development
Prasetiya Mulya Business School, Jakarta, Indonesia
1. Overview of Cambodia
Cambodia has achieved national reconciliation and political stability after the first
democratic election in 1993 resulted in forming a new coalition government. After
overcoming hardship including a protracted civil war, political strife, genocide, and
international isolation, the country has transformed from a centrally planned economy to
a free market economy with the main tasks to implement macroeconomic and structural
reforms and to alleviate poverty. As a result, Cambodia has achieved significant success in
stabilizing the macroeconomic foundation with rapid economic growth and low inflation.
In line with peace, political stability, and social order, Cambodia can maintain a
stable economic growth with an average of about 7 percent per year as planned in its
National Strategic Development Plan. The highest record of growth was 12.3 percent in
2005 and the lowest record of growth was 0.1 percent in 2009 due to the global financial
crisis.
It is estimated in 2015 that the growth rate reached 6.9 percent, the gross
domestic product (GDP) reached $18,502 million, and the per capita GDP reached $1,228.
The sectoral growth is 1 percent for agriculture, 8.7 percent for industry, and 9.0 percent
for services (Ministry of Economy and Finance). The leading sectors in Cambodia are
garment, agriculture, tourism, and construction. The poverty rate has been reduced about
1 percent per year.

Non-Tariff Measures in ASEAN
52
Currently, trade is an important instrument for economic development and
poverty reduction in Cambodia. In order to implement the World Trade Organization
(WTO) and the Association of Southeast Asian Nations (ASEAN) trade agreements,
Cambodia has conducted many reforms, especially legal and institutional reforms and
trade facilitation. In reforming its tariff structure, Cambodia had reduced the number of
tariff bands from 12 to 4 before joining the WTO, and the highest tariff rates of 40
percent, 50 percent, 90 percent, and 120 percent were abolished. At present, the tariff
comprises four tiers: 0 percent, 7 percent, 15 percent, and 35 percent.
While the trade balance of Cambodia is in deficit, both exports and imports have
been expanding as a result of economic growth. As of 31 July 2015, the value of exports
was about $5.35 billion, which is an increase of more than 20.5 percent compared to the
same period of 2014, while the value of imports reached a record of $6.70 billion marking
an increase of 17.2 percent compared to 2014 in the same period.
The major destination countries of exports are the United States, Hong Kong,
China, the European Union, Canada, and Viet Nam. The major importing countries are
Hong Kong, China, Taiwan, Thailand, and Viet Nam. The primary export product is
apparel, which accounted for more than 80 percent of the total exports. The major
import products are textiles, petroleum products, and vehicles. Cambodia is significantly
depending on the imports for industrial input products and daily commodities. Certainly,
with the integration of ASEAN and the liberalization of international trade, non-tariff
measures (NTMs) are an important component in a country's trade activity.
2. Hierarchy of laws and regulations
Cambodia’s Constitutional Assembly adopted the Constitution on 21 September
1993. It is the supreme law of the Kingdom of Cambodia and organizes Cambodia’s
government and institutions. All laws and regulations derive from the Constitution’s
provisions and must conform to it (Open Development Cambodia website). The
Constitution addresses questions of sovereignty, the role and status of the king, the
fundamental rights of the Khmer citizens, the economy, education, culture, and social
affairs, the functioning of the National Assembly, the Senate, congress and the
government, and the functioning of the judiciary, the Constitutional Council, and the
administration.

Chapter 4
53
Laws and regulations are classified in order of importance. There are numerous
legal norms adopted by the legislative and executive powers: the Constitution, laws,
decrees, decisions, among others. There is a strict hierarchy between them, so that each
norm of a lower level must conform to those of a higher value.
- Constitution: The supreme law of the Kingdom of Cambodia.
- International treaties: The king signs and ratifies international treaties and conventions
after their approval by the National Assembly and the Senate. After such ratification,
international treaties and conventions become laws and may be used as the basis for
judicial decisions (Article 26 of the Constitution).
- Chbab/law: Laws adopted by the National Assembly.
- Kram and kret (royal kram and royal decree): Decrees issued under the name of the
king in execution of his constitutional powers.
- Anukret/sub-decrees are signed by the prime minister after adoption at a cabinet
meeting. In case the cabinet meeting has not adopted the sub-decree, countersignature
by the minister(s) in charge is required. The prime minister can use this in execution of
his own regulatory powers.
- Prakas/proclamations are issued by members of the government in execution of their
own regulatory powers.
- Sechdei samrech/decision: Individual decision(s) made by the prime minister, minister,
or governor (prakas-deika), which are made in execution of his own regulatory powers.
- Sarachor/circular: Issued by the prime minister as the head of government, and by a
minister as an official of the relevant ministry either to explain or clarify legal regulatory
measures or to provide instructions.
- Deka/provincial ordinance: Orders issued by a governor within the territorial limits of
his province.
3. Approach to obtain legal comprehensiveness
To analyse NTMs in Cambodia, 100 percent legal comprehensiveness is of prime
importance. Thus we obtain comprehensive data as well as detailed and complete
analysis. To achieve 100 percent legal comprehensiveness, we took several approaches in
collecting regulations.

Non-Tariff Measures in ASEAN
54
First, we needed to find out official sources of Cambodia, for example searching
for regulations in each of the issuing institution (ministry).
Second, through Cambodia's National Trade Repository website we obtained the
laws, anukret, and prakas relating to trade. As a member state of ASEAN, Cambodia is
committed to the development of a National Trade Repository, which is integrated with
the ASEAN Trade Repository (atr.asean.org). The National Trade Repository website
(http://cambodiantr.gov.kh) is the official source for all regulatory information relevant
to traders who wish to import goods into Cambodia or export to other countries.
Third, we also checked the WTO notifications to complete the comprehensiveness
of data. In fact, since 2010, Cambodia only notified three regulations relating to food
standards and labelling.
The comprehensiveness of Cambodia’s NTMs is shown in Table 4.1. There are 52
regulations containing NTMs, but only three that have been notified to the WTO: the Law
on Bio-Safety & Protected Areas, Anukret No. 42 on Industrial Standards of Cambodia,
and the Law on the Management of Quality and Safety of Products and Service. The total
number of coded NTMs is 243, affecting 9,558 products (Harmonized System [HS] code),
or 100 percent of the total products traded in Cambodia.
Table 4.1: Comprehensiveness of Non-tariff Measures in Cambodia
Number Comprehensiveness Number
1 Total number of coded regulations 52
2 Total number of coded regulations reported to the WTO 3
3 Total number of coded NTMs 243
4 Total affected products (HS lines, national tariff lines)
Total number of affected products a/. 9,558
Share of the number of affected products to the number of total products (%)b/. 100%
5 Total number of issuing institutions 14 Notes: a/.
One product may be affected by more than one measure, but the same HS-coded product will be counted as one product, e.g., HS 840731 has three NTMs, so it is it will be counted as one affected product. b/.
Cambodia adopts the HS-8 digit code at national tariff lines and it has 9,558 tariff lines. All 9,558 products are affected by NTMs, so the share of the affected products to the number of total products is 100 percent. Source: Authors’ calculation based on the newly constructed 2015 NTM database ASEAN-ERIA-UNCTAD raw data.

Chapter 4
55
4. Issuing institutions
As shown in Table 4.2, 49 percent of the NTM regulations were issued by the
Ministry of Agriculture, Forestry and Fishery, followed by the Ministry of Health (13
percent), and the Ministry of Industry, Mines and Energy (10 percent). There are 114
NTMs issued jointly by more than one institution. Table 4.3 shows the NTM regulations
issued by single and joint institutions.
Table 4.2: Proportion of Non-tariff Measures by Issuing Institution (Single Institution)
Number Issuing Institution Number of NTMs
Total Number of
NTMs (%)
1 Ministry of Agriculture, Forestry and Fishery 174 49
2 Ministry of Health 46 13
3 Ministry of Industry, Mines and Energy 34 10
4 Ministry of Economic and Finance 23 6
5 Ministry of Industry and Handicraft 21 6
6 Ministry of Interior 12 3
7 Ministry of Commerce 11 3
8 Ministry of Environment 11 3
9 National Steering Committee for Biosafety 7 2
10 National Bank of Cambodia 5 1
11 Other institutions 13 4
Total 357* 100 Note:
*
There are 114 NTMs issued by joint institutions.
Source: Authors’ calculation based on the newly constructed 2015 NTM database ASEAN-ERIA-UNCTAD raw data

Non-Tariff Measures in ASEAN
56
Table 4.3: Proportion of Non-tariff Measures by Issuing Institution (Single and Joint Institution)
Number Issuing Institution Number of NTMs
Total Number of NTMs
(%)
1 Ministry of Agriculture, Forestry and Fisheries 74 30
2 Ministry of Industry, Mines and Energy 34 14
3 Ministry of Health 29 12
4 Ministry of Industry and Handicraft 21 9
5 Ministry of Health, Ministry of Agriculture, Forestry, Hunting and Fishing,
17 7
6 Ministry of Economy and Finance 11 5
7 Ministry of Agriculture, Forestry and Fishery, Ministry of Economic and Finance
9 4
8 Ministry of Commerce 8 3
9 Ministry of Interior 8 3
10 National Steering Committee for Biosafety, Ministry of Environment
7 3
11 Other institutions 25 10
Total 243 100
Source: Authors’ calculation based on the newly constructed 2015 NTM database ASEAN-ERIA-UNCTAD raw data
5. Non-tariff measure classification by type
The most commonly identified type of NTMs are technical barriers to trade (TBT)
(Type B), export-related measures (Type P), and sanitary and phytosanitary (SPS)
measures (Type A) (Table 4.4). TBT measures accounted for 49.8 percent of total NTMs.
Figure 4.1 show that 12 percent of the TBT measures originated from Anukret
No.69 on the Standards and Management of Agricultural Materials Regulations, 9 percent
originated from the Law on Management of Pesticides and Fertilizer 2012, and 6 percent
originated from Anukret No. 48 on Formalities and Conditions for Strong Acid Control.
Meanwhile, regulations concerning chemical products, forestry, and medicine each
contributed around 5 percent to TBT measures. Out of 121 TBT measures, 25 percent
were B15, followed by B31 (15 percent).

Chapter 4
57
Table 4.4: Non-tariff Measure Classification by Type
Code NTM by Type Number of NTMs %
A Sanitary and phytosanitary (SPS) measures 36 14.8
B Technical barriers to trade (TBT) 121 49.8
C Pre-shipment inspection and other formalities 1 0.4
D Contingent trade protective measures 0 0.0
E Non-automatic licensing, quotas, prohibitions, and quantity control measures other than SPS or TBT reasons 3 1.2
F Price control measures including additional taxes and charges 12 4.9
G Finance measures 0 0.0
H Measures affecting competition 0 0.0
I Trade-related investment measures 0 0.0
J Distribution restrictions 0 0.0
K Restriction on post-sales services 0 0.0
L Subsidies (excluding export subsidies under P7) 0 0.0
M Government procurement restrictions 0 0.0
N Intellectual property 0 0.0
O Rules of origin 0 0.0
P Export-related measures 70 28.8
Total coded NTMs 243 100
Source: Authors’ calculation based on the newly constructed 2015 NTM database ASEAN-ERIA-UNCTAD raw data
SPS measures were the third largest group of NTMs, accounting for 14.8 percent
of total NTMs. As shown in Figure 4.2, around 45 percent of SPS measures were
concerned with sanitation of animals and animal products. Those NTMs originated from
three regulations: Anukret No. 16 on Sanitary Inspection of Animals and Animal Products,
Prakas No. 178 on Procedure of Animal Sanitation Control and Animal Origin Products,
and Anukret No. 014 on the Inspection of Animal Sanitary and Animal Originated
Products. Other significant sources were regulations on vinegar, chilli sauce, and
phytosanitary inspection.
Out of 36 SPS NTMs, the most frequently applied NTM was A83 (certification
requirement), which accounted for 17 percent, followed by A31 (11 percent), A82 (11
percent) and A84 (11 percent).

Non-Tariff Measures in ASEAN
58
Figure 4.1: Technical Barriers to Trade Measures by Regulation
Source: Authors’ calculation based on the newly constructed 2015 NTM database ASEAN-ERIA-UNCTAD raw data
Figure 4.2: Sanitary and Phytosanitary Measures by Regulation
chilli
'Vinegar'
Source: Authors’ calculation based on the newly constructed 2015 NTM database ASEAN-ERIA-UNCTAD raw data
Overall, NTM Types A, B, and C (so-called technical measures) were the most
commonly applied NTMs in Cambodia, accounting for 65 percent of total NTMs. Non-
technical measures accounted for 6.2 percent of total NTMs. The non-technical measures
most applied in Cambodia were Type F (price control measures including additional taxes
and charges) accounting for 4.90 percent of total NTMs. Even though Type E (non-
automatic licensing, quotas, prohibitions, and quantity control measures other than SPS

Chapter 4
59
or TBT reasons) only accounted 1.2 percent of total NTM, this type of NTM affected 31.3
percent of total products.
Meanwhile, export measures is the second largest type of NTM, covering 28.8
percent of total NTMs and 31.3 percent of total affected products. Export measures are
imposed on all exported goods in Cambodia.
Based on the sub-chapter classification, 49 types of NTMs were applied in
Cambodia (Table 4.5). Among these, B14 (authorization requirement for TBT reasons) was
the most frequently applied NTM in Cambodia, accounting for 12 percent, followed by
P13 (8 percent) and B31 (7 percent).
Table 4.5: NTM Classification by Sub-Chapter
Number NTM Type Number of NTMs
% Number NTM Type
Number of NTMs
%
1 A14 3 1 26 B82 8 3
2 A15 1 0 27 B83 8 3
3 A19 1 0 28 B84 8 3
4 A22 2 1 29 B85 7 3
5 A31 4 2 30 B853 2 1
6 A32 2 1 31 C3 1 0
7 A33 3 1 32 E111 1 0
8 A42 1 0 33 E23 1 0
9 A64 1 0 34 E231 1 0
10 A82 4 2 35 F6 1 0
11 A83 6 2 36 F61 4 2
12 A84 4 2 37 F65 3 1
13 A85 1 0 38 F69 3 1
14 A851 1 0 39 F71 1 0
15 A86 2 1 40 P11 2 1
16 B11 3 1 41 P12 1 0
17 B14 30 12 42 P13 20 8
18 B15 6 2 43 P14 9 4
19 B22 2 1 44 P5 10 4
20 B31 18 7 45 P61 10 4
21 B32 6 2 46 P62 8 3
22 B33 6 2 47 P69 8 3
23 B42 4 2 48 P7 1 0
24 B7 6 2 49 P9 1 0
25 B81 7 3 Total 243 100 Source: Authors’ calculation based on the newly constructed 2015 NTM database ASEAN-ERIA-UNCTAD raw data

Non-Tariff Measures in ASEAN
60
As shown in Table 4.6, among the top 10 NTMs, five were TBT and another five
were export-related measures.
Table 4.6: Top 10 Non-tariff Measure Codes
Number NTM Type Number of NTMs %
1 B14 30 12
2 P13 20 8
3 B31 18 7
4 P5 10 4
5 P61 10 4
6 P14 9 4
7 B82 8 3
8 B83 8 3
9 B84 8 3
10 P62 8 3
Others 114 47 Source: Authors’ calculation based on the newly constructed 2015 NTM database ASEAN-ERIA-UNCTAD raw data
6. Non-tariff measure classification by affected product
Furthermore, to identify the intensity of NTMs on products, we classified the
number of NTMs applied. The results are shown in Tables 4.7 and 4.8 and Figure 4.3.
From those tables and figure we found that all products traded in Cambodia were
affected by at least three NTMs.
The groups of products mostly affected by NTMs are machinery (21.6 percent),
chemicals (12.1 percent), textiles (11.3 percent) and metals (9.5 percent). More than half
of NTMs (54.5 percent) were imposed on those products groups. Textile products
(apparel) are the primary export product of Cambodia.
Meanwhile, NTMs imposed on vegetable and animal products and foodstuff is
below 7 percent, 6.6 percent imposed on vegetable products, 5.5 percent imposed on
animal products, and 4.6 percent imposed on foodstuff. Most NTMs imposed on those
products are SPS, TBT, and export-related measures.

Chapter 4
61
Table 4.7: Non-tariff Measure Classification by Affected Product
HS Code Product Group 1 NTM 2 NTMs 3 NTMs or more
01-05 Animal & animal products 0 0 521
06-15 Vegetable products 0 0 630
16-24 Foodstuffs 0 0 443
25-27 Mineral products 0 0 204
28-38 Chemicals & allied industries 0 0 1,157
39-40 Plastics/rubbers 0 0 480
41-43 Raw hides, skins, leather, & furs 0 0 100
44-49 Wood & wood products 0 0 426
50-63 Textiles 0 0 1,079
64-67 Footwear/headgear 0 0 74
68-71 Stone/glass 0 0 296
72-83 Metals 0 0 909
84-85 Machinery/electrical 0 0 2,067
86-89 Transportation 0 0 565
90-99 Miscellaneous 0 0 607
Total 0 0 9,558 Source: Authors’ calculation based on the newly constructed 2015 NTM database ASEAN-ERIA-UNCTAD raw data
Table 4.8: Non-tariff Measure Classification by Affected Product (%)
HS Code Product Group 1 NTM 2 NTMs 3 NTMs or more
01-05 Animal products 0.0 0.0 5.5
06-15 Vegetable products 0.0 0.0 6.6
16-24 Foodstuffs 0.0 0.0 4.6
25-27 Mineral products 0.0 0.0 2.1
28-38 Chemicals 0.0 0.0 12.1
39-40 Plastics/rubbers 0.0 0.0 5.0
41-43 Hides and skins 0.0 0.0 1.0
44-49 Wood products 0.0 0.0 4.5
50-63 Textiles 0.0 0.0 11.3
64-67 Footwear 0.0 0.0 0.8
68-71 Stone/glass 0.0 0.0 3.1
72-83 Metals 0.0 0.0 9.5
84-85 Machinery 0.0 0.0 21.6
86-89 Transportation 0.0 0.0 5.9
90-99 Miscellaneous 0.0 0.0 6.4
Total 0.0 0.0 100.0 Source: Authors’ calculation based on the newly constructed 2015 NTM database ASEAN-ERIA-UNCTAD raw data

Non-Tariff Measures in ASEAN
62
Figure 4.3: Non-tariff Measure Classification by Affected Product
Source: Authors’ calculation based on the newly constructed 2015 NTM database ASEAN-
ERIA-UNCTAD raw data
7. Main findings
From 52 regulations, 243 NTMs affect 9,558 products (HS codes). This is 100 percent of
the total products traded in Cambodia.
Most NTM regulations are issued by the Ministry of Agriculture, Forestry and Fishery.
Technical measures are the most frequently applied NTMs in Cambodia, accounting for
65 percent of total NTMs. From these numbers, TBT measures accounted for 49.8
percent of total NTMs.
Authorization requirement for TBT reasons (B14) is the most frequent NTM.
Export-related measures covered 28.8 percent of total NTMs and affected all product
traded in Cambodia.
Products that were most affected by three or more NTMs were machinery (21.6
percent), chemicals (12.1 percent), textiles (11.3 percent), and metals (9.5 percent).
8. Policy recommendations
The NTM database in the Cambodia Trade Repository should be reviewed and updated
every year. There are many regulations in English that are not updated. All legal
documents including laws, anukrets, and prakas should be translated into English by
relevant ministries and establishments.

Chapter 4
63
Official websites of all government ministries and establishments are only in the Khmer
language and are often outdated. The ministry whose published regulation is related to
NTMs should update the website regularly and add English pages.
In the process of making laws or regulations related to NTMs, representatives from
relevant stakeholders, especially the NTMs National Committee and the relevant
private sector, should be invited to participate and provide input.
Capacity building should be supported for government officials at the secretariat of the
NTMs National Committee.
Awareness of NTMs and changes in laws and regulations should be disseminated
through press releases and announcements in official websites of relevant ministries.
Relevant agencies should regularly monitor regulations that might affect NTM changes
while some regulations may be amended or nullified the old NTMs.
References
Ministry of Economy and Finance website. Available at: http://www.mef.gov.kh/ (accessed 10 January 2016).
Open Development Cambodia website. Available at: http://www.opendevelopmentcambodia.net/laws-regulations/

65
CHAPTER 5
Indonesia’s Non-tariff Measures: An Overview10
Ernawati Munadi
Wijaya Kusuma University, Surabaya, Indonesia
1. Background
The reduction in tariff rates as a result of multilateral trade negotiations has
encouraged the use of non-tariff measures (NTMs) to control the flow of international
trade, including in Indonesia. In some countries, mostly in developed countries, the
increasing number of reasons for using NTMs reflects the move away from a focus on the
production side of the equation towards the defence of consumer and societal interests
(WTO, 2012).
In spite of their growing importance in regulating trade, the exact impact of NTMs
on trade flows is not well understood, and the paucity of data on NTMs is possibly the
major constraint to undertaking a qualitative analysis of their impact (UNCTAD, 2013).
Unlike tariffs, information on NTMs is not merely numbers; the relevant information is
often hidden in legal and regulatory documents. Therefore, collecting data on NTMs is a
matter of collecting information hidden in those regulations.
The difficulty of collecting data on NTMs is also due to the fact that these
documents are generally not centralised but often reside in different regulatory agencies.
For example, Indonesia’s LARTAS database reveals that 13 different government agencies
are tasked to issue regulations on import permits. Although the Ministry of Trade (MoT)
is responsible for issuing most of these, it accounted for only 58 percent on average of
the total NTMs issued between 2009 and 2014.11 Meanwhile, other agencies, such as
Quarantine and the Badan Pengawas Obat dan Makanan (BPOM or the National Drug and
Food Control Agency), were responsible on average for 18 percent and 17 percent of
10
The author is grateful to Indah Rahayu and Zamroni Salim. Special thanks are also given to Ayu Sinta Saputri from the Ministry of Trade of Indonesia, Lili Yan Ing from the Economic Research Institute for ASEAN and East Asia (ERIA), and the UNCTAD team for their comments during the data compilation. Project funding from ERIA is gratefully acknowledged. 11
On average, the total number of NTMs in the 10-digit Harmonized System (HS) code is 9,289.

Non-Tariff Measures in ASEAN
66
NTMs, respectively. Together, the MoT, the BPOM, and Quarantine cover 93 percent of
total Indonesian import NTMs. Other ministries are also active in issuing NTMs, such as
the Ministry of Health and Ministry of Agriculture but in limited numbers. There is an
urgent need to develop a better understanding and transparency of existing NTMs.
Nicita and Gourdon (2013) mentioned that efforts to collect NTM data started in
the late 1990s when the United Nations Conference on Trade and Development
(UNCTAD) started to collect and categorise NTM data, and this is available in the Trade
Analysis Information System (TRAINS) database accessible via the World Integrated Trade
Solution (WITS). However, the data have not been regularly updated in the last 10 years.
The new effort on NTM data collection has started through a joint collaboration between
UNCTAD and the World Bank. As of 2011, this joint effort has produced an updated
classification on NTMs as well as detailed new data for about 30 countries. However, this
effort is still far from the ideal data coverage required to undertake a comparable
qualitative analysis on the impact of NTMs among the regions.
The Association of Southeast Asian Nations (ASEAN) member states have initiated
collecting data on NTMs, but due to technical problems, the data is not constantly
updated. The latest NTM data available from the ASEAN secretariat were those reported
by members in 2009. Moreover, these data are not in line with UNCTAD’s new NTM
database classification, instead they are classified based on the old system. The purpose
of this chapter is to identify and collect NTMs in Indonesia, by drawing information from
official sources and using the UNCTAD’s NTM classification and methodology guidelines.
This chapter reports the result of NTM data collection for Indonesia as part of the
ERIA–UNCTAD data collection on ASEAN NTMs using the MAST classification. It focuses
mainly on important findings on the data compilation of Indonesia’s NTMs. Section 2
discusses the government agencies issuing NTM-related regulations, followed by a
discussion on Indonesian tariff lines and tariff lines covered by NTMs in Section 3.
Sections 4 and 5 discuss the type of NTMs imposed by the government – the Indonesian
multiple NTMs. Section 6 presents policy recommendations.

Chapter 5
67
Table 5.1 presents the comprehensiveness of Indonesian NTM data collection.
Comprehensiveness has become critical when collecting NTM data. Comprehensiveness
should cover not only the coded NTMs, but also most importantly the
comprehensiveness of NTM-related regulations. This is due to the fact that NTM
measures are sometimes hidden in the legal and regulatory NTM-related documents.
Therefore, it is important to ensure that 100 percent of the legal and regulatory NTM-
related documents are collected.
For Indonesia, NTM information has been collected from 199 NTM-related
regulations. The regulations are compiled from 14 different government agencies with
the total of 638 coded NTMs. As presented in Table 5.1, those 638 coded NTMs have
affected 5,712 Harmonized System (HS) lines at national tariff lines. This number is
equivalent to 57percent of the total Indonesian tariff lines.
Table 5.1: Comprehensiveness of Indonesian Non-tariff Measures
Number Comprehensiveness Number
1 Total NTM-related regulations 199
2 Total NTM reported to the WTO –
3 Total number of coded NTMs 638
4 Total affected products (HS lines, national tariff lines)
a. Total number of affected products 5,712
b. Share of the number of affected products to the number of total products (%) 57.05%
5 Total issuing institutions 14 Source: Authors’ calculation based on the newly constructed 2015 NTM database ASEAN-ERIA-UNCTAD raw data.
2. Government agencies issuing NTMs
A total of 199 NTM-related regulations were identified with 638 coded NTMs.
These 199 regulations are distributed among 14 different agencies12 involved in issuing
NTMs (Table 5.2). This implies that the Indonesian legal framework on NTMs is
decentralised and, therefore, compiling all the NTM-related regulations is a challenge. Of
these 14 government agencies, the Ministry of Trade is responsible for issuing the most,
almost 40 percent,13 of the total 199 NTM-related regulations. Meanwhile, the Ministry
12
Table 5.1 presents 17 regulatory agencies instead of 14 agencies because it includes (1) the WTO source (item 17), (2) the Ministry of Industry and Trade (item 5), which is basically the MoT before it was merged with the Ministry of Industry before 2005, and (3) the MoT and Ministry of Marine and Fishery (MoMF), which represents a regulation issued jointly by the MoT and MoMF (item 11). 13
This consists of 34.1 percent by the MoT and 5.5 percent by the Ministry of Industry and Trade.

Non-Tariff Measures in ASEAN
68
of Industry is responsible for 30.1 percent of NTM-related regulations. Other ministries
are also active, such as the Ministry of Agriculture at 9 percent, and the Ministry of
Energy and Mineral Resources at 3.5 percent.
Table 5.2: NTM-related Regulations by Regulatory Agency
Number Regulatory Agency Number of Identified
Regulations
%
1 Ministry of Trade 68 34.17
2 Ministry of Industry 60 30.15
3 Ministry of Agriculture 18 9.05
4 Ministry of Marine and Fisheries 14 7.04
5 Ministry of Industry and Trade 11 5.53
6 Ministry of Energy and Mineral Resources 7 3.52
7 Ministry of Finance 6 3.02
8 Ministry of Health 4 2.01
9 National Agency of Drug and Food Control 2 1.01
10 State Secretariat 2 1.01
11 Ministry of Trade and Ministry of Marine and Fisheries 1 0.50
12 Ministry of Environment and Forestry 1 0.50
13 The Indonesian National Police 1 0.50
14 Ministry of Communication and Information 1 0.50
15 Ministry of Environment 1 0.50
16 Ministry of Transportation 1 0.50
17 World Trade Organization (the information is provided by the WTO)* 1 0.50
Total 199 100.00 Note: *) Data on measures of Antidumping, counter failing duties and safeguards are provided by the WTO. The WTO does not issue any regulations. Sources: Authors’ calculation based on the newly constructed 2015 NTM database ASEAN-ERIA-UNCTAD raw data.

Chapter 5
69
Table 5.3: Number of Non-tariff Measures by Issuing Institution
Number Issuing Institution Number of NTMs
Total Number of NTMs (%)
1 Ministry of Trade 186 29.2
2 Ministry of Industry 139 21.8
3 Ministry of Agriculture 92 14.4
4 Ministry of Marine and Fisheries 70 11.0
5 World Trade Organization (the information is provided by the WTO)* 44 6.9
6 Ministry of Industry and Trade 30 4.7
8 Ministry of Energy and Mineral Resources 17 2.7
9 Ministry of Health 23 3.6
10 National Agency of Drug and Food Control 10 1.6
11 Others 27 4.2
TOTAL 638 100
Note: *) Data on measures of Antidumping, counter failing duties and safeguards are provided by the WTO. The WTO does not issue any regulations. Source: Author’s calculations.
On the number of NTMs, Table 5.3 shows that the Ministry of Trade is responsible
for the most, at 29.2 percent, since the ministry has the responsibility to protect
consumers and implement trade safeguards, and thus is tasked to manage import
licences and trade regulations to carry out these objectives. The Ministry of Industry
ranks second, covering almost 22 percent of total NTMs. The Ministry of Agriculture is
third, covering 14.4 percent of the total 638 NTMs.
3. Tariff lines covered by non-tariff measures
Table 5.4 presents tariff lines subject to NTMs by product groups. Table 5.4
reveals that 6,466 tariff lines are affected by NTMs in Indonesia. This implies that of the
total 10,013 national tariff lines in Indonesia, 57 percent are affected by NTMs. This is
similar to Cadot et al. (2015) who found that the incidence of NTMs is widespread around
the world. Except in Argentina, Latin American countries are moderate users of NTMs,
and so are Cambodia and Indonesia – two ASEAN countries. In contrast, a number of
African countries are heavy users of NTMs, on par with the European Union.

Non-Tariff Measures in ASEAN
70
According to the Indonesian tariff line database, machinery and mechanical
appliances, textiles and clothing, and chemicals are product groups with many tariff lines.
Of the product groups where tariff lines are covered by NTMs, animal and animal
products have the most, followed by foodstuffs, and textile and textile products. Almost
100 percent of tariff lines in animal and animal products is subject to NTMs. Foodstuffs
and textiles products are another product group with the most NTMs. Out of 453 tariff
lines, 99 percent of foodstuffs products are covered by NTMs, while 99 percent of tariff
lines textiles products, out of 1167 tariff lines, is subject to NTMs.
However, important items are noted in Table 5.4. The number of tariff lines
covered by NTMs is not the total NTMs because several tariff lines have more than one
NTM. Summing up the number of NTMs across products, the data reveal a total of 36,609
NTMs in Indonesia. Textile and textile products contribute the most at 18 percent,
followed by Machinery products at 14 percent, and Chemical and Allied industry at 12
percent.
Table 5.4: Number of Tariff Lines subject to Multiple NTMs, by Product Group
HS Code Product Group 1 NTM 2 NTMs 3 NTMs or more
01-05 Animal & Animal Products 11 9 551
06-15 Vegetable Products 74 12 449
16-24 Foodstuffs 47 2 399
25-27 Mineral Products 46 34 110
28-38 Chemicals & Allied Industries 46 200 510
39-40 Plastics/Rubbers 22 15 101
41-43 Raw Hides, Skins, Leather, & Furs 37 25 28
44-49 Wood & Wood Products 19 17 348
50-63 Textiles 2 194 958
64-67 Footwear/Headgear 1 6 33
68-71 Stone/Glass 72 20 70
72-83 Metals 17 15 370
84-85 Machinery/Electrical 98 286 491
86-89 Transportation 118 84 268
90-99 Miscellaneous 40 49 162
Total 650 968 4,848 Source: Authors’ calculation based on the newly constructed 2015 NTM database ASEAN-ERIA-UNCTAD raw data

Chapter 5
71
Table 5.5: Percentage of Tariff Lines subject to Multiple NTMs, by Product Group
HS Code Product Group 1 NTM 2 NTMs 3 NTMs or more
01-05 Animal & Animal Products 0% 0% 9%
06-15 Vegetable Products 1% 0% 7%
16-24 Foodstuffs 1% 0% 6%
25-27 Mineral Products 1% 1% 2%
28-38 Chemicals & Allied Industries 1% 3% 8%
39-40 Plastics/Rubbers 0% 0% 2%
41-43 Raw Hides, Skins, Leather, & Furs 1% 0% 0%
44-49 Wood & Wood Products 0% 0% 5%
50-63 Textiles 0% 3% 15%
64-67 Footwear/Headgear 0% 0% 1%
68-71 Stone/Glass 1% 0% 1%
72-83 Metals 0% 0% 6%
84-85 Machinery/Electrical 2% 4% 8%
86-89 Transportation 2% 1% 4%
90-99 Miscellaneous 1% 1% 3%
Total 10% 15% 75%
Source: Authors’ calculation based on the newly constructed 2015 NTM database ASEAN-ERIA-UNCTAD raw data
4. Types of non-tariff measures imposed by Indonesia
Table 5.6 presents the type of NTMs imposed in Indonesia. The table presents 638
occurrences of NTMs in Indonesia. Of this number, import NTMs account for 88.4
percent, while export NTMs cover 11.6 percent of the total identified NTMs. Indonesia’s
import NTMs are mostly on technical measures, mainly referring to technical regulations
and procedures for assessing conformity with technical regulations and standards,
including measures covered by the Sanitary and Phytosanitary (SPS) Measures Agreement
(A), technical barriers to trade (TBT) (B), and pre-shipment inspection and other
formalities (C). Technical measures contribute to almost 89 percent of import NTMs, or
79 percent of total NTMs, leaving only 11 percent for non-technical measures.

Non-Tariff Measures in ASEAN
72
Table 5.6: Types of Non-tariff Measures Imposed by Indonesia
Code NTM by Type Number of
Coded NTMs
NTMs
(%)
A Sanitary and phytosanitary (SPS) measures 125 19.59
B Technical barriers to trade (TBT) 323 50.63
C Pre-shipment inspection and other formalities 55 8.62
D Contingent trade protective measures 44 6.90
E Non-automatic licensing, quotas, prohibitions, and quantity control measures other than SPS or TBT reasons 8 1.25
F Price control measures, including additional taxes and charges 5 0.78
G Finance measures 0 –
H Measures affecting competition 3 0.47
I Trade-related investment measures 0 –
J Distribution restrictions 1 0.16
K Restriction on post-sales services 0 –
L Subsidies (excluding export subsidies under P7) 0 – M Government procurement restrictions 0 –
N Intellectual property 0 –
O Rules of origin 0 –
P Export-related measures 74 11.60
Total coded NTMs 638 100.0
0 Source: Authors’ calculation based on the newly constructed 2015 NTM database ASEAN-ERIA-UNCTAD raw data
As presented in Table 5.6, TBT is the most widely used NTM in Indonesia,
accounting for 50.6 percent of NTMs, followed by SPS measures at 19.6 percent, and pre-
shipment inspection at 8.6 percent. Among the non-technical measures implemented in
the Indonesian NTM database are non-automatic licensing, quotas, prohibitions, and
quantity control measures–other than SPS or TBT reasons (E); price control measures,
including additional taxes and charges (F); measures affecting competition (H); and
distribution restrictions (J).
Table 5.6 also suggest that at the national tariff lines, currently the most widely
used NTM for products is technical measures. There are 19,612 products subject to TBT
(37.8 percent), surpassing the number of products whose imports require importers with
SPS (36.4 percent). The third most widely used import NTMs is pre-shipment inspection
(C), which covers 5,203 products.

Chapter 5
73
Indonesia’s NTMs data compilation also reveals that 66 types of NTMs have been
imposed in Indonesia. Out of these types, the most commonly used in Indonesia is the
authorisation requirement for TBT reasons. There are 4,737 tariff lines subject to
authorisation requirement for TBT reasons, which cover 12.94 percent of total NTMs. The
second most common is traceability information requirements, with a total of 3,671 tariff
lines subject to this measure, accounting for 10.03 percent of total NTMs. The third most
used NTM is registration requirements for importer for TBT reason, and the fourth is pre-
shipment inspection. There are 2,367 tariff lines (or 6.47 percent of total NTMs) and
2,366 tariff lines (or 4.47 percent of total NTMs) subjected to this measure. Other
measures that are commonly used in Indonesia are export registration, which accounts
for 2,181 tariff lines (5.96 percent); labelling requirements for TBT reasons for 2,062 tariff
lines (5.63 percent); labelling requirements for SPS reasons for 1,630 tariff lines (4.45
percent);and 1,533 tariff lines requiring measures to pass through specified port of
customs (4.19 percent).
5. Multiple non-tariff measures
Another interesting note on NTMs imposed by Indonesia is that the imposition is
characterised by the simultaneous application of many measures (multiple NTMs) to the
same product, as shown in Figures 5.1 and 5.2. This can translate into complicated
compliance verification processes for traders. Figure 5.1 shows the multiple NTMs on
total NTMs (total affected products). From Figure 5.1, the results show that 92 percent of
Indonesia’s products are subject to multiple NTMs, while only 6.12 percent of Indonesia’s
tariff lines are subject to two NTMs, and 1.81 percent to one NTM.

Non-Tariff Measures in ASEAN
74
Figure 5.1: Indonesian Tariff Lines subject to Multiple NTMs, by Products (%)
Source: Authors’ calculation based on the newly constructed 2015 NTM database ASEAN-ERIA-UNCTAD raw data
Based on Figure 5.2, most of Indonesia’s product groups have total NTMs
exceeding their total number of tariff lines. This indicates that some products within that
group are subject to more than one NTM, compared to the number of tariff lines in each
product. Vegetable products and textile and textile products have the highest NTM per
tariff lines.
The number of tariff lines covered by NTMs is 6,466 – and this is not the total
number of because several tariff lines have more than one NTM. Summing up all NTMs
across the 10-digit Harmonized System (HS) level, data reveal that the total number of
NTMs is 36,609. Some of those NTMs might have legitimate reasons. Some NTMs are
policy measures on security or public health, such as transport of firearms or explosives,
and trade in dangerous chemicals and radioactive materials. A number of NTMs are to
ban the trade of certain items, such as opium and narcotic drugs.
0%
2%
4%
6%
8%
10%
12%
14%
16%
18%
20%A
nim
al &
An
imal
Pro
du
cts
Ve
geta
ble
Pro
du
cts
Foo
dst
uff
s
Min
era
l Pro
du
cts
Ch
em
ical
s &
Alli
ed
Ind
ust
rie
s
Pla
stic
s /
Ru
bb
ers
Raw
Hid
es,
Ski
ns,
Le
ath
er, &
…
Wo
od
& W
oo
d P
rod
uct
s
Text
iles
Foo
twea
r /
Hea
dge
ar
Sto
ne
/ G
lass
Me
tals
Mac
hin
ery
/ E
lect
rica
l
Tran
spo
rtat
ion
Mis
cella
neo
us
1 NTMs 2 NTMs 3 NTMs or more

Chapter 5
75
Figure 5.2: Indonesian Tariff Lines subject to Multiple NTMs, by Products
Source: Authors’ calculation based on the newly constructed 2015 NTM database ASEAN-ERIA-UNCTAD raw data
Figure 5.2 shows that most product groups have three NTMs or more.14 Of animal
and animal products, 96.5 percent are subject to three or more NTMs, while 92 percent
of metal products, and 90 percent of wood and wood products are both subject to three
or more NTMs.
6. Recommendations
From the previous analysis, findings reveal that cases of multiple NTMs are
common in Indonesia, where almost 92 percent of products are subject to three or more
NTMs, with some of these coming from a single regulatory agency, while others come
from multiple regulatory agencies. The following are some policy recommendations for
Indonesia:
14
As presented in Figure 5.1, the total products that are subject to three or more NTMs are 92 percent.
0%
10%
20%
30%
40%
50%
60%
70%
80%
90%
100%
An
imal
& A
nim
al P
rod
uct
s
Ve
geta
ble
Pro
du
cts
Foo
dst
uff
s
Min
era
l Pro
du
cts
Ch
em
ical
s &
Alli
ed
Ind
ust
rie
s
Pla
stic
s /
Ru
bb
ers
Raw
Hid
es,
Ski
ns,
Le
ath
er, &
Furs
Wo
od
& W
oo
d P
rod
uct
s
Text
iles
Foo
twea
r /
Hea
dge
ar
Sto
ne
/ G
lass
Me
tals
Mac
hin
ery
/ E
lect
rica
l
Tran
spo
rtat
ion
Mis
cella
neo
us
1 NTMs 2 NTMs 3 NTMs or more

Non-Tariff Measures in ASEAN
76
Undertake a regular review of existing policies and regulations to identify policies
and regulations that are impacting negatively on customers, and which are not achieving
the government’s objectives.
Improve the coordination with other government agencies when issuing trade
regulations.
Set up a regulatory and/or oversight body with strong analytical capabilities on
NTMs. This body must be competent and capable of designing better NTMs, and in
conducting a deeper analysis on the impact of this complex regime, which could cause
significant costs and delays for Indonesian businesses and consumers. According to the
World Bank (2008), best practice suggests that a regulatory and/or oversight body should
not be located in a line ministry as other ministries could resent being put under that
authority. Instead, the regulatory and/or oversight body should be placed either under
the Prime Minister’s or the President’s authority, or be set up as an independent body.
References
Cadot, O., E. Munadi, and L.Y. Ing (2015), ‘Streamlining Non-tariff Measures in ASEAN: The Way Forward’, Asian Economic Papers, 14(1), 35–70.
Nicita, A. and J.Gourdon (2013), ‘A Preliminary Analysis on Newly Collected Data on Non-Tariff Measures’, UNCTAD Policy Issues in International Trade and Commodities Study Series No. 53. New York and Geneva: United Nations Conference on Trade and Development.
United Nations Conference on Trade and Development (UNCTAD) (2013), Non-tariff Measures to Trade: Economic and Policy Issues for Developing Countries. Developing Countries in International Trade Studies. New York and Geneva: United Nations.
World Bank (2008), Regulatory Transformation in Mexico, 1988–2000. Case Studies on Reform Implementation Experience. Washington, DC: World Bank.
World Trade Organization (WTO) (2012), World Trade Report 2012. Trade and Public Policies: A Closer Look at Non-tariff Measures in the 21st Century. Geneva: World Trade Organization.


77
CHAPTER 6
Non-tariff Measures in the Lao People’s Democratic Republic
Amphaphone Sayasenh15
National Economic Research Institute, Lao People’s Democratic Republic
1. Introduction
Since the introduction of the New Economic Mechanism in 1986, the Lao People’s
Democratic Republic (Lao PDR) has liberalized its trade through unilateral tariff reduction.
Hence, its highest tariff rate is now 40 percent, down from 150 percent in 1995; and over
half of its tariffs are under 5 percent. Its tariff regime has become more liberal when the
country came under the umbrella of the Association of Southeast Asian Nations (ASEAN),
which accounts for most of the country’s trade. Under ASEAN, currently 89 percent of the
total products have an import tariff of 0 percent and the proportion will increase to 96
percent in 2018. As in many other countries, non-tariff measures (NTMs) are gaining
importance in controlling and hampering the flow of international trade. Several
ministries in the Lao PDR are involved in formulating and implementing such regulations
that may have a trade impact, and frequently new regulations are developed with little
regard to the negative impact these may have on the trading community.
The Economic Research Institute for ASEAN and East Asia (ERIA), in collaboration
with the United Nations Conference on Trade and Development (UNCTAD), has collected
NTM data for all ASEAN countries. Based on this dataset, this chapter aims to provide
insight on NTMs in the Lao PDR.
Table 6.1 summarizes the comprehensiveness of the data on NTMs for Lao PDR.
There are a total of 70 NTM-related regulations. These regulations yield 301 NTMs, which
is many folds higher than a number of NTMs reported to the WTO of 12 NTMs. In
addition, those 70 NTM-related regulations are issued by 14 institutions. Interestingly,
Table 6.1 reveals that every tariff line is affected by at least one NTM.
15
The researcher would like to thank Mr. Saygnasak Sengaloun and Mrs. Phonesavanh Sittideth for their assistance in compiling NTM data of Lao PDR.

Non-Tariff Measures in ASEAN
78
Table 6.1: Comprehensiveness of Non-tariff Measures
Number Comprehensiveness Number
1 Total NTM-related regulations 70
2 Total NTM reported to the WTO 12
3 Total number of coded NTMs 301
4 Total affected products (HS lines, national tariff lines) a. Total number of affected products 9,558
b. Share of the number of affected products to the number of total products (%) 100%
5 Total issuing institutions 14 Source: Authors’ calculation based on the newly constructed 2015 NTM database ASEAN-ERIA-UNCTAD raw data.
2. Types and sources of legal documents
According to the Law on Legislation Making (2012), the country’s legislation of
general application consists of the following: (1) the Constitution; (2) laws; (3) resolutions
of the National Assembly; (4) resolutions of the Standing Committee of the National
Assembly; (5) Ordinances of the President; (6) decrees of the government; (7) resolutions
of the government; (8) orders and decisions of the Prime Minister; (9) orders, decisions,
and instructions of the minister, minister-equivalent, and head of a government
authority; (10) orders, decisions, and instructions of the provincial governors and capital
governors; (11) orders and decisions of the district and municipality chiefs; and (12)
village regulations.
As illustrated in Table 6.1, among the legal documents, 70 contain non-tariff
measures. Two-thirds of the legal documents with NTMs are decisions and instructions of
the ministers and one-fifth are laws.
All legal documents are officially in the Lao language and most of them can be
found in two main electronic sources – the Lao Official Gazette and the Lao Trade Portal.
The Lao Trade Portal also provides unofficial English translation to a number of laws and
regulations.
3. Non-tariff measures in the Lao PDR
To better understand NTMs in the Lao PDR, NTM data were analysed in detail. It
may be noted that NTM data analysis started at the measure level. That means regardless
of a number of tariff lines affected, each registered measure is counted as one. For
example, Decree on the Control of the Movement of Animals and Animal Products,

Chapter 6
79
number 230/GOL dated on 4th June 2012, indicates that ‘To import of livestock and
animal products, the import permit issued designated by the relevant department of the
Ministry of Agriculture and Forestry is required’. This is an NTM and classified as A14
according to UNCTAD’s February 2012 Version Classification. This measure affects 913
national tariff lines. It is, however, counted as one measure. The national tariff line of the
Lao PDR is at 8-digit HS Code and the total number of tariff lines is 9,558.
Table 6.2 shows a total of 301 measures registered and it may be noted that all
the national tariff lines are affected by at least one NTM. Among all registered measures,
the technical barriers to trade (B chapter, NTM code) accounts for the largest share at
30.2 percent and affects 19.4 percent of all the national tariff lines. Interestingly, export-
related measures (P chapter, NTM code) account for 27.2 percent and affect 35.8 percent
of all tariff lines. Price control measures (F chapter, NTM code) accounts for 15.9 percent
but affects all the national tariff lines. Sanitary and phytosanitary (SPS) measures (A
chapter, NTM code) accounts for 12.6 percent and affects about 21 percent of all tariff
lines. Share of chapter E on non-technical licensing, quotas, prohibition and quantitative
measures is 8.6 percent of all measures, but they affect only 4.6 percent of all tariff lines.
Pre-shipment inspection and other formality measures (C chapter, NTM code) account for
a smaller share, at 4.65 percent of total NTMs, but affect a sizeable portion or 24.3
percent of tariff lines. Measures under F chapter account for less than 1 percent of all
measures. Measures under chapter D, H and I were not found.

Non-Tariff Measures in ASEAN
80
Table 6.2: Non-tariff Measures by Type
Code NTM by Type Number of NTMs %
A Sanitary and phytosanitary (SPS) measures 38 22
B Technical barriers to trade (TBT) 91 16
C Pre-shipment inspection and other formalities 14 4
D Contingent trade protective measures 0 0
E
Non-automatic licensing, quotas, prohibitions, and quantity control measures other than SPS or TBT reasons 26 1
F Price control measures, including additional taxes and charges 48 35
G Finance measures 2 0
H Measures affecting competition 0 0
I Trade-related investment measures 0 0
J Distribution restrictions
K Restriction on post-sales services
L Subsidies (excluding export subsidies under P7)
M Government procurement restrictions
N Intellectual property
O Rules of origin
P Export-related measures 82 23
Total coded NTMs 301 100 NTM = non-tariff measure. Notes: The classification and NTMs codes follow the UNCTAD Classification, 2012 Version. The ERIA–UNCTAD’s data collection of NTMs for ASEAN countries does not include the collection of J–O NTMs. Sources: Authors’ calculation based on the newly constructed 2015 NTM database ASEAN-ERIA-UNCTAD raw data.
Table 6.3 gives an overview of the number of measures by each issuing agency.
Data show that NTMs involved not only commerce agencies but other line ministries.
Measures issued by Ministry of Industry and Commerce account for 18.6 percent of a
total number of measures. The largest share of NTMs comes from Ministry of Agriculture
and Forestry, 19.9 percent. The government’s office and Ministry of Health both have
about 18 percent share of all NTMs. Measures issued by the Ministry of Finance account
for 7.3 percent. Other line ministries have their own shares from the total number of
NTMs at less than 3.5 percent.

Chapter 6
81
Table 6.3: Non-tariff Measures by Issuing Agency
Number Issuing Agency Number of NTMs
Total NTMs (%)
1 Government's Office 55 18.27
2 Ministry of Health 53 17.61
3 Ministry of Finance 22 7.31
4 Ministry Agriculture and Forestry 60 19.93
5 Ministry of Natural Resource and Environment 6 1.99
6 Ministry of Industry and Commerce 56 18.60
7 Ministry of Public Work and Transport 7 2.33
8 Ministry of Energy and Mine 6 1.99
9 Ministry of National Defence 9 2.99
10 Ministry of Information Culture and Tourism 10 3.32
11 Ministry of Telecommunication and Post 6 1.99
12 President's Office 1 0.33
13 Bank of Lao PDR 9 2.99
14 Ministry of Home Affairs 1 0.33
Total 301 100 Sources: Authors’ calculation based on the newly constructed 2015 NTM database ASEAN-ERIA-UNCTAD raw data.
Figure 6.1 shows the ‘depth’ of NTMs in each product group. More than 95
percent of animal products, vegetable products, and foodstuffs are subject to three or
more NTMs. Similarly, a large number of transportation (88 percent) and mineral
products (76 percent) are subject to three or more NTMs. The rest of the product groups
have the majority of their tariff lines subject to two NTMs. If all the product groups were
combined, figures show that 58 percent of all tariff lines were subject to two NTMs, 41
percent of all tariff lines were subject to three or more NTMs, and 1 percent is subject to
one NTM.
Complementing Figure 6.1, Figure 6.2 shows the average number of NTMs faced
by each group of products. As shown, the number of NTMs faced by each group of
product varies substantially. Animal and animal products are affected by more than 22
NTMs on average—where nine NTMs are SPS and seven NTMs are export-related
measures. Similarly, vegetable products also face as high as 20 NTMs on average—with
nine on SPS, six on export-related measures and 5 on price control and pre-shipment
measures. Another group of products that faces a large number of NTMs is foodstuffs. On
average, foodstuffs is subject to 17 NTMs—eight SPS, five price control measures, and

Non-Tariff Measures in ASEAN
82
four export-related measures. On the other hand, raw hides and skins, footwear, and
textiles are subject to only two NTMs on average; and plastics/rubbers, stone/glass, and
miscellaneous products are subject to less than five NTMs.
Figure 6.1: Tariff lines in Each Product Group Affected by One or More Non-tariff Measure (%)
Sources: Authors’ calculation based on the newly constructed 2015 NTM database ASEAN-ERIA-UNCTAD raw data.
Figure 6.2: Average Number of Non-tariff Measures Faced by Product Group
Sources: Authors’ calculation based on the newly constructed 2015 NTM database ASEAN-ERIA-UNCTAD raw data.
- 5 10 15 20 25
Animal & Animal Products
Vegetable Products
Foodstuffs
Mineral Products
Chemicals & Allied Industries
Plastics / Rubbers
Raw Hides, Skins, Leather, &…
Wood & Wood Products
Textiles
Footwear / Headgear
Stone / Glass
Metals
Machinery / Electrical
Transportation
Miscellaneous
Type A NTMs
Type B NTMs
Type C NTMs
Type E NTMs
Type F NTMs
0.0
10.0
20.0
30.0
40.0
50.0
60.0
70.0
80.0
90.0
100.0
1 NTM 2 NTMs 3 NTMs or more

Chapter 6
83
4. Other observations
In February 2013, the Lao PDR became a member of the World Trade Organization
(WTO). The process of WTO membership, coupled with regional integration, has
contributed to a great extent to improving the legal environment of the country. Over the
past few years, a large number of amended laws and new legislations have been
approved. The improvement of the legal environment is, however, an ongoing process. It
is expected that a number of legislations will be issued in the coming years, which will
likely change the NTMs stock of the Lao PDR.
The analysis above suggests that most of the regulations that contain NTMs are
legislations at the ministry level. However, unlike the country’s standard laws, ministry-
level legislations are not readily available and accessible. Even within the ministry, stock-
keeping of legislation is not centralised but rather kept within the issuing departments.
This causes, to some extent, redundancy of regulations as some agencies issue new
regulations without taking into account the existing ones. This style of stock-keeping of
regulations also hinders the efforts to collect a comprehensive NTM data in the future.
The large number of NTMs issued by various line ministries highlights the
importance of enhancing the awareness and knowledge on NTMs. The high incidence of
NTMs also reflects the situation where line agencies might have low awareness or
knowledge of NTMs and that they do not fully realize the potential impact these
regulations could have on trade. The high incidence, depth, and large presence of non-
technical measures suggest that there is an urgent need to streamline NTMs in the Lao
PDR.
As part of WTO membership and ASEAN commitments, the Lao PDR is already
engaged in modest streamlining of its stock of NTMs. The Ministry of Industry and
Commerce has, through the Trade Development Fund supported by development
partners, set up a clear agenda to streamline the NTMs of the Lao PDR in the coming
years. The ministry has already taken initiatives by forming the NTMs review working
group with representatives coming from line ministries, the private sector, and research
institutes. In addition, the ministry has also collected data on NTMs and made the NTM
database available at its trade portal.

Non-Tariff Measures in ASEAN
84
5. Recommendations
The findings that both the incidence and depth of NTMs are high in the Lao PDR
suggest that there is an urgent need to streamline NTMs in the country. Taking into
consideration the initiatives already taken by the Ministry of Industry and Commerce, this
chapter provides the following policy recommendations:
The Ministry of Industry and Commerce needs to keep its momentum in
streamlining NTMs. In addition to forming the NTMs review working group, it
needs to include NTM issues in the agenda for trade-related meetings among
high-ranking officials to gain political traction and support in streamlining the
NTMs. The political support from line ministries is necessary because NTMs
involve not only the Ministry of Industry and Commerce but also other line
ministries where the majority of NTMs originate.
The Ministry of Industry and Commerce could make use of the ERIA–UNCTAD
NTM database to complement its database, which can increase
comprehensiveness and become more up-to-date.
It is necessary to enhance the knowledge and capacity of stakeholders on NTMs.
NTM data collection and analysis, as well as streamlining efforts, should be
pursued and enhanced further. To ensure the sustainability of knowledge and
the capacity-building process, training of trainers should be undertaken. This will
ensure the availability of local and in-house expertise in line agencies. As noted
earlier, some line agencies have limited awareness on the potential impact their
regulations could have on trade. The participation of local academic and
research institutions should be encouraged.
Line ministries and government agencies need to stocktake their regulation
functions and improve the stock keeping of those regulations. All regulations
should be readily available and accessible. Centralized sources, such as the Lao
Official Gazette and the Lao Trade Portal, should be optimally utilized. This will
not only improve the collection of NTM data but also improve the legal
environment of the country.

Chapter 6
85
As more legislation is expected to be issued in the coming years – driven by WTO
membership and the ASEAN integration – timely and regular updating of the
NTM database in the next few years should be undertaken. The frequency of
updating the database could be less in later years.
References
Government of the Lao People’s Democratic Republic, Ministry of Industry and Commerce (2015), Lao Trade Portal 2015. Available at: http://www.laotradeportal.gov.la/ (accessed 29 December 2015).
Government of the Lao People’s Democratic Republic, Ministry of Justice (2015), Lao Official Gazette, 2015. Available at: http://laoofficialgazette.gov.la/ (accessed 29 December 2015).
Government of the Lao People’s Democratic Republic, National Assembly (2012), Law on Legislation Making. Vientiane: Government of Lao PDR.
United Nations Conference on Trade and Development (UNCTAD) (2012), Non-Tariff Measures to Trade: Economic and Policy Issues for Developing Countries. Geneva: United Nations Conference on Trade and Development.
United Nations Conference on Trade and Development (UNCTAD) (2013), Classification of Non-tariff Measures, February 2012 Version. Geneva: United Nations Conference on Trade and Development.


87
CHAPTER 7
Non-tariff Measures in Malaysia
Evelyn S. Devadason, V.G.R. Chandran, and Tang Tuck Cheong
University of Malaya, Kuala Lumpur, Malaysia
1. Introduction
Regulatory heterogeneity is a challenge for increasing trade, harmonizing
standards, and creating an integrated Association of Southeast Asian Nations (ASEAN)
single market. A significant number of non-tariff measures (NTMs)16 prevail, including
non-tariff barriers (NTBs)17 (RSIS, 2013), arising primarily from diverse national standards
and regulations (Pettman, 2013; Norani, 2014).
Efforts are underway to harmonize regulatory standards under the ASEAN
Economic Community (AEC). However, there are information shortcomings on the extent
of the diversity of NTMs in the various sectors within the ASEAN countries. The picture on
NTMs remains sketchy, as the existing databases lack complete information. For this
purpose, there is a need for a nuanced understanding on the types and forms of
standards and regulations imposed by the member nations not just for recognizing
regional measures but also for allowing member nations to adopt each other’s
regulations and plausibly harmonize some standards within the region.
This chapter constructs and applies a new database to provide a comprehensive
assessment of NTMs from the Malaysian perspective. More specifically, the chapter
details the diverse types of NTMs for the various sectors based on acts and regulations
that prescribe the conditions for importing into and exporting from Malaysia.
16
NTMs are policy measures, other than ordinary customs tariffs, that can potentially have an economic effect on the international trade in goods, changing quantities traded or prices, or both (UNCTAD, 2010). 17
Not all NTMs are NTBs.

Non-Tariff Measures in ASEAN
88
2. Non-tariff measures database
This chapter deals only with public regulations and standards set by the
government measures. The NTMs are drawn directly from a total of 64 related acts and
regulations in Malaysia.18 Only laws19 enacted by the federal legislature are compiled in
the database.
The Food Regulations 198520 of the Food Act 1983,21 which regulate the various
aspects of food standards in Malaysia, are analysed separately in this chapter. The reason
for this is that the food sector is highly regulated. All food, beverage, and edible
agricultural products manufactured locally or imported are required to comply with the
guidelines stipulated in the Food Regulations 1985.
The NTMs are based on the classification of import and export measures by the
United Nations Conference on Trade and Development (UNCTAD). The database and
classification applied in this chapter is considered to be more comprehensive than the
measures depicted in the current ASEAN database.22
3. Overview of non-tariff measures
Table 7.1 provides some general statistics on the NTMs in Malaysia based on the
newly constructed database. Clearly, the number of notifications made at the World
Trade Organization (WTO) is not a reflection of the number of NTMs in the country (see
also Cadot et al., 2013; Malouche et al., 2013). The total number of NTMs recorded for
Malaysia is 713, affecting approximately 54 percent of the total tariff lines.
18
If the act comes with corresponding regulation(s), only the latter is compiled for the database. This is because regulations, commonly known as ‘subsidiary legislations’, are more specific in the description as they are guidelines that dictate how the provisions of the act are applied. The reference to regulations will also avoid any redundancy in coding of the NTMs. 19
Malaysian written laws are contained in codes and statutes, known as acts, ordinances, and enactments. Acts are laws enacted by the Parliament. Ordinances and enactments refer to laws enacted by state legislative assemblies. 20
Until 2014, several amendments of the regulations have been made. 21
There are four regulations under the Food Act 1983: Food Export (Issuance of Health Certificate for Export of Fish and Fish Product to the European Union) Regulation 2009, Food Regulations 1985 (amended 2014), Food Hygiene Regulations 2009 (amended 2014), and Control of Tobacco Product Regulations 2004 (amended 2013). 22
NTM database for ASEAN. http://www.asean.org/communities/asean-economic-community/item/non-tariff-measures-database.

Chapter 7
89
Table 7.1: Non-tariff Measures in Malaysia
No. Comprehensiveness Number
1 Total NTM-related regulations 64
2 Total NTM reported to the WTO 252
3 Total number of coded NTMs 713
4 Total affected products (HS lines, national tariff lines)
a. Total number of affected products 5,127
b. Share of the number of affected products to the number of total products (%) 54.44%
5 Total issuing institutions 13 Notes: The total number of notifications made at the WTO by Malaysia for TBTs is 216 and for SPS, 36. Source: Authors’ calculation based on the newly constructed 2015 NTM database ASEAN-ERIA-UNCTAD raw data.
Of the total 13 ministries that administer the acts and regulations with trade-
related measures, the Ministry of Health is considered the most important, based on the
number of NTMs found in the written laws that come under its portfolio (Table 7.2).
Table 7.2:Non-tariff Measures in Malaysia, by Issuing Institutions
Number Issuing Institutions Number of
NTMs %
1 Ministry of Health 502 70.41
2 Ministry of Agriculture and Agro-Based Industry 86 12.06
3 Ministry of Natural Resources and Environment 39 5.47
4 Ministry of Plantation Industries and Commodities 27 3.79
5 Ministry of Human Resources Malaysia 14 1.96
6 Ministry of Finance 13 1.82
7 Ministry of Foreign Affairs 9 1.26
8 Ministry of Home Affairs 8 1.12
9 Energy Commission 5 0.70
10 Malaysian Communications and Multimedia Commission 4 0.56
11 Other Institutions 6 0.84
Total 713 100.00 Source: Authors’ calculation based on the newly constructed 2015 NTM database ASEAN-ERIA-UNCTAD raw data.
Overall, the NTMs in Malaysia are highly concentrated as they are distributed only
across seven out of the 16 chapters (Table 7.3). Technical measures dominate the NTMs
as they constitute 84 percent of total reported NTMs.

Non-Tariff Measures in ASEAN
90
Table 7.3:Non-tariff Measures in Malaysia, by Non-tariff Measure Type
Code NTM Type Number of NTMs %
A Sanitary and phytosanitary measures 259 36.33
B Technical barriers to trade 332 46.56
C Pre-shipment inspection and other formalities 5 0.70
D Contingent trade protective measures 24 3.37
E Non-automatic licensing, quotas, prohibitions, and quantity control measures other than SPS or TBT reasons 9 1.26
F Price control measures including additional taxes and charges 12 1.68
P Export-related measures 72 10.10
Total coded NTMs 713 100.00
Technical Measures 596 83.59
Non-technical Measures 117 16.41
Total coded NTMs 713 100.00 Source: Authors’ calculation based on the newly constructed 2015 NTM database ASEAN-ERIA-UNCTAD raw data.
4. Special case: the food sector
4.1. Food standards, regulations, and international trade
Governments usually set standards for food imports that require foreign
producers to meet same standards required of domestic producers (Mitchell, 2003).
Likewise, ASEAN member countries are found to arbitrarily adopt food control systems
under sanitary and phytosanitary (SPS) measures for imports, despite the fact that ASEAN
has several bodies23 dealing with food safety (RSIS, 2013). The food sector is therefore
highly regulated, with various measures related to product characteristics, production,
processing, and distribution. The complexity in regulations for the food sector reflect
consumers’ demand for food safety, firms’ reputation for providing safe food and
maintaining global market shares, and new hazards that surface in global food trade.
These regulations, however, differ across countries in terms of types/forms and desired/
stringency levels, for example, different levels of tolerance for food safety risks and
different levels of accidental contamination. The regulations also differ significantly
23
These bodies include the ASEAN Expert Group on Food Safety, the ASEAN Task Force on Codex, the ASEAN Consultative Committee on Standards and Quality, and the ASEAN Sub-Committee on Food Science and Technology.

Chapter 7
91
across food types, such as raw and processed food, less and highly perishable food
products, and products with low or high incidence of risks for human health.
Hence, differences in regulations, resulting from differences in regulatory
approaches and capacity and consumer risk preferences, result in multiple safety regimes
that could disrupt trade and cause conflict between countries. However, Buzby and
Unnevehr (2003) argue that these differences could in fact spark more dialogue between
countries, leading to change and improvement in the food safety systems. Further, some
argue that implementing food safety standards represents increased compliance costs to
firms. Standards may therefore act as a barrier to trade. Notwithstanding that, standards
can solve information asymmetries between buyers and sellers and reduce transaction
costs (Schuster and Maertens, 2015; Athukorala and Jayasuriya, 2003).
4.2. Regional source for food imports
Malaysia’s food imports from ASEAN recorded an average annual growth rate of
15.9 percent relative to global food imports at 12.5 percent for 2000–2014 (Figure 7.1).
Imports of food from the region rose from US$80 million in 2000 to US$4,408 million in
2014. The region is considered an important import source for food24 (RSIS, 2013); it
represents 30.4 percent of Malaysia’s global imports of food in 2014. On a regional level,
food is also identified as a potential sector to derive benefits when the AEC fully rolls out
(Pettman, 2013).
By categories of food products, high import concentration is noted, with fats,
animal, and vegetable (Harmonized System [HS]15), fish, crustaceans (HS03), cereal,
flour, starch (HS19), cereals (HS10), and cocoa (HS18) accounting for more than 60
percent of total imports from ASEAN (Table 7.4). The same products account for large
shares in total imports of Malaysia from the world. The only exception is that though
ASEAN is not an important source for dairy products, these imports constitute a relatively
larger share of global imports to Malaysia.
Within ASEAN, food products are mainly imported from Indonesia and Thailand
(Figure 7.2). While Indonesia gained in terms of import market share of Malaysia for food
24
The move towards the AEC has increased intra-ASEAN trade, largely due to the increase in processed food trade.

Non-Tariff Measures in ASEAN
92
products between 2000 and 2014, the opposite holds for Thailand where the reduction in
import reflects the growing importance of Singapore and Viet Nam as food import
sources for Malaysia. The four major import markets for food products serve the
Malaysian market for different food categories.
Figure 7.1: Malaysia – Food Imports from ASEAN and the World (US$ million)
ASEAN = Association of Southeast Asian Nations. Source: Calculated from UN COMTRADE.
The varying market and product concentration of food imports from the region
suggest that NTMs are also going to affect the member states disproportionately. Efforts
to harmonize standards within the region should also account for the intensity of trade
across the different food subsectors.

Chapter 7
93
Table 7.4: Malaysia – Import Concentration of Food Products from ASEAN and the World (%)
Malaysia–ASEAN Malaysia–World 2000 2014
HS Category 2000 2006 2014 2000 2006 2014 SGP THAI INDO VNM SGP THAI INDO VNM
HS 02 Meat, edible 0.79 0.10 0.86 6.18 4.25 6.12 0.10 1.21 0.17 2.56 0.37 2.15 0.00 1.57
HS 03 Fish, crustaceans 19.76 10.45 9.03 8.36 8.05 6.63 4.12 22.16 19.94 12.37 1.34 8.01 9.89 14.45
HS 04 Dairy products 1.42 2.45 0.42 9.66 7.19 8.06 0.75 0.10 3.71 0.66 1.80 0.12 0.21 0.63
HS 07 Edible vegetables 6.21 4.55 2.72 7.70 7.22 5.24 0.10 7.72 2.47 1.43 0.15 3.29 0.35 6.90
HS 08 Edible fruits, nuts 2.50 1.11 2.03 3.54 2.31 3.63 0.01 4.81 1.18 0.21 0.25 3.29 1.19 1.67
HS 09 Coffee, tea, spices 4.93 3.80 4.70 3.07 3.28 3.81 4.64 0.20 8.92 18.44 2.49 0.15 5.62 19.27
HS 10 Cereals 17.10 13.84 8.66 19.72 15.47 12.93 2.61 30.15 0.37 48.02 0.11 14.14 0.01 33.30
HS 11 Milling products 2.93 2.27 3.49 3.09 1.97 2.89 1.47 6.35 0.24 0.44 0.92 9.04 0.64 3.60
HS 12 Oilseeds 3.10 1.73 0.82 7.27 4.41 3.66 0.05 0.59 5.89 7.27 0.05 1.03 0.69 1.31
HS 13 Lac, gums, resins 0.18 0.09 0.13 0.40 0.39 0.34 0.31 0.02 0.24 0.00 0.14 0.03 0.18 0.00
HS 15 Fats, animal and vegetable 11.27 24.30 23.61 4.74 11.60 9.85 9.01 1.26 21.43 2.55 4.59 8.07 47.29 3.25
HS 16 Meat and fish preparations 1.99 1.39 1.04 1.07 0.89 0.93 1.52 3.49 0.13 4.67 0.69 2.23 0.30 1.13
HS 17 Sugars 5.34 1.49 7.74 8.80 7.27 7.83 0.67 10.16 1.76 0.03 0.54 23.33 0.46 3.50
HS 18 Cocoa 8.96 16.95 9.76 3.15 11.71 9.04 3.78 0.14 24.97 0.00 10.20 0.55 19.47 1.45
HS 19 Cereal, flour, starch 6.95 8.12 10.22 4.64 4.92 5.44 34.61 4.76 5.39 0.37 19.17 10.65 6.99 0.60
HS 20 Vegetable and fruit preparations 1.27 0.67 1.12 1.92 1.48 2.16 2.95 2.21 0.15 0.42 0.99 2.51 0.19 0.48 HS 21 Miscellaneous edible preparations 4.40 4.02 9.16 4.98 4.61 6.49 21.96 4.50 2.86 0.51 34.60 6.50 6.35 3.96
HS 22 Beverages 0.91 2.66 4.49 1.72 2.97 4.95 11.33 0.16 0.18 0.04 21.59 4.90 0.15 2.92
HS = Harmonized System; INDO = Indonesia; SGP = Singapore; THAI = Thailand; VNM = Viet Nam. Source: Calculated from UN COMTRADE. .

Non-Tariff Measures in ASEAN
94
Figure 7.2: Malaysia – Geographical Concentration of Food Imports from ASEAN, 2000 and 2014 (%)
2000
2014
ASEAN = Association of Southeast Asian Nations; Lao PDR = Lao People’s Democratic Republic. Source: Calculated from UN COMTRADE.
4.3. Food safety standards in Malaysia
A total of 488 NTMs, affecting 1,349 tariff lines, are found in the food regulations,
and all of which comprise technical measures. Within the technical measures category, 55
percent constitute technical barriers to trade (TBTs)25 and the remaining 45 percent are
25
TBTs are also the major impediment for the expansion of regional and global trade in processed food (AFBA, 2014).
0.001

Chapter 7
95
SPS measures.26 Since all NTMs hail from the TBT and SPS chapters, Table 7.5 reports the
frequency counts of NTMs within those two chapters.27
Table 7.5: Frequency Counts of Non-tariff Measures for Sanitary and Phytosanitary and
Technical Barriers to Trade Chapters
A SPS Number %
A14 Special authorisation requirement for SPS reasons 4 1.80
A19 Prohibitions/restrictions of imports for SPS reasons n.e.s. 1 0.45
A21
Tolerance limits for residues of or contamination by certain (non-
microbiological) substances 1 0.45
A22
Restricted use of certain substances in foods and feeds and their contact
materials 125 56.31
A31 Labelling requirements 66 29.73
A33 Packaging requirements 9 4.05
A41 Microbiological criteria of the final product 1 0.45
A42 Hygienic practices during production 3 1.35
A51 Cold/heat treatment 6 2.70
A63 Food and feed processing 1 0.45
A64 Storage and transport conditions 1 0.45
A82 Testing requirement 4 1.80
B SPS 222 100.00
B31 Labelling requirements 65 24.44
B6 Product identity requirement 37 13.91
B7 Product quality or performance requirement 164 61.65
TBT 266 100.00
SPS = sanitary and phytosanitary; TBT = technical barriers to trade. Source: Derived from the Food Regulations 1985.
Labelling requirements are even more important for a country like Malaysia,
where more than half the population is Muslim, as such requirements apply to products
containing pork and alcohol. In addition, among the ASEAN countries that follow the
Codex Alimentarius guidelines,28 only Malaysia makes nutrition labelling mandatory for
energy, protein, carbohydrate, fat, and total sugars for foods that are commonly
26
The SPS refers to measures to protect human, animal or plant life, or health. 27
There are 42 and 31 sub-chapters for SPS and TBT, respectively, based on the UNCTAD classification. 28
For other ASEAN countries that follow the Codex Alimentarius guidelines, nutrition food labelling is voluntary, unless nutrition or health claims are made on food packaging or if the food is for a special purpose (diabetic and fortified foods).

Non-Tariff Measures in ASEAN
96
consumed (bread and milk, canned meat, fish, vegetables, fruit and fruit juices, salad
dressing and mayonnaise), and for various types of beverages (Kasapila and Sharifudin,
2011; Pettman, 2013).
Within the 28 subcategories of the food sector, the frequency count of NTMs is
highest for (i) salt and spice followed by (ii) sweetening substance, (iii) edible fat and
edible oil, (iii) alcoholic beverage, and (v) tea, coffee, chicory, and related products (Table
7.6).
4.4. Harmonization of food trade in ASEAN: some thoughts
ASEAN members have begun to recognize the desirability of having common
measures. For trade purposes, harmonization of standards enables food companies to
adhere to one set of regional regulations instead of adjusting to a diverse array of
regional standards of member countries. Following which, ASEAN members have
expressed their intention to use global food standards29 as a basis for harmonization
efforts in the food sector at the regional level. Yet, there has not been much progress in
this regard (AFBA, 2012).
One reason is that the diverse regulations that govern food and nutrition labelling
across ASEAN rest on the different international guidelines followed by member
countries when preparing national regulations. Kasapila and Sharifudin (2011) point out
that for food and nutrition labelling, Singapore, Malaysia, Brunei, Lao People’s
Democratic Republic, Viet Nam, and Cambodia have followed the Codex guidelines30 in
preparing their regulations. Conversely, Thailand and the Philippines, to some extent,
have adopted the United States nutrition labelling guidelines. Further, member countries
with more developed food safety systems have also adopted the ‘hazards’-based
approach, which does not allow for regulatory convergence, as there is no common basis
for the adoption of common food safety standards. What is needed is a shift towards a
‘risk’-based approach, which comes with a scientific basis (see also Henson and Caswell,
1999), to adopt common safety standards.
29
Organizations that are working to harmonize regulations in the food sector include Codex Alimentarius, the World Trade Organization, the Food and Agricultural Organization, the World Health Organization, the International Standardization Organization, the Global Harmonization Initiative, and the International Union of Food Science and Technology. 30
The Codex Alimentarius is significantly relevant for international food trade, as the food standard issues cover specific raw and processed materials characteristics, food hygiene, pesticides, residues, contaminants, and labelling and sampling methods.

Chapter 7
97
Table 7.6: Frequency Counts of Non-tariff Measures for Sanitary and Phytosanitary and Technical Barriers to Trade Chapters, by Product Group Product Category No. A14 A19 A21 A22 A31 A33 A41 A42 A51 A63 A64 A82 B31 B6 B7
Cereal, cereal product, starch and bread 25 8 3 3 3 8
Malt and malt extract 4 1 1 2
Food aerating substance 9 1 3 3 2
Milk and milk product 2 1 1
Sweetening substance 44 1 17 5 2 4 1 14
Confection 8 1 4 1 1 1
Meat and meat product 25 1 4 4 1 4 3 8
Fish and fish product 26 5 3 1 1 1 3 2 10
Egg and egg product 7 1 3 1 1 1
Edible bird’s nest and edible bird's nest product 2 1 1
Edible fat and edible oil 44 19 2 2 21
Vegetable and vegetable product 20 4 3 2 1 2 3 1 4
Soup and soup stock 2 1 1
Fruit and fruit product 24 5 4 2 4 9
Jam, fruit jelly, marmalade, and seri kaya 7 2 2 3
Nut and nut product 11 5 1 5
Tea, coffee, chicory, and related product 34 6 8 8 3 9
Cocoa and cocoa product 8 4 2 2
Milk shake 1 1
Salt and spice 70 23 3 3 8 33
Vinegar, sauce, chutney, and pickle 16 1 4 2 3 6
Soft drink 19 2 5 5 3 4
Natural mineral water 0
Packaged drinking water 4 1 1 1 1
Alcoholic beverage 42 8 5 1 6 8 14
Shandy 3 1 1 1
Special purpose food 23 5 5 1 1 5 2 4
Water, ice, or steam 3 1 2
FOOD PRODUCTS* 5 1 1 1 1 1
Total 488 4 1 1 125 66 9 1 3 6 1 1 4 65 37 164
Note: *Includes the general requirements for food products obtained through modern biotechnology. These guidelines were enforced on 8 July 2014. Source: Derived from the Food Regulations 1985.

Non-Tariff Measures in ASEAN
98
Notwithstanding the differences in the regulatory framework of member
countries, various efforts are already underway to address the issue of harmonization.
The ASEAN Consultative Committee on Standards and Quality and the ASEAN
Consultative Committee on Standards and Quality Prepared Foodstuff Products Working
Group are both responsible for the harmonization and convergence of food safety and
quality standards. Following which, several initiatives have been launched. The ASEAN
Common Principles of Food Control System, which includes regional requirements for the
labelling of pre-packaged foodstuffs, provides some direction for member countries to
align their national food and nutrition regulations with those generic labelling
requirements. The ASEAN Food Reference Laboratories, which coordinate and monitor
food-testing activities, support the ASEAN Common Principles of Food Control System.
Finally, the ASEAN Risk Assessment Centre, tasked with risk assessment activities,
recognizes the importance of the ‘risk’ approach for the harmonization of standards.
It is important to recognise that complete harmonization may not be practical or
politically feasible. As such, harmonization of regulations in the subsectors that have high
product coverage of NTMs (cover a large number of products) would make more sense.
While harmonization of standards is often done through benchmarking with international
standards, members also need to realise that improving region-wide regulatory practices
may in turn help members overcome difficulties in adhering to international standards
(RSIS, 2013; AFBA, 2012).
The premises for harmonization often build on the elimination of TBTs, having
recognized that these are prominent in the region (AFBA, 2014). Not all NTMs (including
TBTs) are NTBs. As pointed out by Malouche et al. (2013), the onus for policymakers
should not be on the suppression of NTMs, given the legitimacy of these measures. From
the Malaysian perspective, there are only a few recent cases of potential NTBs (not
clearly defined NTBs) related to food products, as reported by other member countries.
Table 7.8 presents three recent cases levelled by Viet Nam, Brunei, and Indonesia against
Malaysia. Most of these cases have been resolved with the member countries.

Chapter 7
99
Table 7.7: Recent Reported Cases of Non-tariff Measures/Non-tariff Barriers in Malaysia
NTM Reporter Issue Concern Status/ Remarks
Import licensing/SPS/permits and related measures
VNM Malaysia maintains TRQ for live pigs (HS 0103.91000, HS 0103.91000), live poultry (0105.11900, 010594190), pork of various kinds (HS 0203.11000, 0203.21000); poultry meat (0207.11000, 0207.12000, 0207.130000, 0207.14000), milk (0401.10110, 0401.20110, 0401.30110), chicken eggs and duck eggs (0407.00111, 0407.00112, 0407.00910, 0407.00920), round cabbage (0704.90110). While the tariff rate within quotas is from 10–25%, it has high outside quotas, from 20%, 40%, 50%, and 90% respectively. (31/5/2012)
- Agency managing quotas and grant import license is the Animal Health Department. Other cooperating agencies include Ministry of Agriculture and Ministry of Health. (31/05/2012) TRQs are not applicable for ASEAN countries. VNM will revert since it needs to check with its private sector. (1/6/2012) VNM (12/7/2013): VNM considered this case resolved.
Import permit on meat products
BN Export and import meat that pass through Limbang is being subjected to charges by the Malaysian Agriculture Department for import permit at RM0.10 per kg of meat products and RM10 per export permit.
It affects the price of meat products.
MY Comment: Sarawak State Government has agreed to waive the licence/permit fees as specified under the Third Schedule of the Veterinary Public Health Ordinance, 1999 for the import/export of livestock (animal and fish) and livestock products between Brunei and Sarawak, effective 1 March 2012. A letter to that effect has been sent to Brunei. (14/05/12)
Border measures
INDO Malaysia requires imported wheat flour must obtain licence in advance, in accordance with the quota set by Malaysian authorities. (15/2/2012)
ATIGA Article 20 provides that ASEAN member states eliminate TRQs.
MY comment: The import licence or AP is required for monitoring purpose. No quota set for importation of wheat flour. (14/05/12) INDO: request MY to provide the relevant information. (LE/regulations/website) (1/6/2012) MY (12/7/2013): Refer to the information on www.customs.gov.my
ASEAN = Association of Southeast Asian Nations; ATIGA = ASEAN Trade in Goods Agreement; BN = Brunei; HS = Harmonized System, INDO =Indonesia; MY = Malaysia; NTB = non-tariff barrier; NTM = non-tariff measure; SPS = sanitary and phytosanitary; TRQ = tariff rate quota; VNM = Viet Nam. Source: Malaysian International Trade and Industry (2015).

Non-Tariff Measures in ASEAN
100
Thus, the focus should shift away from eliminating NTMs to streamlining NTMs across
the region, irrespective of the regulatory rapprochement that is taken; mutual
recognition31 or harmonization. In this respect, given the high frequency of these
measures in the food sector, this chapter contends that the harmonization of standards
and regulations should give priority to the following two areas:
labelling for SPS and TBT reasons; and
restricted substances on food.
Though the above suggestion is based on the frequency of NTMs found in the food sector
from the regulatory framework of Malaysia, AFBA (2014) has also identified the above
two areas (among three others) as priorities for harmonization within ASEAN. It should
also be sector specific as the food sector is highly diversified and trade within the region
will undeniably be concentrated in a few subsectors.
5. Concluding remarks
To move forward in facilitating trade within the region, the food sector should be
the focus of policymakers. The harmonization of standards and regulations in the food
sector, more specifically, would be best done in a piecemeal fashion. First, the focus is to
prioritise the task of harmonization by considering specific NTMs and specific subsectors
of food highly tradable within ASEAN. Second, the focus is to examine which of the NTMs
in the highly tradable sector of the region could impede trade.
References ASEAN Food and Beverage Alliance (AFBA) (2012), Harmonization of Food Standards in
ASEAN: A Shared Vision for Regulatory Convergence. Singapore: ASEAN Food and Beverage Alliance.
ASEAN Food and Beverage Alliance (AFBA) (2014), ASEAN Harmonization in the Food Sector. Singapore: ASEAN Food and Beverage Alliance.http://afba.co/wp-content/uploads/2014/01/AFBA-White-Paper.pdf(accessed 12 October 2015).
Atukorala, P.-C. and S. Jayasuriya (2003), ‘Food Safety Issues, Trade and WTO Rules: A Developing Country Perspective’, The World Economy, Wiley Blackwell, vol. 26(9), pp. 1395-1416.
31
Mutual recognition involves the acceptance of different forms of food safety regulation among countries as ‘equivalent’ (Henson and Caswell, 1999).

Chapter 7
101
Buzby, J.C. and L. Unnevehr (2003), ‘Introduction and Overview’, in Jean C. Buzby (ed.), International Trade and Food Safety: Economic Theory and Case Studies, Agricultural Economic Report No. AER-828. United States Department of Agriculture (USDA) Economic Research Service, 10–27. http://www.ers.usda.gov/publications/aer-agricultural-economic-report/aer828.aspx (accessed 15 October 2015).
Cadot, O., E. Munadi, and L.Y. Ing (2013), ‘Streamlining NTMs in ASEAN: the Way Forward’, ERIA Discussion Paper 2013-24, Jakarta: Economic Research Institute for ASEAN and East Asia.
Henson, S. and J. Caswell (1999), ‘Food Safety Regulation: An Overview of Contemporary Issues’, Food Policy, 24, 589–603.
https://foodindustry.asia/documentdownload.axd?documentresourceid=473(accessed 15 October 2015).
Kasapila, W. and M.D.S. Sharifudin (2011), ‘Harmonisation of Food Labelling Regulations in Southeast Asia: Benefits, Challenges and Implications’, Asia Pacific Journal of Clinical Nutrition, 20(1), 1–8.
Malouche, M., J-D Reyes, and F. Amir (2013), Making Trade Policy More Transparent: Anew Database of Non-tariff Measures, Economic Premise No.123.Washington, DC: World Bank.
Mitchell, L. (2003), ‘Economic Theory and Conceptual Relationships between Food Safety and International Trade’, in Jean C. Buzby (ed.), International Trade and Food Safety: Economic Theory and Case Studies, Agricultural Economic Report No. AER-828.Washington, DC: United States Department of Agriculture Economic Research Service, 10–27. http://www.ers.usda.gov/publications/aer-agricultural-economic-report/aer828.aspx(accessed 15 October 2015).
Norani M.O. (2014), ‘Food Safety in Southeast Asia: Challenges Facing the Region’, Asian Journal of Agriculture and Development, 4(2), 83–92.
Pettman, S. (2013), ‘Standards Harmonisation in ASEAN: Progress, Challenges and Moving Beyond 2015’, ERIA Discussion Paper 2013-30, Jakarta: Economic Research Institute for ASEAN and East Asia.
RSIS (2013), ‘Expert Group Meeting on the ASEAN Economic Community 2015: Opportunities and Challenges for Food Security’, Singapore: Rajaratnam School for International Studies.
Schuster, M. and M. Maertens (2015), ‘The Impact of Private Food Standards on Developing Countries’ Export Performance: An Analysis of Asparagus Firms in Peru’, World Development, Elsevier, vol. 66(C), pp.208-221.
United Nations Conference on Trade and Development (UNCTAD) (2010), Non-tariff Measures: Evidence from Selected Developing Countries and Future Research Agenda. Geneva: United Nations Conference on Trade and Development.
United Nations Conference on Trade and Development (UNCTAD) (2013), Non-tariff Measures to Trade: Economic and Policy Issues for Developing Countries. Geneva: United Nations Conference on Trade and Development.

102

103
CHAPTER 8
Report on Non-tariff Measures in Myanmar
Cho Cho Thein and Zin Zin Naing
Yangon University of Economics, Myanmar
1. Introduction
There is a relationship between the reduction of tariffs arising from the World
Trade Organization (WTO) multilateral agreements and numerous regional and
bilateral level preferential trade agreements (PTAs), and the proliferation of non-tariff
measures (NTMs). Efforts to reach a common understanding on the importance of the
different types of NTMs and their impact on trading activities especially in developing
countries have been challenging, and these efforts include those that were initiated in
Myanmar.
The most challenging part in the study of NTMs in Myanmar is to be able to fully
cover and review all regulations issued in the country. The second most challenging part
is to identify the affected products in terms of the Harmonized System (HS) code. The
preliminary step to compile the data based on the product groups has been done by the
Myanmar team, and the more precise classification of products in the HS code is
accomplished by the United Nations Conference on Trade and Development (UNCTAD).
2. The legal framework
The collection of data for NTMs requires knowledge on how legislation proceeds
in a country. In Myanmar’s legal system, the ministry having the jurisdiction drafts a
legislative bill that is to be introduced. Based on this first draft of the legislation,
consultations take place with other ministries concerned. The originating ministry that

Non-Tariff Measures in ASEAN
104
first drafted the legislation then revises the draft in accordance with the discussion
results, advice, and comments from the inter-ministerial consultations. For NTMs, the
Ministry of Commerce may repeat the discussion and procedure to follow the advice of
referral international nongovernment organizations. Once the required procedure is
completed, the draft legislation is sent to the Attorney General for crafting it into its
proper statutory form. The Office of the Attorney General prepares a comment to
accompany the draft legislation, which is in turn submitted to the Hluttaw (Parliament)
for further discussion. The draft legislation is also presented to the public through the
media, such as newspapers. To incorporate the public’s comments, the Hluttaw again
revises the draft legislation. If the Hluttaw decides in favour of the legislation, the
legislative bill is finalized, goes to the Office of the President, is signed, and it becomes
law.
The sources of information for laws and regulations can be categorized into three.
The Official Gazette is the most common and up-to date source of information on
regulations issued at a point of time. The second source is the database of the Office of
the Attorney General, which provides almost all laws, Cabinet orders, and Cabinet and
ministerial ordinances. It is also supposed to be a comprehensive source of NTM-related
regulations. However, the most comprehensive sources of regulations are the ministries
themselves, where specific regulations affecting their trade activities are lodged.
There are many countries where regulatory functions are scattered over a number
of ministries and agencies, with little incentive to work together and regulations are
often adopted with narrow mandates domestically (Cadot, Munadi, and Ing, 2013).
Myanmar is not exceptional among such countries. The Ministry of Commerce in
Myanmar is now leading the effort to make regulations available in the forthcoming Trade
Portal.
Since ASEAN is leading in improving transparency of its trade regulations, this
chapter is a foundation for Myanmar being an ASEAN member to keep improving the
transparency of trade regulations in the region.
3. Study coverage of non-tariff measures in Myanmar
Since no official database is yet available or all the standards referred to in
Myanmar’s legislation, it is difficult to confirm the full coverage of such legislation. For full

Chapter 8
105
and complete information on Myanmar’s NTMs, two stages of collecting regulations were
used. The first step undertaken was a survey of the websites, newspapers, and key
informants of all ministries that were considered likely to issue regulations affecting their
particular trade activities. The Ministry of Commerce was main source of information as it
has been the most responsible organization in Myanmar for collecting trade related-
regulations. The second stage was confirming the collected data with the Ministry of
Commerce, where compliance of NTMs is monitored. The registration of NTMs is finalized
by UNCTAD.
Table 8.1: Coverage of Non-tariff Measures in Myanmar
Number Comprehensiveness Number
1 Total NTM-related regulations 36
2 Total NTM reported to the WTO 0
3 Total number of coded NTMs 172
4 Total affected products (HS lines, national tariff lines)
a. Total number of affected products 4,663
b. Share of the number of affected products to the number of total products (%) 48.8%
5 Total issuing institutions 8 Source: Authors’ calculation based on the newly constructed 2015 NTM database ASEAN-ERIA-UNCTAD raw
data.
Table 8.1 reveals the incidence of NTMs in Myanmar in terms of the frequency
ratio. Overall, among the regulations issued and reviewed by mid-2015, 36 regulations
were observed as NTMs and from them, 172 NTMs were coded and registered. Summing
all NTMs across the 10-digit HS level, the data reveal a total of 4663 NTM-affected
products in Myanmar. 48.79 percent of product categories are covered by one or more
NTMs.
4. Non-tariff measures by type
Myanmar had 100 percent frequency ratio of by-type NTMs on account of
quantitative restrictions (Ando and Obashi, 2010). Some of these NTMs might have
legitimate reasons. Some NTMs are policy measures concerning security, such as
transport of firearms or explosives, or public health, such as trade in dangerous chemicals
and radioactive materials. A number of NTMs are bans on trade, such as opium and drug
narcotics.

Non-Tariff Measures in ASEAN
106

Chapter 8
107
Figure 8.1: Non-tariff Measures, by Type
Source: Authors’ calculation based on the newly constructed 2015 NTM database ASEAN-ERIA-UNCTAD raw data.
The pattern of NTMs in Myanmar is similar to most ASEAN countries where
technical barriers to trade (TBT) and sanitary and phytosanitary (SPS) measures play a
significant role in the incidence of NTMs. Data collection of NTMs in Myanmar reveals
that the most widely regulated measure are SPS measures. The TBT measures are the
second most widely used measures, followed by export-related measures.
0 5 10 15 20 25 30 35 40 45 50
Sanitary and phytosanitary (SPS) measures
Technical barriers to trade TBT)
Export related measures
Price control measures
Non-automatic licensing, quotas,prohibitions and quantity control measures…
Pre-shipment inspection and otherformalities
Measures affecting competition

Non-Tariff Measures in ASEAN
108
Table 8.2: Non-tariff Measures, by Type
Code NTM by Type Number of NTMs %
A Sanitary and phytosanitary (SPS) measures 75 43.6 B Technical barriers to trade (TBT) 41 23.8
C Pre-shipment inspection and other formalities 2 1.2
D Contingent trade protective measures
E Non-automatic licensing, quotas, prohibitions, and quantity control measures other than SPS or TBT reasons
5 2.9
F Price control measures, including additional taxes and charges
13 7.6
G Finance measures
H Measures affecting competition 1 0.6
I Trade-related investment measures
J Distribution restrictions
K Restriction on post-sales services
L Subsidies (excluding export subsidies under P7)
M Government procurement restrictions
N Intellectual property
O Rules of origin
P Export-related measures 35 20.3
Total coded NTMs 172 100
Source: Authors’ calculation based on the newly constructed 2015 NTM database ASEAN-ERIA-UNCTAD raw data.
There are multiple NTMs on several products. Most of the product groups have
total NTMs exceeding their total number of tariff lines. This indicates that some of the
products within that group are subject to more than one NTM, compared or relative to
the number of tariff lines in each product. As Ando and Obashi observed in 2010,
Myanmar was found to cover all product lines with one or other types of NTMs.
Compared to the previous study on Myanmar’s NTMs (Ando and Obashi, 2010), it is
observed from this study that finance control measures, such as multiple exchange rates
and quantity control measures like quotas linked with export performance and quotas for
sensitive product categories no longer exist in Myanmar’s NTMs. Instead, technical
measures such as marking, labelling, and packaging requirements have become
important in Myanmar’s NTM composition. An examination on the frequency of NTMs by
type in Myanmar suggests that TBT measures are the most frequent measures, followed
by SPS and safeguard measures, according to the data in 2014 (Cadot and Ing, 2015). This
study confirms that SPS measures becomes the most regulated NTMs in Myanmar.

Chapter 8
109
Figure 8.2: Incidence of Multiple Non-tariff Measures, by Product Group
Source: Authors’ calculation based on the newly constructed 2015 NTM database ASEAN-ERIA-UNCTAD raw data.
Figure 8.2 confirms the moderate use of NTMs in Myanmar. The chemicals and allied
industries can be seen as the sector covered most by the greatest number of NTMs,
but, only 20 percent of its tariff lines are covered by NTMs, and many of the
product groups in its tariff lines are covered by one NTM only.
Of the total NTM incidence, 14.2 percent are on vegetable products with three or
more NTMs, while almost 11 percent, 10 percent, and 9 percent of NTMs are related to
animal products, foodstuffs, and machinery and electrical products, respectively. It is
noted that animal and animal products, vegetable fat and oil, vegetable extract, and meat
and fish are heavily covered by three or more NTMs (Figure 8.1).
0.0
5.0
10.0
15.0
20.0
25.0
30.0
35.0
1 NTM 2 NTMs 3 NTMs or more

Non-Tariff Measures in ASEAN
110
Table 8.3: Number of Tariff Lines subject to Multiple NTMs, by Product Group
HS Code Product Group 1 NTM 2 NTMs 3 NTMs or more
01-05 Animal & Animal Products 1 0 527
06-15 Vegetable Products 4 0 727
16-24 Foodstuffs 28 0 450
25-27 Mineral Products 141 0 70
28-38 Chemicals & Allied Industries 441 49 434
39-40 Plastics/Rubbers 63 9 2
41-43 Raw Hides, Skins, Leather, & Furs 20 0 59
44-49 Wood & Wood Products 26 0 151
50-63 Textiles 9 0 131
64-67 Footwear/Headgear 0 0 29
68-71 Stone/Glass 76 0 33
72-83 Metals 171 0 16
84-85 Machinery/Electrical 202 34 106
86-89 Transportation 93 110 335
90-99 Miscellaneous 38 5 73
Total 1313 207 3,143 Source: Authors’ calculation based on the newly constructed 2015 NTM database ASEAN-ERIA-UNCTAD raw data.
Most of the NTMs related to vegetable products are SPS and TBT measures, but
export-related measures such as certification required by the exporting country, export
technical measures, and measures on re-export as well as licensing procedures with no
specific ex-ante criteria are also included. Most of the NTMs related to animals and
animal products and food stuffs are SPS measures such as labelling, marking and
packaging requirements, conformity assessment related to SPS, storage and transport
conditions, animal-raising or catching processes, export-related measures, and licensing
for economic reasons as well as customs inspections, processing, and servicing fees.
Regulations related to chemicals and allied industries’ products contain TBT measures
such as testing requirement and traceability information requirements, export technical
measures, as well as licensing for economic reasons. The NTMs related to textile products
can be found in the export and import rules under the CITES Convention and Operation
System. Measures for textile products include TBT, export, and licensing for economic
reasons. For transportation products, there are three NTM regulations for licensing or

Chapter 8
111
permit requirements, authorization requirements for TBT reasons, and licensing for
economic reasons.
5. Non-tariff measures by issuing institutions
According to the legislative procedure of Myanmar, the NTM-related regulations
reviewed under the study are issued by the ministries concerned. The regulations
reviewed in this study originated from the ministries that are considered as official
sources of regulation.
Table 8.4: Non-tariff Measures by Issuing Institutions
Number Issuing Institution Number of NTMs
Total Number of NTMs (%) 1 Ministry of Agriculture and Irrigation 22 13
2 Ministry of Health 18 10
3 Myanma Petroleum Product Enterprise, Ministry of Energy
9 5
4 Ministry of Livestock, Fisheries, and Rural Development
85 49
5 Ministry of Forestry and Environmental Conservation
19 11
6 Ministry of Communication and Information Technology
2 1
7 Ministry of Home Affairs 16 9
8 Ministry of Commerce 1 1
Total 172 100
Source: Authors’ calculation based on the newly constructed 2015 NTM database ASEAN-ERIA-UNCTAD raw data.
Regulations reviewed in this study are issued by eight different ministries. Most of
the country’s NTMs can be found in regulations issued by the Ministry of Livestock,
Fisheries and Rural Development. The Regulation for Importation and Exportation of
Animals and Animal Products, Animal Health and Development Law, and the Myanmar
Marine Fishery Law regulate many NTMs related to the trade activities of animal and
animal products and fishery products. The Ministry of Agriculture and Irrigation issues
regulations provided under the Pesticide Law, the Plant and Pest Quarantine Law, and the
Fertilizer Law, and ranks second in terms of the number of NTMs issued.
As far as the incidence of NTMs on products in terms of national tariff lines is
concerned, the NTMs issued by the Ministry of Forest and Environmental Conservation
have affected the most products including vegetable products and animals and animal
products, which are the largest group of products affected by more than three NTMs. The
Ministry of Forest and Environmental Conservation is working in collaboration with the

Non-Tariff Measures in ASEAN
112
Convention on International Trade on Endangered Species (CITES) by issuing the CITES
Convention and Operation system (2012) regarding the rules of export and import
permits for CITES species. In addition to CITES, the Protection of Wildlife and
Conservation of Natural Areas Law (1994) has affected the export of animal and animal
products. The Environmental Conservation Law (2012) has affected products in many
areas including transportation.
Notifications of the Myanmar Petroleum Products Enterprise issued by the
Ministry of Energy contain many TBT measures and licensing for economic reasons. The
National Food Law issued by the Ministry of Health and notifications from the Ministry of
Home Affairs also regulate NTMs. Even though the Ministry of Commerce contributed
with only one regulation to the NTM data of Myanmar, it covers 4405 national tariff lines
as its notification is related to the licensing of many imported products.
Some ministries have drafted laws which are still in the legislation procedure
process. The Ministry of Science and Technology, which is the national enquiry Point for
technical barriers to trade (TBT), is in the process of drafting the law related to TBT. Since
it is also the focal ministry for the responsibility of the Chemical Weapon Convention
(CWC) and Myanmar is a member of CWC, the Ministry is also in the process to notify to
the CWC. The Ministry of Science and Technology enacted the National Standard Law in
2014. However, as it has no rules yet the Ministry of Science and Technology is taking the
leading role for coordinating with the relevant ministries in order to have the rules in
place.
6. Conclusion
Many regulations related to NTMs in Myanmar are ratifications to the international
conventions. To streamline NTMs, different approaches for different types of measures
are required. For technical measures like TBT and SPS, standards harmonization and
conformity assessment improvement are desirable and cost less for compliance. .For
NTMs that are customs related, trade facilitation programmes that include
infrastructure development and computerization should support the regulatory
environment.

Chapter 8
113
A regulatory environment with less bureaucracy and less cost of compliance is the
desirable path for Myanmar. However, consumers are increasingly conscious about food
safety, calling for government intervention to ensure they are safe. Myanmar is like
other countries that have resorted to the regulation of foodstuffs and agricultural
products. The difficulty is to assess whether an NTM regulation in favour of consumer
protection is truly an NTM and, to ensure it is not a non-tariff barrier. In conclusion, the
transparency of regulations is an appropriate complement to the level of the
comprehensiveness of NTM information, while a trade policy review mechanism is
another solution to minimize the protectionist use of NTMs.
References
Ando, M. and A. Obashi (2010), ‘The Pervasiveness of Non-tariff Measures in ASEAN –
Evidence from the Inventory Approach’, in M. Micik (ed.), Rising Non-tariff Protectionism and Crisis Recovery. Bangkok: Economic and Social Commission for Asia and the Pacific.
Cadot, O. and L. Y. Ing (2015), ‘Non-tariff Measures: Not All that Bad’, ERIA Policy Brief No. 2015-02, October. Jakarta: Economic Research Institute for ASEAN and East Asia.
Cadot, O., E. Munadi, and L.Y. Ing (2013), ‘Streamlining NTMs in ASEAN: The Way Forward’, ERIA Discussion Paper No. 2013-24. Jakarta: Economic Research Institute for ASEAN and East Asia.


113
CHAPTER 9
An Inventory of Non-tariff Measures in the Philippines
Loreli C. de Dios32
Center for the Advancement of Trade Integration and Facilitation
This chapter describes the work that was undertaken to compile, validate, and
register current non-tariff measures (NTMs) in the Philippines from official sources, with
emphasis on ensuring the comprehensiveness and quality of the information. The
inventoried NTMs are then analysed briefly and policy recommendations are provided to
streamline the NTMs and develop measures that would meet the goals of protecting
health and the environment.
1. Context
NTMs, being policy instruments, 33 are found within a country’s legal and
institutional framework. In the Philippines this framework consists of (i) the Constitution
as the basic law of the land, (ii) Republic Acts or statutes passed by Congress that uphold
the spirit of the Constitution, (iii) executive orders or rules of a general or permanent
character executing statutory power that are issued by the President, and (iv)
administrative issuances or rules and regulations that implement the law and are issued
by government agencies authorised by law to make such rules and regulations, issue
licences, and grant rights or privileges.
Organizationally, regulatory agencies have different levels indicating their degree
of autonomy. This reflects their position in the executive branch of government: (i) the
Bangko Sentral ng Pilipinas has the highest status as an independent central monetary
authority; (ii) a department is the primary sectoral subdivision of the executive branch;
(iii) ‘attached’ agencies have a lateral relationship with a department for policy and
32
The assistance of Paul Feliciano is gratefully acknowledged. 33
Defined broadly as measures taken to implement a guiding principle.

Non-Tariff Measures in ASEAN
114
programme coordination in which the department has a representative in its governing
body but cannot interfere with its internal operation, attached boards or commissions
have regulatory and adjudicatory powers outside the control of the department; (iv) the
next level are regulatory agencies whose personnel and financial resources are under the
administrative supervision of a department; and (v) the last level are agencies under the
control and supervision of a department, for example, line bureaus (Cariño, 2002).All
official documents are written in English, being the country’s official language aside from
Filipino. Laws and executive orders take effect when published in the Official Gazette or
newspapers of general circulation.
In the case of administrative issuances, the law – specifically Executive Order No.
292 or the Administrative Code of 1987—stipulates that copies should be submitted by
the issuing agency to the University of the Philippines Law Center and that rules in force
as of 1987 were to be filed within that year for their sanctions to be enforceable. Issuing
agencies are also required to keep a permanent register of all rules and regulations and
make this available to the public. The University of the Philippines Law Center then set up
the Office of National Administrative Register for discharging its function. Issuances to be
filed with the office include (i) statements of general applicability that implement or
interpret a law; (ii) statements of general applicability that fix and describe the
procedures in, or practice requirements of, an agency; (iii) amendments or repeal of any
prior rule; (iv) regulations affecting private rights, privileges, occupation, or business; and
(v) administrative disciplinary action and the governing rules of procedure.
NTMs are thus found mainly in administrative issuances and occasionally in
executive orders. Administrative issuances are generally classified into circulars and
orders. Circulars prescribe policies, rules, and regulations, and procedures that are
applicable to entities outside the government and designed to provide the means for
carrying out or supplementing provisions of the law. Orders are directed to particular
offices, officials, or employees on specific matters. In practice, issuances take various
other forms such as memoranda, memorandum orders, memorandum circulars, and
regulations, and except for presidential issuances, 34 the definitions or differences
between these forms are not described.
34
EO 292, Book III, Chapter 2 on the ordinance powers of the President: (i) administrative orders are acts that relate to particular aspects of governmental operations in pursuit of his duties as administrative head, (ii)

Chapter 9
115
2. Methodology
The inventory targeted particular NTM types35 from the NTM classification
scheme (UNCTAD, 2015), covering all relevant issuances as comprehensively as possible.
The approach was to (i) identify official sources of information, (ii) extract the
relevant issuances, (iii) validate the information, (iv) identify the NTMs contained in the
issuances and classify them, and (v) register the information in the template, including
NTM type and products covered.
Official sources were of two kinds – official compilations of regulations or
products, and individual issuing agencies. The former guided the search with the titles or
topics of officially disclosed issuances, while the latter provided the text of these legal
documents and other related issuances. Official compilations took the form of
consolidated lists, repositories, or notifications to international bodies. These were used
to draw up a base list of issuances.
The issuances in the base list were examined and also served as a springboard for
further research. For instance, lists of regulated imports only consider the regulation that
requires the import license rather than such prerequisites as the importer or the product
registration. Given that the latter are usually provided in a separate issuance, these had
to be sought.
Agency websites were scrutinised in parallel with the above compilations, not only
to obtain digital copies of the legal documents, but also to identify other relevant
issuances. The websites vary widely, from the highly informative and systematic to those
with limited or less orderly information. Agency personnel were contacted directly to
request, clarify, or confirm information. Other online sources were searched for copies of
documents that could not be found in agency websites.
memorandum orders are acts on matters of administrative detail or of subordinate or temporary interest that only concern a particular office or officer, (iii) memorandum circulars are acts on matters relating to internal administration which are being brought to the attention of some offices, for information or compliance, and (iv) general or special orders are acts of the President in his capacity as Commander-in-Chief of the Armed Forces. 35 These are type A (sanitary and phytosanitary measures or SPS), B (technical barriers to trade or TBT), C (pre-shipment inspection and other formalities), E (non-automatic licensing, quotas, prohibitions, and quantity-control measures other than SPS or TBT), F (price-control measures including additional taxes and charges), G (finance measures), H (measures affecting competition), I (trade-related investment measures), and P (export-related measures).

Non-Tariff Measures in ASEAN
116
The Official Gazette (www.gov.ph) is the source of Republic Acts, executive
orders, presidential decrees, and other issuances of the President.
3. Analysis of registered non-tariff measures
The results of the inventory are summarised in the following tables. Overall, 295
regulations were evaluated, yielding 854 NTMs.36 Of these, 542 or about 63 percent were
notified to the WTO, whether in the Trade Policy Review of 2012, the Import Licensing
Agreement, Application of SPS Measures, or the TBT Agreement.
Table 9.1: Number of Regulations and Non-tariff Measures
Comprehensiveness Indicator Number
Total number of coded regulations 295
Total number of coded NTMs 854
Total number of coded NTMs reported to the WTO 542
Total number of affected products (HS lines) 9,820
Proportion of products affected (%) 100%
Total issuing institutions 37
Source: Authors’ calculation based on the newly constructed 2015 NTM database ASEAN-ERIA-UNCTAD raw data.
The Philippines uses the 8-digit ASEAN Harmonized Tariff Nomenclature (AHTN) of
2012,37 which is based on the latest version of the Harmonized Commodity Description
and Coding System (Harmonized System [HS]) of the World Customs Organization and its
amendments. There are a total of 9,820 national HS lines and all are affected by NTMs.
TBTs are the most numerous NTMs, making up 42.1 percent of the total number,
followed by SPS measures, which constitute 27.3 percent (Table 9.2). Export-related
measures are the third major kind, reaching 17.1 percent of the total, although this is also
because all NTMs affecting exports are combined in a single chapter.
36
This excludes one anti-dumping measure that was added by the UNCTAD team to the inventory. 37
The World Customs Organization has been undergoing a review of HS 2012 with the proposed changes are to be implemented in 2017, while the AHTN Task Force is aligning the AHTN 2012 with HS 2017 and amending it based on the review criteria. ASEAN member states are to implement the AHTN 2017 by 1 January 2017.

Chapter 9
117
Table 9.2: Number of Non-tariff Measures by Type and Products Affected
Code NTM Type Number of
NTMs Total NTMs
(%)
A Sanitary and phytosanitary (SPS) measures 233 27.3
B Technical barriers to trade (TBT) 360 42.1
C Pre-shipment inspection and other formalities 24 2.8
E Non-automatic licensing, quotas, prohibitions, and quantity control measures other than SPS or TBT reasons 56 6.5
F Price control measures including additional taxes and charges 23 2.7
G Finance measures 11 1.3
H Measures affecting competition 1 0.1
I Trade-related investment measures –
P Export related measures 146 17.1
Total coded NTMs 854 100 Source: Authors’ calculation based on the newly constructed 2015 NTM database ASEAN-ERIA-UNCTAD raw data.
The frequency of NTMs by subcategory is summarised in Table 9.3. Among the
TBTs, conformity assessment measures are the most common, followed by prohibitions
or restrictions, while the order is reversed for SPS measures although only slightly
different in number. Labelling requirements are the next most frequent imposition under
both types.
For export-related measures, licences/quotas/prohibitions make up the majority,
followed by technical measures.
The NTMs were contained in the issuances of 37 government agencies, which are
at the level of the department or attached bureau, authority, commission,
administration, corporation, board, or institute. The top 10 agencies together issued 70
percent of all regulations, while the top five together made up about 50 percent of all
issuances.
Three line bureaus under the Department of Agriculture – the Animal Industry,
the Plant Industry, and Fisheries and Aquatic Resources – issued the largest number
equivalent, respectively, with 14.8 percent, 12.6 percent, and 9.4 percent of the total. SPS
measures were concentrated in these agencies, as well as at the Food and Drug
Administration and the National Meat Inspection Service, given their mandates to protect
human and animal health. In contrast, TBT measures were imposed by several different
agencies. About nine NTMs were implemented simultaneously by multiple agencies.

Non-Tariff Measures in ASEAN
118
Environment protection measures were the next major group of NTMs. These
came mainly from the Environmental Management Bureau and the Fertilizer and
Pesticides Authority. Agencies heading the ‘Others’ list had similar objectives, namely the
Forest Management Bureau and the Department of Environment and Natural Resources
(whose issuances were implemented by the Biodiversity Management Bureau and the
Philippine Ozone Desk).
Table 9.3: Frequency of Non-tariff Measures by Subcategory Code NTM Subcategory Number
A1 Prohibitions/restrictions of imports for SPS reasons 88 A2 Tolerance limits for residues and restricted use of substances 1 A3 Labelling, marking, and packaging requirements 28 A4 Hygienic requirements 5
A5 Treatment for elimination of plant and animal pests and disease-causing organisms in the final product 14
A6 Other requirements on production or post-production processes 10 A8 Conformity assessment related to SPS 85 A9 SPS measures, n.e.s. 2 B1 Prohibitions/restrictions of imports for objectives set out in the TBT agreement 113 B2 Tolerance limits for residues and restricted use of substances 8 B3 Labelling, marking, and packaging requirements 56 B4 Production or post-production requirements 26 B6 Product identity requirement 4 B7 Product-quality or -performance requirement 16 B8 Conformity assessment related to TBT 137 C1 Pre-shipment inspection 2 C3 Requirement to pass through a specified port of customs 5
C4 Import-monitoring and surveillance requirements and other automatic licensing measures 3
C9 Other formalities, n.e.s. 14
E1 Non-automatic import-licensing procedures other than authorizations for SPS or TBT reasons 38
E2 Quotas 6 E3 Prohibitions other than for SPS and TBT reasons 9 E6 Tariff-rate quotas 3 F1 Administrative measures affecting customs value 1
F6 Additional taxes and charges levied in connection to services provided by the government 19
F7 Internal taxes and charges levied on imports 3 G1 Advance payment requirement 9 G4 Regulations concerning terms of payment for imports 1 G9 Finance measures, n.e.s. 1 H1 State-trading enterprises, for importing; other selective import channels 1 P1 Export-license, -quota, -prohibitions, and other quantitative restrictions 74 P2 State-trading enterprises, for exporting; other selective export channels 2 P4 Measures on re-export 2 P5 Export taxes and charges 1 P6 Export technical measures 57 P7 Export subsidies 3 P8 Export credits 1 P9 Export measures, n.e.s. 6 854 Source: Authors’ calculation based on the newly constructed 2015 NTM database ASEAN-ERIA-UNCTAD raw data.

Chapter 9
119
All AHTN product groups are subject to NTMs. In fact, multiple NTMs are imposed
on the majority: 30 out of the 97 AHTN chapters, or about one-third, are covered by 11 to
20 NTM types, another one-fifth are affected by six to ten NTM types. However, about
one-fifth are also unaffected by NTMs, mainly textiles and footwear.
A counterpart tabulation for the product groups defined in the template shows
that 16 out of 27, or 73 percent, are subject to 10–22 NTM types. Only two are affected
by one NTM type, while the rest have between two and nine NTM types imposed on
them.
A summary of the specific subcategories of NTMs that affect each of the 97 AHTN
chapters below shows the NTM chapters that apply to broad product groups. Both SPS
and TBT measures are mainly imposed on animals and animal products, vegetable
products and foodstuffs, as well as mineral products (because salt, which is heavily
regulated, is classified here) and chemicals and allied products. The rest are subject to
TBT measures.

Non-Tariff Measures in ASEAN
120
Table 9.4: Non-tariff Measures Types affecting Each Product Group
HS Chapter Product Group
NTM Chapter
A B C E F G H P
01-05 Animal &animal products
A1, A3, A4, A5, A6, A8, A9
B1, B3, B8
C1, C3, C4, C9
E1, E3, E6
G1 H1 P1, P6
06-15 Vegetable products
A1, A3, A4, A5, A6, A8
B1, B2, B3, B4, B6, B7, B8
C1, C3, C4, C9
E1, E3, E6
F6, F7
G1, G4
H1 P1, P6
16-24 Foodstuffs
A1, A3, A6, A8
B1, B3, B4, B6, B7, B8
C1, C4, C9
E1, E2, E6
F1, F6, F7
G1 H1 P1, P6, P9
25-27 Mineral products
A1, A3, A5, A6, A8
B1, B2, B3, B4, B7, B8
C1, C9 E1 F6, F7
G1 H1 P1, P6
28-38 Chemicals &allied Industries
A1, A3, A5, A6, A8
B1, B2, B3, B4, B6, B7, B8
C1, C9 E1, E2, E3
F6, F7
G1, G9
H1 P4, P6, P9
39-40 Plastics/rubber A3 B1, B3,
B4, B8 C1, C9 E1,
E3 F1 G1 H1 P1,
P6
41-43 Raw hides, skins, leather, &furs
B3, B4, B8
P6
44-49 Wood &wood products
A1, A8 B1, B3, B8
C1, C3, C9
E1, E3
F6 G1, G9
H1 P1, P5, P6
50-63 Textiles A8 B1, B3,
B8 C4 E1,
E3 F1 H1 P1,
P6
64-67 Footwear/headgear B1, B3,
B8 C9 G1 H1
68-71 Stone/glass
A8 B1, B3, B4, B8
C9 E1 F7 G1 H1 P1, P2, P6
72-83 Metals
B1, B2, B3, B4, B8
C9 E1 F1, F7
G1 H1
84-85 Machinery/electrical
A8 B1, B2, B3, B4, B7, B8
C9 E1, E2
F6 G1 H1 P1, P6
86-89 Transportation
A8 B1, B3, B7, B8
C9 E1, E3
F1, F6, F7
G1 H1 P1, P6
90-97 Miscellaneous
B1, B2, B3, B4, B8
C9 E1, E2, E3
G1 H1 P1, P6, P9
Source: Authors’ calculation based on the newly constructed 2015 NTM database ASEAN-ERIA-UNCTAD raw data.

Chapter 9
121
4. Recommendations
4.1. Streamlining existing regulations
Since our inventory combines information from official compilations and
individual agencies, it is comprehensive in terms of the NTM chapters that have been
selected for this work. Validation by the agency as to (i) possible exclusions, (ii) validity
period of all inclusions, and (iii) specification of products, would constitute further work
to make it definitive. While no major changes in the legal and institutional framework are
expected, an annual review of the inventory is recommended in order to include new or
modifying regulations that are expected to be issued by agencies in the exercise of their
authority.
The inventory work also revealed the following:
(a) Publicly available records are incomplete. The quarterly compilation of the official
repository is also non-chronological; its website has been inaccessible in recent months.
Regulations do not indicate their current validity, or specify the amended regulation.
Other websites describe procedures and requirements but do not provide the text of the
regulation.
(b) Automated systems of storage or cataloguing do not appear to exist. Older personnel
depend on their own ‘institutional’ memory; newer ones do not have the same familiarity
with the regulations. Physical copies of valid old issuances still have to be digitised; one
agency’s manual can only be obtained by purchase.
(c) The concept of ‘regulated’ products is usually understood in terms of certain types of
NTMs only, such as quotas, prohibitions, or licensing whether or not for SPS and TBT
reasons, as most are not familiar with all other NTMs. Hence, official lists are confined to
these types. Yet those devoted to the same NTM did not contain the same information.
(d) There are measures that are not being enforced, possibly due to their impracticality or
cost-ineffectiveness. The applicability of regulations to domestic products is not always
specified.
(e) The language of a number of regulations is unclear or indirect and circuitous, and
double or even multiple negatives are used.
Non-Tariff Measures in ASEAN
122
(f) Regulations do not specify the AHTN codes of the products covered. Product
descriptions are too broad or vague. Some are expressed in ‘other than’ terms, or affect
products of certain characteristics only. New or unfamiliar products are not defined.
These indicate the need for an automated repository system that compiles all
issuances from all agencies and provides full information and ease of search and retrieval.
The system could incorporate an NTM classification functionality to enable the
identification of the relevant provisions in the issuances. The Philippine National Trade
Repository38 as a single source of information on trade-related matters is an initiative in
this direction.
Systematisation, however, has maximum positive impact only if the information
that is being systematised is of high quality. For rigour and consistency of regulations,
streamlining is thus imperative. Extraneous or redundant provisions and dead regulations
must be removed, and only the most salient ones must be issued. They must be in plain
language, with procedures or requirements reduced to the barest minimum, while
providing all the information in precise terms. This will lower transactions costs and allow
both the agency and the affected party to focus resources where they count most. Thus it
encourages efficiency and compliance.
Streamlining can be done through process reengineering or business process
analysis, a methodology described in the Business Process Analysis Guide to Simplify
Trade Procedures (hereinafter, BPA Guide [UNNExT, UNESCAP, and UNECE, 2012]).
Defined as ‘the study of existing business processes within one or across several
entities…. to understand attributes of the business processes and relationships among
them’, the BPA results serve as a baseline for trade facilitation measures such as the
simplification of trade procedures or of documentary requirements and alignment with
international standards, or the automation of trade transactions and electronic
documents for single window systems.
38
Launched in October 2015 as a web-based single source of comprehensive information on all trade-related matters (http://pntr.gov.ph/about.html), the Philippine National Trade Repository (PNTR) was established by the Ad Hoc Technical Working Group on PNTR under the Committee on ASEAN Economic Community, which is headed by the Bureau of Import Services of the Department of Trade and Industry, with 50 trade regulatory and trade policy agencies as members. It is a commitment under the ASEAN Trade in Goods Agreement that will be linked with the ASEAN Trade Repository, and complies with transparency obligations under the WTO Agreement on Trade Facilitation.
Chapter 9
123
The BPA Guide describes three sequential phases:
Phase I: Scope setting (Step 1. Define project scope. Step 2. Develop detailed work
plan and secure resources)
Phase II: Data collection and process documentation (Step 3. Acquire background
information. Step 4. Conduct interviews and document captured data)
Phase III: Process analysis and recommendations development (Step 5. Analyse
the ‘as-is’ process. Step 6. Develop and propose recommendations)
The Streamlining Non-tariff Measures: A Toolkit for Policy Makers (Cadot et al.,
2012) provides a detailed approach for an NTM review, describing the necessary
institutional conditions, and following the same basic components of data collection and
the assessment of their economic costs and benefits. The toolkit stresses that the
streamlining process must be analytically sound and balance the reduction of trade costs
against the preservation of public objectives.
An understanding of the business process requires research into related laws and
regulations, forms, and documents, interviews with participants, and onsite observation.
Interview questions39must be thorough and produce insights into the process. The
sequence of activities required to complete a process is mapped with activity diagrams,
process descriptions, and a time-procedure chart. These ‘as-is’ business process models
are then verified.
A salient point that must be established by the agency at the start of a BPA is:
what is the objective of the regulation? The inventory shows that aside from the usual
mandates (protecting public health, the environment, consumer welfare, safety, national
security, or morality, or developing particular industries), there are requirements to
prove an entity’s legitimacy, or provide information that would enable control over the
goods or entity in case of non-compliance, or pay fees. These also have to be rationalised.
The business process is then analysed to identify bottlenecks and opportunities
for improvement. Issues to be investigated are the efficiency (caused by redundancies or
unnecessary requirements), effectiveness (amount of rework), reliability, transparency,
and predictability of the business process (UNNExT, UNESCAP, and UNECE, 2012).
Diagrams illustrating ‘to be’ processes may accompany the recommendations, which may
include any of the following: resequencing of activities, elimination of redundant data,
39
The BPA Guide provides sample questions in Box 3B-16 on page 43.

Non-Tariff Measures in ASEAN
124
documents, procedures or activities that do not add value to meeting the measure’s
objectives, integrating business processes that have similar objectives, merging
procedures to eliminate unnecessary documents, harmonising data requirements with
international standards, and automation and information sharing. Also possible are the
elimination of outdated laws and regulations, the privatisation of quality control-related
tasks, modification or creation of laws and regulations, and the use of international best
practice.
Tasks should not be fragmented, potential bottlenecks must be identified and
avoided, and data that will not be used must not be collected. Timing must also be taken
into account.
It is also essential for agencies to have a better understanding of NTM types. Aside
from using simple language, regulations must state explicitly whether they are applicable
to imports, exports, and/or domestic products. And they must specify the AHTN codes of
the products affected. This pre-empts interpretation, misunderstanding, or discretionary
decision-making.
Nine efficient regulation principles of the Organisation for Economic Co-operation
and Development (OECD) are listed in the toolkit (Cadot et al., 2012) to guide the design
and implementation of regulations: (i) transparency and openness, (ii) non-
discrimination, (iii) avoidance of unnecessary trade restrictiveness, (iv) use of
performance-based regulation, (v) use of regulatory impact assessment (RIA),40 (vi)
administrative simplification, (vii) use of internationally harmonised measures, (viii)
ensuring the quality of conformity assessment procedures, and (ix) incorporation of
competition principles in regulatory practice. UNCTAD (2013) also reiterates the
importance of establishing a rule-making process that is transparent and complies with
international obligations.
40
RIA is best practice to improve the quality of regulations in terms of transparency, rigor, accountability, and consistency, and minimal unnecessary and excessive requirements. The methodology includes cost-benefit analysis and stakeholder consultation to ensure that the regulation is effective and efficient in achieving its policy objectives while minimizing negative effects. RIA was piloted at the Department of Finance, Department of Labor and Employment, and the Department of Tourism in 2012.

Chapter 9
125
4.2. Developing NTMs to protect consumer health and the environment
The inventory showed that the bulk of NTMs are imposed to protect health and
the environment. These are legitimate policy objectives. Under the WTO (www.wto.org),
members can adopt NTMs for these objectives, as long as the measures comply with the
rule that they do not create unnecessary obstacles to trade. In the exceptions to the
rules, members may also justify General Agreement on Tariffs and Trade (GATT)-
inconsistent measures if these are necessary to protect human, animal, or plant life or
health (Article XX(b)), or relate to the conservation of exhaustible natural resources
(Article XX(g)). To prevent the misuse of trade-related measures, it further stipulated that
an environmental NTM may not be applied in an arbitrary or unjustifiably discriminatory
manner between countries where the same conditions prevail, or as a disguised
restriction on trade.
As Article XX allows the imposition of GATT-inconsistent measures for health or
environment purposes, it also requires proof that a measure is intended to protect
human, animal, or plant life or health, that the measure is necessary, or that it relates to
the conservation of exhaustible natural resources.
Such trade measures must therefore still be developed carefully. Previous analysis
of ASEAN NTMs recommended the following criteria for their rationalisation (i)
transparent and non-discriminatory application, (ii) scientific basis, and (iii) the absence
of an alternative that can achieve the objective in a less distortive manner (de Dios,
2004). These may serve as a guide for their development, complementing the OECD’s
efficient regulation principles.
Indeed, the SPS and TBT agreements prescribe a science-based approach for such
NTMs and also encourage adherence to international standards. The agreements impose
three types of discipline: (i) on the process of adoption of the measures and their
implementation, under which NTMs should be designed and implemented in a non-
discriminatory manner; (ii) on their proportionality to the objective sought, under which
NTMs should be the least trade-restricting amongst the available instruments, also
known as the efficiency criterion; and (iii) on their necessity, which implies that no other
less trade-inhibiting instrument is appropriate. Regulations that are more stringent than
international standards must be justified based on risk assessment (UNCTAD, 2013).

Non-Tariff Measures in ASEAN
126
References
Cadot, O., M. Malouche, and S. Saez (2012), Streamlining Non-tariff Measures: A Toolkit
for Policy Makers. Washington, DC: World Bank.
Cariño, L.V. (2002), ‘Regulatory Governance in the Philippines: A Profile’, Center on
Regulation and Competition Working Paper Series, Paper No. 44, Manchester,
UK: Institute for Development Policy and Management, University of Manchester.
de Dios, L.C. (2004), Issues and Options for the Work Programme to Eliminate Non-tariff
Barriers in AFTA. Jakarta: EU–ASEAN Programme for Regional Integration
Support. ASEAN Secretariat.
United Nations Conference on Trade and Development (UNCTAD) (2013), Non-tariff
Measures to Trade: Economic and Policy Issues for Developing Countries,
Developing Countries in International Trade Studies. Geneva: UNCTAD.
United Nations Conference on Trade and Development (UNCTAD) (2015), International
Classification of Non-tariff Measures. Geneva: UNCTAD.
United Nations Network of Experts for Paperless Trade in Asia and the Pacific (UNNExT),
United Nations Economic and Social Commission for Asia and the Pacific
(UNESCAP), and United Nations Economic Commission for Europe (UNECE)
(2009), Business Process Analysis Guide to Simplify Trade Procedures. Bangkok:
UNNExT, UNESCAP, and UNECE.


127
CHAPTER 10
Non-tariff Measures in Singapore41
Hank Lim
Singapore Institute of International Affairs, Singapore
Anika Widiana
Center for Inclusive and Sustainable Development, Prasetiya Mulya School of Business and
Economics, Jakarta, Indonesia
Bernard Aw
Singapore Institute of International Affairs, Singapore
1. Overview of Singapore
Most small countries lack the resources that larger countries often enjoy, or have
minimal resources. Small size also translates into a small domestic market, which is
usually inadequate to sustain continuous economic growth. In order to overcome these
disadvantages, small countries need to develop a reliance on imports and exports.
Singapore is such a country, with an open economy in which trade is an important growth
engine that is valued at over three times its gross domestic product (GDP).
A heavy reliance on trade is not without risks. Singapore has an exposed and
vulnerable economy, susceptible to external vagaries and shocks. However, small size can
be turned into an advantage. Not only is a smaller country more nimble and easier to
manage, the government is able to manage its scarce resources more efficiently.
Singapore is often admired for its ability to marshal labour resources to attract foreign
investments and has invested significantly in human capital. Furthermore, it has made full
41
We would like to acknowledge and thank the support from the Government of Singapore, particularly the assistance and consultation received from the Ministry of Trade and Industry.

Non-Tariff Measures in ASEAN
128
use of robust macroeconomic policies to shape the economy, with an emphasis on
growth.
Singapore’s emphasis on growth was borne out of necessity after the country
suddenly found itself a sovereign nation after being ejected from Malaya in August 1965.
This forced the government to cultivate a pro-growth environment. It has put in place
pro-business policies such as strict adherence to the rule of law, strong government
institutions, good infrastructure, competitive tax rates, and made significant investments
in education, skills training, and research and development.
As a small nation that depends on imports of food, energy, and raw materials,
Singapore embraces the multilateral trading system embodied by the World Trade
Organization (WTO). A primary aim of Singapore’s trade policy is to safeguard its trading
interests by ensuring free and open international trading conditions. Beyond its support
of the WTO, Singapore advocates continual improvements in trade efforts and
strengthening of the multilateral trade system, in both regional and international
contexts.
Since Singapore is so dependent on trade, the government has made exporting
and importing as easy as possible. Singapore is generally a free port. Over 99 percent of
all imports into Singapore are duty free. There are, however, high excise taxes on
alcoholic and tobacco products, as well as motor vehicles and petroleum products. These
are mostly levied for social or environmental reasons. All in all, Singapore maintains one
of the most liberal trading systems in the world.
1.1. The legal framework of Singapore
Singapore is often regarded as a unique and successful case of the progress of an
emerging market into a developed economy. Singapore’s legal system reflects its cultural
diversity and at times turbulent history. As a Commonwealth nation, the legal framework
of Singapore has its roots in English law and practice. However, Singapore has made
considerable amendments to its legal system in the past few decades in favour of local
jurisprudence.

Chapter 10
129
Approach to obtain legal comprehensiveness
A primary concern in NTM collection and classification is the legal
comprehensiveness of the country’s laws concerning NTMs. It is critical that an accurate,
comprehensive, and accessible depository of the laws is readily available. While this
depository may be available in printed or digital format or both, it is preferable to have a
searchable online database.
Singapore’s acts and regulations are accessible online through Singapore Statutes
Online (SSO) (Attorney-General’s Chambers, 2015). The SSO is the official website for
Singapore’s legislation and is managed by the Legislation Division of the Attorney-
General’s Chambers.
The SSO carries a comprehensive depository of the following:
a. acts of Parliament and subsidiary legislation;
b. revised editions of acts and subsidiary legislation;
c. bills tabled in Parliament;
d. act supplements, new subsidiary legislation, and amending subsidiary legislation
published each year;
e. historical versions of legislation; and
f. PDF versions of legislation (where available).
The government makes every effort to keep the SSO updated. While it is not
known how often the online depository is updated, the SSO is largely up to date.
Since the legal database comprises not just laws and regulations concerning
NTMs, but also all the other legislation in effect in Singapore, it may be advisable to start
collecting potential NTMs from government agencies identified to be involved in
administering this legislation.
We identified a number of government agencies in Singapore that monitor laws
and regulations potentially related to NTMs. These include the Agri-Food and Veterinary
Authority (http://www.ava.gov.sg/legislation), the Ministry of Trade and Industry
(http://www.mti.gov.sg), the Singapore Customs Authority (http://www.customs.gov.sg),
and the Health Sciences Authority (http://www.hsa.gov.sg), to name a few. Combing

Non-Tariff Measures in ASEAN
130
through the websites of these agencies yields acts and regulations that we believe are
NTMs.
Another method was to examine Singapore’s notifications to the WTO. It also led
us to compare and assess the information provided in the WTO notifications with that
provided in the United Nations Conference on Trade and Development (UNCTAD)
collection. We searched the WTO website to find notified regulations relating to NTMs,
specifically technical barriers to trade (TBT) and sanitary and phytosanitary (SPS)
measures (WTO, 2015a).
Therefore, the NTM collection exercise was carried out using a three-pronged approach:
a. Individual government ministries, departments, and agencies. Visit the websites
of identified government bodies to collect regulations that are indicative of NTMs.
For example, we visited the website of the Agri-Food and Veterinary Authority of
Singapore and combed through their legislation page.
b. WTO notifications. Singapore regularly notifies and reports to the WTO any new
regulations, as well as amendments.
c. Singapore Statutes Online. We complemented the first two search processes with
an examination of Singapore’s legislation to ensure full legal comprehensiveness.
1.2. WTO notification
Members of the WTO are obliged to file notifications to the Central Registry of
Notifications to ensure transparency in the multilateral trading system. The Uruguay
Round Ministerial Decision on Notification Procedures provided an annex on the
indicative list of notifiable measures (WTO, 2015b).
As a WTO member, Singapore is obliged to notify any new trade-related
measures, including TBT, SPS, import licensing, and quantitative restriction measures to
the WTO pursuant to the notification obligations under the various WTO agreements. Not
only does the notification system help to promote transparency, it also ensures that
traders are informed of upcoming measures so that they adapt in good time, if necessary.
Singapore generally notifies within 1–2 months before a measure is implemented.
For classification of goods, Singapore uses the Harmonized System (HS). While the
international nomenclature developed by the World Customs Organization is set at the 6-
digit level, the HS code of goods in Singapore is an 8-digit code (Singapore Customs,

Chapter 10
131
2015a). This is because Singapore follows the Association of Southeast Asian Nations
(ASEAN) Harmonised Tariff Nomenclature (AHTN) code – a harmonised 8-digit level code
across ASEAN member countries.
2. Non-tariff measures in Singapore
2.1. Singapore’s NTM regime
Singapore’s NTM regime is non-organized in nature, as reflected in the
decentralised administration and enforcement of NTMs by various government agencies,
instead of a centralised government ministry such as the Ministry of Trade and Industry.
As such, Singapore’s approach to NTM implementation is not based on targeted trade
protectionism but on the need to protect human health and the environment.
The top three institutional sources of NTMs are the Agri-food and Veterinary
Agency (AVA), the Health Sciences Authority, and the National Environmental Agency.
These organizations are responsible for ensuring food safety, national health and safety,
and protecting the environment, respectively. This underscores the non-protectionist
stance of Singapore’s NTM regime.
This decentralised nature makes it difficult for companies to understand the
various NTMs in place. Moreover, NTM rules may be subject to regular change due to
new international standards. However, companies usually do not need to understand the
whole spectrum of NTMs in order to operate. For example, a food manufacturing
company only needs to know NTMs related to food production. Nonetheless, it could be
beneficial for there to be a centralised depository of information related to Singapore’s
NTM regime.
2.2. Data collection
We collected 140 regulations within 58 acts and/or documents indicative of NTMs
in the first phase. The second phase analysed the identified regulations to assess if they
affected products, finding that 115 regulations (from 52 acts) indicative of NTMs had an
impact. They were classified into 529 measures covering 9,558 products (Table 10.1).

Non-Tariff Measures in ASEAN
132
Table 10.1: Non-tariff Measure Comprehensiveness in Singapore, 2015
Comprehensiveness Indicator Number
1 Total NTM-related regulations 115 regulations
2 Total NTM reported to the WTO 32 regulations
3 Total number of coded NTMs 529 measures
4 Total affected products (HS lines, national tariff lines)
a. Total number of affected products 9,558 products
b. Share of the number of affected products to the number of total
products (%) 100%
5 Total issuing institutions 25 institutions
Source: Authors’ calculation based on the newly constructed 2015 NTM database ASEAN-ERIA-UNCTAD raw
data.
Singapore has adopted the HS-8 digit classification for its national tariff lines and
has 9,558 tariff lines. All the products, which is 100 percent national tariff lines, in
Singapore are affected by NTMs. Singapore has reported to the WTO at least 32
regulations covering about 500 NTMs. Our NTM classification yielded 529 coded NTMs,
so it is fair to say almost all coded NTMs have been reported to the WTO.
We also analysed which government agencies issued the largest number of NTMs,
revealing that there were 25 issuing bodies. Table 10.2 lists the top 10 bodies. The AVA
issued the most NTMs, approximately 60 percent of the total measures. The majority of
these NTMs are for products related to foods, feeds, animals, plants, and endangered
species, as the AVA is the government agency responsible for food safety, animal welfare,
and plant health. Given that NTMs are usually introduced in response to concerns over
food safety, animal welfare, sanitary and phytosanitary matters, as well as the
environment, and given that the AVA is responsible for most of these concerns, it has the
greatest share of issued NTMs.
The Health Sciences Authority was a distant second at 7.1 percent, with NTMs
covering product medicines and poisons. The National Environmental Agency was third,
with 4.1 percent of total NTMs, covering motor vehicles, air-conditioners, clothes dryers,
refrigerators, and televisions.

Chapter 10
133
Table 10.2: Non-Tariff Measures by Issuing Institution, 2015
Number
Issuing Institution Number of NTMs
Total Number of NTMs (%)
1 Agri-Food & Veterinary Authority 317 59.92
2 Health Science Authority 38 7.18
3 National Environment Agency 22 4.16
4 Ministry of Health 18 3.40
5 Singapore Customs Authority 18 3.40
6 National Environmental Agency, Ministry of the Environment 14 2.65
7 Singapore Armed Forces, Singapore Police Force 11 2.08
8 Singapore Civil Defence Force 10 1.89
9 Minister for Health 8 1.51
10 Ministry of Trade and Industry (MTI), International Enterprise Singapore Board, Customs Authority 8 1.51
11 The rest institutions 65 12.29
Total 529 100.00 Source: Authors’ calculation based on the newly constructed 2015 NTM database ASEAN-ERIA-UNCTAD raw
data.
Next we looked at the most common types of NTMs implemented. In Table 10.3,
59.2 percent of total NTMs were classified as technical barriers to trade (TBT), particularly
for the products of food, animal, vegetables, medicines, textiles, and machinery. The
second-largest share was attributed to sanitary and phytosanitary (SPS) measures,
accounting for 24 percent, peculiarly imposed on almost all related to food products. Pre-
shipment inspection and other formalities measure only accounted for 0.4 percent.

Non-Tariff Measures in ASEAN
134
Table 10.3: Non-tariff Measures by Type in Singapore, 2015
Code NTM by type Number of NTMs %
A Sanitary and phytosanitary (SPS) measures 127 24.0
B Technical barriers to trade (TBT) 313 59.2
C Pre-shipment inspection and other formalities 2 0.4
E
Non-automatic licensing, quotas, prohibitions, and quantity control measures other than for SPS or TBT reasons 1 0.2
F Price control measures including additional taxes and charges 36 6.8
P Export-related measures 50 9.5
Total coded NTMs 529 100.0 Source: Authors’ calculation based on the newly constructed 2015 NTM database ASEAN-ERIA-UNCTAD raw data.
Meanwhile, non-technical measures (E+F) imposed on imports coming into
Singapore amounted to 7.0 percent of total NTMs, consisting of non-automatic licensing,
quotas, prohibitions, and quantity control measures (0.2 percent) and price control
measures including additional taxes and charges (6.8 percent). Measures affecting export
activities amounted to 9.5 percent. Most export regulations related to NTMs are based
on trade agreements between Singapore and other countries in international
conventions, especially for medicines, plant products, psychotropic substances, chemical
substances, tobacco, motor vehicles, live fish, medical devices, and rough diamonds.
There are 48 types of measures from the NTM classification in Singapore based on
Multi Agency Support Team (MAST) February 2012 classification, consisting of SPS, TBT,
pre-shipment inspection, and other formalities, non-automatic licensing, quotas,
prohibitions, and quantity control measures other than for SPS or TBT reasons, price
control measures including additional taxes and charges, and export-related measures.
Table 10.4 shows the top 10 types of NTMs most frequently imposed on imported
and exported products. B6 measures relating to product identity requirement were the
most often used, accounting for 17.6 percent of total NTMs imposed on imported
products. Next was B31 (labelling requirement–TBT) at 13.8 percent, and then B14
(authorisation requirement for TBT reasons) at 8.1 percent.

Chapter 10
135
Table 10.4: Top 10 Most Frequent Non-tariff Measures in Singapore, 2015
Number NTM by Type Description Number of NTMs %
1 B6 Product identity requirement 93 17.6
2 B31 Labelling requirement for TBT reasons 73 13.8
3 B14 Authorisation requirement for TBT reasons 43 8.1
4 A31 Labelling requirement for SPS reasons 40 7.6
5 A22 Restricted use in foods and feeds 35 6.6
6 P13 Licensing or permit requirement for export 20 3.8
7 F69 Additional charges, n.e.s. 19 3.6
8 B42 TBT regulations on transport and storage 15 2.8
9 B82 Testing requirement related to TBT 15 2.8
10 F65 Import licence fee 12 2.3
Source: Authors’ calculation based on the newly constructed 2015 NTM database ASEAN-ERIA-UNCTAD raw
data.
Export measures most widely used in Singapore were concerned with licensing or
permit requirements for export, accounting for 3.8 percent of total NTMs. Additional
charges and import licence fee measures were also numerous, accounting for 3.6 percent
and 2.3 percent, respectively.
Figure 10.1: Percentage of Non-tariff Measures in Products to Total
0,0
5,0
10,0
15,0
20,0
25,0
30,0
35,0
3 NTMs or more 2 NTMs 1 NTM
Source: Authors’ calculation based on the newly constructed 2015 NTM database ASEAN-ERIA-UNCTAD raw data.

Non-Tariff Measures in ASEAN
136
As many as 57.9 percent of products were affected by three or more NTMs, while
42.1 percent were affected by two NTMs. Machinery/electrical products were the most
affected by NTMs (more than three NTMs), at 18.8 percent, followed by chemical
products (7.7 percent), and vegetable products (6.5 percent). Most of the products
affected by two NTMs were textiles, at 9.4 percent. No products were affected by just
one NTM.
Relationship with other countries
Given its dependency on trade to drive economic growth, Singapore places a high
priority on building relationships with other countries, especially in trade. Singapore
participates in various international conventions and trade agreements within ASEAN,
and with non-ASEAN countries. Outcomes from international conventions, or bilateral
agreements, are passed in Parliament as legislation. Subsequently, the relevant agencies
in Singapore issue acts and regulations.
The list below shows some international conventions adhered to by Singapore:
a. Montreal Protocol (Ozone depleting products and substances): regulated in the
Environmental Protection and Management Act (Chapter 94A)
b. Chemical Weapons Convention: regulated in the Chemical Weapons (Prohibition)
Act (Chapter 37B)
c. Basel Convention: regulated in the Hazardous Waste (Control of Export, Import
and Transit) Act (Chapter 122A)
d. Rotterdam Convention: regulated in the Poisons Act (Chapter 234) and the
Control of Plants Act (Chapter 57A)
e. Kimberley Process (rough diamonds): regulated in the Regulation of Imports and
Exports Act (Chapter 272A)
f. CITES Convention (endangered species): regulated in the Endangered Species
(Import and Export) Act (Chapter 92A)
g. Several regulations that regulate trade activities between Singapore and other
ASEAN members

Chapter 10
137
3. Conclusions and development
Conclusions
In Singapore, the trend in NTM policy is consistent with regional countries, where
the majority of NTMs are SPS or TBT in nature. In addition, the focus on food safety and
environmental protection is also aligned with the region.
However, the number of NTMs is not indicative of whether a country has too
many or too few regulations. The fact that ASEAN countries have a number of
differences, including economic structure, export structure, legal framework, and policy
effectiveness, means that they have a varying number of policies, including NTMs. NTMs
do not and should not have a negative connotation as such, although some can be
construed as trade barriers.
While Singapore’s trade measures and policies are available on the Internet, they
can be difficult to find. Singapore Customs has anticipated this difficulty in understanding
how to conduct trade in Singapore and has an online guide on its website to facilitate the
registration of trading for interested businesses (Singapore Customs, 2015b).
The reliance on trade to drive Singapore’s economy means that the government
tries to make it as easy as possible for businesses interested in trading with Singapore.
Naturally, NTMs are an important trade issue for Singapore. If appropriate, Singapore
strives to take guidance from best practices, as well as international standards, in the
development of its NTMs.
In particular, Singapore has an interest in improving the transparency of NTMs in
the region as well as globally, underscoring its commitment to the multilateral trading
system. The Ministry of Trade and Industry has set up an NTM unit to allocate resources
to the issues concerning NTMs. The main objective of the NTM unit, however, is to help
Singaporean companies in addressing NTM issues overseas. This could stem from
Singapore’s commitment to being transparent about its trade policies, as evident from its
timely WTO notifications and publicly assessable information on trade policies and
related measures. Important feedback from Singapore firms is that NTMs and rules are
more restrictive and non-transparent in other ASEAN countries. Therefore, this UNCTAD–
ERIA project aims to have more open and transparent NTM rules in all ASEAN countries.

Non-Tariff Measures in ASEAN
138
Furthermore, Singapore is always keen to achieve optimal regulation, avoiding
both over- and under-regulating economic sectors. In 2005, the government formed the
Smart Regulation Committee to improve the knowledge, awareness, and practice of
regulations across the public service. The committee is tasked with finding ways to cut
red tape and achieve optimal regulation.
Overall, we believe the UNCTAD–ERIA project on NTMs will contribute to the
transparency of NTMs in ASEAN, which has been lacking. This is not due to a lack of effort
but an absence of a central and neutral organization to collect and study the information.
The involvement of other ASEAN governments in this project is testament to this.
Nonetheless, we continue to encourage the establishment of more effective cooperation
between the various research teams and their respective national governments.
The value-added of this UNCTAD–ERIA project is to provide a better
understanding of Singapore’s NTMs and a comparative understanding to provide insights
on NTM policies of other ASEAN countries. We believe the project will be a catalyst for
further discussion of NTMs in the ASEAN context. However, we must be careful not to
make the purpose of such an endeavour an exercise in judging the legitimacy or
effectiveness of NTMs imposed by ASEAN countries. Rather, it should be viewed as an
opportunity to better understand the NTM regimes in the region. This will also support
the broader goal of global NTM transparency, which will be the first step to addressing
the impact of NTMs on free trade.
Development
While we do not have many specific recommendations for Singapore, the
following would help to build on the momentum of this project.
a. Improve understanding of Singapore NTMs.
It is important for the government to disseminate widely and provide an
effective information mechanism on NTM rules.
b. Comparative NTM study and analysis among ASEAN member states.
Important feedback from Singapore firms is that NTMs are more restrictive
and non-transparent in other ASEAN countries. A comparative study of
ASEAN member states may be useful to assess how the NTM regimes in
each country differ. This may foster greater understanding and
Chapter 10
139
cooperation between national governments to improve trade flows and
contributes to the establishment of the ASEAN Economic Community.
c. Focus on studying NTMs by sectors or types of measures (for example, food
labelling).
Food safety and environmental protection are two of the most common
reasons identified for the existence of NTMs. Besides looking at NTMs at a
national level, it may be useful to drill deeper into the sectoral level.
Clearly, certain industries such as food manufacturing may be affected
more by NTMs than others.
d. Improve understanding of regional NTMs by promoting more transparency.
The UNCTAD–ERIA project on NTMs is an initiative to promote more
transparency and cooperation between ASEAN governments. This will
sustain efforts to encourage and maintain this climate of improving
transparency.
e. Build regulatory cooperation between governments and regulatory bodies.
Continuing efforts to build closer cooperation between governments and
regulatory bodies are important in supporting the broader goal of
achieving NTM transparency.
References
Attorney-General's Chambers (2015), Singapore Statutes Online. Singapore: Government of Singapore. http://statutes.agc.gov.sg (accessed between Jan–Aug 2015).
Singapore Customs (2015a), Businesses: Harmonized System (HS) Classification of Goods. Singapore: Government of Singapore. http://www.customs.gov.sg/businesses/harmonized-system-hs-classification-of-goods (accessed 13 November 2015).
Singapore Customs (2015b), Businesses: Quick Guide on Registration Matters. Singapore: Government of Singapore. http://www.customs.gov.sg/businesses/registering-to-trade/quick-guide-on-registration-matters (accessed 13 November 2015).
World Trade Organization (WTO) (2015a), TBT Information Management System. Geneva: World Trade Organization. http://tbtims.wto.org/web/pages/search/notification/BasicSearch.aspx (accessed between Jan–Aug 2015).
World Trade Organization (WTO) (2015b), Decision on Notification Procedures. Geneva: World Trade Organization. https://www.wto.org/english/docs_e/legal_e/33-dnotf_e.htm (accessed 13 November 2015).

140

141
CHAPTER 11
Non-tariff Measures in Thailand
Chedtha Intaravitak
Thailand Development Research Institute
1. Introduction
This chapter is a descriptive analysis of Thailand’s database of non-tariff measures
(NTMs) constructed from January to August 2015 using the United Nations Conference on
Trade and Development (UNCTAD) methodology and NTM classification (UNCTAD, 2012;
2014). This study evaluates the comprehensiveness of the database by computing proxies
for incidence, depth, and intensity of Thailand’s NTMs. NTMs imposed on some products
(at the 8-digit tariff line level) are explained in detail to highlight their layers and
complexity. Policy recommendations to streamline NTMs in Thailand are briefly
mentioned. Section 2 describes an overview of Thailand’s NTMs, and the
comprehensiveness of the database, the types of NTMs imposed, and regulatory
institutions. Section 3 discusses the incidence and depth of NTMs by product groups.
Section 4 analyses the intensity of NTMs for each product group by computing the
average number of NTMs per tariff line. Products with a particularly high average number
of NTMs imposed are emphasized by explaining their NTMs in detail to give perspectives
on the procedures with which importers and exporters have to comply. Section 5
provides brief policy recommendations and section 6 concludes.
2. Overview of Thailand’s non-tariff measures
2.1. Comprehensiveness of database
Table 11.1 shows a total of 425 regulations coded out of approximately 600
regulations reviewed. Some regulations are not mandatory, unofficial, or revoked, which,
according to UNCTAD methodology, are not included in the database. The study only

Non-Tariff Measures in ASEAN
142
counts 250 non-tariff ‘measures42 in force’ reported to the World Trade Organization
(WTO); measures ‘in initiation’ to WTO are not included. The study has classified 1,630
NTMs using decentralized methods, that is, analysing regulations of each regulatory
agency at the most disaggregate level starting from ministerial notices then moving up to
a higher level of regulations such as royal decrees or acts as necessary. A thorough and
careful interpretation of contents and/or clauses in each regulation results in 9,558
affected products (at the 8-digit national tariff line), which is 98.90 percent of all tariff
lines (9,664 lines at 8-digit level). NTMs related to international conventions are also
classified. The study found two D321 (volume-based agricultural special safeguard)
measures in the Thailand–New Zealand and the Thailand–Australia free trade
agreements. These are not reported in this database since NTMs related to foreign trade
agreements are under consideration by related international organizations. A limited
number of antidumping and safeguard measures are included in the database.43 The
other types of NTMs that have been incorporated in the database were those reported to
WTO and verified to have been incorporated in the database. It was considered that
reporting the number of ‘regulatory agencies’ at sub-ministry level is more meaningful
than reporting the number of ‘issuing institutions’ at ministry level44 as the latter is too
aggregated to gain a perspective on how diverse NTM-related government agencies are.
An accurate understanding of this issue is crucial in the design of a right institution to
streamline NTMs.
42
NTMs reported to WTO are ‘measures’ and not “regulations’ although some reported measures provide links to regulation sources. 43
Type D NTM measure, which includes antidumping, countervailing, and safeguard measures, is not the
focus of this data collection. UNCTAD, however, has added some antidumping measures to our database based on antidumping measures reported to WTO. 44
Most regulations classified in this chapter are ministerial notices and are issued by relevant ministries.

Chapter 11
143
Table 11.1: Comprehensiveness of Database
Comprehensiveness Number
1 Total number of coded regulations 425
2 Total number of ‘NTMs’ reported to the WTO (measures in force)
250
3 Total number of coded NTMs 1630
4 Total affected products (HS lines, national tariff lines)
a. Total number of affected products a
9558
b. Share of the number of affected products to the number of total products b
98.9%
5 Total number of ‘regulatory agencies’ 26
Note: a. A product may be affected by more than one measure, but the same HS-coded product will be counted as one product, e.g. HS 840731 has three NTMs; it will be counted as ‘one affected product’.
b. Thailand adopts the HS-8 digit at national tariff lines and has 9,664 tariff lines. Source: Authors’ calculation based on the newly constructed 2015 NTM database ASEAN-ERIA-UNCTAD raw
data.
2.2. Types of non-tariff measures
Table 11.2 shows sanitary and phytosanitary (SPS) measures comprising 48.3
percent and technical barriers to trade (TBT) comprising 34.9 percent of all NTMs. Price
control measures (F type) contribute 1.3 percent of NTMs. A detailed inspection of F type
measures indicates applicable ‘special fees’ on some sensitive agricultural products such
as F69 (additional charges, n.e.s.) for import of maize and soybean meal. Other important
F measures include, for example, F65 (import licence fee) for chemical weapons, F72
(excise tax for tobacco and liquor), F9 (price control measures, n.e.s.) for alcoholic
beverages. A detailed inspection of E indicates a small number of measures with a clear
objective of protecting domestic industry. These are measures aimed at some sensitive
agricultural products. Examples include E113 (licensing linked to local production) for milk
(to import milk, importers must buy domestic milk in ratio of 1:2 by weight),
soybean/coconut/palm oil (to control effects on vegetable oil sold in domestic market),
coconut/onion (in the event of shortage, import is allowed within certain limits in
quantity and timeframe). Soybean oil, palm oil, and palm kernel are examples of products
that could be imported only by the public warehouse organization. P measures (export-

Non-Tariff Measures in ASEAN
144
related measures) affect almost all tariff lines but, depending on products, the measures
range from simple inspection to registration to licensing/granting permit and to export
prohibition.
Table 11.2: Types of Non-tariff Measures Imposed by Thailand
Code NTM by Type Number of NTMs %
A Sanitary and phytosanitary measures (SPS) 788 48.34
B Technical barriers to trade (TBT) 562 34.48
C Pre-shipment inspection and other formalities 44 2.70
D Contingent trade protective measures 44 2.70
E Non-automatic licensing, quotas, prohibitions, and quantity control measures other than SPS or TBT reasons
40 2.45
F Price control measures including additional taxes and charges
21 1.29
G Finance measures
H Measures affecting competition 3 0.18
I Trade-related investment measures
J Distribution restrictions
K Restrictions on post-sales services
L Subsidies (excluding export subsidies under P7)
M Government procurement restrictions
N Intellectual property
O Rules of origin
P Export-related measures 128 7.85
Total coded NTMs 1630 100.00
Notes: J to O types of NTMs are not collected in this project. Source: Authors’ calculation based on the newly constructed 2015 NTM database ASEAN-ERIA-UNCTAD raw
data.
2.3. Regulatory institutions
Regulatory agencies for NTMs are diverse across different ministries, offices, and
committees (Table 11.3). NTMs regulated by each ministry are, however, not fragmented
at lower level agencies. They are usually grouped in one or two sub-ministry agencies.
The Ministry of Public Health, for example, contributes 42.6 percent of total number of
NTMs of which 35.1 percent comes from the Food and Drug Administration alone. The
Ministry of Agriculture and Cooperatives imposes 29.1 percent NTMs of which the
Department of Agriculture contributes 25.7 percent. The Ministry of Industry imposes
14.5 percent of which the Thai Industrial Standard Institute comprise 11.5 percent. The
Ministry of Commerce contributes nine percent of which 6.9 percent comes from the

Chapter 11
145
Department of Foreign Trade. This fact, however, should not obscure the imminent
difficulty coordinating these sub-ministry units to streamline NTMs.
Table 11.3: Non-tariff Measures by Regulatory Institution
Number Regulatory Institution Number of
NTMs
Total Number of NTMs
(%)
1 Ministry of Public Health 697 42.6
1.1 General 116 7.1
1.2 Food and Drug Administration 574 35.1
1.3 Bureau of Pathogens and Animal Toxins Act 7 0.4
2 Ministry of Agriculture and Cooperatives 476 29.1
2.1 General 37 2.3
2.2 Department of Agriculture 420 25.7
2.3 Department of Fisheries 18 1.1
2.4 Department of Livestock Development 1 0.1
3 Ministry of Industry 238 14.5
3.1 General 2 0.1
3.2 The Thai Industrial Standard Institute 189 11.5
3.3 Department of Industrial Works 31 1.9
3.4 The Office of the Cane and Sugar Board 12 0.7
3.5 Department of Primary Industries and Mines 4 0.2
4 Ministry of Commerce 147 9.0
4.1 General 3 0.2
4.2 Department of Foreign Trade 113 6.9
4.3 Office of the Central Commission on Prices of Goods and Services
26 1.6
4.4 Department of Internal Trade 3 0.2
4.5 Central Bureau of Weights and Measures 1 0.1
4.6 Committee for Grain Trade Act 1 0.1
5 Ministry of Finance 15 0.9
5.1 Excise Department 15 0.9
6 Ministry of Natural Resources and Environment 10 0.6
6.1 General 4 0.2
6.2 Department of National Parks, Wildlife, and Plant Conservation
6 0.4
7 Office of The National Broadcasting and Telecommunications Commission
7 0.4
8 Prime Minister's Office 3 0.2
8.1 The Consumer Protection Board 3 0.2
9 Ministry of Defense 1 0.1
9.1 Defense Industry Department 1 0.1
10 WTO-related committees 43 2.6
10.1 General 37 2.3
10.2 Committee on Antidumping Practices, Subsidies, and Countervailing Measures
3 0.2
10.3 Committee on Safeguard Measures 3 0.2
Total 1637 100.0
Notes: NTMs under the regulatory institution ‘General’ means are those issued by ministries but with no lower level units indicated as responsible such as departments and bureaus. They are issued usually by the secretariat of the relevant ministry. The 1,637 NTMs exceed what was previously reported (1,630) because

Non-Tariff Measures in ASEAN
146
seven of the measures reported here are regulated by both the Department of Agriculture and the Department of Industrial Works. Source: Authors’ calculation based on the newly constructed 2015 NTM database ASEAN-ERIA-UNCTAD raw
data.
3. Incidence and depth of non-tariff measures
The incidence of NTMs is defined as a proportion of tariff lines in each product
group (to be defined later) affected by at least one NTM. The depth of NTMs is defined as
a proportion of tariff lines in each product group affected by three or more NTMs. Table
11.4 shows the division of products into groups according to their HS code at the 2-digit
level.
Table 11.4: Product Groups Classified by Harmonized System Code (2-digit Level)
HS Code Product Group
01-05 Animal and animal products
06-15 Vegetable products
16-24 Foodstuffs
25-27 Mineral products
28-38 Chemicals and allied industries
39-40 Plastics/rubbers
41-43 Raw hides, skins, leather, and furs
44-49 Wood and wood products
50-63 Textiles
64-67 Footwear/headgear
68-71 Stone/glass
72-83 Metals
84-85 Machinery/electrical
86-89 Transportation
90-99 Miscellaneous Source: Authors’ calculation based on the newly constructed 2015 NTM database ASEAN-ERIA-UNCTAD raw
data.
Figure 11.1 shows machinery products comprise 21.4 percent of tariff lines
affected by one or more NTMs. Seventeen percent of these products has only one NTM.
Textiles and metals products comprise 11.2 percent and 9.4 percent, respectively, with
the majority of products for each group having one NTM. Chemical products comprise 12
percent with approximately equal share of products affected by one and three or more
NTMs. Not surprisingly, animal products, vegetables products, and foodstuff have the

Chapter 11
147
majority of their products affected by three or more NTMs. The ‘depth’ of NTMs for these
product groups is anticipated due to the complexity and details of SPS and TBT measures.
A major drawback of an analysis based on Figure 11.1 is that the percentage is
computed as a percentage of total number of tariff lines (9,664 lines). A more interesting
representation would use the number of tariff lines affected by one or more NTMs in each
product group divided by the number of tariff lines in each product group (Figure 11.2).
All tariff lines in all product groups except vegetable products and foodstuffs are
affected by at least one NTM. This is a striking result compared to previous literature on
Thailand’s NTMs. Cadot et al. (2015), using the ASEAN Secretariat 2009 database, found
the highest incidence of NTMs in textiles where approximately 23 percent of tariff lines
are affected by one or more NTMs (Figure 11.3). The major reason for this discrepancy is
the different methods of NTM collection. The ASEAN Secretariat database is based on
reports by government officials whereas this database is collected by first-hand analysis of
actual regulations and done by independent researchers. The methodologies in classifying
NTMs of the two databases may also differ.
Figure 11.1: Incidence and Depth of Non-tariff Measures (as Percentage of 9,664 Tariff Lines)
Source: Authors’ calculation based on the newly constructed 2015 NTM database ASEAN-ERIA-UNCTAD raw
data.

Non-Tariff Measures in ASEAN
148
According to this new database, it can be concluded that Thailand has 100 percent
incidence of NTMs in all product groups except vegetable products and foodstuffs with
90.8 percent and 91.3 percent, respectively. Figure 11.2 highlights the depth of NTMs for
animal products, vegetable products, foodstuffs, and mineral products where the
majority of tariff lines have three or more NTMs.
Figure 11.2: Incidence and Depth of Non-tariff Measures (as Percentage of the Number of Tariff
Lines in Each Product Group)
Source: Authors’ calculation based on the newly constructed 2015 NTM database ASEAN-ERIA-UNCTAD raw
data.

Chapter 11
149
Figure 11.3: Incidence and Depth of Non-tariff Measures: Percentage of Tariff Lines Affecting
One or More Non-tariff Measure (Previous Study)
Source: Cadot et al. (2015).
4. Intensity of non-tariff measures
The intensity of NTMs is defined as the average number of NTMs per tariff line for
each product group. The average number of measures for each tariff line is further
classified into average number of measures of A, B, C, D, E, F, H, and P types. The overall
average number of NTMs per tariff line for Thailand is 6.4 (Figure 11.4). Animal products,
vegetable products, and foodstuffs have the highest intensity of NTMs, where the
average numbers of NTMs per tariff line is 21.4, 22.7, and 24.6, respectively. Most
measures for these product groups fall under SPS and TBT categories. Mineral products,
chemicals, and transportation products have, on average, from three to five measures
per tariff line with B and P types having the most. Other product groups have less than
three average NTMs per tariff line. Figure 11.4 presents a very different result from
previous work on Thailand’s NTMs. Intaravitak et al. (2013), also using the ASEAN
Secretariat 2009 database, found the average number of NTMs to be less than one per
tariff line for all product groups.
0.0
5.0
10.0
15.0
20.0
25.0
30.0
35.0
Country X 3 NTMs or more 2 NTMs 1 NTM

Non-Tariff Measures in ASEAN
150
Figure 11.4: Intensity of Non-tariff Measures: Average Number of Non-tariff Measures per Tariff
Line for Each Product Group
Source: Authors’ calculation based on the newly constructed 2015 NTM database ASEAN-ERIA-UNCTAD raw
data.
The analysis based on Figure 11.4 may underestimate the severity of NTMs. Each
NTM type tends to be particularly associated with some types of products. For example,
SPS measures in general are applicable to vegetable/animal products and foodstuffs.
Many TBT measures concerning product performance/quality are particularly applicable
to metal and machinery products. For this reason, the study has computed for each
product group, an average number of measures of each NTM type among those tariff
lines affected by that particular NTM type (Figure 11.5).
Within the animal products group, certain tariff lines are affected by type A NTMs.
The average number of type A NTMs imposed on these products is 17.6. Using the same
logic within animal products group, certain tariff lines are affected by type B NTMs. The
average number of type B NTMs imposed on these products is 4.1.
Using this method to compute the intensity (or severity) of NTMs is more precise
than that used in Figure 11.4. As an example, according to Figure 11.4, mineral products
have, on average, 3.9 NTMs per tariff line with insignificant proportion of type A NTMs.

Chapter 11
151
Figure 11.5, on the other hand, suggests that for tariff lines in mineral products group
affected by type A NTMs, the average number of type A measures is 22.3 per tariff line.
For example, HS 25010010 (salt, including table salt and denatured salt; and pure sodium
chloride) contains type A measures ranging from tolerance limit of contaminations to
hygienic practice during production to packing, storage, and labelling requirements.
Similarly, it is striking to note that the average number of type A NTMs faced by tariff
lines affected by type A NTMs in animal products, vegetable products, and foodstuffs
groups are 17.6, 18.5, and 19.3, respectively. For textile products, tariff lines affected by
type B NTMs have 4.5 average measures, mostly to ensure that imported fibre waste is
properly reported and managed. Metal products facing type B measures (product quality
or performance requirements) have to comply with 5.5 measures on average. Metal
products facing type D measures have to comply with 6.5 measures on average. Most are
AD measures. Similarly, machinery products facing type B measures (product quality or
performance requirements) have to comply with 6.9 measures on average.
Figure 11.5: Intensity of Non-tariff Measures: Average Number of Measures of each NTM Type
Among Tariff Lines Affected by that Particular NTM Type

Non-Tariff Measures in ASEAN
152
Source: Authors’ calculation based on the newly constructed 2015 NTM database ASEAN-ERIA-
UNCTAD raw data.

Chapter 11
153
5. Policy recommendations on streamlining non-tariff measures
The focus of this chapter is a descriptive analysis of Thailand’s NTM database and
not so much on designing policies to streamline NTMs. This section briefly discusses ideas
about how to address NTM issues learned during NTM data collection, generally
concurring with the methods proposed by the World Bank toolkit on streamlining NTMs
(Cadot et al., 2012). This approach, however, should be modified to suit local context in
each country. In particular, this study proposes the following steps to streamline NTMs:
NTM collection. Establish a one-stop NTM service centre where importers and
exporters can report and be notified of NTMs in a timely manner.
Review of NTMs. The cost-benefit of an NTM should be carefully analysed. Equally
important is understanding who benefits and who bears the cost. Sometimes, NTMs
represent economic rents for some third parties, causing unnecessary inefficiency.
Streamlining NTMs. The following are proposed:
Establish a strong independent oversight body.
Focus on regional mutual recognition agreements as an intermediate, short-
to-medium term solution.
Encourage adoption of international standards in place of national and/or
regional standards.
6. Conclusion
This study constructed a relatively comprehensive Thailand database of NTMs by
analysing official regulations using UNCTAD methodology and have classified 1,630 NTMs
from 425 regulations. These NTMs affect 9,558 products at 8-digit national tariff lines,
which is 98.90 percent of all tariff lines (9,664 lines at 8-digit level). Of these NTMs, 83
percent are SPS and TBT measures that affect 55 percent of tariff lines. The study found
limited use of price control measures (F type) although it affects a relatively large number
of tariff lines. Type E measures, especially those with a clear objective of protecting
domestic industry such as E113 (licensing linked with local production), are barely used.
This study also found limited use of the H11 (state-trading enterprise, for importing)
measure. P measures (export-related measures) affect almost all tariff lines but,
depending on products, the measures range from simple inspection to registration to
licensing/permit and to export prohibition. NTM-related regulatory institutions are
diverse as they are from different ministries. However, NTMs tend to ‘group together’ in

Non-Tariff Measures in ASEAN
154
some of these sub-ministry agencies. The database indicates that Thailand has 100
percent incidence of NTMs in all product groups except vegetable products with a 90.8
percent incidence and foodstuffs with a 91.3 percent incidence. Animal products,
vegetable products, foodstuffs, and mineral products feature more ‘depth’ of NTMs since
the majority of tariff lines in these product groups face three or more NTMs. For each
product group, this study devised a new method to proxy the intensity (or severity) of
NTMs by computing an average number of measures of each NTM type among tariff lines
affected by a particular NTM type. The study found significant NTM severity for some
NTM types in some products. For example, for those tariff lines in the mineral products
group affected by type A NTM, the average number of type A measures is 22.3 per tariff
line. Similarly, the average number of type A NTMs faced by tariff lines affected by type A
NTMs in animal products is 17.6; vegetable products 18.5, and foodstuffs 19.3.
References
Cadot, O., M. Malouche, and S. Saez (2012), Streamlining Non-tariff Measures: A Toolkit for Policy Makers. Washington, DC: World Bank.
Cadot, O., E. Munadi, and L.Y. Ing (2015), ‘Streamlining NTMs in ASEAN: The Way Forward’, Asian Economic Papers, 14(1), pp.35–70.
Intaravitak, C., N. Luksanapanyakul, and S. Tunmunthong (2013), ‘NTMs of Thailand Trade Partners in ASEAN’, in Thailand Development Research Institute (ed.), Increasing the Competitiveness of Thai Manufacturing Industries under the New International Economic Environment (Phase 4). A Research Project Funded by the Office of Industrial Economics, Ministry of Industry, Thailand. Bangkok: Thailand Development Research Institute, 165–194.
United Nations Conference on Trade and Development (UNCTAD) (2012), Classification of Non-tariff Measures: February 2012. Geneva, Switzerland: UNCTAD.
United Nations Conference on Trade and Development (UNCTAD) (2014), Guidelines to Collect Data on Official Non-tariff Measures: September 2014. Geneva, Switzerland: UNCTAD.


155
CHAPTER 12
Non-tariff Measures in Viet Nam45
Vo Tri Thanh46
Central Institute for Economic Management, Viet Nam
Nguyen Anh Duong Central Institute for Economic Management, Viet Nam
Tran Binh Minh
Central Institute for Economic Management, Viet Nam
1. Introduction
Viet Nam has embarked on comprehensive reforms since 1986, focusing on three
pillars: (i) macroeconomic stabilization, (ii) market-oriented reforms, and (iii) pro-active
economic integration. Since 2000, the economic integration process has accelerated.
Alongside increasing integration, Viet Nam has also phased out tariff barriers to
trade, with import tariffs reduced under most integration arrangements. Under the
World Trade Organization (WTO), average bound tariffs dropped sharply, from 17.4
percent in 2005 to 14.2 percent in 2007 and are set to remain stable at 13.4 percent until
2023. This is also the highest level of bound tariff rates for Viet Nam. Tariffs fell most
sharply under the Association of Southeast Asian Nations (ASEAN) Free Trade Area (AFTA)
framework, with the bound rate decreasing from 6.7 percent in 2005 to below 2.8
percent in 2007 and set to fall to 2.5 percent in 2023. Reduction of bound tariff rates was
more gradual under the ASEAN–China FTA (ACFTA), the ASEAN–Korea FTA (AKFTA), and
the ASEAN–Japan Comprehensive Economic Partnership (AJCEP), though the pace of
reduction has been faster since 2015.
45
This research was conducted as a part of the project of the Economic Research Institute for ASEAN and East Asia (ERIA) and the United Nations Conference on Trade and Development (UNCTAD) ‘NTMs in ASEAN’. The authors would like to express appreciation to both ERIA and UNCTAD for constructive guidance and thoughts. The authors are deeply indebted to the members of this project for their invaluable suggestions. The opinions expressed in this paper are the sole responsibility of the authors and do not reflect the views of ERIA or UNCTAD or the Central Institute for Economic Management. 46
Lead author. Vo Tri Thanh: [email protected] / [email protected]. Address: 68 Phan Dinh Phung Street, Ba Dinh District, Hanoi, Viet Nam.

Chapter 12
156
Figure 12.1: Signed and Pending Free Trade Agreements of Viet Nam
Note: ASEAN = Association of Southeast Asian Nations; EFTA = European Free Trade Association; EU = European Union; FTA = free trade agreement; RCEP = Regional Comprehensive Economic Partnership; TPP = Trans-Pacific Partnership. Source: Central Institute for Economic Management (2015).
Figure 12.2: Tariff Reductions under Some Free Trade Agreements, Viet Nam
Note: FTA = free trade agreement; MFN = most-favoured-nation tariff (for all WTO members); ACFTA = ASEAN–China FTA; AKFTA = ASEAN–Korea FTA; AJCEP = ASEAN–Japan Comprehensive Economic Partnership; AFTA = ASEAN Free Trade Area. Source: Truong et al. (2011).
p
e
r
c
e
n
t

Non-Tariff Measures in ASEAN
157
As tariffs are gradually phased out, non-tariff measures are attracting more and
more attention, alongside other issues such as trade facilitation and reducing
unnecessary burdens on business. This is because non-tariff measures (NTMs), given their
incorporation into various regulations and policies that have implication for flows of
goods both at-the-border and behind-the-border, may still restrict trade flows into Viet
Nam from other countries. In turn, consumers may not be able to consume their
preferred products from overseas and importers may face higher compliance costs when
importing intermediate products for further processing in Viet Nam. Conversely, the
presence of NTMs may also serve specific purposes that can be justified, such as
protection of domestic consumers’ health and local biodiversity.
NTMs are defined as ‘policy measures, other than ordinary customs tariffs, that
can potentially have an economic effect on international trade in goods, changing
quantities traded, or prices or both’ (UNCTAD, 2012). The definition of NTMs is thus quite
broad. Unlike NTMs, non-tariff barriers (NTBs) refer to restrictions that ‘…result from
prohibitions, conditions, or specific market requirements that make importation or
exportation of products difficult and/or costly’ (Nguyen and Dang, 2014). NTBs arise from
different measures taken by governments and authorities in the form of government
laws, regulations, policies, conditions, restrictions or specific requirements, and private
sector business practices, or prohibitions that protect the domestic industries from
foreign competition. Thus, NTBs constitute a subset of NTMs and the a priori distinction
of NTBs from NTMs should be avoided.
This chapter revisits NTMs in Viet Nam, focusing exclusively on the types of NTMs
that originate from Vietnamese regulations and policies. Such NTMs may have
implications for imports of goods into Viet Nam, as well as for exports of goods by
Vietnamese exporters. Hence, we ignore the possible NTMs in overseas markets that
Vietnamese exporters may face when selling their products. As we focus only on the
types of NTMs that are in force, we leave aside the possible trade effects of such NTMs.
Being an economy in transition from a central planning regime to a market
mechanism during the past three decades, Viet Nam has only had relatively limited
experience with instruments of trade and trade-related policies. Most of this experience
can be summarized with the use of three types of instruments: (i) trading rights, (ii) non-
tariff barriers, and (iii) trade-related investment measures. More recently it has also

Chapter 12
158
included prohibitions and/or restrictions of trade of selected products due to Viet Nam’s
participation in various international conventions.
The remainder of this chapter is structured as follows. Section 2 summarizes the
key aspects of NTMs in Viet Nam. Section 3 draws out some key lessons from identifying
NTMs in Viet Nam. Finally, section 4 makes some recommendations related to identifying
and stocktaking NTMs in Viet Nam.
2. Key findings of non-tariff measures in Viet Nam
2.1. Classification of identified non-tariff measures by type
Table 12.1 describes the comprehensiveness of the NTM database for Viet Nam.
Accordingly, all products at the 8-digit HS level are subject to some NTMs. The NTMs
were sourced from 121 regulations, and just over one-third were actually in the WTO
database.
Table 12.1: Comprehensiveness of Database
Comprehensiveness Number
1 Total number of coded regulations 121
2 Total number of ‘NTMs’ reported to the WTO
(measures in force)
142
3 Total number of coded NTMs 379
4 Total affected products (HS lines, national tariff lines)
a. Total number of affected products
a
9,558
b. Share of the number of affected products to the number of total products
b
100%
5 Total number of ‘regulatory agencies’ 15 HS = Harmonized System; NTM = non-tariff measure; WTO = World Trade Organization. Note: a. A product may be affected by more than one measure, but the same HS-coded product will be
counted as one product, e.g., HS 840731 has three NTMs; it will be counted as ‘one affected product’.
b. Viet Nam adopts the HS-8 digit at national tariff lines and has 9558 tariff lines. Source: Authors’ calculation based on the newly constructed 2015 NTM database ASEAN-ERIA-UNCTAD raw
data.

Non-Tariff Measures in ASEAN
159
Table 12.2 presents the documented NTMs by type. Viet Nam has completed
phasing out all trade-related investment measures to attract foreign investment.
Accordingly, there is no documented NTM under Chapter I – Trade-related investment
measures (as per the UNCTAD classification). The NTMs under Chapters K to O are
excluded from the analysis, so they are not documented in Table 12.2.
As can be seen, sanitary and phytosanitary (SPS) measures and technical barriers
to trade (TBT) constitute the most popular NTMs in Viet Nam. Each of these codes
accounted for almost 37.5 percent of NTMs that were identified in the process.
Altogether, SPS and TBT measures already make up three quarters of NTMs in Viet Nam;
export-related measures rank third with 63 measures (or 16.6 percent).
Table 12.2: Summary of Non-tariff Measures by Type
Code NTM by Type Number of NTMs %
A Sanitary and phytosanitary (SPS) measures 142 37.47
B Technical barriers to trade (TBT) 142 37.47
C Pre-shipment inspection and other formalities
5 1.32
E Non-automatic licensing, quotas, prohibitions, and quantity control measures other than SPS or TBT reasons
9 2.37
F Price control measures including additional taxes and charges
7 1.85
G Finance measures 2 0.53
H Measures affecting competition 8 2.11
J Distribution restrictions 1 0.26
P Export-related measures 63 16.62
Total 379 100.00 Source: Authors’ calculation based on the newly constructed 2015 NTM database ASEAN-ERIA-UNCTAD raw
data.
SPS measures account for 37.5 per cent of the coded NTMs. The most popular
ones are authorization, testing, and certification. Once authorized, the relevant ministry
will issue a document listing the products and/or breeds authorized for import and use in
Viet Nam, which makes it easy to misunderstand that the NTM works under a positive-list
approach. The reviews also show that there are frequent changes in the SPS regulations
of the responsible ministries (in fact, some regulations received critical feedback from

Chapter 12
160
business and had to be amended/delayed, such as the ice-glazing ratio on fishery
products).
2.2. Classification of non-tariff measures by issuing agency
Table 12.3 tabulates the number and share of NTMs by issuing agency.
Table 12.3: Summary of Non-tariff Measures by Issuing Agency
Issuing agency Number of NTMs %
Ministry of Industry and Trade 32 8.44
Ministry of Transport 8 2.11
Ministry of Science and Technology 4 1.06
Ministry of Agriculture and Rural Development 130 34.20
Ministry of Finance 16 4.22
Ministry of Natural Resources and Environment 2 0.53
Ministry of Information and Communication 4 1.06
Ministry of Construction 6 1.58
Ministry of Health 63 16.62
Government 70 18.47
National Assembly 25 6.60
General Department of Customs 1 0.26
General Department of Quality Measures 2 0.53
Prime Minister 1 0.26
Standing Committee of National Assembly 15 3.96
Total 379 100.00 Source: Authors’ calculation based on the newly constructed 2015 NTM database ASEAN-ERIA-UNCTAD raw data.
Table 12.4 goes into greater detail by summarizing the number and share of SPS,
TBT, and export-related measures by issuing agency.

Non-Tariff Measures in ASEAN
161
Table 12.4: Classification of Sanitary and Phytosanitary, Technical Barriers to Trade, and Export-related Measures by Issuing Agency
SPS TBT
Export-related Measures
Number
Share (%)
Number
Share (%)
Number
Share (%)
Ministry of Industry and Trade
8 5.6 11 7.7 4 6.3
Ministry of Transport 0 0.0 8 5.6 0 0.0
Ministry of Science and Technology
0 0.0 3 2.1 0 0.0
Ministry of Agriculture and Rural Development
66 46.5 31 21.8 32 50.8
Ministry of Finance 0 0.0 4 2.8 5 7.9
Ministry of Information and Communication
0 0.0 3 2.1 1 1.6
Ministry of Construction
0 0.0 5 3.5 0 0.0
Ministry of Health 30 21.1 30 21.1 1 1.6
Government 16 11.3 31 21.8 15 23.8
National Assembly 11 7.7 13 9.2 1 1.6
General Department of Quality Measures
0 0.0 2 1.4 0 0.0
Prime Minister 0 0.0 1 0.7 0 0.0
Standing Committee of National Assembly
11 7.7 0 0.0 4 6.3
Total 142 100.0 142 100.0 63 100.0 Source: Authors’ calculation based on the newly constructed 2015 NTM database ASEAN-ERIA-UNCTAD raw data.
2.3. Products affected by non-tariff measures
Another aspect of NTMs that deserves attention is the scope of affected products.
One way to do so is to calculate the number of NTMs applied in each product
code/category. The proportion of NTM-affected products is calculated at the 8-digit
Harmonized System (HS) level. Following that principle, Figure 12.3 summarizes the
proportion of products at the 8-digit HS level that are subject to (i) fewer than 10 NTMs,
(ii) between 10 and 19 NTMs (inclusive), and (iii) at least 20 NTMs. As a note, the NTM is

Chapter 12
162
identified at the highest disaggregated level, rather than at the chapter level (that is, A, B,
C, and so on).
Figure 12.3: Summary of Number of Non-tariff Measures by Product Group (%)
Source: Authors’ calculation based on the newly constructed 2015 NTM database ASEAN-ERIA-UNCTAD raw data.
It should be noted that no products in Viet Nam are free of NTMs. In fact, there
are two NTMs that apply horizontally to all products. First, under Circular 28/2012/TT–
BCT issued by the Ministry of Industry and Trade, traders with no presence in Viet Nam
have to register rights to imports. This regulation affects all products. Second, following
Decision 10/2010/QD–TTg of the Prime Minister, importers are required to obtain a
Certificate of Free Sale (CFS) from the relevant authority of the exporting country for their
products. Underlying this requirement is the need to ensure that imported products are
eligible for free sale in Viet Nam. If the goods and products were to be exported to Viet
Nam, the requirements under Chapter 3 (CFS requirements for products and goods
imported into Viet Nam) are such that businesses that import the products and goods
listed under the regulations should duly submit CFS to the Vietnamese competent
authority (Article 17). However, if the competent authority so requires, the aforesaid CFS
0
5
10
15
20
25
Fewer than 10 NTMs From 10 to 19 NTMs At least 20 NTMs

Non-Tariff Measures in ASEAN
163
issued by the exporting country or region should undergo ‘consular legalization’ at the
Vietnamese consulate or embassy in the exporting country, except where it is exempted
pursuant to international pacts of which Viet Nam is a member nation or where it
concerns the goods of exporting countries that have signed a mutual waiver of consular
requirements with Viet Nam.
One should recall that a sizeable portion of NTMs in Viet Nam is applied to export
products. Notable examples of such products are fishery and agricultural products. In
many cases, the NTMs are applied on a voluntary basis, not because of a request by
partners. There are several reasons to this. First, Viet Nam has to comply with
commitments under international conventions (for example, prohibitions, conditional
exports, among others). Second, Viet Nam applies voluntary export measures to ensure
quality control of exported products.
Similar to Figure 12.3, Figure 12.4 depicts the prevalence of export-related
measures across products at the 8-digit HS level that are subject to (i) one measure, (ii)
two measures, and (iii) at least three measures. Again, the export-related measures are
identified at the highest disaggregated level, rather than at the chapter level (i.e. A, B, C,
etc.). Moreover, the share is calculated based on the number of 8-digit HS products that
are subject to export-related measures (rather than all 8-digit HS products). As can be
seen, exports of machinery and mechanical products are all subject to only one NTM. A
large share of products under chemical and allied industries, foodstuffs, and wood
products are subject to only one export-related measure, and export of vegetable
products and animal-animal products are largely subject to at least three NTMs.

Chapter 12
164
Figure 12.4: Summary of Export-related Measures by Product Group (%)
Source: Authors’ calculation based on the newly constructed 2015 NTM database ASEAN-ERIA-UNCTAD raw data.
0
5
10
15
20
25
1 NTM 2 NTMs At least 3 NTMs

Non-Tariff Measures in ASEAN
165
2.4. Objectives of non-tariff measures
There have been no clearly indicated reasons for the NTMs. Table 12.5 shows that
almost 99 percent of NTMs are not accompanied by a specific objective. Only a couple of
NTMs serve the explicit objective of protecting human life and health, and another two
aim to protect the life and health of plants. In some cases, one can infer the objectives of
NTMs, such as whether they seek to enhance food safety, protection of domestic
industries (though the effect is not clear), and the quality control of imported products as
they will at a later stage become inputs for export-oriented processing industries.
Nonetheless, the ambiguity of NTM objectives casts doubt on the systematic use of such
measures in trade.
Table 12.5: Reasons Cited for Non-tariff Measures
Measure Objective Number of NTMs %
No objective specified 375 98.94
Protection of human life and health 2 0.53
Protection of life and health of plants 2 0.53
Total 379 100.00 Source: Authors’ calculation based on the newly constructed 2015 NTM database ASEAN-ERIA-UNCTAD raw data.
2.5. Countries affected by non-tariff measures
From the identification of NTMs, it emerged that 368 measures (or 97.1 percent
of NTMs) applied to trade with all countries/territories. Only a few measures affected a
group of countries/territories. The most notable measures are those pertaining to the
trade of rough diamonds under the Kimberley process. In another instance, Viet Nam has
a specific measure to control the quality of fishery exports to Japan. Viet Nam has not
made use of NTMs on an MFN or discriminatory basis.
TBT measures are popular for the remaining products. Again, a significant
proportion of the NTMs are with permits, testing, and authorization. Full prohibition also
applies for some selected products, such as dangerous goods, chemical products, or
arms. Unlike SPS measures, TBT can be found in regulations of a wide range of agencies,
such as the Ministry of Industry and Trade, the Ministry of Agriculture and Rural
Development, the Ministry of Information and Communication, and the Ministry of
Transport. TBT mainly affects consumer products, motor vehicles, and dangerous goods.

Chapter 12
166
This is mainly because they aim to protect domestic industries and ensure quality control
for the benefit of consumers.
3. Key lessons
From the identification of NTMs in Viet Nam some key lessons emerge. First, Viet
Nam needs to frequently monitor the regulations that may have NTM implications. This is
because documents are frequently amended, replaced, or nullified in the country (Figure
12.5). The issue is hard to avoid, as Viet Nam continues to improve its legal framework
and internalizes its commitments under international conventions and/or free trade
agreements (FTAs). The online database can help with this process: new regulations will
be promptly published in the indicated sources for data collection. In most cases, it takes
4–5 working days for new regulations to be posted online (from their date of publication).
Still, all the current laws governing trade remain in effect and, notwithstanding a few
comments/suggestions for partial revision, a major change in the legal system governing
trade is not expected in 2016.
Figure 12.5: Number of Issued Documents, 2010–2014
PM = Prime Minister. Source: Government of Viet Nam Portal. http://chinhphu.vn
Second, there should be greater investigation into the trade effects of NTMs, for
several reasons. On the one hand, the measures tend to apply to all countries and
19
117
1162
620
3266
8 124 162
746
3923
23
106
52
619
3424
19 210
78
582
3072
29 125 75
496
3930
0
500
1'000
1'500
2'000
2'500
3'000
3'500
4'000
4'500
luật Nghị định QĐ.TTg thông tư Vb điều hành
2010 2011 2012 2013 2014
Law Decree PM’s Decision Circular Other policy documents

Non-Tariff Measures in ASEAN
167
territories, but only some have current trade transactions with Viet Nam. On the other
hand, the measures apply to broad product categories, whereas only a few HS products in
such categories are actually affected. Of course, it may be argued that the absence of
trade transactions for some products and/or with some countries actually resulted from
the impact of NTMs. Still, in this regard, analysing the trade effects of NTMs attains even
greater importance.
Third, we need to constantly check the consistency of NTMs from root documents
(that is, laws and ordinances, among others) with those under guiding documents (such
as decrees and circulars) to avoid duplication. In many cases, the NTMs at the decision or
circular levels are only elaborated from the laws, without adding more effect. Looking at
the root documents ensures that the affected products are captured comprehensively,
but the period of effects and exemption of effects may be better presented in the guiding
documents.
Finally, given the proliferation of FTAs in Viet Nam (Figure 12.1), one should keep
track of all those FTAs. At this stage, FTAs do not affect NTMs as Viet Nam continues to
apply them equally to all partners. That is, preferential treatment under FTAs is not done
significantly by means of NTMs. Still, the large number of bilateral and plurilateral FTAs
now does not exclude the possibility that some NTMs are effective towards selected
countries only. In addition, rules of origin may have more implications under those FTAs,
but are excluded from this analysis.
4. Recommendations
On the basis of the above identification of NTMs and the key lessons that
emerged, we present some recommendations for Viet Nam. First, the country needs to
frequently update the database of the government’s inquiry points (SPS, TBT). The
websites are accessible, but sometimes regulations are already ineffective or have been
amended. Also, the documents are available in only in Vietnamese, so an English
translation should be added to ensure it can be understood by foreign as well as domestic
traders.
Second, Viet Nam needs to promptly construct a national trade repository, which
would provide more consistent, transparent, and easily accessible information on NTMs.

Chapter 12
168
It may also help prepare the country for implementing commitments under various
international frameworks (such as the work on the ASEAN Trade Repository under the
ASEAN Economic Community).
Third, the regulations should also clearly identify HS codes for affected products in
NTM regulations. Having worded descriptions of affect products is insufficient, given the
inadequate harmonization of product groups in Viet Nam and in other partners. Listing
the HS codes can help traders in making customs declarations and improves the quality of
custom data on trade.
Fourth, trade effects of NTMs should be well documented. This will give more
insight into the types of NTMs that are relevant and/or can be phased out. In addition,
given the complexity of regulations that might have NTM implications, analysing the
trade effects can actually help in avoiding unnecessary burdens on trade activities.
Fifth, Viet Nam should continue to apply NTMs equally to all partners. In other
words, Viet Nam should avoid particular NTMs for imports from certain countries or
territories, except under special circumstances or for a short period. Using NTMs on a
discriminatory basis is likely to divert trade away from the partners concerned and
increase administrative costs for managing NTMs in Viet Nam.
Finally, Viet Nam should aim for better and more transparent justification of
NTMs. This will help reduce the unnecessary burden of NTMs on traders and businesses.
In various cases, ex ante consultation might help collect relevant insight from traders and
businesses, which would improve the quality of the regulation itself – when the business
community is confident NTMs are legitimate, this will improve their actual effectiveness.

Non-Tariff Measures in ASEAN
169
References
Central Institute for Economic Management (2015), Impacts of FTAs and BITs on Viet Nam’s Long-term Development Goals: Case Study of Food Processing and Electronics Sectors. Funded by ActionAID International Viet Nam. In Vietnamese and English.
Truong, D.T., Vo, T.T., Bui, T.G., Phan, V.C., Le, T.D., Nguyen, A.D. and Pham, S.A. (2011), Impacts of Market Access Commitments under WTO and FTAs on Production and Business in Viet Nam. Hanoi: Multilateral Trade Assistance Project. In Vietnamese.
United Nations Conference on Trade and Development (UNCTAD) (2012), NTM Classification. February 2012 Version. Online. http://unctad.org/en/PublicationsLibrary/ditctab20122_en.pdf (accessed 24 January 2015).
