non-tariff barriers to trade in east africa community: …
TRANSCRIPT

NON-TARIFF BARRIERS TO TRADE IN EAST AFRICA
COMMUNITY: A CASE OF EXPORTERS IN KENYA
BY
ANYAL MICHAEL OKUTE
UNITED STATES INTERNATIONAL UNIVERSITY - AFRICA
SPRING 2017

i
NON-TARIFF BARRIERS TO TRADE IN EAST AFRICA
COMMUNITY: A CASE OF EXPORTERS IN KENYA
BY
ANYAL MICHAEL OKUTE
A Project Report Submitted to the Chandaria School of Business in Partial
Fulfillment of the Requirement for the Degree of Masters in Business
Administration (MBA)
UNITED STATES INTERNATIONAL UNIVERSITY - AFRICA
SPRING 2017

ii
STUDENT’S DECLARATION
I, the undersigned, declare that this is my original work and has not been submitted to any
other college, institution, or university other than the United States International
University-Africa in Nairobi for academic credit.
Signed: Date:
Anyal Michael Okute ID No: 617447
This research report has been presented for examination with my approval as the
appointed supervisor.
Signed: Date:
Prof. Timothy Okech
Signed: Data:
Dean, Chandaria School of Business

iii
ABSTRACT
The purpose of the study was to investigate the effects of non-tariff and technical barriers
to trade on the Kenyan exporters within the East African Community. The study was
guided by the following research questions: What are the non-tariff barriers faced by
Kenyan exporters within the East African Community? What are the technical barriers to
trade affecting the Kenyan exporters within East African Community? What are the
mitigating factors on non-tariff barriers and technical barriers to trade?
The study adopted an explanatory research design to explain the various technical and
non-tariff trade barriers that hinder trade within EAC within particular emphasis on
barriers that hindered Kenyan exporters in EAC. The population of the study included all
exporters in Kenya who were 9,585. The Yamane‘s formula was used to determine the
sample size from population within each stratum and this brought the sample size to 121
respondents. Questionnaires were the main data collection instrument that were used by
the researcher. Descriptive analysis was used in the data analysis and reporting of results.
Measures of central tendencies, such as means, standard deviation, and percentages were
used. Correlation analysis was used to describe the degree of relationship between the
study variables.
The study showed that documentation and procedures, too many agencies involved in
overall export inspection and certification in the region, escort of all sensitive and
hazardous products through the territory of each East Africa Community (EAC) transit
country, and verification of transit cargo were a challenge. It also showed that lack of
harmonization in working hours at the border posts, delays at weighbridges, multiple
police road blocks and mobile control, prohibition on transportation of locally produced
goods, and EAC transit licenses for goods were a challenge for exporters. The study
showed that truck entrance fees and grace period, business registration, use of
immigration and visa procedures, poor information dissemination across the East Africa
community, language barrier, and insecurity/ highway crimes/loss of goods at the
container freight stations were all non-tariff barriers to trade in EAC.
The study showed that technical Barriers to Trade in terms of technical requirements,
voluntary standards and conformity assessment procedures affect trade. The study
showed that exporters in Kenya faced institutional barriers to Kenya’s trade in the EAC.

iv
The study showed that various Kenyan ministries, departments and parastatals were the
institutional barriers to trade, and that KRA was responsible for the enforcement and
management of the customs laws and the administration of common external tariffs hence
causing TBT. The study showed that application of numerous certification and
conformity assessments, and the procedure for obtaining the certificate of origin being
cumbersome and lengthy were a barrier to trade.
The study showed that some mitigation procedures for minimizing the impact of trade
barriers would include: harmonizing product standards and developing mutual
recognition of standards across member countries, carrying out verification of
information on NTBs, prioritizing products, developing specific work programs, and
carrying out a sector-based approach strategy that deals with issues in specific economic
and politic sectors. Other mitigation strategies would include: enhancing exchange of
information and views on a range of active NTB elimination programs/projects,
establishing a communication network between NTB focal points, and establishing
appropriate procedures for identifying and eliminating NTBs.
The study concludes that documentation and procedures, too many agencies involved in
overall export inspection and certification in the region, escort of all sensitive and
hazardous products through the territory of each EAC transit country, verification of
transit cargo, and lack of harmonization in working hours at the border posts. The study
concludes that some mitigation procedures for minimizing the impact of trade barriers
would include: harmonizing product standards and developing mutual recognition of
standards across member countries, carrying out verification of information on NTBs,
prioritizing products, developing specific work programs, and carrying out a sector-based
approach strategy that deals with issues in specific economic and politic sectors.
The study recommends that existing advance ruling mechanisms in various boarders and
countries be classified according to the national customs tariff and verification of the
origin of goods declared for preferential treatment. All parties could also introduce an
advance ruling mechanism to provide information on the method that will be applied for
customs valuation.

v
ACKNOWLEDGEMENT
This has been a learning process which I could not have achieved on my own.
I would also like to thank the administration of the United States International University
(USIU) for providing me with a good environment and facilities to complete this project
and to the faculty members of the Chandaria School of Business who provided me with
invaluable knowledge throughout my studies and made this success possible.
Finally, I wish to express my love and gratitude to my family for their support in terms of
resources, encouragement and love through the duration of my studies

vi
DEDICATION
This work is dedicated to my late grandfather Daudi Anyal Musa, to my Aunt Evelyn
Anyal, my family, and to my wife Hiromi Okute, without their caring support at one point
or the other in my life, it would not have been possible. Thank you all for your support,
love and encouragement during the time I have been pursuing my Master’s Degree
Programme. Grandfather, it would have been nice to share with you this special
achievement.

vii
TABLE OF CONTENTS
STUDENT’S DECLARATION ......................................................................................... ii
ABSTRACT ........................................................................................................................ iii
ACKNOWLEDGEMENT .................................................................................................. v
DEDICATION.................................................................................................................... vi
TABLE OF CONTENTS ................................................................................................. vii
LIST OF TABLES ............................................................................................................. ix
LIST OF FIGURES ............................................................................................................ x
CHAPTER ONE ................................................................................................................. 1
1.0 INTRODUCTION......................................................................................................... 1
1.1 Background of the Study ................................................................................................ 1
1.2 Problem Statement .......................................................................................................... 5
1.3 Purpose of Study ............................................................................................................. 6
1.4 Research Questions ......................................................................................................... 6
1.5 Significance of the Study ................................................................................................ 6
1.6 Scope of the Study .......................................................................................................... 7
1.7 Definition of Terms......................................................................................................... 7
1.8 Chapter Summary ........................................................................................................... 8
CHAPTER TWO ................................................................................................................ 9
2.0 LITERATURE REVIEW ............................................................................................ 9
2.1 Introduction ..................................................................................................................... 9
2.2 Non-Tariff Barriers Facing Kenyan Exporters in the EAC ............................................ 9
2.3 Technical Barriers to Trade .......................................................................................... 16
2.4 Mitigating Factors on Non-Tariffs and Technical Barriers to Trade within EAC ........ 20
2.5 Chapter Summary ......................................................................................................... 26
CHAPTER THREE .......................................................................................................... 27
3.0 RESEARCH DESIGN AND METHODOLOGY .................................................... 27
3.1 Introduction ................................................................................................................... 27
3.2 Research Design............................................................................................................ 27
3.3 Population and Sampling Design .................................................................................. 28
3.4 Data Collection Methods .............................................................................................. 30

viii
3.5 Research Procedures ..................................................................................................... 30
3.6 Data Analysis Methods ................................................................................................. 30
3.7 Chapter Summary ......................................................................................................... 31
CHAPTER FOUR ............................................................................................................. 32
4.0 RESULTS AND FINDINGS ...................................................................................... 32
4.1 Introduction ................................................................................................................... 32
4.2 Response Rate and General Information ...................................................................... 32
4.3 Non-Tariff Barriers on Trade (NTBs)........................................................................... 34
4.4 Technical Barriers to Trade (TBT) ............................................................................... 39
4.5 Mitigating Factors for the Trade Barriers ..................................................................... 44
4.6 Chapter Summary ......................................................................................................... 51
CHAPTER FIVE .............................................................................................................. 52
5.0 DISCUSSIONS, CONCLUSIONS, AND RECOMMENDATIONS ...................... 52
5.1 Introduction ................................................................................................................... 52
5.2 Summary of Findings .................................................................................................... 52
5.3 Discussions ................................................................................................................... 53
5.4 Conclusions ................................................................................................................... 61
5.5 Recommendations ......................................................................................................... 62
REFERENCES .................................................................................................................. 63
APPENDICES ................................................................................................................... 69
APPENDIX A: TIME SCHEDULE ................................................................................ 69
APPENDIX B: BUDGET ................................................................................................. 70
APPENDIX C: COVER LETTER .................................................................................. 71
APPENDIX D: SAMPLE QUESTIONNAIRE .............................................................. 72

ix
LIST OF TABLES
Table 3.1: Population Distribution ...................................................................................... 28
Table 3.2 Sample Size......................................................................................................... 30
Table 4.1 Rating of Non-Tariff Barriers in Trade ............................................................... 34
Table 4.2 Correlations of Non-Tariff Barriers in Trade ..................................................... 36
Table 4.3 Regression Model Summary for NTB Barriers to Trade .................................... 38
Table 4.4 Regression Coefficients for NTB Barriers to Trade Factors .............................. 38
Table 4.5 Rating of Technical Barriers to Trade ................................................................ 39
Table 4.6 Correlations of Technical Barriers to Trade ....................................................... 41
Table 4.7 Regression Model Summary for TBT Barriers to Trade .................................... 43
Table 4.8 Regression Coefficients for TBT Barriers to Trade Factors ............................... 43
Table 4.9 Rating for Mitigating Factors on Trade Barriers ................................................ 44
Table 4.10 Correlations of Mitigating Factors for Trade Barriers ...................................... 48
Table 4.11 Regression Model Summary for Mitigating Factors for Trade Barriers .......... 50
Table 4.12 Regression Coefficients for Mitigating Factors for Trade Barriers .................. 50
x
LIST OF FIGURES
Figure 4.1 Nature of Business ............................................................................................. 32
Figure 4.2 Length in EAC Export ....................................................................................... 33
Figure 4.3 Trade Barriers Encounter .................................................................................. 33

1
CHAPTER ONE
1.0 INTRODUCTION
1.1 Background of the Study
Many world economies have been embracing regional integration as strategy towards
achieving an accelerated economic development, which is a key agenda for many states
and promise given to electorates every time they elect the leaders. In East Africa,
economic integration involving Uganda, Kenya and Tanzania was established in 1967,
but collapsed in 1977 (Reith & Boltz, 2011). In 1993, the initiative was revived with the
signing of a Declaration on Closer East African Cooperation. The treaty for the
establishment of the East African Community (EAC) of 1999 set out a vision for the
eventual unification of Kenya, Tanzania, and Uganda. The sequence of events laid out
comprised the establishment of a customs union, followed by a common market, a
monetary union, and eventually a political federation (Reith & Boltz, 2011).
The overall objective of EAC was to develop policies and programs aimed at widening
and deepening cooperation among the partner states in political, economic, social and
cultural fields, research and technology, defense, security, and legal and judicial affairs
for their benefits. Currently membership to EAC includes Uganda, Kenya, Tanzania,
Burundi and Rwanda (Okumu & Nyankori, 2010). As part of the process of realizing full
benefits of economic integration, the regional block further agreed to establish a customs
union, common market, monetary union and finally a political federation. In March 2004,
the EAC heads of states signed a protocol on establishment of the East African
Community Customs Union (EACCU). The protocol came into effect on January 2005.
Article 3 of the protocol of (Community, 2004) outlines four key objectives of the
customs union as: to liberalize trade within the customs area for the benefit of all member
states, promote production efficiency within the customs union, attract investments into
customs union area, and stir up economic development and industrialization in various
sectors.
The main instrument for trade liberalization provided under the customs union was the
elimination of tariffs and non-tariff barriers (NTB), within the partner states in order to
increase economic efficiency and create political and cultural relationships among the
partner states (Nzuma, 2007). NTBs refer to the wide and heterogeneous range of policy
interventions other than border tariffs that affect and distort trade of goods, services, and
2
factors of production. Common taxonomies of NTBs include market-specific trade and
domestic policies such as import quotas, voluntary export restraints, restrictive state-
trading interventions, export subsidies, countervailing duties, technical barriers to trade,
sanitary and Phystosanitary (SPS) policies, rules of origin, and domestic content
requirement schemes. Extended taxonomies also include macro-policies affecting trade
(Beghin, 2006).
Globally, tariffs have been declining as a result of multilateral, regional and bilateral trade
liberalization. At the same time though, many countries have instituted alternative
protectionist mechanisms, NTBs, which are ever changing and are threatening
international free flow of goods and services (Beghin, 2006).
As tariff barriers continue to reduce for instance at the multilateral level through various
rounds of trade negotiations; and at the regional and bi-lateral levels through various trade
arrangements, the issue of non-tariff measures becomes more important in accessing
markets (Reith & Boltz, 2011). The World Trade Organization (WTO) General
Agreement on Trade and Tariffs under Article 20, allows members to implement
measures to protect human, animal or plant life or health, provided no discrimination or
disguised protectionism arises (Beghin, 2006). In addition, WTO agreements of Sanitary
and Phytosanitary measures (SPS) and Technical Barriers to Trade (TBT) deal with food
safety and animal and plant health and safety, as well as product standards in general. The
importance of these measures cannot be underscored, since they are necessary for inter
alia environmental protection, health safety, and national security to consumers (Reith &
Boltz, 2011). However with a multiplicity of such measures imposed by countries,
accessing markets of interest has become challenging and costly for producers and
exporters. In many instances the measures are difficult to track and conform to given their
diversity, hence the need to analyze these issues and map out possible solutions to
overcome the challenges they present in accessing markets of interest (Nzuma, 2007).
The creation of the EAC Customs Union is expected to increase trade and investment
flows between member states and at the same time create a large market for the East
African people (Reith & Boltz, 2011). The expanded trade and cooperation of the partner
states offers the prospect of economic growth and prosperity for East Africans. However,
for these outcomes to be realized the Customs Union must urgently eliminate all obstacles

3
that act as impediments to the realization of smooth trade and investment flows in the
region (Mmasi and Ihiga, 2007).
These obstacles include both tariff and non-tariff barriers (NTBs) to trade, whose removal
reduces the cost of doing business and ultimately improves welfare. Within Eastern and
Southern Africa, tariffs play a much less important role as a barrier to cross border trade
than NTBs do (EABC 2005). Under the EAC Customs’ Union Protocol, partner states
have committed themselves to eliminate, with immediate effect, all existing NTBs on
intra-EAC trade and to refrain from introducing new ones. However, trade between the
EAC countries is still being hampered by the existence of NTBs that are variously applied
by the member states (EABC 2005). Within the community, the main types of NTBs
include customs documentation and administrative procedures, immigration procedures,
quality inspection procedures and transiting procedures that are cumbersome, un-
standardized, and costly (EABC 2005). Thus, EAC trade liberalization and associated
welfare gains would depend primarily on the elimination of policies and procedures
linked to structural NTBs.
Economists generally agree that NTBs are detrimental to regional trade. These barriers
diminish the potential benefits of trade preferences such as regional trading arrangements.
Moreover, NTBs are a serious impediment to the growth of intraregional trade and their
associated benefits. The existence of NTBs increases the cost of doing business, which
ultimately leads to huge welfare losses (EABC 2005). However, the cost of these NTBs
and their trade and welfare implications within the EAC are not well understood.
The EAC region has increasingly become the major market for Kenya’s exports, whose
value grew from USD 1.54 Billion in 2001, to USD 1.7 Billion in 2002, 1.8 Billion in
2003, 2.06 Billion in 2004 and to 2.68 Billion in 2005. The region therefore took the
lion’s share of Kenya’s exports during the period, representing 56% between 2001 and
2003, growing to 58% in 2004, and dropping slightly again to 56% in 2005. This was an
average of 57% market share over the period 2001 to 2005. The country’s sister partners
within the EAC region took the bulk of exports to COMESA, with Uganda taking an
average of 41% over the period 2001-05 and Tanzania taking an average 19% of the
market share (Ihiga, 2007).

4
Statistics from the East African Business Council show that Kenya’s ten leading exports
to the EAC during the period 2006-2011 were Tea which took 17%; Articles of iron and
steel which took 6.5%; and Essential oils, perfumery, soap and polishing preparations
which took 6% of Kenya’s exports to EAC/COMESA. Other products in the category of
ten major exports were Petroleum products, Paper and paperboard, Salt and Cement;
Textile yarn, fabrics and garments; Cigarettes; Glass and glassware; and un-milled maize
(Ihiga, 2007).
In general, Non-tariff barriers such as SPS and TBTs have affected Kenya’s access to
markets for commodities such as fish and horticulture. The Uruguay Round of
Negotiations contains three important elements of which SPS is a major one. These
mandate that SPS be applied only to the extent necessary to protect food safety and
animal and plant health. This however can constitute unfair technical barriers to trade
when used indiscriminately. Provision is also made for possible technical assistance for
developing countries to comply with SPS standards of importing countries (Mmasi &
Ihiga, 2007).
Apart from tariff barriers, Kenya’s exports to developed countries markets have been
barred by instances of arbitrary imposition of sanitary and phytosanitary (SPS) measures
and the most affected sub-sectors include horticulture and fisheries. Besides, there have
been cases where sub-standard commodities that do not meet SPS standards have been
dumped in the country. Kenya’s positions on SPS is for transparency in implementation
by developed countries and for provision of technical support to enable the country
undertake risk analysis and participate in international meetings for setting standards
(Nogueira, 2008).
In Kenya, market access has also been affected by SPS, where fish exports to the
European Union faced a ban in 1999 to 2000. This was because Kenya and other East
African Countries were unable to meet the EU’s hazard analysis critical control points
(HACCP) requirement. Although the ban was later lifted, the SPS creates barriers to
agricultural trade. The minimum residual pesticide requirement by the EU countries on
horticulture produce also poses barriers to trade for Kenyan exports. In general, food
standards are used extensively by developed countries to block entry into their markets of
agricultural products from developing countries. Unfortunately, developing countries

5
consider the standards set by developed countries not to be transparent. Furthermore, fair
implementation of SPS agreement requires both financial and technical resources which
Kenya lacks (EAC, 2009).
An acute problem is the lack of appropriate scientific and technical expertise with little
technical assistance being given to developing countries. The challenge facing both
developed and developing countries is for collaboration of one with the other to reach
accommodation and reconcile the disparate preoccupations relating trade and those
relating to the protection of human, animal and plant health and the environment (Nzuma,
2007).
1.2 Problem Statement
Trade barriers have become an important trade policy issue among the member states of
the East African Community. Trade barriers both Non-Tariff and Technical Barriers have
an effect of reducing the gains from trade liberalization arising from the reduction of
tariffs. Due to their unpredictability and persistence, they continue to influence trade
patterns and restricting market access to regional exporters thus denying consumers’
welfare enhancing opportunities, which arise from access to, reasonably priced regional
imports (COMESA, 2009).
NTBs refer to the wide and heterogeneous range of policy interventions other than border
tariffs that affect and distort trade of goods, services, and factors of production. Common
taxonomies of NTBs include market-specific trade and domestic policies such as import
quotas, voluntary export restraints, restrictive state-trading interventions, export subsidies,
countervailing duties, technical barriers to trade, sanitary and Phystosanitary (SPS)
policies, rules of origin, and domestic content requirement schemes. Extended
taxonomies also include macro-policies affecting trade (Beghin, 2006).
The problem thus lays in how to identify these barriers and to what extend do they inhibit
Kenya from fully exploiting the opportunities that exist within the East Africa Market.
The ways which the country can explore to improve on its ability to overcome the barriers
have been understudied and a problem this study sought to address.

6
1.3 Purpose of Study
The purpose of the study was to investigate the effects of non-tariff and technical barriers
to trade on the Kenyan exporters within East African Community.
1.4 Research Questions
1.4.1 What are the non-tariff barriers faced by Kenyan eporters within the East
African Community?
1.4.2 What are the technical barriers to trade affecting the Kenyan exporters within
East African Community?
1.4.3 What are the mitigating factors on NTBs and TBTs?
1.5 Significance of the Study
The study may be of benefit to a number of stakeholders. These include:
1.5.1 Policy Makers
Policy makers will be enlightened on the trade barriers existing within the East African
Community and are in a position to get solutions to the issues raised. They will also be
able to understand and employ the measures suggested to facilitate exportation within the
East African Community.
1.5.2 Kenyan Exporters
Kenyan exporters will be in a position to understand the trade barriers affecting their trade
and are in a position to devise ways to counter the issues affecting their business. They
will also be able to understand what measures they can undertake to help the situation.
1.5.3 Upcoming Kenyan Exporters
Upcoming Kenyan exporters will be able to understand the export business within the
East African Community and know what to expect even before they indulge in the same.
They will be enlightened on the trade barriers they should expect as they embark on
exportation within the East African Community.
1.5.4 Researchers
The future researchers will be able to assess how the past research would have dealt with
the problem and be able to come up with new dimensions that they can research on.

7
1.6 Scope of the Study
This study was limited to the Kenyan exporters within the East African Community. Data
was collected from exporters within Nairobi region using questionnaires. The study
targets a population of 9,585 exporters from which a suitable sample size was drawn. The
research covered the period between the years 2013 to 2014.
The limitations of the study included difficulty in tracing the exporters, lack of openness
by employees and management as they may not want to fully disclose the details of their
companies, and poor response rate. To overcome these limitations, the study ensured that
the correct and reliable sample frame was used to be able to target the right and traceable
organizations and not ghost ones. The study also assured anonymity and confidentiality to
improve on openness and response rate.
1.7 Definition of Terms
1.7.1 Non-Tariff barriers
Any measure other than a tariff that causes a trade distortion (Kimenyi, 2008).
1.7.2 Non-Trade Barrier
These are measures, other than tariffs, that are tightly connected with state
(administrative) activity and influence prices, quantity, structure and/or direction of
international flows of goods and services, as well as resources used to produce these
goods and services. They are import-targeted public policy interventions intended to
protect domestic industries, national health, safety and security, as well as revenue
sources (Okumu and Nyankori, 2010).
1.7.3 Trade Distortion
Exists when the price at the border diverges from the domestic price and can result from
regulations or administrative procedures which are imposed to serve a specific objective
(Hangi, 2010).
1.7.4 Protectionist
Protectionist is the system of imposing duties on imports into a country in order to protect
domestic industries (Okumu and Nyankori, 2010).

8
1.7.5 Monopoly
This is a situation in which one company controls an industry or is the only provider of a
product or service (Fliess and Lejarraga, 2005).
1.8 Chapter Summary
This chapter has covered the introduction of the research problem by exploring the
various definitions of trade barriers. It has explored the global meaning and also the EAC
meaning of trade barriers. It has looked at the diverse taxonomies of trade barriers and
tried to give a brief explanation of the same and has also covered the history of EAC and
its position on trade barriers. It has outlined the problem statement that described the need
for this particular study. The chapter also exposed the general objectives of the research
study. Finally, the chapter explained the rationale of the study, scope in which the
research will take place, and defined terminologies used.
Chapter two presents the literature review related to problem under study, which
evaluates recent research studies that have been undertaken, while chapter three presents
research methodology that was employed in carrying out the study. Chapter four presents
the results and findings of the study, chapter five offers the study discussions, conclusions
and recommendations.

9
CHAPTER TWO
2.0 LITERATURE REVIEW
2.1 Introduction
This chapter presents literature that relates to the study to be carried out. The chapter has
been divided into four sections. In the first section, an introduction of the chapter is
provided, the next section highlights views presented in past studies about looks at
literature related to the Non-Tariff Barriers affecting trade in East Africa Community,
section 2.3 looks at literature related to the Technical Barriers to Trade that Kenya faces
in EAC region, while section 2.4 deals with literature related to the mitigating factors for
Non-Tariff Barriers and Technical Barriers to Trade. The chapter closes with a brief
summary of the issues discussed therein.
2.2 Non-Tariff Barriers Facing Kenyan Exporters in the EAC
A research by World Bank, (2008) presented a synthesised report on the non tariff
barriers that affect traders in the East African Community. These findings are based on
the broad categories organized by the World Trade Organization. Nontariff barriers
(NTBs) refer to the wide range of policy interventions other than border tariffs that affect
trade of goods, services, and factors of production. Most taxonomy of NTBs includes
market-specific trade and domestic policies affecting trade in that market. Extended
taxonomies include macro-economic policies affecting trade. NTBs have gained
importance as tariff levels have been reduced worldwide. Common measures of NTBs
include tariff-equivalents of the NTB policy or policies and count and frequency
measures of NTBs. These NTB measures are subsequently used in various trade models,
including gravity equations, to assess trade and/or welfare effects of the measured NTBs
(Beghin, 2006).
2.2.1 Customs and Administrative Entry and Passage Procedures
Several sessions, forums and meetings have been undertaken by the EAC Council of
Ministers with the aim of simplifying and synchronizing customs documentation,
formalities and procedures at the border posts. Little of this has been translated into
action. Many member states are undertaking donor-funded customs modernization
programs, but the focus and content of such national efforts remain largely uncoordinated
across the EAC. Planned improvements in administering border posts have been slow,
mostly bilateral, and with somewhat varying results to date. Duplication of processes

10
continues to add to monetary costs and loss of time. Unequal treatment according to the
country of origin of the goods and/or truck and opportunities for fraudulent behavior is
frequent, as are the allegations of such “unfair” treatment and corruption (World Bank,
2008).
2.2.2 Documentation and Procedures
A task commissioned by the countries to check on the factors that hinder trade within the
EAC found out there were varying systems of import declaration, payment of applicable
duty rates, and standards applied, as well as limited/varying working hours at the
customs posts. Lengthy procedures and inadequate information to enable customs
officials make pertinent decisions at the border posts seem to plague the EAC-wide
system. To implement customs procedures for entry processing, cargo control, transit,
warehouse control, and accounting, four member countries have opted to use various
versions i.e. Automated Systems for Customs Data (ASYCUDA - is a computerized
customs management system developed by UNCTAD to help reform the customs
clearance process), while Kenya has chosen to use Similarity Based Complex Analysis
System (SIMBA) an electronic real time trading system for international markets. To
date, the linkage between these two systems has not been smooth. Delays in processing
export papers are widespread. Before transporters leave their departure point, they must
file export papers with the revenue authority (at the capital) to be sent to the border post.
Kenya and Uganda have a bilateral legal framework for joint control at their common
border posts, creating a one-stop post at each border crossing, starting with Malaba. They
also have an agreement to introduce 24-hour services at their common border posts. It
takes about one week for process at Kenya Revenue Authority to be completed which too
many exporters is perceived to be a long and strenuous exercise. It gets worse, when
goods move to other countries, which as documented in the report by World Bank (2008)
different procedural arrangements on these borders slow down business.
2.2.3 Institutions Exercising Administrative and Customs Controls
A point agreed by most of the EAC member governments is that there are too many
agencies involved in overall export inspection and certification in the region, stretching
the administrative capacity and resource needs (Beghin, 2006). The process is no different
for goods traded intra-EAC. For example, numerous agencies participate in the clearance
process in Burundi, even though the Customs Service is the primary public agency

11
responsible for administration, control, and collection of taxes on imported and exported
goods. It is also the only country in the EAC that does not have a full-fledged revenue
authority in place. Even in member countries with a fully functional revenue authority,
with its own customs department, and a developed bureau of standards, the inspection and
verification is the responsibility of multiple agencies. Case in point is the public agencies
in Uganda that manage food safety and quality standards. In the end, the multiple
agencies result in customs processing taking up to one week on average in Uganda, with
“simplified procedures” for single item cargo taking one day, and multiple item cargo
taking three days.
In addition, the effectiveness of some agencies such as to which a member government
may have delegated monopoly power in certain functions are being called to question
widely by private sector firms. An example is the Société Générale de Surveillance in
Burundi, which receives cargo under the Import Verification Program. Pre-shipment
inspection is usually designed to improve customs valuations by combating overcharging
of imports and undercharging of exports, but this may become another barrier in the
member nation (SADC, 2006).
2.2.4 Escorts of Goods in Transit
All sensitive and hazardous products are escorted through the territory of each EAC
transit country. In addition, to ensure that transit goods actually cross the borders of a
member country and are not smuggled for sale within, all products in transit are escorted
in convoys especially for a country like Burundi. In all other EAC members the exporter
of the good is issued a transit bond by a clearing agent who monitors that the goods reach
the designated point of exit, where the bond is cancelled. In most countries more than the
required transit days are authorized in the bond, e.g. 3 days in Rwanda compared to the
needed one day. In Burundi, the traders and transporters are concerned about the
nontransparent escort fees. In general, the transporters are concerned about the time lost
in the assembly of convoys by police escorts, which may not be daily and can range
between two and three hours at each stop. Truckers report the journey “taking two days
from Mombasa to Malaba” (a distance of 950 km) due to such convoys (Low, Mchumo,
and Muyambo, 2009).

12
2.2.5 Verification of Transit Cargo
A lot of transit cargo is scanned and verified by the revenues authorities, like the Kenya
Revenue Authority and the Rwanda Revenue Authority, though it is not for use in the
member country concerned. The goods destined for the member country in many cases
are subject to 100 percent physical inspection, particularly where they involve refund or
drawback claims, regardless of the compliance record of the exporter (Ihiga, 2007).
2.2.6 Working Hours at the Border Posts
There is lack of harmonization in terms of the agreed working hours at the intra-EAC
borders (Ihiga, 2007). At present, no border post in EAC is open for 24 hours a day-7
days a week. In addition, Burundi continues to maintain a ban on vehicular traffic on its
roads during the 6:00 PM to 6:00 AM period for safety reasons. Gates are opened or/and
closed at different times on each side of the border, causing unnecessary queues and
commotion. For example, by late 2011, Malaba gates at the Ugandan border post used to
open as from 8:00 AM to 10:00 PM, while gates at the Kenyan border post used to open
8:00 AM to 6:00 PM. For Rwanda, the Rwanda Revenue Authority started 24-hour
operations as from September 1, 2008 to ease the flow of goods and services in the EAC
and neighboring Democratic Republic of Congo. On the contrary, Uganda, a crucial
partner in the 24-hour operation, has not yet been ready to follow suit due to work force
and budget constraints (World Bank 2008).
2.2.7 Delays at Weighbridges
The mandatory weighbridges for goods all along the transit route, and not only at the
border, impede trade through addition to transit time and cost of transporter upkeep.
These are particularly significant on the Kenyan and Tanzanian sides of the transport
corridors. Tanzania requires every vehicle carrying goods, small or large, to be weighed,
including passenger buses. Along the Central Corridor, between Rusumo and Dar es
Salam, there are five compulsory weighbridges: at Nyahahura, Mwenda Kulima, Mkundi,
Mikese, and Kibaha. Along the Northern corridor, there are 7 weighbridges on the
Kenyan route at Mombasa, Malaba, Kilindini, Maliyakani, Athi River, Webuye and
Amagoro. Trucks heading to Kigali have to be weighed another four times in Uganda, at
Busitema, Masaka, Mbarara, and Ntungamo. Neither the acceptable weights per axle nor
the number of axels are not yet harmonized in the region, causing further conflicts (more
on this later). Kenya in 2008 proposed a system that it intended to move towards, is that

13
transit trucks were to be weighed only once and needed to carry the issued certificate, as
preferred by transporters. This was a directive which has not yet been fully achieved due
to delays in the Ministry of Roads and Public Works (Ihiga, 2007).
2.2.8 Multiple Police Road Blocks and Mobile Control
Unrelated with weighing or clearing the cargo, police roadblocks are constantly cited by
traders and transporters as location for rent seeking and transit delays (EABC 2004). The
roadway along the Northern Corridor is particularly noted for such practices, especially
on the Kenyan part. “Police check points have become ‘police cash-points’ as they no
longer serve their intended purpose of security but are being used as medium of soliciting
money from transit trailer trucks, especially those with foreign registration numbers,” said
one irritated transporter. For example, there are about 10 police/local government
roadblocks from Mombasa to the Uganda border (down from about 27 about four to ten
years ago). In addition, there are mobile checkpoints, more frequent in Kenya, run by the
revenue authorities of the respective countries, such as the Revenue Protection
Department in Rwanda. It is estimated that 12 percent of checks of commercial vehicles
take one to two hours. In some cases, these roadblocks cause delays even for returning
vehicles not carrying any goods. Along the Central Corridor, 26 checkpoints were
reported between Rusumo and Dar es Salam (distance 1,480kms), and 5 in Rwanda
between Rusumo and Kigali (168 kms distance). What bothers transporters is that there is
a general lack of coordination among the police in carrying out their duties, such that a
truck is subject to similar checks at all traffic stops. This creates room for the police to
openly press for petty bribes—for example, in Tanzania, commonly referred to as
“kahawa,” meaning a cup of coffee (World Bank 2008).
2.2.9 Prohibition on Transportation of Locally Produced Goods
This is applied in most countries. For example, transit goods license issued for a truck by
the KRA/RRA allows the truck only to route goods through Kenya/Rwanda, but not to
undertake any local goods transportation within the country. It prohibits transportation of
locally produced goods from Kenya/Rwanda as exports and transportation of goods from
another EAC member into Kenya/Rwanda as imports. Such restrictions, on what could be
normal occurrence for returning trucks, escalate transport costs, as empty trucks have to
be sent back (EABC 2009).

14
2.2.10 EAC Transit Licenses for Goods
These are being issued as part of the new EAC transit regulations, with multiple fees:
USD 1,500 for a company transit license; USD600 for a transit goods license, and KSh 10
million for a security bond on goods transited across Kenya. Information shared with
transporters is limited. Moreover, different countries seem to continue to charge their own
rates at present. For example, it costs USh 500,000 (approx. KSh 20,000) for a transit
license in Uganda and KSh 42,000 for one in Kenya (EABC 2009).
2.2.11 Truck Entrance Fees and Grace Period
Contrary to the EAC Protocol, Kenya, Tanzania, and Rwanda charge fees on each truck
entering their territory (often referred to as “road toll”). Kenya charges USD60 for a truck
going up to Nairobi from Mombasa and USD90 beyond Nairobi; Rwanda charges USD76
per truck; while Tanzania charges USD50 per truck per week. In addition, local levies
may apply. For example, the municipality of Mombasa has introduced a new levy on
Uganda-bound trucks. The EAC transit regulations allow a grace period of seven days
without payment of fees for vehicles entering the territory of a member state, but
compliance varies across member states and across time periods.
2.2.12 Business Registration
Treatment of businesses originating in the EAC as “foreign” and different national
procedures make cross-border registration of business branches difficult. Payment for
registration of business names and the multiplicity of licenses for production,
distribution/sale of goods among the five EAC countries is cumbersome (EABC 2009). .
Moreover, exemptions on certain WTO obligations apply to four EAC members that are
categorized as less developed countries. When it comes to cross border trade in
manufactured products, it is not clear how this should impact their trade with Kenya in
specific areas, such as pharmaceutical and medicinal product (ADF 2012).
2.2.13 Use of Immigration and Visa Procedures
These are cumbersome, duplicative, and in many instances used contrary to the EAC
Protocol. EAC-wide, visa fees was removed in June 2007 and replaced by temporary
work permits for visitors seeking temporary work assignments. These do not apply to
traders, transporters, and visitors who are not seeking temporary employment. At the
border, officials at Namanga, Tanzania not only charge each truck USDD50, but also

15
impose a charge of USD100 as work permit for accompanying businesspersons who
would like to exhibit their products in Tanzania (EABC, 2008).
2.2.14 Cost of Translation
The official language of EAC business is English. However, the government and business
processes of Burundi remain francophone, with very limited programs to improve
English- and Kiswahili-speaking capacities of the traders and transporters. Hence, the
language of communication is yet another non-tarrif barrier recognized by Burundian
traders and trucks that travel in Uganda, Tanzania, and Kenya (Mutambara 2009). Traders
face specific charges. For instance, those who export goods to francophone Burundi from
Kenya pay a USD300 fee to translate the required regulations to English at Jomo
Kenyatta International Airport (JKIA) in Nairobi. Most traders prefer that regulations
should be translated in all official national languages spoken in EAC by the issuing
country (Ihiga, 2007).
2.2.15 Information Constraints
Not only are the rules and regulations not mutually recognized or harmonized, but the
dissemination of information on them is extremely poor across member states and within
them. Traders are not aware of some of the decisions made at the EAC Council, such as
the new transit regulations. At the borders, the customs agents often do not have the latest
directives and/or forms from their revenue authorities, and truck drivers may not know
the regulations specific to their cargo. Application of national legislations often appears to
be arbitrary and protectionist, based on outdated/cumbersome import authorization
systems (Okumu, 2010).
In all EAC member states, the traders and officials of traders’ associations criticize the
national governments for monopolizing information (deliberately or because of lack of
dissemination capacity) on decisions relevant to goods trade. Information gaps persist
between the policy makers, the implementing agencies like national bureaus of standards,
and the producers and traders (Kirk 2010). For example, the majority of the EAC traders
are not even aware of the NTM monitoring mechanism through which they can report
constraining measures. There is widespread concern that the mechanisms and the
language used to explain issues concerning goods trade in the EAC are not simplified
enough to be useful to small indigenous traders. This is particularly problematic for

16
Kenyan exporters into the Burundian markets, where the government systems are focused
on early stages of post conflict recovery—but are prevalent EAC-wide.
2.2.16 Insecurity/ Highway Crimes/Loss of Goods at the Container Freight Stations
Heightened security concerns along the trade routes and highway thefts add to concerns
for traders and transporters. Along the Ugandan segment of the Northern Corridor,
transporters who make night runs complain about acts of banditry (EABC, 2005). For the
case of Kenya, in 2007, 32 containers were lost to thieves and a number of people lost
their lives on the way to Kampala. The events that unfolded after the December 2007
election in Kenya led to one of the worst spurts of highway crimes witnessed in Kenya. In
Burundian territory, night travel is banned because of the prevailing lack of security.
Operation of the CFSs at various locations is affected by pilferage of cargo. Exporters end
up losing their goods and are often unable to lodge claims because they do not know
whose responsibility it is to pay for the claims (Ayoki, 2007).
2.3 Technical Barriers to Trade
Technical Barriers to Trade (TBT) are agreement deals with all technical requirements,
voluntary standards and conformity assessment procedures, except when the measures are
covered by the SPS Agreement, and ensure that they do not create unnecessary obstacles
to trade (Kee, Looi, Nicita and Olarreaga 2006). The technical barriers are divided into
two categories; institutional barriers and regulatory barriers to Kenya.
2.3.1 Institutional Barriers to Kenya’s Trade in the EAC
Various Kenyan ministries, departments and parastatals regulate and support the
country’s trade, including the Ministries of Trade, Finance, Justice and Constitutional
Affairs, Public Health and Immigration. Specific agencies that are also involved include
the Kenya Plant Health Inspectorate Service (KEPHIS), Kenya Revenue Authority
(KRA), Kenya Bureau of Standards (KEBS), Kenya Ports Authority (KPA) and Kenya
Roads Board (KRB). In performing their functions, these institutions and agencies
sometimes hinder the free and smooth flow of goods and services in the EAC. These
hindrances occur because of the setting of product standards, technical regulations and
conformity assessment procedures that constitute technical barriers to trade (Kenya
Revenue Authority, 2004).

17
Of the agencies mentioned, the KRA has the most significant impact on intraregional
trade. It is responsible for the enforcement and management of the customs laws and the
administration of common external tariffs. Additionally, the clearance of goods by the
KRA takes time because of the lack of harmonized import/ export documentation and
procedures. Currently, the digital data exchange system used by revenue authorities is
operational in Rwanda, Uganda and Kenya, but not in Burundi and Tanzania. Only
Kenyan customs operates for 24 hours, meaning that even if goods are cleared in Kenya,
they are delayed for Burundi and Tanzania by other member states (Kenya Revenue
Authority, 2004).
Other important agencies that affect the EAC’s trade in Kenya include KEPHIS, which
inspects plants and issues a plant import permit; KEBS, which tests and grades the quality
of goods; KPA, which manages port charges; and the Kenya police, which provide
security and inspect cargo by verifying legal documents. Others agencies include the
Immigration Department, which issues work permits; KRB, which deals with the
application of axle load specifications through the truck scales; and the Public Health
Department, which inspects goods to ensure that they are fit for consumption. All these
agencies operate independently of each other, without much coordination (thereby
occasioning delays). In addition, most of them do not operate 24 hours a day (Mold,
2005).
The Ministry of the EAC coordinates, facilitates and oversees affairs related to the EAC.
Together with similar ministries from partner states, it makes various policies for
implementation by relevant agencies (Pearson, 2006). However, there is a disconnect
between the officers at the border points and those at the ministry’s headquarters;
decisions and policies made by the latter are often not communicated to the former
(Michalopoulos, 2006).
2.3.2 Regulatory Barriers to Trade
The reduction of tariff barriers following the implementation of the EAC’s customs union
in 2005 resulted in an increase in the use of nontariff barriers as a tool for regulating
trade.

18
2.3.2.1 Customs Clearance
Before the importing or exporting of commodities within the EAC, a trader must obtain
an import declaration form (IDF) issued by an appointed government agency in the
partner states. The issuance of IDFs involves numerous agencies (the government printer,
the national bank, KEPHIS, KEBS, KPA and KRA), which conduct the procedures for
the inspection, verification of dutiable value and certification of compliance. The result of
having all these agencies partake in the issuance of IDFs is often duplication of effort and
wasted business time. Additionally, in some cases, inspection bodies have not established
inspection posts at major entryways, thus forcing traders to travel long distances for
customs clearance (Little, 2007).
2.3.2.2 Standards and Certification
EAC member countries apply numerous certification and conformity assessments to
ensure technical quality standards in intra-EAC trade. However, there are differences in
product standards and agencies that are accredited to undertake the standardization
procedures. Some agencies accredited to conduct standardization in one country are not
recognized by officers in another country—a problem that adds to the cost of conducting
certification and wastes time (World Bank, 2007).
2.3.2.3 Rules of Origin
Currently, EAC member countries do not have their own specific rules of origin; instead,
they apply the ones adopted by the Common Market for Eastern and Southern Africa.
These rules of origin stipulate that a good must wholly be produced or contain imported
content of no more than 40 percent of the cost, insurance and freight value of the
materials used in production. The procedure for obtaining the certificate of origin is
cumbersome and lengthy, which itself is costly for the business community (World Bank,
2009).
2.3.2.4 Licenses and Permits
According to World Bank (2007c), licenses required within the EAC include a business
license, an import/export license, a road transportation license and a municipal council
license. The procedures for obtaining these various licenses vary across countries. In
addition, there is a lack of preferential treatment to EAC-originating businesses. This
makes cross-border registration of businesses a difficult, cumbersome and expensive

19
process. In most EAC countries, manual processes are used in business names searches,
registration and the payment of relevant charges. Moreover, multiple licenses are required
for the production, distribution and sale of goods, resulting in duplication and prohibitive
costs of doing business in the region.
2.3.2.5 Immigration Procedures
For citizens of EAC member countries, visas are not required for travel within the
community. However, movement of people across the region is restricted to passport
holders or those with temporary travel documents, and a majority of EAC residents do not
hold such documentation (Little, 2007). In addition, the requirement for the yellow fever
vaccination by Tanzania has been identified as a major bottleneck to trade. Although this
is justified on the basis of health concerns, the procedures for its application and the fee
of $50 for those who apply at the entry points pose a challenge. Therefore, the cost of
movement across boundaries has a significant impact on cross-border trade (World Trade
Organization, 2006b).
2.3.2.6 Police Checks and Roadblocks
Within the EAC, there are many roadblocks and police checkpoints along the major roads
that disrupt the efficient movement of goods. For every 100 kilometers, traders encounter
about two, five and seven roadblocks in Tanzania, Uganda and Kenya, respectively
(Karugia et al. 2009). According to Pedersen, (2006) these stops are costly in terms of
time and money. Making matters worse, police officers often solicit bribes at these
locations from transporters and traders, especially those whose vehicles have foreign
registrations.
2.3.2.7 Truck Scales and Inspections
The mandatory weighing of goods along the transit route adds time and cost of upkeep for
transporters. These costs are particularly significant on the Kenyan and Tanzanian sides
of the transportation corridors (Raman, 2006). Acceptable weights per axle and the
number of axles per metric ton have not yet been harmonized among the EAC member
states. Numerous truck scales along the main road transportation routes like the Northern
Corridor makes it difficult to move goods to destinations on time (Rizet and Hine, 2004).
In addition, because the EAC members have not yet harmonized gross vehicle mass, 54

20
metric tons are allowed in Kenya, 45 metric tons in Uganda, 56 metric tons in Tanzania
and 58 metric tons in both Rwanda and Burundi (Kimenyi, 2008).
2.3.2.8 Language Barriers
English is the agreed-upon language across the EAC for the purposes of administration,
public trade facilitation and private transactions. However, for francophone Burundi,
customs officials still insist on documents being translated into French. To fulfill this
requirement, traders must incur extra costs and time. Translation can involve traveling to
Bujumbura to have the documents certified before transportation commences (Little,
2007).
2.4 Mitigating Factors on Non-Tariffs and Technical Barriers to Trade within EAC
2.4.1 Experiences of other Trade Blocks With Elimination/Reduction of Non-Tariff
and Technical Barriers.
The regional economic communities (RECs) in Africa do not have an impressive record
of dealing with contentious non-tariff barriers (NTB/Ms). However, the EAC has quickly
achieved a lot that remains desirable for RECs in Sub-Saharan Africa. This study explores
beyond the continent for examples, to learn from successes of RECs and emulate them, as
appropriate, and to avoid failures. Lessons are borrowed from the European Union (EU)
and Association of Southeast Asian Nations (ASEAN), since they contain a number of
lessons that can help EAC plan well and minimize policy errors (Fliess and Lejarraga,
2005).
The Association of Southeast Asian Nations (ASEAN) represents a major example of
regional integration and commitment to the removal of Non tariff barriers. The ASEAN
strategy involved establishing a modality for eliminating NTBs including harmonizing
product standards and developing mutual recognition of standards across member
countries. The general features of the process for eliminating NTBs consists of
verification of information on NTBs, prioritization of products, developing specific work
programme and obtaining a mandate from the ASEAN Economic Ministers to implement
a work programme (ASEAN Secretariat, 2010). One major characteristic that
distinguishes the ASEAN experience from that of the EU in dealing with NTBs is its
sector-based approach. In this strategy, ASEAN has focused its economic integration and

21
elimination of trade barriers on a few sectors (chosen among sectors with the highest
potential for intra-regional trade and integration).
In the European Union (EU), elimination of NTBs was the task of the common market
programme. In 1985, the Community’s White Paper identified NTBs and proposed 282
measures to be eliminated with a detailed timetable for completion by the end of 1992
(Sarfati 1998). Most of the proposals were adopted and became part of national laws of
the various member countries. The programme for elimination of the NTBs abolished a
series of technical, physical and fiscal barriers to regional trade through institution of
single standards and regulation, the simplification of the fiscal structure and border
related controls, and the institution of new rules for public procurement (Sarfati, 1998).
While the EU has significantly reduced NTBs, complete elimination has not been
achieved. Ongoing activities for elimination of NTBs include a review of national NTBs
reports, national procedures for inter-ministry co-operation on NTBs, exchange of
information and views on a range of active NTB elimination programmes/projects and
establishing a communication network between NTB focal points. Besides, there are
ongoing negotiations and reforms as well measures to strengthen the process in various
ways such as seeking support of political authorities to support for continued work on
NTBs within the established, directed effort to continue and intensify the work to identify
and eliminate NTBs in the region, establishing appropriate procedures for identifying and
eliminating NTBs, and procedures to have high level commitment and support and
visibility ASEAN (2010). The member states commitment to provide the framework for
continued work on NTBs, meet a couple of times per year, otherwise communicating by
telephone and e-mail, identify NTBs on a continuous basis, prepare the respective annual
reports on NTBs, consider the formation in each country of a national inter-
ministry/agency communication network chaired by a high-level official from EU
Secretariat (World Bank 2008).
Furthermore, the programme includes investment in One-Stop-Centers and electronic
single window systems at border stations, review of port charges to international levels,
political goodwill to facilitate cross-border movement of people while waiting for
finalization of relevant protocol, mutually recognize inspection procedures, and
inspection reports and certificates, clear guidelines for stopping commercial vehicles, a

22
daily record of vehicles stopped, reasons and measures taken, joint verification of goods
at border posts, infrastructure improvement, cancellation of transit bonds, investment in
parking sheds and parking yards, lifting restrictions of truck haulage, expand working
hours (World Bank 2008).
2.4.2 Way Forward For Kenyan in EAC
A series of EAC trade studies (Ihiga 2007; Mmasi and Ihiga 2007) reported some major
NTBs that included customs and administrative entry procedures barriers; sanitary and
Phystosanitary measures; technical barriers to trade, standards, inspection time spent, un-
harmonized procedures for issuance of certification and other distribution related
obstacles. Some of these regulations or NTBs, while justified on the basis of health,
safety and security, among others, have implications on production, consumption,
economic efficiency and trade flows (Okumu and Okuk, 2011). Arising from
identification of NTBs, EAC time-bound programmes for their elimination have been
prepared (EAC Secretariat 2009). These include abolishing charges, corruption,
discriminatory charges, landing fees, entry requirements; application of non-
discriminatory excise duty regime, EAC Rules of Origin, WTO valuation rules;
adherence to EAC Rules of Origin Criteria of 30 percent local value added;
modernization including computerization of procedures to ensure faster clearance,
systems interfacing, and weigh-in-motion systems.
2.4.2.1 Policy Implications
The NTBs have managed to lead to the famous informal trade within the region. Informal
trade is seen to have occupied a greater share of the regional trade. NTBs are escalating
partly due to lags in policy and legislative implementation. Therefore, going forward, one
of the key steps to take is to design effective mechanisms for identifying and verifying
information about NTBs, and prioritizing and ensuring their elimination. This will require
giving the EAC Secretariat the mandate to compel individual countries to eliminate any
identified NTB and to ensure that no new ones are created (Abegaz, 2008). In addition, it
will require transparency in information gathering and sharing, as well as commitment
and willingness to eliminate the NTBs. Second, policy and legislative decisions made by,
for example, Council of Ministers should be communicated in time for effective
implementation. In the medium term, standards should be harmonized and enforcement of
compliance be transferred to one regional body, such as EAC Bureau of Standards. In the

23
short run, the EAC countries should develop a mutual recognition of standards across
member countries (Okumu and Okuk, 2011). Hangi, (2010) recomends the need for EAC
to find ways on how to harmonize the prevailing domestic tax systems, laws and
procedures so as to reduce distortions and smuggling as well as introducing some level of
predictability in business transactions.
2.4.2.2 Involve the General Public in the Process of EAC Integration
According to a report by Okumu and Okuk, (2011) the public, (citizens of the EAC
countries) is not fully aware and involved in the process of EAC integration. Most people
involved in business within the region don’t have enough education on what needs to be
done so as to improve their businesses. Education on the NTBs, how to handle
cross‐ border customs and the like, is not given and that has a great impact on the entire
regional trade (Hangi, 2010). The EAC states with full involvement of the private sector
associations and civil society organizations should intensify public awareness campaigns
about customs union and its economic opportunities. Every effort should be made to
reach out to the entire population of the EAC countries.
2.4.2.3 Trade Impact
A research by World Bank, (2008) recommends for need to make choice on the basis of
the NTB’s trade restrictiveness, including the following elements: number of private
sector complaints, value of export/import affected, and difference between domestic and
world prices for consumer. The is need to prioritize these constraints based on the major
stake holders who are affected, for the Kenyan case, majority of Kenyan exporters who
fall in the private sector, complaints in the EAC are the strongest about poor
infrastructure. This is followed by corruption/fraudulent behavior. They also complain
about the limited human skills and technical capacity of the trade/transit facilitators and
national government officials in the EAC. Further the World Bank (2008) report strongly
suggest the need to assess the total value of export/import affected by a particular NTB,
this could be done by listing the top goods by value traded in the EAC. For most EAC
members, these goods are also the most important ones in the value share of overall trade.
Hence, prioritizing the NTBs that apply specifically to these goods will yield added
benefits from expansion of EAC’s global trade. Further investigation may be needed, to
determine the extent to which the NTMs increase the consumer prices of these goods.

24
2.4.2.4 Develop Strategy for Reducing Differences and Capacity Constraints
One way forward for developing a strategy for reducing/removing NTBs given national
differences and capacity constraints is to adopt a product/sector view in a phased manner.
In ASEAN, the choice of these sectors was made on the basis of comparative advantage
in natural resource endowments, labor skills, cost competitiveness, and value-added
contribution to the REC economy or share of intra-regional trade. For EAC, the intra-
EAC trade is quite product-specific. However, the current NTBs and technical barriers on
formal goods trade revealed by private sector firms and public sector institutions, are
largely not product-specific. A report by Beghin, (2006) reveals the large costs faced by
the private sector. In this way, it would be possible to deal with the problem of
formality/informality of trade and big differences between written rules and actual border
practice.
In a few goods, like milk, beef, poultry (including day-old chicks), the EAC may want to
develop specific region-wide technical and/or SPS standards after detailed investigations.
In choosing the specific product it would be important to consider the regulatory
objective and /or intra-EAC trade impact of the NTM. Here the guidance from the
ongoing process of deliberations and decisions in the ASEAN countries will be useful.
This could be based on harmonization with performance requirements, involving a single
set of fully harmonized and detailed provisions. This approach is used for products that
could put consumers’ safety at risk and for which performance-oriented legislation is felt
needed. Any capacity building initiatives in the overall area of the technical and/or SPS
standards for goods should be assessed vis-à-vis clear articulated demand from end-users
in the public/private sector, rather than from the national bureaus of standards (Hangi,
2010).
2.4.2.5 Invest in Infrastructure
Where government monopolies and/or fiscal constraints have given rise to severe
infrastructure constraints, the related NTBs will need prior large-scale investments and
long-term interventions in expansion/rehabilitation of physical infrastructure in a
coordinated manner across the EAC, especially along the two corridors, North and South
corridors. Here the prioritization could consider the potential for combining the economic
strengths of EAC members for regional advantage; facilitating intra-EAC trade and
investments; attracting and retaining manufacturing activities within EAC; promoting

25
outsourcing in EAC; and developing EAC products and services (Okumu & Nyankori,
2010). Infrastructure bottleneck is critical in the region. A World Bank (2008) suggests
three key points emerging in this area. These are; the EAC executive secretariat ought to
prepare and execute regional infrastructure improvement plan(s), especially the roads
network, with a view to ease the costs imposed on landlocked countries. There is need for
the provision of wagon ferry vessels on Lake Victoria and Lake Tanganyika, through
public or private investments, with adequate safety regulations for their operation.
Important also there is need to institute an efficient railway system through the required
investment by the national government in rails and by the private operators in wagons to
improve the competitiveness and safety of the transportation of bulk products in the
region. The need for developing dual rail tracks across the region is also imperative.
There is need to regulate the railway service provider to prevent inefficiency and abuse of
market power in niches that railways could dominate. Improvement of infrastructure is
fundamental to lowering costs of business and facilitating efficiency in production,
transportation and delivery of goods and services (Hangi, 2010).
The decisions and action related to technical standards for goods and the associated SPS
considerations can be visualized in this category, since it is expected to take a prolonged
period to intervention to adopt a general framework, adopt it and install the appropriate
infrastructure and human capacity to implement the decisions (Okumu & Nyankori,
2010).
2.4.2.6 Apply the Principle of Asymmetry and Promote the use of English
As EAC explores a program to achieve the common market—including the removal of
legal barriers to the free movement of goods, services, capital, and labor— Stephen,
Karingi, Fekadu and Belay (2009), recommends putting in place a policy to mitigate the
effects of the completion of the internal market on relatively disadvantaged member states
(those that are landlocked or are the least economically developed). This will reduce
development discrepancies between the member states. Removal of physical barriers for
goods crossing the intra-EAC borders is merely the first step to facilitate trade through
reduced delivery times and lower associated costs.
When it comes to language of communication, the agreed language across EAC for
overall administration, public trade facilitation, and private transactions is English.

26
However, for members that were originally francophone, especially Burundi, Mugisa,
Onyango and Mugoya (2009) observe that concrete steps are recommended to promote
English in government administration, and in doing so, facilitate the private sector goods
trade of these members.
2.4.2.7 Monitoring for new NTBs and Technical Barriers (NTB/TB)
With respect to the monitoring for new NTBs and Technical barriers that may be imposed
by member states, the EAC could learn from the EU’s adoption of preventive measures
which oblige member states tonotify all draft regulations and standards related to
technical specifications to be introduced on national territories. In this way, the
Commission is able to monitor and prevent the raise of new national barriers to intra-EU
trade (World Bank 2008).
The EU’s internal market scoreboard may prove to be a useful instrument for the EAC
Secretariat to emulate. The European Commission maintains this scoreboard on member
adherence to REC-wide rules including those on NTB/TB on trade, which can be used to
name and shame members into compliance. For the EAC, such a scoreboard could report
the status of the NTB/TB action plans and the number of infringement proceedings due to
new NTB/TB s initiated against member states. These proceedings could be initiated as a
consequence of continuing or new application of a NTB/TB by a member state. In this
case, the member state is encouraged to quickly remedy the situation, and if it fails to do
so it is referred to the EAC court, which can impose a sanction. To supervise the proper
functioning of the internal market for goods in the EAC, the Secretariat would need to
develop adequate capacity for classifying NTB/TB reported and monitoring, as would the
member states in identifying and notifying the observed NTB/TB. Later this could be
supplemented by capacity for enforcement and redress action (IFPRI, 2008). Other EAC
institutions could be needed to contribute to this important function (EAC-EABC 2006).
2.5 Chapter Summary
The study, in this chapter, has addressed the main objectives of the research as
appropriate. The Non-Tariff Barriers, Technical Barriers to Trade and the mitigating
factors have been addressed in sections 2.2, 2.3 and 2.4 respectively. The next chapter is
about the research methodology the study adopted to answer the research questions
mentioned in chapter one.

27
CHAPTER THREE
3.0 RESEARCH DESIGN AND METHODOLOGY
3.1 Introduction
This chapter describes the research methodology and procedures that were used to carry
out the study. In this chapter, the population and sampling design used were also
described. Under sampling design the: sampling frame, sampling technique, sample size
and research procedures were presented. Described also in the chapter are data collection
and analysis techniques employed.
3.2 Research Design
A research design is the plan and structure of investigation so conceived as to obtain
answers to research questions (Cooper & Schindler, 2000). It expresses both the structure
of the research problem and the plan of investigation used to obtain empirical evidence on
relations of the problem. Maylor and Blackmon (2005), states that a research design is a
plan or structured framework of how one intends to solve the research problem and to
expand knowledge and understanding. This study employed exploratory research designs.
Exploratory study is used when a researcher lacks a clear idea of the problems they are
likely to meet during the study (Cooper & Schindler, 2008). This form of research design
provides a clear understanding of a problem where small amount of information exist
(Saunders, Lewis, & Thornhill, 2009). According to Adams and Schvaneveldt (1991)
exploratory research is likened to the activities of the traveller or explorer. The purpose of
studying a situation or problem is in order to establish the relationship between variables
(Saunders, Lewis, & Thornhill, 2003).
The study aimed at establishing both the technical and non-tariff trade barriers that faced
Kenyan exporters within the East African Community. This study sought to elaborate on
the various challenges that Kenyan exporters faced in their quest of selling their goods
and services within EAC markets. Further, it explored the necessary measures that ought
to be taken to address these challenges. Through an explorative research design, this
research sought to highlight various technical and non-tariff trade barriers that hindered
trade within EAC with particular emphasis, on barriers that hindered Kenyan exporters in
the EAC.

28
3.3 Population and Sampling Design
3.3.1 Population
Population is total collection of elements upon which inferences can be made (Schindler,
2008). The larger set of observation is the population while the smaller set of this big
population is called the sample. To obtain the population in this study the, 9,585 exporters
in Kenya, specifically from Nairobi were considered.
Table 3.1: Population Distribution
DISTRIBUTION
Category No. Percentage
Automobile 1600 17
Manufacturing 3200 33
Agriculture 4785 50
Total 9585 100
Source: Export Promotion Council (2013)
3.3.2 Sampling Design
A sample is a group from the population that is the representative of the population
(Coopers & Schindler, 2008). Sampling design is a technique used in selecting a
proportionate representation from the total sample size, which is the population under
study. Sampling enables: lower cost, accuracy of results, increased speed of data
collection, and availability of population elements. The study used a random sampling
technique to get a representative sample size.
3.3.2.1 Sampling Frame
Sampling frame is a list of elements from which the sample is actually drawn and it is
closely related to the population under study (Cooper & Schindler, 2008). They further
explain that this list could of geographical areas, institutions, individuals, or other units.
In this study, a list of Kenyan Exporters (from Nairobi) provided by the Kenya Export
Promotion Council was adopted.
3.3.2.2 Sampling Technique
To determine the study sample, the researcher used statistics and employed random
stratified sampling techniques. Stratified random sampling is a method of sampling that

29
involves the division of a population into smaller groups known as strata (Saunders,
Lewis, & Thornhill, 2003). Stratified random sampling, the strata are formed based on
members’ shared attributes or characteristics (Cooper & Schindler, 2008). A random
sample from each stratum is taken in a number proportional to the stratum's size when
compared to the population. These subsets of the strata are then pooled to form a random
sample (Saunders, Lewis, & Thornhill, 2003). Stratified sampling was used because it
allowed the researcher to divide the sample into appropriate strata that were mutually
exclusive to the afore-mentioned sample frame. The three main advantages of sampling
are that the cost is lower, data collection is faster, and since the data set is smaller, it is
possible to ensure homogeneity and to improve the accuracy and quality of the data
(Cooper & Schindler, 2008).
3.3.2.3 Sample Size
A sample size as the set of elements from which data is collected (Schindler & Cooper
(2003). A good sample size should provide information that is detailed and
comprehensive (Maylor & Blackmon, 2005). Researchers rarely survey the entire
population for two reasons: the cost is too high, and the population is dynamic in that the
individuals making up the population may change over time (Mugenda & Mugenda,
2003).
The Yamane‘s formula of 2001 (Israel (2002) was used to determine the sample size from
population within each stratum. It provided a 95 percent level of confidence and a
maximum variability (p) =.09. A standard error of 9% was considered in the sampling
calculation. On a population of 9585, an approximate figure from the export promotion
council gave a sample of 121 respondents as shown.
n = N
1+N (e) 2
Where n was the sample size, N was the population size and e was the level of precision:
n = 9585
1+ 9585(0.09x0.09)
= 121 Respondents

30
Table 3.2 Sample Size
DISTRIBUTION
Category No. Percentage
Automobile 21 17
Manufacturing 40 33%
Agriculture 60 50
Total 121 100
Source: EPC (2013)
3.4 Data Collection Methods
Primary as data observed or collected from firsthand experience (Cooper & Schindler,
2008). Data was collected from primary sources using questionnaires. The questionnaire
was designed to capture the essential information needed for analysis. It captured
respondents’ general information and specific information arising from the various
objectives of the study.
The questionnaire consisted of structured questions that were both open and closed ended.
The researcher assisted the respondents, where necessary to understand the significance
of the study and ensured that the response was compatible with the objective of the study.
A letter of introduction was attached to the questionnaires explaining to the respondents
the reason for the study and assuring them of their confidentiality.
3.5 Research Procedures
A pilot study was conducted randomly on six respondents from the three major business
categories indicated in the sample size frame so as to ascertain the suitability of the tool
(questionnaire) before administering it in the study. Pre-testing enabled the researcher to
fine tune the questionnaire and enhance the objectivity and effectiveness.
3.6 Data Analysis Methods
Data analysis is a research technique for the objective, systematic and qualitative
description of the manifest content of a communication (Cooper & Schindler, 2008). In
order for research quality in this study, quantitative methods of data analysis were used.
Descriptive statistics involves a process of transforming a mass of raw data into tables,
charts, with frequency distribution and percentages, which are a vital part of making

31
sense of the data (Denscombe, 2006d). The research data was analyzed using Statistical
Package for Social Sciences (SPSS) program and presented using tables to give a clear
picture of the research findings at a glance. Key among the quantitative tools that was
employed were descriptive statistics, which included measures of central tendencies, such
as means, standard deviation, frequencies, and percentages. These tools of analysis used
for instance to determine views of commonality and deviations from commonality.
Correlation was another useful statistic that described the degree of relationship between
variables used and was employed to see if such relationships existed among variables
being studied.
3.7 Chapter Summary
Chapter three has described the methodology and procedures that were used to carry out
the study. It started with a brief introduction highlighting the general methodology and
structure of the chapter. The chapter also highlighted the method that was used to conduct
the research and its use was justified. The population was defined and the sampling
technique, technique, and sample size described. Finally, the data collection techniques
and research procedures to be used have been discussed. The next chapter discusses the
study results and findings.

32
CHAPTER FOUR
4.0 RESULTS AND FINDINGS
4.1 Introduction
This chapter presents the study findings received after analyzing the collected data using
SPSS. The section presents the data in the form of tables and graphs, with brief
explanations on the figures presented within the graphs and tables.
4.2 Response Rate and General Information
4.2.1 Response Rate
The researcher distributed 121 questionnaires to the respondents. After the collected
questionnaires were cleaned and refined, there were 96 questionnaires that were
completely filled. This gave the study a response rate of 79.3% which was above the
required threshold.
4.2.2 General Information
In this sub-section, background information of the businesses is provided. This is in terms
of, nature of business, length in EAC export, and trade barriers encountered.
4.2.2.1 Nature of Business
The study inquired about the nature of their business owned by the respondents and the
response in Figure 4.1 shows that: 34.9% were wholesalers/ suppliers, 25.6% were
manufacturers, 20.9% were automobile dealers, and 18.6% were service providers.
Figure 4.1 Nature of Business
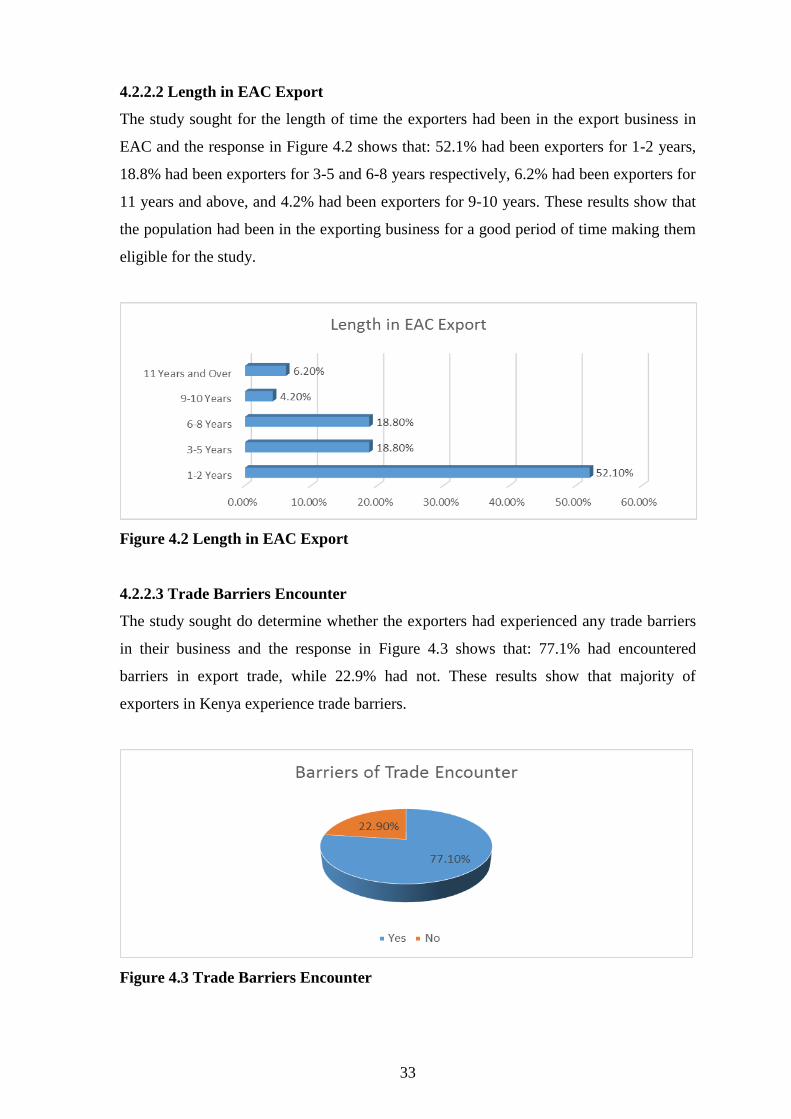
33
4.2.2.2 Length in EAC Export
The study sought for the length of time the exporters had been in the export business in
EAC and the response in Figure 4.2 shows that: 52.1% had been exporters for 1-2 years,
18.8% had been exporters for 3-5 and 6-8 years respectively, 6.2% had been exporters for
11 years and above, and 4.2% had been exporters for 9-10 years. These results show that
the population had been in the exporting business for a good period of time making them
eligible for the study.
Figure 4.2 Length in EAC Export
4.2.2.3 Trade Barriers Encounter
The study sought do determine whether the exporters had experienced any trade barriers
in their business and the response in Figure 4.3 shows that: 77.1% had encountered
barriers in export trade, while 22.9% had not. These results show that majority of
exporters in Kenya experience trade barriers.
Figure 4.3 Trade Barriers Encounter

34
4.3 Non-Tariff Barriers on Trade (NTBs)
This sub-section provides the results of NTBs rating, correlation and regression analysis
with regards to the response received. These results have been presented in the form of
tables.
4.3.1 Rating of Non-Tariff Barriers in Trade
The study sought to examine the rating of non-tariff barriers in trade by exporters using
the scale Strongly Agree, Agree, Neutral, Disagree, and Strongly Disagree. The response
received was as indicated in Table 4.1.
Table 4.1 Rating of Non-Tariff Barriers in Trade
Str
on
gly
Agre
e
Agre
e
Neu
tral
Dis
agre
e
Str
on
gly
Dis
agre
e
Mea
n
Std
Dev
Documentation and
Procedures
50% 31.2% 14.6% 4.2% 0% 1.73 .868
Too many agencies involved
in overall export inspection
and certification in the region
39.6% 35.4% 14.6% 10.6% 0% 1.95 .988
Verification of transit cargo 44.7% 29.8% 10.6% 10.6% 4.3% 2.00 1.179
Lack of harmonization in
working hours at the border
posts
20.8% 43.8% 22.9% 8.3% 4.2% 2.31 1.035
Delays at weighbridges 41.7% 29.2% 22.9% 6.2% 0% 1.94 .954
Multiple police road blocks
and mobile control
39.6% 31.2% 10.4% 10.4% 8.3% 2.17 1.293
Prohibition on transportation
of locally produced goods
12.5% 33.3% 29.2% 8.3% 16.7% 2.83 1.260
East Africa Community transit
licenses for goods
25% 29.6% 16.7% 14.6% 4.2% 2.33 1.136
Truck entrance fees and grace
period
33.3% 39.6% 14.6% 6.2% 6.2% 2.13 1.141
Business registration 52.1% 29.2% 8.3% 6.2% 4.2% 1.81 1.104
Use of immigration and visa
procedures
35.4% 35.4% 18.8% 8.3% 2.1% 2.06 1.039
Poor information
dissemination across the East
Africa Community
31.2% 37.5% 27.1% 4.2% 0% 2.04 .874
Language barrier 27.1% 27.1% 25% 8.3% 12.5% 2.52 1.321
Insecurity/ highway
crimes/loss of goods at the
container freight stations
47.9% 25% 20.8% 6.2% 0% 1.85 .967

35
Table 4.1 shows that documentation and procedures were a barrier as strongly agreed to
by 50%, agreed to by 31.2%, 14.6% were neutral, and disagreed to by 4.2%; the results
had a mean of 1.73 and a standard deviation of 0.868. Too many agencies are involved in
overall export inspection and certification in the region was a barrier as strongly agreed to
by 36.9%, agreed to by 35.4%, 14.6% were neutral, and disagreed to by 10.6%; the
results had a mean of 1.95 and a standard deviation of 0.988. Verification of transit cargo
was a barrier as strongly agreed to by 44.7%, agreed to by 28.9%, 10.6% were neutral,
10.6% disagreed, and 4.3% strongly disagreed; the results had a mean of 2.00 and a
standard deviation of 1.179.
Lack of harmonization in working hours at the border posts was a barrier as strongly
agreed to by 20.8%, agreed to by 43.8%, 22.9% were neutral, 8.3% disagreed, and 4.2%
strongly disagreed; the results had a mean of 2.31 and a standard deviation of 1.035.
Delays at weighbridges was a barrier as strongly agreed to by 41.7%, agreed to by 29.2%,
22.9% were neutral, and 6.2% disagreed; the results had a mean of 1.94 and a standard
deviation of 0.954. Multiple police road blocks and mobile control was a barrier as
strongly agreed to by 39.6%, agreed to by 31.2%, 10.4% were neutral, 10.4% disagreed,
and 8.3% strongly disagreed; the results had a mean of 2.17 and a standard deviation of
1.293. Prohibition on transportation of locally produced goods was a barrier as strongly
agreed to by 12.5%, agreed to by 33.3%, 29.2% were neutral, 8.3% disagreed, and 16.7%
strongly disagreed; the results had a mean of 2.83 and a standard deviation of 1.260.
East Africa Community transit licenses for goods was a barrier as strongly agreed to by
25, agreed to by 29.6%, 16.7% were neutral, 14.6% disagreed, and 4.2% strongly
disagreed; the results had a mean of 2.33 and a standard deviation of 1.136. Truck
entrance fees and grace period was a barrier as strongly agreed to by 33.3%, agreed to by
39.6%, 14.6% were neutral, 6.2% equally disagreed, and strongly disagreed; the results
had a mean of 2.13 and a standard deviation of 1.141.
Business registration was a barrier as strongly agreed to by 52.1%, agreed to by 29.2%,
8.3% were neutral, 6.2% disagreed, and 4.2% strongly disagreed; the results had a mean
of 1.81 and a standard deviation of 1.104. Use of immigration and visa procedures was a
barrier as strongly agreed to by 35.4%, agreed to by 35.4%, 18.8% were neutral, 8.3%
disagreed, and 2.1% strongly disagreed; the results had a mean of 2.06 and a standard

36
deviation of 1.039. Poor information dissemination across the East Africa Community
was a barrier as strongly agreed to by 31.2%, agreed to by 37.5%, 27.1% were neutral,
and 4.2% disagreed; the results had a mean of 2.04 and a standard deviation of 0.0874.
Language barrier was a barrier as strongly agreed to by 27.1%, agreed to by 27.1%, 25%
were neutral, 8.3% disagreed, and 12.5% strongly disagreed; the results had a mean of
2.52 and a standard deviation of 1.321. Insecurity/ highway crimes/loss of goods at the
container freight stations was a barrier as strongly agreed to by 47.9%, agreed to by 25%,
20.8% were neutral, and 6.2% disagreed; the results had a mean of 1.85 and a standard
deviation of 0.967.
4.3.2 Correlations of Non-Tariff Barriers in Trade
A correlation test was carried out to determine the significance of the various non-tariff
barriers in trade factors that affected exporters. A p value of less or equal to 0.01 and/or
0.05 indicated that the particular factor was significant as a barrier. The results are
summarized in Table 4.2.
Table 4.2 Correlations of Non-Tariff Barriers in Trade
Correlations
Documentation and Procedures .402**
.005
Too many agencies involved in overall export inspection and
certification in the region
.581**
.000
Verification of transit cargo .646**
.000
Lack of harmonization in working hours at the border posts .511**
.000
Delays at weighbridges .456**
.001
Multiple police road blocks and mobile control .432**
.002
Prohibition on transportation of locally produced goods .232
.113
East Africa Community transit licenses for goods .500**
.000
Truck entrance fees and grace period .335*
.020
Business registration .184
.210
Use of immigration and visa procedures .304*
.036
Poor information dissemination across the East Africa Community .260
.074

37
Language barrier .048
.745
Insecurity/ highway crimes/loss of goods at the container freight stations .497**
.000
** Correlation is significant at the 0.01 level (2-tailed)
* Correlation is significant at the 0.05 level (2-tailed)
Table 4.2 shows that documentation and procedures were a significant non-tariff barrier
to trade (r=0.402, p<0.01). Too many agencies involved in overall export inspection and
certification in the region were a significant non-tariff barrier to trade (r=0.581, p<0.01).
Verification of transit cargo was a significant non-tariff barrier to trade (r=0.646, p<0.01).
Lack of harmonization in working hours at the border posts was a significant non-tariff
barrier to trade (r=0.511, p<0.01). Delays at weighbridges were a significant non-tariff
barrier to trade (r=0.456, p<0.01). Multiple police road blocks and mobile control were a
significant non-tariff barrier to trade (r=0.432, p<0.01).
East Africa Community transit licenses for goods were a significant non-tariff barrier to
trade (r=0.500, p<0.01). Truck entrance fees and grace period was a significant non-tariff
barrier to trade (r=0.335, p<0.05). Use of immigration and visa procedures was a
significant non-tariff barrier to trade (r=0.304, p<0.05). Insecurity/ highway crimes/loss
of goods at the container freight stations was a significant non-tariff barrier to trade
(r=0.497, p<0.01).
Prohibition on transportation of locally produced goods was an insignificant non-tariff
barrier to trade (r=0.232, p>0.05). Business registration was an insignificant non-tariff
barrier to trade (r=0.184, p>0.05). Poor information dissemination across the East Africa
Community was an insignificant non-tariff barrier to trade (r=0.260, p>0.05). Language
barrier was an insignificant non-tariff barrier to trade (r=0.048, p>0.05).
4.3.3 Regression Analysis for Non-Tariff Barriers in Trade
A regression analysis for Non-Tariff Barriers was computed and the results provided a
model summary for NTB barriers to trade. The results are summarized in Table 4.3.

38
Table 4.3 Regression Model Summary for NTB Barriers to Trade
Model R R Square Adjusted R Square Std. Error of the Estimate
1 .685 .469 .229 .99042
a. Predictors (Constant): NTB Barriers to Trade
The regression model summary in Table 4.3 indicates that 22.9% of the variance in trade
barriers can be explained by NTB barriers of trade. These indicates that NTB barriers to
trade impact exporters by 22.9%, and the rest could be explained by other factors.
4.3.4 Regression Coefficients for NTB Barriers to Trade
A regression analysis for Non-Tariff Barriers factors was computed and the results
provided regression coefficients. The results are summarized in Table 4.4.
Table 4.4 Regression Coefficients for NTB Barriers to Trade Factors
Model
Unstandardized
Coefficients
Standardized
Coefficients
t
Sig. B Std. Error Beta
1 (Constant)
Customs & administrative
procedures
Institutions & custom controls
Verification of transit cargo
Border posts working hours
Weighbridge delays
Police road blocks & mobile
control
Local goods prohibition
EAC transit licenses
Truck entry fees & grace period
Business registration
Immigration & visa procedures
Translation costs
Information constraints
Insecurity & loss of goods
.558
.152
-.051
.367
.147
-.206
-.253
.096
.474
-.050
.192
-.300
.290
-.161
.077
.612
.256
.310
.201
.202
.252
.148
.152
.182
.193
.197
.188
.219
.158
.224
.119
-.045
.385
.137
-.174
-.294
.109
.479
-.050
.192
-.279
.226
-.185
.067
.913
.595
-.163
1.825
.727
-.817
-1.708
.633
2.597
-.257
.974
-1.592
1.324
-1.014
.345
.369
.556
.871
.078
.473
.420
.098
.531
.014
.799
.337
.122
.195
.318
.733
a. Dependent Variable: Barrier to Trade
The coefficients in Table 4.4 show that EAC transit licenses had a positive and significant
influence on trade barrier since its precision level was <0.05. The table shows that
customs and administrative procedures, institutions and custom controls, verification of
transit cargo, border posts working hours, weighbridge delays, police road blocks and

39
mobile control, local goods prohibition, truck entry fees and grace period, business
registration, immigration and visa procedures, translation costs, information constraints,
and insecurity and loss of goods had an insignificant influence on trade barrier since the
precision level for all factors was >0.05 which was the study’s threshold.
4.4 Technical Barriers to Trade (TBT)
This sub-section provides the results of TBTs rating, correlation and regression analysis
with regards to the response received. These results have been presented in the form of
tables.
4.4.1 Rating of Technical Barriers to Trade
The study sought to determine the rating for technical barriers to trade using the scale
Strongly Agree, Agree, Neutral, Disagree, and Strongly Disagree. The response received
was as indicated in Table 4.5.
Table 4.5 Rating of Technical Barriers to Trade
Str
on
gly
Agre
e
Agre
e
Neu
tral
Dis
agre
e
Str
on
gly
Dis
agre
e
Mea
n
Std
Dev
Technical barriers to trade
includes voluntary standards
and conformity assessment
procedures
25.5% 40.4% 19.1% 14.9% 0% 2.23 1.004
Institutional barriers to
Kenya’s trade in the EAC is a
technical barrier to trade
28.3% 37% 21.7% 10.9% 2.2% 2.21 1.052
Some Kenyan ministries,
departments and parastatals
have become technical barriers
to trade
14.9% 40.4% 25.5% 12.8% 4.3% 3.62 7.727
KRA enforces and manages
the custom laws and the
administration of common
external tariffs
40.4% 38.3% 12.8% 8.5% 0% 1.89 .937
Kenya Plant Health
Inspectorate Service inspects
plants and issues a plant import
permit
40.4% 21.3% 29.8% 6.4% 2.1% 2.08 1.080
Kenya Bureau of Standards
tests and grades the quality of
goods and in process causes
barriers to trade
32.6% 32.6% 8.7% 19.6% 6.5% 2.35 1.303

40
Application of numerous
certification and conformity
assessments
27.7% 36.2% 25.5% 8.5% 2.1% 2.21 1.020
The rules of origin which
stipulate that a good must
wholly be produced or contain
imported content of no more
than 40 percent of the cost,
insurance and freight value of
the materials used in
production
17% 38.3% 25.5% 12.8% 6.4% 2.53 1.120
The procedure for obtaining
the certificate of origin is
cumbersome and lengthy,
which itself is costly for the
business community
41.3% 30.4% 17.4% 8.7% 2.2% 2.00 1.075
The variations in the
procedures for obtaining
licenses and business permits
across countries
31.9% 27.7% 23.4% 12.8% 4.3% 2.29 1.177
Table 4.5 shows that technical barriers to trade are agreement deals with all technical
requirements, voluntary standards and conformity assessment procedures as strongly
agreed to by 25.5%, agreed to by 40.4%, 19.1% were neutral, and 14.9% disagreed; the
results had a mean of 2.23 and a standard deviation of 1.004. Institutional barriers to
Kenya’s trade in the EAC is one of the categories of technical barriers to trade was a
barrier as strongly agreed to by 28.3%, agreed to by 37%, 21.7% were neutral, 10.9%
disagreed, and 2.2% strongly disagreed; the results had a mean of 2.21 and a standard
deviation of 1.052. Various Kenyan ministries, departments and parastatals are the
institutional barriers to trade as strongly agreed to by 14.9%, agreed to by 40.4%, 25.5%
were neutral, 12.8% disagreed, and 4.3% strongly disagreed; the results had a mean of
3.62 and a standard deviation of 7.727.
KRA is responsible for the enforcement and management of the customs laws and the
administration of common external tariffs hence causing TBT as strongly agreed to by
40.4%, agreed to by 38.3%, 12.8% were neutral, and 8.5% disagreed; the results had a
mean of 1.89 and a standard deviation of 0.937. Kenya Plant Health Inspectorate Service
inspects plants and issues a plant import permit as strongly agreed to by 40.4%, agreed to
by 21.3%, 29.8% were neutral, 6.4% disagreed, and 2.1% strongly disagreed; the results
had a mean of 2.08 and a standard deviation of 1.080. Kenya Bureau of Standards tests
and grades the quality of goods and in process causes barriers to trade as strongly agreed

41
to by 32.6%, agreed to by 32.6%, 8.7% were neutral, 19.6% disagreed, and 6.5% strongly
disagreed; the results had a mean of 2.35 and a standard deviation of 1.303.
Application of numerous certification and conformity assessments as strongly agreed to
by 27.7%, agreed to by 36.2%, 25.5% were neutral, 8.5% disagreed, and 2.1% strongly
disagreed; the results had a mean of 2.21 and a standard deviation of 1.020. The rules of
origin which stipulate that a good must wholly be produced or contain imported content
of no more than 40 percent of the cost, insurance and freight value of the materials used
in production as strongly agreed to by 17%, agreed to by 38.3%, 25.5% were neutral,
12.8% disagreed, and 6.4% strongly disagreed; the results had a mean of 2.53 and a
standard deviation of 1.120. The procedure for obtaining the certificate of origin is
cumbersome and lengthy, which itself is costly for the business community as strongly
agreed to by 41.3%, agreed to by 30.4%, 17.4% were neutral, 8.7% disagreed, and 2.2%
strongly disagreed; the results had a mean of 2.00 and a standard deviation of 1.075. The
variations in the procedures for obtaining licenses and business permits across countries
as strongly agreed to by 31.9%, agreed to by 27.7%, 23.4% were neutral, 12.8%
disagreed, and 4.3% strongly disagreed; the results had a mean of 2.29 and a standard
deviation of 1.177.
4.4.2 Correlations of Technical Barriers to Trade
A correlation test was carried out to determine the significance of the various technical
barriers to trade factors that affected exporters. A P value of less or equal to 0.01 and/or
0.05 indicated that the particular factor was significant as a barrier. The results are
summarized in Table 4.6.
Table 4.6 Correlations of Technical Barriers to Trade
Correlations
Technical barriers to trade includes voluntary standards and conformity
assessment procedures
.377**
.009
Institutional barriers to Kenya’s trade in the EAC is a technical barrier
to trade
.169
.263
Some Kenyan ministries, departments and parastatals have become
technical barriers to trade
-.059
.695
KRA is responsible for the enforcement and management of the
customs laws and the administration of common external tariffs hence
causing TBT
.060
.690
Kenya Plant Health Inspectorate Service inspects plants and issues a -.103

42
plant import permit .491
Kenya Bureau of Standards tests and grades the quality of goods and in
process causes barriers to trade
-.106
.484
Application of numerous certification and conformity assessments .032
.829
The rules of origin which stipulate that a good must wholly be produced
or contain imported content of no more than 40 percent of the cost,
insurance and freight value of the materials used in production
.305*
.037
The procedure for obtaining the certificate of origin is cumbersome and
lengthy, which itself is costly for the business community
.238
.111
The variations in the procedures for obtaining licenses and business
permits across countries
.039
.793
** Correlation is significant at the 0.01 level (2-tailed)
* Correlation is significant at the 0.05 level (2-tailed)
Table 4.6 shows that Technical Barriers to Trade are agreement deals with all technical
requirements, voluntary standards and conformity assessment procedures were a
significant technical barrier to trade (r=0.377, p<0.01). The rules of origin which stipulate
that a good must wholly be produced or contain imported content of no more than 40
percent of the cost, insurance and freight value of the materials used in production was a
significant technical barrier to trade (r=0.305, p<0.05).
The table however shows that, institutional barriers to Kenya’s trade in the EAC as one of
the categories of technical barriers to trade was an insignificant technical barrier to trade
(r=0.169, p>0.05). Various Kenyan ministries, departments and parastatals being the
institutional barriers to trade was an insignificant technical barrier to trade (r=0.059,
p>0.05). KRA being responsible for the enforcement and management of the customs
laws and the administration of common external tariffs hence causing TBT was an
insignificant technical barrier to trade (r=0.060, p>0.05). Kenya Plant Health Inspectorate
Service inspecting plants and issuing a plant import permit was an insignificant technical
barrier to trade (r=-0.103, p>0.05). Kenya Bureau of Standards testing and grading the
quality of goods and in process causing barriers to trade was an insignificant technical
barrier to trade (r=-0.106, p>0.05). Application of numerous certification and conformity
assessments was an insignificant technical barrier to trade (r=0.032, p>0.05). The
procedure for obtaining the certificate of origin being cumbersome and lengthy, which
itself is costly for the business community was an insignificant technical barrier to trade
(r=0.238, p>0.05). The variations in the procedures for obtaining licenses and business
permits across countries was an insignificant technical barrier to trade (r=0.039, p>0.05).

43
4.4.3 Regression Analysis for Technical Barriers to Trade
A regression analysis for TBT was computed and the results provided a model summary
for TBT barriers to trade. The results are summarized in Table 4.7.
Table 4.7 Regression Model Summary for TBT Barriers to Trade
Model R R Square Adjusted R Square Std. Error of the Estimate
1 .533 .285 .068 1.00549
a. Predictors (Constant): TBT Barriers to Trade
The regression model summary in Table 4.7 indicates that 6.8% of the variance in trade
barriers can be explained by TBT barriers of trade. These indicates that TBT barriers to
trade impact exporters by 6.8%, and the rest could be explained by other factors.
4.4.4 Regression Coefficients for NTB Barriers to Trade
A regression analysis for Technical Barriers to Trade factors were computed and the
results provided regression coefficients. The results are summarized in Table 4.8.
Table 4.8 Regression Coefficients for TBT Barriers to Trade Factors
Model
Unstandardized
Coefficients
Standardized
Coefficients
t
Sig. B Std. Error Beta
1 (Constant)
Conformity Assessment Process
Institutional Barriers
Government ministries
Customs Laws & External Tariffs
Plant Import Permit
Quality Tests for Products
Certification Assessments
Rules of Origin
Certification of Origin Process
Variation in Certification Process
1.744
.228
-.118
-.013
.063
-.206
-.068
-.057
.358
.162
-.069
.537
.194
.226
.025
.289
.182
.192
.242
.209
.191
.164
.227
-.118
-.100
.057
-.216
-.082
-.056
.388
.171
-.079
3.248
1.171
-.521
-.518
.218
-1.133
-.354
-.235
1.711
.846
-.419
.003
.250
.606
.608
.829
.266
.726
.815
.097
.404
.678
a. Dependent Variable: Barrier to Trade

44
The coefficients in Table 4.8 shows that conformity assessment process, institutional
barriers, government ministries, customs laws & external tariffs, plant import permit,
quality tests for products, certification assessments, rules of origin, certification of origin
process, and variation in certification process had an insignificant influence on trade
barrier since the precision level for all factors was >0.05 which was the study’s threshold.
4.5 Mitigating Factors for the Trade Barriers
This sub-section provides the results of mitigating factors’ rating, correlation and
regression analysis with regards to the response received. These results have been
presented in the form of tables.
4.5.1 Rating of Mitigating Factors on Trade Barriers
The study sought to examine the rating of the mitigating factors on non-tariff barriers and
technical tariff barriers to Trade to trade using the scale Strongly Agree, Agree, Neutral,
Disagree, and Strongly Disagree. The response received was as indicated in Table 4.9.
Table 4.9 Rating for Mitigating Factors on Trade Barriers
Hig
h
Mod
erate
Low
Not
Su
re
Not
at
All
Mea
n
Std
Dev
Use lessons to be borrowed
from the European Union (EU)
and Association of Southeast
Asian Nations (ASEAN) for
planning and minimizing
policy errors
38.6% 40.9% 13.6% 6.8% 0% 1.88 .894
Harmonizing product standards
and developing mutual
recognition of standards across
member countries
20% 53.3% 17.8% 6.7% 2.2% 2.80 4.673
Verification of information on
NTBs
31.8% 34.1% 22.7% 11.4% 0% 2.14 1.002
Prioritization of products 18.2% 45.5% 20.5% 13.6% 2.3% 2.36 1.014
Developing specific work
program
22.2% 42.2% 15.6% 13.3% 6.7% 2.40 1.175
Sector-based approach strategy
to be employed to deal with
issues in specific economic and
politic sectors
29.5% 27.3% 25% 9.1% 9.1% 2.41 1.263
Enhance exchange of
information and views on a
26.7% 35.6% 17.8% 20% 0% 2.31 1.083

45
range of active NTB
elimination programs/projects
Establish a communication
network between NTB focal
points
29.5% 27.3% 20.5% 20.5% 2.3% 2.38 1.185
Establishing appropriate
procedures for identifying and
eliminating NTBs
29.5% 38.6% 15.9% 13.6% 2.3% 2.20 1.091
Regular meetings by member
states to discuss of the NTBs to
be eliminated
34.9% 20.9% 23.3% 16.3% 4.7% 2.35 1.251
EAC should invest in One-
Stop-Centers and electronic
single window systems at
border stations
28.9% 37.8% 26.7% 6.7% 0% 2.11 .910
Review of port charges to
international levels
33.3% 35.6% 24.4% 6.7% 0% 2.04 .928
Designing effective
mechanisms for identifying
and verifying information
about NTBs
36.4% 29.5% 20.5% 11.4% 2.3% 2.14 1.112
Involve the general public in
the process of EAC integration
37.8% 29.5% 20.5% 11.4% 2.3% 2.08 1.183
Develop strategy for reducing
differences and capacity
constraints
37.8% 35.6% 17.8% 8.9% 0% 1.97 .965
Invest in infrastructure 45.5% 27.3% 15.9% 4.5% 6.8% 2.00 1.200
Apply the principle of
asymmetry and promote the
use of English
21.7% 47.8% 13% 13% 4.3% 2.30 1.092
Monitoring for new NTBs and
technical barriers (NTB/TB)
44.4% 20% 22.2% 8.9% 4.4% 2.08 1.202
Table 4.9 shows that use of lessons to be borrowed from the European Union (EU) and
Association of Southeast Asian Nations (ASEAN) for planning and minimizing policy
errors would mitigate trade barriers as shown by 38.6% who responded with high, 40.9%
stated moderate, 13.6% stated low, and 6.8% were not sure; the results had a mean of
1.88 and a standard deviation of 0.894. Harmonizing product standards and developing
mutual recognition of standards across member countries errors would mitigate trade
barriers as shown by 20% who responded with high, 53.3% stated moderate, 17.8% stated
low, 6.7% were not sure, and 2.2% stated not at all; the results had a mean of 2.80 and a
standard deviation of 4.673.

46
Verification of information on NTBs would mitigate trade barriers as shown by 31.8%
who responded with high, 34.1% stated moderate, 22.7% stated low, and 11.4% were not
sure; the results had a mean of 2.14 and a standard deviation of 1.002. Prioritization of
products would mitigate trade barriers as shown by 18.2% who responded with high,
45.5% stated moderate, 20.5% stated low, 13.6% were not sure, and 2.3% stated not at
all; the results had a mean of 2.36 and a standard deviation of 1.014. Developing specific
work program would mitigate trade barriers as shown by 22.2% who responded with
high, 42.2% stated moderate, 15.6% stated low, 13.3% were not sure, and 6.7% stated not
at all; the results had a mean of 2.40 and a standard deviation of 1.175. Sector-based
approach strategy to be employed to deal with issues in specific economic and politic
sectors would mitigate trade barriers as shown by 29.5% who responded with high, 27.3%
stated moderate, 25% stated low, 9.1% were not sure, and another 9.1% stated not at all;
the results had a mean of 2.41 and a standard deviation of 1.263.
Enhance exchange of information and views on a range of active NTB elimination
programs/projects would mitigate trade barriers as shown by 26.7% who responded with
high, 35.6% stated moderate, 17.8% stated low, and 20% were not sure; the results had a
mean of 2.31 and a standard deviation of 1.083. Establishing a communication network
between NTB focal points would mitigate trade barriers as shown by 29.5% who
responded with high, 27.3% stated moderate, 20.5% stated low, another 20.5% were not
sure, and 2.3% stated not at all; the results had a mean of 2.38 and a standard deviation of
1.185. Establishing appropriate procedures for identifying and eliminating NTBs would
mitigate trade barriers as shown by 29.5% who responded with high, 38.6% stated
moderate, 15.9% stated low, 13.6% were not sure, and 2.3% stated not at all; the results
had a mean of 2.20 and a standard deviation of 1.091.
Regular meetings by member states to discuss of the NTBs to be eliminated would
mitigate trade barriers as shown by 34.9% who responded with high, 20.9% stated
moderate, 23.3% stated low, 16.3% were not sure, and 4.7% stated not at all; the results
had a mean of 2.35 and a standard deviation of 1.251. EAC investing in One-Stop-
Centers and electronic single window systems at border stations would mitigate trade
barriers as shown by 28.9% who responded with high, 37.8% stated moderate, 26.7%
stated low, and 6.7% were not sure; the results had a mean of 2.11 and a standard
deviation of 0.910. Reviewing of port charges to international levels would mitigate trade

47
barriers as shown by 33.3% who responded with high, 35.6% stated moderate, 24.4%
stated low, and 6.7% were not sure; the results had a mean of 2.04 and a standard
deviation of 0.928.
Designing effective mechanisms for identifying and verifying information about NTBs
would mitigate trade barriers as shown by 36.4% who responded with high, 29.5% stated
moderate, 20.5% stated low, 11.4% were not sure, and 2.3% stated not at all; the results
had a mean of 2.14 and a standard deviation of 1.112. Involving the general public in the
process of EAC integration would mitigate trade barriers as shown by 37.8% who
responded with high, 29.5% stated moderate, 20.5% stated low, 11.4% were not sure, and
2.3% stated not at all; the results had a mean of 2.08 and a standard deviation of 1.183.
Developing strategy for reducing differences and capacity constraints would mitigate
trade barriers as shown by 37.8% who responded with high, 35.6% stated moderate,
17.8% stated low, and 8.9% were not sure; the results had a mean of 1.97 and a standard
deviation of 0.965.
Investing in infrastructure would mitigate trade barriers as shown by 45.5% who
responded with high, 27.3% stated moderate, 15.9% stated low, 4.5% were not sure, and
6.8% stated not at all; the results had a mean of 2.00 and a standard deviation of 1.200.
Applying the principle of asymmetry and promote the use of English would mitigate trade
barriers as shown by 21.7% who responded with high, 47.8% stated moderate, 13% stated
low, 13% were not sure, and 4.3% stated not at all; the results had a mean of 2.30 and a
standard deviation of 1.092. Monitoring for new NTBs and technical barriers (NTB/TB)
would mitigate trade barriers as shown by 44.4% who responded with high, 20% stated
moderate, 22.2% stated low, 8.9% were not sure, and 4.4% stated not at all; the results
had a mean of 2.08 and a standard deviation of 1.202.
4.5.2 Correlations of Mitigating Factors for Trade Barriers
A correlation test was carried out to determine the significance of the various mitigating
factors on non-tariff barriers and technical tariff barriers that would affect exporters. A P
value of less or equal to 0.01 and/or 0.05 indicated that the particular factor was
significant as a barrier. The results are summarized in Table 4.10.

48
Table 4.10 Correlations of Mitigating Factors for Trade Barriers
Correlations
Lessons to be borrowed from the European Union (EU) and Association
of Southeast Asian Nations (ASEAN) for planning and minimizing
policy errors
.429**
.000
Harmonizing product standards and developing mutual recognition of
standards across member countries
-.059
.702
Verification of information on NTBs .381*
.011
Prioritization of products .252
.099
Developing specific work program .154
.318
Sector-based approach strategy to be employed to deal with issues in
specific economic and politic sectors
.124
.421
Enhance exchange of information and views on a range of active NTB
elimination programs/projects
.250
.102
Establish a communication network between NTB focal points .349*
.020
Establishing appropriate procedures for identifying and eliminating
NTBs
.516**
.000
Regular meetings by member states to discuss of the NTBs to be
eliminated
.238
.125
EAC should invest in One-Stop-Centers and electronic single window
systems at border stations
.413**
.005
Member states should review of port charges to international levels and
political goodwill to facilitate cross-border movement of people
.283
.062
Designing effective mechanisms for identifying and verifying
information about NTBs
.390**
.009
Involve the general public in the process of EAC integration .466**
.001
Develop strategy for reducing differences and capacity constraints .372*
.013
Invest in infrastructure .197
.206
Apply the principle of asymmetry and promote the use of English .503**
.001
Monitoring for new NTBs and technical barriers (NTB/TB) .400**
.007
** Correlation is significant at the 0.01 level (2-tailed)
* Correlation is significant at the 0.05 level (2-tailed)
Table 4.10 shows that use of lessons to be borrowed from the European Union (EU) and
Association of Southeast Asian Nations (ASEAN) for planning and minimizing policy
errors would be a significant mitigating strategy to trade barriers (r=0.429, p<0.01).
Verification of information on NTBs would be a significant mitigating strategy to trade
barriers (r=0.381, p<0.05). Establishing a communication network between NTB focal

49
points would be a significant mitigating strategy to trade barriers (r=0.349, p<0.05).
Establishing appropriate procedures for identifying and eliminating NTBs would be a
significant mitigating strategy to trade barriers (r=0.516, p<0.01).
EAC investing in One-Stop-Centers and electronic single window systems at border
stations would be a significant mitigating strategy to trade barriers (r=0.413, p<0.01).
Designing effective mechanisms for identifying and verifying information about NTBs
would be a significant mitigating strategy to trade barriers (r=0.390, p<0.01). Involving
the general public in the process of EAC integration would be a significant mitigating
strategy to trade barriers (r=0.466, p<0.01). Developing strategy for reducing differences
and capacity constraints would be a significant mitigating strategy to trade barriers
(r=0.372, p<0.01). Applying the principle of asymmetry and promote the use of English
would be a significant mitigating strategy to trade barriers (r=0.503, p<0.01). Monitoring
for new NTBs and technical barriers (NTB/TB) would be a significant mitigating strategy
to trade barriers (r=0.400, p<0.01).
Harmonizing product standards and developing mutual recognition of standards across
member countries would be an insignificant mitigating strategy to trade barriers (r=-
0.059, p>0.05). Prioritization of products would be an insignificant mitigating strategy to
trade barriers (r=0.252, p>0.05). Developing specific work program would be an
insignificant mitigating strategy to trade barriers (r=0.154, p>0.05). Sector-based
approach strategy to be employed to deal with issues in specific economic and politic
sectors would be an insignificant mitigating strategy to trade barriers (r=0.124, p>0.05).
Enhancing exchange of information and views on a range of active NTB elimination
programs/projects would be an insignificant mitigating strategy to trade barriers (r=0.250,
p>0.05). Member states meeting a couple of times per year and discuss of the NTBs to be
eliminated would be an insignificant mitigating strategy to trade barriers (r=0.238,
p>0.05). Member states reviewing of port charges to international levels and political
goodwill to facilitate cross-border movement of people would be an insignificant
mitigating strategy to trade barriers (r=0.283, p>0.05). Investing in infrastructure would
be an insignificant mitigating strategy to trade barriers (r=0.197, p>0.05).

50
4.5.3 Regression Analysis for Mitigating Factors to Trade Barriers
A regression analysis for mitigating factors to trade barriers was computed and the results
provided a model summary for mitigating factors for trade barriers. The results are
summarized in Table 4.11.
Table 4.11 Regression Model Summary for Mitigating Factors for Trade Barriers
Model R R Square Adjusted R Square Std. Error of the Estimate
1 .778 .605 .421 .90712
a. Predictors (Constant): Mitigating Factors for Trade Barriers
The regression model summary in Table 4.11 indicates that 42.1% of the variance in trade
barriers can be explained by the mitigating factors for trade barriers. This indicates that
mitigating factors for trade barriers would impact exporters by 42.1%, and the rest could
be explained by other factors.
4.5.4 Regression Coefficients for Mitigating Factors for Trade Barriers
A regression analysis for mitigating factors to trade barriers were computed and the
results provided regression coefficients. The results are summarized in Table 4.12.
Table 4.12 Regression Coefficients for Mitigating Factors for Trade Barriers
Model
Unstandardized
Coefficients
Standardized
Coefficients
T
Sig. B Std. Error Beta
1 (Constant)
Use of Borrowed Lessons
Harmonizing Product Standards
Information Verification
Prioritization of Products
Sector-based Approach Strategy
Regular Meetings by Members
Investment of One-Stop-Centers
Review of Port Charges
General Public Involvement
Reducing Capacity Constraints
Infrastructure Improvement
Asymmetry Application
Monitoring NTB and TBTs
-.331
-.052
.009
.395
.009
.017
.455
.233
-.150
.135
.072
.128
-.155
.169
.548
.253
.041
.201
.235
.164
.146
.287
.235
.201
.245
.170
.207
.220
-.039
.037
.332
.008
.019
.473
.179
-.119
.138
.059
.131
-.142
.174
-.603
-.205
.226
1.964
.039
.107
3.123
.812
-.637
.673
.295
.752
-.747
.766
.551
.839
.823
.060
.969
.916
.004
.424
.529
.506
.770
.458
.461
.450
a. Dependent Variable: Barrier to Trade
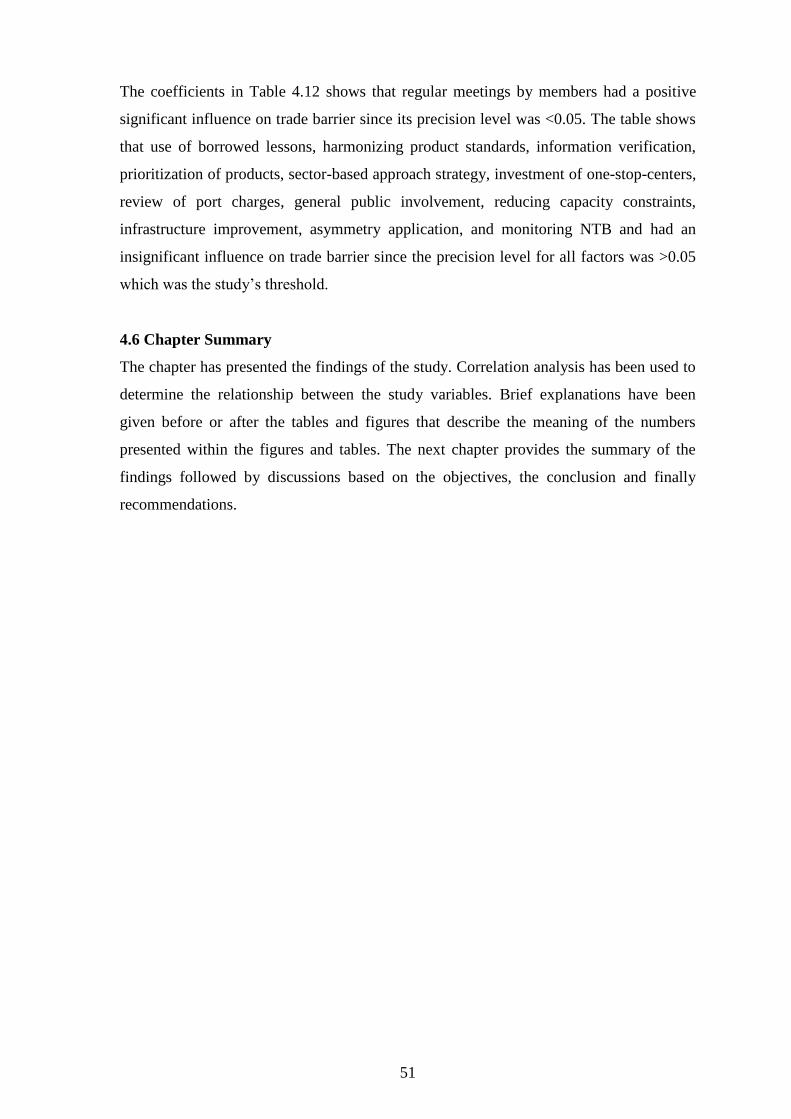
51
The coefficients in Table 4.12 shows that regular meetings by members had a positive
significant influence on trade barrier since its precision level was <0.05. The table shows
that use of borrowed lessons, harmonizing product standards, information verification,
prioritization of products, sector-based approach strategy, investment of one-stop-centers,
review of port charges, general public involvement, reducing capacity constraints,
infrastructure improvement, asymmetry application, and monitoring NTB and had an
insignificant influence on trade barrier since the precision level for all factors was >0.05
which was the study’s threshold.
4.6 Chapter Summary
The chapter has presented the findings of the study. Correlation analysis has been used to
determine the relationship between the study variables. Brief explanations have been
given before or after the tables and figures that describe the meaning of the numbers
presented within the figures and tables. The next chapter provides the summary of the
findings followed by discussions based on the objectives, the conclusion and finally
recommendations.

52
CHAPTER FIVE
5.0 DISCUSSIONS, CONCLUSIONS, AND RECOMMENDATIONS
5.1 Introduction
This chapter concludes the study. The chapter gives the conclusions in various sections
that address the summary of findings; discussions; conclusions; and recommendations
both for improvement and for further studies.
5.2 Summary of Findings
The purpose of the study was to investigate the effects of non-tariff and technical barriers
to trade on the Kenyan exporters within the East African Community. Non-tariff and
technical barriers continues to hinder inter-country trade within the East African
Community and this study sought to highlight the effects of the barriers to Kenyan
exporters. The study was guided by the following research questions: What are the non-
tariff barriers faced by Kenyan exporters within the East African Community? What are
the technical barriers to trade affecting the Kenyan exporters within East African
Community? What are the mitigating factors on non-tariff barriers and technical barriers
to trade?
Explanatory research design to clearly articulate the various technical and non-tariff trade
barriers that hinder trade within EAC within particular emphasis on barriers that hindered
Kenyan exporters in EAC. The study assumed a random sampling technique in getting a
representative sample size of 121 individuals from automobile, manufacturing and
agricultural population. Questionnaires were the main data collection instrument that
were used by the researcher. Descriptive analysis was used in the data analysis and
reporting of results.
Documentation and procedures, too many agencies involved in overall export inspection
and certification in the region, escort of all sensitive and hazardous products through the
territory of each EAC transit country, verification of transit cargo, lack of harmonization
in working hours at the border posts, delays at weighbridges, multiple police road blocks
and mobile control, prohibition on transportation of locally produced goods, East Africa
community transit licenses for goods, truck entrance fees and grace period, business
registration, use of immigration and visa procedures, poor information dissemination

53
across the East Africa community, language barrier, and insecurity/ highway crimes/loss
of goods at the container freight stations were all non-tariff barriers to trade in EAC.
Technical Barriers to Trade are agreement deals with all technical requirements,
voluntary standards and conformity assessment procedures. The study showed that
exporters in Kenya faced institutional barriers to Kenya’s trade in the EAC. The study
showed that various Kenyan ministries, departments and parastatals were the institutional
barriers to trade, and that KRA was responsible for the enforcement and management of
the customs laws and the administration of common external tariffs hence causing TBT.
The study showed that application of numerous certification and conformity assessments,
and the procedure for obtaining the certificate of origin being cumbersome and lengthy
were a barrier to trade.
Some mitigation procedures for minimizing the impact of trade barriers would include:
harmonizing product standards and developing mutual recognition of standards across
member countries, carrying out verification of information on NTBs, prioritizing
products, developing specific work programs, and carrying out a sector-based approach
strategy that deals with issues in specific economic and politic sectors. Other mitigation
strategies would include: enhancing exchange of information and views on a range of
active NTB elimination programs/projects, establishing a communication network
between NTB focal points, and establishing appropriate procedures for identifying and
eliminating NTBs.
5.3 Discussions
5.3.1 Non-Tariff Barriers on Trade (NTBs)
Documentation and procedures was still a trade barrier. These results are similar to World
Bank (2008), several sessions, forums and meetings have been undertaken by the EAC
Council of Ministers with the aim of simplifying and synchronizing customs
documentation, formalities and procedures at the border posts. Little of this has been
translated into action.
Too many agencies were involved in overall export inspection and certification in the
region. These results are similar to Beghin (2006), the point agreed by most of the EAC
member governments is that there are too many agencies involved in overall export

54
inspection and certification in the region, stretching the administrative capacity and
resource needs.
Verification of transit cargo was a trade barrier. These results are similar to Ihiga (2007),
a lot of transit cargo is scanned and verified by the revenues authorities, like the Kenya
Revenue Authority and the Rwanda Revenue Authority, though it is not for use in the
member country concerned. The goods destined for the member country in many cases
are subject to 100 percent physical inspection, particularly where they involve refund or
drawback claims, regardless of the compliance record of the exporter.
Lack of harmonization in working hours at the border posts was a trade barrier. These
results are similar to Ihiga (2007), there is lack of harmonization in terms of the agreed
working hours at the intra-EAC borders. World Bank (2008), a crucial partner in the 24-
hour operation, has not yet been adopted due to work force and budget constraints.
Delays at weighbridges were a barrier to trade. These results are similar to Ihiga (2007),
the mandatory weighbridges for goods all along the transit route, and not only at the
border, impede trade through addition to transit time and cost of transporter upkeep.
These are particularly significant on the Kenyan and Tanzanian sides of the transport
corridors.
Multiple police road blocks and mobile control was a trade barrier. These results are
similar to EABC (2004), unrelated with weighing or clearing the cargo, police roadblocks
are constantly cited by traders and transporters as location for rent seeking and transit
delays. World Bank (2008), what bothers transporters is that there is a general lack of
coordination among the police in carrying out their duties, such that a truck is subject to
similar checks at all traffic stops. This creates room for the police to openly press for
petty bribes.
Prohibition on transportation of locally produced goods was a barrier to trade. These
results are similar to EABC (2009), transit goods license issued for a truck allows the
truck only to route goods through boarders, but it prohibits transportation of locally
produced goods from Kenya/Rwanda as exports and transportation of goods from another
EAC member into Kenya/Rwanda as imports.

55
The study showed that truck entrance fees and grace period was a barrier to trade. These
results are similar to EABC (2009), the EAC transit regulations allow a grace period of
seven days without payment of fees for vehicles entering the territory of a member state,
but compliance varies across member states and across time periods.
Business registration was a barrier to trade. These results are similar to EABC (2009)
treatment of businesses originating in the EAC as “foreign” and different national
procedures make cross-border registration of business branches difficult. Payment for
registration of business names and the multiplicity of licenses for production,
distribution/sale of goods among the five EAC countries is cumbersome.
Use of immigration and visa procedures was a barrier to trade. These results are similar to
EABC (2008), there are cumbersome, duplicative, and in many instances used contrary to
the EAC Protocol. EAC-wide, visa fees was removed in June 2007 and replaced by
temporary work permits for visitors seeking temporary work assignments. These do not
apply to traders, transporters, and visitors who are not seeking temporary employment. At
the border, officials at Namanga, Tanzania not only charge each truck USDD50, but also
impose a charge of USD100 as work permit for accompanying businesspersons who
would like to exhibit their products in Tanzania (EABC, 2008).
There is poor information dissemination across the East Africa Community. These results
are similar to Okumu (2010), not only are the rules and regulations not mutually
recognized or harmonized, but the dissemination of information on them is extremely
poor across member states and within them. Traders are not aware of some of the
decisions made at the EAC Council, such as the new transit regulations. At the borders,
the customs agents often do not have the latest directives and/or forms from their revenue
authorities, and truck drivers may not know the regulations specific to their cargo.
Language barrier was a barrier to trade. These results are similar to Mutambara (2009),
language of communication is yet another non-tariff barrier recognized by Burundian
traders and trucks that travel in Uganda, Tanzania, and Kenya. Traders face specific
charges. For instance, those who export goods to francophone Burundi from Kenya pay a
USD300 fee to translate the required regulations to English at Jomo Kenyatta
International Airport (JKIA) in Nairobi.

56
Insecurity/ highway crimes/loss of goods at the container freight stations was a trade
barrier. These results are similar to EABC (2005), heightened security concerns along the
trade routes and highway thefts add to concerns for traders and transporters. Along the
Ugandan segment of the Northern Corridor, transporters who make night runs complain
about acts of banditry. Ayoki (2007) also points out that, operation of the CFSs at various
locations is affected by pilferage of cargo. Exporters end up losing their goods and are
often unable to lodge claims because they do not know whose responsibility it is to pay
for the claims.
5.3.2 Technical Barriers to Trade
Technical barriers to trade are agreement deals with all technical requirements, voluntary
standards and conformity assessment procedures. These results are similar to Kee, Looi,
Nicita and Olarreaga (2006) Technical Barriers to Trade (TBT) are agreement deals with
all technical requirements, voluntary standards and conformity assessment procedures.
Various Kenyan ministries, departments and parastatals are the institutional barriers to
trade. These results are similar to Kenya Revenue Authority (2004), various Kenyan
ministries, departments and parastatals regulate the country’s trade, including the
Ministries of Trade, Finance, Justice and Constitutional Affairs, Public Health and
Immigration. These hindrances occur because of the setting of product standards,
technical regulations and conformity assessment procedures that constitute technical
barriers to trade.
KRA is responsible for the enforcement and management of the customs laws and the
administration of common external tariffs hence causing TBT. These results are similar to
Kenya Revenue Authority (2004), the KRA has the most significant impact on
intraregional trade. It is responsible for the enforcement and management of the customs
laws and the administration of common external tariffs. Additionally, the clearance of
goods by the KRA takes time because of the lack of harmonized import/ export
documentation and procedures.
Kenya Plant Health Inspectorate Service inspects plants and issues a plant import permit.
These results are similar to Mold (2005), other important agencies that affect the EAC’s
trade in Kenya include KEPHIS, which inspects plants and issues a plant import permit.

57
All these agencies operate independently of each other, without much coordination
(thereby occasioning delays). In addition, most of them do not operate 24 hours a day.
Kenya Bureau of Standards tests and grades the quality of goods and in process causes
barriers to trade. These results are similar to Mold (2005), KEBS, which tests and grades
the quality of goods operates independently, without much coordination (thereby
occasioning delays).
Application of numerous certification and conformity assessments was a barrier trade.
These results are similar to World Bank (2007) EAC member countries apply numerous
certification and conformity assessments to ensure technical quality standards in intra-
EAC trade. However, there are differences in product standards and agencies that are
accredited to undertake the standardization procedures. Some agencies accredited to
conduct standardization in one country are not recognized by officers in another country -
a problem that adds to the cost of conducting certification and wastes time.
Rules of origin which stipulate that a good must wholly be produced or contain imported
content of no more than 40 percent of the cost, insurance and freight value of the
materials used in production. These results are similar to World Bank (2009), rules of
origin that stipulate that a good must wholly be produced or contain imported content of
no more than 40 percent of the cost, insurance and freight value of the materials used in
production has a cumbersome and lengthy process, which itself is costly for the business
community.
Procedure for obtaining the certificate of origin is cumbersome and lengthy, which itself
is costly for the business community. These results are similar to World Bank (2009), the
procedure for obtaining the certificate of origin is cumbersome and lengthy, which itself
is costly for the business community.
Variations in the procedures for obtaining licenses and business permits across countries
was a barrier. These results are similar to World Bank (2007) the procedures for obtaining
these various licenses vary across countries. In addition, there is a lack of preferential
treatment to EAC-originating businesses makes cross-border registration of businesses a
difficult, cumbersome and expensive process.

58
5.3.3 Mitigating Factors on Non-Tariff barriers and Technical Tariff Barriers
Lessons to be borrowed from the European Union (EU) and Association of Southeast
Asian Nations (ASEAN) for planning and minimizing policy errors would mitigate
barriers. These results are similar to Fliess and Lejarraga (2005), lessons are borrowed
from the European Union (EU) and Association of Southeast Asian Nations (ASEAN),
since they contain a number of lessons that can help EAC plan well and minimize policy
errors.
Harmonizing product standards and developing mutual recognition of standards across
member countries would mitigate barriers. These results are similar to Fliess and
Lejarraga (2005), the ASEAN strategy involving the establishment of a modality for
eliminating NTBs including harmonizing product standards and developing mutual
recognition of standards across member countries would increase trade.
Verification of information, prioritization of products, and developing specific work
program would mitigate barriers. These results are similar to ASEAN Secretariat (2010),
the general features of the process for eliminating NTBs consists of verification of
information on NTBs, prioritization of products, developing specific work programme
and obtaining a mandate from the ASEAN Economic Ministers to implement a work
programme.
Sector-based approach strategy to be employed to deal with issues in specific economic
and politic sectors. These results are similar to ASEAN Secretariat (2010), major
characteristic that distinguishes the ASEAN experience from that of the EU in dealing
with NTBs is its sector-based approach. In this strategy, ASEAN has focused its
economic integration and elimination of trade barriers on a few sectors (chosen among
sectors with the highest potential for intra-regional trade and integration).
Enhancing exchange of information and views on a range of active NTB elimination
programs/projects would mitigate barriers. These results are similar to World Bank
(2008), ongoing activities for elimination of NTBs include a review of national NTBs
reports, national procedures for inter-ministry co-operation on NTBs, exchange of
information and views on a range of active NTB elimination programmes/projects and
establishing a communication network between NTB focal points.

59
Establishing a communication network between NTB focal points would mitigate
barriers. Establishing appropriate procedures for identifying and eliminating NTBs would
mitigate barriers. These results are similar to World Bank (2008), establishing appropriate
procedures for identifying and eliminating NTBs, and procedures to have high level
commitment and support and visibility ASEAN (2010).
Regular meetings between member states to discuss of the NTBs to be eliminated would
mitigate barriers. These results are similar to World Bank (2008), member states
commitment to provide the framework for continued work on NTBs, meet a couple of
times per year, otherwise communicating by telephone and e-mail, identify NTBs on a
continuous basis, prepare the respective annual reports on NTBs, consider the formation
in each country of a national inter-ministry/agency communication network chaired by a
high-level official from EU Secretariat.
EAC investing in One-Stop-Centers and electronic single window systems at border
stations, and member states reviewing of port charges to international levels and political
goodwill to facilitate cross-border movement of people would mitigate barriers. These
results are similar to World Bank (2008), the programme of investment in One-Stop-
Centers and electronic single window systems at border stations, review of port charges to
international levels, political goodwill to facilitate cross-border movement of people
while waiting for finalization of relevant protocol, mutually recognize inspection
procedures, and inspection reports and certificates, clear guidelines for stopping
commercial vehicles, a daily record of vehicles stopped, reasons and measures taken,
joint verification of goods at border posts, infrastructure improvement, cancellation of
transit bonds, investment in parking sheds and parking yards, lifting restrictions of truck
haulage, expand working hours.
Designing effective mechanisms for identifying and verifying information about NTBs
would mitigate barriers. These results are similar to Abegaz (2008), one of the key steps
to take is to design effective mechanisms for identifying and verifying information about
NTBs, and prioritizing and ensuring their elimination. This will require giving the EAC
Secretariat the mandate to compel individual countries to eliminate any identified NTB
and to ensure that no new ones are created.

60
Involving the general public in the process of EAC integration would mitigate barriers.
These results are similar to Hangi (2010), the full involvement of the private sector
associations and civil society organizations should intensify public awareness campaigns
about customs union and its economic opportunities. Every effort should be made to
reach out to the entire population of the EAC countries.
Developing strategy for reducing differences and capacity constraints would mitigate
barriers. These results are similar to Beghin, (2006), one way forward for developing a
strategy for reducing/removing NTBs given national differences and capacity constraints
is to adopt a product/sector view in a phased manner.
Investing in infrastructure would mitigate barriers. These results are similar to Hangi
(2010), government monopolies and/or fiscal constraints have given rise to severe
infrastructure constraints, the related NTBs will need prior large-scale investments and
long-term interventions in expansion/rehabilitation of physical infrastructure in a
coordinated manner, thus, improvement of infrastructure is fundamental to lowering costs
of business and facilitating efficiency in production, transportation and delivery of goods
and services.
Applying the principle of asymmetry and promote the use of English would mitigate
barriers. These results are similar to Stephen, Karingi, Fekadu and Belay (2009) states
that, as EAC explores a program to achieve the common market, they recommend putting
in place a policy to mitigate the effects of the completion of the internal market on
relatively disadvantaged member states.
Monitoring for new NTBs and technical barriers (NTB/TB) would mitigate barriers.
These results are similar to World Bank (2008), the monitoring for new NTBs and
Technical barriers that may be imposed by member states, the EAC could learn from the
EU’s adoption of preventive measures which oblige member states to notify all draft
regulations and standards related to technical specifications to be introduced on national
territories. In this way, the Commission is able to monitor and prevent the raise of new
national barriers to intra-EU trade.

61
5.4 Conclusions
5.4.1 Non-Tariff Barriers on Trade (NTBs)
Documentation and procedures, too many agencies involved in overall export inspection
and certification in the region, escort of all sensitive and hazardous products through the
territory of each EAC transit country, verification of transit cargo, lack of harmonization
in working hours at the border posts, delays at weighbridges, multiple police road blocks
and mobile control, prohibition on transportation of locally produced goods, East Africa
community transit licenses for goods, truck entrance fees and grace period, business
registration, use of immigration and visa procedures, poor information dissemination
across the East Africa community, language barrier, and insecurity/ highway crimes/loss
of goods at the container freight stations were all non-tariff barriers to trade in EAC.
5.4.2 Technical Barriers to Trade
Technical barriers to trade are agreement deals with all technical requirements, voluntary
standards and conformity assessment procedures. The study concludes that exporters in
Kenya faced institutional barriers to Kenya’s trade in the EAC. The study therefore
concludes that various Kenyan ministries, departments and parastatals were the
institutional barriers to trade, and that KRA was responsible for the enforcement and
management of the customs laws and the administration of common external tariffs hence
causing TBT. The application of numerous certification and conformity assessments, and
the procedure for obtaining the certificate of origin being cumbersome and lengthy are a
barrier to trade.
5.4.3 Mitigating Factors on Non-Tariff barriers and Technical Tariff Barriers
Some mitigation procedures for minimizing the impact of trade barriers would include:
harmonizing product standards and developing mutual recognition of standards across
member countries, carrying out verification of information on NTBs, prioritizing
products, developing specific work programs, and carrying out a sector-based approach
strategy that deals with issues in specific economic and politic sectors. Other mitigation
strategies would include: enhancing exchange of information and views on a range of
active NTB elimination programs/projects, establishing a communication network
between NTB focal points, and establishing appropriate procedures for identifying and
eliminating NTBs.

62
5.5 Recommendations
5.5.1 Recommendations for Improvement
5.5.1.1 Non-Tariff Barriers on Trade (NTBs)
The study recommends that the consultation process between all stakeholders in the
export business be enhanced by involving the trading community at the drafting stage of
customs laws, regulations and trading procedures. The parties should ensure that all input
offered is taken into consideration in international consultations.
5.5.1.2 Technical Barriers to Trade
National technical and standard bodies and involved parties often have insufficient
capacity to participate actively in standardization activities. The study therefore
recommends that more effort is put by all border organizations in order to fully align
structure, rules, procedures and operations with international and good practice.
Responsibilities for transposing technical regulations should be clearly defined for all
involved parties and responsible ministries should ensure that new technical regulations
are properly enforced by co-operating with market surveillance authorities.
5.5.1.3 Mitigating Factors on Non-Tariff barriers and Technical Tariff Barriers
The study recommends that existing advance ruling mechanisms in various boarders and
countries be classified according to the national customs tariff and verification of the
origin of goods declared for preferential treatment. All parties could also introduce an
advance ruling mechanism to provide information on the method that will be applied for
customs valuation.
5.5.2 Recommendations for Further Studies
This study focused on investigating the effects of non-tariff and technical barriers to trade
on the Kenyan exporters within East African Community. The study recommends that
similar studies be carried out in neighboring countries like Uganda, Tanzania, and
Rwanda so as to have a better understanding of the trade barriers that exporters from the
EAC region face, and this will help policy makers formulate better recommendations.

63
REFERENCES
Abegaz, M. 2008. “Mobilizing Aid for Trade for SPS-related Technical Cooperation in
East Africa: SPS
Adams, G., & Schvaneveldt, J. (1991). Understanding Research Methods. (2nd Ed). New
York: Longman Arusha, Tanzania: East African Community Secretariat.
African Development Bank (ADF, 2012). Non-Tariff Barriers. African Development
Bank
ASEAN (2010). Non-Tariff Barriers. ASEAN. Association of Southeast Asian Nations,
2010.
Ayoki, M. (2007). “Strengthening South-South Cooperation amongst East African
Community Member States.” Report prepared for United Nations Development
Programme.
Balance Sheet for Uganda.” Unpublished report presented at WTO, World Bank, FAO,
WHO workshop on mobilizing aid for trade, Kampala, May 28–29.
Beghin, J. (2006). Non Tariff Barrier. Ames, Iowa: Center for Agricultural and Rural
Development, Iowa State University.
Challenges.” In Accelerating Africa’s Development Five Years into the 21st Century,
AfDB Publication: 206-246.
COMESA. (2009). How to Eliminate Non Tariff Barriers to Trade in the East and South
African Region. Johannesburg - South Africa: COMESA-SADC-EAC.
Cooper, D. R. & Schindler, P. S. (2008). Business research methods (7th
Ed.). Boston:
McGraw-Hill Irwin.
Cooper, D.R., & Schindler, P.S. (2000). Business Research Methods, 7th Edition.
McGraw-Hill International Edition.
Denscombe, M. (2006). Good Research Guide for Small Scale Social Research Projects.
Nairobi: Open University Press
EABC (East African Business Council), 2005. A Study on non-tariff Barriers (NTBs) and
development of a business climate index in the East Africa Region. March
2005.
EAC (East Africa Community). 2009. about East Africa Community.
<http://www.eac.int/about-eac.html>.
East African Business Council (EABC, 2005). A Study on Non-Tariff Barriers (NTBs)
and Development of a Business Climate Index in the East Africa Region. March.

64
East African Business Council (EABC 2004). Protocol on the Establishment of the East
African Community Customs Union.
East African Business Council (EABC, 2008). “The Business Climate Index Survey.”
The Steadman Group, Riverside Drive, Nairobi, October.
East African Business Council (EABC, 2009). EAC Time-Bound Programme for
Elimination of Identified Non- Tariffs Barriers. EAC Secretariat, Arusha,
Tanzania.
East African Community Secretariat-East African Business Council (EAC-EABC). 2006.
“Proposed Mechanism of the Elimination of Non-tariff Barriers in EAC.” Arusha,
Tanzania.
East African Community. (2004) Protocol on the Establishment of the East African
Community Customs Union. Arusha, Tanzania: East African Community
Secretariat.
East African Community. (1999). Protocol on the establishment of the East African
Customs Union. Arusha, Tanzania: East African Community Secretariat.
East African Community. (2000) The second EAC development strategy 2001-2005.
Arusha, Tanzania: East African Community Secretariat.
East African Community. (2000). Treaty establishing the East African Community.
Arusha, Tanzania: East African Community Secretariat.
East African Community. (2005). East African Community Customs Union: Common
external tariff.
East African Community. (2007). The East African Community trade report. Arusha,
Tanzania: East African Community Secretariat.
East African Community. (April 2008). Progress of implementation of the EAC council
decisions and directives related to common market operations as at end of
February 2008. Arusha, Tanzania: East African Community Secretariat.
EPRC. (2001). Final draft of the evaluation report of the implementation of the EAC
cooperation development strategy 1997-2000. Arusha, Tanzania: East African
Community Secretariat.
Everist Mugisa, Onyango, Chris and Mugoya, Patrick, March 2009, “An Evolution and
the Implementation and Impact of the EAC Customs Union”, A Study
Commissioned by the Directorate of Customs and Trade of the EAC Secretariat,
The East African Community (EAC), 2009.

65
Fliess, B. and I. Lejarraga (2005), "Analysis of Non-tariff Barriers of Concern to
Developing Countries," OECD Trade Policy Working Paper, No. 16, OECD,
Paris.
Hangi, M. (2010). The Non-Tariff Barriers in Trading Within the East Africn Community.
Nairobi: Economic and Social Research Foundation.
Ihiga, S. (2007). A Survey of Non-Tariff Barriers that Affect Kenyan Impoets and
Exporters within EAC and COMESA Caountries. Nairobi: Trade and Investment
Consortium.
International Food Policy Research Institute. IFPRI (2008). “Review of East African
Grain Trade.” Washington DC
Karugia, J., Gbegbelegbe, S., Nzuma, J., Massawe, S., Freeman, A., Bahiigwa, G.,
Berisha- Krasniqi, V., Bouet, A., Dimaranan, B., Mevel, S. and Roy, D.
2009. Assessment of the potential impact of adopting a common external
tariff (CET) by COMESA. Project report submitted to COMESA, electronic
copy.
Karugia, J., Wanjiku, J., Nzuma, J., Macharia, E., Stella, M., Freeman, A., et al. (2010).
Encouraging Regional Trade; The impact of non-tariff barriers on maize and beef
trade in East Africa*. Nairobi: Regional Strategic Analysis and Knowlwdge
Support System, International Livestock Research Institute.
Kee, Hiau Looi, Alessandro Nicita and Marcelo Olarreaga. 2006. “Estimating Trade
Restrictiveness Indices.” Policy Research Working Paper no. 3840, World
Bank, Washington, DC.
Kenya Revenue Authority. 2004. “Time Release Study: Kenya”. 56p.
http://www.kra.go.ke/knowledgemanagement/pdf/other/Kenya
Kimenyi, F. 2008. Rwanda: Country Welcomes Kenyan Decision to Reduce Number of
Weighbridges. The New Times (Kigali), 11 August 2008.
<http://allafrica.com/stories/200808110597.html>.
Kirk, R. (2010). Addressing Trade Restrictive Non-Tariff Measures on Goods Trade in
the East African Community.
Lewis, P Thornhill., A & Saunders, N (2005). Business Research Methods. New York:
McGraw Hill.
Little, P.D. 2007. Unofficial cross-border trade in Eastern Africa. Presented at the FAO
workshop on “Staple food trade and market policy options for promoting
development in Eastern and Southern Africa,” FAO, Rome, March 2007.

66
Low, P., Mchumo, Z., and Muyambo, V. (2009), “Africa in the World Trading System:
Prospects and Challenges.” In Accelerating Africa’s Development Five Years into
the 21st Century, AfDB Publication: 206-246
Maylor, H., & Blackmon, K. (2005). Researching Business and Management. Boston:
MacMillan.
Merriam, S. (2003). Qualitative Research in Practice: Examples for Discussion and
Analysis. Jossey-Bass, A Wiley Company.
Michalopoulos, Constantine. 2006.“Trade Policy and Market Access Issues for
Developing Countries.” Policy Research Working Paper, World Bank,
Washington, DC (October).
Mmasi, J and Ihiga, S. (2007). A Survey of Non-Tariff Barriers that Affect Tanzanian
Imports and Exports within EAC, SADC, and COMESA Countries.
http://ntb.africonnect.com/media/tanzania.pdf>
Mmasi, J and Ihiga, S. 2007. A survey of non-tariff barriers that affect Tanzanian imports
and exports within EAC, SADC, and COMESA countries.
<http://ntb.africonnect.com/media/tanzania.pdf>.
Mold, Andrew. 2005. “Non-Tariff Barriers–Their Prevalence and Relevance for African
Countries.” ATPC Work in Progress No. 25, Economic Commission for
Africa, Addis Ababa.
Mugenda, O. M., & Mugenda, A. G. (2003). Research methods: Quantitative and
qualitative approaches. Nairobi: Laba graphics services.
Mugisa,E., Onyango, C., and Mugoya, P.(2009). “An Evolution and the Implementation
and Impact of the EAC Customs Union”, A Study Commissioned by the
Directorate of Customs nad Trade of the EAC Secretariat, The East African
Community (EAC), 2009.
Mutambara, T.E. (2009). Regional Transport Challenges with SADC and their
Complications for Economic Integration and Developments. Contemporary
African Studies, 27 (4)
Nakra, P. (2006). Beware of Non-Tariff Barriers in Global Markets.
Nogueira, L. 2008. Non-tariff barriers and technology: Trade and welfare implications:
Washington State University, Dissertation. <http://www.ilr1.uni-
bonn.de/iatrc/Dissertation_Nogueira.pdf>.

67
Nzuma, J.M. 2007. An Economic analysis of the impacts of trade liberalization on
Kenya’s maize sector. University of Guelph, Canada, Unpublished PhD
Thesis.
Okumu, L,. (2010). Non Tariff Barriers in EAC Customs Union Implication for Trade
between Uganda and other EAC Countries. Economic Policy Research Center.
Okumu, L., & Nyankori, O. J. (2010). Non-Tariff Barriers in EAC Customs Union:
Implications For Trade between Uganda and other EAC Countries. Kampala
Uganda: Economic Policy Research Center.
Okumu, L., & Okuk, N. (2011). Non-Tariff Barriers in EAC Customs Union: Implications
for Trade Between Uganda and Other EAC Countries. Kampala- Uganda:
Economic Policy Research Center.
Pearson, M. 2006. “Enhancing African Regional Integration: Trade Policy and Trade
Facilitation.” Presentation to the World Bank Course on Regional
Integration in Africa and Economic Partnership Agreements, Nairobi, May 22–4.
Pedersen, P. O., 2006, Freight transport under globalization and its impact on Africa,
Journal of Transport Geography 9(2):85-99.
Raman, V. 2006. “Transport and Trade Facilitation in Uganda.” Background paper for the
Uganda Diagnostic Trade Integration Study, World Bank, Washington,
DC.
Rizet C and Hine, J. (2004), “A Comparison of the Costs and Productivity of Road
Freight Transport in Africa and Pakistan”, Transport Reviews, Vol 13,
No.2.
Sarfati, G. (1998). European Industrial Policy as a Non-tariff Barrier. European
Integration Online Papers (EIOP), 2(2).
Saunders, M., Lewis, P., & Thornhill, A. (2009). Research Methods for Business
Students. Boston: Prentice Hall.
Schindler, D. R. (2001). Business Research Methods. New York: McGraw Hill.
Schindler, P. S., & Cooper, D. R. (2003). Business Research Methods. Singapore:
McGraw- Hill.
Southern African Development Community (2006), Towards a Common Market.
http://www.sadc.int/fta/
Stephen N. Karingi and Fekadu, Belay (2009), “Beyond Political Rhetoric – The Meaning
of the Eastern and Southern Africa FTA”, A Report for United Nations Economic

68
Commission for Africa (UNECA), presented at the Twelfth Annual Conference on
Global Economic Analysis, Santiago, Chile
The East African Community (EAC) Facts and Figures report, (2009)
Walter Odhiambo, (2010), “The Distribution of Benefits and Costs in the Regional
Integration: Implications on Future Integration Process in the EAC”, A Draft
Report to Society for International Development (SID), Nairobi, Kenya.
World Bank 2007c. Kenya: Unleashing the Potential for Trade and Growth. Report No:
37688- KE.DTIS.
World Bank 2009. East Africa Trade Facilitation Project” Project Appraisal Document,
Report No: 34178- AFR.
World Bank, (2008), “Non-Tariff Measures on Goods Trade in the East African
Community”, An African Region Synthesis Report, Prepared by the East African
Community and Member governments of Burundi, Rwanda, Kenya, Tanzania and
Uganda.
World Bank. 2007. Standards and Global Trade: A Voice for Africa. Washington, DC:
World Bank.
WTO (World Trade Organization). 2000a. “Trade Policy Review: Kenya.” Report by the
Secretariat. Geneva: World Trade Organization.
WTO (World Trade Organization). 2001. “Trade Policy Review: Uganda.” Report by the
Secretariat. Geneva: World Trade Organization.
WTO (World Trade Organization). 2006b. “Technical Barriers to Trade–The Problem.”
Geneva: World Trade Organization.
http://www.wto.org/english/thewto_e/whatis_e/eol/wto03/wto3_3.htm

69
APPENDICES
APPENDIX A: TIME SCHEDULE
Week
1
Week
2
Week
3
Week
4
Week
5
Week
6
Week
7
Week
8
Week
9
Proposal
writing
Data
collection
Data Entry
Data
analysis
Report
writing
Presentation
Binding and
production

70
APPENDIX B: BUDGET
Cost (items) Cost (Kenya
Shillings)
Proposal development- Printing and stationery 8,000
Data collection 1) Stationery and printing
2) Transport expenses
8,000
7,000
Data analysis and report 1)Printing and stationery
2) Transport
8,000
7,000
Miscellaneous 4,000
TOTAL BUDGET 42,000

71
APPENDIX C: COVER LETTER
ANYAL MICHAEL OKUTE
UNITED STATES INTERNATIONAL UNIVERSITY-AFRICA
P.O. BOX 14634, 00800.
NAIROBI
Dear Respondent,
I am carrying out research on the Technical and Non- Tariff trade barriers on the Kenyan
exporters within the East African Community. This study is a requirement for the partial
fulfillment of the Master in Business Administration in International Business (MBA)
program at the United States International University Africa (USIU-AFRICA). The
purpose of this study is to investigate the various non-tariff and technical barriers to trade
and the effects they have the Kenyan exporters within East African Community.
This study uses various stakeholders who are in the exportation business within the East
African Community, the case study from which you have been selected as one of the
lucky respondent.
This is an academic research and confidentiality is strictly emphasized, your name will
not appear anywhere in the report. Kindly spare some time to complete the questionnaire
attached.
Thank you in advance,
Yours sincerely
Anyal Michael Okute

72
APPENDIX D: SAMPLE QUESTIONNAIRE
PART I: GENERAL INFORMATION
Kindly answer all the questions either by ticking in the boxes or writing in the spaces
provided.
1. Nature of your business
Automobile
Manufacturing
Agricultural
2. Length of exporting within the EAC region
Less than 2 years
6-8 years
3-5 years
9 years and over
3. Do you encounter any trade barriers in your area of trade?
Yes No

73
Section B: Non-Tariff Barriers on Trade (NTBs)
On a scale of: (1) Strongly Agree, (2) Agree, (3) Neutral (4) Disagree and (5) Strongly
Disagree; Please tick the numeric value corresponding to your personal opinion for each
statement.
1.S
tron
gly
Agre
e
2.A
gre
e
3.N
eutr
al
4.D
isagre
e
5.S
tron
gly
Dis
agre
e
1. Documentation and Procedures
2. Too many agencies involved in overall export
inspection and certification in the region
3. Escort of all sensitive and hazardous products
through the territory of each EAC transit country
4. Verification of transit cargo
5. Lack of harmonization in working hours at the
border posts
6. Delays at weighbridges
7. Multiple police road blocks and mobile control
8. Prohibition on transportation of locally produced
goods
9. East Africa Community transit licenses for goods
10. Truck entrance fees and grace period
11. Business registration
12. Use of immigration and visa procedures
13. Poor information dissemination across the East
Africa Community
14. Language barrier
15. Insecurity/ highway crimes/loss of goods at the
container freight stations
What other Non-Tariff Barriers and Technical Barriers to Trade you are aware of?---------
------------------------------------------------------------------------------------------------------------
------------------------------------------------------------------------------------------------------------
------------------------------------------------------------------------------------------------------------

74
C: Technical Barriers to Trade (TBT)
On a scale of: (1) Strongly Agree, (2) Agree, (3) Neutral (4) Disagree and (5) Strongly
Disagree; Please tick the numeric value corresponding to your personal opinion for each
statement.
1.S
tron
gly
Agre
e
2.A
gre
e
3.N
eutr
al
4.D
isagre
e
5.S
tron
gly
Dis
agre
e
1. Technical Barriers to Trade (TBT) are agreement
deals with all technical requirements, voluntary
standards and conformity assessment procedures
2. Institutional barriers to Kenya’s trade in the EAC is
one of the categories of technical barriers to trade
3. Various Kenyan ministries, departments and
parastatals are the institutional barriers to trade
4. KRA is responsible for the enforcement and
management of the customs laws and the
administration of common external tariffs hence
causing TBT
5. Kenya Plant Health Inspectorate Service
(KEPHIS) inspects plants and issues a plant import
permit
6. Kenya Bureau of Standards (KEBS) tests and
grades the quality of goods and in process causes
barriers to trade
7. Kenya Ports Authority (KPA) manages port
charges
8. Regulatory Barriers to Trade is the second category
of technical barriers to trade
9. Customs Clearance is one of the regulatory barriers
to trade in EAC
10. Application of numerous certification and
conformity assessments
11. The rules of origin which stipulate that a good must
wholly be produced or contain imported content of
no more than 40 percent of the cost, insurance and
freight value of the materials used in production
12. The procedure for obtaining the certificate of origin
is cumbersome and lengthy, which itself is costly for
the business community
13. The variations in the procedures for obtaining
licenses and business permits across countries
What other technical barriers to trade your experience?------------------------------------------
------------------------------------------------------------------------------------------------------------

75
------------------------------------------------------------------------------------------------------------
----
Section D: Mitigating factors on Non Tariff barriers and Technical Tariff Barriers
(NTBs /TBTs)
1.H
igh
2.M
od
erate
3.L
ow
4.N
ot
Su
re
5.N
ot
at
all
1. Lessons to be borrowed from the European Union
(EU) and Association of Southeast Asian Nations
(ASEAN) for planning and minimizing policy errors
2. Harmonizing product standards and developing
mutual recognition of standards across member
countries
3. Verification of information on NTBs
4. Prioritization of products
5. Developing specific work program
6. Sector-based approach strategy to be employed to
deal with issues in specific economic and politic
sectors
7. Enhance exchange of information and views on a
range of active NTB elimination programs/projects
8. Establish a communication network between NTB
focal points
9. Establishing appropriate procedures for identifying
and eliminating NTBs
10. Member states to meet a couple of times per year and
discuss of the NTBs to be eliminated
11. EAC should invest in One-Stop-Centers and
electronic single window systems at border stations
12. Member states should review of port charges to
international levels and political goodwill to facilitate
76
On a scale of: (1) High, (2) Moderate, (3) Low (4) Not Sure and (5) Not at all; Please
indicate the level at which the below factors can mitigate NTBs and TBTs
What other mitigating factors can be applicable?--------------------------------------------------
------------------------------------------------------------------------------------------------------------
------------------------------------------------------------------------------------------------------------
------------------------------------------------------------------------------------------------------------
------------------------------------------------------------------------------------------------------------
------------------------------------------------------------------------------------------------------------
------------------------------------------------------------------------------------------------------------
------------------------------------------------------------------------------------------------------------
----------------------------------------------------------------------
THANK YOU FOR TAKING YOUR TIME TO COMPLETE THE QUESTIONNAIRE
cross-border movement of people
13. Designing effective mechanisms for identifying and
verifying information about NTBs
14. Involve the general public in the process of EAC
integration
15. Develop strategy for reducing differences and capacity
constraints
16. Invest in infrastructure
17. Apply the principle of asymmetry and promote the use
of English
18. Monitoring for new NTBs and technical barriers
(NTB/TB)