non standard tests for predict impact of crude oil quality on
TRANSCRIPT

Copyright 2003 Baker Hughes Incorporated
Non Standard Tests for Predict Impact of Crude Oil Quality
on Desalting.
Larry Kremer, Baker PetroliteCrude Oil Quality Group
May 29, 2003
This presentation contains the proprietary information of Baker Petrolite Corporation. By reading this presentation, the reader agrees not to disclose any information contained in the presentation without the prior written consent of Baker Petrolite Corporation, and that the use of the information contained in this presentation is subject to the provisions contained in the Legal Notice included with this Slide Program.

Copyright 2003 Baker Hughes Incorporated
Outline
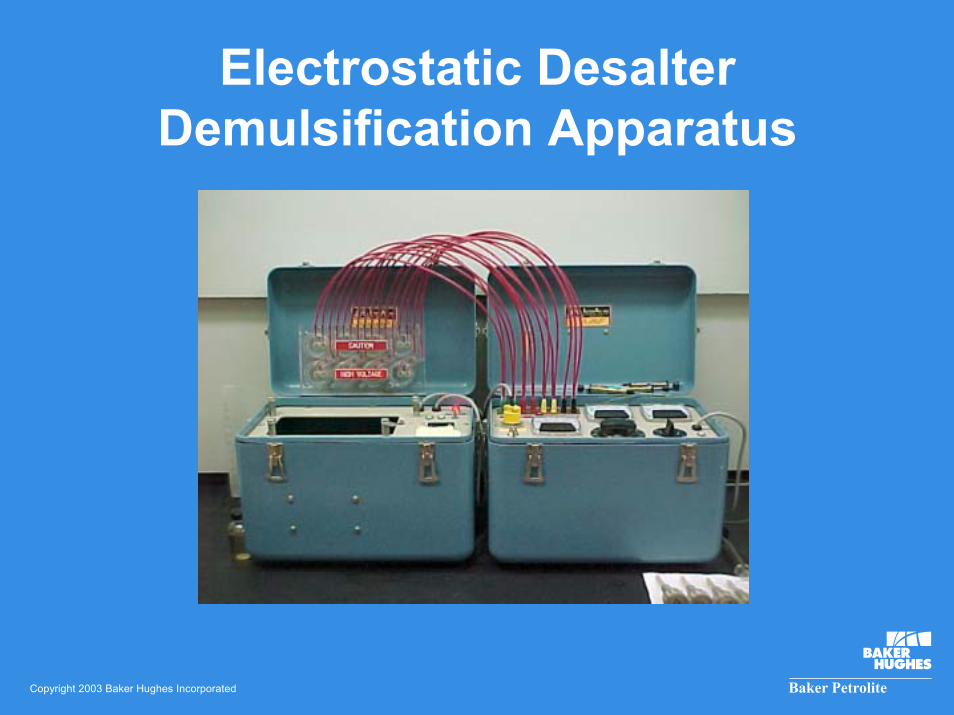
� Introduction� Electrostatic Desalter Demulsification
Apparatus (EDDA)� Filterable solids� Asphaltene Stability Index Test (ASIT)

Copyright 2003 Baker Hughes Incorporated
Problem with Standard Tests
� Full crude assay� Gravity, %S, %N, SARA, etc.� Does not predict how crude will perform in a
desalter.� Daily variation
� BS&W� Salt in crude
� Refineries normally run blends of crudes
Copyright 2003 Baker Hughes Incorporated
Electrostatic Desalter Demulsification Apparatus

Copyright 2003 Baker Hughes Incorporated
Canadian Crude Refinery(3, 5, 7, 9% wash water)
Water Drop Rate for Different %Wash Water in Crude#1
0
1
2
3
4
5
6
7
8
9
0 5 10 15 20 25 30 35
Electrostatic Demulsification Dehydration Time (min.)
% w
ater
dro
p

Copyright 2003 Baker Hughes Incorporated
Filterable Solids
� Can be measured by ASTM D 4807-88� Washed with toluene to solubilize
asphaltenes� Filtered through 0.45mm filter
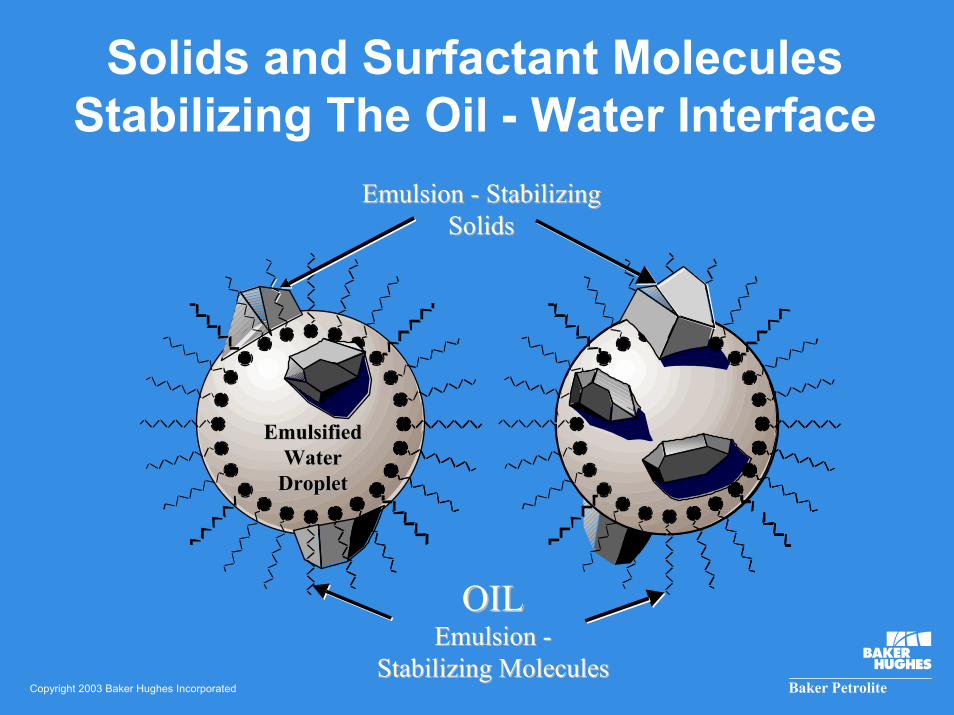
� Solids are known to stabilize emulsions� Logan C Waterman -1965� Wasan� Masliyah

Copyright 2003 Baker Hughes Incorporated
Filterable Solids of Selected Crude Oils
CRUDE OIL TYPICAL RANGE HIGH VALUE
Lloydminster 50-150PTB 280
SJV 50-200 800
ANS 25-50 115

Copyright 2003 Baker Hughes Incorporated
Typical Solids Analysis
� Iron Oxide and Iron Sulfide� Sand� Clay� Silt� Scale

Copyright 2003 Baker Hughes Incorporated
Solids Stabilized Emulsion5% Wash Water Added
100 X
Copyright 2003 Baker Hughes Incorporated
Solids and Surfactant MoleculesStabilizing The Oil - Water Interface
EmulsifiedEmulsifiedWaterWater
DropletDroplet
Emulsion Emulsion -- StabilizingStabilizingSolidsSolids
OILOILEmulsion Emulsion --
Stabilizing MoleculesStabilizing Molecules

Copyright 2003 Baker Hughes Incorporated
PTB

Copyright 2003 Baker Hughes Incorporated

Copyright 2003 Baker Hughes Incorporated
Asphaltene Stabilized Emulsions
� Asphaltenes exist as a cross linked network at the oil-water interface� Asphaltene networks form strong interfacial
films stabilizing the emulsion� Asphaltenes at their limit of solubility in
the oil form the most stable emulsions� Predicting asphaltene stability may help
improve desalting operations

Copyright 2003 Baker Hughes Incorporated
Stability Indicators
� Asphaltene to Resin ratio, Saturate to Aromatic ratio� A/R ratio > 0.35 indicates oil has propensity to
asphaltene destabilization� Generally, do not mix high S/A oil with low S/A oil
� Spot tests� Single solvent spot tests, mixed solvent spot tests,
microscope investigations� ASITSM asphaltene stability index test

Copyright 2003 Baker Hughes Incorporated
0.00
10.00
20.00
30.00
40.00
50.00
60.00
70.00
0.00 0.50 1.00 1.50 2.00 2.50 3.00
Crude #1Crude #2Crude #3Crude #4Crude #4 + Additive
Additives can greatlyincrease the stability
of an oil
ASITSM
Asphaltene Stability Index TestIn
tens
ity
ASI

Copyright 2003 Baker Hughes Incorporated
ASITSM
Asphaltene Stability Index Test
� Used to determine stability of crude oil with regard to asphaltene stability
� Uses NIR laser to detect asphaltene precipitation in petroleum fluids
� Titration technique with non-solvent� Stability based on field correlated results� Gives qualitative information on rate of
fouling

Copyright 2003 Baker Hughes Incorporated
Case History 3
� Introduction of Crude 9 at 50% of normal crude feed resulting in formation of an unusual rag layer & level control problems in preflash tower� Foaming was determined to be the cause of
the level control problems of preflash tower� Blending Crude 9 with other crude oils
resulted in poor desalting and an increase in BS&W

Copyright 2003 Baker Hughes Incorporated
# Oil / Blend ASI 9 Crude 9 1.36
10 Crude 10 1.89 13 80% (Crude 9) 20% (Crude 10) 1.38 14 60% (Crude 9) 40% (Crude 10) 1.48 15 40% (Crude 9) 60% (Crude 10) 1.62 16 20% (Crude 9) 80% (Crude 10) 1.72
C a s e 3A S IT S M A s p h a lte n e S ta b ility In d e x T e s t
05 0
1 0 01 5 02 0 02 5 03 0 03 5 04 0 0
0 0 .5 1 1 .5 2 2 .5A S I
Inte
nsity
# 9
# 1 0
# 1 3
# 1 4
# 1 5
# 1 6

Copyright 2003 Baker Hughes Incorporated
# Oil / Blend ASI 9 Crude 9 1.36
11 Crude 11 1.03 17 84%(Crude 9) 16% (Crude 11) 1.09
Case 3 ASITSM Asphaltene Stability Index Test
0
100
200
300
400
500
600
0 0.5 1 1.5 2ASI
Inte
nsity
# 9# 11# 17# 17 & Additive

Copyright 2003 Baker Hughes Incorporated
EDDA Demulsification Test
0
0.5
1
1.5
2
2.5
3
3.5
4
4.5
# 17 # 17 & AsphalteneStaiblizer
# 17, Stabilizer &Demulsifier
Total Wash Water Added = 5%
% W
ater
Dro
p
0
0.1
0.2
0.3
0.4
0.5
0.6
0.7
BS&
W %
Water Drop 5 minWater Drop 10 minBS&W

Copyright 2003 Baker Hughes Incorporated
Outcome of Case History 3
� Crude 9 was reduced to 40% or less of the normal feed
� Additives containing asphaltene stabilizers were added to Crude 9 as it was transferred to tank storage
� Addition of asphaltene stabilizer allows refinery to run 85% crude 9 without problems
� Demulsifier program was changed� Asphaltenes destabilization believed to be
contributing cause of foaming in preflash tower� Defoamer injected into feed of preflash tower

Copyright 2003 Baker Hughes Incorporated
Conclusions
� ASITSM asphaltene stability index test, Filterable Solids & Electrostatic desalter dehydration apparatus (EDDA) testing are predictive tools for desalting operations� Used to optimize blending strategies &
indicate problematic blends� Sensitive to small changes in blend
components� Filterable solids are useful in monitoring
batch to batch variation in crude quality.