non line of sight operation and optimizations to improve … · 2018-10-03 · optimized settings...
TRANSCRIPT
© Decawave 2014 This document is confidential and contains information which is proprietary to Decawave Limited. No reproduction is permitted without prior express written permission of the author
APS006 PART 2 APPLICATION NOTE
NON LINE OF SIGHT OPERATION AND OPTIMIZATIONS TO IMPROVE PERFORMANCE IN DW1000 BASED SYSTEMS
Version 1.5
This document is subject to change without notice

APS006 Part 2
© Decawave 2014 This document is confidential and contains information which is proprietary to Decawave Limited. No reproduction is permitted without prior express written permission of the author Page 2 of 31
Table of Contents
LIST OF FIGURES ........................................................................................................................................................... 2
LIST OF TABLES ............................................................................................................................................................. 3
1 INTRODUCTION ..................................................................................................................................................... 4
2 EXECUTIVE SUMMARY .......................................................................................................................................... 5
3 NON LINE OF SIGHT SCENARIOS ............................................................................................................................ 6
4 NON LINE OF SIGHT AND THE DW1000 ................................................................................................................. 7
5 OPTIMIZING DW1000 PERFORMANCE FOR NLOS OPERATION .............................................................................. 9
5.1 CHANGING PREAMBLE LENGTH ..................................................................................................................................... 9 5.2 ADJUST RECEIVER DETECTION THRESHOLD ..................................................................................................................... 11 5.3 OVER-ADJUSTING THE RECEIVER DETECTION THRESHOLD .................................................................................................. 14 5.4 COMBINATION OF EXTENDING PREAMBLE LENGTH AND LOWERING OF RECEIVER THRESHOLDS ................................................. 14 5.5 OPTIMIZED SETTINGS FOR LOS AND NLOS CONFIGURATION ............................................................................................ 16
6 WORKED EXAMPLES OF OPTIMISING DW1000 PERFORMANCE FOR NLOS OPERATION .......................................17
6.1 DIRECT PATH THROUGH AIR WITH NO OBSTRUCTION ....................................................................................................... 17 6.2 DIRECT PATH THROUGH TWO WALLS ............................................................................................................................ 18 6.3 THROUGH CONCRETE WALL WITH REFLECTION ............................................................................................................... 19 6.4 THROUGH TWO WALLS WITH REFLECTION ..................................................................................................................... 20 6.5 DIRECT PATH THROUGH PERSON WITH REFLECTION FROM A VEHICLE .................................................................................. 23 6.6 DIRECT PATH THROUGH PERSON WITH REFLECTION FROM A WALL ...................................................................................... 24 6.7 DIRECT PATH THROUGH PERSON WITH NO REFLECTION .................................................................................................... 25
7 APPENDIX 1: TABLE OF RECEIVED SIGNAL POWERS .............................................................................................27
8 APPENDIX 2: REGISTER SETTINGS FOR NLOS OPTIMIZATION ...............................................................................28
8.1 NTM_1 (NSTDEV) SETTING ..................................................................................................................................... 28 8.2 NTM_2 SETTING ..................................................................................................................................................... 28
9 GLOSSARY ............................................................................................................................................................29
10 REFERENCES .....................................................................................................................................................30
11 DOCUMENT HISTORY .......................................................................................................................................30
12 MAJOR CHANGES .............................................................................................................................................30
13 FURTHER INFORMATION ..................................................................................................................................31
List of Figures
FIGURE 1: NLOS SCENARIO SHOWING RANGE IMPROVEMENT WITH CONFIGURATION CHANGES ................................................................ 5 FIGURE 2: NLOS WITH DIRECT PATH AND SINGLE REFLECTED PATH ...................................................................................................... 6 FIGURE 3: NLOS WITH ONLY REFLECTED PATH................................................................................................................................. 6 FIGURE 4: DW1000 CHANNEL IMPULSE RESPONSE VIEW FOR MULTIPATH ............................................................................................ 7 FIGURE 5: EFFECT OF DECREASING FIRST PATH AMPLITUDE ................................................................................................................. 7 FIGURE 6: OVERVIEW OF MULTIPATH OPERATION OF THE DW1000. ................................................................................................... 8 FIGURE 7: INCREASING THE PREAMBLE LENGTH TO "GROW" THE FIRST PATH ......................................................................................... 9 FIGURE 8: MULTIPATH WITH PREAMBLE LENGTH OF 128 ................................................................................................................. 10 FIGURE 9: MULTIPATH WITH PREAMBLE LENGTH OF 1024 ............................................................................................................... 10 FIGURE 10: EFFECT OF CHANGING THE RECEIVER THRESHOLD ........................................................................................................... 11 FIGURE 11: MULTIPATH WITH THRESHOLDS NTM_1 OF 13 AND NTM_2 OF 7 .................................................................................. 12 FIGURE 12: MULTIPATH WITH THRESHOLDS NTM_1 OF 7 AND NTM_2 OF 3 .................................................................................... 12

APS006 Part 2
© Decawave 2014 This document is confidential and contains information which is proprietary to Decawave Limited. No reproduction is permitted without prior express written permission of the author Page 3 of 31
FIGURE 13: SETTING A RECEIVER THRESHOLD WHICH CAUSES FALSE TRIGGERING ON NOISE ..................................................................... 14 FIGURE 14: COMBINED PERFORMANCE WITH PL OF 1024 AND THRESHOLDS REDUCED. ........................................................................ 15 FIGURE 15: PATH LOSS IN FREE SPACE AS GIVEN BY FRIIS' EQUATION ................................................................................................. 17 FIGURE 16: DIRECT PATH WITH OBSTRUCTIONS ............................................................................................................................. 18 FIGURE 17: NLOS THROUGH A SOLID CEMENT WALL WITH A REFLECTION ........................................................................................... 19 FIGURE 18: NON LINE OF SIGHT, AROUND A CORNER SCENARIO. ....................................................................................................... 20 FIGURE 19: PLOT OF RESULTS FOR PRACTICAL TESTING OF THE AROUND THE CORNER SCENARIO .............................................................. 20 FIGURE 20: EXTRAPOLATION OF THE TEST RESULTS WHEN APPLYING NEW THRESHOLD SETTINGS.............................................................. 22 FIGURE 21: IMPROVEMENT IN DIRECT PATH RANGE ........................................................................................................................ 22 FIGURE 22: NLOS WITH PERSON AND TWO CARS ........................................................................................................................... 23 FIGURE 23: NLOS SCENARIO WITH PERSON, CAR AND WALL. ........................................................................................................... 24 FIGURE 24: NLOS SCENARIO WITHOUT REFLECTIONS. .................................................................................................................... 25
List of Tables
TABLE 1: SUMMARY OF OPTIMIZED LOS AND NLOS SETTINGS ......................................................................................................... 16 TABLE 2: EFFECT OF CHANGING NOISE THRESHOLD MULTIPLIER ......................................................................................................... 16 TABLE 3: TABLE OF REFERENCES ................................................................................................................................................ 30 TABLE 4: DOCUMENT HISTORY ................................................................................................................................................... 30

APS006 Part 2
© Decawave 2014 This document is confidential and contains information which is proprietary to Decawave Limited. No reproduction is permitted without prior express written permission of the author Page 4 of 31
1 Introduction
This is one of a library of application notes dealing with the operation, performance and application of Decawave’s UWB technology. This application note is concerned with explaining how Decawave’s UWB products receive and handle signals when obstructions impair the direct path. Furthermore it outlines chip configuration options that can be used by the system implementer to optimize the performance of Decawave’s UWB products in these environments. This application note assumes the reader has some understanding of radio wave propagation and has already read Decawave's application note APS006 Part 1 [3]. A basic understanding of the operation of Decawave's DW1000 will also help your understanding. Further details on Decawave’s DW1000 and our other products as well as a library of other application notes are available on www.Decawave.com.

APS006 Part 2
© Decawave 2014 This document is confidential and contains information which is proprietary to Decawave Limited. No reproduction is permitted without prior express written permission of the author Page 5 of 31
2 Executive Summary
Evaluation of wireless systems is normally initially carried out in line of sight conditions, where the effect of obstructions and reflections to the radio frequency propagation, are ignored. However most products are deployed in real world situations where obstructions and reflections exist. Having considered the performance of the DW1000 in different propagation scenarios, we can present optimized settings for operation in line of sight (LOS) and non line of sight (NLOS) scenarios. These are discussed in detail in later sections of this document. Figure 1 shows one example where the range can be improved by using the NLOS configuration settings. This scenario was investigated in the hallway of an office building. It involves a transmitting node, node 1 which has a direct path to the receiving node, node 2, through two of the building’s internal walls. Using the settings optimized for LOS will give a direct path range of 10 meters, for measurement. With the NLOS optimized settings this can be increased up to 30 meters.
10 m
30 m
Node 1
Node 2 Node 2
DW1000 configured
with the default LOS
optimized settings.
DW1000 configured
with NLOS optimized
settings.
Figure 1: NLOS scenario showing range improvement with configuration changes
There are trade-offs to be considered when using the NLOS optimized settings and these will be discussed in later sections of this document.

APS006 Part 2
© Decawave 2014 This document is confidential and contains information which is proprietary to Decawave Limited. No reproduction is permitted without prior express written permission of the author Page 6 of 31
3 Non Line of Sight Scenarios
There are many different non line of sight (NLOS) scenarios, involving people, walls, animals, vehicles etc. To allow us to do analysis for this application note we have taken two specific cases, which are reasonably representative of radio frequency propagation in NLOS conditions. The first, shown in Figure 2 below, describes a situation where the direct path between the transmitter and receiver is impaired due to the presence of an obstruction. A single reflected path is also shown.
A1 A2
d
NODE 2
Direct path
Reflection
Obstruction
NODE 1
Figure 2: NLOS with direct path and single reflected path
When the obstruction becomes physically bigger, or more reflective, like that shown in Figure 3, the direct path can be totally attenuated, or totally blocked, such that only reflected paths are received at the receiver. In this case there is no direct path present at the receiver.
A1 A2
d
NODE 2
Direct path
Reflection
Obstruction
NODE 1
Figure 3: NLOS with only reflected path.

APS006 Part 2
© Decawave 2014 This document is confidential and contains information which is proprietary to Decawave Limited. No reproduction is permitted without prior express written permission of the author Page 7 of 31
4 Non Line of Sight and the DW1000
From the DW1000's perspective its reception of transmissions in the scenario described by Figure 2, is shown as a representation of the DW1000's channel impulse response, in Figure 4. The first peak shown is the first path which corresponds to the heavily attenuated direct path, from Figure 2. The second peak is the larger amplitude first reflection. It can be seen arriving at the DW1000 some-time after the direct path arrives.
.
First PathFirst
Reflection
Figure 4: DW1000 channel impulse response view for multipath
Should the direct path become increasingly attenuated, and eventually so attenuated that the DW1000 only detects the reflected signal, the reported range will no longer be the distance travelled by the direct path signal, but instead it will report the distance travelled by the reflected signal. This scenario can be seen in Figure 5. The x-axis shows a decreasing first path level (traveling from right to left on the x-axis), received by the DW1000. At a first path receive signal level of -104 dBm to -106 dBm, the probability of the DW1000 detecting the first path starts to decrease. The DW1000 increasingly reports the TOF of the first reflection instead of the first path. At a first path receive signal level of about -108 dBm the DW1000 stops reporting the TOF of the first path and instead reports the TOF of the first reflection only.
First Path Level(dBm)
Probability of
DW1000
finding first
path
-94-98-102-104-106-108-110-112
80%
90%
100%
-96-100
Reflected
Range
Reported
First Path
Range
Reported
70%
60%
50%
40%
30%
20%
10%
0%
Figure 5: Effect of decreasing first path amplitude
To summarize the concepts presented in the previous pages, Figure 6 shows a review of the operation of the DW1000 when the direct path is impaired and a single reflection is present.

APS006 Part 2
© Decawave 2014 This document is confidential and contains information which is proprietary to Decawave Limited. No reproduction is permitted without prior express written permission of the author Page 8 of 31
A1 A2
d
NODE 2
Direct path
Reflection
Obstruction
NODE 1
Fig: A NLOS with single reflection
Fig: B NLOS with single reflection in DW1000 Accumulator
Fig: C. DW1000 performance for NLOS with single reflection
Fig: A. Shows a diagram of a transmitter and receiver where the direct Line of
sight has an obstruction in its path. A single reflection is also shown.
Fig: B. This shows the DW1000 channel impulse response . The first path
corresponds with the direct path while the first reflection corresponds with the
reflection shown in figure A.
Fig: C. The x-axis shows a decreasing first path level (traveling from right to
left on the x-axis), received by the DW1000. At a first path receive signal level
of -104 dBm to -106 dBm, the probability of the DW1000 detecting the first
path starts to decrease. The DW1000 increasingly reports the TOF of the first
reflection instead of the first path. At a first path receive signal level of about
-108 dBm the DW1000 stops reporting the TOF of the first path and instead
reports the TOF of the first reflection only.
First PathFirst
Reflection
First Path Level(dBm)
Probability of
DW1000
finding first
path
-94-98-102-104-106-108-110-112
80%
90%
100%
-96-100
Reflected
Range
Reported
First Path
Range
Reported
70%
60%
50%
40%
30%
20%
10%
0%
Figure 6: Overview of multipath operation of the DW1000.

APS006 Part 2
© Decawave 2014 This document is confidential and contains information which is proprietary to Decawave Limited. No reproduction is permitted without prior express written permission of the author
Page 9 of 31
5 Optimizing DW1000 Performance for NLOS Operation
The DW1000 is configured for optimized LOS operation by default. However there are configuration changes that can be made to the DW1000 to allow improved performance in NLOS conditions.
5.1 Changing Preamble Length
Figure 7 shows the effect of increasing the preamble length (PL), in the scenario where we have a weak first path, in the presence of reflections with a higher level. For a given preamble length the diagram shows the peak of the first path not reaching the receiver threshold ( LDE threshold ). In this situation the first reflection will be detected, incorrectly as the first path. Increasing the preamble has the effect of "growing" the first path, increasing the likelihood that the first path is correctly detected. However it is important to point out that it is the presence of the first reflection that makes this operation possible. Before the first path emerges from the noise floor, the presence of the first reflection ensures the DW1000 receives preamble symbols and continues to detect these preamble symbols allowing time for the first path to emerge from the noise. In the absence of the reflection, the DW1000 would fail to receive preamble symbols and not receive the transmitted frame.
First PathFirst
Reflection
First Path
With Increasing
Preamble Length
Receiver
(LDE
Threshold)
Figure 7: Increasing the Preamble length to "grow" the first path
To quantify what can be achieved, in this scenario, by increasing the preamble length, simulations and practical tests have been performed to quantify the performance of the DW1000. Figure 8 and Figure 9 show the effect of changing the preamble length from 128 symbols to 1024 symbols. Looking at Figure 8, the legend on the top left corresponds to the received signal level of the first reflection. The x-axis gives the level of the first path at the DW1000 receiver, and the y-axis shows the probability of the DW1000 finding the direct path. From Figure 8 it can be seen that, depending on the level of the first reflection, the level of the direct path can drop until the probability of the DW1000 finding the direct path reduces significantly. So for example when the first reflection power is -96 dBm, the direct path can drop to -104 dBm (point circled in the diagram) before the probability of the DW1000 finding the direct path reduces below 90%. From Figure 9 we can see that when the preamble length is increased to 1024 symbols, then the direct path level can drop to about -111 dBm (point circled in the diagram) until the probability of the DW1000 finding the first path reduces significantly, for a first reflected level of -96 dBm. This is an effective improvement of 7 dB in NLOS direct path detection range, for the NLOS situation described.

APS006 Part 2
© Decawave 2014 This document is confidential and contains information which is proprietary to Decawave Limited. No reproduction is permitted without prior express written permission of the author
Page 10 of 31
Note: Other parameters used for the diagrams in Figure 8 and Figure 9 are shown as a PRF (Pulse repetition frequency) of 16 MHz, data rate of 850 kbits/s and a CFO (carrier frequency offset) between the transmitter and receiver crystal or TCXO of 20 ppm.
Figure 8: Multipath with preamble length of 128
Figure 9: Multipath with preamble length of 1024
It can be concluded from the results presented above that the presence of the first reflection assists the operation of the DW1000 in detecting the direct path by increasing the direct path sensitivity in NLOS conditions. It can also be clearly seen that the level of the reflection determines the scale of its contribution in this case. A lower reflected signal power gives a greater contribution, whereas a higher reflected signal power gives a lower contribution.
-120 -115 -110 -105 -100 -950
10
20
30
40
50
60
70
80
90
100P
robabili
ty o
f F
indin
g D
irect
Path
(%
)
Direct Path (dBm)
PRF 16MHz, Data 850kbps, PL 128, CFO 20ppm
-96 dBm
-90 dBm
-80 dBm
-69 dBm
-120 -115 -110 -105 -100 -950
10
20
30
40
50
60
70
80
90
100
Pro
babili
ty o
f F
indin
g D
irect
Path
(%
)
Direct Path (dBm)
PRF 16MHz, Data 850kbps, PL 1024, CFO 20ppm
-96 dBm
-90 dBm
-80 dBm
-69 dBm
Level of the first reflected signal.
Improvement achieved

APS006 Part 2
© Decawave 2014 This document is confidential and contains information which is proprietary to Decawave Limited. No reproduction is permitted without prior express written permission of the author
Page 11 of 31
5.2 Adjust receiver detection threshold
Figure 10 shows the concept of changing the receiver threshold. For threshold option 2 the first path is not detected. But for threshold option 1 the first path is detected.
First PathFirst
Reflection
Receiver
Threshold
Option 1
Receiver
Threshold
Option 2
Figure 10: Effect of changing the receiver threshold
There are two settings in the DW1000 that can be configured to set a threshold which will avoid false first path detection, due to the presence of noise, but also allow for optimum direct path detection. To quantify what can be achieved in this scenario, by lowering the receiver threshold, simulations and practical tests have been carried out to illustrate the performance of the DW1000. The receiver threshold in the DW1000 is controlled by changing the NTM_1 (noise threshold multiplier) and NTM_2 settings (see Appendix 2 for details on changing these settings). Figure 11 and Figure 12 show the effect of changing the receiver thresholds from an NTM_1 of 13 and an NTM_2 of 7 to an NTM_1 of 7 and an NTM_2 of 3. Looking at Figure 11, the legend on the top left corresponds to the level of the first reflection. The x-axis gives the level of the first path at the DW1000 receiver, and the y-axis shows the probability of the DW1000 finding the direct path. From Figure 11 it can be seen that, depending on the level of the first reflection, the level of the direct path can drop until the probability of the DW1000 finding the direct path reduces significantly. So for example when the received power of the first reflection is -96 dBm, the direct path can drop to -104 dBm (point circled in the diagram) before the probability of the DW1000 finding the direct path reduces below 90%. From Figure 12 we can see that when the RECEIVER thresholds are decreased as described above, then the first path level can drop to about -109 dBm (point circled in the diagram) before the probability of the DW1000 finding the first path reduces below 90% for a first reflected level of -96 dBm. This is an improvement of 5 dB in NLOS direct path detection range. Note: Other parameters used for the diagrams in Figure 11 and Figure 12 are shown as a PRF (Pulse repetition frequency) of 16 MHz, data rate of 850 kbits/s and a CFO (carrier frequency offset) between

APS006 Part 2
© Decawave 2014 This document is confidential and contains information which is proprietary to Decawave Limited. No reproduction is permitted without prior express written permission of the author
Page 12 of 31
the transmitter and receiver of 20 ppm.
Figure 11: Multipath with thresholds NTM_1 of 13 and NTM_2 of 7
Figure 12: Multipath with thresholds NTM_1 of 7 and NTM_2 of 3
-120 -115 -110 -105 -100 -950
10
20
30
40
50
60
70
80
90
100P
robabili
ty o
f F
indin
g D
irect
Path
(%
)
Direct Path (dBm)
PRF 16MHz, Data 850kbps, PL 128, CFO 20ppm, NTM_1: 13, NTM_2: 7
-96 dBm
-90 dBm
-80 dBm
-69 dBm
-120 -115 -110 -105 -100 -950
10
20
30
40
50
60
70
80
90
100
Pro
babili
ty o
f F
indin
g D
irect
Path
(%
)
Direct Path (dBm)
PRF 16MHz, Data 850kbps, PL 128, CFO 20ppm, NTM_1: 7, NTM_2: 3
-96 dBm
-90 dBm
-80 dBm
-69 dBm
Improvement achieved

APS006 Part 2
© Decawave 2014 This document is confidential and contains information which is proprietary to Decawave Limited. No reproduction is permitted without prior express written permission of the author
Page 13 of 31
APS006 Part 2
© Decawave 2014 This document is confidential and contains information which is proprietary to Decawave Limited. No reproduction is permitted without prior express written permission of the author
Page 14 of 31
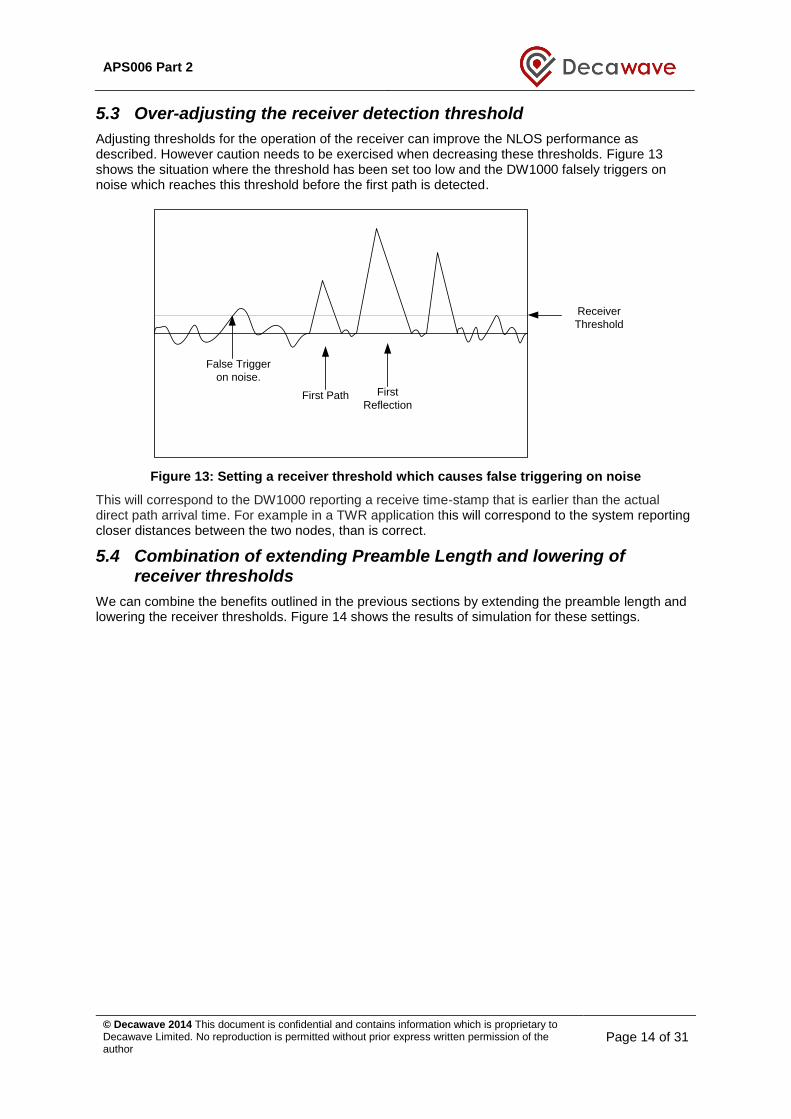
5.3 Over-adjusting the receiver detection threshold
Adjusting thresholds for the operation of the receiver can improve the NLOS performance as described. However caution needs to be exercised when decreasing these thresholds. Figure 13 shows the situation where the threshold has been set too low and the DW1000 falsely triggers on noise which reaches this threshold before the first path is detected.
First Path First
Reflection
Receiver
Threshold
False Trigger
on noise.
Figure 13: Setting a receiver threshold which causes false triggering on noise
This will correspond to the DW1000 reporting a receive time-stamp that is earlier than the actual direct path arrival time. For example in a TWR application this will correspond to the system reporting closer distances between the two nodes, than is correct.
5.4 Combination of extending Preamble Length and lowering of receiver thresholds
We can combine the benefits outlined in the previous sections by extending the preamble length and lowering the receiver thresholds. Figure 14 shows the results of simulation for these settings.

APS006 Part 2
© Decawave 2014 This document is confidential and contains information which is proprietary to Decawave Limited. No reproduction is permitted without prior express written permission of the author
Page 15 of 31
Figure 14: Combined performance with PL of 1024 and thresholds reduced.
-120 -115 -110 -105 -100 -950
10
20
30
40
50
60
70
80
90
100
Pro
babili
ty o
f F
indin
g D
irect
Path
(%
)
Direct Path (dBm)
PRF 16MHz, Data 850kbps, PL 1024, CFO 20ppm, NTM_1: 7, NTM_2: 3
-96 dBm
-90 dBm
-80 dBm
-69 dBm

APS006 Part 2
© Decawave 2014 This document is confidential and contains information which is proprietary to Decawave Limited. No reproduction is permitted without prior express written permission of the author
Page 16 of 31
5.5 Optimized settings for LOS and NLOS configuration
With a view to summarizing the details of the previous pages, Table 1 presents the chosen optimized settings for LOS and NLOS operation of the DW1000.
Table 1: Summary of optimized LOS and NLOS settings
Configuration setting Optimized for LOS Optimized for NLOS
Preamble Length 128 or greater 1024 or greater
NTM_1 13 7
NTM_2 7 3
PRF 16 MHz or 64 MHz 16 MHz
It should be noted that using the settings described for NLOS operation will increase the number of incorrect readings due to false triggering that must be handled by the system. Table 2 shows the relationship between achieving greater first path sensitivity and the increasing probability of a measured time of flight being in error. The measurement in error is characterized as the probability of it being an outlier. So for example if we take the minimum NTM_1 value in the table, of 7, then all measured time of flights (TOF) have a 5.3% probability of being in error. Since a two way ranging measurement is based on three time of flight measurements, the probability of the two way ranging measurement being correct is (1 - Outlier Probability)3. At the system level some form of filtering of these incorrect readings should be implemented.
Table 2: Effect of changing noise threshold multiplier
NTM_1 First Path Sensitivity (dBm) Outlier Probability
7 -113 5.3%
8 -111 3.1%
9 -110 0.5%
10 -110 0.17%
11 -110 0.05%
12 -109 0.001%
Details of register changes in the DW1000 to change NTM_1 and NTM_2 settings are given in Appendix 2. The Details on changing Preamble length and PRF settings can be found in the DW1000 User Manual [2].

APS006 Part 2
© Decawave 2014 This document is confidential and contains information which is proprietary to Decawave Limited. No reproduction is permitted without prior express written permission of the author
Page 17 of 31
6 Worked examples of optimising DW1000 performance for NLOS operation
This section works through some practical examples, to show the benefits of using the changes detailed in the last section. First, however, we will look at the line of sight (LOS) scenario.
6.1 Direct path through air with no obstruction
To compare with the NLOS scenarios and for your information, we will first consider the LOS scenario. Friis' path loss formula describes the receive signal level in LOS conditions and is outlined in Decawave's application note APS006 [3]. Figure 15 gives examples of decreasing signal level with distance for the following conditions: -
fc = 4.0 GHz (channel 2)
PT = -14.3 dBm
Gt = 0 dBi (Gain of transmitting antenna)
Gr = 0 dBi (Gain of receiving antenna)
In Figure 15, it can be seen that the transmission starts from A1 at -14.3 dBm and the power level decreases up to the receiving antenna until at the receiving antenna A2, ten meters from A1, the power level is at -78.8 dBm.
A1 A2 NODE 2
Direct path
NODE 1
1m
10m = -78.8dBm
-58.8dBm
2m = -64.8dBm
3m = -68.3dBm
Transmitting at -14.3dBm
Figure 15: Path Loss in Free space as given by Friis' equation
The range in this type of LOS scenario is simply determined by:
1. the signal level that arrives at the receiver and 2. the sensitivity of the receiver
As long as the signal level at the receiver is greater than or equal to the receiver sensitivity then the receiver can detect the signal and communications will take place successfully. Appendix 1 gives a list of received signal power figures for both 4.0 GHz and 6.5 GHz transmission

APS006 Part 2
© Decawave 2014 This document is confidential and contains information which is proprietary to Decawave Limited. No reproduction is permitted without prior express written permission of the author
Page 18 of 31
frequencies.
6.2 Direct path through two walls
A scenario that will arise when measuring distance is shown in Figure 16. This may occur when the transmitting node is in one room and the receiving node is in another. There may be one, two or a number of walls creating the NLOS scenario. In the absence of reflections, there is no opportunity to change the DW1000 configuration settings, to take advantage of reflected power, to increase the sensitivity to first path power. We call this scenario, non-complex non line of sight.
A1 A2
d
NODE 2
Direct path
Obstruction
NODE 1
Figure 16: Direct path with obstructions
From the DW1000 data sheet [1] on channel 5 (6.5 GHz) at a data rate of 850 kbps and a preamble length of 1024 symbols the receiver sensitivity of the DW1000 is given as -101 dBm. If the obstructions are stud partitions, 10 cm thick, with a -3 dB attenuation of the transmitted signal the received signal power at node 2 can be calculated as:
Rx sensitivity at Ch 5 -101.0 dBm
Stud partitions x 2 6.0 dB
-95.0 dBm
-95 dBm in free space corresponds to approximately 43 meters at 6.5 GHz. So 43 meters is the distance d in Figure 16. This is essentially the maximum range, at 6.5 GHz, through two walls characterised with -3 dB attenuation each. The range will be greater at 4.0 GHz.

APS006 Part 2
© Decawave 2014 This document is confidential and contains information which is proprietary to Decawave Limited. No reproduction is permitted without prior express written permission of the author
Page 19 of 31
6.3 Through concrete wall with reflection
Another scenario that may occur is shown in Figure 17. In this scenario node 1 is communicating with node 2 through a solid concrete wall 102mm thick. A reflection is also present, off a side wall. We call this scenario, complex non line of sight. Figure 17 shows the first placement for node 2 at the maximum communications range, using the optimized LOS configuration settings. A second placement of node 2 is also shown using the optimized NLOS settings.
9.1 m
NODE 2
Direct path
Solid Concrete Wall
102mm thick,
NODE 1
Obstruction
10cm
1 m 8 m
-23dB
Reflected
path
15 m
4 m
8 m
Improvement With
changed Settings
NODE 2
Figure 17: NLOS through a solid cement wall with a reflection
The solid concrete wall has an attenuation of -23 dB [3]. Working out the calculations for optimized LOS settings we get: Direct Path power:
9.1 m through air at 4 GHz -78.0 dBm
Concrete wall -23.0 dB
-101.0 dBm
Reflected Power:
12.0 m through air at 4 GHz -79.2 dBm
If we take the reflected power as -80 dBm and look at the earlier results in Figure 11 we can see that the direct path sensitivity is -101 dBm. This then gives a distance of 9.1 meters as the maximum range with the optimized LOS configuration settings. If we consider the optimized NLOS configuration and looking at Figure 14 we can see that for a reflected power of -80dBm we can get to an input sensitivity of -105dBm. Finding the appropriate distance for this sensitivity we can calculate as follows: Direct Path power:
15.1 m through air at 4 GHz -82.0 dBm
Concrete wall -23.0 dB
-105.0 dBm
This will bring the distance of node 2 out to close to 15 meters.

APS006 Part 2
© Decawave 2014 This document is confidential and contains information which is proprietary to Decawave Limited. No reproduction is permitted without prior express written permission of the author
Page 20 of 31
6.4 Through two walls with reflection
Another scenario that may occur is shown in Figure 18. Here the path between the transmitter node and the receiver node is impeded by two of the building’s internal walls. There is a direct path between the two nodes through the two walls and a reflected path as shown in Figure 18. Two boards from Decawave's EVK were used for this testing. The internal walls are 20 cm drywall on steel studs. Because of the presence of reflections we can change the DW1000 configuration settings to take advantage of reflected power, to increase the sensitivity to the direct path signal.
Direct path
Drywall on steel
studs 20cm
Building side wall
21.3 m
Reflected
path
12
m
NODE 1
NODE 2 Start Point
Figure 18: Non line of sight, around a corner scenario.
Practical testing was carried out for this scenario, and a graph of the results is shown in Figure 19. The Node 1 and Node 2 locations started close together (at the start point indicated) with the distance between them increasing for each subsequent set of ranging measurements. Figure 19 plots the actual physical distance around the corner between the two nodes, this is the top curve. The bottom curve is the through-wall or direct path distance. The middle curve shows the reported distance from the EVK1000 boards. These tests were carried out with the LOS optimized settings.
Figure 19: Plot of results for practical testing of the around the corner scenario
0
5
10
15
20
25
30
35
40
1 2 3 4 5 6 7 8 9 10 11 12 13 14
Distance (meters)
Measurement Number
Around the Corner Distance Direct Path
Reported distance

APS006 Part 2
© Decawave 2014 This document is confidential and contains information which is proprietary to Decawave Limited. No reproduction is permitted without prior express written permission of the author
Page 21 of 31
Figure 19 shows that the EVK1000 reports the through wall direct path distance for some of the plot. As the distance between node 1 and node 2 increases, the reported distance tends towards the around-the-corner distance. Eventually the distance reported by the EVK1000 is always due to the reflected path. This point is identified with a black circle on the diagram and occurs at around 33 m, around the corner distance or approximately 24 m for the direct path. However accurate direct path readings only reach 10 meters (red circle) with the EVK1000 boards. EVK1000 configuration for this testing was: CH2 (4.0 GHz), 110 kb/sec, PRF 64, PL 1024 At around 10 meters we get a kink in the graph (middle curve) which simulation shows relates to the specific configuration of the EVK boards used for this testing and the effect of the relative powers in the direct and reflected paths as the boards move apart. It is possible and also useful at this point to calculate the attenuation created by passing the signal through the two walls: -
At 33 meters we have completely lost the direct path.
From Appendix 1 a distance of 33 meters (at fc =4 GHz) gives a received signal level at node 2 of approximately -90 dBm, assuming a transmitted level of -14.3 dBm.
From Figure 9 for a reflected power of -90 dBm we have a first path sensitivity of -106 dBm.
Wall attenuation = first path sensitivity - free space attenuation = 106 dBm – 90 dBm = 16 dB If we now lower the LDE thresholds as used to generate the results graphed in Figure 14, at -90 dBm first reflected power, we get a first path sensitivity of -109 dBm. This is a 3 dBm improvement. We can now calculate the distance we would reach in this scenario, before we completely lose the direct path measurement: - First Path Distance = First Path Sensitivity - Wall Attenuation First Path Distance = 109 - 16 = 93 dBm From Appendix 1 this is a distance of approximately 48 to 50 meters. This is an expected improvement of double the distance for a 3 dB improvement in first path sensitivity. Figure 20 shows the results of extrapolating the curves described in Figure 19 using our new settings. Simulation results predict the kink in the reported distance response shown in Figure 19 (after around 10 m reported distance) and indicate that it will be removed when we change the PRF to 16 MHz or change the LDE thresholds.

APS006 Part 2
© Decawave 2014 This document is confidential and contains information which is proprietary to Decawave Limited. No reproduction is permitted without prior express written permission of the author
Page 22 of 31
Figure 20: Extrapolation of the test results when applying new threshold settings
From Figure 19 the accurate measurement of the direct path was only achieved for about 10 meters up to the kink in the graph of the reported distance (identified with a red circle on the graph). From Figure 20 we can see that we have extended this accurate measurement of the direct path to 30 meters (identified with a red circle on the graph). Figure 21 summarizes the improvement in NLOS direct path detection range achievable in this scenario by applying the configuration changes discussed.
Direct path
Building side wall
12
m
NODE 1
NODE 2 NODE 2
10m
30m
Figure 21: Improvement in direct path range
0
10
20
30
40
50
60
70
80
1 2 3 4 5 6 7 8 9 10 11 12 13 14
Distance (meters)
Measurement Number
Around the Corner Distance Direct Path
Reported distance

APS006 Part 2
© Decawave 2014 This document is confidential and contains information which is proprietary to Decawave Limited. No reproduction is permitted without prior express written permission of the author
Page 23 of 31
6.5 Direct path through person with reflection from a vehicle
Many automotive keyless entry systems now work by determining the proximity of the key fob to the car. When the DW1000 is used in automotive applications, it is often used to locate a key fob relative to the car. For example inside the car, outside the car, 1 meter from the car, 2 meters from the car etc. One particularly harsh NLOS scenario that occurs in this application occurs when the car owner places the key fob in their rear pocket and approaches the car. Figure 22 shows this occurring in a car park where the owner’s car is beside other cars creating a multipath environment for the signal transmitted from the key fob.
Fob
Person with Fob in back
Receiving Node in Car
6m
2m
6.3m
Figure 22: NLOS with person and two cars
From practical experiments the human body attenuation in this scenario is between -15 dB and -30 dB [3], and is dependent on the body mass index. With this figure we can estimate the received power at the receiving node due to the direct path and the first reflected path as follows: Direct Path power:
6 m through air at 4 GHz -74.4 dBm
Attenuation of human body -30.0 dB
-104.0 dBm
Reflected Power:
8.3 m through air at 4 GHz -77.0 dBm

APS006 Part 2
© Decawave 2014 This document is confidential and contains information which is proprietary to Decawave Limited. No reproduction is permitted without prior express written permission of the author
Page 24 of 31
If we take the reflected power as -80 dBm and look at the earlier results in Figure 11 we can see that the direct path sensitivity is -101 dBm. In this instance we would not detect the first path. However, moving to lower threshold settings as used in Figure 14 we get a first path sensitivity of -105 dBm which would allow us to detect this direct path. Furthermore, moving towards the car from the 6 meter distance will increase the direct path power at the receiving node and allow us to detect this first path more reliably.
6.6 Direct path through person with reflection from a wall
A variation on the scenario outlined in the last section is shown in Figure 23. Here the source of reflected signals is a nearby wall. The person is still 6 meters from the receiving node in the car.
Fob
Person with Fob in back
Receiving Node in Car
6m
12m
13.4m
Wall
Figure 23: NLOS scenario with person, car and wall.
Again we can estimate the received power at the receiving node due to the direct path and the first reflected path as follows: Direct Path power:
6 m through air at 4 GHz -74.4 dBm
Attenuation of human body -30.0 dB
-104.0 dBm
Reflected Power:
25.4 m through air at 4 GHz -87.0 dBm

APS006 Part 2
© Decawave 2014 This document is confidential and contains information which is proprietary to Decawave Limited. No reproduction is permitted without prior express written permission of the author
Page 25 of 31
This time the reflected power is lower than in the previous example. Looking at Figure 14, this makes our direct path sensitivity more like -108 dBm to -109 dBm. We should have no problem detecting the -104 dBm direct path. Indeed the receiving node in the car will detect the key fob at distances greater than 6 meters.
6.7 Direct path through person with no reflection
An even more difficult scenario can be created in the absence of all reflections. Parking the car in a wide open space, the system is dependent on detecting the first path in the absence of reflections. Figure 24 shows this situation. In the absence of reflections, we cannot change the DW1000 configuration settings, to take advantage of reflected power, to increase the sensitivity to direct path power.
Fob
Person with Fob in back
Receiving Node in Car
6m
Figure 24: NLOS scenario without reflections.
We can estimate the received power at the receiving node in the car as follows: Direct Path power:
6 m through air at 4 GHz -74.4 dBm
Attenuation of human body -30.0 dB
-104.0 dBm
If we assume a receive sensitivity, in the absence of reflections, as -101 dBm then this direct path signal will not be received by the receiving node in the car. However as the person approaches the car there will be a point where the attenuation through the air, reduces sufficiently to allow the receiving node to see the transmissions. For example at a distance of 4 meters from the car we have a direct path power at the receiver of:
Direct Path power:
4 m through air at 4 GHz -70.8 dBm
Attenuation of human body -30.0 dB

APS006 Part 2
© Decawave 2014 This document is confidential and contains information which is proprietary to Decawave Limited. No reproduction is permitted without prior express written permission of the author
Page 26 of 31
-100.8 dBm
The receiving node in the car should be able to see this transmission.

APS006 Part 2
© Decawave 2014 This document is confidential and contains information which is proprietary to Decawave Limited. No reproduction is permitted without prior express written permission of the author
Page 27 of 31
7 Appendix 1: Table of received signal powers
Free space received powers from Friis' equation for a transmitted power of -14.3 dBm. Figures are given for channel 2 (4.0 GHz) and channel 5 (6.5 GHz).
range (m)
Rx Power dBm
fc = 4 GHz fc = 6.5 GHz
1 -58.8 -63.0
2 -64.8 -69.0
3 -68.3 -72.6
4 -70.8 -75.1
5 -72.8 -77.0
6 -74.4 -78.6
7 -75.7 -79.9
8 -76.9 -81.1
9 -77.9 -82.1
10 -78.8 -83.0
13 -81.1 -85.3
23 -86.0 -90.3
33 -89.2 -93.4
43 -91.5 -95.7
53 -93.3 -97.5
63 -94.8 -99.0
73 -96.1 -100.3
83 -97.2 -101.4
93 -98.2 -102.4

APS006 Part 2
© Decawave 2014 This document is confidential and contains information which is proprietary to Decawave Limited. No reproduction is permitted without prior express written permission of the author
Page 28 of 31
8 Appendix 2: Register settings for NLOS optimization
To set the registers in the DW1000 for the recommended NLOS configurations of Table 1 we can configure the register details below with the settings given as "New Setting" below. The register overview is reproduced from the DW1000 User Manual [2] for your information.
8.1 NTM_1 (NSTDEV) setting
Sub-Register 0x2E:0806 – LDE_CFG1
ID Length (Octets) Type Mnemonic Description
2E:0806 1 RW LDE_CFG1 LDE configuration
register 1
New Setting = 0x07 Note: This sets the upper 5 bits of the byte to zero.
8.2 NTM_2 setting
Sub-Register 0x2E:1806– LDE_CFG2
ID Length (Octets) Type Mnemonic Description
2E:1806 2 RW LDE_CFG2 LDE configuration
register 2
New Setting = 0x0003

APS006 Part 2
© Decawave 2014 This document is confidential and contains information which is proprietary to Decawave Limited. No reproduction is permitted without prior express written permission of the author
Page 29 of 31
9 Glossary
Acronym Full Name Explanation
LDE Leading Edge Leading edge detection is the process of finding and adjusting the RX message timestamp.
LOS Line of Sight An RF clear line of sight [3]
NLOS Non Line of Sight No RF clear line of sight [3] exists.
NTM (NTM_1 and NTM_2) Noise Threshold Multipliers
These are the threshold settings to avoid false triggering on noise.
EVK1000 Evaluation Kit DW1000 evaluation kit including two PCB boards and antennas.
TCXO Temperature Compensated Crystal Oscillator
CFO Carrier Frequency Offset
This is the difference in frequency between the clock of the transmitter and the clock of the receiver.
PRF Pulse Repetition Frequency.
See DW1000 User Manual [2]
TWR Two Way Ranging Measurement technique used to measure distance between two DW1000 chips.
TDOA Time Difference of Arrival
Measurement technique used to determine location in RTLS systems.
TOF Time of flight Measurement technique used in TWR measurement.

APS006 Part 2
© Decawave 2014 This document is confidential and contains information which is proprietary to Decawave Limited. No reproduction is permitted without prior express written permission of the author
Page 30 of 31
10 References
Reference is made to the following documents in the course of this Application Note: -
Table 3: Table of References
Ref Author Date Version Title
[1] Decawave Current DW1000 Data Sheet
[2] Decawave Current DW1000 User Manual
[3] Decawave Current APS0006 Part 1: Channel Effects on Communications Range and Time Stamp Accuracy in DW1000 Based Systems.
11 Document History
Table 4: Document History
Revision Date Description
1.0 INTERNAL Initial internal release
1.1 INTERNAL Second internal release following review
1.2 23rd December 2014 Third internal release following review
1.3 29th January 2015 Initial external release
1.4 1st October 2016 Added note to section 8.1
1.5 8th August 2018 Updates for new logo and template.
12 Major Changes
Revision 1.3
Page Change Description
All Initial external release
Revision 1.4
Page Change Description
Front Modification of revision to 1.4
All Various typographical corrections
25 Sec 8.1 Add note to clarify.
27 Addition of 1.4 to revision history table
27 Addition of this table
Revision 1.5
Page Change Description
Front Modification of revision to 1.5
29 Addition of 1.5 to revision history table
29 Addition of this table
30 Update of Further Information

APS006 Part 2
© Decawave 2014 This document is confidential and contains information which is proprietary to Decawave Limited. No reproduction is permitted without prior express written permission of the author
Page 31 of 31
13 FURTHER INFORMATION
Decawave develops semiconductors solutions, software, modules, reference designs - that enable real-time, ultra-accurate, ultra-reliable local area micro-location services. Decawave’s technology enables an entirely new class of easy to implement, highly secure, intelligent location functionality and services for IoT and smart consumer products and applications. For further information on this or any other Decawave product, please refer to our website www.decawave.com.