non-gaap/alternative performance …swiss.cfa/lists/events...
TRANSCRIPT

NON-GAAP/ALTERNATIVE PERFORMANCE MEASURES: WHAT IS THE BIG DEAL?
Vincent Papa June 7, 2017
NGFM
• Context • Company Communication of NGFM
• Investors’ Use of NGFM
• Key Investor Concerns
• Bridging the Gap
2 CFA Institute

CONTEXT: EVOLVING CORPORATE REPORTING LANDSCAPE
EVOLVING AUDIT AND ASSURANCE SERVICES
3
Perceived Shortcomings of Traditional
financial statement information
(Country specific GAAP/IFRS)
Increased demand for Other information
(Non-GAAP, ESG, Risk Reporting, Intellectual
capital)
TECHNOLOGY TRANSFORMING THE NATURE, DELIVERY & ASSURANCE OF COMPANY INFORMATION (XBRL delivery, implications of adoption of blockchain technologies,
leveraging big data)
Corporate Information for
Capital Markets
CFA Institute
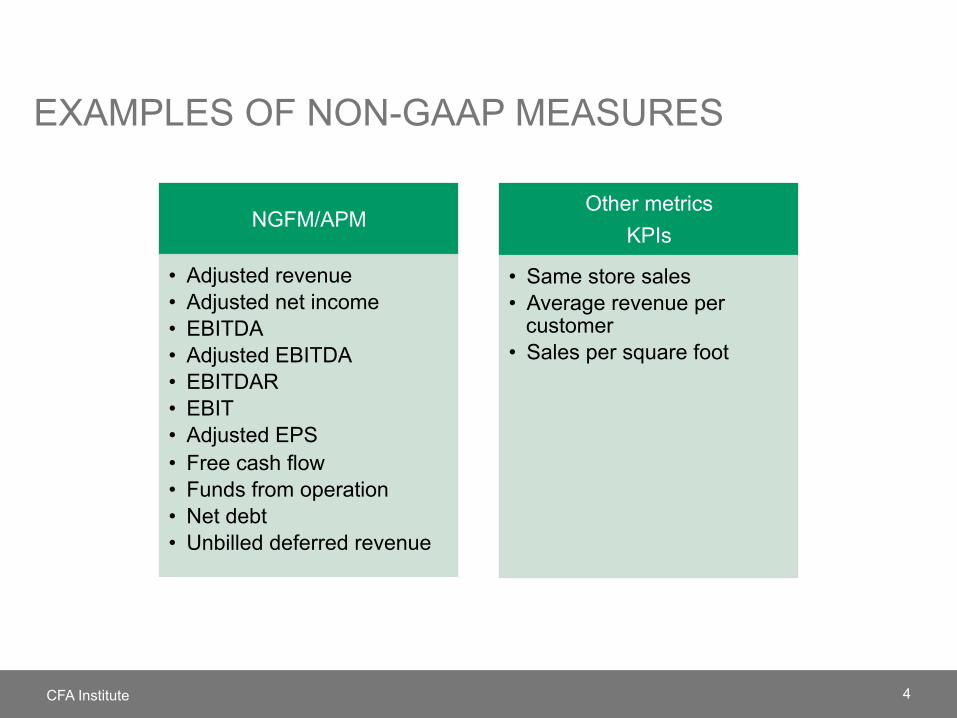
EXAMPLES OF NON-GAAP MEASURES
4 CFA Institute
NGFM/APM
• Adjusted revenue • Adjusted net income • EBITDA • Adjusted EBITDA • EBITDAR • EBIT • Adjusted EPS • Free cash flow • Funds from operation • Net debt • Unbilled deferred revenue
Other metrics KPIs
• Same store sales • Average revenue per
customer • Sales per square foot

DRIVERS OF NGFM REPORTING
SUPPLY FACTORS • Companies desire to convey relevant entity-specific information • Measures help to manage perception of performance
• Variation by country – 43% of SIX versus in 2013 >80% of US (S&P500) and UK (FTSE100) in 2015
• Prevalent in particular industries (Healthcare, technology) • Regulatory environment can determine quality of alternative performance
reporting
DEMAND FACTORS • Investor demand for supplemental information on earnings components • Institutional practices (e.g. consensus earnings) • A by-product of GAAP complexity and perceived irrelevance
5 CFA Institute

6 CFA Institute
ILLUSTRATION: NOVARTIS
NovartisUSDMillions 2016 2015 2014 2013 2012IFRSIncomebeforetaxes 7,817 8,134 11,921 10,496 10,925Amortizationofintangibleassets 4,097 4,132 3,073 3,159 3,045Impairments 786 369 1,575 259 356Acquisitionordivestmentrelateditems (33) 182 (647) 349 364Otherexceptionalitems 648 1,275 (1,096) 74 87Adjustedincomebeforetaxes 13,315 14,092 14,826 14,337 14,777
EPS 2.82 2.92 4.21 3.76 3.83AdjustedEPS 4.76 5.01 5.22 5.09 5.15
2016and2015onlyreflects continuingoperations
7 CFA Institute
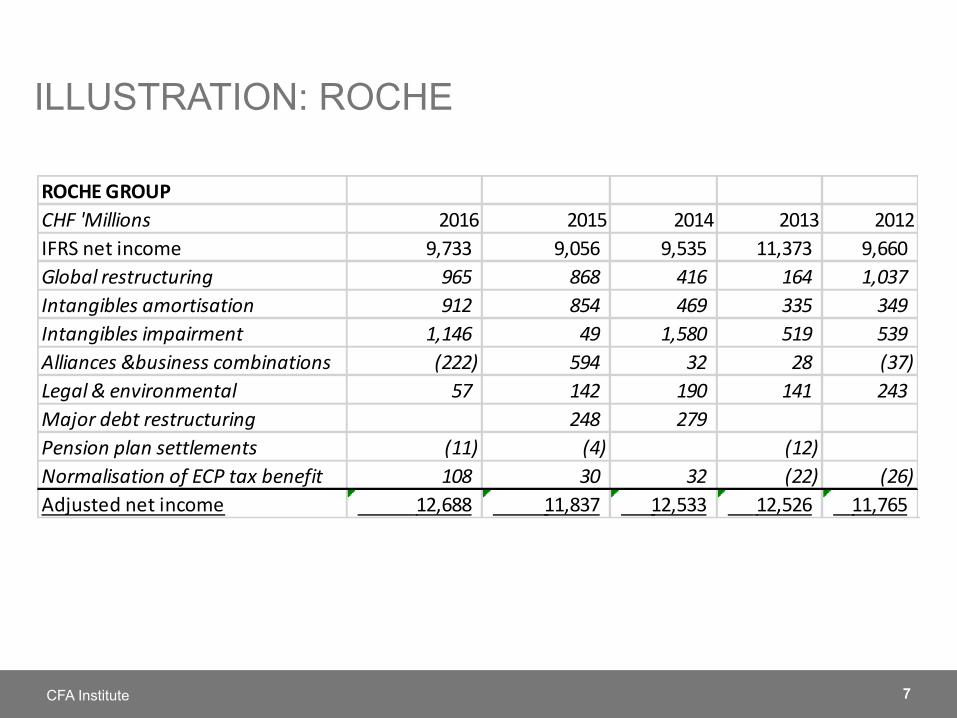
ILLUSTRATION: ROCHE
ROCHEGROUPCHF'Millions 2016 2015 2014 2013 2012IFRSnetincome 9,733 9,056 9,535 11,373 9,660Globalrestructuring 965 868 416 164 1,037Intangiblesamortisation 912 854 469 335 349Intangiblesimpairment 1,146 49 1,580 519 539Alliances&businesscombinations (222) 594 32 28 (37)Legal&environmental 57 142 190 141 243Majordebtrestructuring 248 279Pensionplansettlements (11) (4) (12)NormalisationofECPtaxbenefit 108 30 32 (22) (26)Adjustednetincome 12,688 11,837 12,533 12,526 11,765

8 CFA Institute
TYPICAL EARNING ADJUSTMENTS-SIX
Figure 4: Occurrence of Adjustments for 13 (12) SIX companies in 2013 (2012)
Source: 2014 Deloitte IAS Financial Reporting by listed companies- Spotlight on Swiss Trends
0 2 4 6 8 10 12
Disposaloffixedassets
Disposalofinvestments
IAS39relateditems
Restructuring
Depreciationandamortisation
Impairment
OccurenceofAdjustments
2012 2013

9
2009 2010 2011 2012 2013 2014 Restructuring* 52.5% 45.9% 42.1% 49.0% 51.5% 48.0% Investment gains/losses* 17.6% 20.1% 19.0% 19.7% 21.0% 27.6% Acquisition* 26.1% 34.4% 31.7% 36.1% 35.2% 36.0% Stock compensation 17.6% 17.0% 17.6% 16.5% 17.0% 15.0% Amortization* 22.3% 20.5% 23.1% 22.3% 22.8% 24.0% Impairment* 29.0% 24.3% 25.5% 30.6% 27.5% 27.6% Legal 21.8% 19.7% 23.8% 22.3% 25.9% 28.2% Pension (MTM)* 1.3% 1.9% 3.1% 3.5% 0.3% 4.2% Pension (OPEB)* 2.1% 2.7% 5.2% 9.4% 7.7% 10.2% Currency 1.3% 3.1% 1.4% 1.3% 4.3% 5.4% Tax resolution/change 30.7% 40.2% 37.2% 31.3% 34.6% 35.1% Tax adjustments (NGFM) 36.1% 33.2% 35.2% 36.8% 36.7% 37.5% Debt extinguishment 10.5% 19.7% 13.4% 16.1% 14.5% 18.6% Interest revenues/costs 6.7% 6.6% 6.6% 5.2% 5.2% 4.5%
ADJUSTMENTS- S&P 500 COMPANIES
CFA Institute
CFA Institute
INVESTORS’ USE OF NGFMS
10

11
23.1%
38.0%
21.0%
13.8%
4.0%
33.5%35.2%
14.3%12.1%
4.9%
26.5%
37.1%
18.8%
13.3%
4.3%
0.0%
5.0%
10.0%
15.0%
20.0%
25.0%
30.0%
35.0%
40.0%
Always Often Sometimes Rarely Never
UseofNGFM;N=558
Portfoliomanagers+buy-sideanalysts=376 Other+Sell-sideanalysts=182 All=558
WIDESPREAD USE

12
32.3%
40.8%
16.5%
8.3%
2.1%
33.5% 34.6%
17.0%
11.0%
3.8%
32.7%
38.8%
16.7%
9.2%
2.7%
0.0%
5.0%
10.0%
15.0%
20.0%
25.0%
30.0%
35.0%
40.0%
45.0%
Always Often Sometimes Rarely Never
UseofGAAP/IFRS;N=557
Portfoliomanagers+buy-sideanalysts=375 Other+Sell-sideanalysts=182 All=557
CFA Institute
GAAP/IFRS STILL IMPORTANT
13
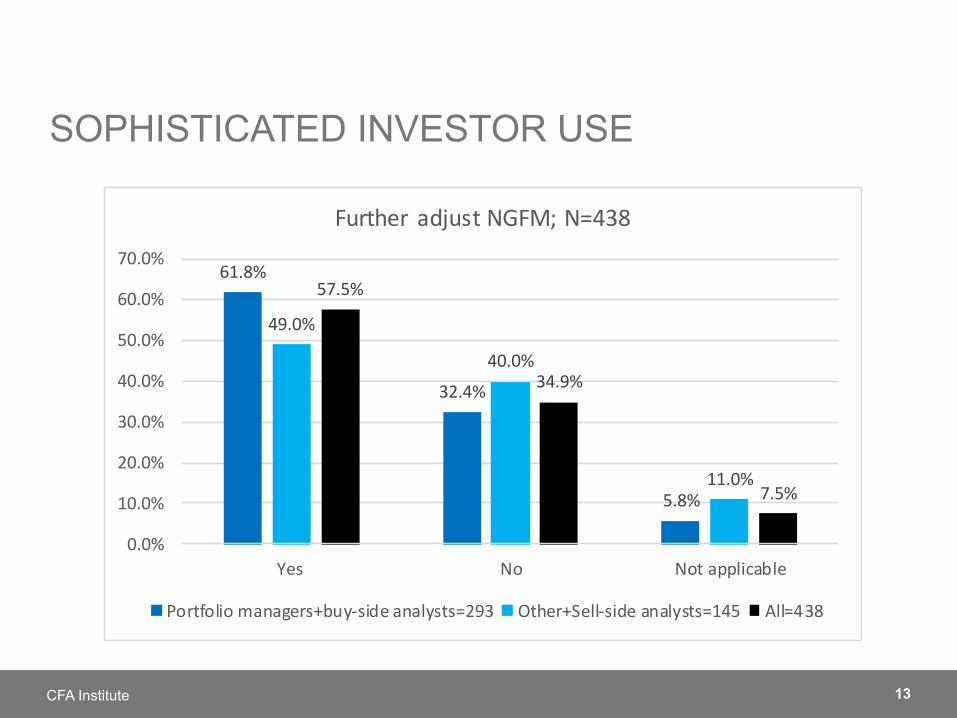
61.8%
32.4%
5.8%
49.0%
40.0%
11.0%
57.5%
34.9%
7.5%
0.0%
10.0%
20.0%
30.0%
40.0%
50.0%
60.0%
70.0%
Yes No Notapplicable
Further adjustNGFM;N=438
Portfoliomanagers+buy-sideanalysts=293 Other+Sell-sideanalysts=145 All=438
CFA Institute
SOPHISTICATED INVESTOR USE

14
78.4%
68.6%64.5%
57.1%
50.2% 49.1%
40.1%
67.4%72.2%
68.8%
55.6%52.1%
39.6%
47.9%
74.7%69.8%
65.9%
56.6%50.8%
45.9%42.7%
0.0%
10.0%
20.0%
30.0%
40.0%
50.0%
60.0%
70.0%
80.0%
90.0%
Freecashflow EBITDA AdjustedEBITDA
Netdebt AdjustedEPS EBIT Adjustedearnings
"Top-Half"UseofNGFM;N=431
Portfoliomanagers+buy-sideanalysts=287 Other+Sell-sideanalysts=144 All=431
CFA Institute
INVESTORS: COMMONLY USED NGFMS

15
39.0% 38.7%35.9%
17.4%
13.2%
8.0%
36.8%
46.5%
42.4%
18.1%
9.7%6.9%
38.3%41.3%
38.1%
17.6%
12.1%
7.7%
0.0%
5.0%
10.0%
15.0%
20.0%
25.0%
30.0%
35.0%
40.0%
45.0%
50.0%
AdjustedEBIT Adjustedoperatingprofit
Fundsfromoperations
AdjustedrevenueUnbilleddeferredrevenue
Other
"Bottom-half"- UseofNGFM;N=431
Portfoliomanagers+buy-sideanalysts=287 Other+Sell-sideanalysts=144 All=431
CFA Institute
INVESTORS: COMMONLY USED NGFMS

16
63.4%
56.9%53.1%
50.0%
38.6%
57.6% 58.3%63.2%
45.1%47.9%
61.5%57.4% 56.5%
48.4%
41.7%
0.0%
10.0%
20.0%
30.0%
40.0%
50.0%
60.0%
70.0%
Toassessearningsquality
Tofacilitateperiodtoperiodtrendanalysis
Tofacilitateforecastingoffuture
earnings
DisagreewithparticularGAAP
treatment
Understandperformancethrougheyesofmanagement
Top5reasonsforUseofNGFMs;N=434
Portfoliomanagers+buy-sideanalysts=290 Other+Sell-sideanalysts=144 All=434
CFA Institute
REASONS FOR USE

17
32.4% 31.7%28.3%
24.8%
10.3%
29.2%
42.4%
36.1%
31.3%
6.9%
31.3%35.3%
30.9%27.0%
9.2%
0.0%
5.0%
10.0%
15.0%
20.0%
25.0%
30.0%
35.0%
40.0%
45.0%
Identifymanagementmisreportingincentivesand
choices
Suitableformyvaluationmodel
Tomakeforecaststhatarecomparabletootheranalysts
Toconformtoconsensusearnings
Other
OtherreasonsforuseofNGFM;N=434
Portfoliomanagers+buy-sideanalysts=290 Other+Sell-sideanalysts=144 All=434
CFA Institute
REASONS FOR USE- CONTINUED

CFA Institute
DARK SIDE OF NON_GAAP MEASURES: INVESTOR CONCERNS
18

19
For 380 S&P 500 firms reporting on a non-GAAP net income basis in 2015 and included in the S&P 500 from 2009 onward.
CFA Institute CFA Institute and R.G. Associates, Inc.
MANAGING PERCEPTION OF PERFORMANCE

20
• Lack of comparability across companies & across reporting periods • Questionable exclusions that can mislead investors on entity’s performance
• Excluding recurring restructuring costs • Excluding stock option expenses- (i.e. real expenses) • Lumping recurring expenses into “other”
• Inappropriate application during executive compensation determination
• Inadequacies of reconciliation and disclosure of NGFM adjustments • Instances of inadequate disaggregation to specific line items • Instances where reconciliation is not prominently located • Boiler plate and inadequate explanations
• Lack of assurance on NGFM
• Risks Associated with Greater Prominence of NGFM relative GAAP/IFRS measures
• Mispricing of equities • Misleading ROE, ROIC
PRIMARY CONCERNS
CFA Institute

21
UNDUE PROMINENCE: RISK OF COMPARING APPLES TO ORANGES
CFA Institute
FacebookPerformance2016 2015
OperatingMarginNon-GAAP 60% 56%OperatingMarginGAAP 45% 35%
InvestorsBusinessDaily-15thFebruary20176-TopRatedStockswith50%PlusProfitMarginsAnnualpre-taxMarginFacebook 60.0%UnitedTherapeutics 59.3%Phillips-66Partners 55.7%BOFIHoldings 53.4%Alibaba 52.9%Mobileye 51.8%
22
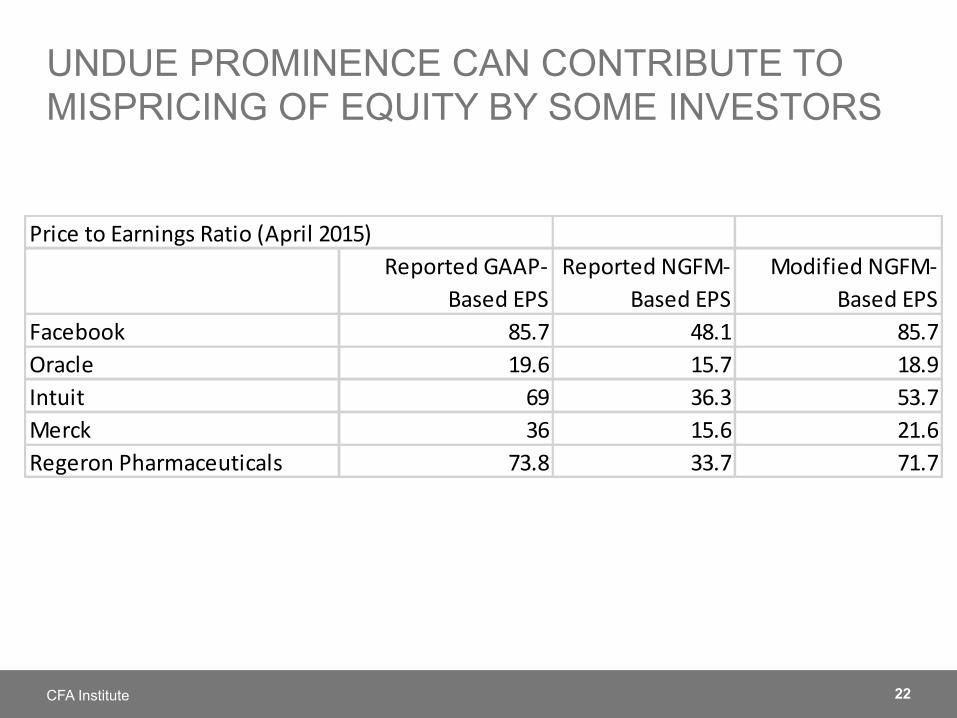
UNDUE PROMINENCE CAN CONTRIBUTE TO MISPRICING OF EQUITY BY SOME INVESTORS
CFA Institute
PricetoEarningsRatio(April2015)ReportedGAAP-
BasedEPSReportedNGFM-
BasedEPSModifiedNGFM-
BasedEPSFacebook 85.7 48.1 85.7Oracle 19.6 15.7 18.9Intuit 69 36.3 53.7Merck 36 15.6 21.6RegeronPharmaceuticals 73.8 33.7 71.7
23
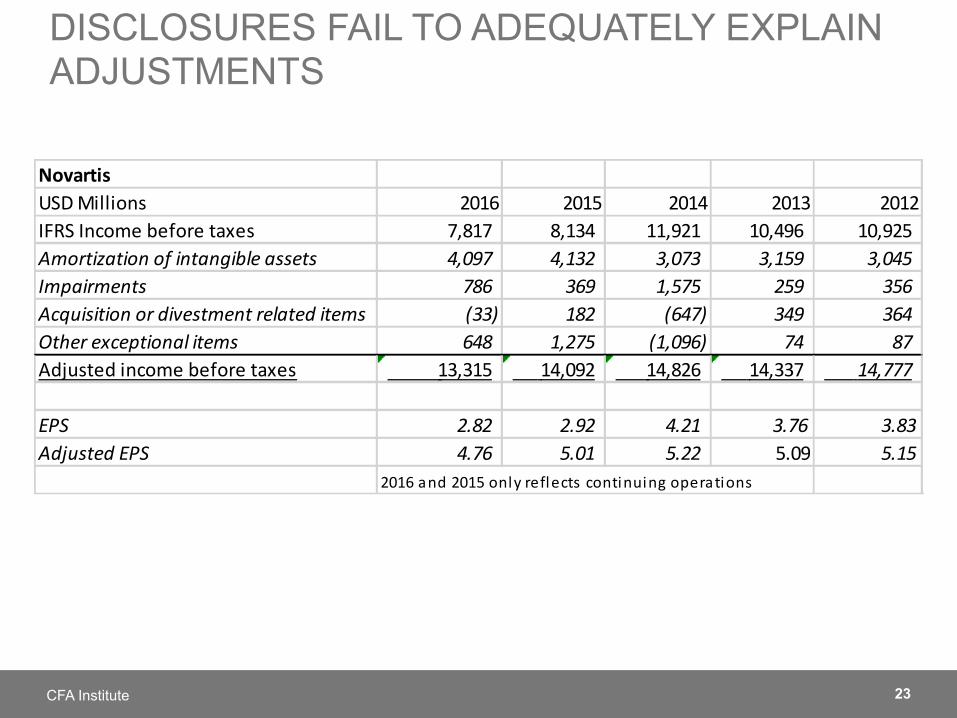
DISCLOSURES FAIL TO ADEQUATELY EXPLAIN ADJUSTMENTS
CFA Institute
NovartisUSDMillions 2016 2015 2014 2013 2012IFRSIncomebeforetaxes 7,817 8,134 11,921 10,496 10,925Amortizationofintangibleassets 4,097 4,132 3,073 3,159 3,045Impairments 786 369 1,575 259 356Acquisitionordivestmentrelateditems (33) 182 (647) 349 364Otherexceptionalitems 648 1,275 (1,096) 74 87Adjustedincomebeforetaxes 13,315 14,092 14,826 14,337 14,777
EPS 2.82 2.92 4.21 3.76 3.83AdjustedEPS 4.76 5.01 5.22 5.09 5.15
2016and2015onlyreflects continuingoperations

24
DISCLOSURES FAIL TO ADEQUATELY EXPLAIN ADJUSTMENTS – NOVARTIS ANNUAL REPORT
CFA Institute
1Amor%za%onofintangibleassets:Costofgoodssoldincludesrecurringamor%za%onofacquiredrightstoin-marketproductsandotherproduc%on-relatedintangibleassets;Research&Developmentincludestherecurringamor%za%onofacquiredrightsfortechnologyplaBorms;IncomefromassociatedcompaniesincludesUSD296millionfortheNovar%sshareofthees%matedRochecoreitems.
2Impairments:CostofgoodssoldandResearch&Developmentincludeimpairmentchargesrelatedtointangibleassets;Otherincomeincludesimpairmentreversalsofproperty,plantandequipment;Otherexpenseincludesimpairmentchargesrelatedtoproperty,plantandequipment,andfinancialassets.
3 Acquisition or divestment related items, including restructuring and integration charges: Other income and Other expense include transitional service-fee income and expenses, and other items related to the portfolio transformation; Other income also includes a gain from the revaluation of a previously held financial investment in a newly acquired company.

25
DISCLOSURES FAIL TO ADEQUATELY EXPLAIN ADJUSTMENTS – NOVARTIS ANNUAL REPORT
CFA Institute
4 Other items: Other revenues include an early release of deferred income associated with a collaboration agreement; Cost of goods sold, Other income and Other expense include net restructuring and other charges related to the Group-wide rationalization of manufacturing sites; Research & Development, Marketing & Sales, Other income and Other expense include other restructuring income and charges; Cost of goods sold and Research & Development include adjustments of contingent considerations; General & Administration, Other income and Other expense include items related to setup costs for Novartis Business Services; Other income and Other expense also include legal settlements and changes in provisions; Other income also includes gains from product divestments, other income related to the portfolio transformation and a gain related to the sale of real estate; Other expense also includes a charge as a result of a pension plan amendment, a charge for an indirect tax settlement and other costs; Income from associated companies includes USD 135 million for the Novartis share of the estimated GSK Consumer Healthcare Holdings Ltd. core items; Other financial income and expense relates mainly to devaluation losses in Venezuela

CFA Institute
INVESTOR PROTECTION- WHAT IS REQUIRED?
26

BRIDGING THE GAP: CREATING A DEPENDABLE PERFORMANCE REPORTING FRAMEWORK
27 CFA Institute

CFA Institute
THANKS FOR LISTENING!
28