non-executive director fees - pwc uk...
TRANSCRIPT

www.pwc.co.uk
Non-executive
Director Fees
2014 Review


PwC ▪ Non-executive Director Fees 2014 3
Foreword
Welcome to the PwC Review of Non-executive Director (“NED”) fee levels for 2014. This year’s report includes
information on NED fees in FTSE 100, FTSE 250 and FTSE Small Cap (“SMCs”) companies.
Last year we predicted that the new binding shareholder vote on the Directors’ Remuneration Policy would have an
impact on changes in NED fee levels from year to year. All listed UK companies will now have an approved
remuneration policy in place with which all remuneration or termination payments to directors must be consistent.
The provisions require companies to disclose in the Directors’ Remuneration Policy the operation and maximum
opportunity for each element of remuneration (including Chairman and NED fees). As a result, many companies
have stated that Chairman and NED fees will be reviewed annually and some have stated that any increases will not
normally exceed inflation or the percentage increase offered to the employee population.
Until recently, it has been relatively unusual for companies to review and change Chairman and NED fees on an
annual basis; most companies reviewed fees every two or three years and then increased fees by a substantial figure
– often between 10% to 20%. However, where companies have stated that fee increases will be limited under the
approved policy to annual inflation (or by reference to general salary increases across the company), we anticipate
that companies will undertake more regular reviews.
Indeed in 2014, 56% of the FTSE 100 increased fees for the Chairman and 54% adjusted NED fees compared to just
over 30% who made adjustments to either Chairman or NED base fees in 2013. The fee increases for NEDs were
relatively modest with a median of 7% in the FTSE 100 and 6% at the median in the FTSE 250.
Fewer companies have reviewed fees for membership of the main board committees compared with the prior year
but the percentage of companies reviewing fees for chairing those committees has increased. Nonetheless, fees for
the membership and chairmanship of committees are now beginning to plateau after several years of steep
increases.
Consistent with last year, only around 20% of companies reviewed the fee for the Senior Independent Director
(“SID”) but those companies increasing fees made a meaningful change. The median additional SID fee in the FTSE
100 is now £20,000, an increase of 23% on the prior year. In the FTSE 250, while fee levels are lower (at £7,000),
this represents an increase of 40% on 2013.
Looking ahead, we predict more of the same steady increases for most companies as they continue to operate within
the constraints of their approved remuneration policy. However, the increased responsibility imposed on NEDs by
EU regulations, particularly impacting financial sector companies, may lead to higher fees to attract individuals to
take on what is becoming a very challenging role.
Fiona Camenzuli
Partner
0207 804 4175

PwC ▪ Non-executive Director Fees 2014 5
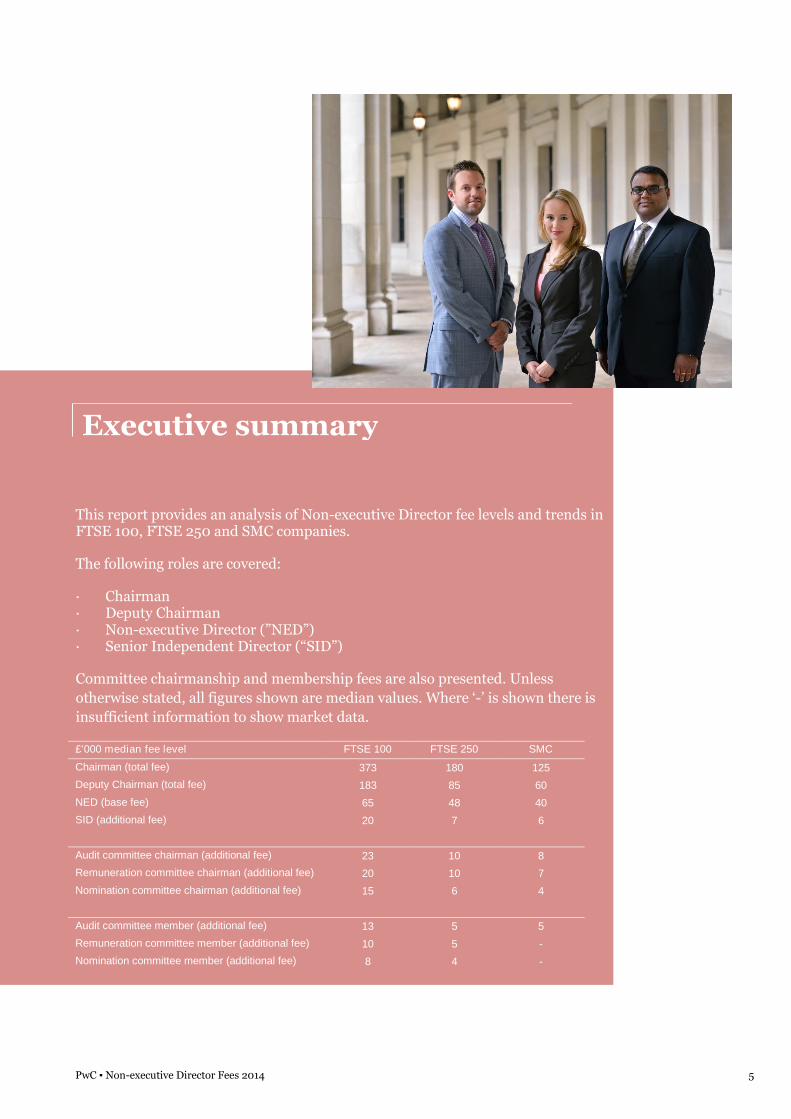
This report provides an analysis of Non-executive Director fee levels and trends inFTSE 100, FTSE 250 and SMC companies.
The following roles are covered:
· Chairman· Deputy Chairman· Non-executive Director (”NED”)· Senior Independent Director (“SID”)
Committee chairmanship and membership fees are also presented. Unless
otherwise stated, all figures shown are median values. Where ‘-’ is shown there is
insufficient information to show market data.
£'000 median fee level FTSE 100 FTSE 250 SMC
Chairman (total fee) 373 180 125
Deputy Chairman (total fee) 183 85 60
NED (base fee) 65 48 40
SID (additional fee) 20 7 6
Audit committee chairman (additional fee) 23 10 8
Remuneration committee chairman (additional fee) 20 10 7
Nomination committee chairman (additional fee) 15 6 4
Audit committee member (additional fee) 13 5 5
Remuneration committee member (additional fee) 10 5 -
Nomination committee member (additional fee) 8 4 -
Executive summary

PwC ▪ Non-executive Director Fees 2014 6
FTSE 350 fee levels over the past five years
Chairman and NED base fees
There has been a small rise in fee levels across all companies over the past year.
FTSE 100 chairman and NED base fees (£’000)
Chairman NED
FTSE 250 chairman and NED base fees (£’000)
Chairman NED
0
50
100
150
200
250
300
350
400
2010 2011 2012 2013 20140
10
20
30
40
50
60
70
2010 2011 2012 2013 2014
0
20
40
60
80
100
120
140
160
180
200
2010 2011 2012 2013 20140
5
10
15
20
25
30
35
40
45
50
2010 2011 2012 2013 2014

PwC ▪ Non-executive Director Fees 2014 7
Committee fees
Committee chairmanship and membership fees in FTSE companies have remained broadly static in 2014although there have been some fluctuations, particularly reflecting changes in the constituents of thegroups.
However, those companies that have adjusted fees have made significant adjustments of the order of 10%to over 30%. It may be that more companies will review fees in 2015 and 2016 to reflect the increasingdemands of many committee roles.
FTSE 100 committee fees (£’000)
FTSE 250 committee fees (£’000)
0
5
10
15
20
25
2010 2011 2012 2013 2014 2010 2011 2012 2013 2014 2010 2011 2012 2013 2014
Audit committee Remuneration committee Nomination committee
FTSE 100 membership fee FTSE 100 chairman fee
0
2
4
6
8
10
12
2010 2011 2012 2013 2014 2010 2011 2012 2013 2014 2010 2011 2012 2013 2014
Audit committee Remuneration committee Nomination committee
FTSE 250 membership fee FTSE 250 chairman fee

PwC ▪ Non-executive Director Fees 2014 8
Annual fee increases in 2014
There has been an increase in the number of companies adjusting fees in 2014.
% Companies increasing fees in 2014
% Companies increasing committee fees in 2014
0% 10% 20% 30% 40% 50% 60%
SID (additional fee)
NED (base fee)
Company chairman (total fee)
FTSE 100 FTSE 250 FTSE SMC
0% 5% 10% 15% 20% 25% 30% 35% 40%
Remuneration committee member (additional fee)
Remuneration committee chairman (additional fee)
Audit committee member (additional fee)
Audit committee chairman (additional fee)
FTSE 100 FTSE 250 FTSE SMC

PwC ▪ Non-executive Director Fees 2014 9
Level of fee increases in 2014
The table below shows, where granted, the level of fee increases in 2014.
Median increase (where given) % increase £’000 increase
FTSE 100 FTSE 250 SMC FTSE 100 FTSE 250 SMC
Chairman (total fee) 4% 6% 10% 15 10 9
NED (base fee) 7% 6% 6% 5 3 2
SID (additional fee) 23% 41% 20% 3 3 1
Audit committee chairman (additional fee) 13% 25% 25% 3 2 1
Remuneration committee chairman (additional fee) 20% 32% - 5 2 -
Audit committee member (additional fee) 17% 11% - 2 1 -
Remuneration committee member (additional fee) 20% 8% - 2 - -
% of FTSE 100 and FTSE 250 making fee increases in 2013 and 2014
0%
10%
20%
30%
40%
50%
Chairman (total fee) NED (base fee) SID Audit Remuneration Audit Remuneration
Chairman Member
Additional fee
FTSE 100: 2013 FTSE 100: 2014 FTSE 250: 2013 FTSE 250: 2014

PwC ▪ Non-executive Director Fees 2014 10
Non-executive fees
The following tables show fee levels for non-executive roles in FTSE 100, FTSE 250 and FTSE Small Cap(SMC) companies. ‘FS’ refers to financial services companies.
Chairman Deputy Chairman
FTSE 1-30
£’000 1-30 1-30 ex FS 1-30 FS 1-30 1-30 ex FS 1-30 FS
Lower quartile 500 495 - - - -
Median 638 625 750 - - -
Upper quartile 703 672 - - - -
FTSE 1-50
£’000 1-50 1-50 ex FS 1-50 FS 1-50 1-50 ex FS 1-50 FS
Lower quartile 400 401 355 - - -
Median 500 500 575 - - -
Upper quartile 650 650 738 - - -
FTSE 51-100
£’000 51-100 51-100 ex FS 51-100 FS 51-100 51-100 ex FS 51-100 FS
Lower quartile 259 257 295 - - -
Median 300 300 320 - - -
Upper quartile 360 337 370 - - -
FTSE 100
£’000 100 100 ex FS 100 FS 100 100 ex FS 100 FS
Lower quartile 300 300 310 - - -
Median 373 384 360 183 183 -
Upper quartile 500 500 475 - - -
FTSE 101-150
£’000 101-150 101-150 ex FS 101-150 FS 101-150 101-150 ex FS 101-150 FS
Lower quartile 169 176 154 - - -
Median 224 233 223 100 100 -
Upper quartile 268 285 246 - - -
FTSE 250
£’000 250 250 ex FS 250 FS 250 250 ex FS 250 FS
Lower quartile 150 160 138 55 58 -
Median 180 181 167 85 85 -
Upper quartile 235 244 231 106 103 -
SMC
£’000 SMC SMC ex FS SMC FS SMC SMC ex FS SMC FS
Lower quartile 100 100 93 50 50 -
Median 125 125 105 60 60 -
Upper quartile 150 150 158 79 79 -
PwC ▪ Non-executive Director Fees 2014 11
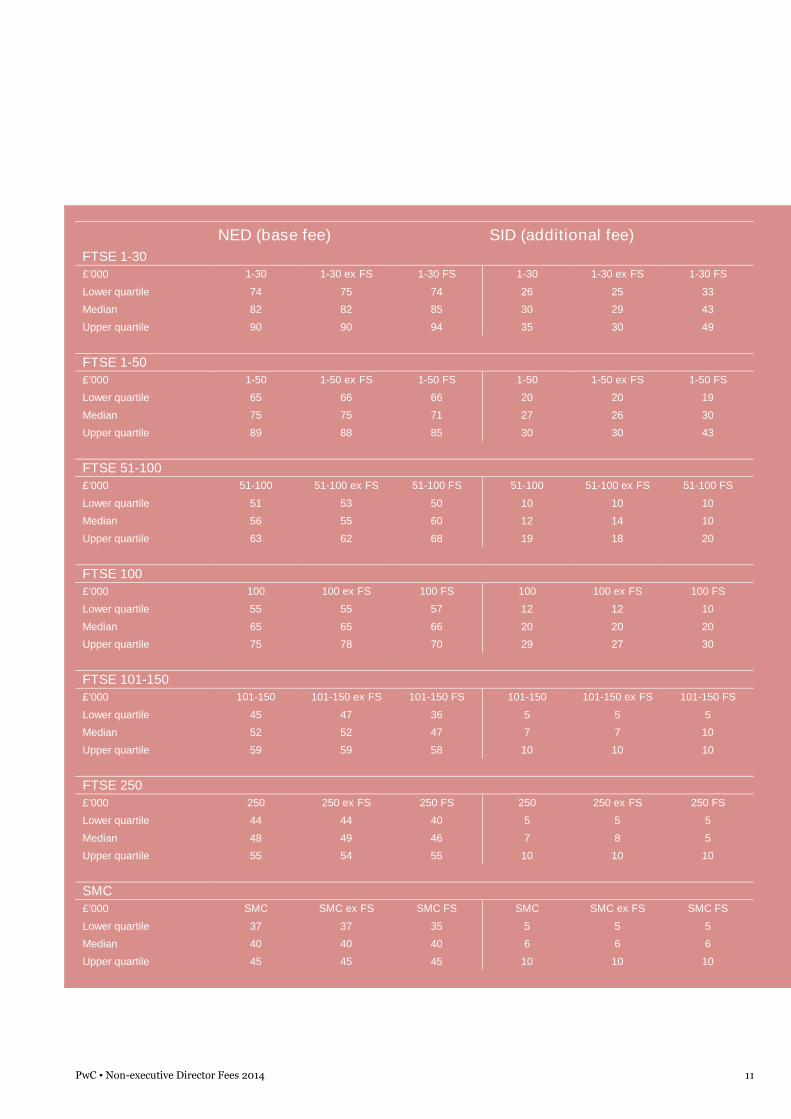
NED (base fee) SID (additional fee)
FTSE 1-30
£’000 1-30 1-30 ex FS 1-30 FS 1-30 1-30 ex FS 1-30 FS
Lower quartile 74 75 74 26 25 33
Median 82 82 85 30 29 43
Upper quartile 90 90 94 35 30 49
FTSE 1-50
£’000 1-50 1-50 ex FS 1-50 FS 1-50 1-50 ex FS 1-50 FS
Lower quartile 65 66 66 20 20 19
Median 75 75 71 27 26 30
Upper quartile 89 88 85 30 30 43
FTSE 51-100
£’000 51-100 51-100 ex FS 51-100 FS 51-100 51-100 ex FS 51-100 FS
Lower quartile 51 53 50 10 10 10
Median 56 55 60 12 14 10
Upper quartile 63 62 68 19 18 20
FTSE 100
£’000 100 100 ex FS 100 FS 100 100 ex FS 100 FS
Lower quartile 55 55 57 12 12 10
Median 65 65 66 20 20 20
Upper quartile 75 78 70 29 27 30
FTSE 101-150
£’000 101-150 101-150 ex FS 101-150 FS 101-150 101-150 ex FS 101-150 FS
Lower quartile 45 47 36 5 5 5
Median 52 52 47 7 7 10
Upper quartile 59 59 58 10 10 10
FTSE 250
£’000 250 250 ex FS 250 FS 250 250 ex FS 250 FS
Lower quartile 44 44 40 5 5 5
Median 48 49 46 7 8 5
Upper quartile 55 54 55 10 10 10
SMC
£’000 SMC SMC ex FS SMC FS SMC SMC ex FS SMC FS
Lower quartile 37 37 35 5 5 5
Median 40 40 40 6 6 6
Upper quartile 45 45 45 10 10 10

PwC ▪ Non-executive Director Fees 2014 12
Committee fees
The following tables show additional committee fee levels by FTSE index.
Audit committee
Chairman Member
FTSE 1-30£’000 1-30 1-30 ex FS 1-30 FS 1-30 1-30 ex FS 1-30 FS
Lower quartile 27 25 53 14 10 26
Median 30 30 65 20 18 30
Upper quartile 40 34 70 20 20 30
FTSE 1-50£’000 1-50 1-50 ex FS 1-50 FS 1-50 1-50 ex FS 1-50 FS
Lower quartile 25 22 30 10 10 15
Median 30 28 50 16 15 25
Upper quartile 35 30 65 20 20 30
FTSE 51-100£’000 51-100 51-100 ex FS 51-100 FS 51-100 51-100 ex FS 51-100 FS
Lower quartile 15 13 20 5 5 5
Median 15 15 23 10 6 10
Upper quartile 20 20 30 14 10 15
FTSE 100£’000 100 100 ex FS 100 FS 100 100 ex FS 100 FS
Lower quartile 15 15 20 8 8 10
Median 23 20 30 13 12 15
Upper quartile 30 30 50 20 20 25
FTSE 101-150£’000 101-150 101-150 ex FS 101-150 FS 101-150 101-150 ex FS 101-150 FS
Lower quartile 8 8 10 4 4 4
Median 10 10 11 5 5 5
Upper quartile 15 15 15 10 10 9
FTSE 250£’000 250 250 ex FS 250 FS 250 250 ex FS 250 FS
Lower quartile 8 8 8 4 4 3
Median 10 10 10 5 5 5
Upper quartile 13 12 15 7 8 5
SMC£’000 SMC SMC ex FS SMC FS SMC SMC ex FS SMC FS
Lower quartile 5 5 6 3 3 -
Median 8 8 8 5 5 -
Upper quartile 10 10 10 5 5 -
PwC ▪ Non-executive Director Fees 2014 13
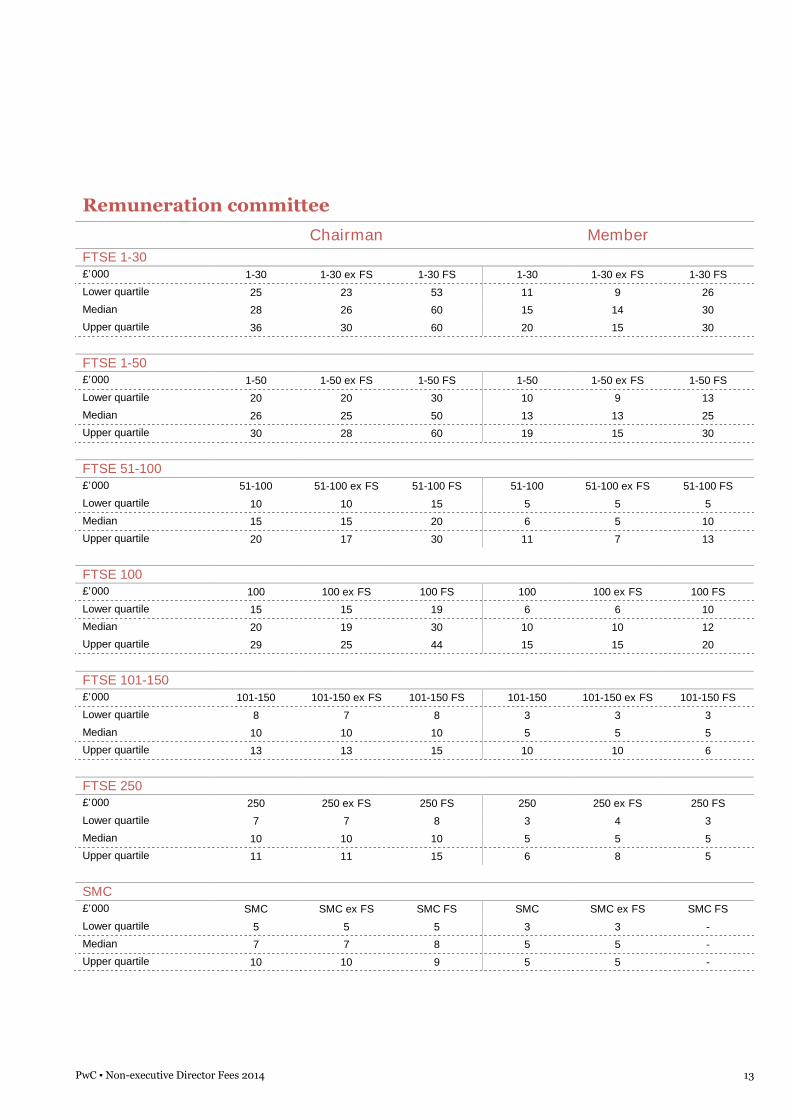
Remuneration committee
Chairman Member
FTSE 1-30£’000 1-30 1-30 ex FS 1-30 FS 1-30 1-30 ex FS 1-30 FS
Lower quartile 25 23 53 11 9 26
Median 28 26 60 15 14 30
Upper quartile 36 30 60 20 15 30
FTSE 1-50£’000 1-50 1-50 ex FS 1-50 FS 1-50 1-50 ex FS 1-50 FS
Lower quartile 20 20 30 10 9 13
Median 26 25 50 13 13 25
Upper quartile 30 28 60 19 15 30
FTSE 51-100£’000 51-100 51-100 ex FS 51-100 FS 51-100 51-100 ex FS 51-100 FS
Lower quartile 10 10 15 5 5 5
Median 15 15 20 6 5 10
Upper quartile 20 17 30 11 7 13
FTSE 100£’000 100 100 ex FS 100 FS 100 100 ex FS 100 FS
Lower quartile 15 15 19 6 6 10
Median 20 19 30 10 10 12
Upper quartile 29 25 44 15 15 20
FTSE 101-150£’000 101-150 101-150 ex FS 101-150 FS 101-150 101-150 ex FS 101-150 FS
Lower quartile 8 7 8 3 3 3
Median 10 10 10 5 5 5
Upper quartile 13 13 15 10 10 6
FTSE 250£’000 250 250 ex FS 250 FS 250 250 ex FS 250 FS
Lower quartile 7 7 8 3 4 3
Median 10 10 10 5 5 5
Upper quartile 11 11 15 6 8 5
SMC£’000 SMC SMC ex FS SMC FS SMC SMC ex FS SMC FS
Lower quartile 5 5 5 3 3 -
Median 7 7 8 5 5 -
Upper quartile 10 10 9 5 5 -
PwC ▪ Non-executive Director Fees 2014 14
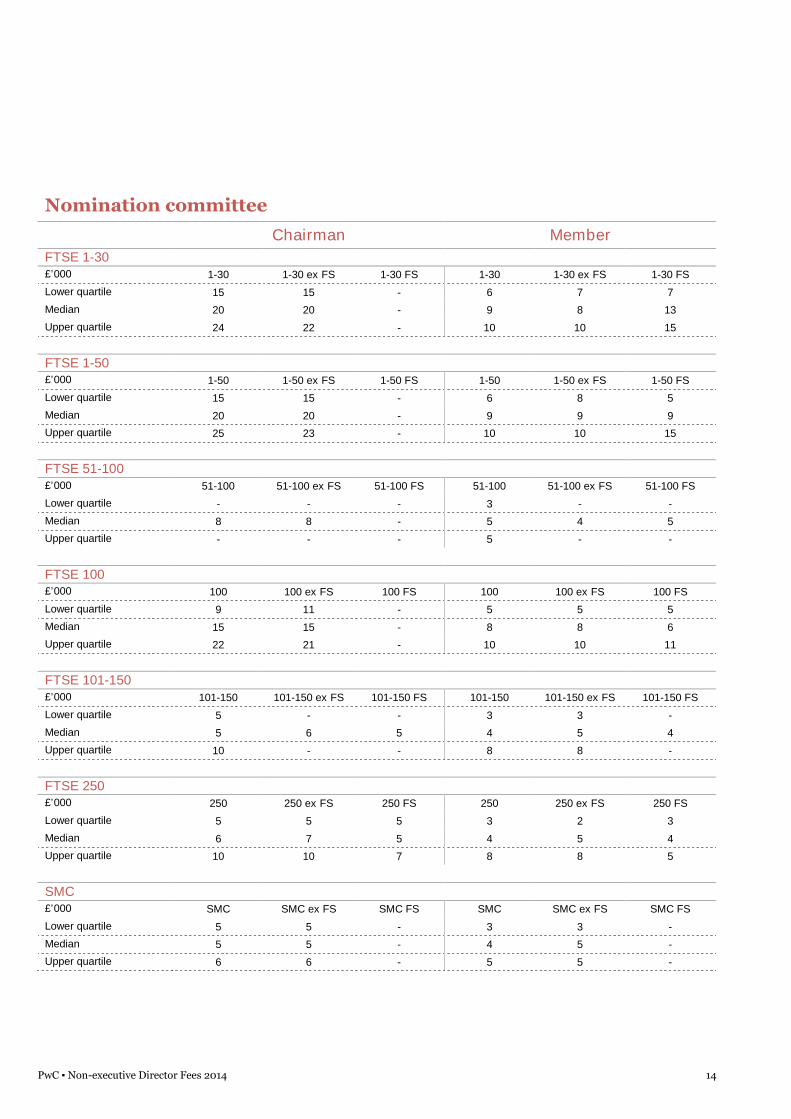
Nomination committee
Chairman Member
FTSE 1-30£’000 1-30 1-30 ex FS 1-30 FS 1-30 1-30 ex FS 1-30 FS
Lower quartile 15 15 - 6 7 7
Median 20 20 - 9 8 13
Upper quartile 24 22 - 10 10 15
FTSE 1-50£’000 1-50 1-50 ex FS 1-50 FS 1-50 1-50 ex FS 1-50 FS
Lower quartile 15 15 - 6 8 5
Median 20 20 - 9 9 9
Upper quartile 25 23 - 10 10 15
FTSE 51-100£’000 51-100 51-100 ex FS 51-100 FS 51-100 51-100 ex FS 51-100 FS
Lower quartile - - - 3 - -
Median 8 8 - 5 4 5
Upper quartile - - - 5 - -
FTSE 100£’000 100 100 ex FS 100 FS 100 100 ex FS 100 FS
Lower quartile 9 11 - 5 5 5
Median 15 15 - 8 8 6
Upper quartile 22 21 - 10 10 11
FTSE 101-150£’000 101-150 101-150 ex FS 101-150 FS 101-150 101-150 ex FS 101-150 FS
Lower quartile 5 - - 3 3 -
Median 5 6 5 4 5 4
Upper quartile 10 - - 8 8 -
FTSE 250£’000 250 250 ex FS 250 FS 250 250 ex FS 250 FS
Lower quartile 5 5 5 3 2 3
Median 6 7 5 4 5 4
Upper quartile 10 10 7 8 8 5
SMC£’000 SMC SMC ex FS SMC FS SMC SMC ex FS SMC FS
Lower quartile 5 5 - 3 3 -
Median 5 5 - 4 5 -
Upper quartile 6 6 - 5 5 -
PwC ▪ Non-executive Director Fees 2014 15
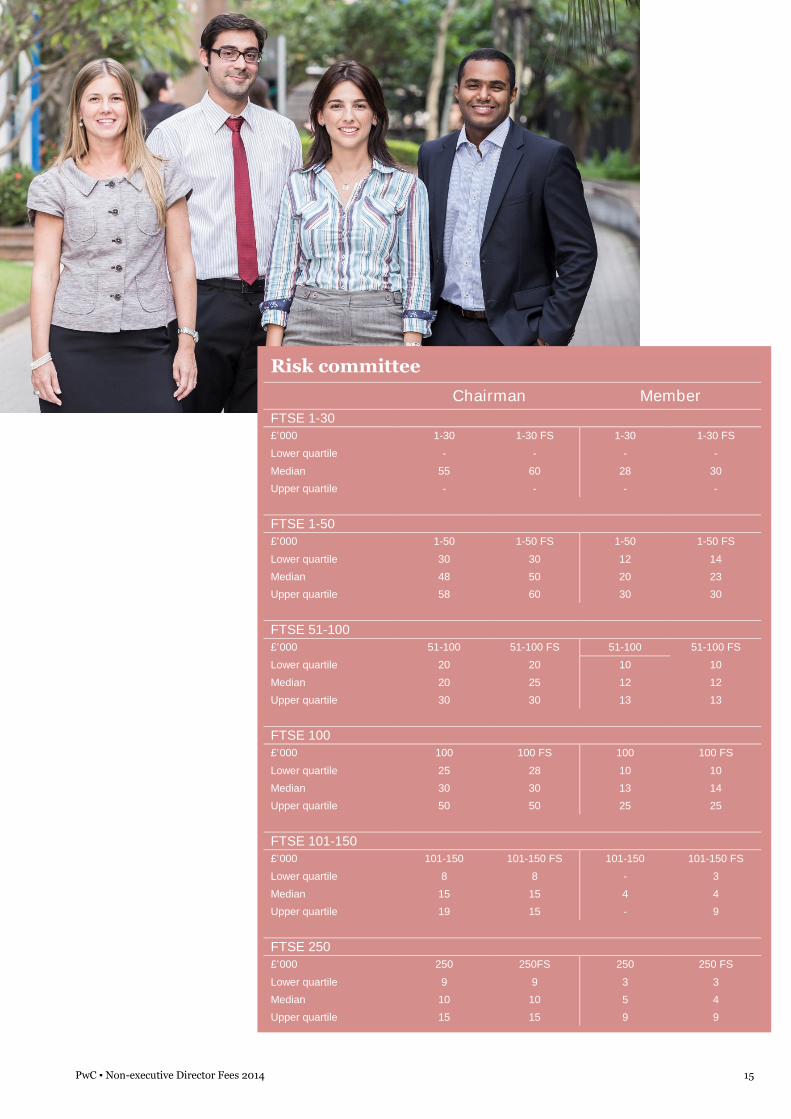
Risk committee
Chairman Member
FTSE 1-30
£’000 1-30 1-30 FS 1-30 1-30 FS
Lower quartile - - - -
Median 55 60 28 30
Upper quartile - - - -
FTSE 1-50
£’000 1-50 1-50 FS 1-50 1-50 FS
Lower quartile 30 30 12 14
Median 48 50 20 23
Upper quartile 58 60 30 30
FTSE 51-100
£’000 51-100 51-100 FS 51-100 51-100 FS
Lower quartile 20 20 10 10
Median 20 25 12 12
Upper quartile 30 30 13 13
FTSE 100
£’000 100 100 FS 100 100 FS
Lower quartile 25 28 10 10
Median 30 30 13 14
Upper quartile 50 50 25 25
FTSE 101-150
£’000 101-150 101-150 FS 101-150 101-150 FS
Lower quartile 8 8 - 3
Median 15 15 4 4
Upper quartile 19 15 - 9
FTSE 250
£’000 250 250FS 250 250 FS
Lower quartile 9 9 3 3
Median 10 10 5 4
Upper quartile 15 15 9 9

PwC ▪ Non-executive Director Fees 2014 16
Other committees
Chairman Member
FTSE 1-30
£’000 1-30 1-30 ex FS 1-30 FS 1-30 1-30 ex FS 1-30 FS
Lower quartile 20 19 - 8 8 -
Median 29 23 60 12 10 30
Upper quartile 45 30 - 20 14 -
FTSE 1-50
£’000 1-50 1-50 ex FS 1-50 FS 1-50 1-50 ex FS 1-50 FS
Lower quartile 20 17 39 8 7 -
Median 25 20 55 12 10 30
Upper quartile 32 29 60 18 13 -
FTSE 51-100
£’000 51-100 51-100 ex FS 51-100 FS 51-100 51-100 ex FS 51-100 FS
Lower quartile 9 8 13 4 - 5
Median 13 11 18 5 - 5
Upper quartile 16 13 28 10 - 16
FTSE 100
£’000 100 100 ex FS 100 FS 100 100 ex FS 100 FS
Lower quartile 13 12 19 6 6 5
Median 20 17 31 10 9 16
Upper quartile 30 22 53 17 12 27
FTSE 101-150
£’000 101-150 101-150 ex FS 101-150 FS 101-150 101-150 ex FS 101-150 FS
Lower quartile 6 6 - - - -
Median 11 12 - 6 - -
Upper quartile 16 17 - - - -
FTSE 250
£’000 250 250 ex FS 250 FS 250 250 ex FS 250 FS
Lower quartile 8 8 8 5 5 -
Median 10 10 10 6 8 -
Upper quartile 12 13 10 8 8 -
FTSE SMC
£’000 SMC SMC ex FS SMC FS SMC SMC ex FS SMC FS
Lower quartile - - - - - -
Median - - - - - -
Upper quartile - - - - - -
‘Other’ committees predominantly include Health & Safety or Corporate Social Responsibility committees. Where present, thetype of committee is often governed by the sector in which a company operates.

PwC ▪ Non-executive Director Fees 2014 17
Contacts
To discuss any of the findings in this report, please contactour survey team or your usual PwC contact.
Reward data team Pay, Performance and Risk partners
Alastair Woods
Director
+44 (0) 207 804 8102
Sebastian Scott
+44 (0) 207 804 5145
Survey team mailbox
NED development programmeAndy Kemp
Partner
+44 (0) 207 804 4408
Liz Smith
Director
+44 (0) 207 804 5314
Tom Gosling
Head of Pay, Performance & Risk
+44 (0) 207 212 3973
Fiona Camenzuli
+44 (0) 207 804 4175
Carol Dempsey
+44 (0) 207 212 4641
Sean Drury
+44 (0) 207 212 5552
Dean Farthing
+44 (0) 207 212 5323
John Harding
+44 (0) 161 247 4542
Isabel McGarvie
+44 (0) 141 355 4060
Phillippa O’Connor
+44 (0) 207 213 4589
Marcus Peaker
+44 (0) 207 804 0249
Julian Sansum
+44 (0) 207 212 1652
Jon Terry
+44 (0) 207 212 4370
Paul Wolstenholme
+44 (0) 207 212 6225

This publication has been prepared for general guidance on matters of interest only, and does not constitute professional advice. You should not
act upon the information contained in this publication without obtaining specific professional advice. No representation or warranty (express or
implied) is given as to the accuracy or completeness of the information contained in this publication, and, to the extent permitted by law,
PricewaterhouseCoopers LLP, its members, employees and agents do not accept or assume any liability, responsibility or duty of care for any
consequences of you or anyone else acting, or refraining to act, in reliance on the information contained in this publication or for any decision
based on it.
© 2015 PricewaterhouseCoopers LLP. All rights reserved. In this document, 'PwC' refers to the UK member firm, and may sometimes refer to
the PwC network. Each member firm is a separate legal entity. Please see www.pwc.com/structure for further details.