nomura financial services conference 2011 - aviva · pdf filerisk and uncertainty....
TRANSCRIPT

Nomura Financial Services Conference 2011
1
Fitter
Stronger
DisclaimerCautionary statements:
This should be read in conjunction with the documents filed by Aviva plc (the “Company” or “Aviva”) with the United States Securities and Exchange Commission (“SEC”). This announcement contains, and we may make verbal statements containing, “forward-looking statements” with respect to certain of Aviva’s plans and current goals and expectations relating to future financial condition, performance, results, strategic initiatives and objectives. Statements containing the words “believes”, “intends”, “expects”, “plans”, “will,” “seeks”, “aims”, “may”, “could”, “outlook”, “estimates” and “anticipates”, and words of similar meaning, are forward-looking. By their nature, all forward-looking statements involve risk and uncertainty. Accordingly, there are or will be important factors that could cause actual results to differ materially from those indicated in these statements. Aviva believes factors that could cause actual results to differ materially from those indicated in forward-looking statements in the presentation include, but are not limited to: the impact of difficult conditions in the global capital markets and the economy generally; the impact of new government initiatives related to the financial crisis; defaults and impairments in our bond, mortgage and structured credit portfolios; changes in general economic conditions, including foreign currency exchange rates, interest rates and other factors that could affect our profitability; the impact of volatility in the equity, capital and credit markets on our profitability and ability to access capital and credit; risks associated with arrangements with third parties, including joint ventures; inability of reinsurers to meet obligations or unavailability of reinsurance coverage; a decline in our ratings with Standard & Poor’s, Moody’s, Fitch and A.M. Best; increased competition in the U.K. and in other countries where we have significant operations; changes to our brands and reputation; changes in assumptions in pricing and reserving for insurance business (particularly with regard to mortality and morbidity trends, lapse rates and policy renewal rates), longevity and endowments; a cyclical downturn of the insurance industry; changes in local political, regulatory and economic conditions, business risks and challenges which may impact demand for our products, our investment portfolio and credit quality of counterparties; the impact of actual experience differing from estimates on amortisation of deferred acquisition costs and acquired value of in-force business; the impact of recognising an impairment of our goodwill or intangibles with indefinite lives; changes in valuation methodologies, estimates and assumptions used in the valuation of investment securities; the effect of various legal proceedings and regulatory investigations; the impact of operational risks; the loss of key personnel; the impact of catastrophic events on our results; changes in government regulations or tax laws in jurisdictions where we conduct business; funding risks associated with our pension schemes; the effect of undisclosed liabilities, integration issues and other risks associated with our acquisitions; and the timing impact and other uncertainties relating to acquisitions and disposals and relating to other future acquisitions, combinations or disposals within relevant industries. For a more detailed description of these risks, uncertainties and other factors, please see Item 3, “Risk Factors”, and Item 5, “Operating and Financial Review and Prospects” in Aviva’s Annual Report Form 20-F as filed with the SEC on 24 March 2011. Aviva undertakes no obligation to update the forward looking statements in this announcement or any other forward-looking statements we may make. Forward-looking statements in this presentation are current only as of the date on which such statements are made.
2

A fitter, stronger Aviva
3
Operating performance
Strategic delivery to finance growth
Strong capital
Competitive advantage

1 excluding Delta Lloyd 2 Pro forma for sale of RAC
IFRS operating profit
13% underlying
growth
HY11HY10
£1,337m£1,270m
5%
Net operating capital generated
HY11
£0.9bn £0.8bn
HY10
MCEV NAV575p
542p
FY10
14%
Funds under management1
£352bn
HY11FY10
£340bn
£0.2bn non-recurring
£0.7bn recurring
Economic capital surplus
£5.6bn
FY10
£4.8bn
FY09
Interim dividend
10.0p
HY11HY10
5%9.5p
£6.9bn
HY11pro forma2
4
£84m special distribution
4%
HY11pro forma2
HY11: further success in all key areas

UK: building a dominant UK franchise
* Excluding health, Aviva Re and run off businesses
L&P sales
£5.2bn£5.5bn
£3.5bn
HY10 HY11
5%
HY10
GI NWP*£2,222m
HY11
£1,942m 14%
£2.9bn GPP, annuities, protection
22%
5
IFRS operating profits
£379m
£463m £462m
HY10 HY11
£229m£242m
HY10 HY11
GI operating profits*
6%
£84m special distribution 22%
Life
GI
15%16%
HY10 HY11
New business IRR
HY10 HY11
96%
98%
GI COR*
Growing the franchise
Growing capital generation
Strong balance sheet
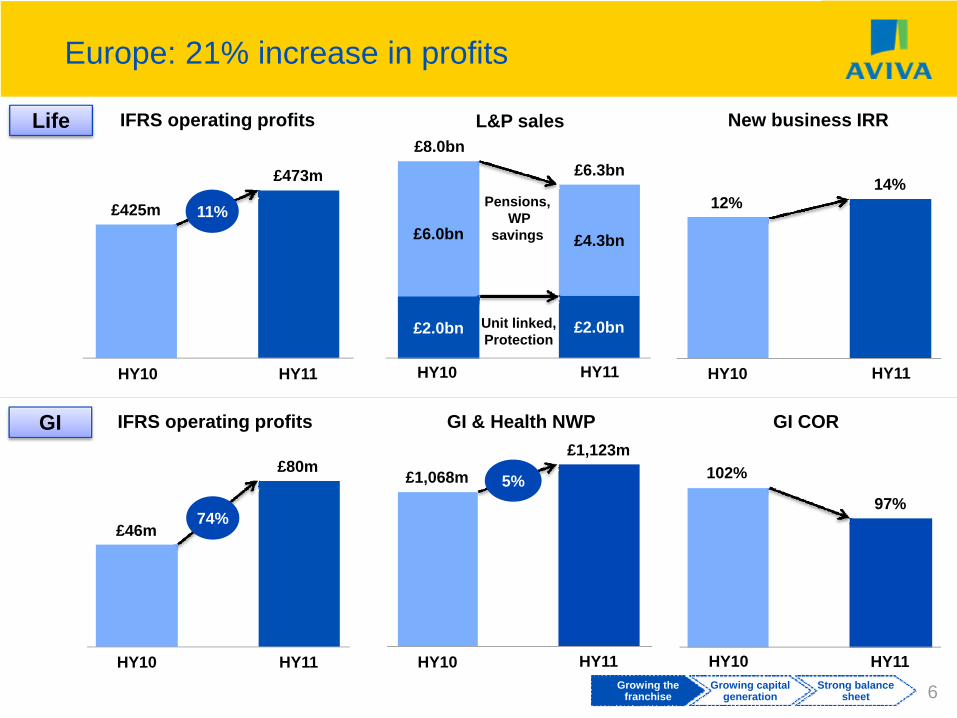
Europe: 21% increase in profits
£425m
£473m
HY10 HY11
11%
£46m
£80m
HY10 HY11
IFRS operating profits
74%
6
HY10 HY11
£2.0bn
£4.3bn£6.0bn
£2.0bn Unit linked, Protection
Pensions,WP
savings
£8.0bn£6.3bn
HY10
£1,123m
HY11
£1,068m 5%
GI & Health NWP
Life
GI
12%14%
HY10 HY11
HY10 HY11
97%
102%
GI COR
New business IRRL&P salesIFRS operating profits
Growing the franchise
Growing capital generation
Strong balance sheet

Beating targets
7
14% life insurance new business IRR against a target of 12%
96% group COR against a target of 97%
£0.8 billion capital generation in H1 towards the £1.5 billion FY11 targetAiming to generate £1.5 billion - £1.8 billion in 2011
On track to deliver £400 million cost and efficiency savings by 2012
Growing the franchise
Growing capital generation
Strong balance sheet

1 Deficit at FY09.
The new Aviva: fitter, stronger & positioned for growth
8
Life IRR 11%
GI COR 98%
Cost base £5.7 billion
Headcount 54,700
Pension deficit £1.7 billion1
VIF £5.0 billion
FY 2008
Economic capital surplus< £3 billion
Profitability
Efficiency
Risk & liabilities
In-force book
Life IRR 14%
HY 2011
£2.3 billionOperating profit
GI COR 96%
VIF £6.6 billion
Cost base £3.9 billion2
Headcount 36,1002
Economic capital surplus£6.9 billion3
Pension deficit Nil
HY £1,337 million – FY?
2 annualised excluding RAC and Delta Lloyd. 3 pro forma for sale of RAC.Growing the
franchiseGrowing capital
generationStrong balance
sheet

Increase in underlying capital generation
£bn
Capital generation and allocation
Generated AllocatedHY11
NetHY10
Net
UK 0.4 - 0.4 0.6
Europe 0.5 (0.3) 0.2 0.1
North America 0.3 (0.2) 0.1 0.2
Asia Pacific - - - -
Delta Lloyd 0.1 - 0.1 -
Total 1.3 (0.5) 0.8 0.9
* HY10 non-life allocation reduced by £0.2bn GI capital release
-800
-400
0
400
800
1200
HY10HY11
£mCapital generation and allocation
Life generation
Non-life generation
Life allocation
Non-life allocation*
Life total Non-life total
Growing the franchise
Growing capital generation
Strong balance sheet 9
HY10 HY11
Capital efficiency1
4.5%
4.0%
1 Capital efficiency = life allocation/PVNBP net of tax and minorities. Excludes Delta Lloyd
GroupTotal
Payback period 6 years
Payback period 7 years

Reduced balance sheet asset risk after Delta Lloyd sell down
£148bn
£113bn
FY10 HY11
Total shareholder assets
£5bn
£1bn
FY10 HY11
Equity holdings in shareholder assets
£35bn
£19bn
FY10 HY11
Mortgages & loans in shareholder assets
Mortgages and loans include £8bn UK mortgage book
Dec2009
Dec 2010
AnnualisedJune2011
Annual interest income £641m £621m £631m
Annual rental income £842m £822m £831m
Rental/interest cover 1.3x 1.3x 1.3x
£750 million UK mortgage provision remains in place
Growing the franchise
Growing capital generation
Strong balance sheet 10

0
2
4
6
8
10
12
UK Annuities UK Protection US Life & Annuity Europe
Assets Liabilities
£21.0bn
Asset and liability durations across the Group are well matched
Durations of assets and liability by region
Duration in years (HY 2010)
11
• Assets and liabilities are duration matched at point of sale
• Regional in-force portfolios are reviewed regularly to ensure continued matching over time
• Benchmarking metrics aligned to ALM and not to pure out-performance
• Diversity across products and regions helps to manage the overall ALM risk profile
Shareholder funds
Portfoliovalue £31bn £15.8bn£0.8bn
Growing the franchise
Growing capital generation
Strong balance sheet

Good corporate and government debt track record
2010 HY11
10bps< 5bps
2009
HY11
Direct shareholder
exposure£bn
Total participating
exposure£bn
Greece - 0.1
Spain 0.3 0.6
Portugal - 0.3
Ireland 0.2 0.4
Total 0.5 1.4
Italy 0.9 6.6
Limited exposure to higher risk European debt
Limited default experience
£0.5bn
FY10 HY11
£0.7bn
Direct shareholder exposure to Greece, Spain, Portugal & Ireland sovereign debt
UK Corporate bonds US debt securities
2010 HY11
40bps31bps
2009
Growing the franchise
Growing capital generation
Strong balance sheet 12
< 5bps
* net of minority interests. All numbers exclude Delta Lloyd
zero

Increased economic capital surplus
* Pension scheme risk is allowed for through five years of stressed contributionsCapital required is based on Aviva’s own internal assessment and capital management policies. The term ‘economic capital’ does not imply capital as required by regulators or other third parties.
2010 increase primarily due to benefit of retained profits
Growing the franchise
Growing capital generation
Strong balance sheet
FY10FY09 HY11
Economic capital surplus*
£4.8bn
£5.6bn
2011 increase due to retained profits, issuance of subordinated debt, further sell down of Delta Lloyd and sale of RAC
IGD solvency also remains strong at £4.0 billion surplus
£6.9bn
13
£6.6bn
adjustment for RAC
AA- rating retained throughout the crisis
Ongoing de-risking of pension scheme through asset hedging

Drivers of growth in profit
14
GI COR
38bps
FY10FY09 HY11
42bps
Admin cost ratio on life reserves
46bps
£4,708m
HY10HY09 HY11
£4,337m
GI & Health NWP
£4,270m
£271bn
FY10FY09 HY11
£253bn
Average life in-force reserves
£237bn
96%
HY10HY09 HY11
97%97%
All numbers based on continuing business – excluding Delta Lloyd

Q&A
15