nomura 2011 healthcare conference · sources: pharma -ims and internal analysis; devices -mdi, ims...
TRANSCRIPT

Nomura 2011 Healthcare Conference June 30, 2011

2
Safe Harbor
This material contains forward-looking statements within the meaning of the federal securities laws. Hospira intends these forward-looking statements to be covered by the safe harbor provisions for forward-looking statements in the federal securities laws. In some cases, you can identify these statements by our use of forward-looking words such as “may,” “will,” “should,” “anticipate,” “estimate,” “expect,” “plan,” “believe,” “predict,” “potential,” “project,” “intend,” “could” or similar expressions. In particular, statements regarding our plans, strategies, prospects, goals and expectations regarding our business and the industries and markets in which we operate are forward-looking statements. You should be aware that these statements and any other forward-looking statements in this material only reflect our expectations and are not guarantees of performance. These statements involve risks, uncertainties and assumptions. Many of these risks, uncertainties and assumptions are beyond our control and may cause actual results and performance to differ materially from our expectations. Important factors that could cause our actual results to be materially different from our expectations include the factors, risks and uncertainties described under the headings “Risk Factors” and “Management’s Discussion and Analysis of Financial Condition and Results of Operations” in Hospira’s latest Annual Report on Form 10-K filed with the Securities and Exchange Commission. Accordingly, you should not place undue reliance on the forward-looking statements contained in this material. These forward-looking statements speak only as of the date on which the statements were made. We undertake no obligation to update or revise publicly any forward-looking statements, whether as a result of new information, future events or otherwise. Statements related to 2011 full year estimates are based on the guidance range as of the April 26, 2011 quarterly conference call. Guidance has not been updated.

3
Hospira At a Glance
• Global specialty pharmaceutical / medication management company
• Provide products to hospitals and alternate healthcare providers
• Market leadership positions in: – generic injectable pharmaceuticals globally – biosimilars in Europe and Australia – medication management systems globally
• 70+ years experience; public since 2004
• Annual revenues of ~$4B
• Market cap ~$9B

4
Positioning Hospira for Stronger Performance …
2004 – 2007
Spin-off and Integration – Achieved independence – Acquired Mayne Pharma
2008 – 2010 2011+
Optimization – Project Fuel
Sustaining Growth – Top-quartile performance – Capacity expansion initiative
Investing for Growth
Improving Margins and Cash Flow
5
HOSPIRA GOING FORWARD
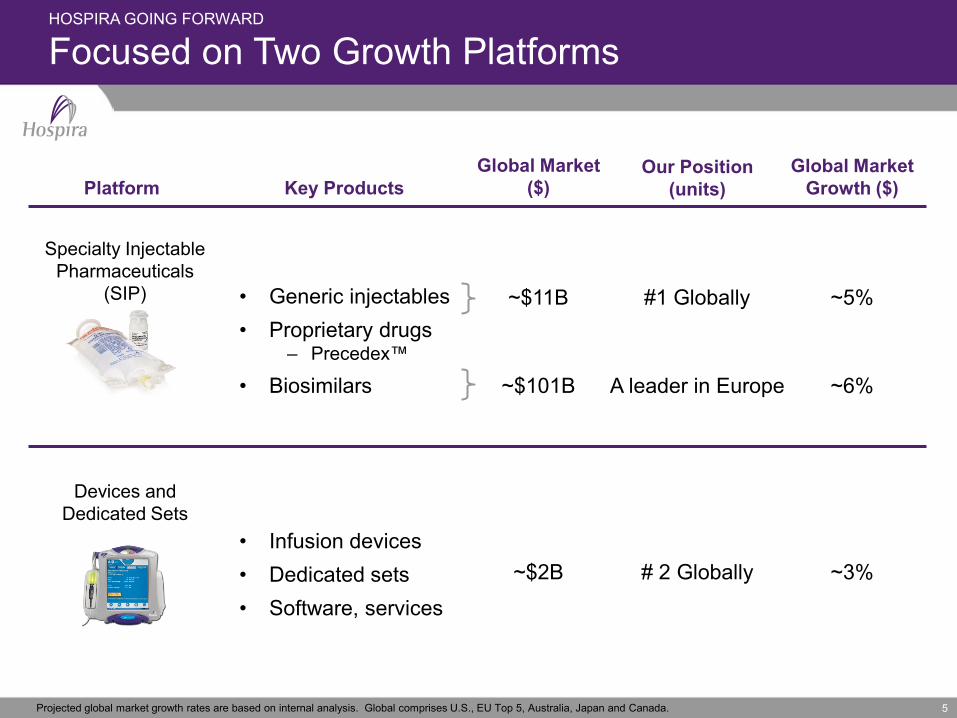
Focused on Two Growth Platforms
Platform Key Products Global Market
($) Our Position
(units) Global Market
Growth ($)
Specialty Injectable Pharmaceuticals
(SIP) • Generic injectables • Proprietary drugs
– Precedex™
• Biosimilars
~$11B #1 Globally ~5%
Devices and Dedicated Sets
• Infusion devices • Dedicated sets • Software, services
~$2B # 2 Globally ~3%
Projected global market growth rates are based on internal analysis. Global comprises U.S., EU Top 5, Australia, Japan and Canada.
~$101B A leader in Europe ~6%

6
Global Leadership Position
#1 in Generic Injectables #2 in Devices and Sets
Global market share, 2009, in units; devices and dedicated sets represent global installed base. Global comprises U.S., EU Top 5, Australia, Japan and Canada. Sources: Pharma-IMS and internal analysis; Devices-MDI, IMS Hospital Supply Index, Millennium Research Group, other syndicated and company reports; internal analysis.
Hospira Fresenius Baxter Novartis Boehringer Ingelheim Sanofi Pfizer Teva Other
15%
12%13%
9%
8%
16%27%
Hospira
4%4% 4%3% 5%
8%
10%
24%
38%Hospira Hospira
CareFusion Baxter B Braun Terumo Fresenius Other

7
Hospira Growth Drivers
3-5% New Products
Biosimilars
Int’l Expansion
Ongoing Optimization
Efforts
3-Year Market Growth
Tuck-in Acquisitions &
Alliances
Hospira

8
Driving Continued Improvement …
Net Sales ($B)
$2.5 $2.6
$3.6$3.9
2004 2006 2008 2010
Operating Margin*
14.9%16.2%
17.8%
20.0%
2004 2006 2008 2010
EPS*
$1.82$1.94
$2.53
$3.31
2004 2006 2008 2010
* Adjusted Operating Margin and EPS for 2004-2010 are adjusted non-GAAP measures. Non-GAAP measures are reconciled to GAAP measures in the Appendix.

9
Key Opportunities Going Forward
Specialty Injectable Pharmaceuticals (SIP) – Continued contribution from our baseline portfolio – Additional pipeline launches across Hospira’s regions – Successful US launches of two large Paragraph IV drugs – Continued progress with biosimilar drugs in Europe
and Nivestim™ in Australia – Market re-entry of oxaliplatin, a large Paragraph IV oncology drug – Three smaller proprietary drug launches, two for pain
management and one oncology/hematology – Expected biosimilar market formation in the US
Medication Management (MM) – Competitor infusion device recall opportunity – Return to market of Symbiq™ Infusion System – Advancements in ancillary products /services for our
Medication Management devices
Other Areas: – Market growth opportunities in OUS markets – Continued results and benefits from Project Fuel – Continued results from optimization initiatives

10
WHY INVEST IN HOSPIRA:
Delivering Long-term Sustained Growth
Today: Strong
performance
Two solid growth platforms
Unique positioning
Optimization benefits
Strong financial position
Tomorrow: Exceptional potential as
strategy executed
Multi-year growth drivers – new products share gains
– international growth
– biosimilars
– full impact of Project Fuel


12 12
GAAP to Non-GAAP Reconciliations
Adjusted Operating Margin (in $ millions, except for percentages)
2010 2009 2008 2007 2006 2005 2004Net Sales - GAAP 3,917.2$ 3,879.3$ 3,629.5$ 3,436.2$ 2,688.5$ 2,626.7$ 2,645.0$ Income from Operations - GAAP 519.2 502.9 517.8 302.6 339.6 336.6 427.7 Specified items: Project Fuel and related impairment charges 27.8 136.5 - - - - - Facilities Optimization charges and related impairment charges 16.9 28.4 35.4 43.5 49.6 37.9 - Amortization of certain intangible assets 70.0 54.2 62.8 47.5 - - - Certain quality and product related charges 54.3 - - - - - - Acquisition and integration-related charges 20.2 - 30.6 44.9 2.0 - - Impairment of certain assets 12.7 - - - - - - Research and development charges 48.8 16.0 - - - - - Litigation settlement and related charges 14.0 - - - - - - Purchase accounting charges - - 0.5 141.1 10.0 - - Non-recurring transition charges - - - - 35.0 46.0 32.2 Curtailment gain - - - - - - (64.6) Sub-total of Specified items 264.7 235.1 129.3 277.0 96.6 83.9 (32.4) Income from Operations - Adjusted 783.9$ 738.0$ 647.1$ 579.6$ 436.2$ 420.5$ 395.3$
Operating Margin - GAAP 13.3% 13.0% 14.3% 8.8% 12.6% 12.8% 16.2%Operating Margin - Adjusted 20.0% 19.0% 17.8% 16.9% 16.2% 16.0% 14.9%

13 13
GAAP to Non-GAAP Reconciliations
Adjusted Earnings Per Share (in $)
2010 2009 2008 2007 2006 2005 2004Diluted Earnings Per Share - GAAP $2.11 $2.47 $1.99 $0.85 $1.48 $1.46 $1.92Specified items: Project Fuel and related impairment charges 0.09 0.69 - - - - - Facilities Optimization charges and related impairment charges 0.07 0.12 0.14 0.17 0.23 0.23 - Amortization of certain intangible assets 0.28 0.23 0.26 0.20 - - - Certain quality and product related charges 0.20 - - - - - - Acquisition and integration-related charges 0.07 - 0.14 0.21 0.01 - - Impairment of certain assets 0.12 - - - - - - Research and development charges 0.18 0.07 - - - - - Litigation settlement and related charges 0.05 - - - - - - Loss on early debt extinguishment 0.14 - - - - - - Impairment of marketable equity securities - 0.10 - - - - - Resolution of IRS tax audit benefit - (0.57) - - - - - Purchase accounting charges - - - 0.76 0.06 - - Non-recurring transition charges - - - - 0.16 0.22 0.16 Curtailment gain - - - - - - (0.26) Sub-total of Specified items 1.20 0.64 0.54 1.34 0.46 0.45 (0.10) Diluted Earnings Per Share - Adjusted 3.31$ 3.11$ 2.53$ 2.19$ 1.94$ 1.91$ 1.82$
Year over year percentage change - GAAP (14.6)% 24.1% 134.1% (42.6)% 1.4% (24.0)%Year over year percentage change - Adjusted 6.4% 22.9% 15.5% 12.9% 1.6% 4.8%
14 14
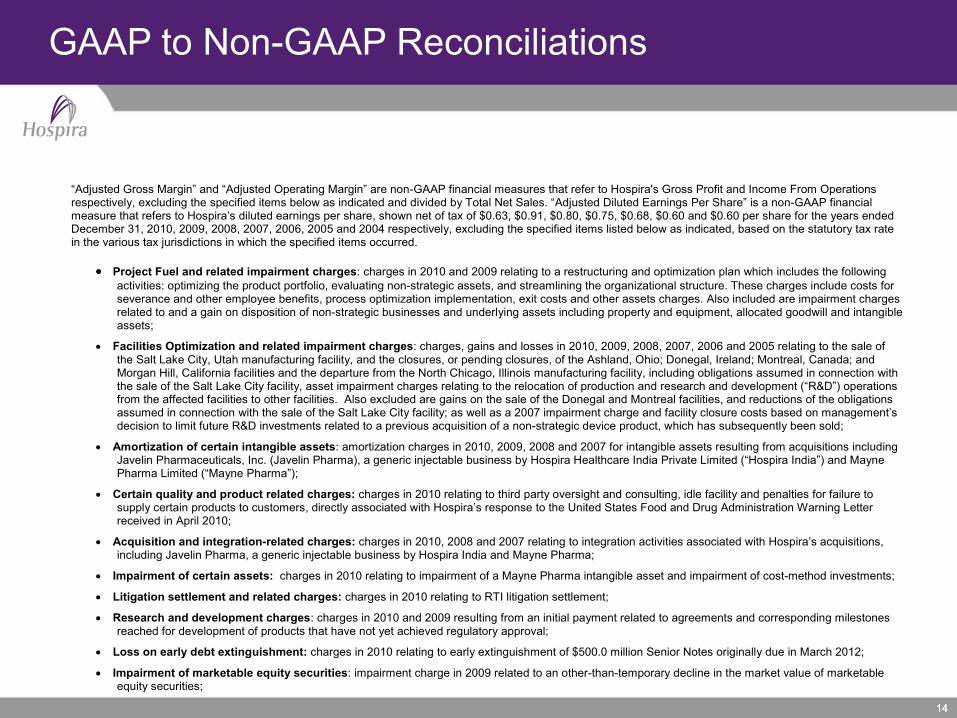
GAAP to Non-GAAP Reconciliations
“Adjusted Gross Margin” and “Adjusted Operating Margin” are non-GAAP financial measures that refer to Hospira's Gross Profit and Income From Operations respectively, excluding the specified items below as indicated and divided by Total Net Sales. “Adjusted Diluted Earnings Per Share” is a non-GAAP financial measure that refers to Hospira’s diluted earnings per share, shown net of tax of $0.63, $0.91, $0.80, $0.75, $0.68, $0.60 and $0.60 per share for the years ended December 31, 2010, 2009, 2008, 2007, 2006, 2005 and 2004 respectively, excluding the specified items listed below as indicated, based on the statutory tax rate in the various tax jurisdictions in which the specified items occurred.
• Project Fuel and related impairment charges: charges in 2010 and 2009 relating to a restructuring and optimization plan which includes the following activities: optimizing the product portfolio, evaluating non-strategic assets, and streamlining the organizational structure. These charges include costs for severance and other employee benefits, process optimization implementation, exit costs and other assets charges. Also included are impairment charges related to and a gain on disposition of non-strategic businesses and underlying assets including property and equipment, allocated goodwill and intangible assets;
• Facilities Optimization and related impairment charges: charges, gains and losses in 2010, 2009, 2008, 2007, 2006 and 2005 relating to the sale of the Salt Lake City, Utah manufacturing facility, and the closures, or pending closures, of the Ashland, Ohio; Donegal, Ireland; Montreal, Canada; and Morgan Hill, California facilities and the departure from the North Chicago, Illinois manufacturing facility, including obligations assumed in connection with the sale of the Salt Lake City facility, asset impairment charges relating to the relocation of production and research and development (“R&D”) operations from the affected facilities to other facilities. Also excluded are gains on the sale of the Donegal and Montreal facilities, and reductions of the obligations assumed in connection with the sale of the Salt Lake City facility; as well as a 2007 impairment charge and facility closure costs based on management’s decision to limit future R&D investments related to a previous acquisition of a non-strategic device product, which has subsequently been sold;
• Amortization of certain intangible assets: amortization charges in 2010, 2009, 2008 and 2007 for intangible assets resulting from acquisitions including Javelin Pharmaceuticals, Inc. (Javelin Pharma), a generic injectable business by Hospira Healthcare India Private Limited (“Hospira India”) and Mayne Pharma Limited (“Mayne Pharma”);
• Certain quality and product related charges: charges in 2010 relating to third party oversight and consulting, idle facility and penalties for failure to supply certain products to customers, directly associated with Hospira’s response to the United States Food and Drug Administration Warning Letter received in April 2010;
• Acquisition and integration-related charges: charges in 2010, 2008 and 2007 relating to integration activities associated with Hospira’s acquisitions, including Javelin Pharma, a generic injectable business by Hospira India and Mayne Pharma;
• Impairment of certain assets: charges in 2010 relating to impairment of a Mayne Pharma intangible asset and impairment of cost-method investments;
• Litigation settlement and related charges: charges in 2010 relating to RTI litigation settlement;
• Research and development charges: charges in 2010 and 2009 resulting from an initial payment related to agreements and corresponding milestones reached for development of products that have not yet achieved regulatory approval;
• Loss on early debt extinguishment: charges in 2010 relating to early extinguishment of $500.0 million Senior Notes originally due in March 2012;
• Impairment of marketable equity securities: impairment charge in 2009 related to an other-than-temporary decline in the market value of marketable equity securities;

15 15
GAAP to Non-GAAP Reconciliations
• Resolution of IRS tax audit benefit: discrete income tax benefit in 2009 relating to the completion and effective settlement of the 2004 and 2005 U.S. tax return audits;
• Purchase accounting charges*: charges in 2008, 2007 and 2006 relating to: the write-off of acquired in-process R&D associated with the 2008 acquisition of a medical device technology developer; the inventories step-up and write-off of acquired in-process R&D relating to the 2007 acquisition of Mayne Pharma; the 2007 purchase of certain clinical studies related to a compound that will be used to file for expanded medical indications; and the write-off of acquired in-process associated with the 2006 acquisition of BresaGen Limited;
• Non-recurring transition charges: non-recurring transition charges in 2006 and 2005 related to Hospira becoming an independent, stand-alone company, including charges relating to the establishment of new facilities, the build-out of independent information technology systems, and product registration and re-labeling; and
• Curtailment Gain: a gain in 2004 related to discontinuation of the company’s post-retirement medical and dental plan. *Purchase accounting charges for the write-off of acquired in-process R&D do not impact adjusted gross margin. Hospira uses various non-GAAP financial measures including, among others, adjusted gross margin, adjusted operating margin, and adjusted diluted earnings per share. These non-GAAP measures adjust for certain specified items that are described above. Hospira’s management believes that these non-GAAP financial measures can facilitate a more complete analysis and greater transparency into Hospira’s ongoing results of operations, particularly in comparing underlying results from year to year. Management uses these non-GAAP financial measures internally in financial planning to monitor business unit performance and in evaluating management performance. All non-GAAP financial measures are intended to supplement the applicable GAAP measures and should not be considered in isolation from, or a replacement for, financial measures prepared in accordance with GAAP. The financial information included in this presentation for 2004 represents a compilation that reflects the results of the businesses that comprise Hospira, as they operated as part of Abbott Laboratories for the first four months of 2004. It does not reflect Hospira’s results of operations had Hospira been a stand-alone company for those months.
The specified items excluded from the non-GAAP financial measures are discussed further in “Management’s Discussion and Analysis of Financial Condition and Results of Operations” and “Notes to Consolidated Financial Statements” in Hospira’s Annual Report on Form 10-K for the year ended December 31, 2010.