noise impact assessment for the proposed menengai … v1 (noise assessment).pdf · noise impact...
TRANSCRIPT

Address: 480 Smuts Drive, Halfway Gardens | Postal: P O Box 5260, Halfway House, 1685 Tel: +27 (0)11 805 1940 | Fax: +27 (0)11 805 7010
www.airshed.co.za
Report Compiled By:
Nicolette von Reiche
Project Manager:
Gillian Petzer
Report No: 14QUP01-02 Version 1 | Date: February 2015
Noise Impact Assessment for the Proposed Menengai Geothermal Power Plant in Kenya
Project done for Quantum Power East Africa

Noise Impact Assessment for the Proposed Menengai Geothermal Power Plant in Kenya
Report Number: 14QUP01-02 Version 1 i
Report Details
Report Title Noise Impact Assessment for the Proposed Menengai Geothermal Power Plant in Kenya
Client Quantum Power East Africa
Report Number 14QUP01-02
Report Version Version 1
Date February 2015
Prepared by Nicolette von Reiche, BEng Hons (Mech.) (University of Pretoria)
Notice
Airshed Planning Professionals (Pty) Ltd is a consulting company located in Midrand, South Africa, specialising in all aspects of air quality, ranging from nearby neighbourhood concerns to regional air pollution impacts as well as noise impact assessments. The company originated in 1990 as Environmental Management Services, which amalgamated with its sister company, Matrix Environmental Consultants, in 2003.
Declaration Airshed is an independent consulting firm with no interest in the project other than to fulfil the contract between the client and the consultant for delivery of specialised services as stipulated in the terms of reference.
Copyright Warning
Unless otherwise noted, the copyright in all text and other matter (including the manner of presentation) is the exclusive property of Airshed Planning Professionals (Pty) Ltd. It is a criminal offence to reproduce and/or use, without written consent, any matter, technical procedure and/or technique contained in this document.
Revision Record
Version Date Section(s) Revised Summary Description of Revision(s)

Noise Impact Assessment for the Proposed Menengai Geothermal Power Plant in Kenya
Report Number: 14QUP01-02 Version 1 ii
Glossary and Abbreviations
Airshed Airshed Planning Professionals (Pty) Ltd
EHS Environmental, Health, and Safety
EMCR Environmental Management and Coordination Regulations (Kenya)
IEC International Electrotechnical Commission
IFC International Finance Corporation
kVA kilo volt ampere
kV kilo volt
LAeq (T) The A-weighted equivalent sound pressure level, where T indicates the time over which the noise is averaged (calculated or measured) (LAeq (T)) (in dBA)
LA90 The A-weighted 90% statistical noise level, i.e. the noise level that is exceeded during 90% of the measurement period. It is a very useful descriptor which provides an indication of what the LAeq could have been in the absence of noisy single events and is considered representative of background noise levels (LA90) (in dBA)
LAFmax The A-weighted maximum sound pressure level recorded during the measurement period
LAFmin The A-weighted minimum sound pressure level recorded during the measurement period
LP Sound pressure level (in dB)
LPA A-weighted sound pressure level (in dBA)
LPZ Un-weighted sound pressure level (in dB)
LW Sound Power Level (in dB)
m distance in meter
NEMA National Environment Management Authority (Kenya)
MVA Mega volt ampere
MW Mega Watt
QPEA Quantum Power East Africa
SABS South African Bureau of Standards
SANS South African National Standards
SLM Sound Level Meter
SoW Scope of Work
V volts
WHO World Health Organisation

Noise Impact Assessment for the Proposed Menengai Geothermal Power Plant in Kenya
Report Number: 14QUP01-02 Version 1 iii
Executive Summary
Airshed Planning Professionals (Pty) Ltd (Airshed) was commissioned by Quantum Power East Africa (QPEA) to undertake
an environmental noise impact assessment for the operational phase of the Proposed Menengai Geothermal Power Plant in
Kenya.
The QPEA facility will generate up to 27.7 mega Watt (MW) using a single flash condensing steam turbine and main sources
of noise will include the steam turbine, the generator, the droplet separator; the steam strainer, valves (main and stop
valves), pumps (incl. oil pumps, vacuum pumps, hotwell pumps and cooling water pumps), ejectors, the main condenser, the
cooling towers and transformers. The turbine, generator and some pumps and valves will be enclosed within the turbine hall
which will be constructed of structural steel and cladded with galvanized (zinc coated) IBR steel sheets that have a
thickness of 0.58 mm and will have a concrete floor. Whereas both the cladding and concrete floor of the turbine hall will
absorb some of the sound energy emitted from sources of noise inside the turbine hall, the cladding will also to some extent
limit the amount of sound energy emitted through the building’s façades.
Two technology options are considered for the release of non-condensable gases (NCG) to the atmosphere. These are to
either emit the NCG through a tall stack or to emit it through the cooling towers. Although the release of NCG through a tall
stack will add additional sources of noise i.e. fans, valves, pipes etc., these will be immaterial in comparison with other major
sources of noise. This assessment did therefore not distinguish between the technologies considered for the release of the
NCG.
The QPEA plant will be operated alongside two other independent power producing plants referred to as the Ormat and
Sosian Geothermal Power Plants. These were included in the assessment and assumed to be identical in design to the
QPEA facility.
From a review of available project information the following tasks were proposed as part of the scope of work:
A review of the legal requirements and applicable environmental noise guidelines.
A desktop study of the receiving (baseline) acoustic environment.
The establishment of a source inventory for proposed operational phase operations.
Noise propagation modelling to determine environmental noise levels.
The screening of simulated noise levels against environmental noise criteria.
The development of a noise management plan including the identification of suitable mitigation measures and
monitoring requirements.
A specialist noise impact assessment report.
The Kenyan National Environmental Management Authority restricts outdoor noise in residential areas to 50 dBA during the
day and 35 dBA during the night whereas the IFC recommends 55 dBA and 45 dBA as noise level guidelines. Kenyan limits
are therefore more stringent. The IFC also recommends that an industrial development not result in an increase of more
than 3 dBA at noise sensitive receptors (NSRs) since it is the level at which a person with average hearing acuity will be
able to detect a change.
The baseline acoustic environment was described in terms of the location of NSRs in relation to the proposed development,
the ability of the environment to attenuate noise over long distances and existing or pre-development noise levels. The
following was found:

Noise Impact Assessment for the Proposed Menengai Geothermal Power Plant in Kenya
Report Number: 14QUP01-02 Version 1 iv
NSRs include single homesteads, villages and community locations. The closest of these lie with 3.5 to 4 km south
west and north-west of the proposed QPEA facility.
Atmospheric conditions are more conducive to noise attenuation during the day.
The wind field is characterised by winds from the south-south-east and north-north-west. Noise impacts will be
more notable in these downwind directions.
Noise level measurements were limited. After careful consideration and analysis of available data representative
but conservative baseline day- and night-time noise levels within the Menengai crater of 55.2 and 45.2 dBA were
determined. These levels are conservative in the sense that these values are on the lower end of what was
measured which will theoretically result in noise from the proposed project to be more notable. These levels are
however already in exceedance of both the Kenyan limits and IFC guidelines.
Sound power levels for main equipment were determined from supplier specifications and theoretical calculations. The
effective sound power level of the turbine hall was also estimated by taking into account the building size, sound absorption
by cladding and floor as well as transmission losses through the galvanised steel sheet cladding. The source inventory, local
meteorological conditions and information on local land use were used to populate the noise propagation model (Concawe).
Noise levels were calculated over an area of 5 km east-west by 5 km north-south at intervals of 50 m. The following was
found:
Noise impact will be most significant at night when baseline noise levels are lower and assessment criteria more
stringent.
With all three facilities operating simultaneously the overall maximum increase in noise level over the baseline will
reduce to less than 3 dBA at around 1.72 km from the boundary of operations.
Since the closest NSRs are situated at least 3 km away from these sites it is unlikely a change in day or night time
noise levels will be detected at these locations.
SANS 10103 (2008) indicates that at an increase of between 0 and 5 dBA, sporadic complaints with little or no
community action may be expected.
The relatively small impact area is the combined result of the baseline noise levels (already in exceedance of
assessment criteria), the design specifications of the facilities (i.e. galvanised steel sheet cladding of building that
contains major noise sources), and the absence of permanent NSRs within 2 km radius from site.
It was concluded that, provided the management plan recommended in this report is adopted, NSR’s will not be affected
negatively or find noise from the facility annoying. The cladding of the turbine hall with galvanised steel sheeting is
considered sufficient from an environmental noise perspective i.e. impacts at NSRs.

Noise Impact Assessment for the Proposed Menengai Geothermal Power Plant in Kenya
Report Number: 14QUP01-02 Version 1 v
Table of Contents
1 INTRODUCTION ................................................................................................................................................. 1
1.1 Description of Proposed Activities from a Noise Perspective ................................................................................. 1
1.2 Scope of Work ........................................................................................................................................................ 2
1.3 Background to Environmental Noise and the Assessment Thereof ....................................................................... 5
1.3.1 Perception of Sound .......................................................................................................................................... 5
1.3.2 Frequency Weighting ......................................................................................................................................... 5
1.3.3 Adding Sound Pressure Levels ......................................................................................................................... 6
1.3.4 Environmental Noise Propagation ..................................................................................................................... 6
1.3.5 Environmental Noise Indices ............................................................................................................................. 7
1.4 Approach and Methodology .................................................................................................................................... 7
1.4.1 Information Review ............................................................................................................................................ 7
1.4.2 Review of Assessment Criteria .......................................................................................................................... 7
1.4.3 Study of the Receiving Environment .................................................................................................................. 8
1.4.4 Source Inventory ................................................................................................................................................ 8
1.4.5 Noise Propagation Modelling ............................................................................................................................. 8
1.4.6 Presentation of Results ...................................................................................................................................... 9
1.4.7 The Development of a Noise Management Plan ............................................................................................... 9
2 LEGAL REQUIREMENTS AND NOISE LEVEL GUIDELINES ................................................................................... 10
2.1 Kenyan Noise Pollution Control Regulations ........................................................................................................ 10
2.2 IFC Guidelines on Environmental Noise ............................................................................................................... 10
2.3 SANS 10103 ......................................................................................................................................................... 10
3 DESCRIPTION OF THE RECEIVING ENVIRONMENT ............................................................................................. 12
3.1 Noise Sensitive Receptors ................................................................................................................................... 12
3.2 Environmental Noise Propagation and Attenuation potential ............................................................................... 12
3.2.1 Atmospheric Absorption and Meteorology ....................................................................................................... 12
3.2.2 Terrain, Ground Absorption and Reflection ..................................................................................................... 14
3.2.3 Baseline Noise Levels ..................................................................................................................................... 15
4 IMPACT ASSESSMENT .................................................................................................................................... 16
4.1 Noise Sources and Sound Power Levels ............................................................................................................. 16
4.2 Noise Propagation and Simulated Noise Levels .................................................................................................. 18
5 MANAGEMENT, MITIGATION AND RECOMMENDATIONS ..................................................................................... 26
5.1 Good Engineering and Operational Practices ...................................................................................................... 26
5.2 Operational Hours ................................................................................................................................................ 26
5.3 Acoustic Barriers .................................................................................................................................................. 26
5.4 Traffic .................................................................................................................................................................... 27
5.5 Monitoring ............................................................................................................................................................. 27
5.6 Application for a Licence to Emit Noise Levels in Excess of Kenyan Limits ......................................................... 27
6 REFERENCES ................................................................................................................................................. 28
7 APPENDIX A – NOISE MEASUREMENT DATA ................................................................................................... 29

Noise Impact Assessment for the Proposed Menengai Geothermal Power Plant in Kenya
Report Number: 14QUP01-02 Version 1 vi
List of Tables
Table 1: Kenyan maximum permissible noise levels for residential areas (outdoors) ............................................................. 10
Table 2: IFC noise level guidelines .......................................................................................................................................... 10
Table 3: SANS 10103 (2008) typical rating levels for outdoor noise ....................................................................................... 11
Table 4: Average diurnal meteorological parameters .............................................................................................................. 14
Table 5: Source information supplied by QPEA ....................................................................................................................... 16
Table 6: Data used in the calculation of the effective LW of the galvanised steel clad turbine hall .......................................... 17
Table 7: Final source inventory summary for the facility(s) ...................................................................................................... 17
Table 8: Maximum downwind distances over which Kenyan and IFC noise criteria are exceeded ......................................... 19
List of Figures
Figure 1: Proposed layout of the Menengai Geothermal Power Plant (layout provided by QPEA) ........................................... 3
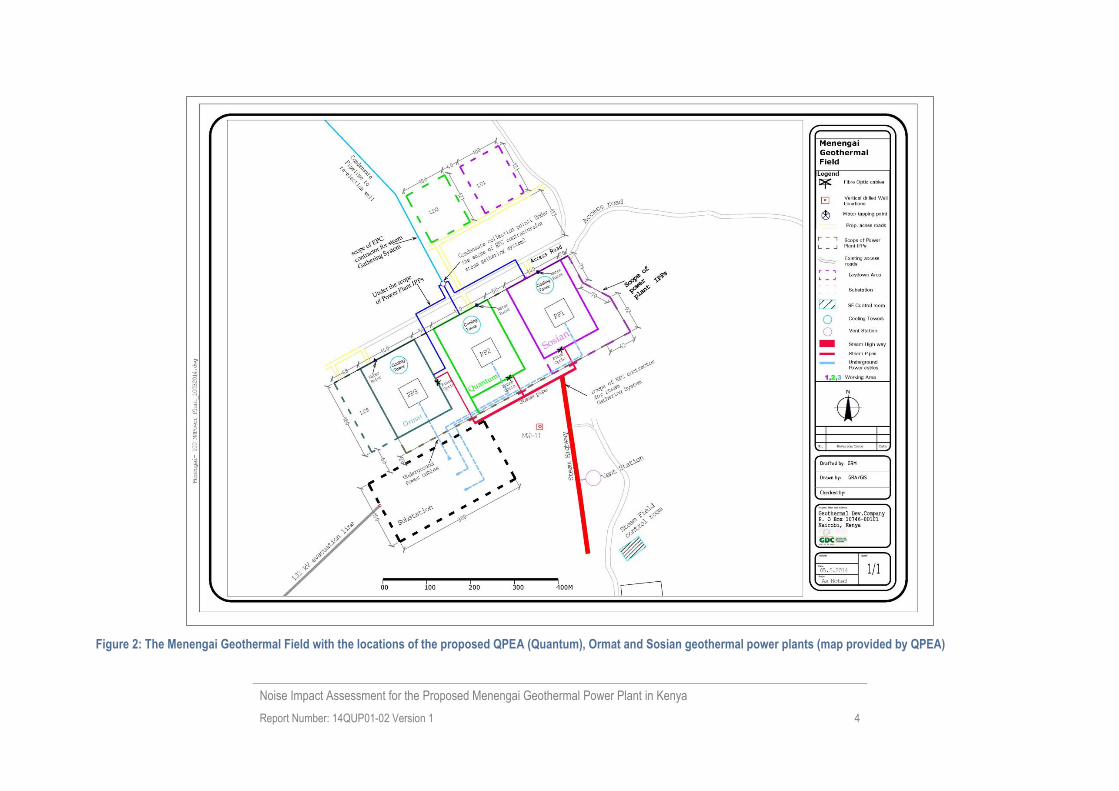
Figure 2: The Menengai Geothermal Field with the locations of the proposed QPEA (Quantum), Ormat and Sosian
geothermal power plants (map provided by QPEA) ................................................................................................................... 4
Figure 3: A-weighting curve ....................................................................................................................................................... 6
Figure 4: Location of potential NSR’s ...................................................................................................................................... 13
Figure 5: Wind roses ................................................................................................................................................................ 14
Figure 6: Incremental day-time LAeq as a result of the operational phase of the QPEA (Quantum), Sosian and Ormat
Geothermal Power Plants ........................................................................................................................................................ 20
Figure 7: Cumulative day-time LAeq as a result of the operational phase of the QPEA (Quantum), Sosian and Ormat
Geothermal Power Plants in addition to the baseline of 55.2 dBA .......................................................................................... 21
Figure 8: Increase in day-time LAeq over the baseline of 55.2 dBA as a result of the operational phase of the QPEA
(Quantum), Sosian and Ormat Geothermal Power Plants ....................................................................................................... 22
Figure 9: Incremental night-time LAeq as a result of the operational phase of the QPEA (Quantum), Sosian and Ormat
Geothermal Power Plants ........................................................................................................................................................ 23
Figure 10: Cumulative night-time LAeq as a result of the operational phase of the QPEA (Quantum), Sosian and Ormat
Geothermal Power Plants in addition to the baseline of 45.2 dBA .......................................................................................... 24
Figure 11: Increase in night-time LAeq over the baseline of 45.2 dBA as a result of the operational phase of the QPEA
(Quantum), Sosian and Ormat Geothermal Power Plants ....................................................................................................... 25

Noise Impact Assessment for the Proposed Menengai Geothermal Power Plant in Kenya
Report Number: 14QUP01-02 Version 1 1
1 INTRODUCTION
Airshed Planning Professionals (Pty) Ltd (Airshed) was commissioned by Quantum Power East Africa (QPEA) to undertake
an environmental noise impact assessment for the operational phase of the Proposed Menengai Geothermal Power Plant in
Kenya. A description of proposed activities from an environmental noise perspective and tasks included in the Scope of
Work (SoW) is given below.
1.1 Description of Proposed Activities from a Noise Perspective
The facility proposed for construction by QPEA will generate a maximum of 37.7 mega Watt (MW) using a single flash
condensing steam turbine. The proposed layout of plant is shown in Figure 1. During its operation noise will be generated by
a number of elements at the plant. The main sources of noise will include:
The steam turbine;
The generator;
The droplet separator;
The steam strainer;
Valves (main and stop valves);
Pumps (incl. oil pumps, vacuum pumps, hotwell pumps and cooling water pumps)
Ejectors;
The main condenser;
The cooling towers; and
Transformers.
The turbine, generator and some pumps and valves will be enclosed within the turbine hall which will be constructed of
structural steel and cladded with galvanized (zinc coated) IBR steel sheets that have a thickness of 0.58 mm and will have a
concrete floor. Whereas both the cladding and concrete floor of the turbine hall will absorb some of the sound energy
emitted from sources of noise inside the turbine hall, the cladding will also to some extent limit the amount of sound energy
emitted through the building’s façades. The need for the installation of additional absorption or insulation materials within the
turbine hall will be determined as part of this investigation.
Two technology options are considered for the release of non-condensable gases (NCG) to the atmosphere. These are to
either emit the NCG through a tall stack or to emit it through the cooling towers. The preferred technology will most likely be
determined by the air quality impact assessment for the plant since it is dependent on the effective dispersion of harmful and
odorous hydrogen sulphide contained in the NCG. Although the release of NCG through a tall stack will add additional
sources of noise i.e. fans, valves, pipes etc., these will be immaterial in comparison with other major sources of noise (the
reader is referred to Section 1.3.3 for some background to the addition of noise levels). This assessment does therefore not
distinguish between the technologies considered for the release of the NCG.
Although very detailed design information was available for the operational phase of the plant, the construction and
decommissioning phases were less well defined. Construction related activities that will impact on environmental noise
levels typically include bulk earthworks, metal works, concrete works and electrical works associated with the establishment
of production wells, plant infrastructure, office buildings and support infrastructure.

Noise Impact Assessment for the Proposed Menengai Geothermal Power Plant in Kenya
Report Number: 14QUP01-02 Version 1 2
Decommissioning whole geothermal developments is a rare operation as generally, if the resource conditions are still
favourable, equipment can be refurbished or replaced. Power plants can undergo refurbishment at the end of their design
life to upgrade and repair equipment to enable operation and generation to continue.
The Proposed Menengai Geothermal Power Plant is one of three such proposed Independent Power Producer (IPP)
facilities. The location of two other facilities, referred to as the Ormat and Sosian Geothermal Power Plants, are shown in
Figure 2. The cumulative impact of all three facilities on environmental noise levels was raised as a concern and therefore
included in the assessment.
1.2 Scope of Work
Given the above, the following tasks were included in the SoW:
1. A review of technical project information.
2. A review of the legal requirements and applicable environmental noise guidelines.
3. A desktop study of the receiving (baseline) acoustic environment, including:
a. The identification of noise sensitive receptors (NSRs) from available maps;
b. A study of environmental noise attenuation potential by referring to available weather records, land use
and topography data sources; and
c. The analysis of sampled environmental noise levels to determine representative baseline (pre-
development) noise levels.
4. The establishment of a source inventory for proposed operational phase operations.
5. Noise propagation modelling to determine environmental noise levels.
6. The screening of simulated noise levels against environmental noise criteria.
7. The development of a noise management plan including the identification of suitable mitigation measures and
monitoring requirements.
8. A specialist noise impact assessment report.

Noise Impact Assessment for the Proposed Menengai Geothermal Power Plant in Kenya
Report Number: 14QUP01-02 Version 1 3
Figure 1: Proposed layout of the Menengai Geothermal Power Plant (layout provided by QPEA)
Noise Impact Assessment for the Proposed Menengai Geothermal Power Plant in Kenya
Report Number: 14QUP01-02 Version 1 4
Figure 2: The Menengai Geothermal Field with the locations of the proposed QPEA (Quantum), Ormat and Sosian geothermal power plants (map provided by QPEA)

Noise Impact Assessment for the Proposed Menengai Geothermal Power Plant in Kenya
Report Number: 14QUP01-02 Version 1 5
1.3 Background to Environmental Noise and the Assessment Thereof
Before more details regarding the approach and methodology adopted in the assessment is given, the reader is provided
with some background, definitions and conventions used in the measurement, calculation and assessment of environmental
noise.
Noise is generally defined as unwanted sound transmitted through a compressible medium such as air. Sound in turn, is
defined as any pressure variation that the ear can detect. Human response to noise is complex and highly variable as it is
subjective rather than objective.
Noise is reported in decibels (dB). “dB” is the descriptor that is used to indicate 10 times a logarithmic ratio of quantities that
have the same units, in this case sound pressure. The relationship between sound pressure and sound pressure level is
illustrated in Equation 1.
𝐿𝑝 = 20 ∙ log10 (𝑝
𝑝𝑟𝑒𝑓
)
Equation 1
Where:
Lp is the sound pressure level in dB;
p is the actual sound pressure in Pa; and
pref is the reference sound pressure (pref in air is 20 µPa)
1.3.1 Perception of Sound
Sound has already been defined as any pressure variation that can be detected by the human ear. The number of pressure
variations per second is referred to as the frequency of sound and is measured in hertz (Hz). The hearing of a young,
healthy person ranges between 20 Hz and 20 000 Hz.
In terms of LP, audible sound ranges from the threshold of hearing at 0 dB to the pain threshold of 130 dB and above. Even
though an increase in sound pressure level of 6 dB represents a doubling in sound pressure, an increase of 8 to 10 dB is
required before the sound subjectively appears to be significantly louder. Similarly, the smallest perceptible change is about
1 dB (Brüel & Kjær Sound & Vibration Measurement A/S, 2000).
1.3.2 Frequency Weighting
Since human hearing is not equally sensitive to all frequencies, a ‘filter’ has been developed to simulate human hearing. The
‘A-weighting’ filter simulates the human hearing characteristic, which is less sensitive to sounds at low frequencies than at
high frequencies (Figure 3). “dBA” is the descriptor that is used to indicate 10 times a logarithmic ratio of quantities, that
have the same units (in this case sound pressure) that has been A-weighted.

Noise Impact Assessment for the Proposed Menengai Geothermal Power Plant in Kenya
Report Number: 14QUP01-02 Version 1 6
Figure 3: A-weighting curve
1.3.3 Adding Sound Pressure Levels
Since sound pressure levels are logarithmic values, the sound pressure levels as a result of two or more sources cannot just
simply be added together. To obtain the combined sound pressure level of a combination of sources such as those at an
industrial plant, individual sound pressure levels must be converted to their linear values and added using Equation 2.
𝐿𝑝_𝑐𝑜𝑚𝑏𝑖𝑛𝑒𝑑 = 10 ∙ log (10𝐿𝑝1
10 + 10𝐿𝑝2
10 + 10𝐿𝑝3
10 + ⋯ 10𝐿𝑝𝑖
10 )
Equation 2
This implies that if the difference between the sound pressure levels of two sources is nil the combined sound pressure level
is 3 dB more than the sound pressure level of one source alone. Similarly, if the difference between the sound pressure
levels of two sources is more than 10 dB, the contribution of the quietest source can be disregarded (Brüel & Kjær Sound &
Vibration Measurement A/S, 2000).
1.3.4 Environmental Noise Propagation
Many factors affect the propagation of noise from source to receiver. The most important of these are:
The type of source and its sound power (LW);
The distance between the source and the receiver;
Atmospheric conditions (wind speed and direction, temperature and temperature gradient, humidity etc.);
Obstacles such as barriers or buildings between the source and receiver;

Noise Impact Assessment for the Proposed Menengai Geothermal Power Plant in Kenya
Report Number: 14QUP01-02 Version 1 7
Ground absorption; and
Reflections
To arrive at a representative result from either measurement or calculation, all these factors must be taken into account
(Brüel & Kjær Sound & Vibration Measurement A/S, 2000).
1.3.5 Environmental Noise Indices
In assessing environmental noise either by measurement or calculation, reference is generally made to the following indices:
LAeq (T) – The A-weighted equivalent sound pressure level, where T indicates the time over which the noise is
averaged (calculated or measured). The International Finance Corporation (IFC) provides guidance with respect to
LAeq (1 hour), the A-weighted equivalent sound pressure level, averaged over 1 hour.
LA90 – The A-weighted 90% statistical noise level, i.e. the noise level that is exceeded during 90% of the
measurement period. It is a very useful descriptor which provides an indication of what the LAeq could have been in
the absence of noisy single events and is considered representative of background noise levels.
LAFmax – The maximum A-weighted noise level measured with the fast time weighting. It’s the highest level of noise
that occurred during a sampling period.
LAFmin – The minimum A-weighted noise level measured with the fast time weighting. It’s the lowest level of noise
that occurred during a sampling period.
1.4 Approach and Methodology
The assessment included a study of the legal requirements pertaining to noise impacts, a study of the physical environment
of the area surrounding the project and the analyses of existing noise levels in the area. The impact assessment focused on
the estimation of LW’s (noise ‘emissions’) and LP’s (noise impacts) associated with the operational phase of the facility. The
findings of the assessment components informed recommendations of management measures, including mitigation and
monitoring. Individual aspects of the noise impact assessment methodology are discussed in more detail below.
1.4.1 Information Review
An information requirements list was submitted to QPEA at the onset of the study. QPEA supplied, for inclusion in the
assessment, the following information:
Georeferenced maps and a site layout;
A detailed process description;
Source noise levels for most major plant equipment;
Information on building construction materials; and
Sampled baseline environmental noise levels.
Gaps or limitations in the information supplied were identified. These were addressed by making suitable technical
assumptions which were approved by QPEA.
1.4.2 Review of Assessment Criteria
In Kenya, the National Environment Management Authority (NEMA) regulates Noise and Excessive Vibration Pollution under
the Environmental Management and Coordination Regulations (EMCR) (NEMA, 2009). These regulations as well as
guidance provided by the IFC were considered in the assessment.

Noise Impact Assessment for the Proposed Menengai Geothermal Power Plant in Kenya
Report Number: 14QUP01-02 Version 1 8
1.4.3 Study of the Receiving Environment
Noise sensitive receptors generally include private residences, community buildings such as schools, hospitals and any
publically accessible areas outside the industrial facility’s property. QPEA provided the coordinates of homesteads, villages
and areas to be considered.
The ability of the environment to attenuate noise as it travels through the air was studied by considering local meteorology,
land use and terrain. Atmospheric attenuation potential was described based on modelled MM5 weather data obtained for
2011 to 2014 for the air quality impact assessment. Readily available terrain and land cover data was obtained from the
Atmospheric Studies Group (ASG) via the United States Geological Survey (USGS) web site. Use will be made of Shuttle
Radar Topography Mission (STRM) (90 m, 3 arc-sec) data and Global Land Cover Characterisation (GLCC) data for Africa.
The extent of noise impacts as a result of an intruding industrial noise depends largely on existing noise levels in the project
area. Higher ambient noise levels will result in less noticeable noise impacts and a smaller impact area. The opposite also
holds true. Increases in noise will be more noticeable in areas with low ambient noise levels. QPEA supplied available
ambient noise measurement data from which baseline noise levels for use in the assessment of cumulative impacts were
estimated.
1.4.4 Source Inventory
The source noise inventory was informed by equipment specific LW data from suppliers and LW predictive equations. Some
sources will be contained within the turbine hall. The effective LW of these sources combined when emitted through the
turbine hall walls (façades) was also estimated.
1.4.5 Noise Propagation Modelling
The propagation of noise from proposed activities was calculated according to ‘The Calculation of Sound Propagation by the
Concawe method’ (SANS 10357, 2004). The Concawe method makes use of the International Organisation for
Standardization’s (ISO) air absorption parameters and equations for noise attenuation as well as the factors for barriers and
ground effects. In addition to the ISO method, the Concawe method facilitates the calculation of sound propagation under a
variety of meteorological conditions. Meteorological data obtained from the MM5 data set used in the air quality impact
assessment were applied in calculations.
If the dimensions of a noise source are small compared with the distance to the listener, it is called a point source. All
sources at noise at the proposed plant were quantified as point sources. The sound energy from a point source spreads out
spherically, so that the sound pressure level is the same for all points at the same distance from the source, and decreases
by 6 dB per doubling of distance. This holds true until ground and air attenuation noticeably affect the level. The impact of an
intruding industrial noise on the environment will therefore rarely extend over more than 5 km from the source and is
therefore always considered “local” in extent.
The propagation of noise was calculated over an area of 5 km east-west by 5 km north-south with the proposed Quantum
plant located centrally. The area was divided into a grid matrix with a 50 m resolution. The model calculates LP’s at each grid
receptor point at a height of 1.5 m above ground level.
Noise Impact Assessment for the Proposed Menengai Geothermal Power Plant in Kenya
Report Number: 14QUP01-02 Version 1 9
1.4.6 Presentation of Results
Noise impacts were calculated in terms of:
Total day- and night time noise levels as a result of:
o The proposed QPEA plant in addition to the baseline; and
o The QPEA, Ormat and Sosian geothermal power plants in addition to the baseline.
The effective increase ambient day and night-time noise levels over the baseline as a result of:
o The proposed QPEA plant; and
o The QPEA, Ormat and Sosian geothermal power plants.
Impacts were assessed according to guidelines published by the Kenyan NEMA and IFC. To assess annoyance at nearby
places of residence, reference was made to guidelines published in SANS 10103 (2008).
1.4.7 The Development of a Noise Management Plan
The findings of the noise specialist study informed the Noise Management Plan (NMP) which will includes:
The setting of management objectives;
The ranking of sources of noise;
Source specific management and mitigation measures;
A monitoring plan; and
Recommendations of record keeping, environmental reporting and community liaison.

Noise Impact Assessment for the Proposed Menengai Geothermal Power Plant in Kenya
Report Number: 14QUP01-02 Version 1 10
2 LEGAL REQUIREMENTS AND NOISE LEVEL GUIDELINES
2.1 Kenyan Noise Pollution Control Regulations
In Kenya, the NEMA regulates Noise and Excessive Vibration Pollution under the EMCR (NEMA, 2009). Schedule 1 of the
regulation gives maximum permissible noise levels for different zones, for construction sites and for mines and quarries. Of
specific interest in this assessment are the levels considered acceptable by the NEMA for outdoor noise within residential
areas. These are given in Table 1.
Table 1: Kenyan maximum permissible noise levels for residential areas (outdoors)
Zone
Sound Level Limit (dBA) Noise Rating Level(a)
Day-time(a)
LAeq (14 hours)
Night-time(b)
LAeq (10 hours)
Day-time(a)
(14 hours)
Night-time(b)
(10 hours)
Residential (outdoor) 50 35 40 25
Notes:
(a) Day-time is from 06:01 to 20:00
(b) Night-time is from 20:01 to 06:00
(c) No definition of noise rating level is provided in the regulation
Should a facility emit noise level to such an extent that the above limits are exceeded, and application to emit those noise
levels has to be submitted to NEMA.
2.2 IFC Guidelines on Environmental Noise
The IFC General Environmental Health and Safety Guidelines on noise address impacts of noise beyond the property
boundary of the facility under consideration and provides noise level guidelines.
The IFC states that noise impacts should not exceed the levels presented in Table 2, or result in a maximum increase
above background levels of 3 dBA at the nearest receptor location off-site (IFC, 2007). For a person with average hearing
acuity an increase of less than 3 dBA in the general ambient noise level is not detectable. = 3 dBA is, therefore, a useful
significance indicator for a noise impact.
Table 2: IFC noise level guidelines
Noise Level Guidelines (IFC, 2007)
Area One Hour LAeq (dBA)
07:00 to 22:00
One Hour LAeq (dBA)
22:00 to 07:00
Industrial receptors 70 70
Residential, institutional and educational receptors 55 45
2.3 SANS 10103
SANS 10103 (2008) successfully addresses the manner in which environmental noise is to be assessed in South Africa, and
is fully aligned with the World health Organisation (WHO) guidelines of 1999. The values given in Table 3 are typical rating

Noise Impact Assessment for the Proposed Menengai Geothermal Power Plant in Kenya
Report Number: 14QUP01-02 Version 1 11
levels that should not be exceeded outdoors in the different districts likely to occur in the study area. Outdoor ambient noise
exceeding these levels will be considered annoying to the community.
Table 3: SANS 10103 (2008) typical rating levels for outdoor noise
Type of district
Equivalent Continuous Rating Level (LReq,T) for Outdoor Noise
SANS 10103 (2008)6
Day/night
LR,dn(c) (dBA)
Day-time
LReq,d(a) (dBA)
Night-time
LReq,n(b) (dBA)
Rural districts 45 45 35
Suburban districts with little road traffic 50 50 40
Urban districts 55 55 45
Urban districts with one or more of the following; business premises; and main roads
60 60 50
Central business districts 65 65 55
Industrial districts 70 70 60
Notes
(a) LReq,d =The LAeq rated for impulsive sound and tonality in accordance with SANS 10103 for the day-time period, i.e. from 06:00
to 22:00.
(b) LReq,n =The LAeq rated for impulsive sound and tonality in accordance with SANS 10103 for the night-time period, i.e. from 22:00
to 06:00.
(c) LR,dn = The LAeq rated for impulsive sound and tonality in accordance with SANS 10103 for the period of a day and night, i.e. 24
hours, and wherein the LReq,n has been weighted with 10dB in order to account for the additional disturbance caused by noise
during the night.
SANS 10103 (2008) also provides a useful guideline for estimating community response to an increase in the general
ambient noise level caused by intruding noise. If Δ is the increase in noise level, the following criteria are of relevance:
0 dB: There will be no community reaction;
0 dB < 10 dB: There will be ‘little’ reaction with ‘sporadic complaints’;
5 dB < 15 dB: There will be a ‘medium’ reaction with ‘widespread complaints’. = 10 dB is subjectively
perceived as a doubling in the loudness of the noise;
10 dB < 20 dB: There will be a ‘strong’ reaction with ‘threats of community action’; and
15 dB < : There will be a ‘very strong’ reaction with ‘vigorous community action’.
The categories of community response overlap because the response of a community does not occur as a stepwise
function, but rather as a gradual change.
Noise Impact Assessment for the Proposed Menengai Geothermal Power Plant in Kenya
Report Number: 14QUP01-02 Version 1 12
3 DESCRIPTION OF THE RECEIVING ENVIRONMENT
This chapter provides details of the receiving acoustic environment in terms of:
Local NSRs;
The local environmental noise propagation and attenuation potential; and
Locally sampled baseline noise levels.
3.1 Noise Sensitive Receptors
A map of likely NSRs is included in Figure 4. These include single homesteads, villages, large towns as well as community
locations. The closest NSRs are situated approximately 3.5 km north-west of the facility on the crater rim at Marigo. Within
the crater itself the individual homestead and structures to the south-west (approximately 3.7 km from the facility) are the
closest.
3.2 Environmental Noise Propagation and Attenuation potential
3.2.1 Atmospheric Absorption and Meteorology
Atmospheric absorption and meteorological conditions have already been mentioned with regards to its role in the
propagation on noise from a source to receiver (Section 1.3.4). The main meteorological parameters affecting the
propagation of noise include wind speed, wind direction and temperature. These along with other parameters such as
relative humidity, air pressure, solar radiation and cloud cover affect the stability of the atmosphere and the ability of the
atmosphere to absorb sound energy. Average day-and night time wind speed, wind direction, temperature, relative humidity,
pressure and solar radiation used as input to the selected noise propagation model are provided in Table 4. Modelled MM5
data (2011 to 2013) for an on-site location was referred to.
It is well known that wind speed increases with altitude. This results in the ‘bending’ of the path of sound to ‘focus’ it on the
downwind side and creating a ‘shadow’ on the upwind side of the source. Depending on the wind speed, the downwind level
may increase by a few dB but the upwind level can drop by more than 20 dB (Brüel & Kjær Sound & Vibration Measurement
A/S, 2000). It should be noted that at wind speeds of more than 5 m/s ambient noise levels are mostly dominated by wind
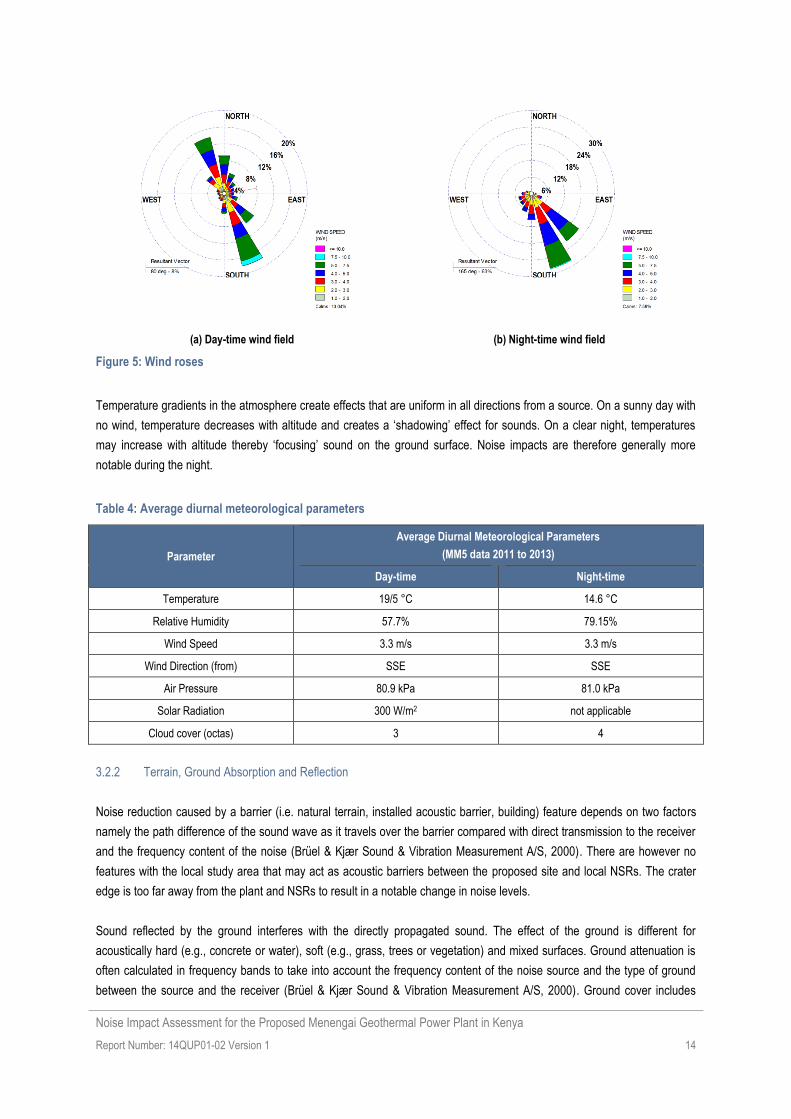
generated noise. The on-site diurnal wind field is presented in Figure 5. Wind roses represent wind frequencies for the 16
cardinal wind directions. Frequencies are indicated by the length of the shaft when compared to the circles drawn to
represent a frequency of occurrence. Wind speed classes are assigned to illustrate the frequencies with high and low winds
occurring for each wind vector. The frequencies of calms, defined as periods for which wind speeds are below 1 m/s, are
also indicated.
On average, during the day, noise impacts are expected to be most notable to the north-north-west and south-south east.
During the night it is expected to be most significant to the north-north-west of proposed operations.

Noise Impact Assessment for the Proposed Menengai Geothermal Power Plant in Kenya
Report Number: 14QUP01-02 Version 1 13
Figure 4: Location of potential NSR’s
Noise Impact Assessment for the Proposed Menengai Geothermal Power Plant in Kenya
Report Number: 14QUP01-02 Version 1 14
(a) Day-time wind field (b) Night-time wind field
Figure 5: Wind roses
Temperature gradients in the atmosphere create effects that are uniform in all directions from a source. On a sunny day with
no wind, temperature decreases with altitude and creates a ‘shadowing’ effect for sounds. On a clear night, temperatures
may increase with altitude thereby ‘focusing’ sound on the ground surface. Noise impacts are therefore generally more
notable during the night.
Table 4: Average diurnal meteorological parameters
Parameter
Average Diurnal Meteorological Parameters
(MM5 data 2011 to 2013)
Day-time Night-time
Temperature 19/5 °C 14.6 °C
Relative Humidity 57.7% 79.15%
Wind Speed 3.3 m/s 3.3 m/s
Wind Direction (from) SSE SSE
Air Pressure 80.9 kPa 81.0 kPa
Solar Radiation 300 W/m2 not applicable
Cloud cover (octas) 3 4
3.2.2 Terrain, Ground Absorption and Reflection
Noise reduction caused by a barrier (i.e. natural terrain, installed acoustic barrier, building) feature depends on two factors
namely the path difference of the sound wave as it travels over the barrier compared with direct transmission to the receiver
and the frequency content of the noise (Brüel & Kjær Sound & Vibration Measurement A/S, 2000). There are however no
features with the local study area that may act as acoustic barriers between the proposed site and local NSRs. The crater
edge is too far away from the plant and NSRs to result in a notable change in noise levels.
Sound reflected by the ground interferes with the directly propagated sound. The effect of the ground is different for
acoustically hard (e.g., concrete or water), soft (e.g., grass, trees or vegetation) and mixed surfaces. Ground attenuation is
often calculated in frequency bands to take into account the frequency content of the noise source and the type of ground
between the source and the receiver (Brüel & Kjær Sound & Vibration Measurement A/S, 2000). Ground cover includes

Noise Impact Assessment for the Proposed Menengai Geothermal Power Plant in Kenya
Report Number: 14QUP01-02 Version 1 15
vegetation, residential and farming areas and is considered acoustically ‘mixed’. 75% of the 5 by 5 km study area/ modelling
domain was conservatively assumed to be acoustically ‘soft’.
3.2.3 Baseline Noise Levels
QPEA supplied, for use in the determination of baseline/background noise levels, two sets of measurement data (see
Appendix A) collected by a third party within and around the Menengai crater. These data sets included:
Average day-time noise levels at several locations within the crater near drilling operations/well areas as reported
by Muse in 2013. The sampling period or acoustic parameter sampled is not clearly indicated and values were
assumed to be LAeq values; and
Minimum and maximum night-time noise levels at NSRs (shown by the red dots in Figure 4). Since it was not
specified these values were assumed to be the LAFmax and LAFmin values of the samples taken over a period of 10
months.
It is clear the data sets area limited in the following ways:
Time averaging periods are not indicated;
Day and night-time measurements were not conducted at the same locations;
Day-time measurements were limited to the Menengai crater where noise levels were affected by drilling
operations;
Night-time measurements were all conducted outside the Menengai crater within community areas.
Since the night-time measurement data set is more detailed, providing minimum and maximum sampled noise levels over
approximately 40 days at locations outside Menengai, it used it as a starting point for determining representative
baseline/background noise levels from which cumulative impacts could be determined. Herewith the approach:
Night time samples were all taken within community locations and will therefore most likely be higher than what is
found within Menengai.
Median of minimum values sampled at night time sampling site was determined.
The lowest of these is medians were found to be 45.2 dBA and is considered representative of night-time levels
within the crater.
The difference in day and night time levels in areas where there is human activity is usually about 10 dBA (SANS
10103, 2008).
The equivalent day-time noise level within Menengai would, by applying the above, be 55.2 dBA.
The estimated 55.2 dBA baseline day-time noise level corresponds to lower end of reported average by Muse
(2013).
For estimating cumulative impacts within Menengai crater, the following conservative representative background
noise levels were therefore used:
o 45.2 dBA for the night; and
o 55.2 dBA for the day.
It is important to note that day and night time baseline noise levels are in exceedance of Kenyan and IFC noise levels
guidelines for residential areas.

Noise Impact Assessment for the Proposed Menengai Geothermal Power Plant in Kenya
Report Number: 14QUP01-02 Version 1 16
4 IMPACT ASSESSMENT
The noise source inventory, noise propagation modelling and results for the operational phase are discussed in Section 4.1
and Section 4.2.
4.1 Noise Sources and Sound Power Levels
QPEA provided the following supplier technical information on main sources of noise which are summarised in Table 5:
Octave band LW’s for the cooling towers and droplet separator;
Octave band LP’s 1 meter from the turbine, generator, steam strainer, valves, pumps, ejectors and main
condenser;
Source locations and quantities.
Table 5: Source information supplied by QPEA
Equipment Name
LW or
LP
LW or LP in dBA
Area (m2) or Point
Distance from
Source of LP
(meters)
Quantity 63 Hz
125 Hz
250 Hz
500 Hz
1 kHz
2 kHz
4 kHz
8 kHz
Tot.
Droplet Separator LW 46 42 44 50 62 62 57 55 66 Point n/a 1
Steam Strainer LP 55 60 64 67 68 66 57 53 73 Point 1 2
Main Stop Valve LP 49 85 75 72 76 73 72 65 88 Point 1 2
Main Control Valve
LP 50 84 68 72 76 73 71 62 88 Point 1 2
Steam Turbine LP 70 77 83 84 89 84 78 73 92 104 2.75(a) 1
Main Oil Pump LP 50 65 72 75 74 73 71 65 81 Point 1 2
Main Oil Tank Vapour Extractor
LP 20 39 51 57 59 58 54 48 64 Point 1 1
Control Oil Pump LP 53 55 60 78 75 75 73 64 80 Point 1 2
Control Oil Radiator
LP 31 50 62 68 70 69 65 60 75 Point 1 1
Generator LP 71 89 78 80 82 79 70 58 91 89 3.25(a) 1
Main Condenser LP 52 62 74 82 86 85 81 75 90 140 3.3(a) 1
Ejector LP 61 71 86 100 107 106 104 102 112 Point 1 3
Inter Condenser LP 53 63 79 92 99 98 96 94 104 Point 1 1
Vacuum Pump LP 56 73 80 86 86 83 79 65 91 Point 1 4
Hotwell Pump LP 30 66 81 80 79 73 64 52 85 Point 1 2
Auxiliary Cooling Water Pump
LP 76 78 79 76 74 73 69 64 80 Point 1 2
Cooling Tower LW 104 101 98.8 98.0 99.7 99.1 98.9 101 106 Point n/a 4
For use in the noise propagation simulations representative LW’s for these sources were determined from Equation 3 for the
spherical diversion of noise from a point source:
𝐿𝑃 = 𝐿𝑊 + 10 ∙ log10 𝑟 + 8 𝑑𝐵

Noise Impact Assessment for the Proposed Menengai Geothermal Power Plant in Kenya
Report Number: 14QUP01-02 Version 1 17
Equation 3
Where Lp is the sound pressure level in dB at distance r from the sources and LW is the actual sound power level of the
source under consideration.
LW’s from the 11 kV to 132 kV generator step up transformer (50 MVA), 11 kV to 0.68 kV station service transformer (4
MVA) and 11 kV to 11 kVA to 425 V auxiliary transformer (350 kVA) were estimated with the following equation (Barron,
2003):
𝐿𝑊 = 45 + 12.5 ∙ log10 𝑘𝑉𝐴
Equation 4
As recommended by Barron (2003), octave band LW’s were determined by subtracting the following from the total LW; 63 Hz
– 7 dB, 125 Hz – 3 dB, 250 Hz – 9 dB, 500 Hz – 13 dB, 1 kHz – 13 dB, 2 kHz – 19 dB, 4 kHz – 24 dB.
The steam strainer, main stop valve, main control valve, steam turbine, main oil pump, main oil tank vapour extractor,
control oil pump, control oil radiator and generator will be contained within the turbine hall. The effective LW of these sources
combined when emitted through the turbine hall walls (façades) was estimated. In the calculation absorption and
transmission losses were accounted for. A summary of information used in the estimation of the effective turbine hall LW is
given in Table 6.
Table 6: Data used in the calculation of the effective LW of the galvanised steel clad turbine hall
Turbine hall dimensions
Length 30 m
Width 18 m
Height 18 m
Internal surface area 2 808 m2
63 Hz 125 Hz 250 Hz 500 Hz 1 kHz 2 kHz 4 kHz
Combined LW of sources within the turbine hall (dB) 112.5 119.9 106.0 102.3 102.8 97.4 93.2
Average absorption coefficient 0.35 0.35 0.39 0.44 0.49 0.54 0.57
Transmission coefficient of 20 g galvanised steel 8 14 20 26 32 38 38
A summary of sources and associated LW’s as determines from the above and included in simulations is given in Table 7.
The reader is reminded that the Ormat and Sosian Geothermal Power Plants were assumed to be exact copies of the QPEA
Menengai Geothermal Power Plant.
Table 7: Final source inventory summary for the facility(s)
Source Qty. per
facility
Octave Band Sound Power Levels; LWi (dB) LWA (dBA) 63 Hz 125 Hz 250 Hz 500 Hz
1000 Hz
2000 Hz
4000 Hz
Droplet Separator 1 72.0 58.0 52.6 53.2 62.0 60.8 58.1 66.2
Main Condenser 1 91.2 91.2 95.8 98.4 99.2 97.0 94.2 103.4
Ejector 3 95.0 95.0 102.6 111.2 115.0 112.8 113.1 119.5
Inter Condenser 1 87.0 87.0 95.6 103.2 107.0 104.8 105.1 111.5
Vacuum Pump 4 90.0 97.0 96.6 97.2 94.0 89.8 86.2 98.8

Noise Impact Assessment for the Proposed Menengai Geothermal Power Plant in Kenya
Report Number: 14QUP01-02 Version 1 18
Source Qty. per
facility
Octave Band Sound Power Levels; LWi (dB) LWA (dBA) 63 Hz 125 Hz 250 Hz 500 Hz
1000 Hz
2000 Hz
4000 Hz
Hotwell Pump 2 64.0 90.0 97.6 91.2 87.0 79.8 71.3 93.2
Auxiliary Cooling Water Pump 2 110.0 102.0 95.6 87.2 82.0 79.8 77.2 92.4
Cooling Tower per Cell 4 103.5 100.9 98.8 98.0 99.7 99.1 98.9 106.1
Turbine Hall (effective LW) 1 110.9 112.3 92.1 82.1 76.3 64.7 60.3 96.9
Transformers (11 kV to 132 kV) 1 99.7 103.7 97.7 93.7 93.7 87.7 82.7 97.7
Transformers (11 kV to 0.69 kV) 1 86.0 90.0 84.0 80.0 80.0 74.0 69.0 84.0
Transformers (11 kV to 00.415 kV) 1 72.8 76.8 70.8 66.8 66.8 60.8 55.8 70.8
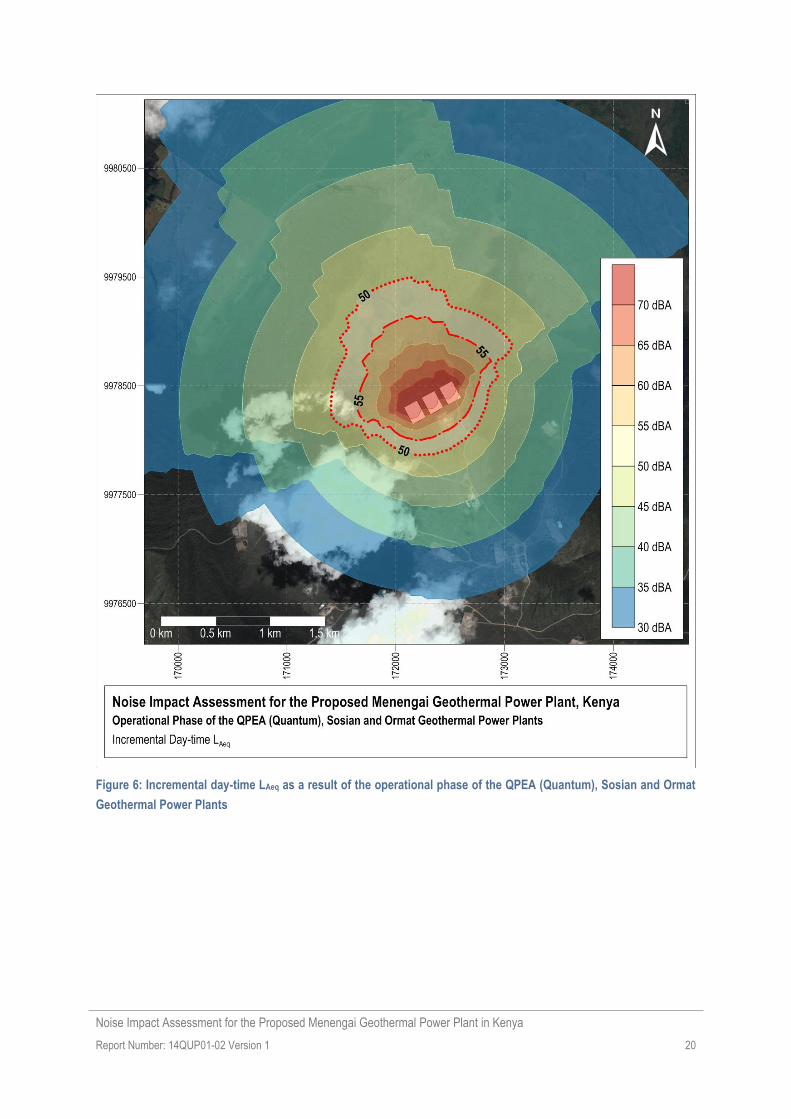
4.2 Noise Propagation and Simulated Noise Levels
The propagation of noise from the operational phase was calculated in accordance with SANS 10355 (2004). Meteorological
and site specific acoustic parameters as discussed in Section 3.2.1 along with source data discussed in 4.1, were applied in
the model.
Based on the anticipated extent of impacts given the baseline, the propagation of noise was calculated over a distance of
approximately 5 km at 50 m intervals. Results are presented in tabular and isopleths form. An isopleth is a line on a map
connecting points at which a given variable (in this case LP) has a specified constant value. This is analogous to contour
lines on a map showing terrain elevation. In the assessment of environmental noise, isopleths present lines of constant
noise level as a function of distance.
Table 8 gives a summary of maximum downwind distances over which Kenyan sound level limits and IFC noise level
guidelines are exceeded should the QPEA Geothermal Power Plant be operational on its own and with the Sosian and
Ormat facilities. Since the latter is representative of the ‘worst case’ isopleths of this scenario is included in Figure 6 to
Figure 11.
From Table 8 it is evident that even with all three facilities operating simultaneously the overall maximum increase in noise
level over the baseline will reduce to less than 3 dBA at around 1.72 km from the boundary of operations. As expected the
noise impact would be most notable at night when baseline noise levels are lower and assessment criteria more stringent.
Since the closest NSRs are situated at least 3 km away from these sites it is however unlikely a change in day or night time
noise levels will be detected at these locations. SANS 10103 (2008) indicates that at an increase of between 0 and 5 dBA,
sporadic complaints with little or no community action may be expected.
The relatively small impact area is the combined result of the baseline noise levels (already in exceedance of assessment
criteria), the design specifications of the facilities (i.e. galvanised steel sheet cladding of building that contains major noise
sources), and the absence of permanent NSRs within 2 km radius from site.
It can therefore be concluded that, when referring to noise levels and increases in ambient noise levels as a result
of the geothermal power plants’ operational design parameters, such as turbine hall cladding with galvanised steel
sheets, will be sufficient to ensure that no annoyance will be caused at the closest NSRs.

Noise Impact Assessment for the Proposed Menengai Geothermal Power Plant in Kenya
Report Number: 14QUP01-02 Version 1 19
Table 8: Maximum downwind distances over which Kenyan and IFC noise criteria are exceeded
Source Kenya Sound Level Limits IFC Noise Level Guidelines
Day-time (50 dBA) Night-time (35 dBA) Day-time (55 dBA) Night-time (45 dBA)
QPEA (Quantum) Geothermal Power Plant
Incremental 50 dBA at 760 m 35 dBA 2 430 m 55 dBA at 520 m 45 dBA at 1 250 m
Cumulative (in addition to baseline) Baseline of 55.2 dBA
exceeds limit Baseline of 45.2 dBA
exceeds limit Baseline of 55.2 dBA
exceeds guideline Baseline of 45.2 dBA
exceeds guideline
Increase above baseline Not applicable Not applicable 3 dBA at 510 m 3 dBA at 1 230 m
QPEA (Quantum), Sosian and Ormat Geothermal Power Plants
Incremental 50 dBA at 1 080 m 35 dBA 3 160 m 55 dBA at 730 m 45 dBA at 1 760 m
Cumulative (in addition to baseline) Baseline of 55.2 dBA
exceeds limit Baseline of 45.2 dBA
exceeds limit Baseline of 55.2 dBA
exceeds guideline Baseline of 45.2 dBA
exceeds guideline
Increase above baseline Not applicable Not applicable 3 dBA at 730 m 3 dBA at 1 720 m
Noise Impact Assessment for the Proposed Menengai Geothermal Power Plant in Kenya
Report Number: 14QUP01-02 Version 1 20
Figure 6: Incremental day-time LAeq as a result of the operational phase of the QPEA (Quantum), Sosian and Ormat
Geothermal Power Plants

Noise Impact Assessment for the Proposed Menengai Geothermal Power Plant in Kenya
Report Number: 14QUP01-02 Version 1 21
Figure 7: Cumulative day-time LAeq as a result of the operational phase of the QPEA (Quantum), Sosian and Ormat
Geothermal Power Plants in addition to the baseline of 55.2 dBA

Noise Impact Assessment for the Proposed Menengai Geothermal Power Plant in Kenya
Report Number: 14QUP01-02 Version 1 22
Figure 8: Increase in day-time LAeq over the baseline of 55.2 dBA as a result of the operational phase of the QPEA
(Quantum), Sosian and Ormat Geothermal Power Plants

Noise Impact Assessment for the Proposed Menengai Geothermal Power Plant in Kenya
Report Number: 14QUP01-02 Version 1 23
Figure 9: Incremental night-time LAeq as a result of the operational phase of the QPEA (Quantum), Sosian and Ormat
Geothermal Power Plants

Noise Impact Assessment for the Proposed Menengai Geothermal Power Plant in Kenya
Report Number: 14QUP01-02 Version 1 24
Figure 10: Cumulative night-time LAeq as a result of the operational phase of the QPEA (Quantum), Sosian and
Ormat Geothermal Power Plants in addition to the baseline of 45.2 dBA

Noise Impact Assessment for the Proposed Menengai Geothermal Power Plant in Kenya
Report Number: 14QUP01-02 Version 1 25
Figure 11: Increase in night-time LAeq over the baseline of 45.2 dBA as a result of the operational phase of the QPEA
(Quantum), Sosian and Ormat Geothermal Power Plants

Noise Impact Assessment for the Proposed Menengai Geothermal Power Plant in Kenya
Report Number: 14QUP01-02 Version 1 26
5 MANAGEMENT, MITIGATION AND RECOMMENDATIONS
In the quantification of noise emissions and simulation of noise levels as a result of proposed geothermal power generation
activities it was found that incrementally, both Kenyan and IFC assessment criteria for human exposure will not be exceeded
at NSRs. Since baseline noise levels are however already in exceedance of these criteria, cumulative noise levels will as
expected also be. The maximum increase above the baseline will reduce to less than 3 dBA (IFC criterion) at around 1.72
km from the boundary of operations. The increase at all NSRs will be less than 1 dBA both during the day and night. SANS
10103 (2008) indicates that at an increase of between 0 and 5 dBA, sporadic complaints with little or no community action
may be expected.
To however minimise and ensure low impacts of both construction and operational noise on the receiving environment it is
recommended that the following measures be adopted as part of the GPEA noise management plan.
5.1 Good Engineering and Operational Practices
For general construction and operational activities the following good engineering practice should be applied:
All diesel powered construction equipment and plant vehicles must be kept at a high level of maintenance. This
must particularly include the regular inspection and, if necessary, replacement of intake and exhaust silencers.
Any change in the noise emission characteristics of equipment must serve as trigger for withdrawing it for
maintenance.
To minimise noise generation, vendors must be required to guarantee optimised equipment design noise levels.
Acoustic attenuation devices should be installed on all ventilation outlet and high pressure gas or liquid should not
be ventilated directly to the atmosphere, but through an attenuation chamber or device.
Vibrating equipment must be on vibration isolation mountings.
The site layout should be designed in such a manner that the noisiest sections of the plant are at the centre of the
site, using surrounding buildings as noise attenuation shields.
A mechanism to monitor noise levels, record and respond to complaints and mitigate impacts should be
developed.
5.2 Operational Hours
It is recommended that, as far is as feasible, noise generating activities be limited to day-time hours (considered to be
between 06:01 and 20:00) since noise impacts are most significant during the night. This includes:
Limiting all construction activities to day-time hours;
Limiting truck and other vehicle activity to and from the site during the operational phase to day-time hours.
5.3 Acoustic Barriers
The effect of the steel sheet cladding of the turbine hall which encloses major noise sources was included in the assessment
and proven to be sufficient to ensure that assessment criteria are not exceeded at NSRs. It is essential that the cladding be
installed in such a way that gaps and openings are minimised. Access doors must be kept closed at all times.

Noise Impact Assessment for the Proposed Menengai Geothermal Power Plant in Kenya
Report Number: 14QUP01-02 Version 1 27
5.4 Traffic
Although traffic volumes are expected to be low during the operational phase, construction phase traffic may be notable.
The measures described below are considered good practice in reducing traffic related noise.
In general, road traffic noise is the combination of noise from individual vehicles in a traffic stream and is considered as a
line source if the density of the traffic is high enough to distinguish it from a point source. The following general factors are
considered the most significant with respect to road traffic noise generation:
Traffic volumes i.e. average daily traffic.
Average speed of traffic.
Traffic composition i.e. percentage heavy vehicles.
Road gradient.
Road surface type and condition.
Individual vehicle noise including engine noise, transmission noise, contact noise (the interaction of tyres and the
road surface, body, tray and load vibration and aerodynamic noise
In managing transport noise specifically related to trucks, efforts should be directed at:
Minimizing individual vehicle engine, transmission and body noise/vibration. This is achieved through the
implementation of an equipment maintenance program.
Minimize slopes by managing and planning road gradients to avoid the need for excessive
acceleration/deceleration.
Maintain road surface regularly to avoid corrugations, potholes etc.
Avoid unnecessary idling times.
Minimizing the need for trucks/equipment to reverse. This will reduce the frequency at which disturbing but
necessary reverse warnings will occur. Alternatives to the traditional reverse ‘beeper’ alarm such as a ‘self-
adjusting’ or ‘smart’ alarm could be considered. These alarms include a mechanism to detect the local noise level
and automatically adjust the output of the alarm is so that it is 5 to 10 dB above the noise level in the vicinity of the
moving equipment. The promotional material for some smart alarms does state that the ability to adjust the level of
the alarm is of advantage to those sites ‘with low ambient noise level’ (Burgess & McCarty, 2009).
5.5 Monitoring
It is recommended that short term 24-hour to 1-week sampling be conducted at the on the facility boundaries as well as
nearest NSRs. Monitoring should be conducted in accordance with the procedures specified by the IFC (2007)). Samples, at
least 24-hours in duration should include the following parameters: LAeq, LA90, and the un-weighted octave band sound
pressure levels (LZeq). In the interpretation and reporting of sampled environmental noise levels, use should be made of a
trained specialist. In addition to ambient noise monitoring it is recommended that source noise measurements of turbine
building facades and sources located inside and outside buildings be sampled to verify LW’s applied in this study.
5.6 Application for a Licence to Emit Noise Levels in Excess of Kenyan Limits
It is unclear exactly when a facility may be required to apply for such a licence. It is recommended that local authorities
be consulted in this regard given the outcome of this noise assessment.

Noise Impact Assessment for the Proposed Menengai Geothermal Power Plant in Kenya
Report Number: 14QUP01-02 Version 1 28
6 REFERENCES
Barron, R. F., 2003. Industrial Noise Control and Acoustics. New York: Marcel Dekker, Inc..
Brüel & Kjær Sound & Vibration Measurement A/S, 2000. www.bksv.com. [Online] Available at: http://www.bksv.com
[Accessed 14 October 2011].
Burgess, M. & McCarty, M., 2009. Review of Alternatives to 'Beeper' Alarms for Construction Equipment, Canberra:
University of New South Wales.
IFC, 2007. General Environmental, Health and Safety Guidelines, s.l.: s.n.
Muse, G., 2013. Proposed Installation of 3 x 30 MWe Menengai Modular Power Plants Projects in Nakuru County, s.l.:
University of Eldoret.
NEMA, 2009. Noise Regulations. [Online] Available at: http://www.nema.go.ke [Accessed 17 February 2015].
SANS 10103, 2008. The measurement and rating of environmental noise with respect to annoyance and to speech
communication, Pretoria: Standards South Africa.
SANS 10357, 2004. The Calculation of Sound Propagation by the Concawe Method. s.l.:Standards South Africa.
WHO, 1999. Guidelines to Community Noise. s.l.:s.n.

Noise Impact Assessment for the Proposed Menengai Geothermal Power Plant in Kenya
Report Number: 14QUP01-02 Version 1 29
7 APPENDIX A – NOISE MEASUREMENT DATA
To be included