noise and vibration settings report san … · wilson, ihrig & associates, inc. 4 sf muni...
TRANSCRIPT

NOISE AND VIBRATION SETTINGS REPORT SAN FRANCISCO MUNI HISTORIC STREETCAR SERVICE TO FORT MASON Revised Report April 2009 Submitted to: URS Corporation 221 Main Street, Suite 600 San Francisco, CA 94105 By
President and Principal Consultant

WILSON, IHRIG & ASSOCIATES, INC. i SF Muni Historic Streetcar Extension
TABLE OF CONTENTS Page INTRODUCTION ..........................................................................................................................1 REGULATORY SETTING ..........................................................................................................1
Operational Noise...............................................................................................................1 Operational Vibration .......................................................................................................4 Construction Noise and Vibration....................................................................................5
AFFECTED ENVIRONMENT ....................................................................................................6
Existing Land Uses.............................................................................................................6 Existing Noise Levels.........................................................................................................8 Existing Vibration Levels ..................................................................................................9
APPENDIX A - AMBIENT NOISE AND VIBRATION SURVEYS ................................... A-1
BASIC CONCEPTS...................................................................................................... A-2 SURVEY PROCEDURE.............................................................................................. A-2 RESULTS ...................................................................................................................... A-4
Noise................................................................................................................... A-4 Vibration ............................................................................................................ A-7 Figures A-1 through A-31.....................................................................A-9 - A-31
APPENDIX B - GLOSSARY AND SIGNIFICANCE
OF ACOUSTICAL TERMS ...................................................... B-1 - B-6

WILSON, IHRIG & ASSOCIATES, INC. 1 SF Muni Historic Streetcar Extension INTRODUCTION This report presents information on the existing noise and vibration levels in the vicinity of the proposed extension into Fort Mason of the San Francisco Municipal Railway's existing F-Line, which utilizes historic streetcars from San Francisco, other U.S. cities and foreign countries. The project will extend historic streetcar service from the existing terminus on Jones Street in Fisherman's Wharf west through the San Francisco Maritime National Historical Park, then on through the existing abandoned rail tunnel below Upper Fort Mason, terminating in the vicinity of the Fort Mason Center in the Golden Gate National Recreation Area. The project will eliminate use of the existing track and tight-radius curves on Jones Street, and will provide new track on Leavenworth Street (between Jefferson and Beach). REGULATORY SETTING Operational Noise The National Park Service does not have any specific quantitative noise standards that are applicable to Fort Mason or the Aquatic Park District, although the NPS Director=s Order #47, Natural Sounds, requires park facilities to be managed in such a way to minimize noise pollution. Direction for management of natural and cultural soundscapes is provided in Section 4.9, Soundscape Management and in Section 5.3.1.7, Cultural Soundscape Managmenet of Management Policies 2006 published by the NPS. The basic policy is that, "The National Park Service will preserve, to the greatest extent possible, the natural soundscapes of parks." There are no specific City, State, or Federal regulations for noise from streetcar operations. However, there are several sets of guidelines relating to land-use compatibility and the design of transit facilities, which are relevant to the project. San Francisco=s Plan for Transportation Noise Control (a section of the Environmental Protection Element) provides guidance on the environmental noise levels that are considered generally acceptable for residential and other land uses. The Plan provides land-use compatibility guidelines in terms of the Day-Night Average Sound Level (Ldn) in the Land-Use Compatibility Chart, reproduced in Figure 1. The guidelines for single-family and multi-family residential development are that: $ Areas with an Ldn of less than 60 dB are considered satisfactory for residential development, with
no special building noise insulation requirements.
$ New residential development between 60 and 70 dB Ldn should only proceed subject to an assessment of the need for, and if necessary the incorporation of, additional noise insulation features in the design (these requirements are generally specified in a noise study report).
$ New residential development should generally be discouraged above 70 dB Ldn. The development should only proceed subject to an assessment of the need for, and if necessary the incorporation of, additional noise insulation features in the design (these requirements are generally specified in a noise study report).

WILSON, IHRIG & ASSOCIATES, INC. 2 SF Muni Historic Streetcar Extension Thus, existing residential development located in an urban setting where the Ldn is below 60 dB would be considered to be in a relatively quiet area. Note that the guidelines are slightly less restrictive for hotels and motels, recognizing the transitory nature of the occupancy and the fact that these buildings are usually better insulated against exterior noise.
Figure 1 Land Use Compatibility Guidelines (from San Francisco's Environmental
Protection Element) The American Public Transit Association Guidelines1 include criteria for airborne noise along transit corridors. The APTA criteria are given in terms of the maximum pass-by noise levels, and are dependent on the type of building and the type of area. For example, these criteria limit the maximum pass-by noise levels from transit systems to 70 dBA at single-family dwellings in low density residential areas, and to 75 dBA in average and high density residential areas. The criteria for multi-family dwellings are up to 5 dBA higher.
1 American Public Transit Association, 1981 Guidelines for Design of Rapid Transit Facilities, Section 2.7, ANoise and Vibration,@ 1981. Note B the American Public Transit Association is now the American Public Transportation Association.

WILSON, IHRIG & ASSOCIATES, INC. 3 SF Muni Historic Streetcar Extension Table 1 summarizes the APTA wayside noise criteria. These criteria are generally applicable outdoors at the nearside of the nearest occupied building or area under consideration, but not less than 50 ft. from track centerline. Table 1 APTA Criteria for Maximum Noise from Train Operations
Maximum Passby Noise Level - dBA
Community Area Category Single Family
Dwellings
Multi-Family
Dwellings
Commercial
Buildings I
Low Density Residential
70
75
80
II
Average Residential
75
75
80
III
High Density Residential
75
80
85
IV
Commercial
80
80
85
V
Industrial/Highway
80
85
85
The U.S. FTA Guidance Manual2 provides procedures for assessing the noise and vibration impacts of new bus and rail mass transit projects. The main basis of the noise impact criteria is a comparison between the existing ambient noise levels and the future noise levels from the proposed project. If the project noise contribution is well below the existing noise levels at sensitive receptors, the project is considered to have no impact. Figure 2 (from Chapter 3 of the FTA Guidance Manual) illustrates this approach. The graph indicates that, for example, if the project noise contribution is 55 dB Ldn in an area where the existing ambient noise is 65 dB Ldn, there is clearly no impact. Conversely, if the project produces a noise contribution is 65 dB Ldn in the same area, the impact would be moderate (bordering on severe). The Land Use Categories referred to in the figure are: $ Category 1 B Land where quiet is essential (includes national historic landmarks with significant
outdoor use, recording studios, concert halls). $ Category 2 B Residences and buildings where people normally sleep (includes hotels). $ Category 3 B Institutional land uses with primarily daytime and evening use (includes schools,
libraries, theaters, museums).
2 US Department of Transportation, Federal Transit Administration Office of Planning and Environment, Transit Noise and Vibration Impact Assessment, FTA-VA-90-1003-06, May 2006.

WILSON, IHRIG & ASSOCIATES, INC. 4 SF Muni Historic Streetcar Extension
Figure 2 Noise Impact Criteria for Transit Projects (from FTA Guidance Manual) Operational Vibration As with noise, there are no specific City, State, or Federal regulations for vibration from streetcar operations. However, the vibration criteria in the FTA Guidance Manual are commonly used in assessing potential vibration impacts from new transit projects, and provide guidance on acceptable levels. These criteria, summarized in Table 2, are based on the vertical vibration velocity level of the building floor, in decibels. To avoid confusion with noise levels in decibels, the vibration velocity level is usually referred to as VdB. Vibration levels of as low as 65 VdB can be perceptible to people.

WILSON, IHRIG & ASSOCIATES, INC. 5 SF Muni Historic Streetcar Extension Table 2 Groundborne Vibration Impact Criteria (from FTA Guidance Manu al)
Groundborne Vibration Impact Levels -
VdB re 1 micro-in/sec*
Land Use Category Frequent Events
Occasional Events
Infrequent Events
Category 1: Buildings where vibration would interfere with interior equipment (such as optical microscopes)
65
65
65
Category 2: Residences and buildings where people normally sleep
72
75
80
Category 3: Institutional land uses with primarily daytime use (such as schools, churches, quiet offices)
75
78
83
* Refers to vertical floor vibration velocity levels "Frequent Events" are defined as more than 70 vibration events of the same source per day, for example, more than 70 train or streetcar passbys per day. "Occasional Events" are defined as between 30 and 70 events per day, and "Infrequent Events" are defined as less than 30 events per day. Thus, the vibration criteria for residential buildings applicable to most rapid transit or light rail systems are either 72 VdB or 75 VdB, depending on the frequency of daily operations. Construction Noise and Vibration The San Francisco Noise Ordinance (Article 29 of the San Francisco Police Code) prohibits the operation of any powered construction equipment emitting noise at a level in excess of 80 dBA at 100 ft., or an equivalent sound level at some other distance. This limit does not apply to impact tools and equipment, such as pile drivers, pavement breakers, and jackhammers, provided such equipment is fitted with approved intake and exhaust mufflers, and that pavement breakers and jackhammers are also equipped with approved acoustically attenuating shields or shrouds. The Noise Ordinance prohibits construction activities between 8:00 p.m. and 7:00 a.m., if the noise created by the activities exceeds the ambient noise level by more than 5 dBA at the nearest property line. There are no specific City or State regulations or standards for ground vibration due to construction sources. However, City and State agencies, such as the Department of Public Works and Caltrans, normally include vibration limits in their construction contracts to minimize the risk of damage to potentially affected buildings and civil structures. These limits are usually presented in terms of the

WILSON, IHRIG & ASSOCIATES, INC. 6 SF Muni Historic Streetcar Extension Peak Particle Velocity (PPV) of the vertical ground vibration. For example, Caltrans uses limits of 0.2 in/sec PPV for conventional buildings and 0.08 in/sec for historical buildings in evaluating the potential effects of continuous vibration, including vibration generated by road traffic and by most construction activities. The threshold of people's perception in terms of PPV is on the order of 0.005-0.006 in/sec. Human sensitivity is such that vibrations can be felt by the occupants of buildings and produce complaints even though no physical damage is caused. This phenomenon is evident from the data in Table 2, which provides a summary of the effect of continuous vibrations on people and building structures (developed from research carried out by the Transport and Road Research Laboratory in England). These criteria indicate that the vibration can become unpleasant and lead to major complaints well before there is any significant risk of even superficial structural damage to most buildings. These criteria are also used by Caltrans to assess the severity of road traffic and construction vibration. Caltrans notes that the 0.08 in/sec criterion included in Table 2 for ruins and historical monuments could also be applied to the buildings of historic interest. AFFECTED ENVIRONMENT Existing Land Uses The buildings and facilities along the San Francisco Municipal Railway's existing F-Line in the study area are predominantly commercial. Building uses along Jefferson, Beach, and Jones Streets include restaurants, cafe/bars, and other food and retail outlets, including those at Fisherman's Wharf. There are also residential apartments, a museum, a senior center, a hotel and several public parking lots. The Holiday Inn Express Hotel at 550 North Point Street - the only hotel in the study area located along the existing F-Line - is adjacent to the Jones/Beach intersection, where the streetcars negotiate a tight-radius curve from Jones Street into Beach Street. Existing buildings and facilities that will be located adjacent to the extended streetcar line between Jones Street and the entrance to the rail tunnel (below Upper Fort Mason) include: $ The Holiday Inn Hotel at 1300 Columbus Avenue. $ The Courtyard by Marriott at 580 Beach Street. $ The Argonaut Hotel at 495 Jefferson Street. $ The Cannery, located adjacent to The Argonaut Hotel and bounded by Jefferson, Beach, and
Leavenworth Streets. The Cannery has shops, restaurants, offices, and a jazz club. $ The cable car turnaround at Hyde and Beach Streets and the neighboring park and seafront areas,
which extend to the west beyond the disused rail tunnel entrance. $ Ghiradelli Square at 900 North Point Street, which has shops, restaurants, and galleries. $ San Francisco Senior Center at 890 Beach Street in the NHL Aquatic Park Bathhouse Building
(Maritime Museum). $ The NHL Aquatic Park Bathhouse Building (Maritime Museum) at 900 Beach Street (currently
closed and undergoing renovation). $ Other commercial/office buildings, shops, galleries, cafe/restaurants and bars.

WILSON, IHRIG & ASSOCIATES, INC. 7 SF Muni Historic Streetcar Extension Table 3 Reactions of People and Damage to Buildings at Various Continuous Vibration Levels
Vibration Level (Peak Particle Velocity)
mm/s in/sec Human Reaction Effect on Buildings
0.15 - 0.30 0.006 - 0.019
Threshold of perception; possibility of intrusion
Vibrations unlikely to cause damage of any type.
2.0 0.08 Vibrations readily perceptible
Recommended upper level of the vibration to which ruins and ancient monuments should be subjected.
2.5 0.10 Level at which continuous vibrations begin to annoy people.
Virtually no risk of Aarchitectural@ damage to normal buildings.
5.0 0.20 Vibrations annoying to people in buildings (this agrees with the levels established for people standing on bridges and subjected to relative short periods of vibrations).
Threshold at which there is a risk of Aarchitectural@ damage to normal dwelling - houses with plastered walls and ceilings. Special types of finish such as lining of walls, flexible ceiling treatments, etc., would minimize Aarchitectural@ damage.
10-15 0.4 - 0.6 Vibrations considered unpleasant by people subjected to continuous vibrations and unacceptable to some people walking on bridges.
Vibrations at a greater level than normally expected from traffic, but would causeAarchitectural@ damage and possibly minor structural damage.
Note: The vibration levels are based on peak particle velocity in the vertical direction. Where human reactions are concerned, the value is at the point at which the person is situated. For buildings, the value refers to the ground motion. No allowance is included for the amplifying effect, if any, of structural components.
Source: AA Survey of Traffic-induced Vibrations@ by Whiffen and Leonard, Transport and Road Research Laboratory, RRL Report LR418, Crowthorne, Berkshire, England, 1971.

WILSON, IHRIG & ASSOCIATES, INC. 8 SF Muni Historic Streetcar Extension It appears that the only existing residential units located immediately adjacent to the future streetcar track along this area are the upper level apartments at 2765 Hyde Street, located above the Buena Vista Cafe. There are other residential buildings further back from the proposed alignment, for example the residential towers (Fontana Towers) located on North Point (between Polk and Van Ness), but these buildings are considered too far from the future streetcar tracks to be adversely affected by operational noise or vibration. The existing abandoned rail tunnel is almost directly below some of the historic residential buildings in Upper Fort Mason. Buildings 2, 7, 11, 231, 232, and 235 are the closest residential buildings to the tunnel, and are potentially affected by ground-borne noise and vibration from future streetcar operations in the tunnel. Fort Mason Center is a multicultural center, which hosts events, conferences, performances and exhibits. The facilities in the five Landmark Buildings (A through E) at the Fort Mason Center include offices, conference areas, theaters, meeting/activity spaces, a restaurant, bookstore, library, and educational facilities (including a school of music). Depending on the final design of the turnaround track, the five Landmark Buildings are potentially impacted by streetcar noise. The pavilions and other facilities on the three piers are some distance from the proposed alignment, and are unlikely to be affected by streetcar noise or vibration. Existing Noise Levels This section presents a summary of the ambient noise levels recorded during two noise surveys in the study area. This first survey occurred during November 2006 and was supplemented by a second survey during February and March 2008. Complete details on the survey procedures, instrumentation and results are provided in Appendix A. As would be expected, the highest noise levels measured during the environmental noise surveys were generally obtained along Beach, Jefferson, Leavenworth and Jones Streets - the more heavily trafficked streets in the study area. The Day-Night Average Sound Level (Ldn) values obtained at the long-term monitoring locations and the Ldn values estimated at the short-term monitoring locations, along these streets, were either close to or above 70 dB. These levels are fairly typical of busy urban streets. At the monitoring location near the NHL Aquatic Park Bathhouse Building (Maritime Museum) and near the western end of Beach Street, just past this building, the noise levels were typically below 65 dB Ldn due to the lower traffic volumes in this area. New development along these streets consistent with current use would generally need a noise study to proceed based on San Francisco's Land Use Compatibility Guidelines. At the park area near the east portal of the abandoned tunnel the noise levels were typically below 60 dB Ldn and any development in this area consistent with current use would generally not need a noise study to proceed based on San Francisco's Land Use Compatibility Guidelines. Upper Fort Mason is generally a fairly quiet area, apart from the southern part closest to Bay Street, with existing noise levels below 55 dB Ldn in the areas closest to the rail tunnel. The residences near the tunnel are some distance from Bay Street and there is usually little traffic on the roads within Upper Fort Mason. Fort Mason Center is also reasonably quiet, with existing noise levels of

WILSON, IHRIG & ASSOCIATES, INC. 9 SF Muni Historic Streetcar Extension approximately 60 dB Ldn at the south end of Landmark Buildings B and C. The main noise source in this area is traffic movements into and out of the parking lot. Any development in this area consistent with current use with the exception of highly noise sensitive structures such as a new auditorium or music hall, would generally not need a noise study to proceed based on San Francisco's Land Use Compatibility Guidelines. Noise levels are somewhat higher due to traffic in the vicinity of Laguna and North Point Streets where the existing noise levels are typically greater than 65 dB Ldn near the streets, but generally 2 to 3 dB lower when away from Laguna Street and in the park area. Noise from the intermittent streetcar operations along Beach, Jefferson, and Jones Streets does not significantly affect the existing Day-Night Average Sound Levels, which are dominated by the semi-continuous street traffic noise. However, the normal operational (wheel/rail) streetcar noise and the warning bells that are rung along Jefferson Street through the Fisherman's Wharf area are generally quite noticeable, although they do not appear to be overly intrusive. Depending on the speed, the maximum passby noise levels from the streetcar operations can be comparable with the maximum passby noise levels from street traffic. For example, at the short-term monitoring location at Beach and Taylor, the maximum streetcar pass-by noise levels were between 82 and 91 dBA at 25 ft. from the track centerline, with the streetcars running at approximately 20-25 mph. However at Jones and Beach, where the speeds are very low, the noise levels were 66-70 dBA (in the absence of wheel squeal). Most of the vintage streetcars that were observed negotiating the tight (approximately 65 ft. radius) curve at Jones and Beach produced very little, if any, wheel squeal. However, one of the streetcars (#496, a vintage tram acquired from Melbourne, Australia) generated very high, subjectively unpleasant noise levels of greater than 100 dBA, at the monitoring location at the SE corner of Jones and Beach, due to wheel squeal. The significant difference in noise levels on curved track are due to the vibration damping incorporated in the wheel construction of most of the vehicles. Streetcar #496 appears to have very lightly damped wheels. A full documentation of the noise levels from the historic streetcar fleet will be incorporated as part of the project's impact characterization. Existing Vibration Levels This section provides a summary of the ground vibration levels recorded during the November 2006 ambient vibration survey in the study area. Further details on the survey procedures, instrumentation and the results are provided in Appendix A. The highest ground vibration levels were obtained at locations adjacent to the existing streetcar tracks. For example, the maximum vibration level recorded at the monitoring location at the SE corner of Jones and Beach was 75 VdB, due to a streetcar negotiating the curved track at this intersection. The maximum vibration level recorded at Beach and Taylor, where the streetcars were traveling at 20-25 mph, was 81 VdB at 25 ft. from track centerline. The ground vibration was, subjectively, noticeable at both locations.

WILSON, IHRIG & ASSOCIATES, INC. 10 SF Muni Historic Streetcar Extension At the other monitoring locations along the heavily trafficked streets in the study area where there are no streetcar operations, the ground vibration levels were typically less than 70 VdB, and the vibration was not, subjectively, noticeable. Thus, the results indicate that the streetcars can produce significantly higher ground vibration than other street traffic. The ground vibration levels at the monitoring locations in Upper Fort Mason and in the Fort Mason Center were relatively low. The maximum vibration level recorded during the 15-minute sample at the south end of Landmark Building A in the Fort Mason Center was 58 VdB. The maximum vibration level recorded during the 15-minute sample on the sidewalk in front of Buildings 232 and 234 in Upper Fort Mason was 45 VdB. These levels are well below the threshold of human perception. As with noise, a full documentation of ground vibration from historic streetcar operations will be incorporated as part of the project's impact characterization.

1WILSON, IHRIG & ASSOCIATES, INC. A-1 SF Muni Historic Streetcar Extension
APPENDIX A
AMBIENT NOISE AND VIBRATION SURVEYS

2WILSON, IHRIG & ASSOCIATES, INC. A-2 SF Muni Historic Streetcar Extension BASIC CONCEPTS Sound is a slight, rapid fluctuation in atmospheric pressure. The sound pressure level of sound in decibels is 20 times the logarithm to the base of 10 of the ratio of the RMS (root-mean square) value of the sound pressure to the RMS value of a reference sound pressure. The standard reference sound pressure is 20 micro-Pascals as indicated in ANSI S1.8-1969, "Preferred Reference Quantities for Acoustical Levels." Noise is often considered as sound that is unwanted by the recipient. Vibration is the mechanical motion of a solid medium, such as the ground or a building structural element. Vibration velocity is the rate of change of displacement of a vibration. The velocity level is 20 times the logarithm to the base 10 of the ratio of the RMS value of the velocity to a reference velocity of 10-6 in/sec. Above approximately 10 Hz, human response to vibration is more closely correlated to the velocity level than the acceleration level. To avoid confusion with noise levels in decibels, the vibration velocity level is usually referred to as VdB. Typical environmental noise levels and typical vibration velocity levels are shown in Figures A-1 and A-2. SURVEY PROCEDURE The ambient noise and vibration surveys consisted of both short-term noise and vibration recordings, and long-term noise measurements. There were two series of noise measurements, the first occurred during November 2006 and the second during February and March 2008. The second series of noise measurements were undertaken to further characterize the noise levels within the park areas. The noise and vibration measurement locations were chosen to characterize the existing ambient conditions at a potentially noise and vibration sensitive area or building. Thus the focus is on buildings with residential uses, other buildings with uses requiring relative quiet, buildings of historical significance and park areas. Additional measurements are often obtained at other locations to provide a relatively complete assessment of the noise and vibration environment within the area affected by a project. The long-term noise measurements obtained over several days were supplemented by short-term measurements for source characterization and further characterization of the noise environment in the project area. Vibration measurements are typically taken over relatively short-term periods for environmental characterization and source identification. Long-term vibration measurements are typically not necessary to characterize ambient vibration at a particular location. The characterization of the noise and vibration environment in the project area provides a basis for establishing design criteria and for evaluating the potential noise and vibration impact of the project. The long-term monitoring for all data obtained by WIA was carried out using precision, calibrated, Larson Davis Laboratories Type 812 and 820 digitally logging sound level meters secured to utility poles or trees, with the logger microphones about 15 ft. above ground, providing hourly statistical information on the A-weighted ambient sound levels. For the first series of noise measurements, four of the loggers were deployed from Monday, November13, 2006 until Tuesday, November 21, 2006, but the logger at Location L-1 was not deployed until Tuesday, November 14. The long-term monitoring locations for the first series of measurements, designated as L-1 through L-5, are indicated on aerial photos of the study area in Figures A-3 and A-4, and are described below:

3WILSON, IHRIG & ASSOCIATES, INC. A-3 SF Muni Historic Streetcar Extension
§ In the Fort Mason Center parking lot, near the south end of Landmark Building B (L-1).
§ The north side of Beach Street, just west of the NHL Aquatic Park Bathhouse Building (Maritime Museum) (L-2).
§ The south side of Beach Street, between Polk and Hyde (L-3).
§ The east side of Leavenworth Street, between Beach and Jefferson (L-4).
§ The north side of Beach Street, between Leavenworth and Jones (L-5). For the long-term monitoring locations for the second series of measurements, designated as L-11 through L-14, three of the loggers were deployed from Thursday, February 28, 2008 until Wednesday, March 5, 2008, while the logger at L-11 was deployed from Tuesday, February 26, 2008 until Sunday, March 9, 2008. These measurement locations are also shown on aerial photos of the study area in Figures A-3 and A-4, and are described below:
• In the western Fort Mason park area, east of the intersection of Laguna and North Point Streets (L-11).
• In the western Fort Mason park area, east of the intersection of Laguna and North Point Streets, but relatively close to Laguna Street (L-12).
• In the Aquatic Park National Historic Landmark District, adjacent to the east portal of the abandoned railroad tunnel (L-13).
• In the Aquatic Park National Historic Landmark District, just east of the NHL Aquatic Park Bathhouse Building (Maritime Museum), and north of Bay Street (L-14).
The long-term measurements at L-11 were obtained over an extended period of nearly two weeks by the National Park Service using a Larson Davis Laboratories Type 824 digitally logging sound level meter with the microphone on a tripod rather than in a tree or on a light or utility pole. Both series of long-term measurements were made during periods of dry weather. Typical temperatures were in the mid 60's oF during the day and in the mid 40's to low 50's oF during the night. Photos of the long-term monitoring locations are provided in Figures A-5 through A-12. Simultaneous short-term noise and ground vibration samples, of 15 minutes’ duration, were taken during the first measurement series in November 2006 at an additional six locations in the study area, designated as S-1 through S-6. These measurements were generally taken on sidewalks. The locations are indicated in Figures A-3 and A-4, and are described below:
§ At the south end of Landmark Building A in the Fort Mason Center (S-1).
§ In front of Buildings 232 and 234 in Upper Fort Mason (S-2).
§ The SW corner of Larkin and Beach (S-3).
§ The south side of Beach Street, between Polk and Hyde (S-4).
§ The SE corner of Jones and Beach, close to the curved streetcar track (S-5).
§ On the east side of Taylor Street, approximately 25 ft. to the south from the streetcar track on Beach Street (S-6).
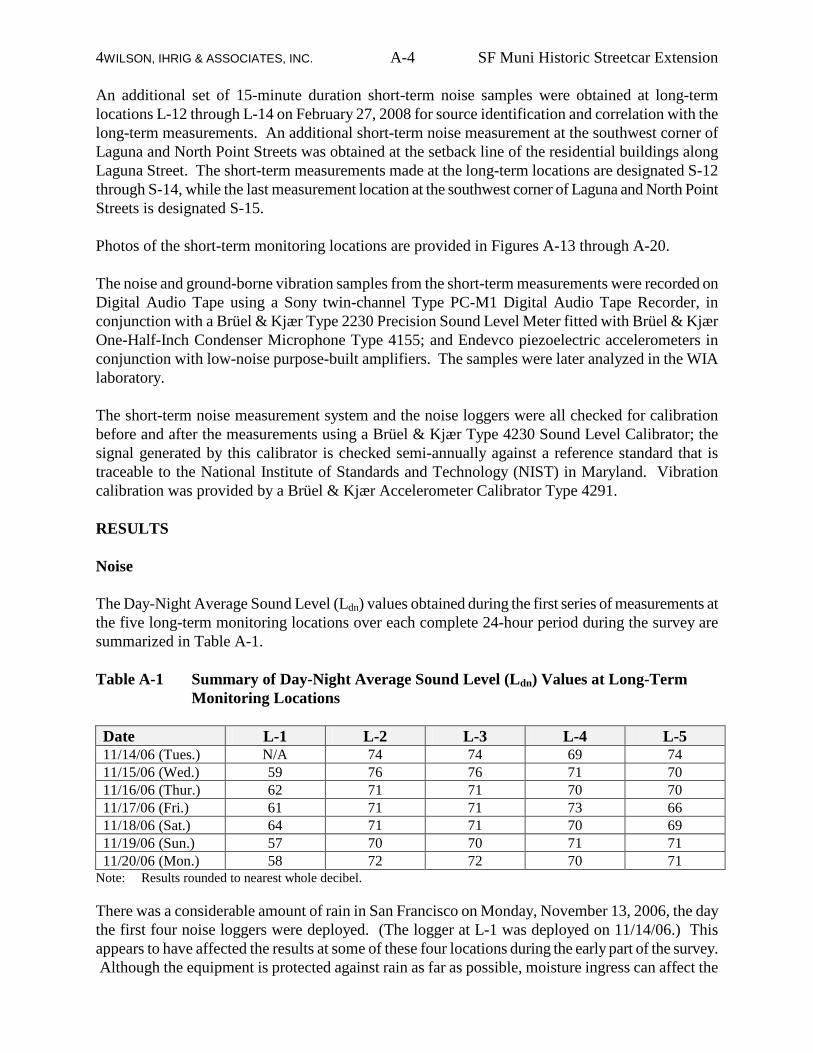
4WILSON, IHRIG & ASSOCIATES, INC. A-4 SF Muni Historic Streetcar Extension An additional set of 15-minute duration short-term noise samples were obtained at long-term locations L-12 through L-14 on February 27, 2008 for source identification and correlation with the long-term measurements. An additional short-term noise measurement at the southwest corner of Laguna and North Point Streets was obtained at the setback line of the residential buildings along Laguna Street. The short-term measurements made at the long-term locations are designated S-12 through S-14, while the last measurement location at the southwest corner of Laguna and North Point Streets is designated S-15. Photos of the short-term monitoring locations are provided in Figures A-13 through A-20. The noise and ground-borne vibration samples from the short-term measurements were recorded on Digital Audio Tape using a Sony twin-channel Type PC-M1 Digital Audio Tape Recorder, in conjunction with a Brüel & Kjær Type 2230 Precision Sound Level Meter fitted with Brüel & Kjær One-Half-Inch Condenser Microphone Type 4155; and Endevco piezoelectric accelerometers in conjunction with low-noise purpose-built amplifiers. The samples were later analyzed in the WIA laboratory. The short-term noise measurement system and the noise loggers were all checked for calibration before and after the measurements using a Brüel & Kjær Type 4230 Sound Level Calibrator; the signal generated by this calibrator is checked semi-annually against a reference standard that is traceable to the National Institute of Standards and Technology (NIST) in Maryland. Vibration calibration was provided by a Brüel & Kjær Accelerometer Calibrator Type 4291. RESULTS Noise The Day-Night Average Sound Level (Ldn) values obtained during the first series of measurements at the five long-term monitoring locations over each complete 24-hour period during the survey are summarized in Table A-1. Table A-1 Summary of Day-Night Average Sound Level (Ldn) Values at Long-Term
Monitoring Locations Date L-1 L-2 L-3 L-4 L-5 11/14/06 (Tues.) N/A 74 74 69 74 11/15/06 (Wed.) 59 76 76 71 70 11/16/06 (Thur.) 62 71 71 70 70 11/17/06 (Fri.) 61 71 71 73 66 11/18/06 (Sat.) 64 71 71 70 69 11/19/06 (Sun.) 57 70 70 71 71 11/20/06 (Mon.) 58 72 72 70 71
Note: Results rounded to nearest whole decibel. There was a considerable amount of rain in San Francisco on Monday, November 13, 2006, the day the first four noise loggers were deployed. (The logger at L-1 was deployed on 11/14/06.) This appears to have affected the results at some of these four locations during the early part of the survey. Although the equipment is protected against rain as far as possible, moisture ingress can affect the

5WILSON, IHRIG & ASSOCIATES, INC. A-5 SF Muni Historic Streetcar Extension sensitivity of the microphones and can therefore affect the results until the moisture evaporates. Thus, no data are reported for November 13. The weather was dry during the period of 11/14/06 through 11/20/06. Figures A-21 through A-25 are plots of the statistical noise levels from the first series of measurements for one complete 24-hour period (Monday, 20 November 2006) at each location. The metrics plotted include the hourly equivalent continuous noise level (Leq) and the noise levels exceeded for 1%, 10%, 50%, and 90% of each hour (L1, L10, L50, and L90, respectively). These graphs indicate a fairly typical diurnal variation of noise levels in an urban setting. The Day-Night Average Sound Level (Ldn) values obtained during the second series of measurements at the four long-term monitoring locations over each complete 24-hour period during the survey are summarized in Table A-2. Table A-2 Summary of Day-Night Average Sound Level (Ldn) Values at Long-Term
Monitoring Locations Date L-11 L-12 L-13 L-14 2/26/08 (Tues.) 64 - - - 2/27/08 (Wed.) 64 - - - 2/28/08 (Thur.) 64 67 57 62 2/29/08 (Fri.) 65 67 60 64 3/1/08 (Sat.) 65 67 59 73** 3/2/08 (Sun.) 62 65 58 80** 3/3/08 (Mon.) 64 66 57 63 3/4/08 (Tue.) 64 66 60 62 3/5/08 (Wed.) 65 67 63* 63 3/6/08 (Thur.) 65 - - - 3/7/08 (Fri.) 64 - - - 3/8/08 (Sat.) 64 - - - 3/9/08 (Sun.) 63 - - - * High noise levels in the morning. ** High noise levels in evening (3/1) and night (3/2) due to local activities Note: Results rounded to nearest whole decibel. As would be expected, the highest noise levels measured during the environmental noise surveys were generally obtained along Beach, Jefferson, Leavenworth and Jones Streets – the more heavily trafficked streets on the east side of the study area, as well as along Laguna Street on the west side of the study area. The Day-Night Average Sound Level (Ldn) values obtained at the long-term monitoring locations and the Ldn values estimated at the short-term monitoring locations, along these streets, were either close to or above 70 dB. These levels are fairly typical of busy urban streets. At the monitoring location near Maritime Museum/Historic Bathhouse and at the western end of Beach Street, just past the San Francisco Maritime Museum/Historic Bathhouse, the noise levels were typically below 65 dB Ldn due to the lower traffic volumes in these areas. At the park area near the east portal of the abandoned tunnel the noise levels were typically below 60 dB Ldn. Upper Fort Mason is generally a fairly quiet area, apart from the southern part closest to Bay Street, with existing noise levels below 55 dB Ldn in the areas closest to the rail tunnel. The residences near

6WILSON, IHRIG & ASSOCIATES, INC. A-6 SF Muni Historic Streetcar Extension the tunnel are some distance from Bay Street and there is usually little traffic on the roads within Upper Fort Mason. Fort Mason Center is also reasonably quiet, with existing noise levels of around 60 dB Ldn at the south end of Landmark Buildings B and C. The main noise source in this area is traffic moving into and out of the parking lot. Noise levels are somewhat higher due to traffic in the vicinity of Laguna and North Point Streets where the existing levels are typically greater than 65 dB Ldn near the streets, but generally 2 to 3 dB lower when away from Laguna Street and in the park area. Table A-3 provides a summary of the results obtained from the short-term noise measurements taken on Friday, November 17, 2006, and Wednesday, February 27, 2008. Table A-3 Summary of Statistical Noise Levels Recorded during Short-Term Attended
Measurements on 11/17/06 (S-1 through S-6) and 2/27/08 (S-12 through S-16)
Loc. Time Measured Noise Levels (dBA) Main Noise L max L 1 L 10 L 50 L 90 L min L eq Sources Noted
S-1
11:12 a.m. to 11:27 a.m.
91 69 58 51 48 44 65 Distant traffic, aircraft, birds, vehicle movements in parking lot, hammering.
S-2
10:35 a.m. to 10:50 a.m.
70 57 50 45 42 40 49 Birds, distant traffic, aircraft, one local vehicle movement.
S-3
12:40 p.m. to 12:55 p.m.
83 76 67 59 53 50 65 People walking past, street traffic, aircraft.
S-4
3:21 p.m. to 3:36 p.m.
85 78 69 62 56 52 67 Street traffic, people walking past.
S-5
1:30 p.m. to 1:45 p.m.
88 79 69 61 56 53 68 Street traffic, people walking past, streetcars.
S-6
2:42 p.m. to 2:57 p.m.
87 80 69 61 59 52 68 Street traffic, people walking past, streetcars.
S-12 4:57 p.m. to 5:12 p.m.
75 71 67 63 58 49 64 Street traffic, birds
S-13 3:15 p.m. to 3:30 p.m.
67 62 53 46 44 42 51 Light street traffic, people walking past, light airplane, birds
S-14 3:58 p.m. to 4:13 p.m.
71 66 58 53 50 48 56 Street traffic, ocean wave sounds, people walking past, light airplane, cable car bell, sea gulls, bag pipes
S-15 5:38 p.m. to 5:53 p.m.
83 78 72 67 62 51 69 Street traffic, people walking past
Note: Results rounded to nearest whole decibel.

7WILSON, IHRIG & ASSOCIATES, INC. A-7 SF Muni Historic Streetcar Extension Noise from the intermittent streetcar operations along Beach, Jefferson, and Jones Streets does not significantly affect the existing Day-Night Average Sound Levels, which are dominated by the semi-continuous street traffic noise. However, the normal operational (wheel/rail) streetcar noise and the warning bells that are rung along Jefferson Street through the Fisherman's Wharf area are generally quite noticeable, although they do not appear to be overly intrusive. Depending on the speed, the maximum passby noise levels from the streetcar operations can be comparable with the maximum passby noise levels from street traffic. For example, at the short-term monitoring location at Beach and Taylor the maximum streetcar pass-by noise levels were between 82 and 91 dBA at 25 ft. from the track centerline, with the streetcars running at approximately 20-25 mph. However at Jones and Beach, where the speeds are very low, the noise levels were 66-70 dBA (in the absence of wheel squeal). Most of the vintage streetcars that were observed negotiating the tight (approximately 65 ft. radius) curve at Jones and Beach produced very little, if any, wheel squeal. However, one of the streetcars (#496, a vintage tram acquired from Melbourne, Australia) generated very high, subjectively unpleasant noise levels of greater than 100 dBA, at the monitoring location at the SE corner of Jones and Beach, due to wheel squeal. The significant difference in noise levels on curved track are due to the vibration damping incorporated in the wheel construction of most of the vehicles. Streetcar #496 appears to have very lightly damped wheels. Figure A-30 is a plot of the one-third-octave passby noise levels due to streetcar operations recorded during the short-term measurements at Jones and Beach (Location S-5) and at Taylor and Beach (Location S-6). The overall A-weighted (dBA) noise levels are shown on the right-hand axis of the graph. The significant differences between the pass-by noise levels at the two locations are apparent. The three streetcar pass-bys recorded at Jones and Beach (#1007 at 1:30 p.m., #1055 at 1:38 p.m., and #1056 at 1:44 p.m.) were not observed to exhibit any noticeable wheel squeal. A full documentation of the noise levels from the historic streetcar fleet will be incorporated as part of the project's impact characterization. Vibration Table A-4 provides a summary of the results obtained from the short-term ground vibration measurements taken on Friday, November 17, 2006. Table A-4 Summary of Statistical Ground Vibration Velocity Levels Recorded during
Short-Term Attended Measurements on 11/17/06
Loc. Time Measured Ground Vibration Levels (VdB) Main Vibration L max L 1 L 10 L 50 L 90 L min L eq Sources Noted
S-1
11:12 a.m. to 11:27 a.m.
58 52 47 41 36 29 43 Vehicle movements in parking lot.
S-2
10:35 a.m. to 10:50 a.m.
45 37 26 22 18 12 25 One local vehicle movement.

8WILSON, IHRIG & ASSOCIATES, INC. A-8 SF Muni Historic Streetcar Extension
Loc. Time Measured Ground Vibration Levels (VdB) Main Vibration L max L 1 L 10 L 50 L 90 L min L eq Sources Noted
S-3
12:40 p.m. to 12:55 p.m.
68 62 51 42 39 32 49 Street traffic, people walking past.
S-4
3:21 p.m. to 3:36 p.m.
71 64 55 45 38 32 52 Street traffic, people walking past.
S-5
1:30 p.m. to 1:45 p.m.
75 67 54 48 43 38 54 Streetcars, street traffic, people walking past.
S-6
2:42 p.m. to 2:57 p.m.
81 67 54 47 41 36 58 Street traffic, people walking past, streetcars.
Note: Results rounded to nearest whole decibel. The highest ground vibration levels were obtained at locations adjacent to the existing streetcar tracks. For example, the maximum vibration level recorded at the monitoring location at the SE corner of Jones and Beach was 75 VdB, due to a streetcar negotiating the curved track at this intersection. The maximum vibration level recorded at Beach and Taylor, where the streetcars were traveling at 20-25 mph, was 81 dB at 25 ft. from the track centerline. The ground vibration was, subjectively, noticeable at both locations. At S-3 and S-4, the two other monitoring locations along the heavily trafficked streets in the study area where there are no streetcar operations, the ground vibration levels were typically less than 70 VdB, and the vibration was not, subjectively, noticeable. Thus, the results indicate that the streetcars can produce significantly higher ground vibration than other street traffic. The ground vibration levels at the monitoring locations in Upper Fort Mason and in the Fort Mason Center were relatively low. The maximum vibration level recorded during the 15-minute sample at the south end of Landmark Building A in the Fort Mason Center was 58 VdB. The maximum vibration level recorded during the 15-minute sample on the sidewalk in front of Buildings 232 and 234 in Upper Fort Mason was 45 VdB. These levels are well below the threshold of human perception. Figure A-31 is a plot of the one-third-octave ground vibration velocity levels due to streetcar operations recorded during the short-term measurements at Jones and Beach (Location S-5) and at Taylor and Beach (Location S-6). The overall Linear (dB) vibration levels are shown on the left-hand axis of the graph. As with the pass-by noise levels, the significant differences between the passby vibration levels at the two locations are apparent. As with noise, a full documentation of ground vibration from historic streetcar operations will be incorporated as part of the project's impact characterization.

9WILSON, IHRIG & ASSOCIATES, INC. A-9 SF Muni Historic Streetcar Extension
FIGURE A-1 TYPICAL A-WEIGHTED (DBA) SOUND OR NOISE LEVELS
FROM DIFFERENT SOURCES (FROM FTA GUIDANCE MANUAL)

10WILSON, IHRIG & ASSOCIATES, INC. A-10 SF Muni Historic Streetcar Extension
FIGURE A-2 TYPICAL LEVELS OF GROUND VIBRATION FROM DIFFERENT
SOURCES (FROM FTA GUIDANCE MANUAL)

11WILSON, IHRIG & ASSOCIATES, INC. A-11 SF Muni Historic Streetcar Extension
FIGURE A-3 SHORT-TERM AND LONG-TERM MONITORING LOCATIONS ON WESTERN SIDE OF STUDY AREA
L-11
L-12
S-15
L-13

12WILSON, IHRIG & ASSOCIATES, INC. A-12 SF Muni Historic Streetcar Extension
FIGURE A-4 SHORT-TERM AND LONG-TERM MONITORING LOCATIONS ON EASTERN SIDE OF STUDY AREA
L-14

13WILSON, IHRIG & ASSOCIATES, INC. A-13 SF Muni Historic Streetcar Extension
FIGURE A-5 LONG-TERM NOISE MONITORING LOCATION L-1 (FORT MASON
CENTER)
FIGURE A-6 LONG-TERM NOISE MONITORING LOCATION L-2 (BEACH
STREET, WEST OF MARITIME MUSEUM/HISTORIC BEACHHOUSE)

14WILSON, IHRIG & ASSOCIATES, INC. A-14 SF Muni Historic Streetcar Extension
FIGURE A-7 LONG-TERM NOISE MONITORING LOCATION L-3 (BEACH
STREET, BETWEEN POLK AND HYDE)
FIGURE A-8 LONG-TERM NOISE MONITORING LOCATION L-4
(LEAVENWORTH STREET, BETWEEN BEACH AND JEFFERSON)

15WILSON, IHRIG & ASSOCIATES, INC. A-15 SF Muni Historic Streetcar Extension
FIGURE A-9 LONG-TERM NOISE MONITORING LOCATION L-5 (BEACH
STREET, BETWEEN LEAVENWORTH AND JONES)
FIGURE A-10 LONG-TERM AND SHORT-TERM NOISE MEASUREMENT LOCATION L-12 (LAGUNA & NORTH POINT NEAR LAGUNA)
Noise Logger

16WILSON, IHRIG & ASSOCIATES, INC. A-16 SF Muni Historic Streetcar Extension
FIGURE A-11 LONG-TERM AND SHORT-TERM NOISE MEASUREMENT LOCATION L-13 (NEAR EAST PORTAL OF TUNNEL)
FIGURE A-12 LONG-TERM AND SHORT-TERM NOISE MEASUREMENT LOCATION L-14 (EAST OF MARITIME MUSEUM/BATHHOUSE)
Noise Logger
Noise Logger

17WILSON, IHRIG & ASSOCIATES, INC. A-17 SF Muni Historic Streetcar Extension
FIGURE A-13 SHORT-TERM NOISE AND VIBRATION MONITORING LOCATION
S-1 (FORT MASON CENTER)
FIGURE A-14 SHORT-TERM NOISE AND VIBRATION MONITORING
LOCATION S-2 (UPPER FORT MASON)

18WILSON, IHRIG & ASSOCIATES, INC. A-18 SF Muni Historic Streetcar Extension
FIGURE A-15 SHORT-TERM NOISE AND VIBRATION MONITORING
LOCATION S-3 (SW CORNER LARKIN AND BEACH)
FIGURE A-16 SHORT-TERM NOISE AND VIBRATION MONITORING
LOCATION S-4 (SOUTH SIDE BEACH STREET, BETWEEN BEACH AND HYDE)

19WILSON, IHRIG & ASSOCIATES, INC. A-19 SF Muni Historic Streetcar Extension
FIGURE A-17 SHORT-TERM NOISE AND VIBRATION MONITORING
LOCATION S-5 (SE CORNER OF JONES AND BEACH)
FIGURE A-18 SHORT-TERM NOISE AND VIBRATION MONITORING LOCATION S-6 (TAYLOR AND BEACH)
20WILSON, IHRIG & ASSOCIATES, INC. A-20 SF Muni Historic Streetcar Extension
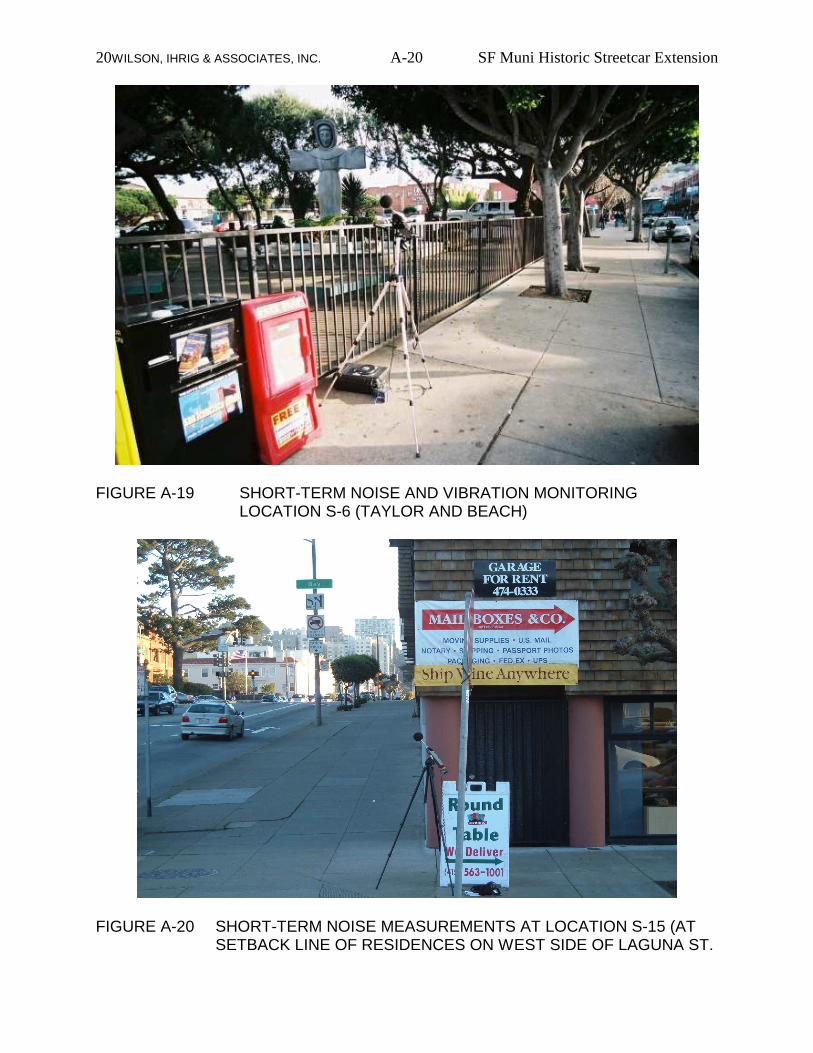
FIGURE A-19 SHORT-TERM NOISE AND VIBRATION MONITORING
LOCATION S-6 (TAYLOR AND BEACH)
FIGURE A-20 SHORT-TERM NOISE MEASUREMENTS AT LOCATION S-15 (AT SETBACK LINE OF RESIDENCES ON WEST SIDE OF LAGUNA ST.

21WILSON, IHRIG & ASSOCIATES, INC. A-21 SF Muni Historic Streetcar Extension
100
90
80
70
60
50
40
303 6 9 noon 3 6 9 12
Mon, 20 Nov
SO
UN
D L
EV
EL
-- d
BA
Ldn = 58 L1 Leq(24) = 54 L10 CNEL = 59 Leq
L50 L90
FIGURE A-21 STATISTICAL NOISE LEVELS RECORDED AT LONG-TERM
MONITORING LOCATION L-1 (FORT MASON CENTER) ON MONDAY 11/20/06

22WILSON, IHRIG & ASSOCIATES, INC. A-22 SF Muni Historic Streetcar Extension
100
90
80
70
60
50
40
303 6 9 noon 3 6 9 12
Mon, 20 Nov
SO
UN
D L
EV
EL
-- d
BA
Ldn = 64 L1 Leq(24) = 58 L10 CNEL = 64 Leq
L50 L90
FIGURE A-22 STATISTICAL NOISE LEVELS RECORDED AT LONG-TERM
MONITORING LOCATION L-2 (BEACH STREET, WEST OF SAN FRANCISCO MARITIME MUSEUM) ON MONDAY 11/20/06
23WILSON, IHRIG & ASSOCIATES, INC. A-23 SF Muni Historic Streetcar Extension
100
90
80
70
60
50
40
303 6 9 noon 3 6 9 12
Mon, 20 Nov
SO
UN
D L
EV
EL
-- d
BA
Ldn = 72 L1 Leq(24) = 68 L10 CNEL = 72 Leq
L50 L90
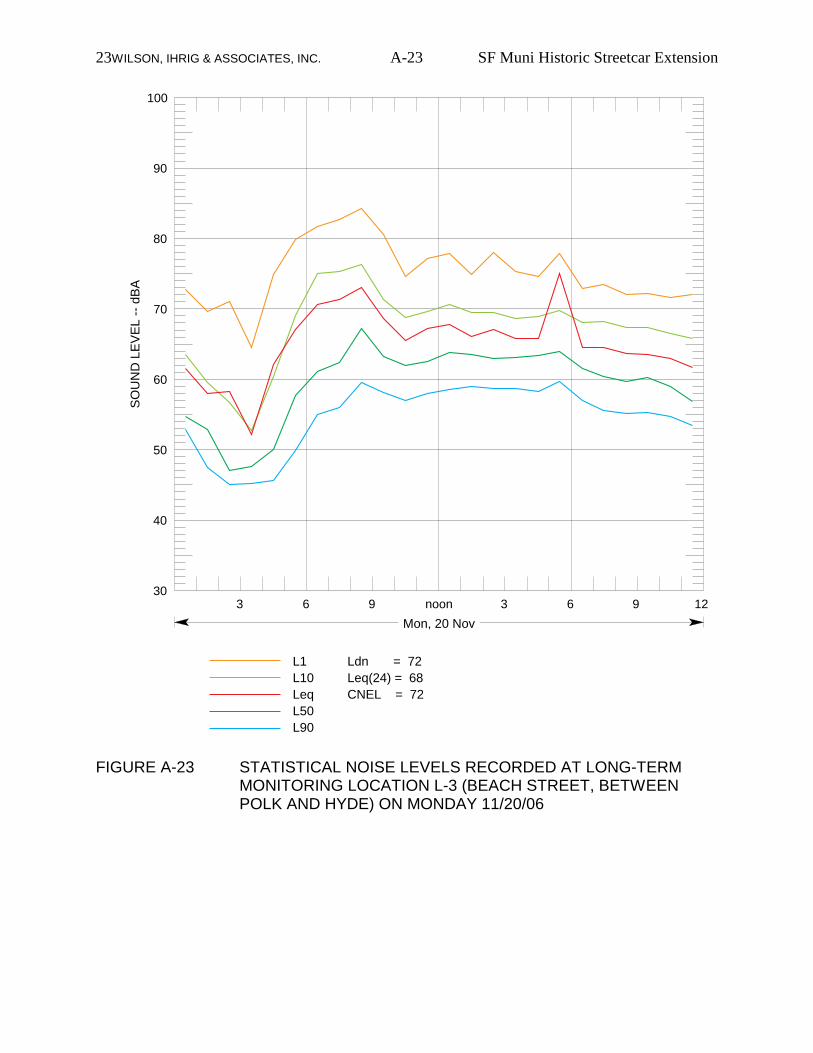
FIGURE A-23 STATISTICAL NOISE LEVELS RECORDED AT LONG-TERM
MONITORING LOCATION L-3 (BEACH STREET, BETWEEN POLK AND HYDE) ON MONDAY 11/20/06

24WILSON, IHRIG & ASSOCIATES, INC. A-24 SF Muni Historic Streetcar Extension
100
90
80
70
60
50
40
303 6 9 noon 3 6 9 12
Mon, 20 Nov
SO
UN
D L
EV
EL
-- d
BA
Ldn = 70 L1 Leq(24) = 65 L10 CNEL = 71 Leq
L50 L90
FIGURE A-24 STATISTICAL NOISE LEVELS RECORDED AT LONG-TERM
MONITORING LOCATION L-4 (LEAVENWORTH STREET, BETWEEN BEACH AND JEFFERSON) ON MONDAY 11/20/06

25WILSON, IHRIG & ASSOCIATES, INC. A-25 SF Muni Historic Streetcar Extension
100
90
80
70
60
50
40
303 6 9 noon 3 6 9 12
Mon, 20 Nov
SO
UN
D L
EV
EL
-- d
BA
Ldn = 71 L1 Leq(24) = 67 L10 CNEL = 72 Leq
L50 L90
FIGURE A-25 STATISTICAL NOISE LEVELS RECORDED AT LONG-TERM
MONITORING LOCATION L-4 (BEACH STREET, BETWEEN LEAVENWORTH AND JONES) ON MONDAY 11/20/06

26WILSON, IHRIG & ASSOCIATES, INC. A-26 SF Muni Historic Streetcar Extension
100
90
80
70
60
50
40
303 6 9 noon 3 6 9 12
Thu, 28 Feb
SO
UN
D L
EV
EL
-- d
BA
Ldn = 64 L1 Leq(24) = 60 L10 CNEL = 65 Leq
L50 L90
FIGURE A-26 STATISTICAL NOISE LEVELS RECORDED AT LONG-TERM
MONITORING LOCATION L-11 (LAGUNA AND NORTH POINT STREETS IN PARK AREA) ON THURSDAY 2/28/08

27WILSON, IHRIG & ASSOCIATES, INC. A-27 SF Muni Historic Streetcar Extension
100
90
80
70
60
50
40
303 6 9 noon 3 6 9 12
Thu, 28 Feb
SO
UN
D L
EV
EL
-- d
BA
Ldn = 67 L1 Leq(24) = 63 L10 CNEL = 67 Leq
L50 L90
FIGURE A-27 STATISTICAL NOISE LEVELS RECORDED AT LONG-TERM
MONITORING LOCATION L-12 (LAGUNA AND NORTH POINT STREETS IN PARK AREA – CLOSER TO STREET) ON THURSDAY 2/28/08

28WILSON, IHRIG & ASSOCIATES, INC. A-28 SF Muni Historic Streetcar Extension
100
90
80
70
60
50
40
303 6 9 noon 3 6 9 12
Thu, 28 Feb
SO
UN
D L
EV
EL
-- d
BA
Ldn = 57 L1 Leq(24) = 53 L10 CNEL = 57 Leq
L50 L90
FIGURE A-28 STATISTICAL NOISE LEVELS RECORDED AT LONG-TERM
MONITORING LOCATION L-13 (ADJACENT TO EAST PORTAL OF ABANDONED RAILROAD TUNNEL) ON THURSDAY 2/28/08

29WILSON, IHRIG & ASSOCIATES, INC. A-29 SF Muni Historic Streetcar Extension
100
90
80
70
60
50
40
303 6 9 noon 3 6 9 12
Thu, 28 Feb
SO
UN
D L
EV
EL
-- d
BA
Ldn = 62 L1 Leq(24) = 58 L10 CNEL = 63 Leq
L50 L90
FIGURE A-29 STATISTICAL NOISE LEVELS RECORDED AT LONG-TERM
MONITORING LOCATION L-14 (EAST OF MARITIME MUSEUM/BATHHOUSE) ON THURSDAY 2/28/08

30WILSON, IHRIG & ASSOCIATES, INC. A-30 SF Muni Historic Streetcar Extension
31.5 63 125 250 500 1K 2K 4K 8KOCTAVE BAND CENTER FREQUENCY -- Hz
100
90
80
70
60
50
40
30
OV
ER
ALL
A-W
EIG
HT
1/3
OC
TA
VE
BA
ND
SO
UN
D P
RE
SS
UR
E L
EV
EL
-- d
B r
e 20
µPa
ST CAR 1:30 JONES & BEACH (S-5)ST CAR 1:38 JONES & BEACH (S-5)ST CAR 1:44 JONES & BEACH (S-5)ST CAR 2:33 BEACH & TAYLOR (S-6)ST CAR 2:39 BEACH & TAYLOR (S-6)ST CAR 2:49 BEACH & TAYLOR (S-6)ST CAR 2:56 BEACH & TAYLOR (S-6)
FIGURE A-30 ONE-THIRD-OCTAVE NOISE LEVELS FROM STREETCAR
PASS-BYS AT MONITORING LOCATIONS S-5 AND S-6, RECORDED ON 11/17/06

31WILSON, IHRIG & ASSOCIATES, INC. A-31 SF Muni Historic Streetcar Extension
4 8 16 31.5 63 125 250 500 1KOCTAVE BAND CENTER FREQUENCY -- Hz
90
80
70
60
50
40
30
20
OV
ER
ALL
1/3
OC
TA
VE
BA
ND
RM
S V
ELO
C. L
EV
EL
-- d
B r
e 10
-6in
./sec
ST CAR 1:30 JONES & BEACH (S-5)ST CAR 1:38 JONES & BEACH (S-5)ST CAR 1:44 JONES & BEACH (S-5)ST CAR 2:49 BEACH & TAYLOR (S-6)ST CAR 2:56 BEACH & TAYLOR (S-6)
FIGURE A-31 ONE-THIRD-OCTAVE GROUND VIBRATION VELOCITY LEVELS
FROM STREETCAR PASS-BYS AT MONITORING LOCATIONS S-5 AND S-6, RECORDED ON 11/17/06

WILSON, IHRIG & ASSOCIATES, INC. B-1 SF Muni Historic Streetcar Extension APPENDIX B
GLOSSARY AND SIGNIFICANCE OF ACOUSTICAL TERMS\

WILSON, IHRIG & ASSOCIATES, INC. B-2 SF Muni Historic Streetcar Extension
GLOSSARY AND SIGNIFICANCE OF ACOUSTICAL TERMS 1. Glossary of Terms A-Weighted Sound Level (dBA):
The sound pressure level in decibels as measured on a sound level meter using the internationally standardized A-weighting filter or as computed from sound spectral data to which A-weighting adjustments have been made. A-weighting de-emphasizes the low and very high frequency components of the sound in a manner similar to the response of the average human ear. A-weighted sound levels correlate well with subjective reactions of people to noise and are universally used for community noise evaluations.
Accelerometer:
A vibration sensitive transducer that responds to the vibration acceleration of a surface to which it is attached. The electronic signal generated by an accelerometer is directly proportional to the surface acceleration.
Acceleration Level:
Also referred to as "vibration acceleration level". Vibration acceleration is the rate of change of speed and direction of a vibration. An accelerometer generates an electronic signal that is proportional to the vibration acceleration of the surface to which it is attached. The acceleration level is 20 times the logarithm to the base 10 of the ratio of the RMS value of the acceleration to a reference acceleration. The generally accepted reference vibration acceleration is 10-6 g (10-5 m/sec).
Ambient Noise:
The prevailing general noise existing at a location or in a space, which usually consists of a composite of sounds from many sources near and far.
Background Noise:
The general composite non-recognizable noise from all distant sources, not including nearby sources or the source of interest. Generally background noise consists of a large number of distant noise sources and can be characterized by L90 or L99.
Community Noise Equivalent Level (CNEL The Leq of the A-weighted noise level over a 24-hour period with a 5 dB penalty applied to noise levels between 7 p.m. and 10 p.m. and a 10 dB penalty applied to noise levels between 10 p.m. and 7 a.m.

WILSON, IHRIG & ASSOCIATES, INC. B-3 SF Muni Historic Streetcar Extension C-Weighted Sound Level (dBC):
The sound pressure level in decibels as measured on a sound level meter using the internationally standardized C-weighting filter or as computed from sound spectral data to which C-weighting adjustments have been made. C-weighting has fairly uniform response from 50 to 5,000 Hz. C-weighted sound levels when compared to A-weighted sound levels can be used to provide an estimate of the spectral characteristics of a sound. If the difference between C-weighted and A-weighted sound levels are several decibels or more, the noise is predominantly low-frequency.
Day-Night Sound Level (Ldn):
The Leq of the A-weighted noise level over a 24-hour period with a 10 dB penalty applied to noise levels between 10 p.m. and 7 a.m.
Decibel (dB):
The decibel is a measure on a logarithmic scale of the magnitude of a particular quantity (such as sound pressure, sound power, sound intensity) with respect to a standardized quantity.
Energy Equivalent Level (Leq):
The level of a steady noise which would have the same energy as the fluctuating noise level integrated over the time period of interest. Leq is widely used as a single-number descriptor of environmental noise. Leq is based on the logarithmic or energy summation and it places more emphasis on high noise level periods than does L50 or a straight arithmetic average of noise level over time. This energy average is not the same as the average of sound pressure levels over the period of interest, but must be computed by a procedure involving summation or mathematical integration.
Frequency (Hz):
The number of oscillations per second of a periodic noise (or vibration) expressed in Hertz (abbreviated Hz). Frequency in Hertz is the same as cycles per second.
L 1, L10, L50, L90 and L99:
The noise (or vibration) levels that are exceeded 1%, 10%, 50%, 90% and 99% of a specified time period, respectively. Environmental noise and vibration data are often described in these terms. See section 2 for a more detailed discussion of the statistical distribution terms.

WILSON, IHRIG & ASSOCIATES, INC. B-4 SF Muni Historic Streetcar Extension Noise Criterion Curves (NC Curves):
A series of curves which specify the maximum sound pressure level in each octave band between 63 Hz and 8,000 Hz used to characterize the noisiness of steady sounds in an occupied indoor space.
Noise Exposure Level (NEL):
Noise Exposure Level (NEL), also referred to as Sound Exposure Level (SEL), is a time integrated metric which quantifies the total energy in A-weighted noise (sound) level measured during a particular event referenced to a duration of 1 second.
Noise Reduction (NR):
Noise reduction, also referred to as noise level reduction (NLR) is the overall difference between the exterior and interior sound levels of a building space, taking into account the sound transmission loss of all structural elements (walls, roofs, doors, windows, etc.) and the interior sound absorptive characteristics of the space.
Noise Reduction Coefficient (NRC):
Noise reduction coefficient is a measure of the acoustical absorption performance of a material, calculated by averaging its sound absorption coefficients at 250 Hz, 500 Hz, 1000 Hz and 2000 Hz.
Octave Band - 1/3 Octave Band:
One octave is an interval between two sound frequencies that have a ratio of two. For example, the frequency range of 200 Hz to 400 Hz is one octave, as is the frequency range of 2000 Hz to 4000 Hz. An octave band is a frequency range that is one octave wide. A standard series of octaves is used in acoustics, and they are specified by their center frequencies. In acoustics, to increase resolution, the frequency content of a sound or vibration is often analyzed in terms of 1/3 octave bands, where each octave is divided into three 1/3 octave bands.
Reverberant Field:
The region in a room where the reflected sound dominates, as opposed to the region close to the noise source, where the direct sound dominates.
Reverberation:
The continuation of sound reflections within an enclosed space after the sound source has stopped.

WILSON, IHRIG & ASSOCIATES, INC. B-5 SF Muni Historic Streetcar Extension Reverberation Time (RT):
The time taken for the sound pressure level in a room to decrease to one-millionth (60 dB) of its steady-state value after the source of sound energy is suddenly interrupted. It is a measure of the persistence of a sound in a room and of the amount of acoustical absorption present inside the room.
Sound Absorption Coefficient (α ):
The absorption coefficient of a material is the ratio of the sound absorbed by the material to that absorbed by an equivalent area of open window. The absorption coefficient of a perfectly absorbing surface would be 1.0 while that for concrete or marble slate is approximately 0.01 (a perfect reflector would have an absorption of 0.00).
Sound Exposure Level (SEL):
See definition of Noise Exposure Level Sound Pressure Level (SPL):
The sound pressure level of sound in decibels is 20 times the logarithm to the base of 10 of the ratio of the RMS (root-mean square) value of the sound pressure to the RMS value of a reference sound pressure. The standard reference sound pressure is 20 micro-pascals as indicated in ANSI S1.8-1969, "Preferred Reference Quantities for Acoustical Levels".
Sound Transmission Class (STC):
STC is a single number rating, specified by the American Society for Testing and Materials (ASTM), which is used for comparing the sound transmission characteristics (in decibels) of building elements. It is widely used for rating sound insulation characteristics of building materials and products for sources such as speech, radio, television and similar sounds within buildings.
Velocity Level:
Also referred to as the "vibration velocity level". Vibration velocity is the rate of change of displacement of a vibration. The velocity level is 20 times the logarithm to the base 10 of the ratio of the RMS value of the velocity to the reference velocity. In this report the reported vibration velocity levels are all referenced to 10-6 in/sec. Above approximately 10 Hz, human response to vibration is more closely correlated to the velocity level than the acceleration level.
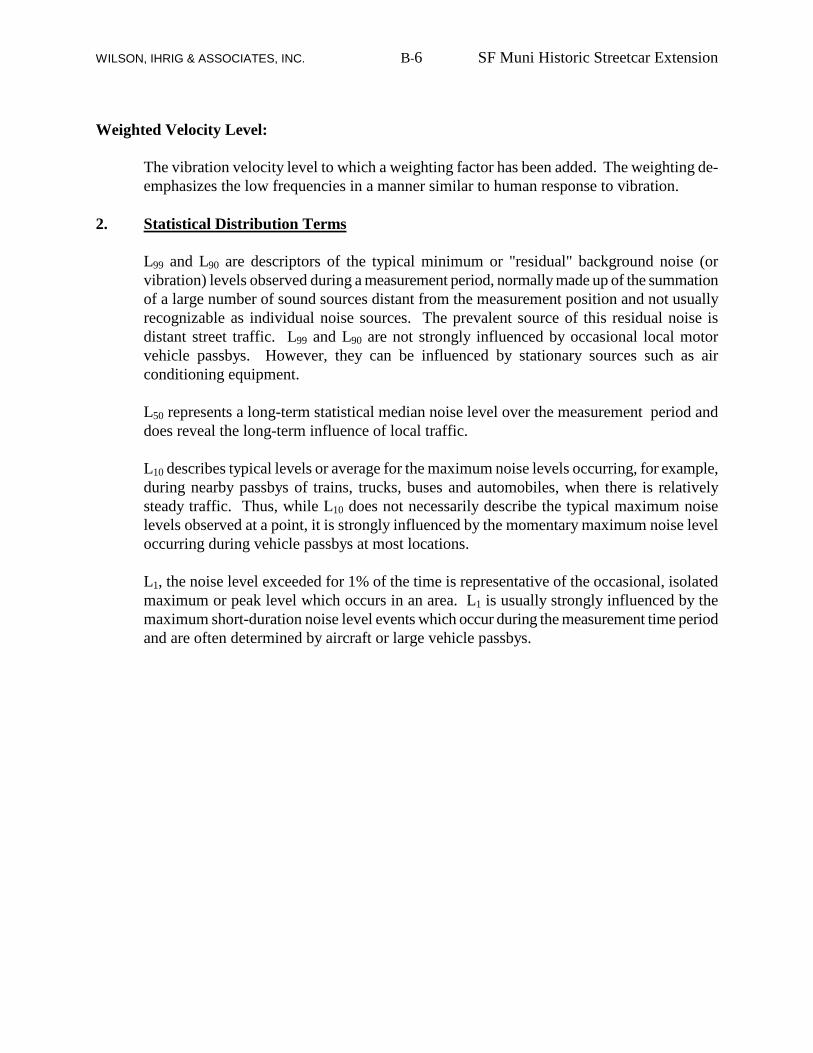
WILSON, IHRIG & ASSOCIATES, INC. B-6 SF Muni Historic Streetcar Extension Weighted Velocity Level:
The vibration velocity level to which a weighting factor has been added. The weighting de-emphasizes the low frequencies in a manner similar to human response to vibration.
2. Statistical Distribution Terms
L99 and L90 are descriptors of the typical minimum or "residual" background noise (or vibration) levels observed during a measurement period, normally made up of the summation of a large number of sound sources distant from the measurement position and not usually recognizable as individual noise sources. The prevalent source of this residual noise is distant street traffic. L99 and L90 are not strongly influenced by occasional local motor vehicle passbys. However, they can be influenced by stationary sources such as air conditioning equipment.
L50 represents a long-term statistical median noise level over the measurement period and does reveal the long-term influence of local traffic.
L10 describes typical levels or average for the maximum noise levels occurring, for example, during nearby passbys of trains, trucks, buses and automobiles, when there is relatively steady traffic. Thus, while L10 does not necessarily describe the typical maximum noise levels observed at a point, it is strongly influenced by the momentary maximum noise level occurring during vehicle passbys at most locations.
L1, the noise level exceeded for 1% of the time is representative of the occasional, isolated maximum or peak level which occurs in an area. L1 is usually strongly influenced by the maximum short-duration noise level events which occur during the measurement time period and are often determined by aircraft or large vehicle passbys.