noise and skid measurements on us285 in the turkey creek ... · noise and skid measurements on...
TRANSCRIPT

Report No. CDOT - RI-R-2001-9
Noise and Skid Measurements on US285 in the Turkey Creek Canyon Area Project NH 2854-068
Robert LaForce
Jill Schlaefer
June ~OO l

The contents of this report retlect the views of !he authors who are responsible for the facls
and accuracy of !he data presented herein . The contents do not necessarily reflect !he official
view of the Colorado Department of Transportation or the Federal Highways Administration.
This report does not constitute a standard, specification or regulation .

Acknowledgments:
The authors would like to acknowledge the following for their help in completing this study.
Skip Outcalt from COOT Research and Mick Barnhardt from David L. Adams Associates, Inc . for their work in taking the noise measurements with short notice and rapid turnaround time and again, Skip for the skid measurements.
Dennis Largent , COOT Project Engineer for locating the test sections and scheduling and managing construc tion of the test site very soon after contract award.
ii

Technical Report Documentation Page
L Report No. 2. Government Accession No. 3. Recipient's Catalog No.
CDOT - R1 - R - 2001-9
4. Title and Subtitle 5. Report Date
Noise and Skid Measurements on US285 June 2001 in the Turkey Creek Canyon Area Project NH 2854-068 6. Performing Organization Code
7. Author(s) 8. Performing Organization Report No, I Jill Schlaefer Robert LaForce CDOT - Rl - R - 2001-9
9. Performing Organization Name and Address 10, Work Unit No. (TRAlS)
Colorado Department of Transportation, Region One 18500 E. Colfax Ave. 11. Contract or Grant No. Aurora, Colorado 8001 J
12. Sponsoring Agency Name and Address 13. Type of Report and Period Covered
Colorado Department of Transportation 420 I E. Arkansas Ave. Denver, Colorado 80222 14. Sponsoring Agency Code
15, Supplementary Notes
16. Abstract
This repon documents the noise measurements taken using a single vehicle on four different pavement surface lextures. The pavements were located on US285 southwest of Denver, Colorado.
Noise measurements were taken inside the vehicle, 25 feet from the center of the closest driving lane, and near the right rear tire. Skid testing was performed at 40 mph in conformance with the ASTM procedure E 274 for a ribbed tire.
The surface types included longitudinal tined concrete, transverse tined concrete, ground concrete, and an asphalt surface (3/8 inch nominal Stone Mastic Asphalt).
17. Key Words 118. Distdbulion Statement skid number, noise properties, surface texture, frictional No restrictions. This document is available to the public characteristics, tining through:
National Technical Information Service. 5825 Port Royal Road Springfield, Virginia 22161
I J9. Security CJ:ls.sif. (of this rt>porl) 20. Security ClassiC (of this page) 21. No. of Pages 22. Price
Unclassified Unclassified 23 I -- ---
iii

Noise and Skid Measurements on US285 in the Turkey Creek Canyon Area Project NH 2854-068
Executive Summary
Under Project NH 2854-068, Region] planned to construct several test sections of roadway to evaluate possible treatments to address noise problems on Phase I and 1I of US285 between mileposts 243.4 and 246.2. The tire noise from the transverse tining causes an objectionable whine, which has resulted in complaints from area residents.
The US285 location also offers the opportunity to measure noise and skid resistance from several pavement surface types in relatively close proximity. The project induded an asphalt surface (SMA) in Turkey Creek Canyon immediately north of Phase I and longitudinally tined concrete immediately south of Phase 11. The three pavement surface types are within four miles on the same highway.
Only one concrete treatment test section was constructed this fall. The concrete pavement surface was ground V4 inch to remove the transverse tining.
Noise and skid measurements were taken both before and after construction on the test section as well as on the various pavement surface types available near the project area. Noise measurements were taken in exactly the same manner, using the same vehicle, as measurements taken on 1-70 near Deer Trail in 1994. (See Report CDOT-DTD-95-2.) A-weighted sound level measurements and 1/3 octave band sound pressure level measurements between 25 and 10,000 Hz were taken inside the vehicle, inside the rear tire well, and at the roadside 25 feet from the center of the travel lane.
Following is a summary of sound level (dBA) measilled 25 feet from the center of the travel lane and skid numbers for the various surface types:
Longitudinal Tined Concrete Asphalt Surface (3/8 inch SMA)
Transverse Tined Concrete 114 inch Ground Test Section
Reduction in Noise Level (dBA) from Original Tining
Noise Levels (dEAl
75 74
82 76
6
Conclusions drawn from this study are listed below:
Skid Number 40 mph (SN40Rl
43.3 51.5
43.5 47.6
NA
• On the tnlOsverse tined concrete test seC1ion the II! inch grinding resulted in a reduction in the noise level of 6 decibels near the road. Although a noise level reduction of 6 dBA was achieved by this change in surface texture, this does not constilute i.l Tloi.'e Jb~\lemen( under federal regubtions_

• The majority of the annoying frequency components from tire/pavement noise lie between 700 and 2000 Hzl. The average reduction in sound pressure level between 800-2500 Hz inclusive was 7 decibels for this test section.
• The current standard surface finish for concrete pavement (longitudinal tining) resulted in comparable noise level valuesto'the ground surface and the 3/8 inch SMA asphalt surfacing. The skid number for the asphalt is considerably higher than the concrete surfaces, but the concrete skid number is adequate. Many states take action when the skid number (SN40R) is below 30 to 35-'
• The reduction in noise level after grinding away the transverse tining is very similar 10 those reported in a recent Wisconsin report, "Noise and Texture on PCC Pavements" Report No. WIISPR-08-99. The noise levels for the other surface treatments are also similar to those reported in the above-mentioned report.
2

Table of Contents
Executive Summary .
Introduction .
Methodology ..
Analysis ... .
Conclusions ..
References ..
List of Tables Table I. Height of microphone relative to road ...
Table 2 . Resu lts of sou nd measurements taken inside vehicle
Table 3 . Results of sound measurements at tire well of vehic le ... .... . .
Table 4 . Results of sound measurements taken a t the roadside ..
Table 5. Before and after sound measurements for ground section of highway.
Table 6. Skid resistance comparison of pavement surface types.
List of Figures Figure I. Location map of study area ..
Figure 2 . Oblique photograph of transverse tining test sections US285
Figure 3. View of test sections I through 3 at MP 24442 through 244.53 along US285
Figure 4 . Detailed view of transverse tining textures before and after grinding
Figure 5 . Microphone mount at tire location . .. .. .. .
List of Graphs Graph I. Base-line sound measurements taken inside vehicle.
Graph 2. Base-line sound measurements at tire well of vehicle.
Graph 3. Base-line sound measurements taken at the roadside ........ . ...... .
Graph 4. Base-line measurements other vehicles at tlle roadside.
Graph 5. Comparison of sound measurements taken inside vehicle
Graph 6. Comparison of sound measurements at tire well of vehicle
Graph 7. Comparison of sound measurements taken at the roadside.
.. .1
. .. 4
..5
..7
. .... 11
. ... 20
.... . 6
. .. .. . 9
. .. .... 9
.. . 9
. .. 10
.. 11
. .. .4
.5
...... ... .... . . 7
.. .... 7
. .. 8
.. 12
. ... 13
. .. 14
. ... .. 15
.. .... 16
.17
. .. 18
Graph 8. Comparison of all test sections at roadside to ground transverse tined section ... . ... 19
3

Introduction
A mUltiple phase State Highway 285 project was undertaken to realign and improve roadway safety and capacity in response to increased commuter and regional travel demand. As highway traffic and speed increased. local residents began experiencing noise problems on some newly constructed pavement segments. It was quickly recognized that the most objectionable roadway noise was generated where transverse tining pavement texture treatments had been utilized. This easi I y discernable noise is characterized as a high piTched "wh i ne" associated with lire and road surface interaction.
\ )
(, .
Figure I. Location map of study area showing Test Sites I through 5.
This site selecTive study was conducted in October 2000 under Project NH 2854-068. The STudy ilrea is showrl in Figure 1. The purpose of the project was to acoustical I y assess the impact of variou~ puving surfaces I n.~lde a vehicle. at the lire of a vehicle, ilnd at the roadside. Additionally. the skid l1umbers of both origi nal and reconstructed pavement surfaces were compared to evaJ U<lte safety i mpac ts due 10 noise reduction [cchniq ues. Region 1 plnnned 10 construct several test sections of roadway [0 evalu<lTC possible !re<llrnents to address noi~e problems on Ph;t,e J and II of US285. Only one concreTe treatment test section W<lS constructed Ihls fall. The concrele pJ\ement ,urface was ground I./, inch to remove the tr<lnSverse til1ll1g. (See Figure~ 2 through -l.l
The US2R:i IOCLIt ion al"0 oHers the opportllnl ty to measure noi~e Jnd ~k Id resi ~ran(e from ~ever,d pa \, el11enl surt~ice lype.; in re ILiti vdy ..:illS\! pn'.\i mity. The project incl udeu an asphLllt ~ut'['ace (St.1A) i 11 Turkey Creek CtnY(\!1 Illlllledi,tlely nl)rth of Phi.l~e L It)llgituuin,llly lined lOllcrete il\lm~diLitcly ~outh of Ph.L~e II. unJ rr..J Il,\'a~e Ii n.-d connete pa, ernent III Ph:l'e I. The three I)J \ .omen! ~urLH.:e t >'I)e~ <lrc \\ it hill tOUt· mi k~ 1111 I he .<IIIle: hi~h\\Jy.
4

Figure}, Oblique view looking east <:It Tes! Sections I through 3 along US285,
Methodology
Base-Line Measurements The study wos designed nnd implemented for COOT by Davis L. Adams Associates to accommodate noise and skid measurements from several road surface types. Three different road surface pavements and tex tures were Identified w Ithm a tour mile distance. Noise and skid measurementS were taken both before and <Jfter construct ion on the test sections as well as on the various pavement surface type~ available near the project area, NOise measurements were t<lken in exactly the same manner. using the S<lme vehicle. as measurements wken on [-70 near Deer Trail in 1994, (See Report CDOT-DTD-95-2.)
A-weighted sound level measurements and 1/3 octave band sound pressure level measurements between 2S and 10.000 Hz were taken inSide the vehic Ie, i n5ide the rear tire well, and at the roadside 25 feet from the center of the travel lane , Before-grinding nOise b<lse-line measurements were recorded on October 4, 2000. Noise me.3.sure me n S tor the ltfter-gn nding lest section were taken on Octobel' 3 I, 2000. The grout-filled test section hall not been cO II~truued at lhe ti me of thiS report.
A III Il<~:tSUn~m~I1(~ w~re laken "'lIh a Lar5en-Da\' is Model 2900 sound kveJ meter on "fast" response. together with a Bruei & KjJer Type -I J65 microphone . Cal lbrmion WdS checked before. during (ll1d il fter this ~enes of mca .~ \lrel ) l e nt s lI' ilh ;1 L.Hse n -D~l\'i ~ CA2511 PI'!!cision ACOll ~tic Calibrator. A wind~creen covered the micl'l\ph()nt (Jul'i n~ all outs ide me;)~ uremel1ts.
The \veJI"et' \l~J~ mild at 65 degl'ee~ FJhn:nheit \v Itil 110 IH.)tiC t"lhle bl ee·(e. A-welghred sound level lil e:l"llrC:lnCllt~ " <;: 1<: 1' c::c.: <,"J rueu d~ wdl .I~ I r:. ('(t<l\T [I'equellcy [1'.IIH.1, b~t\\·t'el\ 25 clod I O.ono H~
T he \'d 'II ~' k lI 'cJ ",l':1 I q ,) -! Oicl '-i \\( ;bL Ie C uti :t,~ S i<:1 ra ,1.111(\1\ \\ :lgn r1 1'1\\\ 1(.kJ by the Co lor8uo Dcp;ll"Il nelii or T r,lll"'pnrt :l! 1<'11. he Ollhmobi le ~!:I I i(\ 11 \\ :l,:nll ,, \ :1.<; rr,)\'e Ii Il!,' i II I he l' lg hi 1 :\lI~ <lr .1 "peei.J of 50 md c~ pel' hour. D u,: 10 Ill\! ,.:. Ii:;ht uph i II fi' ~IJ e. \)f Ihe I·"~IJ. i l ":1" i 11"I 1'),'lCt l( .I \ 10 idle: 1 ~ 1 ': cli ginc uur lng the tcSI.~ whil~' m~lllI ta l l\ i n g.
~I.'c cd . F , )j" C(·llIr.il' I'..,' n P 1l1l·0 <; t'S. ~i Il)lbr ~ r: ld,: .' \I c rt' ~h \l ~c ll Jnr ,il l three tc: ~t ~;l( llp l c: \ ,
5

Three conditions were assessed as follows:
I. Sound measurements were taken with the microphone inside the vehicle at center, front seat position. The microphone was positioned at ear height. The sound measurements reported reflect the average sound pressure levels sampled throughout the period in whic h the vehicle was traveling over sections of each pavement surface. typically about 2 seconds.
2. A mounting bracket was fabricated to allow sound measuremenrs (0 be taken near the rear tire well away from the exhaust pipe. See Figure 5 for illustration of microphone configuration. The sound measurements reponed reflect the average sound pressure levels sampled Throughout the period in which the vehicle was traveling over sections of each pavement surface.
3. Sound measurements were taken 25 feet from the center-line of the lrave I lane closest to the highway shoulder. The height of the "roadside" microphone above road level is shown ill Table I. The height of the microphone was dictated by the topogrilphy and limitations of the tripod.
Table J. Height and location of [he microphone relative to load
Location Description Microphone Height
I Transverse Tining Rond to be Ground. MP 244.42-244.45 -11 inches
2 Transverse Tining Road to Remain Unchanged, MP 244.45-244.49 5 I inches
3 Transverse Tining to be Grout-Filled, MP 244.49-244.53 58 inches
<1 A sphalt, SMA, -MP 246.3 34 inches
5 Longitudinal Tining, MP 243.20-243.49 34 inches
Since there wa~ interference from other vehicles in both eastbound and westbound lanes, a number of measurements were taken. The sound level meter was set to "maximum spectrum" which records the spectrum of the sound when the highest A-wei g h ted overall Ie ve lis reac hed as the veh I c Ie passes by. Due to consiste n t traffic flow, it was difficult to absolutely isolate the station wagon from other trafflc in the distance. Sound pressure levels reponed are the lowest levels from multiple tests with the assumption that these levels most closely represent the sound generated by the subject vehicle.
Follow-up Measurements Mea~lIrement:; were Taken in Turkey Creek Canyon on US285 in the same manner and the same equ ipment used In thl! previolls study conducted Octobet· 4,2000. We conducted measurements tor Test Section I only. This section of trans\el se Ii Ili ng had been ground down si nee previolls measurements. See Figure~ .) Zlnd -I.The \\'eJlher IV,IS mild ~ll -12 degrees Fahrenheit with no noticeable breeze The road was dty
6

Figure 1 View looking east at transverse tining Test Sections 1.2 and 3 along US285 mileposts 244.42 to 224,53,
Figure 4, A detailed view of transverse tining at Test Section I bel ween mi leposts 244.42 and 24.:.1.45. eastbound US2SS, The right-hand 1/2 of the pho(Ograph shows where trans verse [i ni ng has been ground_ The grinding lapel-" 10 rhe left showing remnant Irnnsverse lining lexture, NOle pen for' scale,
Analysis
Noise Th e re sull" of Ihe hil'ie-linc on;,.: rncaSUrel11enl~ <Ire pro"iueJ In Tables 2 Ihrough -I. Frequellcy sp~LtrJ d:lI;) hJ'; ai"l) been piolled in GI,)pi1s I rhrough ~ (() compJre the fil '\! 1'('<lU\IJY test ~eclion~ unlb the three mea,lLrell1c:nt (onu Iliulls of i nSlcJe I ell icle. ar I ht: Iii e we II. and iii rhe r'oad,lue,
7

Two sound pressure anomal ies occurred withi n datJ collection. The first anomaly is a consistent 6 to 9 decibel (dB) spike at 100 Hz frequency in all noise melsurements_ This frequency has been idemitied as engine noise
C:osi?c·Cell --Neocrene Tape
Hose C!amps ~ (Typ . Z;
,1.\:C;o;::hcr.e -
Microphone Mount at Tire Location
:1
: i -':-:0
Fi:;ure 5_ Micwphnne mllunt <:It .he (ire location .
8
COOT: 7ur~ey Cree~
."":li?C: Nc o ~ ~ ~
:r2'.'Jl1 ::~J :-:.iE2:

'-0
T8ble :?: Results of Sound Measurements Taken inside the Vehicle Measurements Taken: 10/4/00 SPL at 113 Octave Band Frequency
1,~,0, l) S ,40,0, _,~M_~JJL_,'I.2.~----1JNJI~~l1 2000 25QD ll~,O @D 500.0 ':gIO !!!Xl IL..lC!mL_.1Z.StJ1_, ,16000 2@~.o l'®.o 4000 Q ®!XI,Q ~.o 8(191,0 .OCQO.Q dBA Section 1 90 85 84 79 72 66 74 67 65 63 62 61 54 53 51 55 50 49 51 46 40 35 31 28 27 27 27 64 Sec lion 2 88 86 86 82 72 69 73 69 66 61 62 61 55 54 53 58 53 50 51 47 41 37 35 35 36 34 30 65 Seclion 3 89 86 86 85 72 66 74 66 63 61 61 59 55 52 50 59 49 46 49 45 40 34 31 28 27 29 29 64 Section <I 91 88 83 78 72 66 74 72 67 62 64 62 56 54 55 55 52 49 47 42 37 34 32 28 27 27 27 65 Section 5 89 85 84 82 71 72 73 65 63 60 60 60 54 51 50 51 49 45 44 41 36 33 30 27 26 26 26 62
TClDlc :1- f-105ulls of SOl)nd Measurements Taken al the Tire of the Vehicle Measurements Taken: 10/4/00 SPL at 113 Octave Band Frequency
~H ,,)1,0 'Q,O $(),Q_,Al.Q._,.!!lJL-lOM-1lS.o II;j)D 200Q 2$()O )]So 400~P 6.YJQ @D lOOOQ 12511.0 ljoOOP ~OCQQ 15QM ll50.P 4OO(IP woo.o bWQ ScooO '00000 dBA S" G(lon 1 90 94 92 90 67 65 94 83 87 88 85 87 85 88 90 100 95 96 102 100 94 85 81 77 72 69 68 107
90 89 86 94 84 87 86 84 85 84 86 89 101 93 93 99 97 93 85 80 77 73 70 68 106 88 86 84 93 82 86 85 83 83 82 85 88 104 91 92 98 96 93 84 79 75 72 69 67 106
I Se lec t jon 2 97 95 92 Scclion 3 94 92 89 Section ~ 98 96 93 92 89 86 94 86 86 86 B6 85 85 87 90 92 95 94 9S 91 84 80 76 75 72 70 69 102 Section 5 93 91 90 88 85 84 93 82 84 84 83 82 81 84 87 92 91 90 92 90 85 81 78 75 72 69 58 99
Tilbl(~ ~: [1,,:,111(5 ot Sound Measurements Taken at the Roadside Measurements Taken: 10/4/00 SPL al1/3 Octave Band Frequency
25,0 )L5 . 'P,O_~.o_7~.9,_~,Q \!;Q,t! 11M liOg lOOO Z5Q.o Jl~ W,Q ~,Q ~:I!!Q 6~Jl_IWP IS"W ~ 21il1!!D ~!Ii!!,Q mltf ~.t! bW.!! 6m'L-J~~ S('ction 1 50 51 50 49 49 54 60 55 59 59 59 59 60 65 67 78 73 71 75 74 67 81 58 52 47 43 39 82 Section 2 51 46 49 51 52 53 59 53 57 58 61 57 59 62 66 76 69 59 72 69 62 50 56 S2 48 44 40 79 Seclion :I 51 52 52 54 55 59 59 55 57 60 62 59 61 62 65 75 71 71 74 71 64 61 55 51 46 42 38 80 Section 4 51 56 49 55 55 56 54 54 58 57 61 60 59 61 64 64 68 66 64 62 58 54 52 49 ~ 43 38 74 Seclion 5 <15 45 52 53 51 54 59 55 53 58 60 55 58 62 64 67 66 67 66 64 62 58 55 50 46 41 37 75

related to the subject vehicle. Graph I illustrates an anomaly at the high frequency tail of sound measurements taken inside the vehicle for Test Section 2. This deflection of 2 to 5 dB from the data trend occurs only once and is attributed to extraneous noise generated inside the car, such as driver movement.
During Ihe measurements, other random vehicles were sampled on the transverse tjned roadway. No record of type of vehicles is provided. The frequency readings for the Oldsmobile station wagon tended to peak at 800 Hz at the roadside (see Graphs 1-3), whereas other vehicles peaked at 1000 Hz or 1250Hz (see Graph 4).
The audible range of frequencies for humans is between 20 and 20,000 Hz. In general, all highway noise frequency spectral measurements peaked within a range between 800 and 2000 Hz. The distribution within this range was slightly bimodal with peaks at 800 H, and 1600 Hz respectively. The exterior vehicle sound measurements best demonstrated the noise (decibel) increases and frequency (Hz) peaks at both base-line and after grinding surface texture trealment sections.
The peak frequency-noise level increase band or "prominence" represents the whine heard by local residents as cars pass over the transverse rining. 1 Although these noise measurements indicate that the prominence occurs in all test sections. (he before-grinding transverse tining surface texture generated the highest values. Peak prominence values for base-li'ne Test Sections 1,2 and 3 average 7 dB (roadsidc) to 4dB (tire well) higher than corresponding peak values on asphall and longitudi nally tined surfaces.
The result of grinding down % inch of transverse tining at Test Section I was a net noise reduction of 6 dB. This is a noticeable noise reduclion for the area residents. FHW A noise abatement criteria cites a 5 dB sound level reduction as significant for residentiill areas. The before and after grinding noise level comparisons for Section I are presented in Table 5 and the frequency spectra are ploued as Graphs 5-7. The roadside before and after grinding noise frequency spectra comparisons are charted as Graph 8.
~a'IJ.' r,}'\i<!:~ r,~. ,_ .,
l.~ l...!.J !3_~ sp-~ ~o ~_o ".~ '.'l'\~ J e'l~ - ..... .,... ... - - .... ' ..... .b<U .... "". !ont.' -.. """I ..... , ... ... In CO! ~Qr.~ndin9 '" " " " '" "" oJ 0' " '" " " " '" .. " " " "
,. " ,> 1~C:ar.tJ\er~lng .,
'" 'J I, .' " r .. oJ " " " '" " ." " .." .., ,. :0 :n $I J' ,:
()Irr~one. ., .S ., ., ., ~ ., ~
At,.A ..... ror.G:"~ '" .. ., ., " ." .. OJ " .. .. " '" .. .,
'''' '" .. '''' '0) .. "" " )J " dJ
AtI1t.~tw'~I~ '" "" .. ., ,) .. .. " " .. .. ., .. ., "' '"
., "
., '" .. " .. " " .)
~.,..n£. ~ .. ., .. . , .. ., .) .,
1t~IMO(. 50 Ok 50 .. til '" ,.
'" ,. .. tiJ '"
., " " " " ). " .' " " " " C->OQ
-"'"' " ., " " .. " " oJ tiJ ~ '"' .' OJ d) '" .. '" '" .. .. " .. ,..
'" " """'00 r:-'fW_C-1t ., .. .. oJ '" ., 4 ~ ~ ., ~ .,
Table 5. Before and after sound measurements for ground section of highway.
Skid Resistance Road surface friction is measured to determine pavement skid resistance. Skid resistance is defined as the retarding force generated by the interaction between a pavement and a tire under locked, non-rotaling wheel condition 3 Measurements afe standardized for tire and pavement surface conditions and the results from resistance testing are reponed as friction numbers or skid numbers. Skid numbers were measured using a locked wheel lester in accordance with ASTM E 274. using a standard ribbed tire at 40 mph. The measurements were reponed as SN40R, where SN refers to skid number, 40 refers to the speed in miles per hour, and R refers to the tire tread type, in this case ribbed tires .
Table 6 compares base-line skid numbers for e(lch pavement surface type and the after grinding transverse tining test section. Grinding improved the skid number from 43.5 to 47.6. This improvement is associated with the <;m;)ll grooves caused by the grinding wheels. Similar improvements in skid resistance have been reported In other loc31ions v.hcre grinding was performed on concrete pavements.
10
,- ~..M
» '" " ~,J
.. I{lJ
"" i l';l
., ~
,. ., 19 ,.
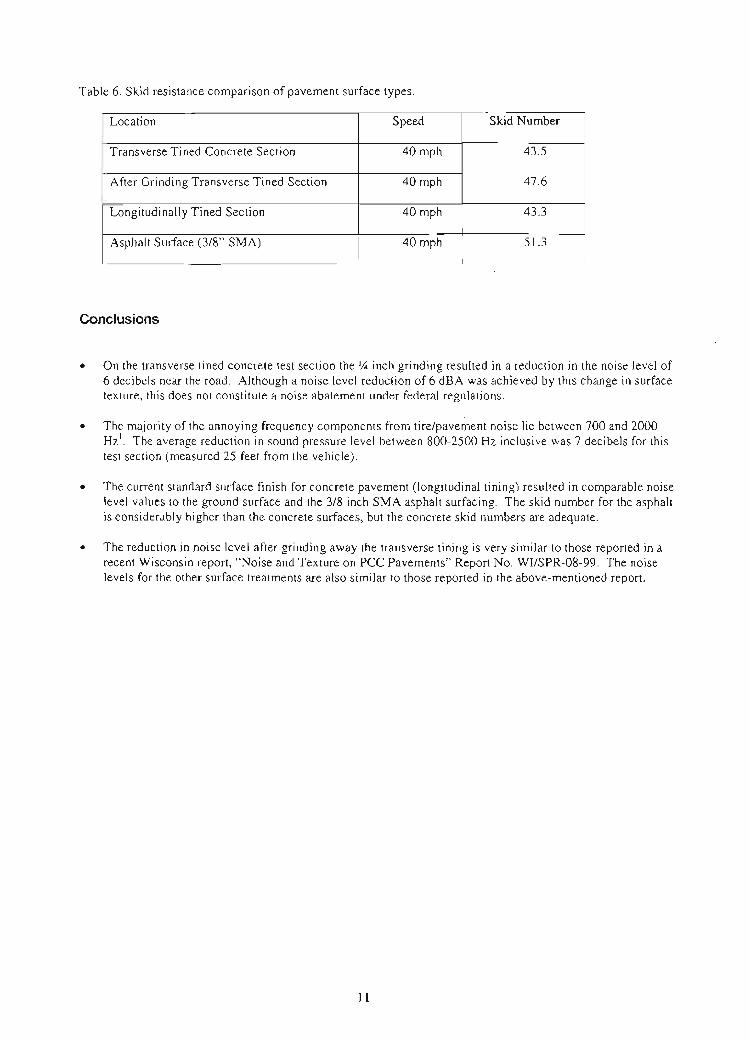
Table 6. Skid resistance comparison of pavement surface types.
-Location Speed Skid Number
Transverse Tined Concrete Section 40 mph 43.5
I After Grinding Transverse Tined Section 40 mph 47.6
Longitudinally Tined Section 40 mph 43.3
Asphalt Surface (3/8" SMA)
I 40 mph 51.3
~ I I
Conclusions
• On the transverse tined concrete test section the J,4 inch grinding resulted in a reduction in the noise level of 6 decibels near the road. Although a noise level reduction of 6 dBA was achieved by this change in surface texture, this does not constitute a noise abatement under federal regulations.
• The majority of the annoying frequency components from tire/pavement noise lie between 700 and 2000 Hzl. The average reduction in sound pressure level between 800-2500 Hz inclusive was 7 decibels for this test section (measured 25 feet from the vehicle).
• The current standard surface finish for concrete pavement (longitudinal tining) resulted in comparable noise level values to the ground surface and the 3/8 inch SMA asphalt surfacing. The skid number for the asphalt is considerably higher than the concrete surfaces, but the concrete skid numbers are adequate.
• The reduction in noise level after grinding away the transverse tining is very similar to those reported in a recent Wisconsin report, "Noise and Texture on pee Pavements" Report No. WIISPR-08-99. The noise levels for the other surface treatments are also similar to those reported in the above-mentioned report.
J l

Isound Measurements Taken Inside the Vehicle)
100
(
~~ l\ 90
80
~ ro u (/)
ro 0.. 0 U 70 'E 0 N
~ CO 3 60 Q) > <IJ -l
~ ::J III (/)
50 Q)
a: -0 c: :l 0
CI)
40
lf1 ~ ,\ I~
r) ~ J I ~ \
~ f ~ ~ ~ ~ ~ ~~ ""'-:I ~ 1
~ ~ ~ ~ ~ ~ ~ ~ .J~ "l
~ V< ~ ~, I'---.; , ~ ~ >-' .....-' ~
\ ~
'\~ / 30
20
25 40 63 100 160 250 400 630 1000 1600 2500 4000 6300 10000 31.5 50 80 125 200 315 500 800 1250 2000 3150 5000 8000
Frequency (Hz)
B Section 1 ~ Section 2 6 Section 3 e Section 4 9 Section 5
--Sound Measurements: In Vehicle
Graph p;; COOT: Turkey Creek
1 f-
~ID L ADAMS ASSOC!8IE5 I~C ,\
O::!.~~~ml1 II
Project No, r
Drawn by 3031455-1900 FAX 3031455-9187 11-5-00 6171 M88 ..
12

I • • • ! I I
Isound Measurements Taken at Tirel
-I
'"
" h-+ T
" ,. .... , .... _ ...... ,,""--_ ..... -...... 'II 200". __ ,_"""" ..... __ _ " ". l"lI
Sound Measurements: At Tire -2
, "

[Sound Measurements Taken at Roadside]
80 I I I I ,
70
c;;-oo (,) CIl ~ a. 0 t;
-E 60 0 N
~ CO ~ ru > (I)
....J Q)
~ 50 I/) CIl Q)
a': "0 C. ::l 0
If)
40
~ ~ ~ p
~ ~ \ \ v---< \
~ ~
~ vi ~ f\ ~
~ ~ ~ ~
r /1 ~ / 1\
~ ~ /./ ~~ \ \
~ \ r ~ .~ ~ ~ (
~ ~ ~ \ ~ i ~
~
~ ~ \ ~ ,0
\ f fI(.." '~
~ rr '1:~
, y---~ ~
~ ~ .
I
30 25 40 63 100 160 ' 250 400 630 1000 1600 2500 4000 6300 10000
31.5 50 80 125 200 315 500 800 1250 2000 3150 5000 8000
Frequency (Hz)
B Section 1 0 Section 2 6 Section 3 e Section 4 9 Section 5
~ Sound Measurements: At Roadside
Graph ~
COOT: Turkey Creek
3 I--
~IO L ADAMS ~ATES I~C, A 17Q1 BOlllde( SlTeeI A
I--Cel»!flI: Cokxadll 00211 Project No. Drawn by 303/45&-1900 FAX :lO:3J455-9187 11-5-00 6171 MBB - .
14

!Various Drive-Bys, Unidentified Vehicles 1
• ~ record 1
•• record 2
... record 3
B "record 4
~ • record 5
6· record 6
I·
25 40 63 100 160 250 400 630 1000 1600 2500 4000 6300 10000 31 .5 50 80 125 200 315 500 800 1250 2000 3150 5000 8000
1/3-0ctave Band Frequency (Hz)
Sound Measurements: Roadside
• Graph =-
COOT: Turkey Creek
4 ~
Q&lD L, ADt.MS ASSOCIcmS ItlC 17Ql ~ulder Street A -Q~[ Cclc[ida a0211 Project No. Drawn by 303/455-1900 FAX 303/455-9187 11-5-00 6171 MBB
15

II COOT: Highway 285, Turkey Creek Sound Measurements inside Car of Transverse lining V$ , Ground Down Road
90
\ ~ \ ~ 80 ~ I f/)
\ co
) ~ c. 0 t> 'E 70 0 [f'\ ~ ~ ~ N
~ b'1 h ~ co 1\ ~ 60 <D '[ V I ~ >
fl <ll
V ...J
~l e ~ ~, :::l 50 ~
'" 1/\ \ '" Q)
ct f--t f\ ~\ " c: ::J 0 40
C/) \ N h ~R 30 \ W
25 40 63 100 160 250 400 630 1000 1600 2500 4000 6300 10000 31.5 50 80 125 200 315 500 BOO 1250 2000 3150 5000 8000
Frequency (Hz)
I_ in Car Before Grinding 8 in Car After Grinding I
Sound Measurements: In Vehicle
6- Graph ~
CDOT: Turkey Creek
5 f--
QA~D !.. 8Q~ flS~OCIAIfS. 1M!,:; " 1701 Boulder §~
1\ f--
Llc!Il!er Cgj~Q 82211 Project No. Drawn by 3031455-1900 FAX 303/455-9187 11-5-00 6171 MBB
,.
16

COOT: Highway 285, Turkey Creek Sound Measurements at Tire of Transverse Tining vs. Ground Down Concrete Road
110
100
Ul
ro u Ul ro D-o '-u ·E a 90 ("\J
~ m ~ OJ > Ql
--l
~ 80 ::J Ul Ul C!l
Q ""0 C ::J 0
(f)
70
I )~
I~ II 1/ \ / \ ~
[ i
~~ j l~ / j-----E
-\ 1\
~ ~ ~
~ ~ h V V \ ~ 1 ~ p ~ V •
I ~~ "t ~ ~ ~
~ ~~ \p
60
25 40 63 100 160 250 400 630 1000 1600 2500 4000 6300 10000 31.5 50 80 125 200 315 500 800 12502000 3150 50008000
Frequency (Hz)
• At Tire Before Grinding 8 At Tire After Grinding
Sound Measurements: At Tire
-- COOT: Turkey Creek
~ L AIJ8MS 8SSOCI8I~ INC 1701 Boulder Street "
lJenY!lC CQlQrnQQ 00211 Project No. 303/455-1900 FAX 3031455-9187 11-5-00 Drawn by
6171 MBB
17
Graph p;;iEI
6 t--
-
.... c- ."',..~ .. .. . ~, ., ~ .~

COOT: Highway 285, Turkey Creek Sound Measurements at Roadside of Transverse lining VS, Ground Down C<lncrete Road
80
70
---(J)
~ II'> nJ Q.
e u 'E 0 60 ('\l
<11 .... I!)
~ Q3 > <11 -i
<11 50 ::; (J) II'> Q.l
a:: "tJ c:: ~ 0
Cf)
40
I ~ ~ lJ h ~ 1\ -
~ V f'\ \ ~
) ~ I) ~ V ~ \ \ ~ ~
r ~ y'- '1
~ I •
.) V
~ t
/ r I
..--A ~ \
'\ / \)
\ J
1\ I
30 25 40 63 100 160 250 400 630 lOCO 1600 2500 4000 6300 10000
31 ,5 50 80 125 200 315 500 800 1250 2000 3150 5000 8000
Frequency (Hz)
I_ Roadside Before 8 Roadside After
6-Sound Measurements: At Roadside
Graph P-CDOT: Turkey Creek
7 ~
" QAlllQ l A08MS 6SSQCfAr~....ll:!C.-
17Q l Boulder Sifi " ~!lYI
SH 285 Noise Measurements beside Roadway (25 feet from center of Lane)
-
~ -I~ / ~~ / --.. ~
1\ V ,.
~J ~ \ / ~Lt;<~ , ' ... 1\
.- J ~
.:.;:-.. •.... ~ . " ' I ·'t..., ~\ "'--
,~~, .. : . .,
4 ., "
., '- ". ~:,. ~
~ ~ lI'~'J r- :'\ 1 \, .. ~
~ -; ~-- '----1 N',·I . ~,~ • ./ ~\ ~
\
~ J k--'~ ~'''xf 3.."". ~~ .~
\ f7~" ~\I .: ~ ~ ~~
-~'~
~
II l ... .,.. I""%~ k I-
~~
~ ~ ~ ~ ~ ~ ~ ~ ~ ~ ~ ~ ~ ~ ~ ~ ~ ~ ~ ~ ~ ~ ~ ~ ~ ~ ~ {>" ~". t>-~' ~~. '0,.". 't>~-"~~ . &.,,O~."v~r;:...rt>r;:.. ',.,,,,~ ' 1>.~r;:.. . ~~~.'o":>~-'t>~r;:...~~~'{>~.,O~~.~~~.~~~.,~~.~~~.r;:;,~~ .':'J~~.(;::p~ 'r;:;,~~'
" " ~ ~ ~ ,." ~ ~ ~ ~ ~
Frequency (Hz)
80
75
70
65
60
55
50
45
40
35
30
• Trans. Tining - .. - Trans_ After Grinding --·--~A~~-N·SMA Asphalt Pavement .. -.-.-........ !)(-.v_-.. Long. lining I
Gmph 8. Comparison of fill lesl sections at rO<ldside 10 ground Imnsverse lining secl ion .
19
~ :.-4J
..J 4J .... :l VI I/) II> ....
Q.
'0 C :::J 0
<Il

References
I. "Kuemmel,D.A. et aI., 2000, "Noise and Texture on PCC Pavements - Results of a Multi-State Study," WisDOT Highway Research Study #93-05 SPR#O092-45-91, Final Report WUSPR-08-99.
2. "Evaluation of Pavement Friction Characteristics," NCHRP Synthesis 291, National Academy Press, 2000.
3. "Kulakowski, B.T., et aI., 1990, "Skid Resistance Manual," FHW A Report IP-90-13 Unpublished Final Draft, FHW A, Office ofImplementation (HRT-IO).
20