nofima atlantic salmon in closed- containment … atlantic salmon in closed-containment systems...
TRANSCRIPT

Nofima Atlantic Salmon in Closed-Containment Systems Research Update
28.10.2014 1AIW#6
Bendik Fyhn TerjesenNofima
Aquaculture Innovation Workshop #6Vancouver, October 27th-28th 2014

�Current Atlantic salmon production, challenges, and trends in Norway
�Research on postsmolt production in RAS
�Effects of tank scale on postsmolt production (in flow-through)
�Research on postsmolt production in floatingsemi-closed containment systems in sea
Contents
AIW#6

Norwegian salmon farming
� Norways 2nd largest export commodity ~ 7 billion US$ annual value
� Norway exports salmon to approximately 100 countries� Produced around 1.3 million ton salmonids in 2013,
14 million meals every day� The industry employ > 20 000 persons in Norway
28.10.2014 3AIW#6

Norwegian salmon farming in 2050
28.10.2014 4
Envisioned value generation provided limiting factors for growth in the aquaculture value chain are addressed. Value estimates from Olafsen et al (2012)*. 1 US$ ~ 6 NOK
� 5 million ton salmonproduced annually i 2050?
� It has been projected thatNorway will produce 5 mill. ton salmon annually in 2050 (Olafsen et al 2012)*
� 5x increase in productionvolume, 8x in total valuecreation
� Large increases in relatedindustries, such as water treatment technologies
� This projection assumes thatsustainability issues areadressed and solved
AIW#6
* Olafsen, T., et al., 2012. Value creation from productive seas in 2050. Report from The Royal Norwegian Society of Sciences and the Norwegian Council of Academies of Engineering and Technological Sciences, Trondheim, Norway, 79 p.

Challenges for Norwegian salmon farming
• Sea lice is a serious challenge, for wild and farmed salmon• Escapes of farmed salmon may affect wild salmon populations• New sustainable feed resources must be found• Loss of fish: Mortality during production is 16.4% on average• Most of this loss, and lost production capacity, occur soon after
stocking at sea, of small smolts (<100 g)
• Huge efforts and R&D are being done to combat lice; everythingfrom laser canons against lice, cleaner fish, breeding lice-resistantsalmon, to submerged cages, tarpaulins, and closed-containmentsystems
10/28/2014 5
Photo: Stingray
AIW#6

Research on postsmolt production in RAS
28.10.2014 test 6

Smolt prod in closed RAS land-based
Postsmolts in semi-closedcontainment
in sea
Shorter periodin cages
before harvest
Semi-closedcontainmentin sea
0-80 g 80 g – 1 kg 1 kg – 5 kg
Smolt prod in closed RAS land-based
Postsmolt in closed RAS land-based
Shorter periodin cages
before harvest
0-80 g 80 g – 1 kg 1 kg – 5 kg
Closed-containmenton land
Today: 22 000 tons in closedsystems in Norway, as smolt
If all salmon in Norway to 1 kg in closed systems: 290 000, 13x increase!
Future production strategies in Norway?
AIW#6

Experimental series to increaseknowledge about postsmolt production in RAS
Bio-reaktor CO2
Filter
To tanks flow-through, full SW
Experiment 1
RAS medium-scale, varying salinity, varying water velocity
Bio-reaktor CO2
Filter
To cages in sea
Experiment 2
RAS industrial scale, varying salinity, fixed water velocity
Bio-reaktor CO2
Filter
To cages in sea
Experiment 3
RAS medium-scale, fixed salinity & water velocity
AIW#6

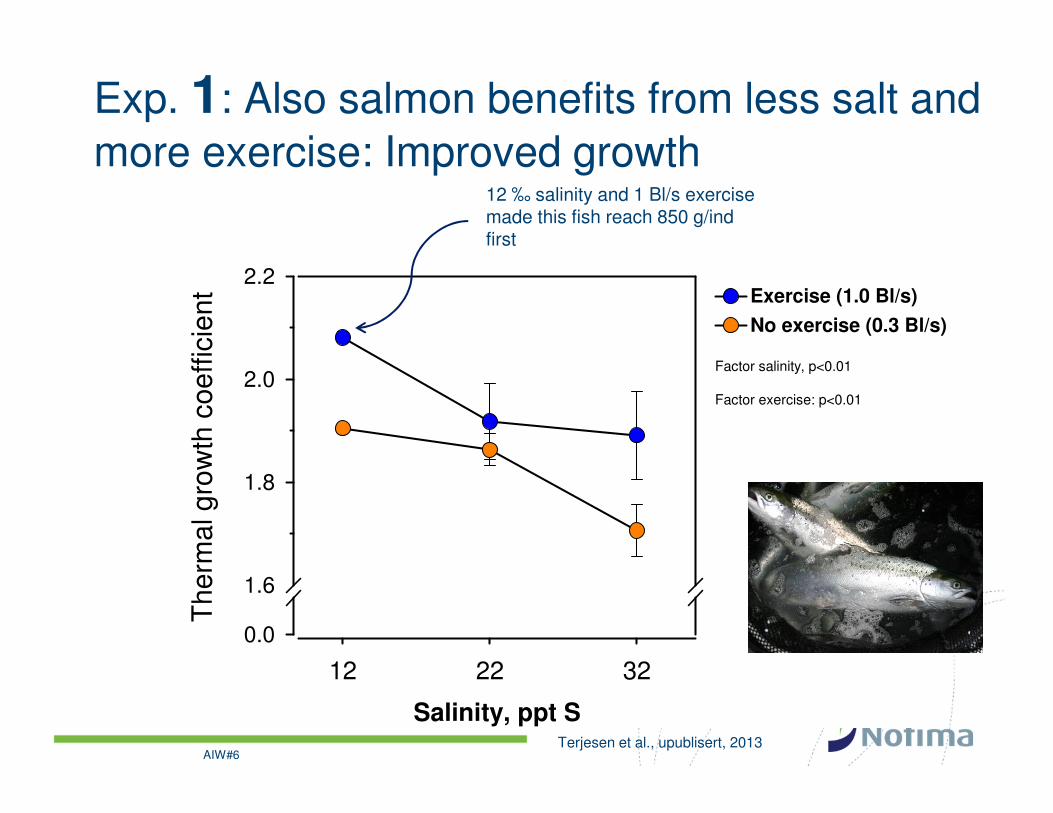
Exp 1. Salinity & water velocity in RAS for postsmolts
• SW-RAS may have higher running costs than FW-RAS due to CO2 and TAN removal efficiencies are lower than in FW
• Results in need for largerinstallations and/or higher flow
• Or can postsmolts be kept at lower salinity in RAS, and still handle full-strength SW at stocking in sea?
• This exp ran from 70 g til 850 g at different salinities (12-22-32 pptS) or exersize levels (0.3 og 1 BL/s), at12L:12D photoperiod
10/28/2014 9
Nofima Centre for Recirculation in Aquaculture (NCRA), Sunndalsøra, Norway
AIW#6
Salinity, ppt S
12 22 32
The
rmal
gro
wth
coe
ffici
ent
0.0
1.6
1.8
2.0
2.2
Factor salinity, p<0.01
Factor exercise: p<0.01
Exercise (1.0 Bl/s)
No exercise (0.3 Bl/s)
Exp. 1: Also salmon benefits from less salt and more exercise: Improved growth
12 ‰ salinity and 1 Bl/s exercisemade this fish reach 850 g/indfirst
Terjesen et al., upublisert, 2013AIW#6

Exp. 1: Improved feed utilization at lower salinities(FCR, feed:gain)
28.10.2014 11
Salinity (ppt)
12 22 32
FC
R (
fee
d/g
ain
)
0.00
0.80
0.85
0.90
0.95
1.00
1.05
1.10ExerciseNo exercise Salinity:p=0.071
Exercise: NS
Salinity (ppt)
12 22 32
FC
R (
fee
d/g
ain
)0.000.80
0.85
0.90
0.95
1.00
1.05
1.10
1.15
1.20ExerciseNo exercise
FCR entire trial (70-800 g) FCR 250-450 g
Salinity:p<0.005Exercise:NS
AIW#6Terjesen et al., upublisert, 2013

Exp.1: Improved survival of low salinities, when kept in similar conditions throughout
Terjesen et al., unpublished, 2013
AIW#6
Fish weight (g)
0 200 400 600 800
% C
um
mu
lati
ve s
urv
ival
0
50
60
70
80
90
100
12‰ + Exercise22‰ + Exercise32‰ + Exercise12‰ - Exercise22‰ - Exercise32‰ - Exercise
12‰ salt, 99%22‰ salt, 97%
32‰ salt, 71%
Mean survival in cages
Sensitive period

28.10.2014 Havbruk 2014, Tromsø
Exp.2: Industrial scale RAS; effects of salinity at fixed water velocity, with stocking in cages
400
m3 700
m3
Drum-
filterMBBR

FW RAS
>400’
smolt
12ppt RAS
51’ post-
smolt, 81g
12ppt RAS
61’ post-
smolt, 92 g
12ppt RAS
50’ post-
smolt
12ppt RAS
50’ post-
smolt
12ppt RAS
50’ post-
smolt
12ppt RAS
50’ post-
smolt
12ppt RAS
98’ post-
smolt
22ppt RAS
49’ post-
smolt, 78g
22ppt RAS
62’ post-
smolt, 100g
22ppt RAS
50’ post-
smolt
22ppt RAS
50’ post-
smolt
22ppt RAS
50’ post-
smolt
22ppt RAS
50’ post-
smolt
22ppt RAS
103’ post-
smolt
SW
116’ post-
smolt, 110g
SW
114’ post-
smolt
SW
99’ post-
smolt
SW
116’ post-
smolt
Industrial scale RAS: GSF Adamselv
Control cages in sea: GSF Loppa (90 m circumsphere)
Cages in sea:
GSF Loppa
(140m
circum-
sphere)
SW
101’ post-
smolt
SW
101’ post-
smolt, 75g
80-110g ~200 g ~300 g
Exp. 2 design: effects of salinity in industrial scale RAS, Grieg SeaFood
Frode Mathisen, unpub., 2013
AIW#6

FHF Postsmolt E project (Medhus, Norheim, Norwegian Veterinary Institute):� Detected nephrocalcinosis and red blood cells in kidney tubuli, increasingly with
duration of experiment
12ppt 22ppt
Exp.2: Industrial scale RAS; effects of salinity at fixed water velocity
Kolarevic, Terjesen et al., unpubl., 2013
Dato
12.a
ug.1
3
26.a
ug.1
3
09.se
p.13
23
.sep.
13
07.o
kt.13
21
.okt.
13
04.n
ov.1
3
18.n
ov.1
3
[CO
2] (
mg/
l)
0
5
10
15
20
25
30
35
40
Dato
12.au
g.13
26
.aug.
13
09.se
p.13
23
.sep.
13
07.o
kt.13
21
.okt.
13
04.n
ov.1
3
18.n
ov.1
3
[CO
2] (
mg/
l)
0
5
10
15
20
25
30
35
40Avg. [CO2] 13 ± 5 mg/L Avg. [CO2] 18 ± 7 mg/L
Yersinia
introduced by
accident to
RAS
Yersinia
introduced by
accident to RAS
� Detected Yersinia ruckeri at last sampling point� Detected Tenacibaculum sp.
AIW#6

Period
Aug-O
kt
Okt-Nov
Aug N
ov
Th
erm
al g
row
thco
eff
icie
nt
(TG
C)
0.0
0.5
1.0
1.5
2.0
2.5
3.0
3.5
4.012 ppt RAS22 ppt RASControl cages, in sea
Exp. 2: Industrial scale RAS, growth and survival p=0.09
� Good growth rate in RAS, but yersinosisgave negative effect
� After stocking at sea, higher mortality in RAS groups, likely due to sub-optimal water quality and yersinosis
Preliminary conclusions:� In RAS with no apparent disease issues
with, 12 ppt S should be used due to better growth, skin health, and water treatment, as found in Exp. 1
� In RAS with typical FW-pathogen challenges, a higher salinity should be used, provided that water treatment capacity is sufficient
� After this exp., Grieg SeaFood has changed the RAS water treatment and biosecurity, and now have good experiences with post-smolts in RAS
AIW#6 Date
25.no
v.13
9.des
.13
23.d
es.13
6.
jan.14
20
.jan.
14
3.feb
.14
17.fe
b.14
3.
mar
.14
Cum
mul
ativ
esu
rviv
al (
%)
0
70
75
80
85
90
95
100
Control cages, in sea 12 ppt RAS, after sea transfer22 ppt RAS, after sea transfer
Average survival to harvest size(Skrudland & Bleie, 2014)
Kolarevic , Terjesen, et al., unpubl., 2013

Nofima
NCRA
FW-RAS 1000g12‰ -RAS+Exercise
Cage
12:
1224L
Cage
2000g
2000g
2000g
600g+ Exercise 12‰ -RAS
600g 1000g Cage
1000g
12‰ -RAS+Exercise9 tanks 6 tanks 3 tanks
3 cages 3 cages
3 cages
Exp. 3: medium-scale RAS with fixed salinityand water velocity, then stocking in cages
• Exp. 1: Potential for very high (99%) survial, but sensitive phase 300-700 g• Exp. 2: Importance of water quality and biosecurity, and again sensitive postsmolts• Exp. 3. goal: “test of concept” post-smolt RAS prod, with changes according to
Exp.1&3 results, now followed with stocking in cages
Ytrestøyl & Terjesen, unpublished, 2014
12L:12D
AIW#6

Exp.3: Changes to reduce mechanical contact and improve skin healthTemp in RAS keptrelatively low (12-13ºC), 0-3ºC differences to cages Feeding in exp. tanks
ended late, -2 daysAdded product w/iso-eugenol
sedation to exp.
tanks (2.7 mg/l)
Added product w/
polyvinylpyrrolidone
(PVP, 60 mg/l)
and EDTA to nets,
weighing tanks, holding tanks
Used long time & careful netting and
loading (1 h/tank)
(w/12 ppt S, iso-eugenol & PVP)
Careful pumping from tanks on truck, to exp. cages
Ytrestøyl and Terjesen, unpubl. 2014AIW#6

�Transfer @600 g: Appetite right aftertransfer, and gradual increase to July, from then on above tables for same size/temp
�Transfer @1000 g: Higher condition factor at transfer. Long time without detectable feedintake. Gradual improvement from August, then abovetables for same size/temp
Exp.3: Feed intake in postsmolts produced in RAS, after stocking in cages, at two size-classes
Ytrestøyl and Terjesen, unpub, 2014
AIW#6
Date
mai jun jul aug sep okt nov
Fee
d in
take
(%
BW
day
-1)
0.0
0.2
0.4
0.6
0.8
1.0
1.2
1.4
1.6
1.8Transfer 1 @600 gTransfer 2 @1000 g

�Good growth rate during time in RAS (TGC=2.8)
�After stocking, comparable weightdevelopment betweencages and RAS (avg. temp. 12.8ºC og 12.3ºC)
�Growth in the two sizeclasses reflecteddifferences in feed intake
�At ~1 kg, relatively lowmaturation, this is monitored closely
-RAS: 3% (1 kg)-Transfer 1, 7% (1.4 kg)-Transfer 2, 0.7% (1 kg)
Exp.3: Growth after transfer from RAS to cages in sea, at two size classes
Ytrestøyl and Terjesen, unpubl. 2014
AIW#6
Date
1.fe
b.14
1.ap
r.14
1.jun
.14
1.au
g.14
1.ok
t.14
1.de
s.14
Bod
y w
eigh
t (g
ind-1
)
0
500
1000
1500
2000
2500
Transfer 1, in cagesTransfer 2, in cages12 ppt S RAS
Transfer 1 Transfer 2Estimate
TGC RAS: 2.80
TGC RAS: 1.6TGC Transfer 1: 2.0
TGC Transfer 2: 0.04
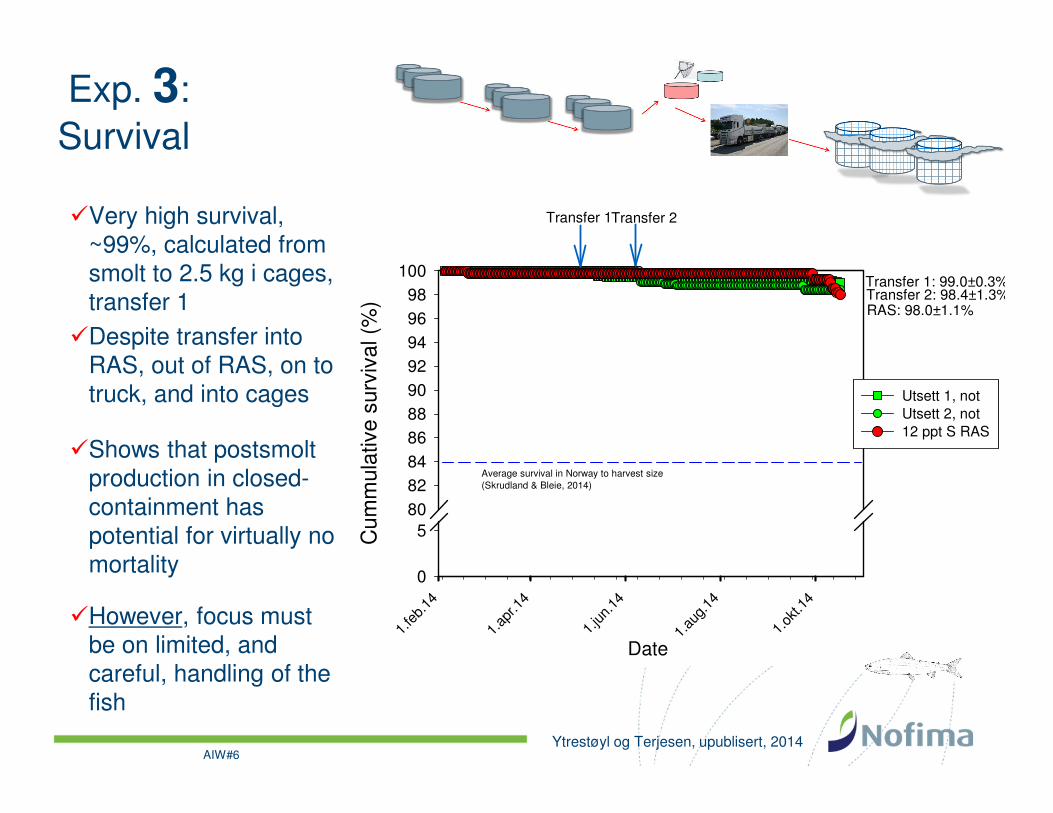
�Very high survival, ~99%, calculated from smolt to 2.5 kg i cages, transfer 1
�Despite transfer intoRAS, out of RAS, on to truck, and into cages
�Shows that postsmolt production in closed-containment has potential for virtually nomortality
�However, focus must be on limited, and careful, handling of thefish
Exp. 3: Survival
Ytrestøyl og Terjesen, upublisert, 2014AIW#6
Date1.
feb.
14
1.ap
r.14
1.jun
.14
1.au
g.14
1.ok
t.14
Cum
mul
ativ
e su
rviv
al (
%)
0
580828486889092949698
100
Utsett 1, notUtsett 2, not12 ppt S RAS
Transfer 1Transfer 2
RAS: 98.0±1.1%
Transfer 1: 99.0±0.3%Transfer 2: 98.4±1.3%
Average survival in Norway to harvest size(Skrudland & Bleie, 2014)

Effects of tank scale on postsmolt production
28.10.2014 22

23
EU AquaExcel WP8: Up-scaling and validity of research results
• Scale is the size of fish containment units, i.e. tanks or cages, and biofilters
• There has been a tremendous increase in size of industrial tanks, cages, and biofilters
• Does the increasing gap in scale affect the relevance of scientific data?
• Information about scaling effects is also useful for industrial tank, bioreactor, unit design
• In AquaExcel we have modelled scale effects, and validated by experiments on sea bass, salmon, and bioreactors
• Effects on the fish (Nofima, SINTEF, NTNU, HCMR) and bioreactor nitrification rate (IMARES, Nofima, WUR)
Photo: Erik Røed
Photo: Nofima
AIW#6
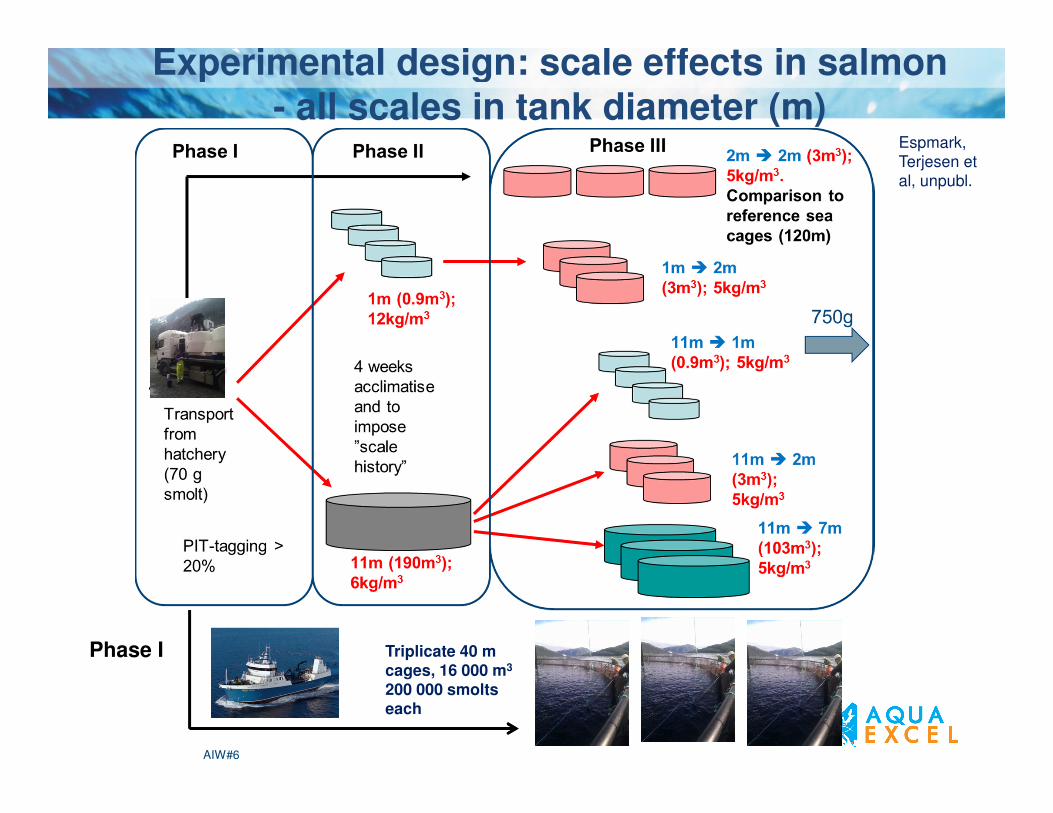
Experimental design: scale effects in salmon- all scales in tank diameter (m)
Espmark, Terjesen et al, unpubl.
Phase I
AIW#6
Triplicate 40 m cages, 16 000 m3
200 000 smoltseach

Material and MethodsVariables that were standardized –between tank scales
Variables that were not standardized – but measured/monitored -tanks
Tank geometry Feed distribution angles Fish genetic & batch origin
Fish genetic & batchorigin
Tank water turnover Feeding time regime adjusted in tanks
Initial fish density Water velocity Feed batch
Feed batch + feedingregime
Water quality parameters (except DO, controlled to 85% sat.)
Temperature adjusted in tanks, according to cage (5to 14ºC)
Light (300-400 lux), and photoperiod (natural)
Photoperiod (natural)
Temperature (5 to 14ºC), oxygen saturation (85% sat.)
Variables that were standardized between cage and tank
AIW#6
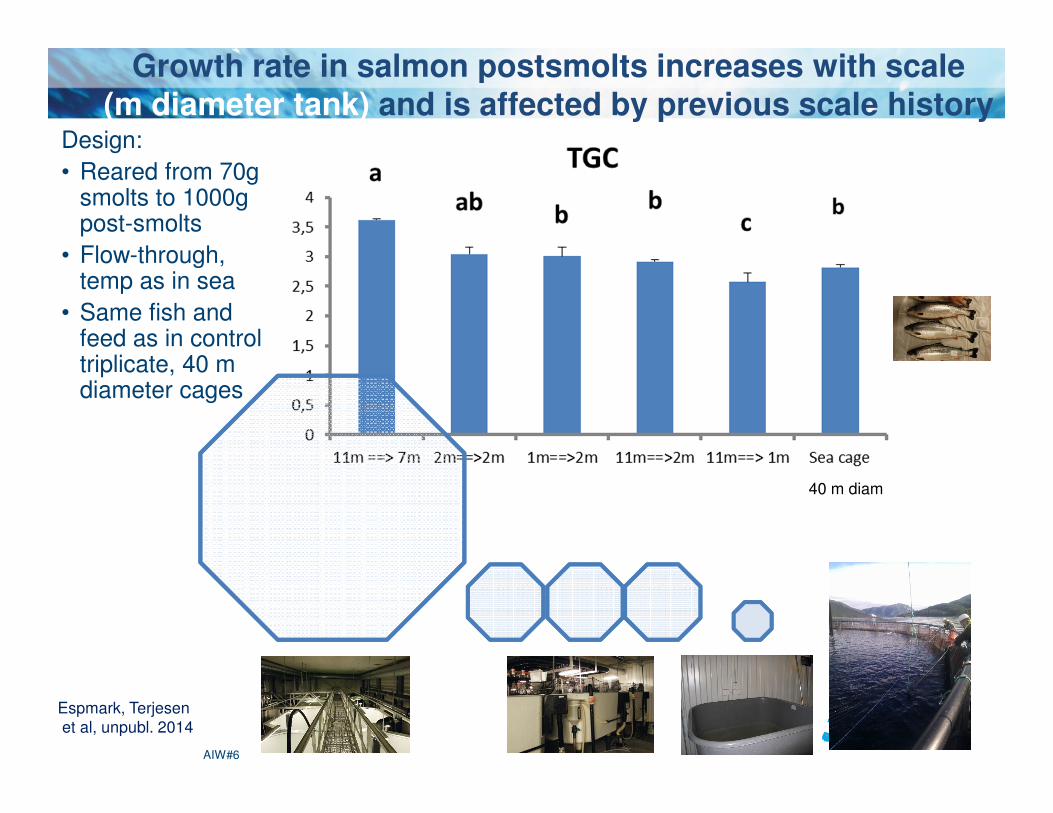
Growth rate in salmon postsmolts increases with scale (m diameter tank) and is affected by previous scale history
Design:• Reared from 70g
smolts to 1000g post-smolts
• Flow-through, temp as in sea
• Same fish and feed as in controltriplicate, 40 m diameter cages
40 m diam
AIW#6
Espmark, Terjesenet al, unpubl. 2014

Research on postsmolt production in floatingsemi-closed containment systems in sea
28.10.2014 27AIW#6

Semi-closed containment systems for postsmolt production, taking water from below the sea lice belt
28.10.2014 28
Photo: Aquafarm Equipment, 21 000 m3, 450 m3/min flow
Preline, 2 000 m3
Photo: Lerøy
AquaDome. Photo: Cermaq, 5 700 m3
HDN Flexibag: 1 600 m3. Photo Smøla KS
AIW#6

OPP exp 5a: Industrial scaleexperiment, semi-closedsystem to 1 kg (Marine Harvest, UNI Research, Nofima)
Photo: Bendik Fyhn Terjesen
Photo: Bjarte Sævareid
Photo: Aquafarm Equipment

28.10.2014 30
Smolt producerSemi-closed tank
Sampling program to 1 kg:Weight, length, condition factor, TGCGill tissue, NKA, plasmaSamples for molecular and histopathology analyses
of skin healthExternal welfare indicators (e.g. fins, cataract, skin)Water quality (temp, CO2, TAN, O2, TSS, etc)Fish health screening (Postsmolt E, NVI)
24
8
Nov Apr June
Photoperiod
1 3 6 mnd0
OPP5a: Industrial scale experiment, postsmolt production in semi-closed system: Design
Reference cages
200 000, 0+ smolt transferred to each treatment 13/10 & 17/11
AIW#6
Calabrese, Handeland, et al, unpubl.

28.10.2014 31
OPP5a: Status experimental fish beforetransfer to semi-closed or reference cages
Date
2/9/
13
16/9
/13
30
/9/1
3
14/1
0/13
28
/10/
13
11/1
1/13
25
/11/
13
Na
+, K
+-A
TP
as
e
acti
vit
y
0
5
10
15
20
0.9
1.0
1.1
1.2
1.3
1.4
NKA activity
Condition factor
transferred to semi-closed24L:0D
Co
nd
itio
n f
acto
r (W
/L3)
17 ppt S
Date
2/9/
13
16/9
/13
30
/9/1
3
14/1
0/13
28
/10/
13
11/1
1/13
25
/11/
13
Bo
dy w
eig
ht
(g in
d-1
)
0
20
40
60
80
100
120
Transferred to semi-closed24L:0D 17 ppt S
Calabrese, Handeland, et al, unpubl.
AIW#6

Date
01.o
kt.1
3
01.d
es.1
3
01.fe
b.14
01.a
pr.14
01.ju
n.14
Tem
pera
ture
(°C
)
0
2
4
6
8
10
12
14
16
18
Ref. cagesSemi-closed
Transfersemi-closed
Transfer reference cages
28.10.2014 32
OPP5a: Industrial scale experiment, postsmolt prod. in semi-closed system: Weight
Comparable weight developmentin semi-closed
Water temperature
Date
1.ok
t.13
1.n
ov.1
3
1.de
s.13
1.
jan.14
1.
feb.
14
1.m
ar.1
4
1.ap
r.14
1.
mai.
14
1.jun
.14
Bod
y w
eigh
t (g
ind-1
)
0
100
200
300
400
500
600
700
800
900
1000
1100
Weight based on feed intake ref. cagesWeight based on feed intake semi-closedWeight sampling semi-closed
Stockingsemi-closedStocking
ref. cages
(Ref. cages based on fed amounts and FCR=1.0)
Calabrese, Handeland, et al, unpubl.
AIW#6

OPP5a: Industrial scaleexperiment, postsmolt prod. in semi-closed system: Growth to 1 kg
1200
1220
1240
1260
1280
1300
Semi-closed, Molnes Reference cages
Heat-sum (Σ°C, to 1 kg)
0
0.5
1
1.5
2
2.5
3
3.5
4
Semi-closed, Molnes Reference cages
Thermal growth coefficient
(TGC) to 1 kg
Calabrese, Handeland, et al, unpubl.
AIW#6

28.10.2014 34
OPP5a: Industrial scale experiment, postsmolt prod. in semi-closedsystem: Survival to 1 kg
�Indicates that postsmolt production to 1 kg in semi-closed systems, has potential for very lowmortality
�However, after thisproject, the fish werekept, and in September experienced toxic algae, and became infected withAGD, amoebic gilldisease
�Marine Harvest thereforeharvested the tank thisSunday
Date
1.ok
t.13
1.
nov.1
3
1.de
s.13
1.
jan.1
4
1.fe
b.14
1.
mar
.14
1.
apr.1
4
1.m
ai.14
1.
jun.1
4
Cum
mul
ativ
e su
rviv
al (
%)
0
5
86
88
90
92
94
96
98
100
Ref. cagesSemi-closed
Transfer,semi-closedTransfer,
referencecages
Semi-closed, Molnes99.2%
Ref. cages, 89.1%
Calabrese, Handeland, et al, unpubl.
AIW#6

0
0.1
0.2
0.3
0.4
0.5
0.6
0.7
0.8
0.9
1
Nu
mb
er
of
fem
ale
ma
ture
lic
e p
er
fish
28.10.2014 35
OPP5a: Industrial scale experiment, postsmolt prod. in semi-closed system: Low, but not zero sea lice
Mature sea lice per postsmolt
Regulated limit
Calabrese, Handeland, et al, unpubl.
AIW#6

OPP5a: Industrial scale experiment, postsmolt prod. in semi-closed system: External welfare scores to 1 kg
Foto: Bendik Fyhn Terjesen
Means ± SD
N=60-80 fish. Each indicator is given a score between 0-2 based oncondition (0=good, 2=bad). Values are given as means±SD
Kolarevic, Terjesen, et al, unpubl.
AIW#6
Cataracts Skin lesions Operculum damage fin damage
Before transfer 0,01±0,12 0,63±0,48 0,01±0,12 0,91±0,37
3 months 0,10±0,34 0,36±0,48 0,02±0,13 0,87±0,42
6 months 0,24±0,45 0,48±0,50 0,01±0,11 0,96±0,25

OPP5a: Industrial scale experiment, postsmolt prod. in semi-closed system:Water quality to 1 kg
Foto: Bendik Fyhn Terjesen
Water sampling Molnes 12.05.14
Sampling location Temp (oC) pH Conductivity (mS/cm) Salinity (ppt) Oxygen (%sat) Turbidity (NTU) CO2 (mg/l)
Inlet 7 8.08 50.7 101 0.39
2m 7.28 7.8 50.8 32.2 82 0.28 4
10m 7 7.89 50.8 32.2 82 0.42 3.5
15m 6.9 7.9 50.9 32.2 83 0.5 3
Kolarevic, Terjesen, et al, unpubl.

Thanks for your attention!Thanks to all contributors in Nofima:Jelena Kolarevic, Trine Ytrestøyl, Harald Takle, Torbjørn Åsgård, Roger Selset, Yuriy Marchenko, Britt Kristin Reiten, Per Brunsvik, and more
And to all in the OPP-consortium:
Ørjan Tveiten, Sara Calabrese, Olav Breck, Cato Lyngøy (formerly MH)Frode Mathisen, Per Magne EriksenSvein Martinsen, Rune Iversen +HDN-consortiumHarald Sveier, Gunnar Steinn GunnarssonSigurd Handeland, Lars Ebbesson, Tom Ole NilsenSigurd StefanssonBjørn Olav Rosseland, Hans Christian Teien Sveinung Fivelstad, Camilla Hosfeld, Kristin Kvamme Åse Åtland, Torstein KristensenAgathe Medhus, Øyvind Vågnes, Kari Norheim, Brit HjeltnesErlend Haugarvoll, Rolv HaugarvollCato Lyngøy (Hauge Akva)
Funded by an industry consortium (Marine Harvest, Grieg, Smøla KS m.fl.)Funded by the Research Council of Norway-Project 217502/E40, “Optimized postsmolt production”(OPP)Associated activities funded by FHF-Project #900816 Postsmolt A, D and EFunded by the European Union, FP7-INFRAAquaExcel: AQUAculture infrastructures for EXCELLence in European Fish Research