no slide title - weber state...
TRANSCRIPT

LITHOSPHERE
BIOSPHERE
Source: After
Christopherson,
2012, p. 13

ECOSYSTEM ESSENTIALS
1. Introduction: the ecosystem concept
2. Green plants: the basis for life
3. Abiotic ecosystem components
4. Biotic ecosystem components
5. Ecosystem stability and succession

WHAT IS AN ECOSYSTEM??
An ecosystem is:
(1) A self-sustaining association
(2) of living plants and animals,
(3) interacting with each other
(4) and their non-living environment.
(See Christopherson 2012 p. 556.)

The ecosystem
concept: biotic
and abiotic
components. Source: Christopherson,
2012, p. 558.
Producers
Consumers
Decomposers
Nutrients

PRIMARY PRODUCERS
(autotrophs)
HERBIVORES
CARNIVORES
Trophic
levels
Basic energy flows in biotic ecosystem
components.
DE
CO
MP
OS
ER
S

A simplified terrestrial food chain.
Source: Christopherson, 2009, p. 623.

A food chain in action.
Source: Christopherson, 2012, p. 571.

PHYTOPLANKTON
Blue green algae
(Dunaliella viridis)
BRINE SHRIMP
(Artemia franciscana)
BRINE FLIES
BIRDS
Simplified energy flows in Great Salt
Lake ecosystem. (After USGS.)
SUN

Bird migration routes
(Pacific flyway)
Great Salt Lake drainage basin. (Source: Salt Lake Tribune.)

‘Black smoker’ at a hydrothermal vent, Juan de
Fuca Ridge, Pacific Ocean. Source: Oregon State University.

Tubeworm colony, Juan de Fuca Ridge, Pacific Ocean.
Source: Oregon State University.

Deep-sea crabs, Juan de Fuca Ridge, Pacific Ocean.
Source: Oregon State University.

Microscope view of stomata in a cactus leaf.
Source: Microscopy UK.

Stomata open Stomata closed
Function of stomata in plant leaves.

Transpiration of water
through stomata generates
water pressure gradient
across the tree.
This draws more water up
from the soil, through the
plant roots and into the trunk
and branches, bringing
dissolved nutrients with it.

WHY ARE GREEN PLANTS GREEN??
Because they contain chlorophyll.
Photosynthesis occurs in the presence of chlorophyll:
6 CO2 + 6 H2O + sunlight C6H12O6 + 6 O2 glucose
Used to make starches

Respiration allows plants to burn sugars for energy:
C6H12O6 + 6 O2 glucose
RESPIRATION
Animals respire, but plants both
photosynthesize and respire.
NET photosynthesis =
total sugars produced by photosynthesis
total sugars burned by respiration
6 CO2 + 6 H2O + energy

Tree rings indicate net photosynthesis

Energy receipt, use, and disposition in the biosphere.
Source: Christopherson, 2012, p. 561.

Net primary productivity: grams of carbon/m2/yr
Estimated net primary productivity.
Source: Christopherson, 2012, p. 562.

Net primary productivity: grams of carbon/m2/yr
Net primary productivity calculated by CASA-
VGPM model. Source: DeLucia Lab, University of Illinois.

NPP
gC/m2/yr
0
500
1000
1500
2000
2500
Tropi
cal r
ain
fore
st
Tropi
cal s
easo
nal f
ores
t
Tempe
rate
eve
rgre
en fo
rest
Tempe
rate
dec
iduo
us fo
rest
Bor
eal f
ores
t
Woo
dlan
d an
d sh
rubl
and
Savan
na
Tempe
rate
gra
ssla
nd
Tundr
a an
d al
pine
regi
on
Des
ert a
nd se
mid
eser
t scr
ub
Extre
me
dese
rt, ro
ck, s
and,
ice
Cul
tivat
ed la
nd
Swam
p an
d m
arsh
Lake
and
stre
am
Ope
n oc
ean
Upw
ellin
g zo
nes
Con
tinen
tal s
helf
Alg
al b
eds a
nd re
efs
Estua
ries
Net primary productivity for various ecosystems.
Source: Christopherson, 2012, p. 563.

WHAT DO YOU NEED FOR A
PLANT TO GROW??
1. Light
2. Heat
3. Water
4. Nutrients

Cold
Hot
Wet
Dry
Relationship
between climate
and ecosystems.
Source: Christopherson, 2012,
p. 564.

Altitudinal
and
latitudinal
zonation.
Source: Christopherson,
2012, p. 565.

Köppen climate classification system.
Source: Christopherson, 2012, p. 258.

Nitrogen delivery to the Gulf of Mexico.
Source: Christopherson, 2012, p. 568.

Nitrogen delivery to the Gulf of Mexico.
Source: Christopherson, 2012, p. 568.

Summer ‘dead zone’
in the Gulf of
Mexico. Source:
Christopherson, 2012, p. 568.

Limiting factors in tree species. Source: Christopherson, 2012, p. 569.
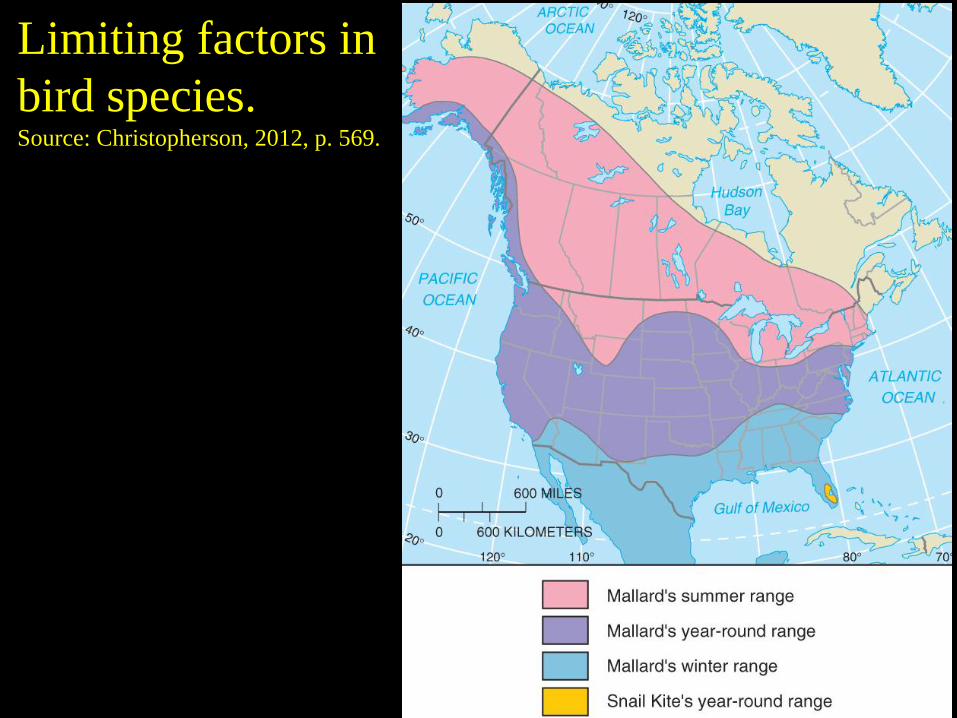
Limiting factors in
bird species.
Source: Christopherson, 2012, p. 569.

PRIMARY PRODUCERS
(autotrophs)
HERBIVORES
CARNIVORES
FOOD CHAIN concept and the 10% rule.
10% energy
10% energy
Ferocious predator
(Gatsby)

Why big, fierce animals are rare: the 10% rule in action. Source: Christopherson, 2009, p. 626.

Why we should all be vegetarians.
Source: Christopherson, 2012, p. 573.

Grazing animals. Source: National Wildlife Federation.

Bioaccumulation
(biological
amplification).
Source: Christopherson, 2009, p. 628.

Antarctic marine food web. Source: Christopherson, 2012, p. 572.

Secondary succession from bare soil to
hardwood forest. Source: California Integrated Waste Management Board.
1-2 years 3-20
years 25-100
years
150+ years
Climatic climax
community

Primary succession, Hawaii. Source: Christopherson, 2009, p. 635.

Secondary succession, Mt. St. Helen’s. Source: Christopherson, 2012, p. 580.

Secondary succession, Mt. St. Helen’s. Source: Christopherson, 2012, p. 580.

Secondary succession, Mt. St. Helen’s. Source: Christopherson, 2012, p. 580.