no. in the japanese market, - nipponexpress.com · nippon express (italia) s.r.l. is established...
TRANSCRIPT

M a r k e t L e a d e r s h i p i n J a pa n
N o . 1 i n T h e J a pa n e s e M a r k e t ,Our Success Story ContinuesV A L U E C R E A T I O N F R O M P E R F O R M A N C E A N D I N N O V A T I O N
ANNUAL REPORT 2008
Year Ended March 31, 2008NIP
PO
N E
XP
RE
SS
CO
., LTD. A
NN
UA
L RE
PO
RT 20
08
By expanding and adding value to its service range, Nippon Express is accelerating its growth from No. 1 in Japan to the global top rank.
Nippon Express began its existence as a transport company connecting rail freight terminals
and customers on October 1, 1937. For seven decades, it has supported Japan’s economic
development through high-quality logistics services. During that time, it has grown into
Japan’s largest group of logistics enterprises, offering transport services across land, sea and
air. In addition to high-quality shipping, Nippon Express offers many value-added services
that have earned the trust of our customers. These include third-party logistics (3PL) to meet
a broad range of logistics needs including warehouse services, security transport services
to carry cash and valuables safely, and heavy haulage and construction, which is a set of
services ranging from transportation to installation of plant equipment and more.
Our business scope extends far beyond Japan. From our network of 381 bases in 37
countries, we are actively developing our international forwarding and intra-area logistics
businesses. As a global logistics enterprise deriving nearly 30% of sales from overseas
business, Nippon Express is determined to capture new logistics demand worldwide and
achieve large-scale, sustainable growth.
CONTENTS
FINANCIAL HIGHLIGHTS
INTERVIEW WITH THE PRESIDENT
SPECIAL TOPICS
1: OUR GLOBAL BUSINESS
2: 3PL BUSINESS
3: DOMESTIC BUSINESS
DIFFERENTIATION
4: INTEGRATION OF THE PARCEL
DELIVERY BUSINESS
REVIEW OF OPERATIONS
THE AMERICAS
EUROPE
ASIA & OCEANIA
CSR & CORPORATE PHILOSOPHY
CORPORATE GOVERNANCE
CRISIS MANAGEMENT, COMPLIANCE &
PERSONAL INFORMATION PROTECTION
DIRECTORS, OFFICERS &
CORPORATE AUDITORS
ENVIRONMENTAL &
SOCIAL CONTRIBUTIONS
FINANCIAL SECTION
GLOBAL NETWORK
COMPANY INFORMATION
SHARE INFORMATION
2
4
10
12
14
16
18
20
22
26
27
28
29
30
33
56
60
61
日通英文AR_表紙観音.indd 1 08.9.12 2:36:36 PM
(2,1) -1- 日通英文AR_表紙観音.indd 08.9.12 2:36:50 PM(2,1) -1- 日通英文AR_表紙観音.indd 08.9.12 2:36:50 PM

M a r k e t L e a d e r s h i p i n J a pa n
N o . 1 i n T h e J a pa n e s e M a r k e t ,Our Success Story ContinuesV A L U E C R E A T I O N F R O M P E R F O R M A N C E A N D I N N O V A T I O N
ANNUAL REPORT 2008
Year Ended March 31, 2008NIP
PO
N E
XP
RE
SS
CO
., LTD. A
NN
UA
L RE
PO
RT 20
08
By expanding and adding value to its service range, Nippon Express is accelerating its growth from No. 1 in Japan to the global top rank.
Nippon Express began its existence as a transport company connecting rail freight terminals
and customers on October 1, 1937. For seven decades, it has supported Japan’s economic
development through high-quality logistics services. During that time, it has grown into
Japan’s largest group of logistics enterprises, offering transport services across land, sea and
air. In addition to high-quality shipping, Nippon Express offers many value-added services
that have earned the trust of our customers. These include third-party logistics (3PL) to meet
a broad range of logistics needs including warehouse services, security transport services
to carry cash and valuables safely, and heavy haulage and construction, which is a set of
services ranging from transportation to installation of plant equipment and more.
Our business scope extends far beyond Japan. From our network of 381 bases in 37
countries, we are actively developing our international forwarding and intra-area logistics
businesses. As a global logistics enterprise deriving nearly 30% of sales from overseas
business, Nippon Express is determined to capture new logistics demand worldwide and
achieve large-scale, sustainable growth.
CONTENTS
FINANCIAL HIGHLIGHTS
INTERVIEW WITH THE PRESIDENT
SPECIAL TOPICS
1: OUR GLOBAL BUSINESS
2: 3PL BUSINESS
3: DOMESTIC BUSINESS
DIFFERENTIATION
4: INTEGRATION OF THE PARCEL
DELIVERY BUSINESS
REVIEW OF OPERATIONS
THE AMERICAS
EUROPE
ASIA & OCEANIA
CSR & CORPORATE PHILOSOPHY
CORPORATE GOVERNANCE
CRISIS MANAGEMENT, COMPLIANCE &
PERSONAL INFORMATION PROTECTION
DIRECTORS, OFFICERS &
CORPORATE AUDITORS
ENVIRONMENTAL &
SOCIAL CONTRIBUTIONS
FINANCIAL SECTION
GLOBAL NETWORK
COMPANY INFORMATION
SHARE INFORMATION
2
4
10
12
14
16
18
20
22
26
27
28
29
30
33
56
60
61
日通英文AR_表紙観音.indd 1 08.9.12 2:36:36 PM08.9.12 2:36:36 PM
(2,2) -1- 日通英文AR_表紙観音.indd 08.9.12 2:36:50 PM(2,2) -1- 日通英文AR_表紙観音.indd 08.9.12 2:36:50 PM

200770th anniversary of the founding of Nippon Express
Nippon Express (India) Private Limited, Nippon Express Russia LLC and Nippon Express (Middle East) L.L.C. are established
Acquisition adds ocean cargo division to Nippon Express (Taiwan) Co., Ltd.
200850th anniversary of Nippon Express’ fi rst venture into overseas markets
1937Nippon Express Company, Ltd., is established
1941–45Nippon Express consolidates Japan's small transportation companies, and begins its modern-day operations
1872Riku-un Moto Kaisha is founded
1875Company name changes to Naikoku Tsu-un Kabushiki Kaisha
1928Begins operations under the name of Kokusai Tsu-un Kabushiki Kaisha
1958A representative offi ce opens in New York
The Transport History Archives (currently Museum of Logistics) is established
1962Nippon Express U.S.A., Inc., is established
1981Nippon Express (U.K.) Ltd., and Nippon Express (Deutschland) GmbH are established
1984Nippon Express Tours (Europe) Ltd. and Nippon Express (Malaysia) Sdn. Bhd. are established
1983Nippon Express (Belgium) N.V./S.A. and Nippon Express Canada Ltd. are established
1992More than 200 bases outside Japan
2001Number of overseas employees exceeds 10,000
1994Shanghai Express International Co., Ltd. and Nippon Express (Shenzhen) Co., Ltd., are established
1995Nippon Express Philippines Corporation is established
1996Representative offi ces open in Hanoi and Ho Chi Minh City
The offi ce in Johannesburg reopensShares at time of founding
Early head offi ce in Nihonbashi-Muromachi
Transportation when horse-drawn carriages were used because of fuel shortages
1950Nippon Express goes public and is reestablished as a private company
1990Nippon Express (New Zealand) Ltd., is established
1970Representative offi ces open in Singapore, Honolulu and London
1985Nippon Express (Australia) Pty., Ltd., Nippon Express France, S.A., and Nippon Express Travel U.S.A., Inc. are established
1973Nippon Express (Singapore) Pte. Ltd., is established
1977Nippon Express (Nederland) B.V. is established
1966Representative offi ces open in Dusseldorf, Amsterdam and Rome
1967Representative offi ces open in Taipei and Sydney
1968Representative offi ces open in Paris and Bangkok
1963Representative offi ce opens in Seoul
1978Nippon Express Hawaii, Inc., is established
1979Nippon Express (H.K.) Co., Ltd. and Nippon Express do Brasil Ltda., are established
1986Nippon Express (Italia) S.R.L. is established
1987Nippon Express (Schweiz) AG is established
1988Nippon Express de Espana, S.A. is established
1989Nippon Express (Thailand) Co., Ltd., is established
1997Nippon Express (Zhuhai) Co., Ltd., Chile S.A. and P.T. Nittsu Lemo Indonesia Logistik are established
1998Representative offi ce opens in Budapest
1999Number of overseas employees exceeds 8,000
2006Nippon Express (St. Petersburg) LLC established
Nippon Express’ safety symbol, created to mark the company’s 70th anniversary
Befo re 1950 1950s 1960s 1970s 1980s 1990s 2000s
ESTABLISHMENT AND OVERSEAS EXPANSION
NOTABLE ASSIGNMENTS IN OUR HISTORY
BUSINESS EVOLUTION AND ENVIRONMENTAL ACTIVITIES
1999Transports the Liberty Leading the People
1970Performs services for the Inter-national Exposition in Osaka
1985Performs services for International Exposition in Tsukuba, Japan
1998Transports the Statue of Liberty scale model from Paris
Museum of Logistics opens
2000Carries out moving work in accordance with the reorganization of government ministries and agencies
2002Carried out transportation work related to the hosting of the FIFA World Cup soccer tournament
1972Performs services for the Winter Olympics in Sapporo
1974Transports the Mona Lisa
1964Performs services for the Olympic Games in Tokyo
Transports the Venus de Milo
1951Transports antiques for Ancient Art of Japan Exhibition for the fi rst time, begins art transport operation
1990Performs services for Flower and Greenery Exposition
1991Nippon Express moves Tokyo Metropolitan Government Offi ce
1982Transports Moai statues from Easter Island
2005Performed services for The 2005 World Exposition Aichi, Japan
2006Transported the giant mural “The Myth of Tomorrow,”painted by Taro Okamoto
1949Nippon Express fully enters the marine transport business
1951Begins experimental operation of Nittsu-style container transport
1955Begins travel services and domestic air freight forwarding
1957Start of international air freight combination
1965Establishes Security Transport Business Division
1981The name Simple Pelican Box is changed to Pelican
1982The Pelican service extended to overseas destinations
1983Pelican services for golfers and skiers begin
1984VAN system begins operation
1986Chakubarai Pelican service (COD service) begins
1987Daibiki Pelican service (another class of COD service) begins
1989Cool Pelican service begins
1997Recyclable moving/packing materials are developed
Global distribution information system “N-SHATLE” is developed
“Pro Konpo” service is launched
The Eco-Business Division is established
2005New Pelican Delivery Time Frame Specifi cation service begins
20th anniversary of the Nittsu Family Concert
2006Eco-Recycle Express and Eco-Recycle Box sale launched
“Ecology Konpo” service receives Eco Products Award, the Minister’s Award from the Ministry of Land, Infrastructure and Transport
1993Reusable moving materials are developed
1996Full operation of integrated clerical work pro-cessing system begins
A moving operation using containersDai-ichi Kongo Maru
2000The fi rst Environmental report is issued
Cool Pelican service (chilled transportation) is launched
1971Marine transport route connecting Tokyo and Tomakomai, Hokkaido, is opened
Begins operation using 10-foot, fi ve-ton containers
1977The Simple Pelican Box service is launched
1964Freighter Dai-ichi Ten-nichi Maru connecting Tokyo and Muroran starts operation
Begins marine transport operations using three-ton containers
2003“Ecology Konpo” home removal product launched
The Compliance Department is established
1991The corporate committee is established to ad-dress environmental issues
Super Pelican service is launched
The REWARDS inventory management system begins operation
1992Electric vehicles are introduced
2002Number of low-pollution vehicles introduced exceeded 1,000
2004New IT system commences operation
CSR report 2007
A H i s tory of S us ta i n e d G r ow t h a n d
1978Performs services for transferring New Tokyo International Airport to Narita
日通英文AR_表紙観音.indd 2 08.9.12 2:37:35 PM
(1,1) -2- 日通英文AR_表紙観音.indd 08.9.12 2:37:36 PM(1,1) -2- 日通英文AR_表紙観音.indd 08.9.12 2:37:36 PM

S t e a dy E x pan s io n Ov e r s e as
NIPPON EXPRESS GROUP BUSINESS SITES (As of March 31, 2008)
Countries
Cities
Offices and warehouses
Subsidiaries and affiliates of the Nippon Express Group in Japan and overseas
TOTAL
Overseas
Domestic
29268
360
The Nippon Express Group comprises Nippon Express and 292 subsidiary companies (among these are 267 consolidated subsidiaries and 1 equity-method subsidiary) plus 67 affiliates (of which 21 are equity-method affiliates).
MARKET SHARES IN JAPAN (Market shares announced by JAFA, JR FREIGHT and MLIT as of March 31, 2008.)
21.025.743.038.9
%
%
%
%
Nippon Express is Asia’s No. 1 air freight forwarder and No. 2 in the world. It is now expanding its business by carrying out not only shipments to and from Japan but also trilateral shipping, such as from points in China and Asia to destinations in Europe and Americas, taking advantage of a network spanning 37 countries.
Nippon Express offers added-value products, such as BSP (special correspondence transport) and personal information courier services, as well as high speed logistics services, particularly for business-to-business freight.
With the growing interest in implementing a “modal shift”—a move to limit global warming by switching to rail and sea transport instead of trucks—Nippon Express is using its comprehensive capacity for departure and arrival services to promote the shipping of large containers by rail.
Demand for third-party logistics (3PL) services, in which a logistics business takes over every aspect of delivery, storage and sorting by destination, has grown steadily in recent years. Nippon Express is responding to this great demand by actively building conveniently located warehouses around large urban areas.
Warehouse business, encompassing 21 group companies
International air freight
Domestic air freight
Railway transport
37210381
1

1,500,000
1,000,000
500,000
2,000,000
0’08’04 ’05 ’06 ’07
400,000
200,000
600,000
0’08’04 ’05 ’06 ’07
40,000
20,000
60,000
0’08’04 ’05 ’06 ’07
1,000,000
500,000
1,500,000
0’08’04 ’05 ’06 ’07
30,000
20,000
10,000
40,000
0’08’04 ’05 ’06 ’07
30
20
10
40
0’08’04 ’05 ’06 ’07
Total assetsTotal net assets Net income per share
FINANCIAL HIGHLIGHTS
(¥ million) (¥ million) (¥)
Revenues Operating income Net income
(¥ million) (¥ million) (¥ million)
Millions of yenThousands of U.S. dollars*1
2008 2007 2006 2008
For the year: Revenues ¥1,901,433 ¥1,866,267 ¥1,793,925 $18,978,280
Revenues by geographic segment*2
Distribution & transportation 1,597,284 1,580,546 1,522,325 15,942,554
Goods sales 291,923 279,080 266,908 2,913,702
Other 12,225 6,640 4,690 122,025
Revenues by industry segment*2
Japan 1,682,699 1,666,887 1,631,402 16,795,087
The Americas 48,009 45,126 38,495 479,182
Europe 69,146 59,422 49,333 690,155
Asia & Oceania 101,578 94,831 74,693 1,013,857
Operating income 48,502 50,325 43,187 484,100
Net income 36,439 33,208 18,663 363,701
At year-end: Total net assets*3 520,823 517,516 488,205 5,198,353
Total assets 1,297,406 1,360,694 1,315,599 12,949,462
Per share: Net income 34.94 31.84 17.71 0.35 (Yen, U.S. dollars) Dividend 10.00 8.00 8.00 1.00
*1 U.S. dollar amounts presented in financial statements are included solely for convenience. The rate of US$1.00 = ¥100.19 prevailing on March 31, 2008, has been used for translation into U.S. dollar amounts. Amounts less than one thousand U.S. dollars are rounded off in thousands.
*2 The above figures for revenues by industry segment and by geographic segment do not include internal revenues or money transfers between the segments.*3 The calculation of net assets is carried out by applying the Accounting Standards for Description of Net Assets in the Balance Sheet (Accounting Standards Board of Japan, “Accounting Standards
for Business Enterprises, No. 5” dated December 9, 2005) and the Application Guidelines for Accounting Standards and Others for Description of Net Assets in the Balance Sheet (Accounting Standards Board of Japan, “Application Guideline for Accounting Standards for Business Enterprises, No. 8” dated December 9, 2005) from the year ended March 31, 2007.
2

TOTAL
1,901,433(¥ million)
Goods sales
15.4%
Distribution & transportation
84.0%
Other0.6%
The Americas 2.5%
Asia & Oceania
5.4%Europe 3.6%
Japan
88.5%
TOTAL
1,901,433(¥ million)
TOTAL
1,312,125(¥ million)
Railway utilization transportation
7.4%
Motor transportation
40.1%
Heavy haulage & construction
3.9%
Air freight forwarding
15.8%
Other transportation 16.2%
Warehousing
5.7%Marine & harbor transportation
10.9%
Revenues by industry segment (Consolidated)
Revenues by geographic segment (Consolidated)
Revenues by operation (Non-consolidated)
3

Masanori KawaiPresident, Chief Executive Officer
4

INTERVIEW WITH THE PRESIDENT
Looking at the global economic environment, although fears of a slowdown in the U.S. economy
grew due to the subprime loan crisis and there was stagnation in some sectors, capital investment
remained strong in many regions overseas, particularly in the emerging economies. My impression is
that the situation was generally healthy overall.
In the field of logistics, in which the Company operates, demand for international freight continued
to increase. However, there was a slump in exports by air of flat-screen televisions and other electrical
products and electronic components from Japan to North America, to a large extent resulting from
the slowdown in the U.S. economy. The slump was particularly pronounced in the fourth quarter, so I
am concerned about how the market conditions will develop following the year under review.
Meanwhile, the business environment remained harsh in the Japanese market, with a study by the
Nippon Express Group’s Nittsu Research Institute and Consulting, Inc. showing that overall transportation
volumes have declined for eight consecutive years. In addition, costs increased due to a sharp rise in fuel
expenses, and there was a temporary stagnation in construction-related demand due to the amendment
of the Building Standard Law. Regarding our accounting, there was also an increase in depreciation as a
result of a tax system revision. All in all, it was an extremely challenging year for the Company.
In this environment, we pushed ahead with our medium-term business plan, the Three-year
Power Up Plan, and in our overseas business operations we achieved results largely according to
plan. Domestically, we continued to focus our efforts on the third-party logistics (3PL) business
and security transport business, and were rewarded with growth in both areas. We also performed
strongly in trade incidental to logistics.
As a result, in fiscal 2008, despite the challenging market environment, we were able to achieve
record levels in revenues and net income, with revenues of ¥1,901.4 billion (a year-on-year increase
of 1.9%), operating income of ¥48.5 billion (a 3.6% decrease), ordinary income of ¥55.9 billion (a 2.6%
decrease) and net income of ¥36.4 billion (a 9.7% increase).
First, how do you view the business environment and the Company’s business performance in fiscal 2008?
Question 1
Growing Stronger on All Fronts
Dear shareholders, the Nippon Express Group is currently moving ahead with the
Three-year Power Up Plan, which aims at expanding and strengthening the Group’s
business operations under the slogan “Challenging New Horizons in Innovation with Our
Customers.” The year ended March 31, 2008 (fiscal 2008) was the second year of this
plan. To build on the record levels in revenues and net income that we achieved in the
previous fiscal year, we introduced a number of new initiatives on the sales side and
implemented a range of policies to strengthen our management structure. As a result, in
fiscal 2008, the Company once again achieved record levels in revenues and net income.
5

The Three-year Power Up Plan is our medium-term business plan, and is based on the theme of
“stepping up in size, building a strong Nippon Express Group, and expecting a great leap forward.”
We launched the plan in fiscal 2007. Our targets for fiscal 2009, the final year of the plan, are
revenues of ¥2.0 trillion, operating income of ¥54.5 billion, ordinary income of ¥60.0 billion and
net income of ¥35.3 billion. I believe that we are making good progress toward these targets.
Our overseas business operations are a key area of focus. The Americas, Europe, Asia and Oceania
all performed strongly and the ratio of overseas business revenues to total consolidated revenues
rose 0.2 percentage points from the previous year to 28.4%. Overseas, while the forwarding business
has become central, we also saw strong growth in intra-regional logistics in each region, and we are
building a more robust business structure that does not depend only on forwarding.
Looking at Asia, we opened a large-scale logistics center for automobile parts in southern
China, and strengthened our delivery system for all of China. In this market, the demand for
delivery of automobile parts is increasing every year, so I believe this business will be a major
strength for the Company going forward.
We have also set up large new distribution bases in Chicago and Los Angeles in the United
States, and in the Czech Republic and Poland in Europe, and are preparing for the expansion of
intra-regional logistics.
Furthermore, we have steadily built up a presence in emerging economies. In India, we
quickly built a business foundation through our acquisition of a local logistics company in
April 2007. In Russia, we strengthened our business structure by establishing Nippon Express
(Russia), and in the Middle East, we made our first moves into the growth market of the United
Arab Emirates with the establishment of Nippon Express (Middle East).
Regarding our 3PL business, over the course of the year we increased our overall warehouse
facility floor area in Japan by 100,000m2. As 3PL provides comprehensive logistics services,
distribution bases are absolutely essential as a starting point. Therefore, over the last two years,
we have concentrated our investment into warehouses. We have completed construction of a
number of warehouses and put them into operation, resulting in growth in revenues.
In the past few years, an increasing number of our customers have expressed a desire to
shift to concentrated management that consolidates dispersed warehouses into one location.
For this reason, I believe that our continued investment in warehouses will lead to steady
expansion of the 3PL business.
In Japan, we have been focusing on businesses that enable us to differentiate ourselves
from competitors. Our popular services include our CSD (cash safety delivery) security
transport service for which we have acquired a business model patent, and our Ecology Konpo
service, which is helping to reduce the environmental impact of the moving service segment.
The heavy haulage and construction business and railway transport business, both of which
are areas of strength for us, are also expanding strongly.
It should be noted that the decreases in operating income and ordinary income were due to
a ¥3.4 billion increase in depreciation costs resulting from the revision of the tax system, and a
¥2.7 billion increase in costs brought by the sharp rise in fuel expenses. If these special costs
are factored out, we achieved an increase in both operating income and ordinary income.
The year under review was the second year of the Three-year Power Up Plan. Please tell us about the Company’s progress under this plan.
Question 2
In October 2007, we reached a basic agreement with Japan Post regarding the integration of our parcel
delivery businesses, and on April 25, 2008 we officially concluded a basic agreement on integration.
On June 2, 2008, we established a new company called JP Express Co., Ltd., which will play a central
role in advancing the various procedures required to complete the integration. We plan to study
matters such as equity capital and the delivery network in detail, conclude a contract between the
shareholders of the two companies by the end of August, and launch the business in April 2009.
In the parcel delivery business, Nippon Express has announced business integration with Japan Post. What does this integration entail?
Question 3
INTERVIEW WITH THE PRESIDENT
6

The parcel delivery business has the same character as the process industry in that the
more cargo there is, the more efficient it becomes. Combining our Pelican Express service with
Japan Post Service’s Yu-Pack nearly doubles the size of the business, so there is no doubt that
we can achieve greater efficiency than in the past.
However, there will be no gains if the number of staff and facilities also doubles. Most of the
employees involved in Nippon Express’ parcel delivery business will be transferred to the new
company, where they will be joined by some staff from Japan Post Service. Basically, we will
seek to generate synergy effects by using the information systems, large-scale terminal bases
and other assets of Nippon Express together with the Japan Post Group’s extensive nationwide
collection and delivery network.
We are now preparing for the full-scale launch of a competitive, high-quality parcel delivery
business in April 2009.
Our forecasts for the year ending March 31, 2009, which we have already announced, are
revenues of ¥1,945.0 billion (a year-on-year increase of 2.3%), operating income of ¥52.0 billion
(a 7.2% increase), ordinary income of ¥58.0 billion (a 3.6% increase) and net income of ¥32.3
billion (a 11.4% decrease).
These figures fall slightly short of the targets in the medium-term business plan. However, if
we factor out the impact of changes to the business environment that were unforeseen at the
time of the plan’s establishment, then in fact they are very close to the plan’s targets. I believe
that the integration of the parcel delivery business will have no direct impact on our results for
the year ending March 31, 2009.
Looking at the forecast for each business and starting with the overseas businesses,
although U.S. imports have slumped since the beginning of 2008, intra-regional logistics are
performing well. Moreover, exports from the United States are expected to increase due to the
depreciation of the dollar.
In Europe, growth is highly likely to continue, particularly in Eastern Europe and Russia, and
our business operations in the United Kingdom, which struggled in the first half of fiscal 2008,
recovered in the second half of the year. We expect to see continued expansion in Asia as well,
mainly in emerging economies, and in the fourth quarter we plan to change Nippon Express
(China) from an equity-method affiliate to a consolidated subsidiary.
Areas of concern are the cost increases caused by the sharp rise in fuel expenses and
the many areas of uncertainty regarding the economic trends and consumption trends in the
Japanese domestic economy. However, we will continue our efforts to improve our business
performance through the 3PL business and products that differentiate us from competitors.
What are your forecasts for the year ending March 31, 2009?Question 4
In the medium to long term, I intend to build a powerful management structure that can reliably
generate profits even as competition intensifies, particularly in the domestic business. Having
spun off the B to C and C to C parcel delivery businesses to the new company, JP Express,
we will in the future restructure our domestic business to focus on B to B. I intend to further
streamline the parcel delivery business and strengthen its management structure through the
process of this reorganization.
Meanwhile, the market in which we can expect high growth is the overseas market. We are
currently focusing our energies on intra-regional logistics, an area with near-limitless potential
for expansion. The Company is generating revenues of approximately ¥1.0 trillion through its
transportation operations in Japan alone, but we can continue to grow if we utilize our logistics
expertise to expand our business in the United States and China, countries with many times the land
area and population of Japan. When we do this, the business must be operated by local people for
local customers. One of the major challenges we face in striving to become a truly global company
Please tell us about the medium- to long-term prospects after the next fiscal year?Question 5
7

October 2007 was the 70th anniversary of the founding of Nippon Express. To commemorate
this milestone and thank our shareholders for their support, we increased both the mid-term
dividend and the year-end dividend for fiscal 2008 by ¥1 per share from the normal ¥4 per
share, resulting in a dividend of ¥10 per share for the full year. Going forward, our basic policy
will be to pay ¥10 as a normal dividend annually, and continue to strengthen our financial
situation while also rewarding our shareholders for their support.
The logistics business is not the kind of business that produces huge profits quickly.
However, it is essential to society and will generate profits reliably if managed soundly. We
are currently continuing our initiatives to aggressively expand our business both domestically
and overseas, and we will use the extra profits to increase returns to shareholders. We wish to
assure our shareholders and investors that we are a corporate group that will realize stable and
sustainable growth, and look forward to their continuing support in the future.
(Interviewed in June 2008)
Please tell us about your policy for returning profits to shareholders and investors.Question 7
09/3(Forecast)
06/3 07/3 08/30
30
20
10
40
(¥ billion)
Consolidated net income
Dividend payout ratio (Consolidated)
0
30
60
90
120
(%)
Non-consolidated net income
Dividend payout ratio (Non-consolidated)
Dividend development
INTERVIEW WITH THE PRESIDENT
Masanori KawaiPresident, Chief Executive Officer
We will not necessarily reject an acquisition if it increases the corporate value of the Nippon
Express Group and therefore improves the true value for our shareholders. However, as we
believe that a certain amount of time is needed to sufficiently examine the details of a bid and
reach a conclusion, we introduced a prior warning-type counterplan against acquisition.
Currently, the Company is moving ahead with a variety of reforms to realize sustainable
growth and increase shareholder value. For example, we are integrating our parcel delivery
business with the Japan Post Service. We think that the common interests of shareholders
would be harmed if these major changes, which are already under way, were to be hindered by
a bidder with another objective.
Under the counterplan, if a bidder attempts to acquire more than 20% of the Company’s
shares, the Company will request submission of the required information, after which
an independent committee
comprised of members from
outside the Company judges
the content of the information,
and the Board of Directors
passes a resolution on the
matter. Furthermore, having
considered the time that will
be needed until our current
reform init iat ives produce
results, we have stipulated a
period of three years.
The June 2008 General Shareholders’ Meeting approved the introduction of a counterplan against acquisition. What are the reasons for the introduction of this plan?
Question 6
Yes
Bidder
Intention statement, required information
Non-compliance procedureNon-complianceperiod
No
Apply the counterplan(Resolution by the Board meeting)
NOT to apply the counterplan(Resolution by the Board meeting)
Recommendation to apply the counterplan by the committee
Recommendation NOT to apply the counterplan by the committee
Follow the opinionsFollow the opinions
• Review period by the Board members (60 days or 90 days)
• Judge, form opinions and pursue alternatives by the Board members
• Review by independent committee
Prior warning-type, independent committee-type defense measure
is human resources. However, we will overcome this problem by building each national and regional
base of Nippon Express into a major logistics company, and connect our worldwide logistics
services. This is my vision of the kind of company the Nippon Express Group will be in the future.
8

Going Further Every Minute of Every Day
SPECIAL TOPICS
10
14
16
12
OUR GLOBAL BUSINESS
Spe c i a l Topic 1
DOMESTIC BUSINESS DIFFERENTIATION
Spe c i a l Topic 3
INTEGRATION OF THE PARCEL DELIVERY BUSINESS
Spe c i a l Topic 4
3PL BUSINESS
Spe c i a l Topic 2
9

2006 ranking by the International Air Transport Association (IATA)Nippon Express was listed 2nd among air forwarders worldwide and 1st among air forwarders in the Asia-Pacific region in 2006.
08/305/3 06/3 07/30
300
250
200
150
100
50
350
0
5
10
15
20
25
30
35
(%)(¥ billion)
Revenues from overseas businesses To and from JapanRatio of overseas revenues to consolidated total revenues
G LOBA L I ZAT ION
Spe c i a l Topic 1 OUR GLOBAL BUSINESS
Revenues related to freight to and from Japan (Non-consolidated), and overseas revenues and its ratio to consolidated total revenues
Starting with the opening of a New York representative office in
1958, Nippon Express Co., Ltd. has continued to develop its busi-
ness outside Japan, expanding in Europe during the 1970s and Asia since
the 1980s. Today, with 381 bases in 210 cities in 37 countries (as of the
end of March 2008), we rank as one of the world’s most prominent global
logistics enterprises. Our global business during the year ended March 31,
2008 accounted for 28.4% of our consolidated revenues (the total of non-
consolidated overseas-related revenues and overseas segment-specific
sales for the Americas, Europe and Asia & Oceania).
As the pace of globalization in the world economy becomes increasingly
rapid, Nippon Express is taking advantage of its comprehensive overseas network
to enhance its competitiveness and actively expand into newly industrializing
nations to further expand its global business, which is a crucial growth strategy.
In our forwarding business, which is the heart of our global business,
Nippon Express has forged alliances with other strong enterprises to
* The numbers in the circles show Nippon Express’ ranking in each country. Circle sizes denote the amount of freight handling charges paid to airlines.
TAPA certification acquired by: Nippon Express U.S.A. Inc.: New York Air Cargo Branch, Chicago Air Cargo Branch, Atlanta Branch, San Francisco Air and Ocean Cargo Branches, Boston Branch / Nippon Express (U.K.) Ltd.: Head Office (London) / Nippon Express de Espana, S.A.: Barcelona Branch / Nippon Express France, S.A.: Charles de Gaulle Airport Cargo Zone Warehouse / Nippon Express (Italia) S.R.L.: Head Office (Milan) / Nippon Express (Deutschland) GMBH: Frankfurt Branch / Nippon Express (Singapore) Pte. Ltd.: Head Office / Nippon Express (Philippines) Corporation: Manila Air Cargo Branch / Nippon Express (Malaysia) Sdn, Bhd.: KLIA Air Cargo Office, Penang Branch / P.T. Nippon Express Indonesia: Logistics Center / NEX Global Logistics Korea Co., Ltd.: Shihwa Warehouse / Nippon Express Co., Ltd.: Narita International Airport, Kansai International Airport C-TPAT acquired by: Nippon Express U.S.A. Inc. AEO (Authorized Economic Operator) certification acquired by: Nippon Express Co., Ltd., Nippon Express (Nederland) B.V.
6
9 1
7 2 1
10
12
20
22 9
45
18 19
U.S.A.
MEXICO
SPAIN
FRANCE
U.K.
BRAZIL
BELGIUM
NETHERLANDS
GERMANY
THAILAND
SINGAPORE
MALAYSIA
PHILIPPINES
HONG KONG
INDONESIA
10

Cross-border shipping
Intra-area milk run
JIT delivery
Air
Sea
Vendor A
Country A vendor
Country B vendor
Production
Distribution
Country C vendor
Vendor B Vendor C
Land LOGISTICSCENTER
Major logistics centers opened
Chicago
Los Angeles
Pilsen (CZECH REPUBLIC)
Torun (POLAND)
Moscow (RUSSIA)
Singapore
Guangzhou
Hanoi
Jan. 2008
Nov. 2009
Jan. 2006
Nov. 2008
Jan. 2009
Dec. 2006
Mar. 2008
Dec. 2008
14,400m2
8,230m2
16,000m2
15,700m2
24,000m2
27,600m2
16,600m2
10,000m2
Expansion of intra-regional logistics business
rapidly and effectively step up competitiveness. As a result, in September
2007 we established CNJ World Logistics Co., Ltd., a partnership with
China Shipping, one of the leading Chinese marine transport lines. This
has enabled us to offer fares competitive enough to win global bids and
secure a stable volume of shipping space.
To boost our air freight business, in April 2008 we joined forces with
All Nippon Airways Co., Ltd. (ANA) and Kintetsu World Express Inc. to form
All Express Corporation (ALLEX), which began doing business in July. As
the client demands placed on Asian supply chains have become more
advanced in recent years, the new company has begun business in the
sale of express products from Japan to Hong Kong and Shanghai. However,
this is only a start. The company will expand its service area once ANA
starts using Okinawa’s Naha Airport as a hub in the autumn of 2009.
On top of strengthening international forwarding, Nippon Express has
worked to expand intra-regional logistics outside Japan in recent years.
For example, in April 2007 we began regular operation of a shuttle truck service
between Chicago, U.S.A. and Toronto, Canada, followed in May 2008 by a similar
connection between Laredo (Texas), U.S.A. and Monterrey, Mexico. In Asia, regu-
lar combined freight round-trip truck delivery services connecting the north, east
and south of China commenced in September 2007, while April 2008 saw the
start of truck freight services between Hanoi, Vietnam and Bangkok, Thailand.
In addition, we have actively worked to acquire authorizations that will
further expand our business. As a result, in April 2008 Nippon Express
(Nederland) B.V. became the first Japanese enterprise to become an
Authorized Economic Operator (AEO), giving us favorable tariff treatment.
Prior to this, in January 2008, we gained the equivalent of AEO status in Japan.
Finally, we have been working towards certification under the standards of
the Transported Asset Protection Association (TAPA), which evaluates logis-
tics facility security and safety. In August 2007, Nippon Express (Singapore)
Pte. Ltd. won the 18th TAPA certification for the Nippon Express Group.
The Americas
Europe
Asia & Oceania
11

LOGIST IC S
08/305/3 06/3 07/30
60
40
20
80
(¥ billion)
Warehousing Safe storage (additional business)Investment in facilities
Spe c i a l Topic 2 3PL BUSINESS
Revenues relating to warehousing business (Non-consolidated) and investment in facilities (In preparation for the expansion of the 3PL business)
As corporate customers, for instance in the manufacturing
and sales industries, focus on their core businesses to
promote efficiency, and as supply chain management grows more
advanced and sophisticated, more companies are finding a need for
third-party logistics (3PL) so they can hand their shipping operations
over to an outside provider. A high-quality 3PL service, however,
requires an operator that offers the entire range of services, including
procurement logistics, inter-factory logistics, sales logistics (inventory
management and delivery control) and reverse logistics (transporting
industrial waste and returned or repaired goods). For Nippon Express,
the 3PL business is a field in which we can prove our strengths.
Due to the growing demand for concentrated logistics bases
seen in recent years, making large warehouses available is also
becoming a key part of our 3PL business. Nippon Express identified
this demand early on, which is why we have been building large-
12

Osaka Sustainable Architecture Award for Hokko Logistics Center
Completed in June 2007, the Hokko Logistics Center of the West Osaka Branch was selected for a special prize as part of the inaugural Osaka Sustainable Architecture Awards. These awards were established under an ordinance of the Osaka Prefectural Government concerning measures to combat global warming, and aim to raise public awareness about environmental issues in general. Although the Hokko Logistics Center is a multi-level warehouse, it has no freight elevators and is designed to save energy through the use of natural lighting and ventilation. The award was given in recognition of these features.
Place Type Space (m2) Completion date
Tokyo
Kanazawa
Osaka
Tokyo
Yokohama
Nagoya
Kyoto
Tokyo (sublease)
Tokyo (sublease)
Trunk room
Warehouse for business
Warehouse for business
Warehouse for business
Research facility
Commercial warehouse
Commercial warehouse
Warehouse for business
Truck terminal
22,089
19,156
48,226
16,199
10,860
25,973
16,292
56,710
24,000
Apr. 2007
May 2007
Jun. 2007
Jun. 2007
Jul. 2007
Nov. 2007
Apr. 2008
Dec. 2007
Jul. 2008
Managing and operating commercial
distribution and logistics operations
Optimizing commercial distribution and logistics within the Nippon Express Group
Nippon Express Group personnel managing
and operating facilities and equipment in
Japan and overseas, financial base,
information systems
Operation of commercial distribution Logistics operations
Placement and acceptance of orders
SourcingDeputy of import
and exportStock management
Sales
PackingWarehouse management
ForwardingTransport
Just-in-time supply
Suggesting and developing commercial
distribution and logistics systems
Suggesting and developing customized
information andoperating systems
that meet customers’ needs
Knowledge-based “soft” services Material-based “hard” services
Third-party logistics (3PL) Major facility investments
scale, well-equipped bases in recent years, particularly near cities
where demand is high.
In the year ended March 31, 2008, we completed large logistics
centers all over Japan, including Ishikawa (Kanazawa/Senkoji No.
2), Tokyo (Kitasuna), Osaka (Hokko), Nagano, Hokkaido (Sapporo
No. 2) and Aichi (Aisai). During this year, commercially available
warehouse floor space in Japan increased by about 100,000 m2,
a gain of approximately 4%. Logistics bases are flourishing and as
Nippon Express ascertains demand in the future, we plan to continue
proactive investment in large warehouses.
For Nippon Express, the 3PL business is an important part of our
strategy for sustained growth, and the area has been steadily fruitful
for us. For that reason, we are not limiting this business to Japan.
Providing a 3PL service is a critical part of our global business, and
we are now actively rolling out large logistics bases outside Japan.
We have expanded our logistics bases in Central and Eastern Europe
with the startup of a site in Pilsen, Czech Republic in May 2007 and in
Torun, Poland the following October. We have also opened two core
logistics bases for international and domestic shipments of automobile
production components in South China, with the new Guangzhou
Multi-Logistics Center and Huadu Satellite Logistics Center opening
in January 2008. In the U.S., another large logistics base was built
adjacent to Chicago’s O’Hare International Airport in February 2008.
All together, in one year the warehouse space owned by our overseas
subsidiaries increased by about 190,000 m2.
Nippon Express is making its 3PL business more competitive in ways
other than expanding logistics facilities. We are also combining the
commercial distribution management functions of our subsidiary Nittsu
Shoji Co., Ltd. with the financial functions of Nippon Express Capital Co.,
Ltd., which was established in October 2006 as a financial subsidiary.
13

DI FFE RE NT IAT ION
0
300
250
200
150
100
50
350
08/305/3 06/3 07/3
(¥ billion)
MovingRailway
Security transportHeavy haulage and construction
Spe c i a l Topic 3 DOMESTIC BUSINESS DIFFERENTIATION
Sales expansion of differentiated services
As it moves from an era of growth to an age of maturity, the
logistics industry in Japan faces a more competitive environ-
ment. Nippon Express is working to set itself apart from the competition
and following its strategy for sustained growth by focusing on its four
areas of strength: railway transport, heavy haulage and construction,
security transport and moving services.
Railway transport is an area in which we have long held the No. 1
market share. Compared to trucks used mainly for domestic logistics,
railway transport emits only one-sixth the CO2 and consumes one-fourth
the energy. These environmental advantages have renewed interest in
railway transport as customers become more aware of the need to head
off global warming and other environmental problems.
Railway transport does not work, however, unless it is skillfully combined
with truck transport to connect cargo collection points and shippers with
freight stations. To expand the volume of rail cargo handled, we are actively
14

Share (%) Rank Source
Railway
Moving
Cash transport
43.0
17.8
45.9
1
1
1
JR Freight (Year ended March 31, 2008)
Market announcement
Market announcement
NIPPON EXPRESSLogistics functions
NITTSU SHOJICommercial distributionmanagement functions
NIPPON EXPRESS CAPITALFinancial functions
BuyersVendors
Distribution
Loans
Order placement plan,Logistics operational
instructions
Orderplacement
plan
Performanceinformation,
Stock information
Orderplacement plan,
Orderplacement
Loans
Distribution
Orderplacement plan,
Orderplacement
Loans
Expanding the service range with financial services Share of differentiated services in Japan
leveraging our nationwide logistics network and our general strength in all
modes of shipping—land, sea and air. Similarly, we are developing products
to meet specific customer needs, such as the TOYOTA LONG PASS EXPRESS,
a special freight car that has run between Nagoya and Morioka to ship pro-
duction components for Toyota Motor Corporation since November 2006. In
October 2007, we expanded this service to two trips per day. International ser-
vices combining rail and ships to connect Japan with China and South Korea
have also proven popular. These include the Sea & Rail Service using Shanghai
Super Express Co., Ltd. (SSE) between Hakata and Shanghai, and the Rail-Sea-
Rail Service (South Korea), an international multimodal transportation service.
Our heavy haulage and construction business provides one-stop service
ranging from transportation to installation of heavy goods for large facilities like
power stations and petrochemical plants, as well as large production equip-
ment. The 2005 establishment of the heavy haulage and construction division
has created a stronger organization in this area, leading to steady profitability.
In the security transport business, we have set up devices to collect cash
deposits from sales and food service businesses and others who handle large
amounts of cash. Our CSD (cash safety delivery) service uses secure vehicles to
visit these devices at regular times to collect funds and deliver change. This busi-
ness is growing steadily and winning an increasing number of contracts for trans-
porting cash and other valuables between the offices of financial institutions, col-
lecting and distributing funds to large sales outlets and stocking ATMs with cash.
In the moving services business, the Ecology Konpo service, which uses
reusable packaging materials to reduce waste, is now available and being
marketed nationwide. As environmental awareness rises, customers are mak-
ing wider use of this service. Our goal is to expand sales further with a greater
range of services. These include our Full Pack service, in which we do every-
thing from packing and unpacking to putting furniture and appliances in place
and cleaning up, and other services, like Half Pack, Self Pack and Tanshin Pack,
thereby enabling customers to choose according to their budget and needs.
15

PART N E RSH I P
Spe c i a l Topic 4 INTEGRATION OF THE PARCEL DELIVERY BUSINESS
To be utilized by new company
Terminals (About 70 locations) Distribution centers (About 710 locations)
• Leased to new company
• Separation into new company
Not utilized by new company
• Sell (Return)
• Facilitate for other usage (Office to lease, residence etc.)
• Use for distribution
Diagram of transition of assets for small-package delivery business
Mr. Masanori KawaiPresident, Nippon Express Co., Ltd.
Mr. Yoshifumi NishikawaPresident,Japan Post Holdings Co., Ltd.
Nippon Express’ parcel delivery service, Pelican Express,
stands to become more competitive as the scale of its
business grows. To take advantage of this scale benefit, we have
made structural reform of our parcel delivery business a key business
strategy in recent years.
After considering our approach from many angles, we decided to
merge our parcel delivery business with that of another major enterprise.
On October 5, 2007, Nippon Express reached a basic agreement to merge
Pelican Express with the Yu-Pack service of Japan Post Service Co., Ltd.,
part of the Japan Post Group, to form a new parcel delivery company. In
accordance with the basic agreement, we established the equally owned
joint venture JP Express Co., Ltd. on June 2, 2008. Upon concluding a
shareholders agreement and formulating a new business plan for the
new enterprise by August 31, 2008, we intend to launch full-scale parcel
delivery services as a combined company from April 2009.
16

Investing 50% (At the beginning) Investing 50% (At the beginning)
Nippon Express Co., Ltd.
(Launched June 2, 2008, paid-in capital of ¥300 million)New company engages exclusively in the small-package delivery business.
Japan Post will have majority shareholding after consolidation of the small-package delivery business.
JP Express Co., Ltd.
Japan Post Group
Integration of small-package delivery business with Japan Post
Nippon Express began preparing for this integration of parcel
delivery services with the November 2007 launch of its Small Package
Business Strategy Headquarters, which is managing the transfer of
personnel and facilities to the new company as well as the funds to
be invested in it. Details are still under consideration, but we expect
to transfer or dispatch up to 5,000 personnel, equivalent to our entire
parcel delivery workforce, to the new company and use Nippon
Express bases as collection and delivery terminals. The new company
will make use of Nippon Express expertise for the IT systems used to
manage cargo data and perform invoicing and collection processes,
and for cargo transport trunk line and terminal operating methods.
Also, because of the uneven geographic distribution of the business
(70% of parcel deliveries are within 10% of Japan’s area), the new
company will use both parent companies’ assets to build a suitable
collection and delivery network in regions with a high concentration of
businesses, while using Japan Post Group’s existing network in areas
with a lower concentration. This will ensure an operating system with
a high level of service quality and efficiency.
Anticipating the integration of these parcel delivery services, we
are also initiating efforts to reorganize Arrow Express, our combined
freight truck service for cargo exceeding Pelican Express’ size and
weight limits. While establishing the details of the new joint venture,
we will create a stronger and more efficient Arrow Express that uses
its business-to-business focus for outstanding competitiveness.
17

The financial concerns triggered by the subprime loan crisis in the United
States are having a growing impact on the U.S. economy as a whole, as
demonstrated by the country’s economic growth rate falling 0.7 points to 2.2% in 2007.
The high price of oil and grain is creating an economic drag, and a weak dollar has led
to a lower volume of imports. Making up for this is the rising flow of exports, which
has helped Nippon Express to enjoy growing profits in the United States as a whole.
We are also handling much more cargo in Mexico, where production is strong.
The end result is that for the term, revenues in the Americas were up 5.4% to ¥59.87
billion and operating income rose 10.5% to ¥3.66 billion.
During the current fiscal year, ending March 31, 2009, Nippon Express aims
to expand its business by positioning itself to offer one-stop logistics services,
stepping up intra-regional shipping capacity with a view to mergers and
acquisitions, and by concentrating investment in emerging markets.
REVIEW OF OPERATIONS
08/305/3 06/3 07/30
4
2
6
2.02.2
3.3
(¥ billion) (¥ billion)
The Americas Europe Asia & OceaniaJapan (Right scale)
0
20
40
60
3.6
Revenues by geographic segment (Consolidated)
CANADACalgaryFort ErieMontrealTorontoVancouverWindsorCambridge
BRAZILCampinasManausRio de JaneiroSantosSao Paulo
MEXICOAguascalientesGuadalajaraManzanilloMexico CityMonterreyTijuana
CHILESantiago
MinneapolisNashvilleNew York (& New Jersey)Newport NewsOmahaPhiladelphiaPhoenixPittsburghPortlandRaleighRochesterSalt Lake CitySan AntonioSan DiegoSan FranciscoSan Juan (Puerto Rico)SavannahSeattleSt. LouisTroyWashington, D.C.
U.S.A.AnchorageAtlantaAustinBostonCharlotteChicagoCincinnatiClevelandColumbusDallasDenverDetroitEl PasoHonoluluHoustonIndianapolisLaredoLexingtonLos AngelesMcAllenMemphisMiamiMilwaukee
The Americas
Business base expansion in fi scal 2008
18

Regular Chicago–Toronto shuttle truck service begins
The Chicago Air Cargo Branch of Nippon Express U.S.A. Inc. and Nippon Express Canada began a
regular shuttle truck service between Chicago and Toronto in April 2007. The Toronto route is the
eighth line in the Chicago Branch’s Midwest Time Advantage (MTA) service, which ships cargo
arriving at O’Hare International Airport for next-day delivery by truck to cities in the U.S. Midwest.
After a steep rise in shipments of electronic products and automobile components from
Japan to Toronto in recent years, the inadequate capacity of direct flights to that city has
started to become apparent. To make up the gap, under the new shuttle truck service, Nippon
Express Canada performs import customs clearance procedures 24 hours a day at the U.S.-
Canadian border to ensure that our service is just as convenient for customers as a direct flight.
The Toronto route is currently running three times a week, as opposed to the daily operation of
other MTA routes, but the service will expand when there is enough demand.
Our truck transport network covers North America from bases in Los Angeles, Chicago and
New York, and by combining air and sea forwarding with land truck transport, we offer optimal
logistics services for our customers’ needs.
Opening of new central base adjacent to O’Hare International Airport in Chicago
The U.S. Midwest is starting to re-emerge as a hub for the automobile industry, including
component manufacturers. Chicago’s O’Hare International Airport is a key gateway for air cargo to
this industry. For Nippon Express U.S.A., O’Hare Airport is of crucial importance, in part because
it is the starting point for the MTA regular shuttle truck service to Midwest cities and Toronto,
Canada. For that reason, the company opened a major base next to the airport in February 2008.
Because the logistics business there is expected to grow further overall, for instance
through distribution center operations including U.S. domestic shipping and marine cargo
freight, the new base was built to a large scale, with 35% more area under roof than earlier
facilities. The site was additionally designed to conform to TAPA Class A, the highest level of the
global security standard for cargo facilities.
Opening of Monterrey Office of Nippon Express USA de Tijuana S.A. de C.V.
Situated in northern Mexico near the U.S. border, Monterrey is Mexico’s third largest industrial
city, and as such has attracted numerous Japanese automobile-related companies and other
manufacturers. This has led to a tremendous expansion in the volume of cargo handled in the area.
In 2006, Nippon Express U.S.A. founded Nippon Express USA de Tijuana S.A. de C.V. to cover
Tijuana, Mexico, and registered that company with the Services IMMEX Program* in 2007.
Principal operations involve the import of raw materials and parts/components from Japan,
Asia and other regions, the storage of finished and semi-finished goods, and distribution
processing. The local business has now opened an office in Monterrey, registered it with the
Services IMMEX Program, and utilized this program to develop its own door-to-door bonded
transport system from Laredo, Texas on the U.S. border to Monterrey via a twice-weekly shuttle
truck service. The transport flow of goods bound for Monterrey, which used to stop on the U.S.
side of the border, has thus been improved and the lead time substantially reduced.
The Monterrey Office has its own warehouse capable of handling long-term storage under
the Services IMMEX Program. Equipped with REWARDS (Nippon Express’s proprietary global
warehouse management information system), this warehouse will provide customers with Vendor
Managed Inventory (VMI), Just-in-Time (JIT) delivery and other high-quality logistics services.
* Services IMMEX Program: A program that provides transport and warehouse storage services for raw materials and parts/components imported to Mexico on a duty-free basis for the production of goods for subsequent export..
19

REVIEW OF OPERATIONS
Europe
POLANDWroclawTorunWarszawa
RUSSIAMoscowSt. Petersburg
TURKEYIstanbul
SOUTH AFRICAJohannesburg
UNITED ARAB EMIRATESDubai
PORTUGALLisbonOporto
AUSTRIAVienna
SWITZERLANDGenevaZurich
CZECH REPUBLICPraguePilsen
LUXEMBOURGLuxembourg
U.K.Derby (East Midland) GlasgowLeicesterLondonManchesterNewcastleSwindon
IRELANDCorkDublin
FINLANDHelsinki
BELGIUMAntwerpBrussels
NETHERLANDSAmsterdamRotterdamVenray
GERMANYCologneDusseldorfFrankfurtHamburgHannoverMunichNurembergStuttgart
FRANCELyonMulhouseParis
ITALYFlorenceMilanRomeTurin
HUNGARYBudapest
SPAINBarcelonaBilbaoMadridMalaga
08/305/3 06/3 07/30
4
2
6
0
20
40
60
2.4
3.23.4
(¥ billion) (¥ billion)
The Americas Europe Asia & OceaniaJapan (Right scale)
3.0
Business base expansion in fi scal 2008
Revenues by geographic segment (Consolidated)
Economic growth in the euro zone rose 2.7% in 2007, eclipsing the U.S.
growth rate for the first time in six years. The U.S. economic slowdown
started to impact Europe, however, and in the second half of the year in particular,
exports to North America tapered off while high oil and grain prices dampened
personal consumption, making the environment more challenging in many countries.
Business grew briskly in the emerging markets of Central and Eastern Europe and
Russia, however, leading overall revenues to rise 16.7% year on year to ¥77.52 billion.
Despite this, operating income declined 10.3% from the previous year to ¥3.08
billion due to the high price of fuel, a strong euro and a temporary rise in costs
incurred from the start-up of a warehouse in the United Kingdom.
While the environment is expected to worsen in the period ending March
31, 2009, Nippon Express is actively taking on intra-regional logistics and
striving to secure profits by capturing export cargo to the newly industrializing
economies of Asia.
20

New bases set up in the Czech Republic, Poland and other locations
in Central and Eastern Europe
The Czech Republic and Poland, which joined the EU in May 2004, have seen massive
investments in the automotive and electronics-related industries in recent years. This has
sparked a surge in logistics demand, including cargo bound for Western Europe. Responding to
the changing environment, Nippon Express (Deutschland) GmbH has been actively preparing
bases in Central and Eastern Europe, including the Pilsen Logistics Center in Bor, Czech
Republic, which opened in May 2007. The facility functions as a center for relaying electronic
devices and other products from Japan to European destinations. Moreover, with its proximity
to Frankfurt am Main International Airport, one of Europe’s major gateways, we expect it to find
use as a hub for the flow of goods into Central and Eastern Europe.
In October of the same year, Nippon Express (Deutschland) also started operations at the
Torun Logistics Center in Torun, Poland. The center aims to offer JIT logistics services to support
manufacturing of products such as flat-panel televisions, especially for Japanese manufacturers.
Nippon Express Russia LLC and Moscow Branch established,
large warehouse under construction
Seeing the business potential in Russia, Nippon Express opened a representative office in
Moscow in 2005 to gather information and study the market. In 2006, we commenced business
operations in this market with the launch of Nippon Express (St. Petersburg) LLC. The scope of
that company’s business in automotive-related shipping through the port of St. Petersburg has
grown steadily, and in July 2007 we expanded our operating organization in Russia on the back
of further growth in the country’s economy.
With the recently completed reorganization of Nippon Express (St. Petersburg), the
company assumed the new name of Nippon Express Russia LLC, clarifying its position as our
local corporation with responsibility for the Russian market. At the same time, Nippon Express
Russia opened a Moscow Branch to serve as its base and reinforce its operational structure in
the region. As it is capable of handling a wide range of businesses, including 3PL, air and sea
forwarding and overseas moving services, the newly opened Moscow Branch plays a vital role
in our expansion in Russia.
The Russian unit is also opening a large warehouse in the Moscow suburbs close to
Sheremetyevo International Airport. The facility will commence operations in January 2009.
Nippon Express (Middle East) LLC established in Dubai, UAE
The Emirate of Dubai, part of the United Arab Emirates (UAE), is looking ahead to the day when
oil resources will become depleted, and has made an effort in recent years to build a service
industry. To prepare its logistics infrastructure in particular, construction has begun on a large
airport in Dubai. This is just one of the developments that are likely to turn Dubai into a major
logistics transfer point for not only the Middle East but also Asia, the CIS countries, East Africa
and the European continent.
To take advantage of that environment, we established Nippon Express (Middle East) LLC in
the Emirate of Dubai in February 2007.
While we have had a representative office in the region since 2005, the establishment of
the new company will enable us to provide high-quality transport and customer service to
meet the logistics needs of Japanese, European and North American enterprises and offer
comprehensive logistics service across land, sea and air.
21

REVIEW OF OPERATIONS
Asia & Oceania
XiangfanWuhanChangshaChenduChongqingKunmingWulumuqi
TAIWANHsinchuKaohsiungTaichungTainanTaipeiTaoyuanKeelung
KOREAInchonMasanPusanSeoulShiheung
AUSTRALIASydneyMelbourne
NEW ZEALANDAuckland
CHINAHaerbinChangchunShenyangDalianBeijingTianjinYantaiQingdaoChanshuZhangjiagangNantongNanjingShanghaiSuzhouWuxiJiaxingHangzhouNingboFuzhouXiamenHuizhouDongguanGuangzhouShenzhenZhongshanJiangmenHong KongZhuhaiXian
INDIABangaloreNew DelhiChennaiMumbaiKolkataPuneCochinHyderabadTrivandrum
PHILIPPINESAngelesBiñanCabuyaoCebuLapu-LapuLipaMakatiMalvarManilaParañaqueRosarioSubicPasig
THAILANDAyutthayaBangkokChiang MaiChon Buri
Pranchin BuriRayongSongkhlaLeam Chabang
SINGAPORESingapore
VIETNAMHanoiHo Chi Minh CityHaiphon
INDONESIABaliBandungBatamJakartaSurabayaMerak
MALAYSIAIpohJohor BahruKuala LumpurKuchingMalaccaPenang
08/305/3 06/3 07/30 0
2.93.3
4.5
4
2
6
20
40
60
(¥ billion) (¥ billion)
The Americas Europe Asia & OceaniaJapan (Right scale)
5.0
Business base expansion in fi scal 2008
Revenues by geographic segment (Consolidated)
Economic growth rates surpassed 5% throughout Asia in fiscal 2008, coming
to 11.4% for China, 5.5% for the NIEs* and 6.1% for the ASEAN-4 (Indonesia,
Philippines, Malaysia, Thailand). Chinese exports leveled off due to the slowdown
in the U.S. economy, but expectations for the Beijing Olympics and other events
minimized any slowdown in China. The NIEs boasted strong exports to Europe and
newly emerging economies, while the ASEAN-4 countries experienced growing
domestic demand as prices on primary products rose worldwide. The high-margin
air cargo area declined, but in the Asia & Oceania region revenues rose 5.8% over
the previous year to ¥109.64 billion and operating income jumped 12.6% to ¥5.09
billion for the term.
In the current fiscal year, ending March 31, 2009, we aim to step up our efforts in
the growing field of intra-regional logistics and expand our business lines, in part by
responding to the shift of production to parts of Asia other than China.
* Newly Industrialized Economies (South Korea, Taiwan, Hong Kong and Singapore)
22

Start of Mekong Land Bridge Express ground shipping service
between Vietnam and Thailand
With the development of a ground shipping route between Hanoi, Vietnam and Bangkok,
Thailand, in April 2008, Nippon Express launched its new Mekong Land Bridge Express Service.
Until now, transport between these two cities has principally taken place by air or by
ship, with door-to-door sea transport service taking 14 days. Our new service ships goods
between Hanoi and Bangkok in three days using the convenient “East–West Corridor” between
Da Nang, Vietnam and Mawlamyaing, Myanmar, which was made possible by the completion
of the Second Mekong Bridge. To meet the demand for large-volume transport, we are offering
a service using containers of the same specifications as marine cargo containers, and plan to
begin a consolidated shipping service in summer 2008 for smaller cargo loads.
Under the project name SS7000, Nippon Express has been working to connect the 7000
kilometers of road transport routes between Shanghai and Singapore.
The Company already operates services on two segments: the Star Night Express between
South China and Hanoi and the Oriental Land Bridge Express between Singapore and Bangkok.
With the addition of the Mekong Land Bridge Express, the SS7000 route, which crosses the
borders of six nations, is now complete.
Construction of large logistics bases in Guangzhou, China
In January 2008, Nippon Express (H.K.) Co., Ltd. opened two logistics bases in Guangzhou,
South China for automobile production components: the Guangzhou Multi-Logistics Center
(Yonghe District) and Huadu Satellite Logistics Center (Huadu District).
Since starting automobile production component shipping services within China in 2004,
Nippon Express has worked to expand its network there, and we now have 101 bases in 36
cities. Automobile production is steadily growing in China and, along with it, the volume of
cargo shipped, but in the future we also anticipate growing exports to other areas and intra-
regional transport to production bases in Southeast Asia. The two new bases in Guangzhou are
ready for the higher volume and sophistication of this logistics demand.
Both centers are spacious, with 16,600 m2 of floor space at the Guangzhou center and 6,300
m2 at Huadu. Both come with truck and marine container docks and can handle domestic and
international logistics. In the next fiscal year, Nippon Express (H.K.) will also complete a 10,000
m2 scale warehouse in the Nansha district of Guangzhou, an important automobile industry
cluster. These additions will enhance service quality by increasing reliability, cutting lead times
and reducing inventory.
Merger of local companies creates Nippon Express (India) Pte., Ltd.
In April 2007, we established Nippon Express (India) Pte., Ltd. after an M&A process in which
we acquired 51% of the outstanding shares of the Indian air and marine cargo agent J I Logistics
Private Limited (JIPL). This has helped us to rapidly establish our position in India, one of the
so-called BRICs and a country that has seen rapid economic growth over the last decade.
Since 2000, Nippon Express has set up representative offices in two Indian cities, New Delhi
and Bangalore, and engaged in air and ocean cargo operations through our local agent. As
Japanese automotive-related businesses have continued to enter this market, cargo volumes
have risen quickly. The outlook for continued growth led us to acquire JIPL.
Through this acquisition of a local enterprise, Nippon Express is now able to manage
customs clearance operations for this market on its own, and our workforce of 300 employees
stationed at bases in 10 Indian cities makes us the largest Japanese logistics enterprise in India.
23
Joint venture with China’s leading marine transport enterprise
In September 2007, Nippon Express joined forces with China Shipping (Group) Company, a major
Chinese shipping firm, to establish CNJ World Logistics Co., Ltd. and thereby offer improved marine
transport services in China, an increasingly important production base and consumer market.
China Shipping is a key government-owned company managed directly by the Chinese
government and boasts China’s largest (and the world’s sixth largest) fleet of oceangoing
container ships. The new company is a joint venture equally owned by Nippon Express and
China Shipping Japan Co., Ltd., a wholly owned subsidiary of China Shipping.
The newly created CNJ World Logistics aims to expand its cargo business by leveraging the
combination of the Nippon Express Group’s global network and comprehensive land, sea and
air transportation modes and China Shipping’s marine cargo capacity. The firm will develop new
customers and original business models for Japan–China transport and trilateral trade.
Expansion of ULD service for enhanced shipping quality in China
Certain Nippon Express facilities located close to airports offer a ULD Intact Service, in which Nippon
Express staff bundle cargo intended for air freight onto pallets and containers (Unit Load Devices, or ULDs)
and then unload the goods at another Nippon Express facility at the destination. Customers are increasingly
taking advantage of this service for safe and reliable air transport of cargo and shorter delivery times.
Air transport of delicate goods like semiconductors and electronic devices has increased in
recent years. We are responding to this need with ULD handling systems in bonded warehouses
at the Narita, Kansai and Chubu international airports. While already providing ULD services for
several destinations (Hong Kong and four cities in mainland China), we anticipated growing
demand as the Olympics drew near and in February 2008 began offering these services for the
destinations of Beijing and Tianjin, thereby enhancing our capacity.
Air service starts from Haneda to China
Nippon Express began a new service in December 2007 to further boost the speed of air freight
to China. The Kai-Soku! Hongqiao service uses a newly opened regular charter route between
Haneda Airport and Shanghai Hongqiao Airport.
With this service, cargo ready to go by evening in Tokyo is delivered to Shanghai the next
day. This can save 20 hours from the ordinary route connecting Narita Airport and Shanghai
Pudong International Airport.
Before the launch of this service, we already offered an air cargo service between Tokyo
and Shanghai in the form of Cho-Soku! Shanghai, which uses late-night flights connecting
the Haneda and Kansai airports with Shanghai Pudong. With Kai-Soku! Hongqiao in place as
our second fastest service, Nippon Express continues to enhance its product lineup, giving
customers a choice in terms of time and costs.
Construction of bonded warehouse in Hanoi, Vietnam
Nippon Express (Vietnam) Co., Ltd. is building a bonded warehouse in the Minh Quang Industrial
Zone in suburban Hanoi. The expected completion date is December 2008.
In addition to offering a skilled labor force, Vietnam is also building international credibility by
joining the World Trade Organization. Japanese industry continues to pour into the area, and today
some 250 electric and precision device manufacturers have set up bases in Hanoi, the nation’s
financial center. Along with the increase in foreign-owned enterprises comes rising demand for
warehouse space, and Nippon Express’ new bonded warehouse intends to meet that need.
Moreover, since Hanoi is on the route of our SS7000 ground shipping service connecting
Shanghai and Singapore, the new warehouse will play a pivotal role as a relay point.
REVIEW OF OPERATIONS
Asia & Oceania24

Doing More for Society and for Our World
C S R
CSR & CORPORATE PHILOSOPHY
CORPORATE GOVERNANCE
CRISIS MANAGEMENT, COMPLIANCE & PERSONAL INFORMATION PROTECTION
DIRECTORS, OFFICERS & CORPORATE AUDITORS
ENVIRONMENTAL & SOCIAL CONTRIBUTIONS
26
27
28
29
30
25

CSR management
Nippon Express possesses infrastructure for economic activity on a global scale. We recognize the important social responsibilities inherent to
our role as a global logistics provider, and continue to expand our corporate social responsibility (CSR) activities.
The reinforcement of our CSR activities is a key theme under our medium-term business plan for the period from fiscal 2007 to fiscal 2009, the Three-
year Power Up Plan. We continually strive to strengthen public confidence in the Nippon Express Group through policies targeted toward three key goals:
• Consistent compliance with all regulatory requirements
• Effective risk and safety management
• The application of environmental management principles.
The commemorative program for our 70th anniversary in October 2007 included a number of initiatives to strengthen and enhance our CSR
activities and ensure that all of our activities are permeated by CSR principles. These include:
• The adoption of a new corporate philosophy
• Continuing implementation of social contribution activities, especially in the area of environmental protection
• The installation of a monument inscribed with the words “Pledge to Safety.”
Corporate philosophy
In 1958, Nippon Express adopted “Our Principles” as a philosophical framework for all employees. Since then, these principles have been used as
guidelines for employee behavior in all areas of our business activities.
As part of activities to commemorate the 70th anniversary of the founding of Nippon Express, we formulated a new corporate philosophy. This
combines the spirit of “Our Principles” with our vision for the future of Nippon Express. The new philosophy reflects a review of our values and our
approach to social contribution.
CSR & CORPORATE PHILOSOPHY
Nippon Express Group Corporate Philosophy
Our MissionBe a Driving Force for Social Development
Our ChallengeCreate New Ideas and Value that
Expand the Field of Logistics
Our PrideInspire Trust Every Step of the Way
Since our founding, the Nippon Express Group has employed our logistical strengths to connect people, businesses and regions throughout the world. In so doing,
we have continuously supported social development.
While our mission never changes, we continuously advance to meet the world’s changing needs.
Making no compromise in safety and maintaining a deep focus on environmental issues, we continuously strive to deliver innovative solutions at the next frontier of logistics.
We will forever take pride in our ability to inspire trust and answer the call of society.
Every move we make is aimed at advancing society and bringing an enriched life to future generations.
26

Corporate governance
Basic stance on corporate governance
Nippon Express recognizes the importance of consistent compliance, trans-
parent management and the improvement and reinforcement of corporate
governance. Our basic policies call for timely management decision-making
and transparent accountability, and one of our top management priorities is
to develop systems and implement measures to achieve these goals.
Corporate Organization
Nippon Express has adopted a “Company with Board of Auditors”
structure. In addition to the Board of Directors and Board of Auditors,
we have also established a Board of Executive Officers with the aim of
speeding up decision-making and business operations.
The Board of Directors consists of 15 members (as of June 7, 2008).
Normally it meets once a month, but special meetings can be convened as
required. The tasks of the Board of Directors are to make important manage-
ment decisions and supervise business operations. To provide clear manage-
ment accountability for each business year, directors serve one-year terms.
The Board of Auditors consists of four corporate auditors, includ-
ing three external corporate auditors (as of June 7, 2008). Normally
it meets every three months, but special meetings are convened
when necessary. The corporate auditors attend important meetings
and present fair and objective opinions on management in general or
specific matters. They also audit the performance of directors’ duties
by examining the legality of decisions and assessing internal control
systems. The audit activities of the corporate auditors also include
perusal of important documents, on-site inspections at key business
sites, and inspections of subsidiaries. Their findings are reported to
the Board of Corporate Auditors and the Board of Directors. Audits
also cover the performance of executive organizations.
The Board of Executive Officers consists of 26 members, including 14
executive officers who are also serving as directors (as of June 7, 2008).
Normally it meets once a month, but special meetings can be convened
if necessary. The tasks of the Board of Executive Officers are to dissemi-
nate the decisions of the Board of Directors and issue directives based on
those decisions, to present reports on business operations, and to discuss
important matters. Like directors, executive officers serve one-year terms.
Strengthening internal control systems—compliance with the
“J-SOX Law”
In May 2006, the Board of Directors of Nippon Express adopted and
established a basic policy for the development of internal control sys-
tems in order to comply with Japan’s new Corporation Law.
The Financial Instruments and Exchange Law, which is known as the
“J-SOX Law,” also stipulates requirements concerning internal control
systems. In August 2006, Nippon Express launched a project to prepare
for the full enforcement of the new law in March 2009. Work under this
project includes the assessment of its internal control systems relating
to financial reporting, and the development of audit mechanisms.
In March 2008, Nippon Express achieved certification under ISO/IEC
27001:2005, which is the international standard for information security man-
agement systems (ISMS), and under JIS Q 27001:2006, which is the Japanese
ISMS standard. The reliability of the Company’s information management
systems has been thoroughly assessed by independent organizations.
CORPORATE GOVERNANCE
Board of Auditors Board of Directors
Board of Executive OfficersCorporate Attorney Compliance Committee
Crisis Management Committee
Audit Division
Accounting Auditor
Appointment and Removal
Cooperation
Report
ReportReport
Audit
Audit
Audit of Accounts
Appointment and Removal Appointment and Removal
Appointment
Enforcement Division(Headquarters divisions, Headquarters departments,
regional administration (domestic/overseas), each business division, each branch office, each group company)
Corporate AffairsAudit
AuditPresident
General Shareholders’ Meeting
Corporate governance organizational chart
27

Crisis Management Structure
Effective logistics is essential to the normal functioning of society. As
a company involved in that field of business, Nippon Express is con-
tinually developing and strengthening its crisis management systems
to minimize the disruption that would result from various contingen-
cies, such as major natural disasters or incidents. In January 2000,
we formulated the Crisis Management Code as the basic framework
for our systems in this area. Organizational preparations include the
establishment of the Risk Management Committee in our head office.
In October 2001, we formulated the Nippon Express Group Disaster
Response Regulations, which stipulate specific actions in the event of a
disaster. A disaster management system site has been established on our
intranet, and systems have been established to ensure proper reporting
between head office and branches and among branches, in accordance
with the Disaster Reporting Procedures. Since ordinary telephone lines
may become unusable after a disaster, we have also provided satellite
telephones in the relevant head office departments and in key branches.
Compliance Management
In June 2003, we strengthened our compliance systems through the
establishment of the Compliance Division. In October of the same
year, we completed our basic compliance structure with the formu-
lation of the Compliance Regulations. Our group-level compliance
organization consists of the Compliance Committee, which is chaired
by the President, and the Compliance Division, which acts as a secre-
tariat for this committee and is also responsible for the drafting and
implementation of related measures.
Workplace-level initiatives are implemented by the Compliance
Headquarters Promotion Group, together with compliance officers
and compliance promotion officers in coordinating branches and gen-
eral branches. We also maintain the Nittsu Speak Up internal reporting
system as a mechanism for the early detection and rectification of
compliance violations. There is also an internal investigation team.
Personal Information Protection
Stringent information management is required to
comply with various laws and regulations, including
Japan’s Personal Information Protection Law. The
protection of personal information was previously
the responsibility of the Compliance Division, but
in February 2005, we strengthened our systems
in this area by establishing a specialist unit, the
Personal Information Management Section. The
Personal Information Management Section has formulated the Personal
Data Protection Policy and the Compliance Program for the Protection
of Personal Data. The section has also implemented organizational mea-
sures, including the deployment of personal information management offi-
cers and staff. In addition, it implements training and awareness programs
designed to raise awareness among employees throughout the Nippon
Express organization about the need to protect personal information.
On March 23, 2007, Nippon Express was given approval to use the
Privacy Mark. This status was granted after stringent documentary
audits and on-site inspections by the Japan Information Processing
Development Corporation (JIPDEC).
CRISIS MANAGEMENT, COMPLIANCE & PERSONAL INFORMATION PROTECTION
Compliance Committee
Internal Review Team Compliance HeadquartersPromotion Group
1.
2.
3.
Chairman:
Co-chairman:
Advisors:
President
Executive Vice President (Presides over the Compliance Division)
Corporation lawyers, certified public accountants, tax accountants, etc.
(Internal reception office)
Internal reporting, consultation, reception, reviews
(Reception office for corporation lawyers)
Internal reporting, consultation, external reception
Audit departments in regional managing branches
SecretariatCompliance Division
Regional managing branches, branch offices
Compliance Administrator
Compliance Promotion Officer
Audit Division Planning, education, guidance
Compliance system
Nippon Express’ Privacy Mark approval certificate
28

DIRECTORS, OFFICERS & CORPORATE AUDITORS
Masahiko Okabe
Masanori Kawai
Keiichi Nakatani
Mitsuzo Segawa
Takakazu Omae
Keiichiro Yokoyama
Keiji Hagio
Noriyuki Marumoto
Yoichiro Tsuri
Satoshi Miyahara
Tsutomu Takeuchi
Kenryo Senda
Sakae Uematsu
Shotaro Moriya
Yukio Nagata
Yoshiaki Ishii
Masatoshi Nakano
Kenichiro Nanri
Shuji Kojima
Ryoichi Hashimoto
Osamu Abe
Zenjiro Watanabe
Yuzuru Fujita
Masaki Izumikawa
Kenji Watanabe
Takao Ohara
Yasuo Ito
Jiro Nakamura
Hiroaki Sano
Masao Hosokoshi
Minoru Miida
MANAGING OFFICER
OFFICERS
FULL-TIME CORPORATE AUDITORS
CORPORATE AUDITOR
CHAIRMAN
PRESIDENT, CHIEF EXECUTIVE OFFICER
EXECUTIVE VICE PRESIDENTS, EXECUTIVE OFFICERS
DIRECTOR, SENIOR MANAGING OFFICER
DIRECTORS, MANAGING OFFICERS
DIRECTOR, OFFICER
29
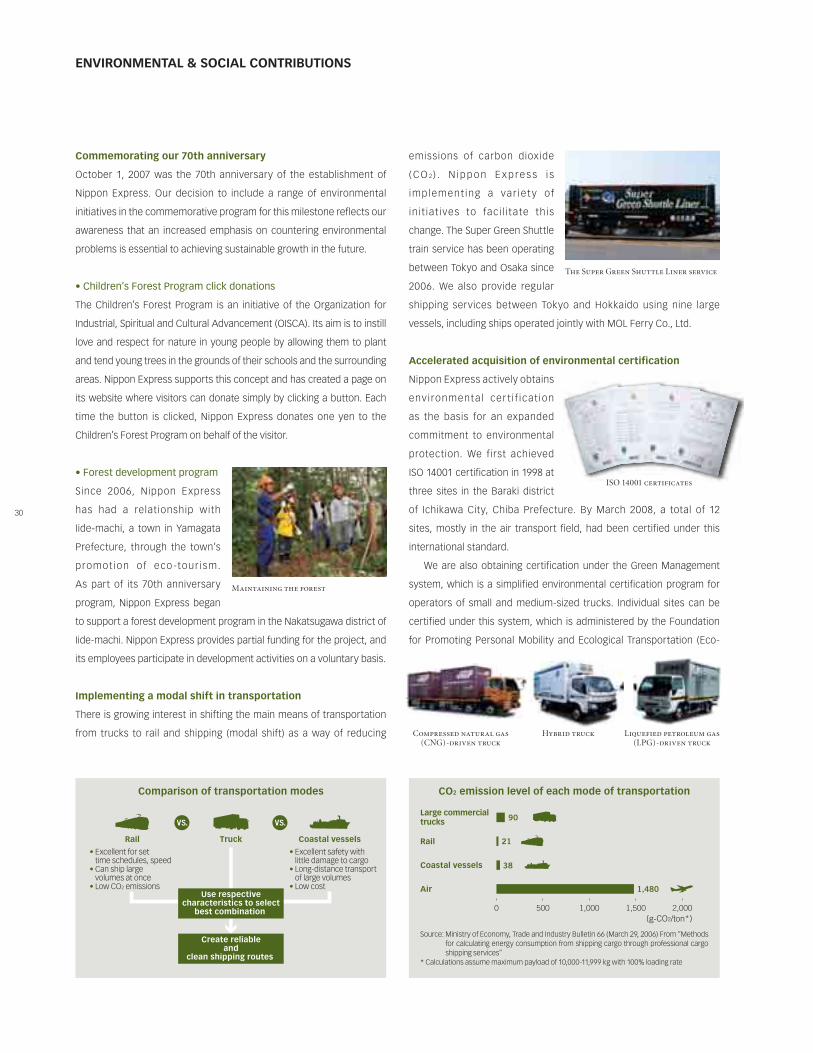
Commemorating our 70th anniversary
October 1, 2007 was the 70th anniversary of the establishment of
Nippon Express. Our decision to include a range of environmental
initiatives in the commemorative program for this milestone reflects our
awareness that an increased emphasis on countering environmental
problems is essential to achieving sustainable growth in the future.
• Children’s Forest Program click donations
The Children’s Forest Program is an initiative of the Organization for
Industrial, Spiritual and Cultural Advancement (OISCA). Its aim is to instill
love and respect for nature in young people by allowing them to plant
and tend young trees in the grounds of their schools and the surrounding
areas. Nippon Express supports this concept and has created a page on
its website where visitors can donate simply by clicking a button. Each
time the button is clicked, Nippon Express donates one yen to the
Children’s Forest Program on behalf of the visitor.
• Forest development program
Since 2006, Nippon Express
has had a relationship with
Iide-machi, a town in Yamagata
Prefecture, through the town’s
promot ion of eco -tour ism.
As part of its 70th anniversary
program, Nippon Express began
to support a forest development program in the Nakatsugawa district of
Iide-machi. Nippon Express provides partial funding for the project, and
its employees participate in development activities on a voluntary basis.
Implementing a modal shift in transportation
There is growing interest in shifting the main means of transportation
from trucks to rail and shipping (modal shift) as a way of reducing
emissions of carbon dioxide
( CO 2 ) . N ip p o n E x p re s s i s
implement ing a var ie t y of
ini t iat ives to faci l i tate this
change. The Super Green Shuttle
train service has been operating
between Tokyo and Osaka since
2006. We also provide regular
shipping services between Tokyo and Hokkaido using nine large
vessels, including ships operated jointly with MOL Ferry Co., Ltd.
Accelerated acquisition of environmental certification
Nippon Express actively obtains
env ironmental cer t i f icat ion
as the basis for an expanded
commitment to environmental
protection. We first achieved
ISO 14001 certification in 1998 at
three sites in the Baraki district
of Ichikawa City, Chiba Prefecture. By March 2008, a total of 12
sites, mostly in the air transport field, had been certified under this
international standard.
We are also obtaining certification under the Green Management
system, which is a simplified environmental certification program for
operators of small and medium-sized trucks. Individual sites can be
certified under this system, which is administered by the Foundation
for Promoting Personal Mobility and Ecological Transportation (Eco-
ENVIRONMENTAL & SOCIAL CONTRIBUTIONS
• Excellent for set time schedules, speed• Can ship large volumes at once • Low CO2 emissions
Rail
• Excellent safety with little damage to cargo • Long-distance transport of large volumes • Low cost
Coastal vesselsTruck
VS. VS.
Use respectivecharacteristics to select
best combination
Create reliableand
clean shipping routes
Rail
Coastal vessels
Air
Large commercial trucks
0 500
90
21
38
1,480
1,000 1,500 2,000(g-CO2/ton*)
Comparison of transportation modes CO2 emission level of each mode of transportation
The Super Green Shuttle Liner service
Maintaining the forest
Compressed natural gas (CNG)-driven truck
Hybrid truck Liquefied petroleum gas(LPG)-driven truck
Source: Ministry of Economy, Trade and Industry Bulletin 66 (March 29, 2006) From “Methods for calculating energy consumption from shipping cargo through professional cargo shipping services”
* Calculations assume maximum payload of 10,000-11,999 kg with 100% loading rate
ISO 14001 certificates
30

Green logistics award
At the Green Logistics Partnership Conference in December 2007, the Minister of Land,
Infrastructure and Transport presented awards in recognition of significant contributions made
by the logistics industry to counter global warming. Kagawa Matsushita Electric Works, Ltd., Asahi
Tsusho K.K., Japan Freight Railway Company, Jumbo Ferry Co., Ltd. and Nippon Express received
the Minister of Economy, Trade and Industry Award for their efforts to reduce CO2 emissions. These
efforts include a modal shift to rail and shipping, and the arrangement of shipments for the return
trips of vehicles after goods have been delivered.
Another award, presented by the Director-General for Policy Planning of the Ministry of Land,
Infrastructure and Transport, was given to the Shihoro Agricultural Cooperative Association, Japan
Freight Railway Company and Nippon Express for an initiative to reduce energy consumption and
promote clean agriculture and green logistics through a modal shift from trucks to rail for potato transportation from the Tokachi area in Hokkaido.
The above awards were first introduced in 2006. In fiscal 2007, Nippon Express, together with the Japan Freight Forwarders Association, Japan
Freight Railway Company and Zenkoku Tsuun K.K., received the Minister of Economy, Trade and Industry Award for the Super Green Shuttle project.
Mo Foundation), an organization affiliated with the Japanese Ministry
of Land, Infrastructure and Transport.
We are progressively obtaining certification, especially at sites
used for trucking and warehousing operations. By March 2008, Green
Management certification had been achieved at 252 Nippon Express
trucking sites and another 26 trucking sites operated by 11 group
companies, as well as at 33 warehousing sites, including one operated
by a group company.
Low-emission vehicles and eco-driving
Nippon Express is progressively
replacing its fleet of trucks with
environment-friendly vehicles
designed to reduce emissions
of CO2 and other substances,
especially hybrid vehicles and
vehic les that comply wi th
Japan’s new long-term emission
regulations. By March 2008, we had deployed a cumulative total of
2,967 of these vehicles, compared with our target of 3,000.
Another priority is the promotion of “eco-driving,” which means both
“ecological driving” and “economical driving.” Every year, we provide
comprehensive instructor training for employees who play a central role in
our driving training programs. We have also installed digital drive recorders
in our trucks to provide data that can be used to train employees in eco-
driving techniques. In June 2006, the Japan Federation of Freight Industries
acknowledged our efforts in this area by presenting us with an award for
environmental conservation activities in the area of freight logistics.
Development of reusable packaging
Nippon Express aims to minimize the amount of waste resulting from
its transportation activities, while also ensuring that customers’ goods
are delivered safely. We develop our own reusable packaging materials,
which have been used extensively for house-moving work since 1992.
Our Ecology Konpo environment-friendly house-moving service has
become especially popular. We are continually working to reduce
waste and improve efficiency by reviewing our packaging methods and
developing new packaging materials for all types of household goods. Our
Pasokonpo range of packaging materials for IT products are also reusable.
The materials, which consist of a special shock-absorbent film used to
wrap the products, together with tough exterior boxes, are widely used
when returning computers and other precision equipment for repairs.
To p i c 1
ISO 14001 certification acquired by: Tokyo Air Service Branch: Baraki Export Cargo Center, Baraki Air Cargo Distribution Center, Narita Airport Logistics Center / Nagoya Air Service Branch: Nagoya Distribution Center, Nagoya Air Cargo Center / Osaka Air Service Branch: Nanko Air Cargo Center / Fukuoka Air Service Branch: Fukuoka Air Cargo Center / Hiroshima Air Service Branch: Hiroshima Domestic Air Cargo Center / Sendai Air Service Branch: Sendai Airport Logistics Center / Takamatsu Air Service Center: Takamatsu Air Cargo Center / Shikoku Branch (Shikoku Heavy Haulage Construction Branch)
A digital tachograph
Various reusable packing materials
Protective box for tableware
The minister of land infrastructure and transport award certificate
Reusable shoe box
The logotype for Ecology Konpo
31

Nippon Express family concerts
Since 1986, sisters Saori Yuki and
Sachiko Yasuda have delighted
a growing number of fans
throughout Japan with songs
that remind listeners of the
beauty and expressive richness
of the Japanese language. In
1995, Nippon Express began to
sponsor concerts of children’s songs by this popular duo. There have
been over 2,000 of these performances, which in fiscal 2007 were
presented under a new title: “Nippon Express Presents Saori Yuki and
Sachiko Yasuda Songs with Your Life Concert—Songs to the Future.”
In 2002, Nippon Express also became a co-sponsor of “Local Stage
School Concerts” presented by Saori Yuki and Sachiko Yasuda at junior
high schools throughout Japan. The sisters launched these concerts
to help young people to appreciate children’s songs and other types of
vocal music, and thereby help to ensure that Japan’s precious heritage
of songs is passed on to future generations.
Historical documents donated to the Museum of Logistics
The Museum of Logistics was
established by the Forwarders
Counci l in August 1998 to
inform the general public about
the continuing and important
role of logistics in supporting
modern society. Located in the
Takanawa district of Tokyo’s
Minato Ward, the museum has a collection of 10,000 documents,
40,000 photographs, 2,000 artifacts and around 100 videos and
films. Elementary and junior high schools use the facility for social
education, while companies use it for employee training. Nippon
Express has provided numerous exhibits and also supports the
museum financially.
Support for schools and local festivals
Throughout its history, Nippon Express has
achieved growth by working in partnership
with local communities throughout Japan.
We are extensively involved in community
interaction initiatives, including traffic
safety courses, and work experience
programs for elementary school children,
junior high school students and students
from special needs schools. Nippon
Express also sponsors and participates in
local festivals, and supports tree planting
and litter removal campaigns. Other contributions include assistance
with emergency contact systems for children and the elderly.
Physical education activities
As part of its contributions to society, Nippon Express is promoting
sports by running various sports groups, including the Nippon Express
Baseball Club and the Judo Club, Sumo Club and Kendo Club. The
Company is providing sports lessons to local youth as well as bringing
home good results in a variety of
competitions. Nippon Express
is also contr ibut ing to the
promotion and protection of
traditional Japanese Budo sports,
such as judo, sumo and kendo.
Sumo training at the Nippon Express sumo club
Interior view of the Museum of Logistics
A local stage school concert
The Kids X change program
Nippon Express was the first Japanese company to support the YouthXchange initiative launched by the United
Nations Educational, Scientific and Cultural Organization (UNESCO) and the United Nations Environmental
Programme (UNEP). Since its initial publication in 2002, the YouthXchange program, which educates on
responsible consumption using a guidebook and a website, has been translated into 15 languages and distributed
worldwide to 400,000 people.
We have edited YouthXchange materials for use by elementary school children to create the Kids X change
program. The program has been distributed to numerous elementary schools in Japan and is now being used in
educational activities.
Habits formed by young people today will have a major influence on future consumption patterns. That is
why instilling environmental values in young people is seen as an important part of aligning today’s wasteful
consumption with sustainable development.
Through Kids X change, we emphasize the importance of education in forming the attitudes, values and
behavior patterns of young people, including children, toward consumption.
Nippon Express staff from the Tokushima branch and other branches
To p i c 2
32

TEN-YEAR SUMMARY
MANAGEMENT DISCUSSION AND ANALYSIS
CONSOLIDATED BALANCE SHEETS
CONSOLIDATED STATEMENTS OF OPERATIONS AND RETAINED EARNINGS
CONSOLIDATED STATEMENTS OF SHAREHOLDERS’ EQUITY
CONSOLIDATED STATEMENTS OF CASH FLOWS
NOTES TO CONSOLIDATED FINANCIAL STATEMENTS
REPORT OF INDEPENDENT AUDITORS
34
36
40
42
43
44
45
55
F i na n c i a l S e c t i o n 33

TEN-YEAR SUMMARY
2008 2007 2006FOR THE YEAR: Revenues *1 1,901,433 1,866,267 1,793,925
Revenues by industry segment *2
Distribution & transportation 1,597,284 1,580,546 1,522,325
Goods sales 291,923 279,080 266,908
Other 12,225 6,640 4,690
Revenues by geographic segment *2
Japan 1,682,699 1,666,887 1,631,402
The Americas 48,009 45,126 38,495
Europe 69,146 59,422 49,333
Asia & Oceania 101,578 94,831 74,693
Operating income 48,502 50,325 43,187
Net income 36,439 33,208 18,663
AT YEAR-END: Total net assets *3 520,823 517,516 488,205
Total assets 1,297,406 1,360,694 1,315,599
Net cash provided by operating activities 90,096 123,058 63,966
Cash and cash equivalents at end of year 144,639 170,109 150,615
PER SHARE: (Yen) Net assets per share 489.26 486.94 467.80
Net income per share 34.94 31.84 17.71
RATIOS: (%) Net assets to total assets 39.33 37.33 37.11
Return on equity 7.16 6.67 4.00
OTHER: Employees 69,177 67,773 65,562
(Average temporary employees) 24,434 23,796 24,190
*1 Revenue fi gures do not include consumption taxes.*2 The above fi gures for revenues by industry segment and by geographic segment do not include internal revenues or money transfers between the segments.*3 The calculation of net assets is carried out by applying the Accounting Standards for Description of Net Assets in the Balance Sheet (Accounting Standards Board of Japan, “Accounting Standards for
Business Enterprises, No. 5” dated December 9, 2005) and the Application Guidelines for Accounting Standards and Others for Description of Net Assets in the Balance Sheet (Accounting Standards Board of Japan, “Application Guideline for Accounting Standards for Business Enterprises, No. 8” dated December 9, 2005) from the year ended March 31, 2007.
’04 ’05 ’06 ’07 ’080
1,500,000
1,000,000
500,000
2,000,000
’04 ’05 ’06 ’07 ’080
50,000
40,000
30,000
20,000
10,000
60,000
0
30,000
20,000
10,000
40,000
’04 ’05 ’06 ’07 ’08
Revenues Operating income Net income
(¥ million) (¥ million) (¥ million)
34

Millions of yen
2005 2004 2003 2002 2001 2000 19991,753,306 1,666,945 1,676,918 1,708,140 1,760,687 1,637,758 1,643,022
1,485,266 1,419,156 1,429,489 1,454,133 1,491,528 1,423,825 1,428,055
263,216 243,084 242,988 248,898 263,898 208,893 211,758
4,823 4,703 4,440 5,108 5,259 5,039 3,208
1,605,602 1,556,828 1,566,037 1,590,309 1,652,365 1,553,058 —
33,722 31,297 36,055 45,944 42,520 35,916 —
45,525 38,688 37,406 33,997 28,626 21,639 —
68,455 40,130 37,419 37,889 37,174 27,144 —
43,025 46,156 42,802 33,370 35,283 35,916 44,820
32,190 27,263 23,330 21,180 -26,589 24,040 25,141
444,940 421,128 367,551 375,390 335,730 375,234 337,547
1,287,351 1,262,383 1,205,103 1,248,205 1,230,342 1,184,181 1,147,993
83,139 83,108 48,315 113,752 89,057 75,257 —
145,983 138,236 136,149 165,625 140,674 152,823 —
426.24 403.38 352.02 353.99 313.76 349.29 314.20
30.64 25.93 22.08 19.97 -24.78 22.38 23.40
34.56 33.36 30.50 30.07 27.29 31.69 29.40
7.43 6.91 6.28 5.96 — 6.75 7.63
65,321 64,699 65,160 66,716 66,219 68,335 —
24,400 25,321 25,701 27,263 27,075 22,049 —
’04 ’05 ’06 ’07 ’080
500,000
400,000
300,000
200,000
100,000
600,000
0
1,000,000
500,000
1,500,000
’04 ’05 ’06 ’07 ’080
100,000
50,000
150,000
’04 ’05 ’06 ’07 ’08
Total net assets Total assetsNet cash provided by operating activities
(¥ million) (¥ million) (¥ million)
35

MANAGEMENT DISCUSSION AND ANALYSIS
CURRENT STATUS OF THE CONSOLIDATED COMPANY AND ITS OPERATIONSThe Nippon Express Group is composed of Nippon Express and its
292 subsidiary companies, including 267 consolidated subsidiaries
and one equity-method subsidiary, as well as 67 affiliates, of which
21 are equity-method affiliates. In total, the Group consists of 360
companies, with 292 of these within Japan and 68 overseas.
Distribution and transportation operations, like motor
transportation, railway utilization transportation and marine
and harbor transportation, form the core of the Company, but
we are also developing operations in goods sales and other
areas such as real estate.
In distribution and transportation operations, there are 242
domestic transportation companies, including Nippon Express
Co., Ltd. and Nippon Truck Co., Ltd., and 60 companies operating
overseas, including Nippon Express U.S.A., Nippon Express (U.K.)
Ltd., Nippon Express (Nederland) B.V., Nippon Express
(Deutschland) GmbH, Nippon Express (H.K.) Co., Ltd. and Nippon
Express (Singapore) Pte. Ltd.
In goods sales operations, there are 26 domestic companies
including Nittsu Shoji Co., Ltd. as well as six overseas companies
operating under Nippon Express U.S.A.
Other operations include 23 domestic businesses, including
Nittsu Express Real Estate Co., Ltd., Nippon Express Capital Co.,
Ltd. and two overseas businesses.
PERFORMANCE OVERVIEWBusiness Environment and Activities during the Period
During the fiscal year under review, the Japanese economy was
characterized by sluggishness in certain sectors, and by falling
public investments and housing investments. These factors were
attributable to the soaring prices of crude oil and other natural
resources, as well as to concerns about a slowdown in the U.S.
economy, triggered by the subprime mortgage crisis. Meanwhile,
exports continued to increase on the back of continued expansion
in overseas economies, and capital expenditures also rose on the
strength of high corporate earnings. Given these demand condi-
tions at home and abroad, business conditions remained favor-
able although the expansionary trend slowed.
In the field of logistics, demand for international freight trans-
portation continued to grow overall. However, the business envi-
ronment remained difficult as demand for domestic freight trans-
portation continued to decline. The business climate surrounding
the field of logistics was made even more difficult by the soaring
fuel expenses and our corporate customers’ accelerated efforts
to streamline their distribution operations.
In this severe business environment, the Nippon Express Group
made all-out efforts to strengthen its earnings in accordance with
the Three-Year Power Up Plan— Challenging New Horizons in
Innovation with Our Customers, which was in its second year.
On the sales side, the Company strove to increase its competi-
tiveness through modal partnerships and system partnerships on
a global scale, along with enhancing and upgrading its overseas
network. We provide worldwide land, air and sea transportation,
and are taking actions to enhance the third-party logistics (3PL)
business in which Nippon Express can leverage its expertise and
advantages, such as a multitude of information systems. While
providing services that are tailored domestically and internationally
to each region, we are also actively expanding our operations.
On the management side, in order to reinforce our manage-
ment structure, we are extending our use of IT resources and
working to increase the effectiveness of group management with
the aim of using management resources efficiently, securing a
low-cost structure and making more effective use of our assets.
To carry out our social responsibilities as a corporation, we
are taking action to promote compliance by keeping everyone
’04 ’05 ’06 ’07 ’080
150,000
100,000
50,000
200,000
’04 ’05 ’06 ’07 ’080
300
400
200
100
500
0
30
25
20
15
5
10
35
’04 ’05 ’06 ’07 ’08
Cash and cash equivalents at end of year Net assets per share Net income per share
(¥ million) (¥) (¥)
36

informed about rules and regulations, implementing CSR educa-
tion and strengthening inspection and guidance at each business
site. In addition, in pursuit of ever-higher quality, we are enhanc-
ing our internal education system and developing talent to rein-
force our capabilities at local sites.
MANAGEMENT PERFORMANCERevenues and Cost of Goods Sold
As shown in the results below, consolidated revenues amounted
to ¥1,901.4 billion, which represents an increase of ¥35.1 billion,
or 1.9%, over the previous fiscal year.
Broken down by region, Japan grew by 1.1% over the previous
year, the Americas by 5.4%, Europe by 16.7% and Asia/Oceania by
5.8%, as revenues continued to increase in every region. Overseas
revenues grew by ¥402.6 billion overall, a 12.3% increase, and
overseas revenues now account for 21.2% of total revenues, an
increase of 0.2 percentage points in the overseas sales ratio.
The main contributions to the revenue increase in distribution and
transportation operations came from growth in warehousing, ship-
ping and motor transportation, and were centered on production
bases belonging to the clients of Nippon Express’ overseas subsidiar-
ies. In goods sales operations, revenue contributions came from a rise
in the unit cost of sales in the petroleum business, and in other opera-
tions from the acquirement of a human resource services business.
Cost of goods sold came to ¥1,769.7 billion, a ¥34.5 billion, or
2.0% increase over the previous fiscal year.
Gross profits came to ¥131.6 billion, which represents a ¥0.6
billion, or 0.5% year-on-year increase, while the ratio of gross
profits to sales fell to 6.9%, a decrease of 0.1 percentage points.
The main factors behind the increase in the cost of goods sold
were increases in outsourcing costs for vehicle leasing and subcon-
tracting fees that accompanied the revenue increase in distribution
and transportation operations; the sharp rise in fuel expenses; an
increase in depreciation and amortization expenses caused by a
change in the depreciation and amortization system accompanying a
revision of the Japanese tax system, and an appreciation in the pur-
chase price in the petroleum business in goods sales operations.
Selling, General and Administrative Expenses and
Operating Income
Selling, general and administrative expenses rose by ¥2.4 billion
to ¥83.1 billion, or a 3.0% year-on-year increase, primarily due to
an increase in the number of consolidated subsidiaries.
The ratio of selling, general and administrative expenses to
revenues was 4.3%, the same level as the previous fiscal year.
As a result, operating income amounted to ¥48.5 billion, a
decrease of ¥1.8 billion, or 3.6 %, from the previous fiscal year.
The operating income ratio was 2.6%, a decrease of 0.1 per-
centage points.
Other Profits and Losses and Net Income
Extraordinary profits were ¥17.2 billion, an increase of ¥8.9 billion or
107.1% year on year, while extraordinary losses amounted to ¥9.4
billion, an increase of ¥2.6 billion, or 38.2 %, over the previous year.
The main reason for the increase in extraordinary profits was
a gain from the transfer to the defined contribution pension sys-
tem of ¥7.8 billion, accompanying the change from a lump sum
retirement payment system to a defined contribution pension sys-
tem. The main reasons for the increase in extraordinary losses
were ¥1.2 billion in management costs for the parcel delivery
business integration, and losses from the sale of fixed assets.
Income before income taxes and minority interests was ¥63.7
billion. After adjusting for corporate taxes, local and franchise
taxes, deferred income taxes and minority interests, net income
came to ¥36.4 billion, an increase of ¥3.2 billion, or 9.7%, over the
previous year.
30
35
40
’04 ’05 ’06 ’07 ’080
6
8
4
2
10
’04 ’05 ’06 ’07 ’08 ’04 ’05 ’06 ’07 ’080
60,000
40,000
20,000
80,000
Net assets to total assets Return on equity Employees(Average temporary employees)(%) (%)
37

Net income per share came to ¥34.94 for the period, an
increase of ¥3.1. Shareholders’ equity stood at 7.16% of net
income, a year-on-year improvement of 0.49 percentage points.
Segment Information
Segment results are summarized as follows:(Millions of yen)
(Revenue details) 2007 2008 Increase/Decrease
Change(%)
Transportation 1,584,476 1,600,988 16,511 1.0
Goods sales 365,578 377,964 12,385 3.4
Other 20,115 28,629 8,513 42.3
Total 1,970,171 2,007,582 37,410 1.9
(Millions of yen)
(Operating income details) 2007 2008 Increase/Decrease
Change(%)
Transportation 45,940 43,896 (2,044) (4.4)
Goods sales 5,351 5,752 400 7.5
Other 1,275 1,061 (213) (16.7)
Total 52,567 50,710 (1,856) (3.5)
Distribution and Transportation Operations
In Japan, there were weak results in air freight forwarding for han-
dling volumes of international freight, but overseas handling vol-
umes grew in all regions of the Americas, Europe and Asia/
Oceania, and the number of consolidated subsidiaries increased as
well. Overall, revenues grew by ¥16.5 billion year on year, or 1.0%,
to a total of ¥1,600.9 billion. Owing to the sharp rise in fuel costs
and the effect of the change of the depreciation and amortization
system that accompanied the taxation system revision, operating
profits were ¥43.8 billion, a decrease of ¥2.0 billion, or 4.4%.
Goods Sales Operations
The unit cost of sales for petroleum rose. Due to this and other fac-
tors consolidated revenues reached ¥377.9 billion, a year-on-year
increase of ¥12.3 billion, or 3.4%. We took steps to cut operating
costs, and due to this and other factors operating income reached
¥5.7 billion, a year-on-year increase of ¥0.4 billion, or 7.5%.
Other Operations
In March 2008, we acquired a human resource services business.
Due to the impact of this acquisition and other factors, consoli-
dated revenues came to ¥28.6 billion, a year-on-year increase of
¥8.5 billion, or 42.3%. Due to the increase in operating costs and
other factors, operating income was ¥1.0 billion, a year-on-year
decrease of ¥0.2 billion, or 16.7%.
Results by region are summarized as follows:
Japan
Revenues decreased in distribution and transportation operations
due to decreased handling volumes for international-related cargo
by air freight forwarding. However, an increase in revenues in
goods sales operations and other businesses brought overall con-
solidated revenues in Japan to ¥1,696.1 billion, an increase of
¥18.6 billion, or 1.1%, year on year. Operating income was ¥38.6
billion, a decrease of ¥2.3 billion, or 5.6%, year on year. This was
due to the impact of the change to the depreciation and amortiza-
tion method resulting from the revision of the Japanese tax sys-
tem, and higher costs due to the sharp rise in fuel expenses.
The Americas
Exports in the air freight forwarding and marine and harbor
transportation business grew, as did handling volumes in the
warehousing business. As a result consolidated revenues were
¥59.8 billion, an increase of ¥3.0 billion, or 5.4%, year on year.
Operating income was ¥3.6 billion, an increase of ¥0.3 billion, or
10.5%, year on year.
Europe
Handling volumes increased in both the warehousing business
and the motor transportation business. In addition, there was an
impact from the appreciation of the euro, resulting in consolidated
revenues of ¥77.5 billion, an increase of ¥11.1 billion, or 16.7%,
year on year. However, due to the up-front costs of launching
new warehouses, operating costs increased 18.2% year on year
while operating income came to ¥3.0 billion, a decrease of ¥0.3
billion, or 10.3%, year on year.
Asia & Oceania
Exports and imports in the marine and harbor transportation busi-
ness grew, as did handling volumes in the warehousing business
and motor transportation business. In addition, there was an
increase in the number of consolidated subsidiaries. Due to these
and other factors, consolidated revenues rose ¥6.0 billion, or
5.8%, year on year to ¥109.6 billion. Operating income grew by
¥0.5 billion, or 12.6%, year on year to ¥5.0 billion.
Note: Figures shown do not include consumption taxes.
CASH FLOWFor the fiscal year under review, cash and cash equivalents
(“cash”) decreased by ¥25.4 billion year on year. With the addi-
tional impact of a modification in the scope of consolidation, total
cash flow came to ¥144.6 billion.
Cash Flow from Operating Activities
Funds obtained during the fiscal year as a result of operating
activities reached ¥90.0 billion, down from ¥123.0 billion in the
previous fiscal year. This figure was calculated by accounting for
such items as income before income taxes and minority interests
of ¥63.7 billion, depreciation and amortization expenses of ¥84.9
billion and income taxes paid of ¥18.8 billion.
38

Cash Flow from Investing Activities
Funds used in investing activities during the fiscal year came to
¥105.2 billion, up from ¥89.4 billion in the previous fiscal year. A
total of ¥118.0 billion was spent on investment for distribution
bases, provision and maintenance of warehouse facilities, and
acquisition of vehicles, among other activities, while disposal of
fixed assets brought in ¥9.0 billion.
Cash Flow from Financing Activities
Funds used in financing activities came to ¥10.2 billion, down
from ¥16.3 billion in the previous fiscal year. This figure includes
proceeds from long-term debt of ¥43.0 billion, a ¥64.1 billion
repayment of long-term debt, proceeds from issuing bonds of
¥20.0 billion and cash dividends of ¥9.4 billion.
FINANCIAL POSITIONAssets
Total assets at the end of the fiscal year were ¥1,297.4 billion, a
year-on-year decrease of ¥63.2 billion, or 4.7%. Current assets
were ¥498.1 billion, a decrease of ¥33.7 billion, or 6.4%, while fixed
assets were ¥799.2 billion, down ¥29.5 billion, or 3.6%. The primary
factors behind the fall in current assets were decreases in cash
and cash in banks, outstanding accounts for sales and accounts
receivables. The value of fixed assets includes an increase of ¥13.1
billion for buildings, and a decrease of ¥46.4 billion in marketable
securities based on the end-of-period valuation.
Liabilities and Shareholders’ Equity
Total liabilities at the end of the fiscal year were ¥776.5 billion,
a decrease of ¥66.5 billion, or 7.9%, year on year. Current liabil-
ities increased by ¥17.1 billion, or 3.6%, to ¥487.0 billion, while
long-term liabilities fell ¥83.7 billion year on year, or 22.4%, to
¥289.5 billion. The major factors behind the increase in current
liabilities include an increase in short-term redeemable bonds.
The major factors behind the decrease in long-term liabilities
include a decrease in bonds, long-term debt and provision for
retirement benefits.
Net assets amounted to ¥520.8 billion at the end of fiscal
2008, an increase of ¥3.3 billion, or 0.6%, from the end of fiscal
2007. The major contributor to the increase in net assets was
¥36.4 billion in net income for the period. In addition, the valuation
of marketable securities fell by ¥25.2 billion.
Total equity per share came to ¥489.26, a year-on-year
increase of ¥2.32. The shareholders’ equity ratio was 39.33%, an
increase of 2.0 percentage points.
Interest-bearing Debt
Interest-bearing debt at the end of the fiscal year decreased by
¥1.5 billion, or 0.4%, to ¥354.7 billion due to a reduction in bor-
rowed funds, an increase in commercial paper and other factors.
CAPITAL INVESTMENTThe Nippon Express Group carried out a total of ¥111.5 billion in
capital investment during fiscal 2008. This includes logistics bases
for the restructuring of domestic and international logistics, provi-
sion and maintenance of warehouse facilities, replacement of
motor vehicles and transport equipment, as well as leased equip-
ment for the handling of leases with customers.
Investment in plant and equipment by segment was as follows:(Millions of yen)
2008 Change(%)
Distribution and transportation 55,737 5.7
Goods sales 54,866 5.2
Other 1,075 (5.9)
Subtotal 111,680 5.4
Eliminations (106) —
Total 111,573 5.3
Dividend Policy
Nippon Express regards the return of profits to shareholders as
one of its most important policies. As it strives to build up its
operations, strengthen its financial soundness and improve profit-
ability, the Company intends to continually raise the value of its
shareholders’ equity as well as its dividend, while maintaining a
focus on dividend stability.
Nippon Express’ basic policy is to pay dividends from retained
earnings twice a year—one mid-term dividend and one dividend
at the end of the year. Decisions regarding these dividends are
taken at the Board of Directors meeting for the mid-term dividend
distribution and the General Shareholders’ Meeting for the year-
end dividend distribution.
At the 102nd General Shareholders’ Meeting on June 27, 2008,
we proposed and received approval for a normal dividend of ¥4
plus a dividend of ¥1 to commemorate the 70th anniversary of the
founding of our company, resulting in a total dividend of ¥5 per
share. Together with the ¥5 per share dividend for the mid-term (a
normal dividend of ¥4 and a commemorative dividend of ¥1), divi-
dends came to ¥10 per share for the year.
Retained earnings reinvested within the Company will be used
to expand sales of various transport products and improve trans-
portation efficiency. This is in line with our policy to make the best
use of such investments as provisioning and maintaining logistics
bases and replacing vehicles. Through these investments, we plan
to strengthen our financial situation and secure a stable founda-
tion for management.
39

CONSOLIDATED BALANCE SHEETSAs of March 31, 2008 and 2007
Millions of yen Thousands of U.S. dollars (Note 1)
ASSETS 2008 2007 2008
Current assets:
Cash and cash in banks (Notes 2, 3 and 4) ¥ 147,739 ¥ 173,507 $ 1,474,594
Trade receivables (Notes 2, 4 and 10)
Notes and accounts 300,357 309,635 2,997,880
Less: allowance for doubtful accounts (1,453) (1,805) (14,505)
Inventories (Note 2) 6,248 7,130 62,361
Deferred tax assets (Notes 2 and 8) 17,091 14,920 170,595
Other current assets 28,146 28,521 280,933
Total current assets 498,130 531,908 4,971,860
Property and equipment (Notes 2, 4 and 7):
Land 168,501 165,327 1,681,814
Vehicles 242,435 245,289 2,419,753
Buildings and structures 560,491 538,863 5,594,284
Machinery and tools 229,135 224,440 2,287,012
Property on leases 155,480 143,719 1,551,860
Construction in progress 7,758 11,391 77,441
Less: accumulated depreciation (778,397) (756,013) (7,769,209)
Net property and equipment 585,405 573,018 5,842,958
Investments and other assets:
Investments in securities (Notes 2 and 4) 129,994 177,279 1,297,480
Investments in subsidiaries and affi liates (Note 2) 13,098 11,946 130,736
Loans to employees 2,665 3,192 26,605
Others (Note 2) 68,111 63,348 679,822
Total investments and other assets 213,870 255,767 2,134,644
Total assets ¥ 1,297,406 ¥ 1,360,694 $ 12,949,462
The accompanying notes are an integral part of these statements.
FINANCIAL STATEMENTSNippon Express Co., Ltd. and consolidated subsidiaries
40

Millions of yen Thousands of U.S. dollars (Note 1)
LIABILITIES AND NET ASSETS (SHAREHOLDERS’ EQUITY) 2008 2007 2008Current liabilities:
Short-term bank loans (Note 4) ¥ 3,790 ¥ 4,986 $ 37,837
Current portion of long-term debt (Note 4) 113,916 63,660 1,137,004
Accounts payable 178,365 186,770 1,780,268
Deposits from employees 31,309 32,176 312,506
Income taxes payable (Note 8) 8,740 10,585 87,238
Other current liabilities (Notes 2 and 4) 150,916 171,719 1,506,305
Total current liabilities 487,039 469,898 4,861,160
Long-term liabilities:
Long-term debt, less current portion (Note 4) 194,178 245,513 1,938,107
Retirement benefi ts obligation (Notes 2 and 5) 54,193 87,342 540,906
Deferred tax liabilities (Notes 2 and 8) 18,833 24,658 187,978
Other long-term liabilities 22,337 15,763 222,955
Total long-term liabilities 289,543 373,279 2,889,948
Total liabilities 776,583 843,177 7,751,108
Minority interests — — —
Contingent liabilities (Note 10)
Net assets (Shareholders’ equity) (Note 11):
Common stock 70,175 70,175 700,421
Additional paid-in capital 26,909 26,909 268,588
Retained earnings 369,264 341,890 3,685,642
Less: treasury stock (Note 6) (11,504) (11,426) (114,829)
Net unrealized gains on securities (Note 2) 50,194 75,485 500,989
Net unrealized gains on hedge transactions (7) 5 (72)
Foreign currency translation adjustment 5,221 4,858 52,114
Minority interests 10,569 9,617 105,498
Total net assets 520,823 517,516 5,198,353
Total liabilities and net assets ¥ 1,297,406 ¥ 1,360,694 $ 12,949,462
The accompanying notes are an integral part of these statements.
41

CONSOLIDATED STATEMENTS OF OPERATIONS AND RETAINED EARNINGSFor the years ended March 31, 2008 and 2007
Millions of yen Thousands of U.S. dollars (Note 1)
2008 2007 2008
Revenues (Note 2) ¥ 1,901,433 ¥ 1,866,267 $ 18,978,280
Operating costs 1,769,799 1,735,242 17,664,435
Gross profi t 131,634 131,024 1,313,845
Selling, general and administrative expenses 83,132 80,699 829,744
Operating income 48,502 50,325 484,100
Other income and expenses:
Interest and dividend income 3,935 3,168 39,278
Interest expenses (4,379) (4,078) (43,710)
Gain on sales of securities, net 673 475 6,717
Gain on sales or disposal of property and equipment, net 1,474 2,125 14,717
Equity in earnings of unconsolidated companies (Note 2) 917 1,034 9,157
Gain on shifting to DC pension plan (Note 5) 7,858 — 78,430
Others, net 4,740 5,866 28,293
Income before income taxes and minority interests 63,721 58,918 636,011
Income taxes (Notes 2 and 8):
Current 16,991 20,961 169,591
Deferred 9,416 4,141 93,989
26,408 25,102 263,580
Minority interests (874) (607) (8,729)
Net income ¥ 36,439 ¥ 33,208 $ 363,701
Yen U.S. dollars
Per share data (Note 2):
Net income ¥ 34.94 ¥ 31.84 $ 0.3487
Cash dividends, applicable to earnings of the year 10.00 8.00 0.0998
The accompanying notes are an integral part of these statements.
42

CONSOLIDATED STATEMENTS OF SHAREHOLDERS’ EQUITYFor the years ended March 31, 2008 and 2007
Millions of yen
Common stock
Additional paid-in capital
Retained earnings
Treasury stock
Unrealized gain (loss) on
securities
Unrealized gain (loss) on derivatives
Foreign currency translation adjustment
Minority interests Total
Balance at March 31, 2007 ¥70,175 ¥26,909 ¥341,890 ¥(11,426) ¥ 75,485 ¥ 5 ¥4,858 ¥ 9,617 ¥517,516 Cash dividends (9,386) (9,386) Net income 36,439 36,439 Increase in treasury stock (Note 6) (111) (111) Decrease in treasury stock (Note 6) 0 33 34 Increase (Decrease) of consolidated subsidiaries 33 33 Increase (Decrease) of affi liated company 287 287 Net change during the year (25,291) (12) 362 952 (23,990)Balance at March 31, 2008 ¥70,175 ¥26,909 ¥369,264 ¥(11,504) ¥ 50,194 ¥ (7) ¥5,221 ¥10,569 ¥520,823
Thousands of U.S. dollars (Note 1)
Common stock
Additional paid-in capital
Retained earnings
Treasury stock
Unrealized gain (loss) on
securities
Unrealized gain (loss) on derivatives
Foreign currency translation adjustment
Minority interests Total
Balance at March 31, 2007 $700,421 $268,588 $3,685,642 $(114,829) $ 500,989 $ (72) $52,114 $105,498 $4,383,878 Cash dividends (93,691) (93,691) Net income 363,701 363,701 Increase in treasury stock (Note 6) (1,112) (1,112) Decrease in treasury stock (Note 6) 5 336 342 Increase (Decrease) of consolidated subsidiaries 334 334 Increase (Decrease) of affi liated company 2,870 2,870 Net change during the year (252,437) (127) 3,616 9,502 (239,446)Balance at March 31, 2008 $700,421 $268,588 $3,685,642 $(114,829) $ 500,989 $ (72) $52,114 $105,498 $5,198,353
The accompanying notes are an integral part of these statements.
Millions of yen
Common stock
Additional paid-in capital
Retained earnings
Treasury stock
Unrealized gain (loss) on
securities
Unrealized gain (loss) on derivatives
Foreign currency translation adjustment
Minority interests Total
Balance at March 31, 2006 ¥70,175 ¥26,908 ¥316,506 ¥(11,316) ¥84,314 — ¥1,617 ¥8,120 ¥496,326 Cash dividends (8,345) (8,345) Directors’ bonuses (182) (182) Net income 33,208 33,208 Increase in treasury stock (Note 6) (125) (125) Decrease in treasury stock (Note 6) 1 14 16 Increase (Decrease) of consolidated subsidiaries 62 62 Increase (Decrease) of affi liated company 641 641 Net change during the year (8,828) 5 3,241 1,497 (4,084)Balance at March 31, 2007 ¥70,175 ¥26,909 ¥341,890 ¥(11,426) ¥75,485 ¥5 ¥4,858 ¥9,617 ¥517,516
Thousands of U.S. dollars (Note 1)
Common stock
Additional paid-in capital
Retained earnings
Treasury stock
Unrealized gain (loss) on
securities
Unrealized gain (loss) on derivatives
Foreign currency translation adjustment
Minority interests Total
Balance at March 31, 2006 $594,453 $227,940 $2,681,121 $(95,857) $714,222 — $13,706 $68,792 $4,204,381 Cash dividends (70,693) (70,693) Directors’ bonuses (1,546) (1,546) Net income 281,305 281,305 Increase in treasury stock (Note 6) (1,059) (1,059) Decrease in treasury stock (Note 6) 8 119 127 Increase (Decrease) of consolidated subsidiaries 529 529 Increase (Decrease) of affi liated company 5,435 5,435 Net change during the year (74,782) 46 27,454 12,681 (34,600)Balance at March 31, 2007 $594,453 $227,948 $2,896,153 $(96,797) $639,440 $46 $41,160 $81,473 $4,383,878
43

CONSOLIDATED STATEMENTS OF CASH FLOWSFor the years ended March 31, 2008 and 2007
Millions of yen Thousands of U.S. dollars (Note 1)
2008 2007 2008Cash fl ows from operating activities: Income before income taxes and minority interests ¥ 63,721 ¥ 58,918 $ 636,011 Depreciation and amortization 84,957 80,054 847,968 Provision for allowance for doubtful accounts, net (4) (1,004) (48) Provision for retirement benefi ts, net (25,269) (6,920) (252,214) Gain on sale or disposal of property and equipment, net (1,468) (2,111) (14,654) Gain on shifting to DC pension plan (7,858) — (78,439) Expense of consolidation for small-package delivery business 1,208 — 12,062 Gain on sale or write-down of securities, net 676 1,154 6,752 Equity in earnings of unconsolidated subsidiaries and affi liates (917) (1,034) (9,157) Increase in accounts payable following the shift to the DC pension plan 16,004 — 159,741 Increase (decrease) in trade receivables 10,684 (13,925) 106,638 Decrease in inventories 905 875 9,033 Increase in other current assets 387 (2,279) 3,870 Increase (decrease) in accounts payable (9,523) 10,704 (95,058) Decrease (increase) in income taxes payable (1,845) (3,644) (18,415) Increase (decrease) in other current liabilities (17,771) 23,672 (177,375) Other (506) 4,108 (5,057) Sub-total 113,380 148,568 1,131,659 Interest and dividends received 4,277 3,317 42,689 Interest paid (4,361) (4,082) (43,533) Cash paid for the shifting to DC pension plan (4,027) — (40,199) Payment for promotional expenses on the combination of small package delivery business (273) — (2,725) Income taxes paid (18,899) (24,745) (188,635) Net cash provided by operating activities 90,096 123,058 899,253
Cash fl ows from investing activities: Payment for purchase of property and equipment (118,023) (96,152) (1,177,993) Proceeds from sale of property and equipment 9,046 12,287 90,296 Payment for purchase of securities (217) (4,083) (2,173) Proceeds from sale of securities 3,905 2,454 38,981 Change in investments (11) (3,955) (113) Net cash used in investing activities (105,299) (89,449) (1,051,002)
Cash fl ows from fi nancing activities: Proceeds from issuance of bonds 20,000 — 199,620 Change in short-term bank loans (1,849) 167 (18,462) Change in commercial paper 3,000 (5,500) 29,943 Net increase in securitized lease receivables (1,367) 4,883 (13,651) Proceeds from long-term debt 43,033 41,683 429,514 Payment of long-term debt (64,147) (49,095) 640,255 Redemption of bonds — (200) — Cash dividends (9,487) (8,443) 94,696 Net increase in treasury stock (77) (109) (770) Other 692 308 6,914 Net cash used in fi nancing activities (10,203) (16,305) (101,842) Effect of exchange rate changes on cash (88) 1,518 (888) Net increase in cash and cash equivalents (25,496) 18,821 (254,478) Cash and cash equivalents at beginning of year 170,109 150,615 1,697,868 Increase in cash and cash equivalents due to increase of consolidated subsidiaries 25 672 258 Cash and cash equivalents at end of year (Notes 2 and 3) ¥ 144,639 ¥ 170,109 $ 1,443,647
The accompanying notes are an integral part of these statements.
44

NOTES TO CONSOLIDATED FINANCIAL STATEMENTSNippon Express Co., Ltd. and consolidated subsidiaries
01BASIS OF PRESENTING FINANCIAL STATEMENTS
The accompanying consolidated financial statements of Nippon Express Co., Ltd. (“the Company”) and consolidated
subsidiaries are prepared on the basis of accounting principles generally accepted in Japan, which are different in certain
respects as to the application and disclosure requirements of International Financial Reporting Standards, and are compiled
from the consolidated financial statements prepared by the Financial Instruments and Exchange Law of Japan.
In order to facilitate the understanding of readers outside Japan, certain reclassifications are made to the consolidated
financial statements prepared for domestic reporting purposes. In addition, the notes to the consolidated financial
statements include information that is not required under accounting principles generally accepted in Japan but is
presented herein as additional information.
The yen amounts are rounded off in millions. Therefore, total or subtotal amounts do not correspond with the
aggregation of such account balance.
U.S. dollar amounts presented in the financial statements are included solely for convenience. The rate of ¥100.19 to
US$1.00, prevailing on March 31, 2008, has been used for translation into U.S. dollar amounts in the financial statements.
The U.S. dollar amounts are then rounded off in thousands. The inclusion of such amounts should not be construed as a
representation that Japanese yen amounts have been or could in the future be converted into U.S. dollars at that rate.
02SUMMARY OF SIGNIFICANT ACCOUNTING POLICIES
(a) Consolidation The consolidated subsidiaries included 212 domestic and 55 foreign majority-owned subsidiaries for the years ended
March 31, 2008, and 218 domestic and 55 foreign majority-owned subsidiaries for the years ended March 31, 2007. The excess cost of the Company’s investments in consolidated subsidiaries over the fair value of the net assets
of these companies at the dates of acquisition, consolidation goodwill, is amortized on the straight-line method over five years.
Investments in an unconsolidated subsidiary and 21 affiliates are stated at cost plus equity in undistributed income as of March 31, 2008 and an unconsolidated subsidiary and 18 affiliates as of March 31, 2007.
Investments in insignificant unconsolidated subsidiaries and affiliates have been carried at cost.
(b) Cash and cash equivalents Cash and cash equivalents presented in the accompanying consolidated statements of cash flows represent cash
on hand, bank deposits, which are payable on demand, and short-term investments with original maturities of three months or less which are easily convertible into cash and present insignificant risk of changes in value.
(c) Securities Other securities with market value are stated at market value on the balance sheet date. Cost of sold securities is
stated using the moving-average method. The differences between the acquisition costs and the carrying values of securities are recognized in unrealized gain [loss] on securities. Unrealized gain [loss] on securities, net of applicable income taxes, is charged to net assets. Other securities without market value are stated at cost determined by the moving-average method.
(d) Inventories Purchased and finished goods, work in process, raw materials, and supplies are valued at cost, primarily determined
by the moving-average method.
45

(e) Allowance for doubtful accounts General provision for doubtful receivables is provided by applying a certain reserve percentage of the receivables
based on experience from past transactions. When considered necessary, specific reserves are made based on the assessment of individual receivables.
Allowance for doubtful receivables for non-current assets, which were included in “Others” in “Investment and other assets,” were ¥1,992 million ($19,883 thousand) and ¥1,632 million in 2008 and 2007, respectively.
(f) Property and equipment, depreciation and lease transaction Property and equipment is stated at cost. Depreciation of property and equipment, except for building and leased assets, is mainly computed by the
declining-balance method over the applicable useful lives. Building and leased assets are depreciated by the straight-line method over the estimated lives and the lease contract period, respectively.
Under Japanese tax law, capital gains arising from disposals by expropriation of assets and other similar transactions are deducted from the cost of property and equipment acquired in substitution. Such capital gains amounted to ¥1,794 million ($17,905 thousand) and ¥6,183 million for the years ended March 31, 2008 and 2007, respectively.
Finance lease transactions, except for those which meet the condition that the ownership of the leased asset is substantially transferred to the lessee, are accounted for as operating lease transactions.
(Changes in depreciation rules for property and equipment) The Company and its domestic subsidiaries have adopted the Revision of the corporate tax law and changed the
depreciation method for property and equipment acquired after April 1st, 2007. As a result of this change, operating income and ordinary income as well as income before income taxes and
minority interests decreased by ¥1,375 million ($13,724 thousand), respectively.
(Additional information) For property and equipment acquired before March 31, 2007, the Company and its domestic subsidiaries amortized
the residual book-value, the amount equivalent to 5% of acquisition costs using a straight-line method over five years from the following fiscal year when the depreciation has ended to a final depreciable limit under the pre-revised Corporate Tax Law. The amortized amount is included in depreciation expenses.
As a result of this change, operating income, ordinary income and income before income taxes and minority interests decreased by ¥2,123 million ($21,189 thousand), respectively.
(g) Deferred charges Bond Issuance cost which can be deferred under the Corporation Law is charge to income as expended.
(h) Income taxes Deferred tax assets and liabilities are recognized for the future tax consequences attributable to differences between
the financial statement carrying amounts of existing assets and liabilities and their respective tax bases. Deferred tax assets and liabilities are measured using enacted tax rates expected to apply to taxable income in the years in which those temporary differences are expected to be recovered or settled. The effect of deferred tax assets and liabilities of a change in tax rate are recognized in income in the period that includes the enacted date.
(i) Retirement benefits obligation and pension plan Substantially all of the employees are entitled to lump-sum payments upon retirement or severance of employment.
Accrual for the lump-sum payments is stated at the present value of the estimated future obligations arising from services performed to the end of the fiscal year.
Certain consolidated subsidiaries have instead implemented the Qualified Corporate Pension Plan, which is a private non-contributory plan funded by the subsidiaries on the basis of an accepted actuarial method, and amortization of prior service cost has been charged to income.
The retirement benefit obligation is attributed to each period by the straight-line method over the years of service. The net retirement benefit obligation at transition was charged to operations as incurred.
46

03CASH AND CASH EQUIVALENTS
Reconciliation cash and cash equivalents at the end of year on the statements of cash flows for the years ended March
31, 2008 and 2007 are as follows:
Millions of yen Thousands of U.S. dollars
2008 2007 2008Cash and cash in banks in the consolidated balance sheets ¥147,739 ¥173,507 $1,474,588
Time deposits with maturities of over three months (2,905) (3,206) (28,994)
Time deposits pledged as collateral for debts (195) (190) (1,946)
Cash and cash equivalents at end of year in the statements of cash fl ows ¥144,639 ¥170,709 $1,443,648
Actuarial gain and loss are amortized in the year following the year in which the gain or loss is recognized primarily by the straight-line method over the period of the average remaining years of service of the employees.
The certain consolidated subsidiaries have separately provided an allowance for lump-sum retirement benefits to directors and statutory auditors, of which actual payments of such benefits are subject to the approval of the shareholders. Provision has been made for annual increases of such liability estimated systematically by management.
(Additional information) On Oct. 1, 2007, the Company has changed retirement benefit plan and the certain portion of the lump-sum
retirement plan is shifted to the Defined Contribution (DC) plan adopted by the “Guidance on Accounting for Transfer between Retirement Benefit Plans” (Accounting Standards Board of Japan Guidance No. 1).
Gains on shifting from a lump-sum retirement plan to DC pension plan are ¥7,858 million ($78,431 thousand), included in other income and expenses of this year.
(j) Per share data Basic net income per share is computed by dividing net income available to common shareholders, by the weighted-
average number of common shares outstanding for the period, retroactively adjusted for stock splits. Diluted net income per share in 2008 and 2007 is not disclosed because it is anti-dilutive.
(k) Consumption tax Consumption tax with respect to the Company and its domestic subsidiaries is accounted for using the tax-
excluded method.
04SHORT-TERM BANK LOANS, COMMERCIAL PAPERS AND LONG-TERM DEBT
(a) Short-term bank loans
Short-term bank loans are mostly unsecured and represented by short-term notes.
(b) Commercial paper
Commercial paper, due within one year, is ¥8,000 million ($79,848 thousand) and ¥5,000 million as of March 31, 2008
and 2007, respectively, which is unsecured and included in other current liabilities.
47

05RETIREMENT BENEFITS OBLIGATION AND PENSION PLAN
Retirement benefits obligation as of March 31, 2008 and 2007 consists of the following:
(d) Pledged assets
A summary of assets pledged as collateral for long-term and short-term bank loans and for other purposes as of
March 31, 2008 is as follows:
(c) Long-term debt
Long-term debt as of March 31, 2008 and 2007 is as follows:
Years ending March 31 Millions of yenThousands of U.S. dollars
2009 ¥39,372 $392,973
2010 82,664 825,076
2011 9,349 93,319
2012 31,517 314,577
2013 and thereafter 11,275 112,539
Millions of yenThousands of U.S. dollars
Property and equipment ¥10,256 $102,365
Time deposits 195 1,947
Trade receivables 906 9,047
Investment in securities 1,237 12,347
The annual maturities of long-term debt outstanding as of March 31, 2008 are as follows:
Millions of yenThousands of U.S. dollars
2008 2007 2008Projected benefi ts obligation ¥(153,331) ¥(178,043) $(1,530,411)
Plan assets at fair market value 64,014 85,909 638,932
Unrecognized actuarial net loss 38,970 9,946 388,963
Unrecognized prior service cost (3,306) (4,625) (33,006)
Retirement benefi ts obligation at end of year ¥ (53,653) ¥ (86,813) $ (535,522)
Millions of yenThousands of U.S. dollars
2008 2007 20081.59% 20 billion bonds due 2018 ¥ 20,000 — $ 199,620
1.93% 40 billion bonds due 2008 40,000 40,000 399,241
0.84% 100 million bonds due 2009 100 100 998
0.243%-3.833% loans from fi nancial institutions due 2008 to 2016 247,995 269,074 2,475,247
Total 308,095 309,174 3,075,107
Less: amount due within one year (113,916) (63,660) 1,136,999
¥194,179 ¥245,513 $1,938,108
48

06TREASURY STOCK
The Company held 19,383 thousand shares of treasury stock as of March 31, 2008 based on approval by the annual
shareholders’ meeting.
Pension expense for the years ended March 31, 2008 and 2007 included the following components:
Impact on the shifting from a lump-sum payment retirement plan to Defined Contribution pension plan are as follows:
Actuarial assumptions used to determine costs and obligations for retirement benefits are as follows:
The total liability in connection with the retirement benefits to directors and statutory auditors, which is included
in “Retirement benefits obligation,” is ¥539 million ($5,384 thousand) and ¥528 million as of March 31, 2008 and
2007, respectively.
Millions of yen Thousands of U.S. dollars
2008 2007 2008Service cost ¥ 7,722 ¥ 8,711 $ 77,075
Interest cost on projected benefi ts obligation 4,121 4,545 41,139
Expected return on plan assets (831) (706) (8,297)
Amortization of unrecognized actuarial net loss 1,553 1,254 15,505
Prior service cost recognized (548) (601) (5,476)
Net periodic pension cost 12,017 13,204 119,945
Proceeds from shift to DC pension plan (7,858) — (78,439)
Contribution for defi ned contribution pension plans 5,443 642 54,331
Total ¥ 9,602 ¥13,846 $ 95,838
Millions of yen Thousands of U.S. dollars
2008 2007 2008Decrease in retirement benefi t obligation ¥26,261 — $262,111
Unrecognized actuarial gain/loss (3,082) — (30,761)
Unrecognized prior service cost 765 — 7,635
Decrease in reserves for retirement benefi ts ¥23,944 — $238,985
Millions of yen
2008 2007Discount rate mainly 2.5% mainly 2.5%
Expected rate of return on plan assets mainly 2.5% mainly 2.5%
Recognition period of prior service cost 15 years 15 years
Amortization period of actuarial net loss (gain) 12–15 years 12–15 years
49

Amounts equivalent to depreciation expenses are calculated by the straight-line method over the period of the finance leases.
Amounts equivalent to interest expenses are not recognized due to immateriality.
As a lessor
(a) Amounts equivalent to acquisition costs, accumulated depreciation, and net balance as of March 31, 2008 and 2007,
concerning the finance lease assets are as follows:
Millions of yenThousands of U.S. dollars
2008 2007 2008Lease expenses paid ¥ 669 ¥ 897 $ 6,678
(Depreciation expenses) (669) (897) (6,678)
Millions of yen Thousands of U.S. dollars
2008 2007 2008Acquisition
costAccumulated depreciation
Net lease property
Acquisition cost
Accumulated depreciation
Net lease property
Acquisition cost
Accumulated depreciation
Net lease property
Vehicles ¥ 40,634 ¥ 25,618 ¥15,015 ¥ 39,345 ¥24,026 ¥15,318 $ 405,571 $ 255,698 $149,872
Machinery and tools 112,820 64,419 48,401 102,408 59,059 43,349 1,126,065 642,970 483,094
Other 25,432 12,210 13,222 20,301 10,618 9,683 253,844 121,873 131,970
Total ¥178,887 ¥102,248 ¥76,639 ¥162,056 ¥93,704 ¥68,352 $1,785,481 $1,020,542 $764,938
(c) Lease expenses paid and amounts equivalent to depreciation expenses during fiscal 2008 and 2007, are as follows:
Millions of yenThousands of U.S. dollars
2008 2007 2008Portion due within one year ¥ 619 ¥ 821 $ 6,186
Thereafter 1,066 1,033 10,646
Total ¥1,686 ¥1,854 $16,832
(b) Future payment obligations of finance lease as of March 31, 2008 and 2007, are as follows:
Millions of yen Thousands of U.S. dollars
2008 2007 2008Acquisition
costAccumulated depreciation
Net lease property
Acquisition cost
Accumulated depreciation
Net lease property
Acquisition cost
Accumulated depreciation
Net lease property
Vehicles ¥2,200 ¥1,134 ¥1,066 ¥1,795 ¥ 891 ¥ 904 $21,961 $11,319 $10,642
Machinery and tools 1,449 904 544 2,488 1,652 836 14,463 9,031 5,431
Other 137 61 76 226 112 114 1,371 612 759
Total ¥3,786 ¥2,100 ¥1,686 ¥4,511 ¥2,656 ¥1,854 $37,796 $20,963 $16,832
07LEASES
(1) Finance lease transactions, except for those which meet the conditions that the ownership of the lease assets is
substantially transferred to the lessee
As a lessee
(a) Amounts equivalent to acquisition costs, accumulated depreciation and net balance as of March 31, 2008 and 2007,
concerning the finance lease assets are as follows:
50

(c) Lease income received, depreciation expenses and amounts equivalent to interest income during fiscal 2008 and
2007, are as follows:
Amounts equivalent to interest income are calculated by the interest method based on an excess of the aggregate sum
of lease income over amounts equivalent to acquisition costs.
(b) Receivables from finance lease as of March 31, 2008 and 2007, are as follows:
(2) Future payment obligations of operating lease expenses as of March 31, 2008 and 2007, are as follows:
As a lessee
Millions of yenThousands of U.S. dollars
2008 2007 2008Portion due within one year ¥26,420 ¥23,560 $263,703
Thereafter 57,670 48,996 575,612
Total ¥84,091 ¥72,557 $839,316
Millions of yenThousands of U.S. dollars
2008 2007 2008Portion due within one year ¥11,168 ¥ 8,411 $111,474
Thereafter 77,889 57,892 777,420
Total ¥89,058 ¥66,303 $888,894
Millions of yenThousands of U.S. dollars
2008 2007 2008Lease income received ¥29,849 ¥27,337 $297,927
Depreciation expenses 26,115 23,858 260,654
Interest income 2,763 2,591 27,586
08INCOME TAXES
Income taxes applicable to the Company and consolidated subsidiaries comprise (1) corporation tax, (2) enterprise tax,
and (3) inhabitant tax. While the normal statutory tax rates were approximately 40.7 percent both in 2008 and 2007, these
income taxes resulted in effective tax rates of approximately 41.4 percent and 42.6 percent in 2008 and 2007, respectively.
The following table reconciles the above statutory tax rate to the Company’s effective tax rate for the years ended March
31, 2008 and 2007.
2008 2007Statutory rate 40.7% 40.7%
Non-deductible items 2.0 2.2
Non-taxable items (1.4) (1.3)
Impairment loss — —
Inhabitants’ minimum taxes 2.1 2.6
Tax credit — —
Other, net (2.0) (1.6)
Effective tax rate 41.4% 42.6%
51

The significant components of the Company’s deferred tax assets and liabilities as of March 31, 2008 and 2007 are as follows:
Millions of yenThousands of U.S. dollars
2008 2007 2008Deferred tax liabilities:
Current:
Accumulated depreciation ¥ 810 ¥ 793 $ 8,093
Other 148 364 1,483
Total deferred tax liabilities - current 959 1,158 9,576
Non-current:
Accumulated depreciation 18,995 17,182 189,592
Gain on securities contribution to employee’s retirement benefi ts trust 20,653 20,653 206,146
Unrealized gain on securities 34,568 51,998 345,032
Other 3,592 3,218 35,859
Total deferred tax liabilities - non-current 77,810 93,053 776,630
Total deferred tax liabilities ¥78,770 ¥ 94,211 $ 786,207
Total net deferred tax assets:
Current ¥17,091 ¥ 14,920 $ 170,595
Total net deferred tax liabilities:
Non-current (18,833) (24,658) (187,978)
Total ¥ (1,741) ¥ (9,738) $ (17,383)
Millions of yenThousands of U.S. dollars
2008 2007 2008Deferred tax assets:
Current:
Allowance for doubtful accounts ¥ 269 ¥ 445 $ 2,686
Accrued expenses 8,429 8,576 84,134
Enterprise tax payable 792 927 7,910
Lease transaction 3,898 3,670 38,910
Other 4,720 2,516 47,115
Total deferred tax assets - current 18,110 16,136 180,758
Non-current:
Allowance for doubtful accounts 543 534 5,421
Retirement benefi ts 48,264 61,325 481,734
Unrealized gain 1,985 1,959 19,820
Impairment loss 5,587 5,588 55,766
Other 10,286 6,069 102,666
Valuation allowance (7,749) (7,140) (77,343)
Total deferred tax assets - non-current 58,918 68,336 588,065
Total deferred tax assets ¥77,028 ¥84,472 $768,82452

09SEGMENT INFORMATION
(a) Industry segment information
Operations of the Company and its consolidated subsidiaries have been classified into three industry segments:
distribution and transportation, goods sales and other. The distribution and transportation segment includes railway
forwarding, motor transport, marine and harbor transportation, air freight and travel, warehousing, heavy haulage
and construction, in-factory work and other transport operations. The goods sales segment includes the sale of
vehicles, supplies for transportation, petroleum, LP gas, etc., as well as lease and maintenance operations.
The other segment includes mediation, planning and design, and management of real estate and a driving school.
Summarized financial information by industry segment for the years ended and as of March 31, 2008 and 2007 is as follows:
(b) Foreign operations
Summarized financial information on foreign operations for the years ended 2008 and 2007 is as follows:
Millions of yen
Distribution & transportation Goods sales Other Subtotal
Adjustment & eliminations Total
2008:
Revenues ¥1,600,988 ¥377,964 ¥28,629 ¥2,007,582 ¥(106,148) ¥1,901,433
Operating income 43,896 5,752 1,061 50,710 (2,208) 48,502
Identifi able assets 1,063,027 246,274 30,304 1,339,606 (42,200) 1,297,406
Depreciation & amortization 40,116 44,722 513 85,352 (394) 84,957
Capital expenditure 55,737 54,866 1,075 111,680 (106) 111,573
Millions of yen
Distribution & transportation Goods sales Other Subtotal
Adjustment & eliminations Total
2007:
Revenues ¥1,584,476 ¥365,578 ¥20,115 ¥1,970,171 ¥(103,904) ¥1,866,267
Operating income 45,940 5,351 1,275 52,567 (2,242) 50,325
Identifi able assets 1,129,514 243,601 17,516 1,390,632 (29,938) 1,360,694
Depreciation & amortization 34,928 45,230 283 80,442 (387) 80,054
Capital expenditure 52,719 52,144 1,142 106,006 (82) 105,923
Thousands of U.S. dollars
Distribution & transportation Goods sales Other Subtotal
Adjustment & eliminations Total
2008:
Revenues $15,979,520 $3,772,477 $285,752 $20,037,750 $(1,059,469) $18,978,280
Operating income 438,134 57,414 10,596 506,144 (22,043) 484,100
Identifi able assets 10,610,119 2,458,070 302,472 13,370,662 (421,200) 12,949,462
Depreciation & amortization 400,401 446,376 5,124 851,902 (3,934) 847,968
Capital expenditure 556,321 547,625 10,736 1,114,683 (1,060) 1,113,622
Millions of yenThousands of U.S. dollars
2008 2007 2008Revenue from foreign operations ¥402,692 ¥392,948 $4,019,290
Ratio to total revenue 21.2% 21.0% 21.2%
53

11SUBSEQUENT EVENT
(1) Basic agreement for combination of small-package delivery business with JP Post
Based on the basic agreement with JP Post on May 5, 2007, the basic agreement of combination with JP Post was
signed on April 25, 2008. Then, Nippon Express established a new company for combination of small-package
delivery business on June 1, 2008.
1. Overview of the new company is as follows:
Name: JP Express Co., Ltd.
Location: 1-3-2, Kasumigaseki, Chiyoda-ku, Tokyo (JP Post Building)
Paid-in capital: ¥300 million
2. Combination of target businesses (JP Post delivery business and Pelican delivery business) to be merged to create
a new company.
Currently an examination is being conducted concerning the details of the business combination and its impact
on business performance which, at this stage, is still unclear.
(2) Investigation by the Japan Fair Trade Commission
Nippon Express was investigated by the Japan Fair Trade Commission on April 20, 2008, for violation of the Anti-
monopoly Act, regarding the fuel surcharge added to freight charges for international air cargo transportation.
It is difficult to forecast the impact this will have on our financial results at the moment since the investigation by
the Commission is currently underway.
10CONTINGENT LIABILITIES
As of March 31, 2008, the Company and its consolidated subsidiaries were contingently liable as follows:
Millions of yenThousands of U.S. dollars
Notes discounted with banks ¥ 62 $ 620
Guarantees of loans, principally of unconsolidated subsidiaries and affi liates 1,889 18,862
54

REPORT OF INDEPENDENT AUDITORS
55

NIPPON EXPRESS U.S.A., INC.590 Madison Avenue, 24th Floor,New York, NY 10022, U.S.A.
NIPPON EXPRESS TRAVEL U.S.A., INC.720 Market Street, 6th Floor,San Francisco, CA 94102, U.S.A.
NEX TRANSPORT, INC.13900 State Route 287,East Liberty, OH 43319, U.S.A.
NIPPON EXPRESS DO BRASILRua Fortaleza 53, Bela Vista,São Paulo, SP CEP 01325-010, Brazil
NITTSU DO BRASIL COMERCIAL, LTDA.Rua Fortaleza 53, Bela VistaSão Paulo, SP, CEP 01325-010, Brazil NIPPON EXPRESS CHILE S.A.Lo Echevers 891, Modulo A-13Mercocentro Lo Echevers,Quilicura, Santiago, Chile
NIPPON EXPRESS CANADA, LTD.6250 Edwards Boulevard, Mississauga, Ontario L5T 2X3, Canada NIPPON EXPRESS DE MEXICO, S.A. DE C.V.Avenida Michoacan No. 20, Nave #9 CColonia Renovacion,C.P. 09209 Mexico, D.F., Mexico
NIPPON EXPRESS USA DE TIJUANA, S.A. DE C.V.Blvd. Bellas Artes #20240 B y C,Ciudad Industrial, DelegaciónMesa de Otay, Tijuana,Baja California, 22444, Mexico
THE AMERICAS
GLOBAL NETWORKSubsidiaries and Major Representative Offi ce
56

NIPPON EXPRESS (IRELAND) LTD.Unit 1, Northern Cross Business Park, North Road, Dublin 11, Ireland
NIPPON EXPRESS (U.K.) LTD.Heathrow 3602 Millington Road, Hayes,Middlesex UB3 4AZ, U.K.
NIPPON EXPRESS FRANCE, S.A.1 Rue Du Chapelier, B.P. 18177,95702 Roissy Aeroport Charles De Gaulle, France NIPPON EXPRESS (BELGIUM) N.V./S.A.Brucargo Bldg. 723, 1931 Zaventem, Belgium NIPPON EXPRESS (NEDERLAND) B.V.Cessnalaan 24, 1119 NL Schiphol-Rijk, The Netherlands
NIPPON EXPRESS EURO CARGO B.V.Cessnalaan 24, 1119 Nl Schiphol-Rijk, The Netherlands NIPPON EXPRESS TOURS (NEDERLAND) B.V.Cessnalaan 24, 1119 NL Schiphol-Rijk, The Netherlands NIPPON EXPRESS (DEUTSCHLAND) GMBHMarie-Bernays-Ring 23,41199 Moenchengladbach,F.R.GERMANY NIPPON EXPRESS (SCHWEIZ) AGGrindel Strasse 19, 8303 Bassersdorf,Switzerland NIPPON EXPRESS (ITALIA) S.R.L.Via Londra 12, 20090 Segrate (Mi), Italy
NIPPON EXPRESS DE ESPANA, S.A.Centro de Carga Aerea, Aeropuerto de Barajas,Parcela 2.1, Nave 2, 28042 Madrid, Spain
NIPPON EXPRESS PORTUGAL S.A.Aeroporto De Lisboa, Edifi cio 125, Piso 3, Gab 6, 1700 Lisbon, Portugal
NIPPON EXPRESS (RUSSIA) LIMITED LIABILITY COMPANYGapsalskaya street 5, lit. A,St. Petersburg, 198035, Russia
NIPPON EXPRESS (MIDDLE EAST) L.L.C.Lob21, Room No. 31,P.O. Box 17341, Jebel Ali, Dubai, United Arab Emirates
EUROPE
57

NIPPON EXPRESS (H.K.) CO., LTD.1101 Chinachem Golden Plaza,77 Mody Road, Tsim Sha Tsui East,Kowloon, Hong Kong
NIPPON EXPRESS (SHENZHEN) CO., LTD. B 105-36 Futian Free Trade Zone, Shenzhen, The People’s Republic of China
NIPPON EXPRESS (ZHUHAI F.T.Z.) CO., LTD.No. 27-1-1, Zhuhai Free Trade Zone,Hong Wan, Zhuhai, Guang Dong, The People’s Republic of China
NIPPON EXPRESS (CHINA) CO., LTD.Room 301, Bja Building,Tianzhu Airport Industrial Zone,10 Tianzhu Road, Shunyi District,Beijing, 101312, The People’s Republic of China
NIPPON EXPRESS (SHANGHAI) CO., LTD.11F, Jinan Tower No. 908East Daming Road, Shanghai, 200082, The People’s Republic of China
NIPPON EXPRESS GLOBAL LOGISTICS(SHANGHAI) CO., LTD.11, De Bao Lu, Wai Gao QiaoFree Trade Zone, Shanghai, The People’s Republic of China
NIPPON EXPRESS (SUZHOU) CO., LTD.No. 622 Changjiang Rd, Suzhou New District, Suzhou Jiangsu Province, 215011,The People’s Republic of China
SHANGHAI e-technology CO., LTD.6F, UC-Tower, 500 Fushan Road,Pudong New Area, Shanghai, 200122, The People’s Republic of China
NIPPON EXPRESS (ZHUHAI) CO., LTD.No. 1 Ping Dong 5 Road,Nan Pin High-Technology Industry Area,Zhuhai, Guang Dong, The People’s Republic of China
NIPPON EXPRESS (JIAXING) CO., LTD.Rm 415, BoYuang Bldg, No. 6 Dong Fang Rd,ZhaPu Development Zone,JiaXing, ZheJiang, 314201,The People’s Republic of China
NITTSU SINOTRANS LOGISTIC DALIAN LTD.No. 6 Haitian Rd, Free Trade Zone Of Dalian,Dalian, 116600, The People’s Republic of China
NIPPON EXPRESS CARGO SERVICE (SHENZHEN) CO., LTD.2F, West Side, Nippon Express WarehouseYantain Port Free Trade Zone Shenzhen, The People’s Republic of China
ASIA & OCEANIA
GLOBAL NETWORKSubsidiaries and Major Representative Offi ce
58

NIPPON EXPRESS (XIAMEN) CO., LTD.No. 23-1B, Xiangxing 1 Road,Xiangyu Free Trade ZoneXiamen, 361006, The People’s Republic of China
NIPPON EXPRESS (SINGAPORE) PTE. LTD.40 ALPS Avenue, Singapore 498781
NIPPON EXPRESS (MALAYSIA) SDN, BHD.10th Floor, West Tower, Wisma Consplant 1, No. 2 Jalan Ss16/4, 47500 Subang Jaya,Selangor Darul Ehsan, Malaysia
NITTSU TRANSPORT SERVICE (M) SDN, BHD.Lot 4286, Batu 12, Jalan Balakong,43300 Sri Kembangan, Selangor Darul Ehsan, Malaysia NIPPON EXPRESS (AUSTRALIA) PTY., LTD.Unit 1, 154 O’riordan Street, Mascot, N.S.W. 2020, Australia
NIPPON EXPRESS (NEW ZEALAND) LTD.37 Andrew Baxter Drive, Airport Oaks, Mangere,New Zealand
Nippon Express (INDIA) PTE., LTD.‘Logistics Park,’ Plot No. 7, Road No. 10,Export Promotion Indl. Park,Whitefi eld. Bangalore-560066., India
NIPPON EXPRESS (TAIWAN) CO., LTD.5Fl., No. 100, Section 3,Minsheng E. Rd., Songshan District,Taipei City 105, Taiwan, R.O.C.
NIPPON EXPRESS (THAILAND) CO., LTD.3195/16 11th Floor, Vibulthani Tower 1, Rama 4 Road, Klong Ton, Klong Toey Bangkok, 10110, Thailand
HI-TECH NITTSU (THAILAND) CO., LTD.Lake Rajada Offi ce Complex,193/88,21st Fl., Rachadapisek Road, Klong-Toey, Bangkok, 10110, Thailand
NIPPON EXPRESS ENGINEERING (THAILAND) CO., LTD.3195/16 11th Floor VibulthaniTower 1, Rama 4 Road, Klong Ton,Klong Toey, Bangkok, 10110, Thailand
NIPPON EXPRESS (PHILIPPINES) CORPORATIONUnit 20B Trafalgar Plaza, 105 H.V. Dela CostaSt., Salcedo Village, Makati City, 1227, Philippines NEP LOGISTICS, INCUnit 1 Lot 10 Phase 4, East Science Ave.Laguna Technopark, Inc. Binan,Laguna, Philippines
NEP DISTRIBUTORS SYSTEM, INCUnit 3 Elisco Warehouse #74,Elisco Road, Kalawaan Pasig City, Philippines
P.T.NITTSU LEMO INDONESIA LOGISTIKJl. Raya Cakung Cilincing Kav. 14,Cakung-Timur, Cakung, Jakarta, 13910, Indonesia
PT.NIPPON EXPRESS INDONESIASoewarna Business Park Block J lot 12Bandara International Soekarno-HattaJakarta, 19110, Indonesia
NEX GLOBAL LOGISTICS KOREA CO., LTD.11F Kyobo Securities B/D 26-4 Yeouido-Dong Yeoungdeungpo-Gu, Seoul, 150-737, Republic of Korea
NIPPON EXPRESS (VIETNAM) CO., LTD.Room 5.3 E-TOWN, 364 Cong Hoa Street,Tan Binh District, Ho Chi Minh City,Socialist Republic of Vietnam
Moscow Representative Offi ceMillennium House, Offi ce “H” (5F)Trubnaya str.12, Moscow, 103045, Russia
Johannesburg Representative Offi ce11 Pomona Road, Cnr. Hawthone Road,Kempton Park 1619, South Africa
New Delhi Representative Offi ceC/O Jayem Impex Private Limited.Plot No. 422, Phase- III, Udyog ViharGurgaon Haryana, 122016, India
Seoul Representative Offi ceC/O The Korea Express Co., Ltd.58-12, Seosomun-Dong, Chung-KuSeoul, 100-110, Republic of Korea Pusan Representative Offi ceKorea Express Bldg., Room No. 909,1211-1, Choryang-Dong,Dong-Ku, Pusan, 601-714, Republic of Korea
MAJOR REPRESENTATIVE OFFICES
59

Name
Headquarters
Formal establishment
Paid-in capital
Employees
URL
Nippon Express Co., Ltd.
1-9-3, Higashi Shimbashi, Minato-ku,Tokyo 105-8322, JapanTel: +81 (3) 6251-1111
October 1, 1937
¥70,175 million
38,517
http://www.nittsu.co.jp/
1. Railway utilization transportation business
2. Motor cargo transportation business
3. Motor vehicle utilization transportation business
4. Marine transportation business
5. Coastal shipping business
6. Harbor transportation business
7. Vessel utilization transportation business
8. Air freight forwarding business
9. Cargo transportation business and freight utilization busi-ness other than those mentioned in the foregoing items
10. Cargo transportation agency business
11. Warehousing business
12. Construction business
13. Customs brokerage business
14. Express clearing business
15. Air transportation agency business
16. Damage insurance agency business
17. Packing and packaging business
18. Packing, display and storage of drugs, quasi-drugs, cosmetics and medical equipment
19. Travel business
20. Transportation, erection and installation of heavy cargo and business activities incidental thereto
21. Sales and purchases, leasing and letting of immovables and business activities incidental thereto
22. Guarding business
23. Employee dispatching business
24. Industrial waste disposal service
25. Special correspondence delivery service
26. Collection and disposition of physical distribution informa-tion and incidental business thereto
27. Business incidental to all items mentioned above
28. Investments in and loans for all items mentioned above
Areas of operations
COMPANY INFORMATION (As of March 31, 2008)
60

61
200770th anniversary of the founding of Nippon Express
Nippon Express (India) Private Limited, Nippon Express Russia LLC and Nippon Express (Middle East) L.L.C. are established
Acquisition adds ocean cargo division to Nippon Express (Taiwan) Co., Ltd.
200850th anniversary of Nippon Express’ fi rst venture into overseas markets
1981Nippon Express (U.K.) Ltd., and Nippon Express (Deutschland) GmbH are established
1984Nippon Express Tours (Europe) Ltd. and Nippon Express (Malaysia) Sdn. Bhd. are established
1983Nippon Express (Belgium) N.V./S.A. and Nippon Express Canada Ltd. are established
1992More than 200 bases outside Japan
2001Number of overseas employees exceeds 10,000
1994Shanghai Express International Co., Ltd. and Nippon Express (Shenzhen) Co., Ltd., are established
1995Nippon Express Philippines Corporation is established
1996Representative offi ces open in Hanoi and Ho Chi Minh City
The offi ce in Johannesburg reopens
1990Nippon Express (New Zealand) Ltd., is establisheden in Singapore,
1985Nippon Express (Australia) Pty., Ltd., Nippon Express France, S.A., and Nippon Express Travel U.S.A., Inc. are established
e) Pte. Ltd., is
d) B.V. is established
c., is established
Ltd. and Nippon e established
1986Nippon Express (Italia) S.R.L. is established
1987Nippon Express (Schweiz) AG is established
1988Nippon Express de Espana, S.A. is established
1989Nippon Express (Thailand) Co., Ltd., is established
1997Nippon Express (Zhuhai) Co., Ltd., Chile S.A. and P.T. Nittsu Lemo Indonesia Logistik are established
1998Representative offi ce opens in Budapest
1999Number of overseas employees exceeds 8,000
2006Nippon Express (St. Petersburg) LLC established
Nippon Express’ safety symbol, created to mark the company’s 70th anniversary
s 1980s 1990s 2000s
1999Transports the Liberty Leading the People
nter-ka
1985Performs services for International Exposition in Tsukuba, Japan
1998Transports the Statue of Liberty scale model from Paris
Museum of Logistics opens
2000Carries out moving work in accordance with the reorganization of government ministries and agencies
2002Carried out transportation work related to the hosting of the FIFA World Cup soccer tournamento
1990Performs services for Flower and Greenery Exposition
1991Nippon Express moves Tokyo Metropolitan Government Offi ce
1982Transports Moai statues from Easter Island
2005Performed services for The 2005 World Exposition Aichi, Japan
2006Transported the giant mural “The Myth of Tomorrow,”painted by Taro Okamoto
1981The name Simple Pelican Box is changed to Pelican
1982The Pelican service extended to overseas destinations
1983Pelican services for golfers and skiers begin
1984VAN system begins operation
1986Chakubarai Pelican service (COD service) begins
1987Daibiki Pelican service (another class of COD service) begins
1989Cool Pelican service begins
1997Recyclable moving/packing materials are developed
Global distribution information system “N-SHATLE” is developed
“Pro Konpo” service is launched
The Eco-Business Division is established
2005New Pelican Delivery Time Frame Specifi cation service begins
20th anniversary of the Nittsu Family Concert
2006Eco-Recycle Express and Eco-Recycle Box sale launched
“Ecology Konpo” service receives Eco Products Award, the Minister’s Award from the Ministry of Land, Infrastructure and Transport
1993Reusable moving materials are developed
1996Full operation of integrated clerical work pro-cessing system begins
2000The fi rst Environmental report is issued
Cool Pelican service (chilled transportation) is launched
nnecting Tokyo and pened
foot, fi ve-ton
rvice is launched
2003“Ecology Konpo” home removal product launched
The Compliance Department is established
1991The corporate committee is established to ad-dress environmental issues
Super Pelican service is launched
The REWARDS inventory management system begins operation
1992Electric vehicles are introduced
2002Number of low-pollution vehicles introduced exceeded 1,000
2004New IT system commences operation
CSR report 2007
H i s tory of S us ta i n e d G r ow t h a n d
rita
Stock listing
Number of shares
Number of shareholders
Stock transfer agent
Tokyo, Osaka
Total number of shares issued: 3,988,000,000
Total number of shares outstanding: 1,062,299,281
86,672
Mitsubishi UFJ Trust and Banking Corporation
Distribution of Shares
By type of shareholders By size of shareholding
Major shareholders
Stock price movement
0
30,000
60,000
90,000
120,000
150,000
0
200
400
800
600
1,000
19984
19994
20004
20014
20024
20034
20044
20054
20064
20074
20084
■ Financial institutions
■ Individuals, others
■ Overseas corporate
■ Other corporate
■ Securities companies
■ Treasury stock
44.6%
19.8%
26.4%
6.4%
0.9%
1.8%
■ Individuals, others
■ Other corporate
■ Overseas corporate
■ Financial institutions
■ Securities companies
97.7%
1.5%
0.5%
0.2%
0.1%
1,062,299,281shares
86,672shareholders
Number of shares held(Thousands of shares)
Voting share percentage(%)
Asahi Mutual Life Insurance Company 65,474 6.2
The Master Trust Bank of Japan, Ltd. (Account in Trust) 53,084 5.0
Mizuho Bank, Ltd. 51,766 4.9
Nipponkoa Insurance Co., Ltd. 50,294 4.7
Japan Trustee Services Bank, Ltd. (Account in Trust) 47,027 4.4
Mizuho Corporate Bank, Ltd. 41,477 3.9
Japan Trustee Services Bank, Ltd. (Account in Trust No. 4) 28,204 2.7
Nippon Express Employees’ Shareholding Association 23,384 2.2
JPMorgan Chase Bank 380055 22,954 2.2
The Bank of Tokyo-Mitsubishi UFJ, Ltd. 20,554 1.9
SHARE INFORMATION (As of March 31, 2008)
(Thousands of shares)
(Yen)
DIC541 特色赤
日通英文AR_表紙観音.indd 2 08.9.12 2:37:35 PM
(2,1) -2- 日通英文AR_表紙観音.indd 08.9.12 2:37:36 PM(2,1) -2- 日通英文AR_表紙観音.indd 08.9.12 2:37:36 PM

Printed in Japan
Our Success Story ContinuesV A L U E C R E A T I O N F R O M P E R F O R M A N C E A N D I N N O V A T I O N
ANNUAL REPORT 2008
Year Ended March 31, 2008NIP
PO
N E
XP
RE
SS
CO
., LTD. A
NN
UA
L RE
PO
RT 20
08
1-9-3, Higashi-Shimbashi, Minato-ku, Tokyo 105-8322, Japan
Phone: +81 (3) 6251-1111
URL: http://www.nittsu.co.jp/
日通英文AR_表紙観音.indd 1 08.9.12 2:36:36 PM
(1,1) -1- 日通英文AR_表紙観音.indd 08.9.12 2:36:50 PM(1,1) -1- 日通英文AR_表紙観音.indd 08.9.12 2:36:50 PM