nmhc research foundati...ry 2020 the u.s. student housing market 14 graduate student housing choices...
TRANSCRIPT
|
NMHC Research Foundation | JANUARY 2020 THE U.S. STUDENT HOUSING MARKET
About NMHC and the NMHC Research Foundation 3
About the Authors 4
Executive Summary 5
Key Opportunities 6
Methodology 9
Trends 17
Going Forward 27
Conclusion 30
Bibliography 31
© 2020, National Multifamily Housing Council
All rights reserved. The text portions of this work may not be reproduced or transmitted in any form or
by any means, electronic or mechanical, including photocopying, recording, or by information storage
and retrieval systems, without permission in writing from the publisher. The views expressed are the
authors’ and do not necessarily represent those of the National Multifamily Housing Council.
NMHC Research Foundation | JANUARY 2020 THE U.S. STUDENT HOUSING MARKET
Based in Washington, D.C., the National Multifamily Housing Council (NMHC) is
the leadership of the apartment industry. We bring together the prominent own-
ers, managers and developers who help create thriving communities by providing
apartment homes for 40 million Americans, contributing $3.4 trillion annually to
the economy. NMHC provides a forum for insight, advocacy and action that ena-
bles both members and the communities they help build to thrive. For more in-
formation, contact NMHC at 202/974-2300, email the Council at [email protected]
or visit NMHC's website at www.nmhc.org.
In 2016, NMHC formed a non-profit (501(c)(3)) Research Foundation to produce
research that will further support the apartment industry’s business interests. The
work supported by the NMHC Research Foundation raises the industry’s standard
of performance and encourage worldwide investment in the sector.
The NMHC Research Foundation funds unique and original research on a wide
range of topics, including issues related to development and redevelopment activ-
ity, affordable and workforce housing, demographics, tax policy, regulatory envi-
ronment and zoning and land use, among others.
In 2018, NMHC formed the Student Housing Research Fund as part of the NMHC
Research Foundation to conduct research focused on the student housing indus-
try to address the paucity and narrowness of research in the industry. This is the
first report from this Fund.
For more information, visit www.nmhc.org/Research-Foundation.

NMHC Research Foundation | JANUARY 2020 THE U.S. STUDENT HOUSING MARKET
This white paper was prepared by Eigen 10 Advisors, LLC, which provides com-
mercial real estate consulting services in the areas of market and investment analyses, capital formation, investor communications, asset and partner due dili-gence, portfolio strategy and data analytics.
Paige Mueller is a co-founder of Eigen 10 Advisors, LLC. She has decades of expe-
rience working with both limited partners and general partners, including the de-velopment of a pension consulting practice that approved $2.5 billion in multiple
property types and vehicles. She previously worked at GIC Real Estate, one of the largest global sovereign wealth firms, and LaSalle Investment Management, where she provided support for investment, brokerage, REIT, site selection and knowledge management teams. She graduated with an MBA in Finance from Indi-
ana University, teaches market analysis at UC Berkeley and is recognized as a CRE
and Hoyt Fellow. She can be contacted at [email protected]. Jeffrey Havsy is a strategic advisor to Eigen 10 Advisors, LLC. Prior to that, he was
CBRE’s Americas Chief Economist and Managing Director of CBRE-Econometric
Advisors where he provided thought leadership on real estate trends, the macro-economy and economic events. Before joining CBRE, he was the NCREIF Director
of Research and Global Strategist with Property & Portfolio Research, leading the company’s global expansion effort by coordinating real estate market coverage
across North America, Europe and Asia. As a Vice President at Equity Office Prop-
erties, he spearheaded long-term strategic research projects to support and ad-
vance the company’s $25 billion portfolio and future expansion. He is a Homer Hoyt Fellow and Counselor of Real Estate. Jeff holds a Masters in Economics from the University of Virginia and a B.A. in Economics from Lehigh University. He can be contacted at [email protected].

NMHC Research Foundation | JANUARY 2020 THE U.S. STUDENT HOUSING MARKET
•
•
•
•
•
1 US Dept. of Education, National Center for Education Statistics (NCES), 2019 estimates. 2 Excludes university owned properties, students who live with parents and students who own their housing.

NMHC Research Foundation | JANUARY 2020 THE U.S. STUDENT HOUSING MARKET
•
•
•
•
OPPORTUNITY #1: SUPPLY-DEMAND BALANCE AND HIGH GROWTH MARKETS
As in other housing types, forward-looking demographic analyses, including income and growth patterns, should be carefully considered. While some schools are already facing closures and declining enrollment, others continue to grow, even in excess of new supply. Fiscal conditions have not recovered since the Great Financial Crisis of 2008-09 in many states, reducing the overall amount of new university-owned hous-ing throughout the U.S. since 2011 and thus increasing the need for privately owned housing where enrollments continue to rise.
OPPORTUNITY #2: EFFICIENCIES AND MARKET SHARE
Despite the recent institutionalization of the market, significant opportunities remain to increase market share. First, a review of the housing markets for the 70 largest four-year universities shows that 55 percent of the rental housing market is less than 10 units in size, and 80 percent of the rental stock is less than 50 units in size, indicat-ing that a large ‘mom & pop’ market remains. Our sample of nearly 900,000 student housing and 5.4 million student competitive properties is almost entirely larger than 80 units.
3 RealPage: Second quarter 2019 data

NMHC Research Foundation | JANUARY 2020 THE U.S. STUDENT HOUSING MARKET
Second, portfolios of student housing properties remain small, even among institu-tional owners. Fewer than 20 companies own 25 or more properties, indicating op-portunities to increase scale and potentially improve both operational efficiencies and access to capital.
OPPORTUNITY #3: AFFORDABILITY
The student population is severely income constrained. Thirty-four percent of un-dergraduates and 38 percent of graduate students earn less than $20,000 per year, even after considering parent income for dependent students. More than eight per-cent of post-secondary students are at risk of homelessness. Unit sizes began to shrink after 2010, but only slightly. The race to provide amenity-heavy units to cap-ture the top rents in the market is leaving many students behind and creating higher vacancy in newer units. Demographics at each university should be carefully re-viewed.
OPPORTUNITY #4: DOUBLE OCCUPANCY AND FLEXIBLE PRICING
In addition to providing more affordable space for students, double occupancy may provide higher income per unit than single occupancy. However, only five percent of student housing units built since 2010 provide double occupancy, which is highest (at nearly 18 percent) for units built before 1970. Some property owners provide flexible pricing plans -- allowing either single occupancy or double occupancy -- to maximize revenues, while others use creative short-term and daily rental strategies for vacant units.
OPPORTUNITY #5: THE RIGHT AMENITY MIX
A recent student survey indicated that the amenities most important to students are those that create functional, lifestyle efficiencies.4 These include laundry, parking, washers and dryers, Wi-Fi, inclusion of utilities and furniture. High-end amenities, such as pools, clubhouses and fitness rooms, were rated as important by less than 20 percent of the students. This is an advantage for the smaller ‘mom & pop’ proper-ties, which could much more easily include ‘more important’ low-cost rather than ‘less important’ high-cost amenities.
OPPORTUNITY #6: INCREASING DENSITY AND MIXED USE
Density is rising as student housing is getting closer to campus, and most new student housing and student competitive properties are either mid- or high-rise properties. The third highest student expenditure after tuition and room is food. In fact, food costs at universities with the highest-rated food quality average $578 per month as compared to average student housing rent of $637 per month. Where density al-lows, student housing developers may want to consider mixed-use properties that
4 "What Amenities Do Students Actually Care About," Student Housing Business.com, November/December 2018.
NMHC Research Foundation | JANUARY 2020 THE U.S. STUDENT HOUSING MARKET
include food options, similar to other rental housing and office formats in population-dense areas. Fast, low-cost food formats are frequently rated as high quality on campus environments.
NMHC Research Foundation | JANUARY 2020 THE U.S. STUDENT HOUSING MARKET
5 U.S. Census, 2018 Table B14001. 6 National Center for Education Statistics, 2018 Digest, 2017 Fall Data, Table 301.10. 7 This includes both Title IV institutions and private for-profit schools. 8 U.S. Department of Education, National Center for Education Statistics.

NMHC Research Foundation | JANUARY 2020 THE U.S. STUDENT HOUSING MARKET
Institution Type
%
Undergraduate
% Post-
Baccalaureate
Public 4-year 35.0% 46.7%
Public 2-year 39.1% 0.0%
Public < 2-year 0.3% 0.0%
Private nonprofit 4-year 15.1% 43.0%
Private nonprofit 2-year 0.5% 0.0%
Private nonprofit < 2-year 0.0% 0.0%
Private for profit 4-year 5.7% 10.3%
Private for profit 2-year 2.3% 0.0%
Private for profit < 2-year 1.9% 0.0%
Total 100% 100%
Total # 17,036,778 2,940,492
Source: National Center for Education Statistics, PowerStats, 2015-16 Data
9 National Center for Education Statistics, 2018 Digest, 2017 Fall Data, Table 303.45. 10 National Center for Education Statistics, 2018 Digest, 2017 Fall Data, Table 303.45. 11 National Center for Education Statistics, 2018 Digest, 2017 Fall Data, Table 303.45.

NMHC Research Foundation | JANUARY 2020 THE U.S. STUDENT HOUSING MARKET
12 As of Fall 2019. Estimates from this section were gathered from NCES Tables 303.70 and 303.80.

NMHC Research Foundation | JANUARY 2020 THE U.S. STUDENT HOUSING MARKET
2018-19 Private School Enrollment Growth Estimates*
Total Nonprofit For-profit Total Nonprofit For-profit Total Nonprofit For-profit
2012-17 Avg -2.3% 0.6% -10.3% -10.0% 6.0% -11.9% 0.4% 1.1% -2.8%
2018-19 Avg 0.3% 2.1% -7.6% 0.4% 7.4% -1.5% 0.4% 1.0% -2.8%
*Source: NCES Table 303.70; Figures in blue are calculated by Eigen 10 Advisors, LLC.
Undergraduate 4-Year Schools Undergraduate 2-Year Schools Graduate
2018-19 Private School Enrollment Growth Estimates*
Total Nonprofit For-profit Total Nonprofit For-profit Total Nonprofit For-profit
2012 100.0% 69.7% 30.3% 100.0% 10.0% 90.0% 100.0% 80.3% 19.7%
2017 100.0% 80.9% 19.1% 100.0% 20.6% 79.4% 100.0% 83.4% 16.6%
2019 100.0% 83.8% 16.2% 100.0% 23.6% 76.4% 100.0% 84.4% 15.6%
*Source: NCES Table 303.70; Figures in blue are calculated by Eigen 10 Advisors, LLC.
% Total Private School Enrollment % Total Private School Enrollment
Undergraduate 4-Year Schools Undergraduate 2-Year Schools Graduate
% Total Private School Enrollment
13 NCES PowerStats, 2015-16 data.
NMHC Research Foundation | JANUARY 2020 THE U.S. STUDENT HOUSING MARKET
14 Graduate student housing choices were estimated from NCES 1993-95 and 1996-99 data for all graduate stu-
dents, regardless of college type. 15 National Center for Education Statistics, PowerStats, 2015-16 data. 16 National Center for Education Statistics, PowerStats, 2015-16 data.

NMHC Research Foundation | JANUARY 2020 THE U.S. STUDENT HOUSING MARKET
17“Higher Education, Actions Needed to Improve Access to Federal Financial Assistance for Homeless and Foster Youth,” United States Government Accountability Office, May 2016. 18“Barriers to Success: Housing Insecurity for U.S. College Students,” U.S. Department of Housing and Urban De-velopment, February 2015. 19 Per HUD definition: https://files.hudexchange.info/resources/documents/AtRiskofHomelessnessDefinition_Criteria.pdf 20“Higher Education, Actions Needed to Improve Access to Federal Financial Assistance for Homeless and Foster Youth,” United States Government Accountability Office, May 2016.

NMHC Research Foundation | JANUARY 2020 THE U.S. STUDENT HOUSING MARKET

NMHC Research Foundation | JANUARY 2020 THE U.S. STUDENT HOUSING MARKET
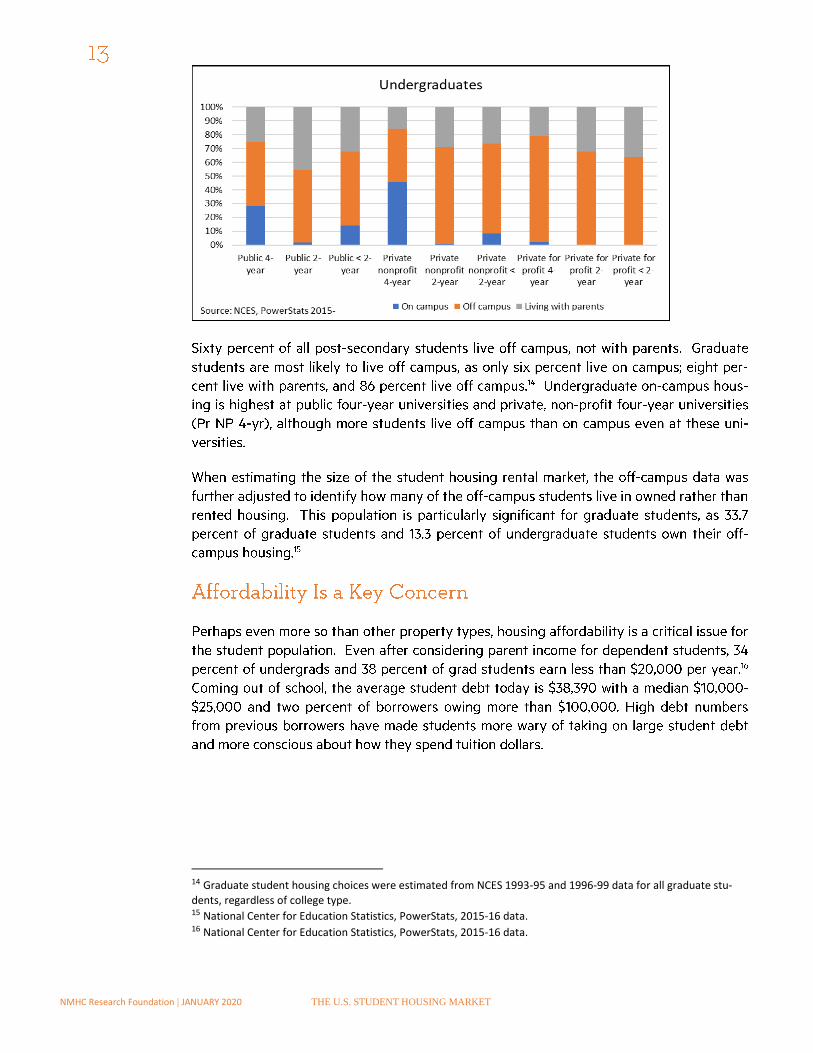
Undergraduate Students 2019 Housing Estimates
On Campus Parents Owned Rented
Public 4 year 1,826,391 1,629,816 937,721 2,947,477
Public 2 year 81,155 2,220,955 813,146 2,555,910
Private 4 year 1,172,527 487,581 419,343 1,318,093
Private 2 year 789 60,076 41,609 130,788
< 2 year 6,631 59,007 32,821 103,165
Total 3,087,493 4,457,434 2,244,641 7,055,432
Total 16,877,000
Source: Eigen 10 Advisors, NCES
Graduate Students 2019 Housing Estimates
On Campus Parents Owned Rented
Public 4 year 91,013 120,372 495,684 760,144
Private 4 year 96,399 127,496 525,020 805,133
Total 187,412 247,867 1,020,704 1,565,277
Total 3,027,000
Source: Eigen 10 Advisors, NCES
21 RealPage: Second quarter 2019 data.
NMHC Research Foundation | JANUARY 2020 THE U.S. STUDENT HOUSING MARKET
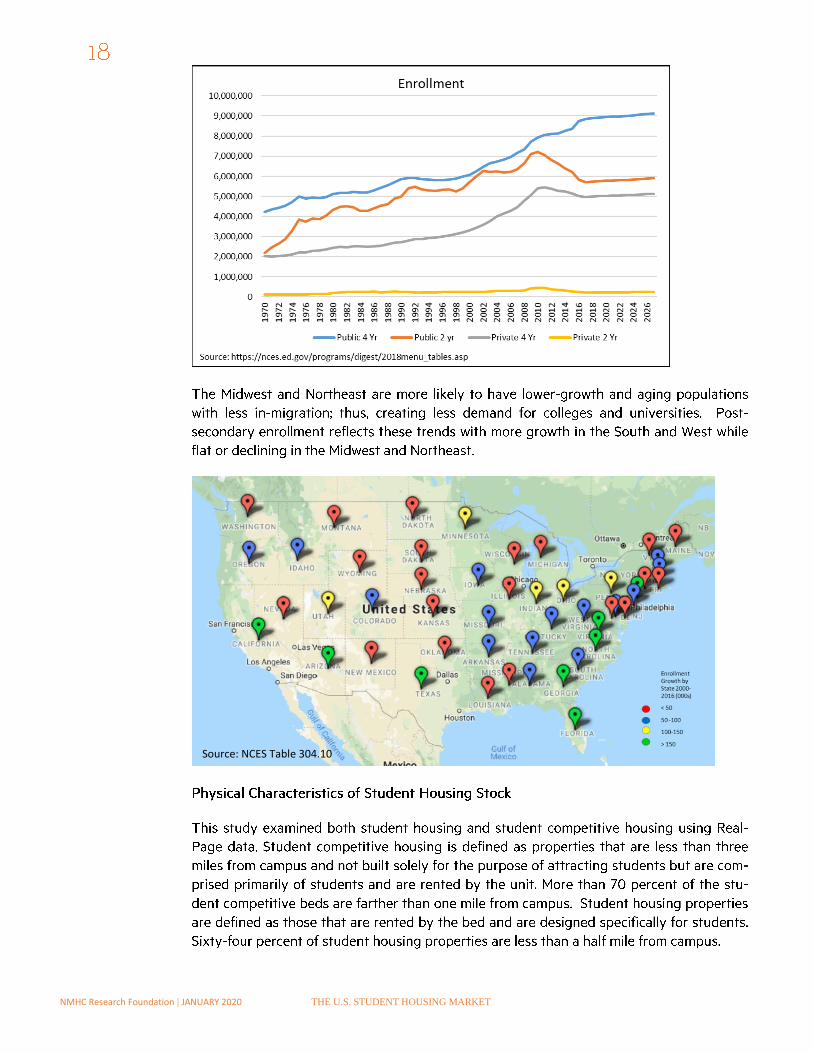
22 Source: NCES. Note that data through 1995 are for institutions of higher education, while later data are for degree-granting institutions. Degree-granting institutions grant associate’s or higher degrees and participate in Title IV federal financial aid programs. The degree-granting classification is very similar to the earlier higher educa-tion classification, but it includes more 2-year colleges and excludes a few higher education institutions that did not grant degrees.
NMHC Research Foundation | JANUARY 2020 THE U.S. STUDENT HOUSING MARKET
Source: NCES Table 304.10
NMHC Research Foundation | JANUARY 2020 THE U.S. STUDENT HOUSING MARKET

NMHC Research Foundation | JANUARY 2020 THE U.S. STUDENT HOUSING MARKET

NMHC Research Foundation | JANUARY 2020 THE U.S. STUDENT HOUSING MARKET
NMHC Research Foundation | JANUARY 2020 THE U.S. STUDENT HOUSING MARKET
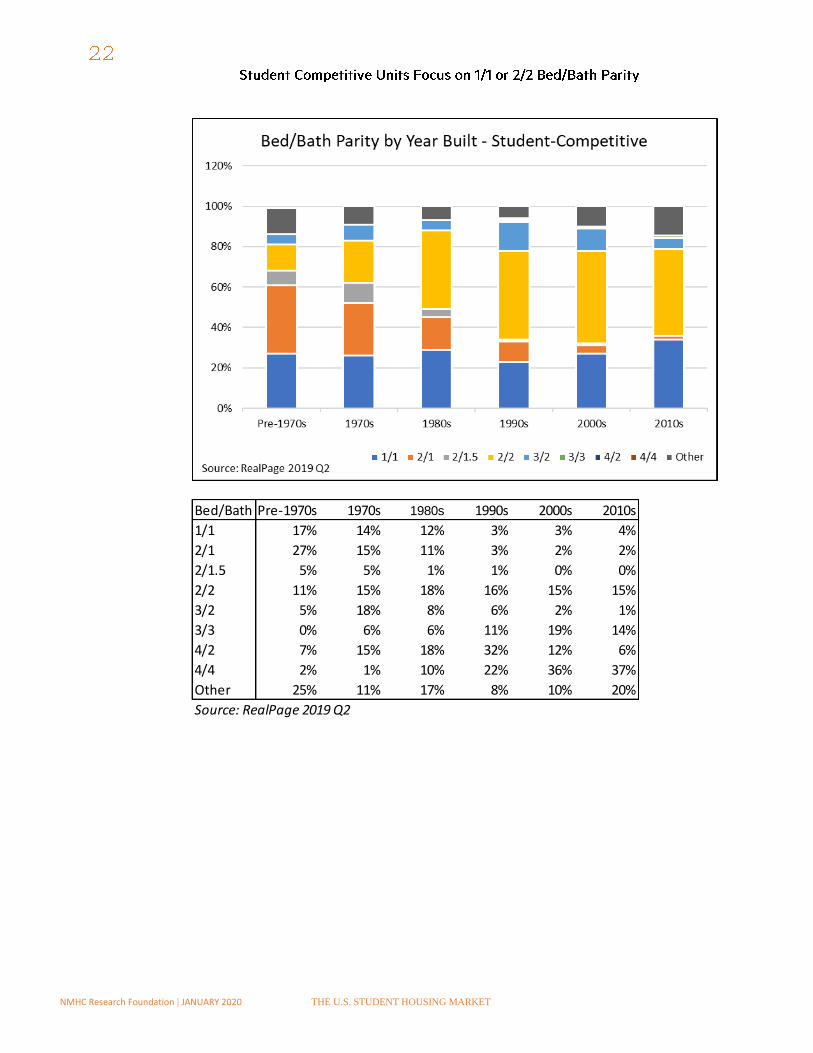
Bed/Bath Pre-1970s 1970s 1980s 1990s 2000s 2010s
1/1 17% 14% 12% 3% 3% 4%
2/1 27% 15% 11% 3% 2% 2%
2/1.5 5% 5% 1% 1% 0% 0%
2/2 11% 15% 18% 16% 15% 15%
3/2 5% 18% 8% 6% 2% 1%
3/3 0% 6% 6% 11% 19% 14%
4/2 7% 15% 18% 32% 12% 6%
4/4 2% 1% 10% 22% 36% 37%
Other 25% 11% 17% 8% 10% 20%
Source: RealPage 2019 Q2
NMHC Research Foundation | JANUARY 2020 THE U.S. STUDENT HOUSING MARKET
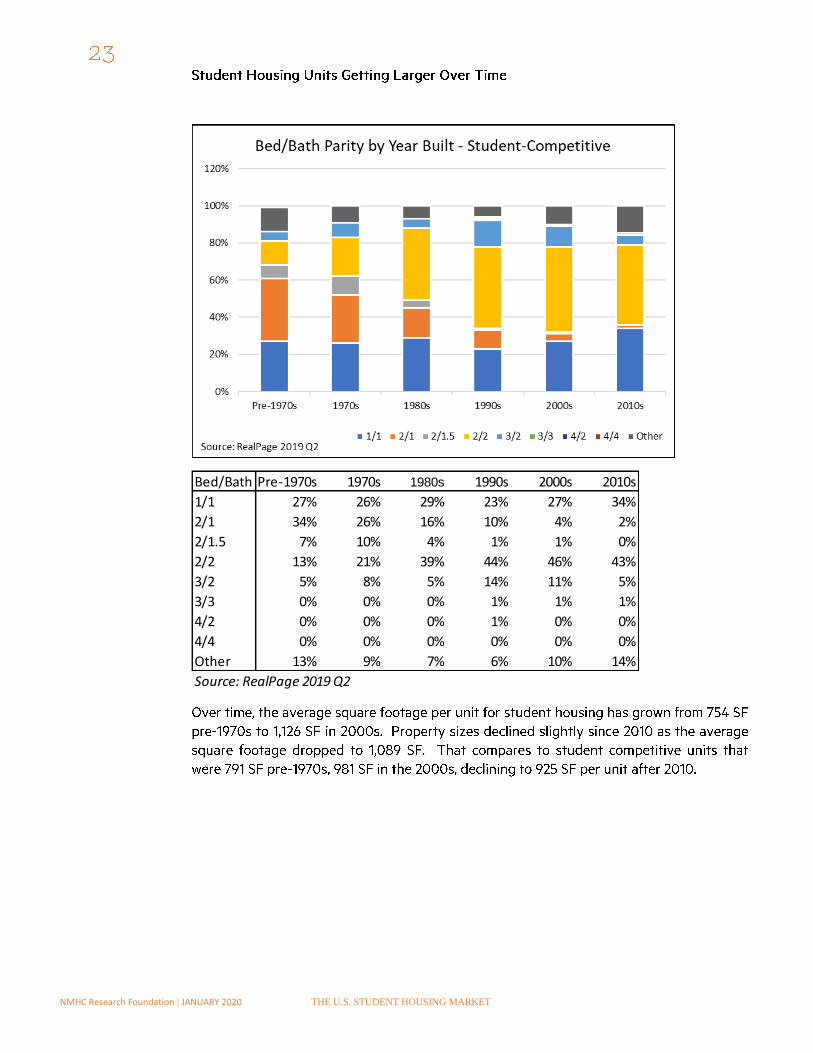
Bed/Bath Pre-1970s 1970s 1980s 1990s 2000s 2010s
1/1 27% 26% 29% 23% 27% 34%
2/1 34% 26% 16% 10% 4% 2%
2/1.5 7% 10% 4% 1% 1% 0%
2/2 13% 21% 39% 44% 46% 43%
3/2 5% 8% 5% 14% 11% 5%
3/3 0% 0% 0% 1% 1% 1%
4/2 0% 0% 0% 1% 0% 0%
4/4 0% 0% 0% 0% 0% 0%
Other 13% 9% 7% 6% 10% 14%
Source: RealPage 2019 Q2

NMHC Research Foundation | JANUARY 2020 THE U.S. STUDENT HOUSING MARKET
23 “What Amenities Do Students Actually Care About,” studenthousingbusiness.com, November/December 2018.

NMHC Research Foundation | JANUARY 2020 THE U.S. STUDENT HOUSING MARKET
24 NCES, off-campus includes owned housing. “Students with disabilities are those who reported having deafness
or serious difficulty hearing; blindness or serious difficulty seeing; serious difficulty concentrating, remembering, or making decisions because of a physical, mental, or emotional condition; or serious difficulty walking or climbing stairs. For 2015–16, the question about difficulty concentrating, remembering, or making decisions was expanded to include examples of relevant conditions. Specifically, students were instructed to “consider conditions includ-ing, but not limited to, a serious learning disability, depression, ADD, or ADHD.”

NMHC Research Foundation | JANUARY 2020 THE U.S. STUDENT HOUSING MARKET
25 RealPage 2019. 26 75 largest four-year universities, Niche.com; average for all full-time undergraduate students is $415 per NCES, 2017-18. 27 Niche.com.
NMHC Research Foundation | JANUARY 2020 THE U.S. STUDENT HOUSING MARKET
28 RealPage: Second quarter 2019 data. 29 NCES.
NMHC Research Foundation | JANUARY 2020 THE U.S. STUDENT HOUSING MARKET
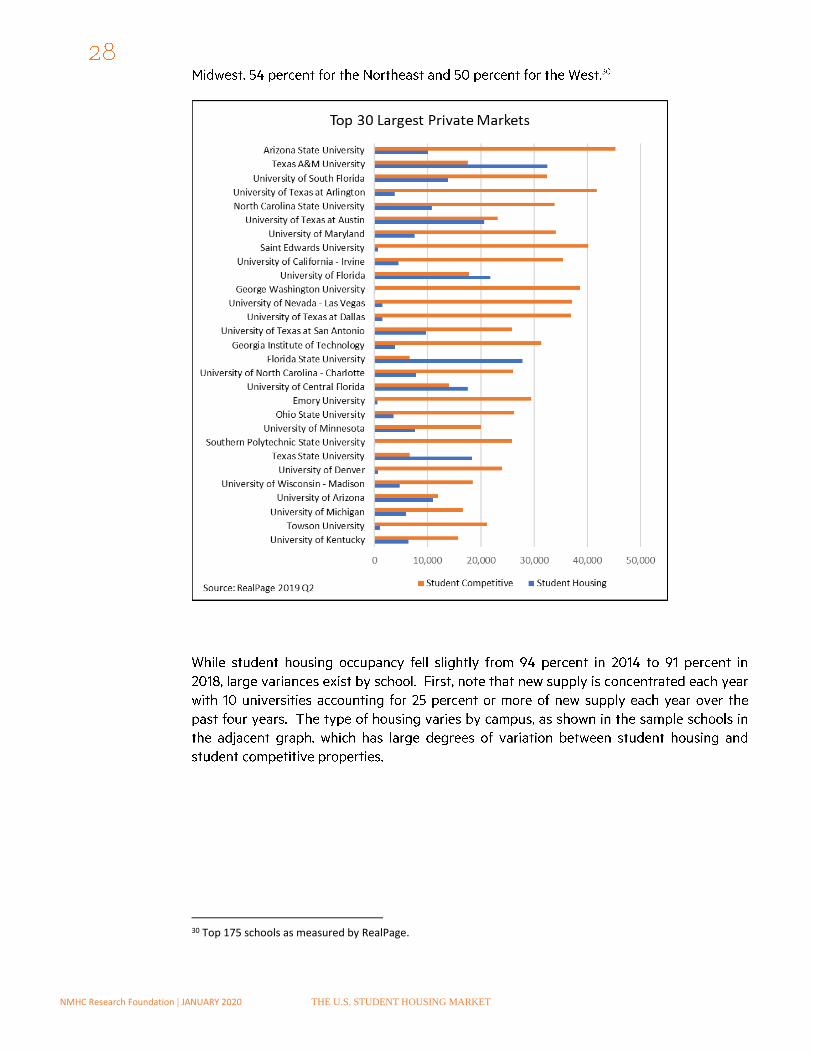
30 Top 175 schools as measured by RealPage.
NMHC Research Foundation | JANUARY 2020 THE U.S. STUDENT HOUSING MARKET
NMHC Research Foundation | JANUARY 2020 THE U.S. STUDENT HOUSING MARKET
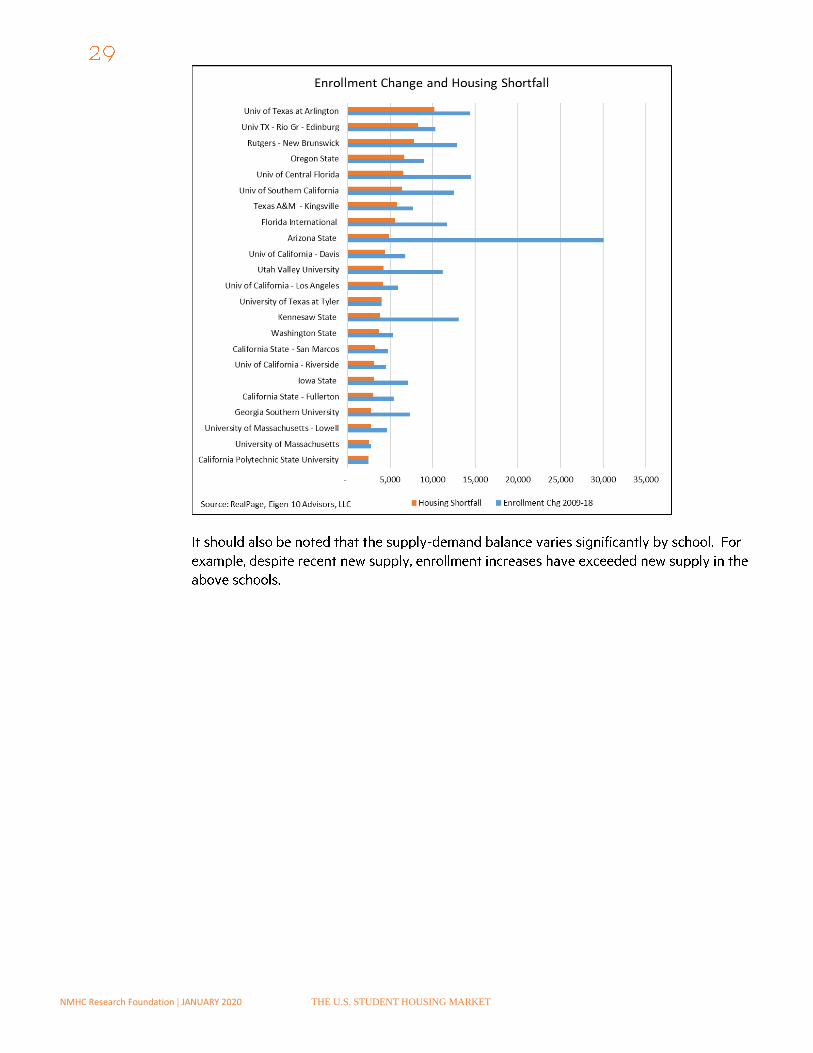
NMHC Research Foundation | JANUARY 2020 THE U.S. STUDENT HOUSING MARKET