nmda321 sn06 lecture acid base balance physiology revision –10 minute video on acid base balance: ...
TRANSCRIPT

NMDA321Nutritional Physiology Research
www.endeavour.edu.au
Session 6
Acid Base Balance
Nutritional Medicine Department

© Endeavour College of Natural Health www.endeavour.edu.au 2
Session 6
o Investigate the mechanisms and relationships to
disease processes and exploration of current clinical
research regarding:
o Acid Base balance
o Nutritional implications

© Endeavour College of Natural Health www.endeavour.edu.au 3
Pre-reading
o Schwalfenberg, G.K., 2012. The alkaline diet: Is there evidence that
an alkaline pH diet benefits health? Journal of Environmental and
Public Health, 2012. Available at:
https://login.ezproxy.endeavour.edu.au:2443/login?url=http://search.
ebscohost.com/login.aspx?direct=true&db=mdc&AN=22013455&sit
e=eds-live&scope=site.
o Adeva, M.M. & Souto, G., 2011. Diet-induced metabolic acidosis.
Clinical Nutrition, 30(4), pp.416–421. Available at:
https://login.ezproxy.endeavour.edu.au:2443/login?url=http://search.
ebscohost.com/login.aspx?direct=true&db=edsgao&AN=edsgcl.262
897144&site=eds-live&scope=site
o Physiology revision – 10 minute video on acid base balance:
https://www.youtube.com/watch?v=i_pTaTveCCo

© Endeavour College of Natural Health www.endeavour.edu.au 4
Acids and Baseso Acids and bases are defined by their behaviour in water
(aqueous solution)
o Acid = a chemical that dissociates, releasing a hydrogen
ion (proton, H+) into solution
o Base = a chemical that produces negative ions in
solution which can then accept an acidic proton
Acid ↔ Base + H+
o The pH Scale: based on [H+] in a solution.
o Lower pH – more acidic; Higher pH – more basic or
alkaline; pH 7 - neutral

© Endeavour College of Natural Health www.endeavour.edu.au 5
The pH Scale
Source: Fundamentals of Anatomy &
Physiology (9th Edition), 2011, Frederic H.
Martini et al.

© Endeavour College of Natural Health www.endeavour.edu.au 6
Body pH
o Normal pH of the blood is tightly controlled in healthy
people. Range: 7.35 – 7.45
o The pH in other parts of the body varies considerably
(Schwalfenberg, 2012, p. 2)

© Endeavour College of Natural Health www.endeavour.edu.au 7
Buffers
o Buffer = a chemical which resists a change in the pH of
a system
o The human body has systems that buffer or remove
excess acids and alkalis – to minimise pH change
o Bicarbonate is the major buffering system in body;
uses carbonic acid, which is created by dissolving CO2
in water
CO2 + H2O ↔ CH2CO3 ↔ H+ + HCO3-
(Carbon dioxide + water ↔ Carbonic acid ↔ hydrogen ion
+ bicarbonate)

© Endeavour College of Natural Health www.endeavour.edu.au 8
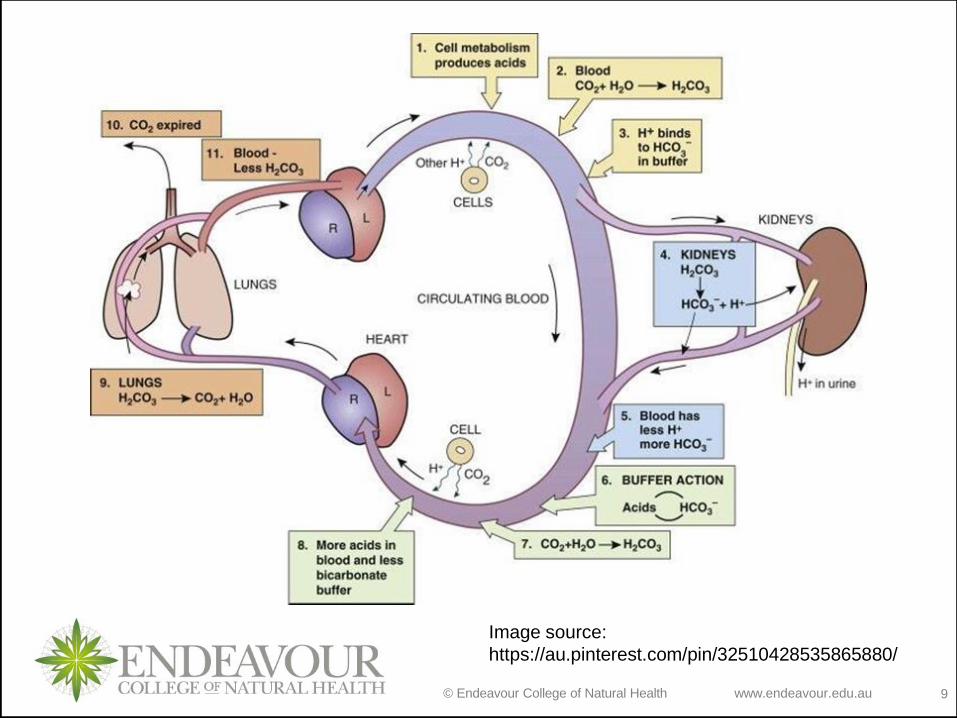
Acid base homeostasis
o Many biochemical reactions of metabolism either
produce or consume acids and bases (Poupin et al 2012)
o As part of metabolism, the body generates volatile acid,
which is excreted as CO2 in the lungs, and non-volatile
acid, which is excreted by the kidney. (Yenchek et al 2014)
o The body buffers the impact of significant endogenous
acid production via the blood, lungs and kidneys
© Endeavour College of Natural Health www.endeavour.edu.au 9
Image source:
https://au.pinterest.com/pin/32510428535865880/
© Endeavour College of Natural Health www.endeavour.edu.au 10
Overview of Acid-Base Balance
The Merck Manual (Professional Version) –
comprehensive reference resource:
o Acid-Base Regulation
o Acid-Base Disorders
o http://www.merckmanuals.com/professional/SearchResul
ts?query=Overview+of+Acid-
Base+Balance&icd9=MM083%3bMM084
o OpenSTAX Anatomy and Physiology (free e-book)
Chapter 26
o https://openstax.org/details/anatomy-and-physiology

© Endeavour College of Natural Health www.endeavour.edu.au 11
Minerals
Minerals leave an acidic or alkaline residue in the body
when metabolised
o Acid forming minerals: S, P, Cl (cations, –ve charge)
o Alkaline forming minerals: Ca, Mg, K, Na (anions, +ve
charge)
Image source:
http://sciencenotes.org/cat
egory/chemistry/periodic-
table-chemistry

© Endeavour College of Natural Health www.endeavour.edu.au 12
Acid-forming foods
o Meat, fish, chicken, eggs, grains (high in phosphate
which creates phosphoric acid)
o Animal proteins are rich in sulfur containing amino acids
cysteine and methionine (create sulfuric acid residues)
o Processed foods and soft drinks (phoshates used as
food additives)
o Salt (40% Na: 60% Cl) + 95% of Cl ions absorbed
causing a net increase in acid load
o Oxalate in food potentially acid forming but poorly
absorbed so unlikely to have much effect on body pH.
(Paxton 2015, p. 271; Adeva & Souto 2011; Welch et al 2008)

© Endeavour College of Natural Health www.endeavour.edu.au 13
Alkaline-forming foods
o Foods that contain organic acids taste acidic (eg. citrus
fruit) but are not acid-forming because organic acids are
metabolised completely and produce bicarbonate
o Fruit, vegetables, nuts, legumes, in general, are alkaline
–forming
o Fruit & vegetables rich in potassium salts which form
bicarbonate as an end product
o Dairy products contain both acid-forming phosphate and
alkaline-forming calcium, and have a slight alkaline effect(Paxton 2015, p 271)
o Glutamate (anionic amino acid) consumes H+ when
metabolised to become neutral (Adeva & Souto 2011)
© Endeavour College of Natural Health www.endeavour.edu.au 14
Acid/alkaline diets
o Most of the acids in the body are derived from sulphur
and phosphate in animal foods and grains, and chloride
from salt
o Most of the bicarbonate (alkali) is derived from organic
anions such as citrate provided by potassium salts in
fruits and vegetables
o Inadequate fruit and vegetable intake may lead to latent
acidosis and a reduction in the total buffering capacity of
the blood(Paxton 2015, p. 272; Adeva & Souto 2011)

© Endeavour College of Natural Health www.endeavour.edu.au 15
Australian Diet Survey
o Results from 2011-12 Australian Diet Survey for
Australians aged 2 years and over
• 97% reported consuming cereals and grains
• 85% consumed dairy of which 32% had cheese
• 6.8% met the recommended intake of vegetables –
potatoes making up ¼ of what has been consumed.
• 54% met the recommendation for fruit
• 35% of total energy from discretionary foods – high in fat,
sugar, salt and alcohol
o ABS, 2014, 4364.0.55.007 - Australian Health Survey: Nutrition First Results - Foods
and Nutrients, 2011-12, available
here: http://www.abs.gov.au/ausstats/[email protected]/Lookup/4364.0.55.007main+features
12011-12
© Endeavour College of Natural Health www.endeavour.edu.au 16
Diet-induced metabolic acidosis
o ‘Acidogenic diet’ urinary excretion of anions such as
sulfate, chloride and phosphate increases and there is
also urinary loss of calcium (Adeva & Souzo 2011)
o The kidneys are not able to excrete all of the acids
produced by modern diets chronic mild metabolic
acidosis (Paxton 2015, p. 272)
o “The daily net acid load’s magnitude (in part by
influencing systemic acid-base status) has been shown
to induce renal losses of calcium, magnesium and
nitrogen, and adversely affects numerous endocrine
functions.” (Frassetto et al 2007)
© Endeavour College of Natural Health www.endeavour.edu.au 17
NEAP = Net Endogenous Acid
Productiono The outcome of acid-alkali interactions in the body –
closely reflects the dietary protein : potassium ratio (Paxton 2015, p. 272)
o “…the amount of net acid produced by the metabolic
system per day…, results predominately from
differences in the relative amounts of the diet’s acid load
and base precursors absorbed by the gut” (Frassetto et al
2007)
o “Diet-dependent acid load produced by the excessive
dietary content of acid precursors, approximately
estimated from renal net acid excretion” (Adeva & Souto
2011, p. 416)
© Endeavour College of Natural Health www.endeavour.edu.au 18
PRAL = Potential Renal Acid
Loado Used to categorize foods based on the amounts of
alkalising minerals (Mg, K, Ca) and the chloride,
phosphate and protein content of each food
o Originally based on German research, then developed
by the USDA; considered by scientists to be the most
accurate way of measuring the dietary acid load on the
body
o PRAL reference list - Schwalfenberg 2012
• Negative values indicate alkalising effect; positive values
indicate acidic forming
• The lower the number the more alkaline, the higher the number,
the more acidic. Zero = neutral

© Endeavour College of Natural Health www.endeavour.edu.au 19
Pathology testing
o Urine pH
• Lab Tests Online - Urine pH
o Electrolytes
• Lab Tests Online – Electrolytes
o Bicarbonate
• Lab Tests Online - Bicarbonate
o Anion gap
• Anion gap - Lab Tests Online
• The Merck Manual - The anion gap
o RACGP Manual
• https://www.rcpa.edu.au/Library/Practising-Pathology/RCPA-
Manual/Home

© Endeavour College of Natural Health www.endeavour.edu.au 20
Urine pH
o Urine reflects key excretory path for metabolic acids,
therefore indicative of acidic burden and kidney’s ability
to compensate.
o Urine pH varies from acid to alkaline depending on the
need for balancing the internal environment (Schwalfenberg
2012)
o Dietary acid-base load is significantly related to urine pH.
A more alkaline urine is associated with a more alkaline
dietary load and vice versa.
o Urine pH provides a simple tangible measure of the
effects of diet and could be used to monitor change in
diet quality (Welch et al 2008)
© Endeavour College of Natural Health www.endeavour.edu.au 21
Urine pH
o An acidic urine (pH < 5.5) has been established as an
accurate indicator of:
• Acidogenic diet
• Increased urinary calcium loss
• Accelerated progression of chronic kidney disease
• Increased risk of urate renal stone production
• Increased risk of cardiovascular and all cause mortality
• Increased risk of bladder cancer
o Urinary pH has also been shown to reflect increased
intake or alkaline foods

© Endeavour College of Natural Health www.endeavour.edu.au 22
Bicarbonate (HCO3)
o Primary acid buffering system in the blood
o Levels are principally regulated by the kidney
o Serum bicarbonate is increased in metabolic alkalosis
and in compensated respiratory acidosis (RCPA manual)
o Typically demonstrates a direct relationship with pH:
Plasma levels Systemic pH Effect is:
↑ HCO3 ↑ pH Alkalising
↓ HCO3 ↓ pH Acidifying
© Endeavour College of Natural Health www.endeavour.edu.au 23
Bicarbonate (HCO3)
o Lab Tests Online – Bicarbonate
o Reference range for adults: 23-29 mEq/L
o Suboptimal HCO3 (< 23) has been associated with:
• Acidogenic diets
• Accelerated progression of chronic kidney disease
• Reduced bone mineral density in post-menopausal women and
older men
• Increased rate of bone loss
• Impaired mobility and ‘incident functional limitation’ in the elderly
(Yenchek et al 2014)
• Increased risk of cardiovascular and all cause mortality (Park et
al 2015)

© Endeavour College of Natural Health www.endeavour.edu.au 24
Causes of low bicarbonate
1. Increased use – acid buffering
a) Metabolic acidosis
b) Starvation
c) Diabetes (poorly controlled)
2. Increased losses – renal and/or GIT
a) Diarrhoea
b) Kidney damage
c) Chronic use of loop diuretics
3. Medications
• Phenformin, tetracycline, methicillin, nitrofurantoin, thiazide
diuretics, triamterene
© Endeavour College of Natural Health www.endeavour.edu.au 25
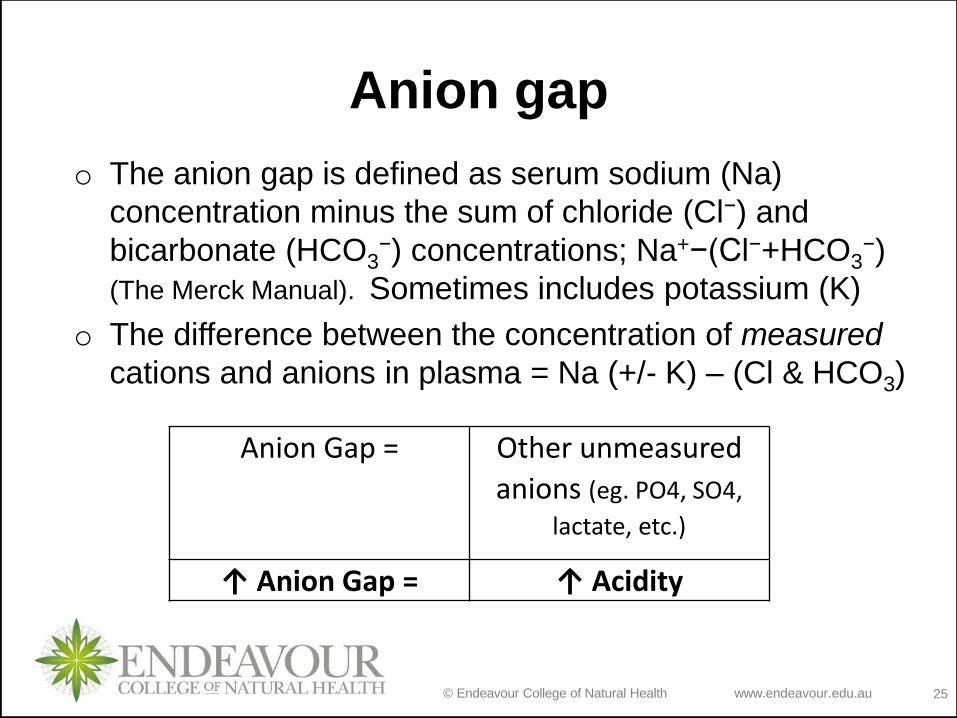
Anion gap
o The anion gap is defined as serum sodium (Na)
concentration minus the sum of chloride (Cl−) and
bicarbonate (HCO3−) concentrations; Na+−(Cl−+HCO3
−)
(The Merck Manual). Sometimes includes potassium (K)
o The difference between the concentration of measured
cations and anions in plasma = Na (+/- K) – (Cl & HCO3)
Anion Gap = Other unmeasured
anions (eg. PO4, SO4,
lactate, etc.)
↑ Anion Gap = ↑ Acidity

© Endeavour College of Natural Health www.endeavour.edu.au 26
Anion gap
o Lab Tests Online - Anion gap
o Increased levels (> 12mEq/L if including K, > 8 if not)
• Acidogenic diet and lifestyle
• Lactic acidosis
• Diabetic or alcoholic ketoacidosis
• Increased HCO3 losses from GIT (eg. diarrhoea, IBD)
• Impaired ability to produce HCO3
• Renal impairment and renal failure
• Medications, ethanol
o Decreased levels (< 8mEq/L if including K, < 4 if not)
• Excessive antacid use
• Chronic vomiting
© Endeavour College of Natural Health www.endeavour.edu.au 27
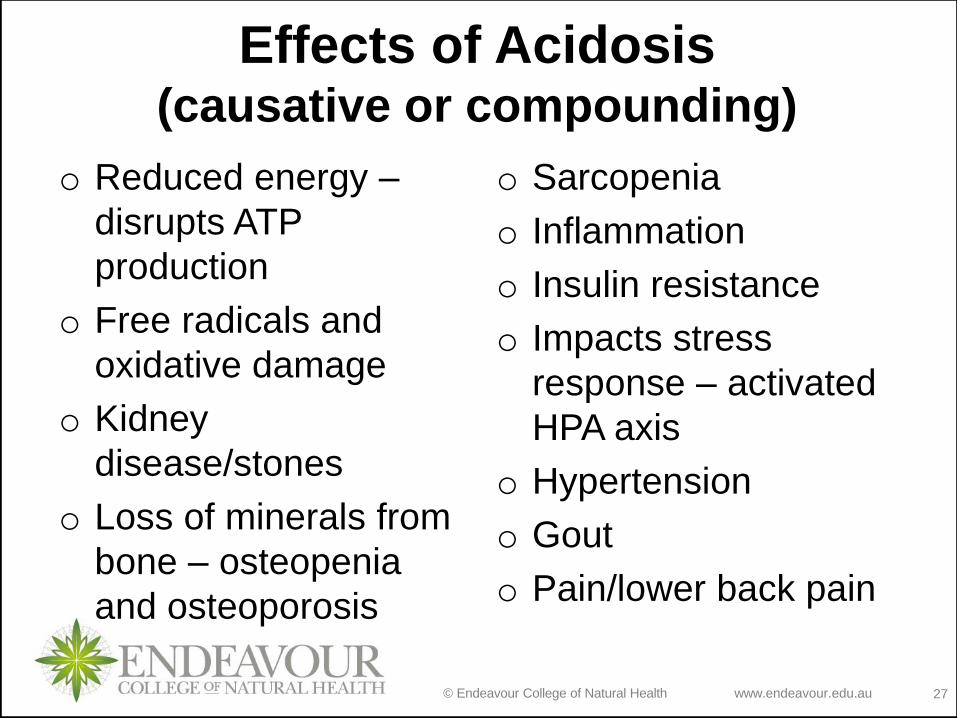
Effects of Acidosis(causative or compounding)
o Reduced energy –
disrupts ATP
production
o Free radicals and
oxidative damage
o Kidney
disease/stones
o Loss of minerals from
bone – osteopenia
and osteoporosis
o Sarcopenia
o Inflammation
o Insulin resistance
o Impacts stress
response – activated
HPA axis
o Hypertension
o Gout
o Pain/lower back pain
© Endeavour College of Natural Health www.endeavour.edu.au 28
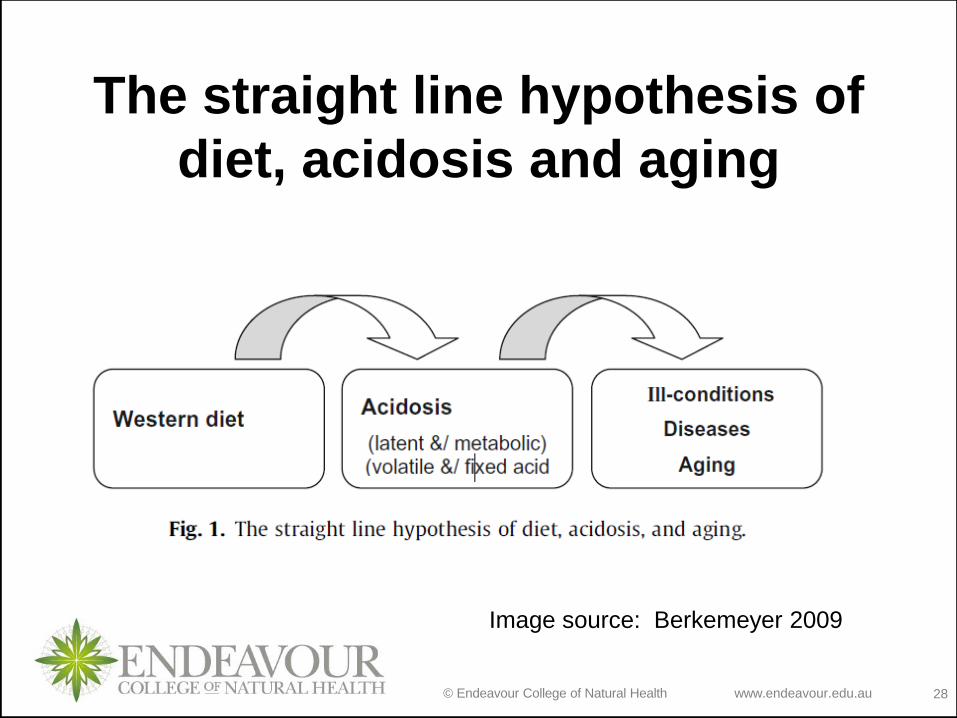
The straight line hypothesis of
diet, acidosis and aging
Image source: Berkemeyer 2009

© Endeavour College of Natural Health www.endeavour.edu.au 29
Effects of acidosis on the boneo BONE = largest reserve of alkali in the body
o In acidosis, osteoclast activity increased and osteoblast
activity inhibited; bones release bicarbonate, K, Na, Ca,
Mg to buffer acidity
o Bicarbonate is excreted and reabsorbed by the kidneys
to maintain stable pH and electrical neutrality
o Muscle is broken down to produce ammonia (strongly
alkaline) + kidneys increase excretion of acids
o The kidneys cannot excrete urine more acid than pH 4.4
excess acids are buffered by forming complexes with
minerals (K, Ca, Mg) – leading to mineral losses in the
urine
(Paxton 2015, p. 272)

© Endeavour College of Natural Health www.endeavour.edu.au 30
Effects of acidosis on the boneAdeva & Souzo 2011
o Increased rates of endogenous acid production are
associated with reduced kidney tubule calcium
reabsorption resulting in hypercalciuria and negative
calcium balance
o Urinary calcium excretion is higher in animal protein diet
compared to vegetarian diet
o Urinary calcium excretion falls as fruit and vegetable
(F&V) ingestion rises calcium retaining effect +
predictor of greater bone density in postmenopausal
women & healthy children
o Dietary depletion of F&V induces hypercalciuria
© Endeavour College of Natural Health www.endeavour.edu.au 31
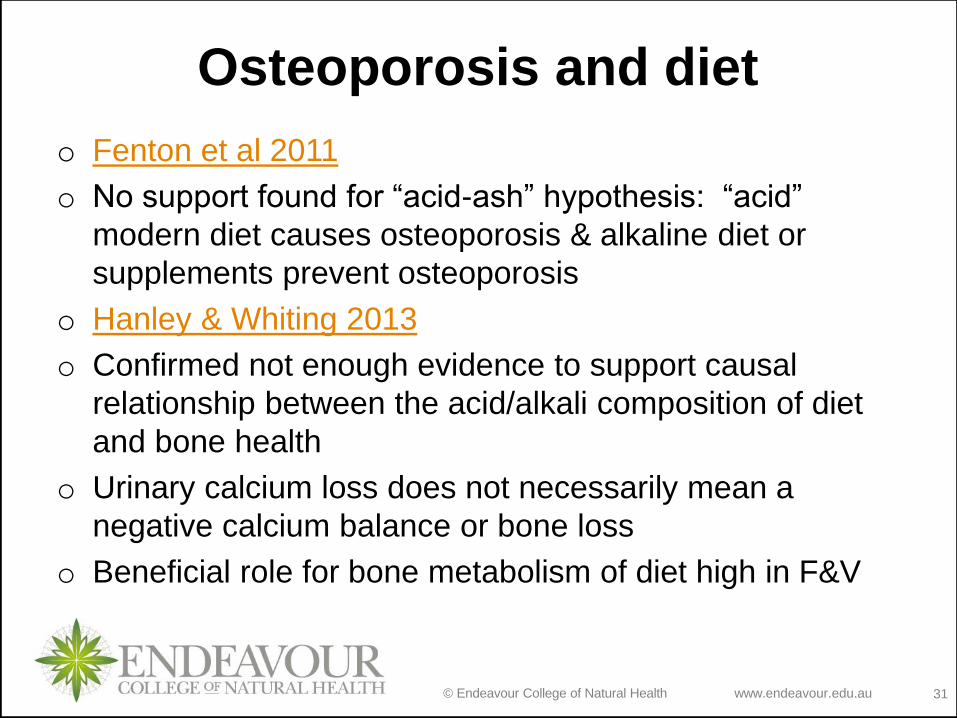
Osteoporosis and diet
o Fenton et al 2011
o No support found for “acid-ash” hypothesis: “acid”
modern diet causes osteoporosis & alkaline diet or
supplements prevent osteoporosis
o Hanley & Whiting 2013
o Confirmed not enough evidence to support causal
relationship between the acid/alkali composition of diet
and bone health
o Urinary calcium loss does not necessarily mean a
negative calcium balance or bone loss
o Beneficial role for bone metabolism of diet high in F&V

© Endeavour College of Natural Health www.endeavour.edu.au 32
Effects of acidosis on the
kidneys
o Diet-induced metabolic acidosis promotes low urine pH,
hypercalciuria and hypocitraturia, predisposing to uric
acid and calcium kidney stone formation (nephrolithiasis)
o Low urine pH – major risk factor for uric acid stone
formation
o Functional changes take place in the kidney: increased
renal plasma flow and glomerular filtration rate – to
remove excess acid load kidney hypertrophy(Adeva & Souto 2011)

© Endeavour College of Natural Health www.endeavour.edu.au 33
Urine pH and uric acid
Kanbara et al 2012
o Small crossover study – 18 female healthy university
students – ‘acidic’ vs ‘alkaline’ diet
o Uric acid in the serum was higher in the acidic group
than in the alkaline group
o Uric acid in the urine was lower for the acidic group than
in the alkaline group
o Uric acid may be reabsorbed more actively in acidic
urine than in alkaline urine
o Concluded that alkalization of urine by eating alkaline
diet is effective for removing uric acid from the body

© Endeavour College of Natural Health www.endeavour.edu.au 34
The effect of aging on the kidney
o With aging, there is a decreased ability of the kidneys to
excrete an acid load.
o Low bicarbonate levels might reflect occult tubular
dysfunction, leading to acid retention, or an increased
acid load that is greater than the aging kidney’s ability to
excrete the load. (Yenchek et al 2014)

© Endeavour College of Natural Health www.endeavour.edu.au 35
Acid-base balance & Sarcopenia
Yenchek et al 2014
o Acidosis can produce muscle catabolism, leading to
decreased muscle mass and decreased lower extremity
strength
o Acidosis leads to impaired insulin/IGF signalling; this
leads to upregulation of proteolytic pathways in muscle
muscle wasting
o Low serum bicarbonate (< 23 mEq/L) was associated
with slower gait speed, less quadriceps strength, and
subsequent development of impaired physical
functioning in previously well functioning older adults.

© Endeavour College of Natural Health www.endeavour.edu.au 36
Acid base balance and weight gain
Berkemeyer 2009
o Both under and over nutrition are conditions of catabolic
stress and related to the risk of developing acid retention
o The loss of muscle mass is made worse on a protein
deficient diet, even so protein adds to the acid load of
the body
o The correction of acidosis warrants urgent increased
consumption of vegetables and fruits and/or alkali
supplements. A regular consumption of these would
prevent the acidosis from setting in in the first place and
should be vigorously targeted as a health objective
o Breathing dynamics also important for maintaining acid
base balance (Berkeymeyer 2009)

© Endeavour College of Natural Health www.endeavour.edu.au 37
Image source: Berkemeyer 2009, p.354

© Endeavour College of Natural Health www.endeavour.edu.au 38
Cardiovascular effects
Park et al 2015
o n = 31 590 healthy adults; median follow up 93 months
o An increase in daily metabolic acid load in the general
population with normal renal function is believed to result
from acidogenic modern diets.
o Clinical biomarkers of a higher metabolic acid load, such
as lower serum bicarbonate level and urine pH were
associated with a higher all-cause mortality
o This association was more prominent in participants with
BMI > 23
o Compared with serum bicarbonate and urine pH, serum
anion gap was not significantly associated with mortality
© Endeavour College of Natural Health www.endeavour.edu.au 39
pH and Enzyme Function
o There are 75,000 enzymes in the human body; over
7000 metabolic processes depend on enzymes for
critical processes
o Enzyme activity affected by: temperature, genetic
variants, pH
o Each type of enzyme has optimum pH conditions. If the
pH changes from the optimum, the chemical nature of
the amino acids is altered reduced function of enzyme
o pH imbalance/acidity may affect vital enzymes such as:
• ATP synthase
• Glutathione peroxidase
• MTHFR (methyltetrahydrofolate reductase)
(Lewerenz et al 2010)
© Endeavour College of Natural Health www.endeavour.edu.au 40
pH and the Microbiome
o Duncan et al 2009
o The pH of our digestive tract influences microbial
colonisation
o Latent acidity influences the pH of the mucosal terrain
which in turn affects bacterial growth and survivability
o Sensitivity to pH varies from one species of bacteria to
another. Most colonic bacteria generally grow well at
approx. pH 6.5
o “Inhibition of the growth of bacteria at mildly acidic pH
creates niches that can be exploited by more low-pH-
tolerant microorganisms” (Duncan et al 2009)
© Endeavour College of Natural Health www.endeavour.edu.au 41
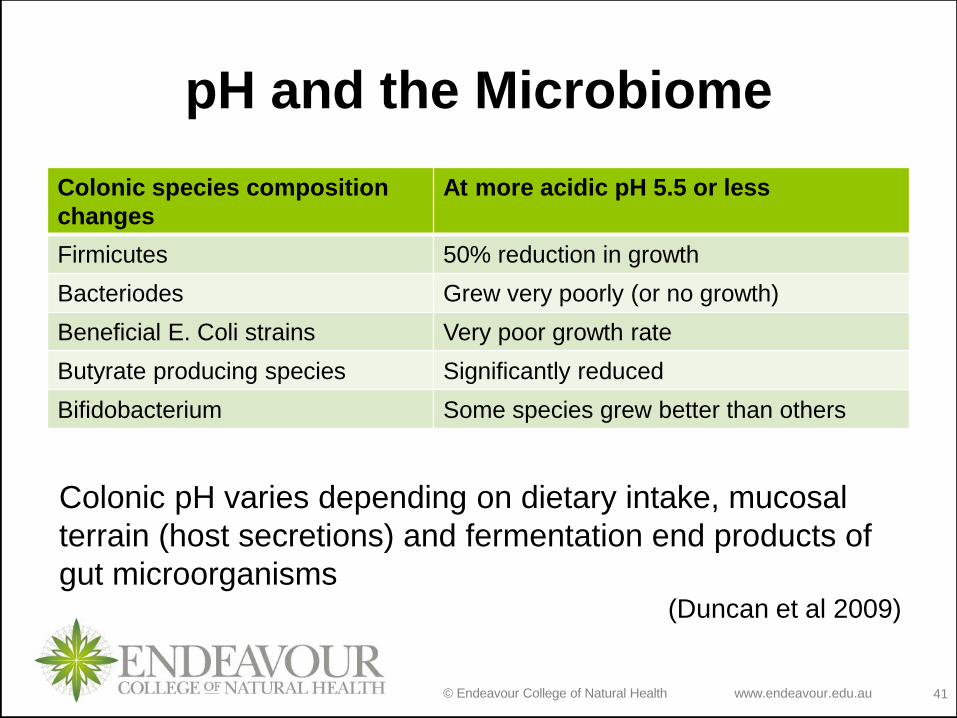
pH and the Microbiome
Colonic species composition
changes
At more acidic pH 5.5 or less
Firmicutes 50% reduction in growth
Bacteriodes Grew very poorly (or no growth)
Beneficial E. Coli strains Very poor growth rate
Butyrate producing species Significantly reduced
Bifidobacterium Some species grew better than others
Colonic pH varies depending on dietary intake, mucosal
terrain (host secretions) and fermentation end products of
gut microorganisms (Duncan et al 2009)
© Endeavour College of Natural Health www.endeavour.edu.au 42
The primary benefits that may result from
adherence to Alkaline Diet are:
o Increased fruits and vegetables in an alkaline diet would
improve potassium/sodium ratio and may benefit bone
health, reduce muscle wasting, as well as mitigate other
chronic diseases such as hypertension and strokes .
o In increase in growth hormone with an alkaline diet may
improve many outcomes from cardiovascular health to
cognition and memory .
o An increased in intracellular magnesium, necessary for
energy metabolism and the function of many enzymes is
another benefit for an alkaline diet. Furthermore,
magnesium is necessary to activate vitamin D and
therefore this is another potential mechanism for
improved bone health .

© Endeavour College of Natural Health www.endeavour.edu.au 43
The primary benefits that may result from
adherence to Alkaline Diet are:
o Alkaline diet improves uric acid clearance offering
protection against the development of gout, diabetes,
metabolic syndrome and hypertension.
o Reduces cumulative mild metabolic acidosis associated
with ageing reducing calcium excretion, bone resorption
markers and osteoporotic risk.

© Endeavour College of Natural Health www.endeavour.edu.au 44
Referenceso Adeva, M.M. & Souto, G., 2011. Diet-induced metabolic acidosis. Clinical Nutrition,
30(4), pp.416–421. Available at:
https://login.ezproxy.endeavour.edu.au:2443/login?url=http://search.ebscohost.com/lo
gin.aspx?direct=true&db=edsgao&AN=edsgcl.262897144&site=eds-live&scope=site.
o Berkemeyer, S., 2009. Acid-base balance and weight gain: Are there crucial links via
protein and organic acids in understanding obesity? Medical Hypotheses, 73(3),
pp.347–356. Available at:
https://login.ezproxy.endeavour.edu.au:2443/login?url=http://search.ebscohost.com/lo
gin.aspx?direct=true&db=edselp&AN=S0306987709002333&site=eds-
live&scope=site.
o Duncan, S.H. et al., 2009. The role of pH in determining the species composition of
the human colonic microbiota. Environmental Microbiology, 11(8), pp.2112–2122.
Available at:
https://login.ezproxy.endeavour.edu.au:2443/login?url=http://search.ebscohost.com/lo
gin.aspx?direct=true&db=edsgao&AN=edsgcl.204951170&site=eds-live&scope=site.
o Fenton, T.R. et al., 2011. Causal assessment of dietary acid load and bone disease: a
systematic review & meta-analysis applying Hill’s epidemiologic criteria for causality.
Nutrition journal, 10(1), p.41. Available at:
https://login.ezproxy.endeavour.edu.au:2443/login?url=http://search.ebscohost.com/lo
gin.aspx?direct=true&db=edsgao&AN=edsgcl.258855537&site=eds-live&scope=site.
© Endeavour College of Natural Health www.endeavour.edu.au 45
Referenceso Hanley, D.A. & Whiting, S.J., 2013. Does a High Dietary Acid Content Cause Bone
Loss, and Can Bone Loss Be Prevented With an Alkaline Diet? Journal of Clinical
Densitometry.
o Kanbara, A. et al., 2012. Effect of urine pH changed by dietary intervention on uric
acid clearance mechanism of pH-dependent excretion of urinary uric acid. Nutrition
Journal, 11(1), p.39. Available at:
https://login.ezproxy.endeavour.edu.au:2443/login?url=http://search.ebscohost.com/lo
gin.aspx?direct=true&db=edsgao&AN=edsgcl.297993473&site=eds-live&scope=site
o Lewerenz, J., Dargusch, R. & Maher, P., 2010. Lactacidosis modulates glutathione
metabolism and oxidative glutamate toxicity. Journal of Neurochemistry, 113(2),
pp.502–514. Available at:
https://login.ezproxy.endeavour.edu.au:2443/login?url=http://search.ebscohost.com/lo
gin.aspx?direct=true&db=aph&AN=48598965&site=eds-live&scope=site.
o Park, M. et al., 2015. Association between the markers of metabolic acid load and
higher all-cause and cardiovascular mortality in a general population with preserved
renal function. Hypertension research, 38(6), pp.433–438. Available at:
https://login.ezproxy.endeavour.edu.au:2443/login?url=http://search.ebscohost.com/lo
gin.aspx?direct=true&db=mdc&AN=25762414&site=eds-live&scope=site.
o Paxton, F., 2015. Foundations of Naturopathic Nutrition, Sydney: Allen & Unwin.

© Endeavour College of Natural Health www.endeavour.edu.au 46
Referenceso Poupin, N. et al., 2012. Impact of the diet on net endogenous acid production and
acid-base balance. Clinical Nutrition, 31(3), pp.313–321. Available at:
https://login.ezproxy.endeavour.edu.au:2443/login?url=http://search.ebscohost.com/lo
gin.aspx?direct=true&db=edsgao&AN=edsgcl.290798257&site=eds-live&scope=site.
o Schwalfenberg, G.K., 2012. The alkaline diet: Is there evidence that an alkaline pH
diet benefits health? Journal of Environmental and Public Health, 2012. Available at:
https://login.ezproxy.endeavour.edu.au:2443/login?url=http://search.ebscohost.com/lo
gin.aspx?direct=true&db=mdc&AN=22013455&site=eds-live&scope=site.
o Welch, A. a et al., 2008. Urine pH is an indicator of dietary acid-base load, fruit and
vegetables and meat intakes: results from the European Prospective Investigation
into Cancer and Nutrition (EPIC)-Norfolk population study. The British journal of
nutrition, 99(6), pp.1335–1343. Available at:
http://search.proquest.com.ezproxy.endeavour.edu.au/health/docview/213830182?ac
countid=45102.
o Yenchek, R. et al., 2014. Association of serum bicarbonate with incident functional
limitation in older adults. Clinical Journal of the American Society of Nephrology,
9(12), pp.2111–2116. Available at:
https://login.ezproxy.endeavour.edu.au:2443/login?url=http://search.ebscohost.com/lo
gin.aspx?direct=true&db=rzh&AN=109768356&site=eds-live&scope=site.