nkonki soc integrated reporting awards 2016 brochure
TRANSCRIPT

Experience Ingenuity.
Integrated Reporting | A continued journey
for Public Sector Entities in South Africa
© Nkonki Proprietary 2016
Also available on:
email:[email protected]

SOC* Integrated Reporting Awards 2016
* Schedule 2 State Owned Companies in terms of the Public Finance Management Act 1 of 1999
Disclaimer
This document is proprietary to Nkonki and the information herein is confidential. It is supplied in confidence and should not be disclosed, duplicated or otherwise revealed in whole or in part to any third parties without the prior written consent of Nkonki.to any third parties without the prior written consent of Nkonki.
A global network of independent accounting firms
A member firm of

Executive Summary
Foreword
Research Findings and Results
Chapter 1:
The Fundamental Concepts
Chapter 2:
Nkonki’s Tools
Chapter 3:
A Practical Guide - The Roadmap to Excellent Integrated Reporting
Purpose and Research Methodology
Chapter 4:
Chapter 5:
Schedule 2 State Owned Companies Reports Analysed
Annexure A:
Glossary of Terms
Annexure B:
Bibliography
Annexure C:
1
3
5
9
21
33
39
47
49
50
51
Introduction

Since 2011, Nkonki has been tracking how South African Public Sector Companies are adopting integrated reporting best practice through this yearly review, an extremely worthwhile thought leadership initiative, which Kreston International is proud to endorse as it represents a significant body of research to assist these companies on their journey.
One third of global gross domestic product (GDP) is made up by the public sector and this is being invested in ensuring there is effective infrastructure, good educational opportunities and reliable health care. In many ways it is this investment by the public sector that is helping to create the conditions for wealth creation and preparing the way for the success of this and future generations.
Global leaders are looking for tools and frameworks to help them demonstrate effective resource allocation, and accountability – communicating not just for the sake of ‘being transparent’ – but to ensure all stakeholders understand how their organisation is creating value in the short, medium and long term. Increasingly, organisations around the world are using integrated reporting to assist them to communicate their own clear, concise, and integrated story that explains how they create value. This is helping them to not only think holistically about their strategy and plans, but also to make informed decisions, and to manage key risks to build investor and stakeholder confidence. Perhaps most importantly, it is helping them to improve their performance.
This effort is being headed by the International Integrated Reporting Council (IIRC), which has as its mission “to establish integrated reporting and thinking within mainstream business practice as the norm in the public and private sectors”. Kreston International lauds the council for this goal, which we wholeheartedly support.
Integrated reporting has been adopted in South Africa by many organisations in both the public and private sectors, and the country continues to set the trend globally, particularly in the listed company space. However, the more recent introduction of the International Integrated Reporting Framework seems to be presenting a significant challenge to both private and public sector organisations.
Whilst it could be argued that JSE-listed companies have made more progress in this respect due to the fact that they are compelled to produce integrated reports as a listing requirement1, this year the Nkonki report shows that Public Sector Companies have not embraced the Framework to the same extent. In fact, the gap between those Public Sector Companies that are making an effort to embrace integrated reporting and produce a high quality integrated report and those that were not seems to be widening, which is of concern.
That being said, it is also clear from the 2016 report that there is a group of Public Sector Companies that have embraced the key concepts of the Framework and this represents a positive step forwards. The improvement in the disclosure of the Fundamental Concepts (which include the value creation model, the business model and the six capitals) is reassuring. More encouraging perhaps is that many of the Public Sector Companies reviewed by Nkonki’s independent panel still lead the way in terms of the adoption of the Framework and are providing a good example to other members of the IIRC’s Public Sector Pioneer Network.
Integrated Reporting – A continued journey
| 1
FOREWORD
“An integrated report is a concise communication about how an organisation’s strategy, governance, performance and prospects lead to the creation of value over the short, medium and long term.” International Integrated Reporting Framework
FOREWORD
1 Companies listed on the Johannesburg Stock Exchange (JSE) have been required to prepare integrated reports because the principles of King III (which include the preparation of integrated reports) fall into the Listing Requirements since 2010.

2 |
In a sector in which just 18 Public Sector Companies – known in South Africa as State Owned Companies (SOCs) – control an asset base exceeding R1.1 trillion, and have a turnover of more than R395 billion, it is essential that good corporate governance and reporting principles are applied. Also extremely important is that all stakeholders, which include the general public, are kept abreast of how these companies are creating value, including their outcomes, with resource constraints, in as transparent a manner as possible. This is a fundamental aim of both integrated reporting and of the Framework itself, and as cited by the IIRC’s Public Sector Network, “Public sector organisations are being increasingly challenged with maintaining or improving outcomes within the same or reduced resources. Communicating how, and how well prepared they are, to achieve this will be critical to public accountability.”
With the challenge of having to continuously improve the quality of information contained in a company’s annual or integrated report, it is clear the process involved in producing such a report requires integrated thinking within the organisation. This in turn enables a better understanding of the factors that materially affect the organisation’s ability to create value over time. Most significantly, it can lead to behavioural changes and an improvement in performance throughout an organisation, a major imperative for the adoption of the Framework, particularly in the current hostile economic environment.
In conclusion, I would like to thank Nkonki for producing this important report, and congratulate the winners, particularly the top three – Airports Company South Africa, Telkom and Transnet – for their continued efforts towards improved reporting. These companies should be seen as leaders in integrated reporting, and represent a beacon for others to follow. I also encourage the rest to continue to make progress. As the primary objective of most public sector entities is to deliver services to the public, rather than to make profits and generate a return on equity to investors, their performance can only partially be evaluated by examining their financial position, financial performance and cash flows. Reports that don’t fully embrace the principles of integrated reporting and the Framework only tell us a limited amount about how well an entity is equipped to deal with the challenges ahead and to continue delivering services and supporting its communities. In today’s climate it’s is becoming increasingly important for stakeholders to understand the full story in order to establish trustworthiness.
Jon Lisby | CEO, Kreston International
“In an age of time and resource constraints, public sector organisations need ways of broadening the conversation about the services they deliver and the value they create, not only to meet short-term demands but for the longer term.”

| 3
Integrated Reporting – A continued journey
INTRODUCTION
INTRODUCTION
This is Nkonki’s sixth year of releasing the results of the annual State Owned Companies (SOC) Integrated Reporting Awards, and the accompanying report. The awards started in 2011 to encourage high-quality reporting, which can only improve transparency within these entities, and to showcase the leaders of integrated reporting within the sector to encourage them to continue raising the bar, not only for their South African counterparts, but globally as well.
Looking back to when we started, most SOCs battled to meet the minimum requirements and very few qualified for recognition as they had to at least exceed 50% of the expected minimum disclosure requirements. Over the years, we have seen these reports take different formats, change content and differ in length, and we are proud to say that this year we continue to see good improvement in the integrated reports of these SOCs.
The 2016 report provides insights into the extent to which South African SOCs applied the International Integrated Reporting Council’s (IIRC) International Integrated Reporting Framework to their 2015 reports. It reveals both the achievements and areas of improvement by these entities in the spirit of encouraging a high standard of corporate reporting of these public entities, which can assist in improving understanding by and encouraging trust of the citizens of this country.
This year’s report is based on the 2015 integrated reports of South Africa’s major SOCs, and the reports were scored using the same rigorous process of judging and adjudication using the International Integrated Reporting Framework as a base. Overall, the results indicate that the adoption of the Framework is still not at an ideal level, and reveal that there is a clear divide between those SOCs that are fully embracing the Framework and those that are lagging behind. Please refer to this year’s results in the Executive Summary and in Chapter 1 of this report.
We extend our congratulations to the winner of the 2016 Nkonki SOC Integrated Reporting Awards, the Airports Company South Africa SOC Limited (ACSA), on this outstanding achievement. ACSA moved from eighth place in the previous year, and we know that the ACSA team has worked incredibly hard over the past year to deliver their best integrated report yet. Their effort has resulted in an exemplary report that firmly embraces the principles that are set out in the Framework. In addition, we commend all the entities included in the ‘top 10’ for the example they have set in South Africa and around the world in terms of understanding and appreciating the global changes and challenges that are taking place, ranging from changes in legislation to the fourth industrial revolution.
This survey has been made possible by the continued involvement and dedicated efforts of Anton du Toit and the panel of adjudicators from Monash South Africa team. We would further like to thank Jon Lisby, the CEO of Kreston International, for his contribution to this report. We hope that, by continuing this survey, we will encourage SOCs to improve the standard of their integrated reporting and motivate integrated thinking.
Thuto Masasa | Partner

4 |
Interesting STATISTICSAsset base:
2013: Exceeded R1 trillion and a turnover of more than
R260 billion2014: Exceeded R1.2 trillion and a turnover of more than
R320 billion2015: Exceeded R1.1 trillion and a turnover of more than
R395 billion (a decrease in asset base compared to 2014 as three SOCs were excluded in 2015)
GUIDE TO THE RATINGS
80% – 100%
70% – 79%
60% – 69%
50% – 59%
0 – 49%
0 20 40 60 80 100
ABCDD
In considering the best reports, it is rewarding that, for the first time since the inception of SOC Integrated Reporting Awards, three companies achieved an A rating.
Lengthiest report:
2013: 418 pages | 2014: 296 pages | 2015: 445 pages

| 5
Integrated Reporting – A continued journey
EXECUTIVE SUMMARY
When reviewing these reports, it was clear that there is a divide within the SOCS – those that give attention to and apply the International Integrated Reporting Framework, and those that do not. The first group continues to develop in terms of applying the Framework and reporting improvements have been noted amongst these companies. This has not been the case in the second group.
The International Integrated Reporting Framework (IIRC, 2013) is receiving increasing attention globally in terms of the preparation of annual / integrated reports. This is true for both the public and the private sectors. In South Africa producing an annual or integrated report – and following guidelines such as the Integrated Reporting Framework and the King Code on Corporate Governance – remains voluntary, except for JSE listed companies, for which it is mandatory.
On reviewing the integrated reports of the top 211 SOCs in South Africa (as per Schedule 2 of the Public Finance Management Act, 1999, “PFMA”), it was found that the adoption of the Framework is still not at an ideal level. This is somewhat disappointing since the 31 March 2015 annual / integrated reports would have given the SOCs a second year in which to apply the Framework, as it was released in December 2013.
When reviewing these reports, it was clear that there is a divide within the SOCS – those that give attention to and apply the International Integrated Reporting Framework, and those that do not. The first group continues to develop in terms of applying the Framework and reporting improvements have been noted amongst these companies. This has not been the case in the second group.
Minor adjustments were made to the scorecard for this review; however, these did not substantially influence comparability with the previous year’s results. The 2015 scorecard reflected an average score of 54.8%, a slight improvement on 2014 (54.2%).
Overall, the results indicate, at a high level, that the SOCs achieved an average score of more than 50% for nine of the 12 expected disclosures (see Graph 1), yet fell below 50% for three. The best performance remains in the area of “Consistency and Comparability” (84.8% vs 2014: 100%), which means that all of the assessed SOCs continued to ensure consistency over time and enabled comparisons with other organisations (and with prior years of the same SOC) to the extent material to the organisation’s own ability to create value. However, it is disappointing to note that in this category, performance weakened considerably. The disclosure of “Strategic Focus” was also good and, in fact, improved from 71.7% in 2014 to 79.4% in 2015. Other categories showing good improvements are the “Content Elements” (up from 55% in 2014 to 72.9% in 2015) and the “Wow Factor” (up from 11.7% in 2014 to 22.7% in 2015).
EXECUTIVE
SUMMARY
1 Excluding South African Airways SOC Limited and South African Nuclear Energy Corporation Limited, whose annual reports were not ready for assessment. Broadband Infrastructure Company (Pty) Limited was incorporated under Telkom SA Limited and thus did not present an annual report for 2015. It should be noted that, due to non-publication of three SOCs results for 2015, only 18 SOC reports were reviewed this year

Aver
age
Perf
orm
ance
%
0
20
40
60
80
100
6 |
What remains of concern is the length of the reports, which in 2015 increased again after showing a decrease in 2014. This is despite the Framework’s overall objective of achieving succinctness. The lengthiest report this year was 445 pages, compared to 296 pages in 2014.
The full results and analysis of each category can be found in Chapter 1. In terms of the Fundamental Concepts (that include the value creation model, the business model and the six capitals) – which are discussed in more detail in Chapter 2) there was a pronounced improvement over the previous year. Five SOCs fully disclosed the Fundamental Concepts, compared to just one in 2014.
Two SOCs (2014: six) showed some initiative in terms of applying the Fundamental Concepts, but will need to do more work in their future reports, especially with respect to introducing the inputs and outputs. The remaining SOC reports were still nowhere close to a proper representation of the Fundamental Concepts, although seven of these did mention a business model, an improvement on the five in 2014.
Lastly, it must be noted that sustainability assurance remains a lesser priority within the SOCs.
Stra
tegi
c Fo
cus
Conn
ectiv
ity o
f In
form
atio
n
Mat
eria
lity
in Te
rms
of
Stak
ehol
ders
Dea
lings
Nat
ure
of D
ealin
g w
ith
Stak
ehol
ders
Conc
isen
ess
Relia
bilit
y an
d Co
mpl
eten
ess
Cons
iste
ncy
and
Com
para
bilit
y
Fund
amen
tal C
once
pts,
Busi
ness
Mod
el, C
apita
ls
Cont
ent E
lem
ents
(exc
ludi
ng
Stra
tegi
c Fo
cus)
The
WO
W F
acto
r (un
ique
w
ay o
f dis
clos
ure)
Layo
ut a
nd B
asis
of
Pres
enta
tion
IR N
ame,
IIRC
, Res
pons
ibili
ty
(onl
y 20
15)
Graph 1 – Average Performance for State Owned Companies – 2015 and 2014
THE WINNERS: We are proud to announce this year’s winners as:
1. Airports Company South Africa SOC Limited with an “A” rating (more than
80%)
2. Telkom SA SOC Limited with an “A” rating (more than 80%)
3. Transnet SOC Limited with an “A” rating (more than 80%)
2015 2014
52
79.4
71.7
59.556.3
57.766.9 67.6
66.9
28
41.3
62.368.5
84.8
100
43.345
72.9
55
22.7
11.7
54.3
61

| 7
Integrated Reporting – A continued journey
The following are the qualifying finalists, which scored 50% or more (the full details and positions in the past few years can be found in Section 1.5 of Chapter 1):
The winner, Airports Company South Africa SOC Limited (ACSA), improved from eighth position in 2014 to achieve first position for its 2015 annual report. What makes this accomplishment remarkable is the fact that the 2015 annual report was only the second integrated report ever published by ACSA.
Telkom SA SOC Limited, which was in fourth position in 2014, obtained a level A rating and second place overall. It produced a suburb report this year.
Transnet SOC Limited, the winner in 2014, published another great annual report for 2015, obtaining a level A rating and making third place.
Eskom SOC Limited, which was ranked third in 2014, achieved fifth position.
We applaud the three winners for 2015 and thank them for the example they are setting for both SOCs and listed companies in South Africa. These top three SOCs are worthy winners and in many instances leaders in the integrated, financial and sustainability reporting fields. The remainder of the SOCs on the list deserve to be congratulated for exceeding the expected minimum disclosure requirements.
EXECUTIVE SUMMARY
B rating
Air Traffic and Navigation
Services SOC Limited
B rating
Eskom Holdings SOC Limited
B rating
Development Bank of Southern
Africa
B rating
Denel SOC Limited
D rating
Industrial Development Corporation of
South Africa Limited
D rating
Central Energy Fund SOC
Limited
4th Place
5th Place
6th Place
7th Place
8th Place
9th Place
The 2015 results could not be directly compared with the 2014 results, given the changes in the structure of the research and the allocations of the mark sheet in 2014, but the scores remained
good in 2015. There are nine qualifying finalists, with an average score of 54.8%. Seven SOCs scored a level C or higher – 39% of the 18 SOCs assessed.

8 |

1.1 The Integrated Reporting Framework Total Score Analysis
| 9
Integrated Reporting – A continued journey
50.0%of the Integrated
Reporting Framework recommendations
Nine of the SOCs scored higher than
CHAPTER 1
RESEARCH
FINDINGS AND RESULTS
The elements of the Integrated Reporting Framework were scored as follows:
IR Name, IIRC, Responsibility
[Name of the report is “Integrated Report”; applied the International Integrated Reporting Framework; accepted responsibility for the report; gave an opinion if the Framework was applied (not scored in previous year)]
15 marks
Strategic Focus 5 marks
Connectivity of Information 15 marks
Materiality in terms of Stakeholder Dealings 10 marks
Nature of Dealings with Stakeholders 10 marks
Conciseness 15 marks
Reliability and Completeness 15 marks
Consistency and Comparability 5 marks
Fundamental Concepts, Business Model, Capitals 30 marks
Content Elements 35 marks
The “Wow” Factor 15 marks
Layout and Basis of Presentation 30 marks
TOTAL 200 marks

10 |
Nine of the SOCs scored higher than 50% (2014: 55%) in terms of applying the recommendations of the Integrated Reporting, with the average score being 54.8% (2014: 54.2%). This slight improvement means that there is some application of the Framework.
The decrease in the number of SOCs that scored more than 50% can be attributed to the fact that two SOCs reports were not ready / published at the time the analysis was done. For the first time, three SOCs achieved A ratings, as was indicated in the Executive Summary. Graph 2 provides an analysis of the total scores.
Graph 2 – Integrated Reporting Framework Total Scores
Graph 3 – Name of Report, IIRC and Responsibility
Num
ber o
f com
pani
es
A rating B rating C rating D rating Below D rating0
2
4
6
8
10
A Rating80% – 100%
B Rating70% – 79%
C Rating60% – 69%
D Rating50% – 59%
Below D Rating0 – 49%
9
4
23
45
1.1.1 NAME OF REPORT, IIRC AND RESPONSIBILITY
Nine of the SOCs (56%) scored higher than a D rating and the average score was 52%.
Num
ber o
f com
pani
es
A rating B rating C rating D rating Below D rating0
1
2
3
4
5
6
7
8
A Rating80% – 100%
7
8
2
1
B Rating70% – 79%
C Rating60% – 69%
D Rating50% – 59%
Below D Rating0 – 49%
2
9
2015 2014

| 11
Integrated Reporting – A continued journey
In both 2014 and 2015, 13 of the SOCs (72%; 2014:65%) scored a D rating or higher and the average score was 59.5% (2014: 56.3%).
1.1.2 STRATEGIC FOCUS
1.1.3 CONNECTIVITY OF INFORMATION
CHAPTER 1N
umbe
r of c
ompa
nies
A rating B rating C rating D rating Below D rating0
1
2
3
4
5
6
7
8
3
6
3
6
1
7
5
A Rating80% – 100%
B Rating70% – 79%
C Rating60% – 69%
D Rating50% – 59%
Below D Rating0 – 49%
Seventeen (2014: 19) of the SOCs (94%; 2014: 95%) scored higher than a D rating and the average score was 79.4% (2014: 71.7%).
Num
ber o
f com
pani
es
A rating B rating C rating D rating Below D rating0
2
4
6
8
10
12
A Rating80% – 100%
4
10
21
6
12
1 1
B Rating70% – 79%
C Rating60% – 69%
D Rating50% – 59%
Below D Rating0 – 49%
2015 2014
2015 2014
12
1
6
1
Graph 4 – Strategic Focus
Graph 5 – Connectivity of Information

12 |
Eleven (2014: 15) of the SOCs (61%; 2014: 75%) scored a D rating or higher and the average score was 57.7% (2014: 66.9%).
Fifteen of the SOCs (83%; 2014:75%) scored higher than a D rating and the average score was 67.6% (2014: 66.9%).
1.1.4 MATERIALITY IN TERMS OF STAKEHOLDER DEALINGS
1.1.5 NATURE OF DEALINGS WITH STAKEHOLDERS
Num
ber o
f com
pani
es
A rating B rating C rating D rating Below D rating0
1
2
3
4
5
6
7
8
Num
ber o
f com
pani
es
A rating B rating C rating D rating Below D rating0
2
4
6
8
10
8
4
1
3
2
9
7
5
3
1
32
5
3
5
7
A Rating80% – 100%
B Rating70% – 79%
C Rating60% – 69%
D Rating50% – 59%
Below D Rating0 – 49%
A Rating80% – 100%
B Rating70% – 79%
C Rating60% – 69%
D Rating50% – 59%
Below D Rating0 – 49%
2015 2014
2015 2014
8
Graph 6 – Materiality of Stakeholder Dealings
Graph 7 – Nature of Dealings with Stakeholders

Graph 8 – Conciseness
Graph 9 – Reliability and Completeness
Num
ber o
f com
pani
es
A rating B rating C rating D rating Below D rating0
3
6
9
12
15
| 13
Integrated Reporting – A continued journey
CHAPTER 1
Five (2014: seven) of the SOCs (28%; 2014: 35%) scored higher than a D rating and the average score was 28% (2014: 41.3%).
Fifteen (2014: 17) of the SOCs (83%; 2014: 85%) scored a D rating or higher and the average score was 62.3% (2014: 68.5%).
1.1.6 CONCISENESS
1.1.7 RELIABILITY AND COMPLETENESS
Num
ber o
f com
pani
es
A rating B rating C rating D rating Below D rating0
2
4
6
8
10
A Rating80% – 100%
B Rating70% – 79%
C Rating60% – 69%
D Rating50% – 59%
Below D Rating0 – 49%
A Rating80% – 100%
B Rating70% – 79%
C Rating60% – 69%
D Rating50% – 59%
Below D Rating0 – 49%
3
1
10
5
3
1
4
6
3 3 3
4 4
13 13
2015 2014
2015 2014

Graph 10 – Consistency and Comparability
Graph 11 – Fundamental Concepts
14 |
Fifteen (2014: 20) SOCs (83%; 2014: 100%) scored higher than a D rating and the average score was 84.8% (2014: 100%).
Eight (2014:10) of the SOCs (44%; 2014:50%) scored higher than a D rating and the average score was 43.3% (2014: 45%).
1.1.8 CONSISTENCY AND COMPARABILITY
1.1.9 FUNDAMENTAL CONCEPTS, BUSINESS MODEL, CAPITALS
Num
ber o
f com
pani
es
A rating B rating C rating D rating Below D rating0
5
10
15
20
Num
ber o
f com
pani
es
A rating B rating C rating D rating Below D rating0
2
4
6
8
10
A Rating80% – 100%
B Rating70% – 79%
C Rating60% – 69%
D Rating50% – 59%
Below D Rating0 – 49%
A Rating80% – 100%
B Rating70% – 79%
C Rating60% – 69%
D Rating50% – 59%
Below D Rating0 – 49%
2
4 4
1
34
10 10
20
14
13
2015 2014
2015 2014

| 15
Integrated Reporting – A continued journey
CHAPTER 1
Fifteen of the SOCs (83%; 2014: 75%) scored a D rating or higher and the average score was 72.9% (2014: 55%)
Three (2014: 0) of the SOCs (17%; 2014: 0%) scored a D rating or higher and the average score was 22.7% (2014: 11.7%).
1.1.10 CONTENT ELEMENTS
1.1.11 THE” WOW” FACTOR
Num
ber o
f com
pani
es
A rating B rating C rating D rating Below D rating0
1
2
3
4
5
6
7
8
Num
ber o
f com
pani
es
A rating B rating C rating D rating Below D rating0
5
10
15
20
A Rating80% – 100%
B Rating70% – 79%
C Rating60% – 69%
D Rating50% – 59%
Below D Rating0 – 49%
A Rating80% – 100%
B Rating70% – 79%
C Rating60% – 69%
D Rating50% – 59%
Below D Rating0 – 49%
7
8
2
5
2
6
5
3
20
15
12
2015 2014
2015 2014
Graph 12 – Content Elements
Graph 13 – The “Wow” Factor

16 |
Eleven (2014: 16) of the SOCs (61%; 2014: 80%) scored a D rating or higher and the average score was 54.3% (2014: 61%).
From Table 1 it is clear that there was some overall improvement in 2015, with five SOCs disclosing a business model, compared to just one in 2014. However, it must be noted that the remaining
SOCs were nowhere close to a proper presentation of their busi-ness models as outlined in the Framework. Chapter 2 will provide more insight on the disclosure of the Fundamental Concepts.
1.1.12 LAYOUT AND BASIS OF PRESENTATION
Num
ber o
f com
pani
es
A rating B rating C rating D rating Below D rating0
2
4
6
8
10
A Rating80% – 100%
B Rating70% – 79%
C Rating60% – 69%
D Rating50% – 59%
Below D Rating0 – 49%
Number of SOCs in 2015
Number of SOCs in 2014
Business model graphic representation Use of capitals in the business model Comments
5 1 Full business model included All six capitals part of business model Excellent
1 1 Good graphic of business model Only four capitals included Focus on development
1 3 Business model included Capitals not part of business model
Capitals briefly described elsewhere, but linked to the strategic dimensions in a table, according to which the performance section is categorised
0 2 Good graphic of business model
No capitals in the business model or elsewhere. One company presented capitals as “enabling resources” and had a value creation section. Not called a “business model”
1 1Business model mentioned, but not presented. A simple model of strategic pillars is presented
This SOC describes five of the six capitals (excluding intellectual capital) as part of the strategic pillars
Graphic of the strategic pillars is quite good, but still not a business model or value creation process
1 1Business model mentioned, but not presented as per Framework – just physical/natural movement presented
Capitals mentioned elsewhere
5 3 Business model mentioned, but not presented No capitals mentioned
0 2 Some graphics presented, but not a business model No capitals mentioned
4 6 No business model mentioned No capitals mentioned (except for one SOC briefly discussing Human Capital)
5
2
5
2
9
2 2
4
7
Table 1 – Analysis of Disclosure of Fundamental Concepts: 2015 vs 2014
1.2 The Fundamental Concepts: Business Model and Graphics, Capitals, Value Creation
2015 2014
Graph 14 – Layout and Basis of Presentation
| 17
Integrated Reporting – A continued journey
CHAPTER 1
As in the previous year, the most common issue was that many of the SOCs simply did not follow the recommendations of the In-ternational Integrated Reporting Framework. However, since the Framework presents a complex set of new criteria, we continue to recommend that organisations apply the tools offered by Nkonki to ensure they are developing integrated reports that conform to
increasingly global standards such as the Framework.
Most SOCs that adopted the Integrated Reporting Framework did reasonably well in the scoring. Those that did not, lost marks as a result of only partially disclosing the Content Elements and Fundamental Concepts.
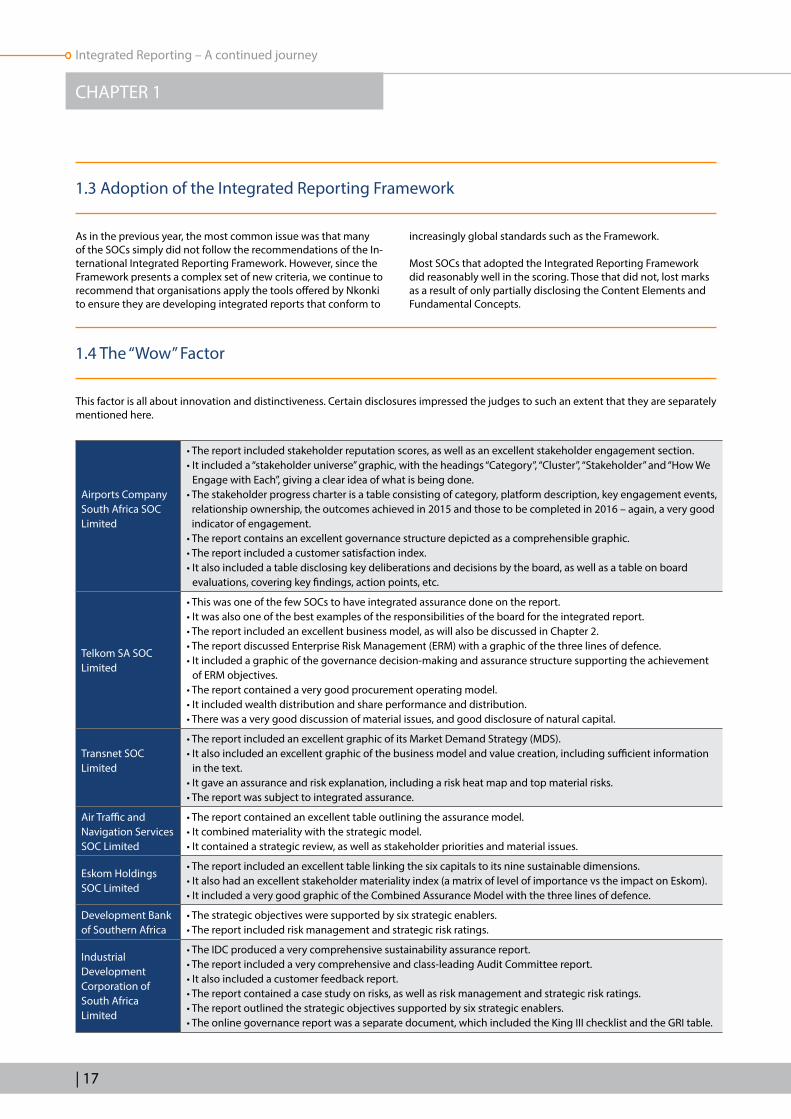
This factor is all about innovation and distinctiveness. Certain disclosures impressed the judges to such an extent that they are separately mentioned here.
1.3 Adoption of the Integrated Reporting Framework
1.4 The “Wow” Factor
Airports Company South Africa SOC Limited
• The report included stakeholder reputation scores, as well as an excellent stakeholder engagement section.• It included a “stakeholder universe” graphic, with the headings “Category”, “Cluster”, “Stakeholder” and “How We
Engage with Each”, giving a clear idea of what is being done.• The stakeholder progress charter is a table consisting of category, platform description, key engagement events,
relationship ownership, the outcomes achieved in 2015 and those to be completed in 2016 – again, a very good indicator of engagement.
• The report contains an excellent governance structure depicted as a comprehensible graphic.• The report included a customer satisfaction index.• It also included a table disclosing key deliberations and decisions by the board, as well as a table on board
evaluations, covering key findings, action points, etc.
Telkom SA SOC Limited
• This was one of the few SOCs to have integrated assurance done on the report.• It was also one of the best examples of the responsibilities of the board for the integrated report.• The report included an excellent business model, as will also be discussed in Chapter 2.• The report discussed Enterprise Risk Management (ERM) with a graphic of the three lines of defence.• It included a graphic of the governance decision-making and assurance structure supporting the achievement
of ERM objectives.• The report contained a very good procurement operating model.• It included wealth distribution and share performance and distribution.• There was a very good discussion of material issues, and good disclosure of natural capital.
Transnet SOC Limited
• The report included an excellent graphic of its Market Demand Strategy (MDS).• It also included an excellent graphic of the business model and value creation, including sufficient information
in the text.• It gave an assurance and risk explanation, including a risk heat map and top material risks.• The report was subject to integrated assurance.
Air Traffic and Navigation Services SOC Limited
• The report contained an excellent table outlining the assurance model.• It combined materiality with the strategic model.• It contained a strategic review, as well as stakeholder priorities and material issues.
Eskom Holdings SOC Limited
• The report included an excellent table linking the six capitals to its nine sustainable dimensions.• It also had an excellent stakeholder materiality index (a matrix of level of importance vs the impact on Eskom).• It included a very good graphic of the Combined Assurance Model with the three lines of defence.
Development Bank of Southern Africa
• The strategic objectives were supported by six strategic enablers.• The report included risk management and strategic risk ratings.
Industrial Development Corporation of South Africa Limited
• The IDC produced a very comprehensive sustainability assurance report.• The report included a very comprehensive and class-leading Audit Committee report.• It also included a customer feedback report.• The report contained a case study on risks, as well as risk management and strategic risk ratings.• The report outlined the strategic objectives supported by six strategic enablers.• The online governance report was a separate document, which included the King III checklist and the GRI table.

18 |
Findings indicate that a few SOCs have made remarkable improvements in their integrated reports. These include ACSA, which improved from eighth position to first position. What makes this remarkable is the fact that this was only the second integrated report ever published by ACSA. The South African Post Office Limited also showed good progress, improving from 18th to 11th position.
There were no big downward movements, which is a good sign overall in terms of the SOCs applying proper integrated reporting principles, including the International Integrated Reporting Framework.
However, a major concern relates to sustainability, one of the main purposes of integrated thinking – the ultimate objective
of integrated reporting. This is highlighted by the fact that Broadband Infrastructure Company (Pty) Limited (Broadband Infraco), in seventh place last year, was taken over by Telkom due to “going concern” problems.
Another two SOCs were struggling with cash flow and solvency issues and had not, at the time of this report going to press, published annual reports – South African Airways SOC Limited (sixth place in 2014) and the South African Nuclear Energy Corporation Limited (14th in 2014). This underlines the fact that good integrated reports do not guarantee success and sustainability if they are not based on sound corporate governance, business principles and integrated thinking.
RankingsState Owned Company
Results
2012 2013 2014 2015 2012 2013 2014 2015
10 12 8 1 Airports Company South Africa SOC Limited E E D A
2 3 4 2 Telkom SA SOC Limited C B B A
3 2 1 3 Transnet SOC Limited C B B A
15 10 2 4 Air Traffic and Navigation Services SOC Limited F D B B
1 1 3 5 Eskom Holdings SOC Limited B B B B
8 7 4 6 Development Bank of Southern Africa E D B B
5 4 9 7 Denel SOC Limited D C D B
4 5 5 8 Industrial Development Corporation of South Africa Limited D C C D
17 18 10 9 Central Energy Fund SOC Limited G G D D
Below D Rating
14 16 15 10 South African Broadcasting Corporation SOC Limited F F E E
7 18 11 South African Post Office Limited D F E
10 11 12 12 Trans-Caledon Tunnel Authority E E E E
12 6 11 13 South African Forestry Company SOC Limited E D E E
18 17 17 14 Armaments Corporation of South Africa SOC Limited G F F F
16 16 12 15 Alexkor SOC Limited F F E F
9 9 13 16 Land and Agricultural Development Bank of South Africa E D E G
16 17 Independent Development Trust F G
15 18 South African Express SOC Limited F G
11 13 6 South African Airways SOC Limited E E C
13 14 7 Broadband Infraco SOC Limited F E D
6 8 14 South African Nuclear Energy Corporation SOC Limited D D E
1.5 Overall Ratings and Results
Table 2 – Analysis of Rankings: 2012 to 2015

Integrated Reporting – A continued journey
| 19
CHAPTER 1
The Global Reporting Initiative’s (GRI) Sustainability Reporting Guidelines, version 4 (GRI, 2013) remains the main global standard for reporting on sustainability and more specifically, the relevant KPIs for measuring sustainability.2 Whilst the International Integrated Reporting Framework does not refer to the GRI guidelines, Nkonki felt that the use of and reference to the guidelines should be analysed as part of this research.
It was found that 13 of the 18 SOCs stated that they followed the GRI guidelines (72%, compared to 70% in 2014). However, it is interesting to note how they referred to them:
• Two reports referred to the G4 “Core” guidelines.• Two reports referred to the G4 guidelines, with one SOC stating
it wanted to achieve “Core” status in the future.• Three reports referred to the previous guidelines, G3.• Five reports simply mention the “GRI guidelines” as a whole or
that they used the GRI Index.
Although the International Integrated Reporting Framework is silent on the matter, an important point coming out of both the King III Report and the King III Code (Principle 9.3) (IoD, 2009b),3 as well as the G4 guidelines is the recommendation that the sustainability report should be independently assured. A company would thus be well advised to follow best practice in this matter, and begin the journey towards having their sustainability report independently assured by starting to apply the GRI G4 guidelines and appointing an external assurance provider.
Even though seven SOCs (2014: 5; 2013: 3 and 2012: 3) had an independently-assured sustainability report (some with a declared Application Level and some not), taking the above into account, it was disappointing to find the following:
• Of the seven with independently-assured sustainability reports, three of these reports could not be found where they were supposed to be (according to the integrated report). Of the remaining four, one sustainability report was included in the Annual Financial Statements (as part of the Auditor-General’s audit report). Four of the seven reports had limited external assurance, and three provided both reasonable and limited assurance.
• Another four (2014: 3) reports contained internal assurance statements, such as from Internal Audit. Two of these could also not be found.
• There is still confusion about the use of G3.1, G3.2 or G4.• It is recommended that SOCs come to grips with the GRI G4
guidelines and apply these guidelines to any reports published after 31 December 2015.
A last comment is about the names of the reports: both Alexkor and the South African Post Office call their reports “integrated reports”, but in essence they are not. Not one of the reports surveyed refers to the IIRC.
1.6 Sustainability
2 It must be noted again that in the predecessor guidelines, G3, there were three application levels – “A”, “B” and “C” (with a “+” sign indicating if some of the KPIs had been assured). The G4 guidelines only make provision for compliance at a “Core” or “Comprehensive” level.
3 It should be noted that King IV, due to be released in November 2016, leans more towards a Combined Assurance Model, and remains silent on the matter of assuring sustainability reports per se.
Overall 50% of the SOCs reviewed
scored above 50% (D or better).
This is a slight decline on the 55%
achieved in 2014, but the same
as that achieved in 2013 (2012:
37%; 2011: 16%).

20 |
1.7 Conclusion
Overall, half of the 18 SOCs (50%) reviewed scored above 50% (D or better) for the application of the International Integrated Reporting Framework, a decrease of 5% on the 2014 results (55%). Of concern is that only the stronger SOCs seem to be making progress in terms of integrated reporting, whilst the weaker SOCs are still, in general, not making much progress. This is a clear indication that many SOCs need to improve their integrated reporting efforts, as well as their sustainability disclosure. They should also begin to disclose sustainability information using acknowledged and generally-accepted guidelines, such as those of the IIRC and the GRI. More importantly, however, SOCs should reflect reality in their integrated reports.

| 21
Integrated Reporting – A continued journey
According to the International Integrated Reporting Framework, there are three fundamental concepts underpinning integrated reporting:
1. Value creation for the organisation and for others. An organisation’s activities, its interactions and relationships, its outputs and the outcomes for the various capitals it uses and affects, influence its ability to continue to draw on these capitals in a continuous cycle. It must then also attempt to continue to create value to ensure sustainability.
2. The capitals are the resources and the relationships used and affected by the organisation. These are identified in the Integrated Reporting Framework in the following six categories: financial, manufactured, intellectual, human, social and relationship, and natural capital. However, these categories are not required to be adopted in preparing an
entity’s integrated report, and an integrated report does not have to include all six capitals – the focus is on those capitals that are relevant to the entity.
3. The value creation process. At the core of the value creation process is an entity’s business model, which draws on various capitals and inputs, and through the entity’s business activities, the business creates outputs (products, services, by-products, waste) and outcomes (internal and external consequences for the capitals).
The Content Elements are linked together in a graphic presentation of the value creation process, with the business model in the middle. The six capitals (a Fundamental Concept) are the starting point for the process (the inputs), as well as the end point (the outcomes).
CHAPTER 2
2.1 The Integrated Reporting Framework Total Score Analysis
THE
FUNDAMENTAL CONCEPTS
Figure 1 – Value Creation and Business Model as per the Integrated Reporting Framework

22 |
This kind of mapping or modelling of value creation is an important foundation for strategic planning and for performance measurement and evaluation (Adams, 2015). For this reason, it is meaningful to analyse if and how a business (or SOC) analyses
and interprets its own value creation process in an integrated manner in its integrated report. This is the first sign that the silos of reporting are being collapsed and that integrated thinking is taking place amongst those charged with governance.
A summary of how the SOCs disclosed the Fundamental Concepts and value creation process was provided in Chapter 1 (Table 1 – Analysis of Disclosure of Fundamental Concepts: 2015 vs 2014).
In this chapter more detail of these disclosures is given. Please note that only those SOCS that mentioned a business model are analysed.
2.2 Graphic Representation of the Value Creation Process and Business Model
Airports Company South Africa SOC Limited
ACSA’s report is outstanding in that provides a fully-developed business model as part of the strategy discussion. The business model is given in table format, representing a vertical flow of capitals and processes.
Overall the process includes governance, regulatory, financial status, stakeholders and employees. The capitals are then grouped under three sections: Our Business, Our People and Society, and Our environment, with the relevant capitals given in each category. For each capital more details are provided and there is a flow from inputs, activities and outputs to outcomes, right after a process of integrated sustainable value creation.
Telkom SA SOC Limited
The business model is linked to Telkom’s strategy and is represented as a process flow where the organisation’s purpose, i.e. to “Seamlessly connect South Africans to a better life” lies at the centre of a circular graphic, followed by layers depicting ERM, governance and stakeholders. Linked to the circular graphic are assets, values, governance, stakeholders, and ERM, each described briefly.
This graphic flows onto the next page, where the strategic objectives are listed. These include being a “leading provider of converged ICT solutions”, putting the “customer first”, and “building a sustainable business”. The process flow relates to each of the six capitals. The only deviation from the Integrated Reporting Framework is that the name “productive” is used in relation to manufactured capital. The value created or the outcome of each capital is then listed.
The next few pages of the report focus on the key features of the financial year, including a table outlining wealth creation, followed by graphs showing both wealth creation and wealth distribution. There is also a table in the report dedicated to integrated performance indicators. The section concludes with an analysis of the share price performance and main shareholders.

| 23
Integrated Reporting – A continued journey
CHAPTER 2
Transnet SOC Limited
The Transnet value creation model is depicted in a large graphic across a fold-out four-page spread, which includes a business model at the centre. This is linked to Transnet’s Market Demand Strategy (MDS), which lies at the core of Transnet’s activities. The business model draws on various capitals as inputs which, through the company’s business activities, then are converted into commercial and sustainable developmental outcomes.
To the left of the business model, each of the six capitals listed – as recommended by the International Integrated Reporting Framework – gives further detail on what is included, and includes numeric and other measurement indicators. This flows to a column outlining the MDS imperatives (e.g. capacity creation), enablers (e.g. sound governance and ethics) and sustainable developmental outcomes (e.g. regional integration and transformation).
To the right of the business model there is a column listing the expected MDS outcomes grouped under the headings: Financial, Capacity, Operational, and Market, and then the enablers. All these are referenced to the relevant pages within the integrated report. Lastly, there is a column listing the 2015 outputs for each of the six capitals.
What makes this report remarkable is that an entire section of it, starting with the fold-out spread, is devoted to how Transnet creates value, linking back to the value creation model and the MDS.
Air Traffic and Navigation Services SOC Limited
The business model links the functions of the SOC to its mandate on the one hand and its customers on the other. The value creation process is on a double-page spread and lists the vision, mission and values at the top of the process. Inputs are listed on the left, outlining all six capitals and giving the components of each, including some measures. This flows into two columns – the first outlining the context, key risks, opportunities and the second, the strategy. The second column is further broken down into economic, social, and environmental sustainability.
Next to that are three building blocks from the business model: Operational Concept, Enabling Infrastructure & Resources, and ATM & TS Operations. The last column contains the outcomes, which are not the six capitals, but the outcomes linked to the strategy (again listed in terms of economic, social, and environmental sustainability). There are no outputs, and neither the model nor the process are discussed further within the integrated report.

24 |
Eskom Holdings SOC Limited
The Eskom business model extends over two pages and is a very literal representation of how energy is generated (both renewable and non-renewable), following the process from primary energy sources, to power generation, to transmission, through to distribution. It ends with customers. KPIs are listed below the model in terms of Inputs, Process, Outcomes and Outputs. The capitals are not directly included in this model, and there is no further discussion of it within the report.
Development Bank of Southern Africa
The DBSA has a very detailed business model extending over four pages and included as part of the chapter “The DBSA and its strategy”. The first column describes how the Bank supports infrastructure development and creates value. The capitals (intellectual, social, financial and human) follow from that, with a short description and some key metrics included (financial and other), as well as the key regulators involved.
The next section describes the value chain in terms of the steps involved, i.e. Plan, Prepare, Finance, Build, and Maintain/Improve. This is outlined in terms of both services (projects in sectors such as education, health and housing) and clients/markets (e.g. national and provincial government departments, municipalities, etc.).
The following page details the four main elements essential for the Bank to remain financially sustainable. Flowing from that are the outputs described in terms of the key areas of Project Preparation, Infrastructure Financing, Financial Results, and Infrastructure Implementation, including key financial metrics.
The last page details the outcomes in terms of development, also in four areas, i.e. Municipal (South Africa), Non-Municipal (South Africa and SADC), Implementation Support to Municipalities (Non-Lending) and Infrastructure Implementation.

| 25
Integrated Reporting – A continued journey
CHAPTER 2
Denel SOC Limited
The Denel business model is not very detailed, but does contain the main concepts as required by the International Integrated Reporting Framework. The word “capitals” is not included, but the model does make reference to inputs and outcomes.
In the centre of the model is a circle containing the elements of a business model as broadly outlined by the Framework. The inputs are listed on the left as Human Capital, Intellectual Property, Natural Capital and others such as Material, Funding and Stakeholders. These are “translated” into outputs on the right hand side of the business model, classified in terms of products and services.
The bottom part of the graphic details the outcomes, classified in groups similar to the incomes, with Material replaced by Supply Chain, Funding by Financial Capital and Stakeholders by Social Capital, which makes it all a bit confusing for the reader, who is not able to link inputs and outcomes directly. Even more confusingly, the following page details the outputs extensively in terms of products and services.
There is no further discussion in the report of the business model nor of value creation.
Airports Company South Africa SOC Limited
As outlined in its business model, there are components of each capital describing the capital, whether as part of inputs, activities,
outputs or outcomes. The entire operational report section is divided into the six capitals, which gives the reader an excellent and integrated description. This detail and effort makes ACSA a worthy overall winner.
Under manufactured capital, the following is described over 19 pages:
Aeronautical business
Cargo Increasing traffic
Customer care Building for the future
Special needs Community programmes
Safety International traffic
Hazards, events and safety concerns New measures
Aerodrome rescue and fire fighting A roadmap for growth
Security Regional airports
Systems for efficiency
2.3 Treatment of the Six Capitals

26 |
Non-aeronautical
Highlight metrics: head count, learning and performance, transformation, employee wellness and engagement, succession and leadership development
Appointments, promotions and terminations, including a table of workforce movements for gender and race in each of these three areas
Securing capable and agile leadership capability (succession management, leadership development, organisational capability and aviation expertise)
Securing meaningful employee relations and engagement (including engagement scores graph, engagement driver table and disciplinary action table)
Key drivers and commitmentsEmbedding a fair and equitable employee reward value proposition
Overview The imagined future
Resourcing
Information Technology – overview, Group IT operating model, Group IT value proposition and figure for digital business platform, matters in need of attention, enterprise applications, Group IT operations and a customer satisfaction index, as well as system availability year-on-year
Group IT compliance and assurance and King III governance assessment graph
Electronic services IT project management office
Information security The year ahead
Group IT infrastructure Group IT vision
Ensuring financial and commercial sustainability Credit rating reviews
Financial overview (financial results, financial position and key financial ratios) – and a graph for profit after tax
Cash flows
Capital expenditure Outlook
Value created
Revenue – aeronautical and non-aeronautical revenue, graph for departing passengers and related revenue, and for arrival aircraft and related revenue
Capital expenditure programme and graph
Charts for commercial revenue and operating expenses Funding requirements and graphs
Balance sheet and charts for total assets, debt and financing costs and debt maturity profile
Retail – including graphs and KPIs for total retail revenue (R), retail revenue per airport, retail lettable area by airport (%) and trading area (%), and retail lettable area by category and trading area (%)
Advertising
Outlook Parking
Car rental Airport management solutions
Property Future plans
Property development and the various individual airports Logistics
Under financial capital (the CFO report), the following is described over 12 pages:
Under the heading intellectual capital, discussed over 10 pages, one finds the following:
Human capital is the next capital, covering the following topics over eight pages:

Integrated Reporting – A continued journey
| 27
CHAPTER 2
Telkom SA SOC Limited
The performance chapter of this integrated report is organised according each of the six capitals, and is exceptionally detailed, starting with financial capital, which is covered in seven pages and includes the following:
• A table linking the financial structure, operating efficiency, and supply and value management to the approach and outlook for the future.
• A page of financial highlights including information on the number of ADSL subscribers, revenue for managed data network sites, and traffic volumes in terabytes.
• A discussion and charts for operating revenue and EBITDA, as well as mobile net revenue and ADSL subscribers.
• There are graphs and growth charts relating to derisking the business in terms of growth in mobile data and the stabilisation of voice rentals.
• This is followed by information on capital expenditure, the procurement operating model, supply and value management, enterprise development and the outlook.
Productive capital, dealt with over 12 pages, includes:
• This includes a page of key highlights, followed by a table listing services, Telkom’s approach, FY2015 principle activities, and the future mapped out according to the categories of fixed-line voice, fixed-line data services, mobile communication services, mobile voice and mobile data, IT services, carrier-to-carrier, distribution channels, the Telkom brand and property portfolio respectively.
• The next page covers the Telkom Business, the Telkom Consumer, and Telkom Wholesale and Networks respectively, each listing the KPIs and providing additional information.
• The remaining pages deal with the Consumer business, Telkom Wholesale and Networks, and the Property portfolio in detail.
Intellectual capital is described in four pages:
• The first page lists the elements of intellectual capital and the approach to each disclosed in table format. The elements include IT, skills and experience of the team, ability to adapt to changing environments, the Telkom brand, stakeholder relationships, the strategies, policies, procedures and codes for governing the business and investment in people and communities.
• The following pages give key performance figures and percentages relating to these, and then cover the role of IT in Telkom and building the Telkom brand.
Human capital covers six pages, as follows:
• The section starts with the philosophy and approach to human capital, and includes employee numbers and headcount movements.
• This is followed by a page in table format giving detailed information relating to human resource management (grouped according to general information, labour relations, employee benefits, and talent management) and the attraction, retention and development of talent (grouped according to skills development, cultural diversity and transformation, and safety, health and wellbeing).
• The next page gives union numbers, and graphs detailing the investment in learning and development since 2013.
• The last few pages deal with safety, health and wellbeing (including key statistics); developing skills and creating job
Social and relationship capital is the following capital, covering the following in five pages:
The last capital is natural capital – an important part of the performance, which is discussed over six pages:
Transformation Retail transformation
Gender representation, including a full table of gender and geographical data for each level of employee
Property transformation
People with disabilities Construction transformation
Enterprise development Socio-economic development and spending
Preferential procurement
Environmental approach, including graphs for electricity consumption, water resource management, fuel and diesel consumption, waste management, noise management and bird and wildlife strikes
Bird and wildlife management
Air quality management Compliance with laws and regulations

28 |
Transnet SOC Limited
Transnet discusses the six capitals only as part of the business model and briefly as part of the section on the creation of value. The value creation process does not deal directly with the
capitals, but is rather structured around the strategic imperatives: financial sustainability, capacity creation, operational excellence, and market segment competitiveness. The performance of each division is also structured around these imperatives and not around the capitals.
opportunities; talent development; and employment equity.
Social and relationship capital covers four pages, as follows, all supported with numbers, figures and graphs:
• Defines the approach to social and relationship capital, followed by information on social investment in three areas – education, social development, and employee volunteerism.
• Three pages in table format then cover social capital in relation to transformation and B-BBEE, skills development, preferential procurement, and enterprise development.
Natural capital cover four pages and deals with the following:
• Description and introduction.• Approach to, current activities and the future relating to
environmental management, water management, emissions management and energy use, waste management, resource consumption and recycling management, biodiversity impact management, environmental incident management and awareness and training.
• Greenhouse gas emissions. • Water consumption comparisons.
Air Traffic and Navigation Services SOC Limited
The capitals are not discussed in the content of the integrated report.
Eskom Holdings SOC Limited
The six capitals are discussed separately but what is unique in this integrated report, is that the sustainability dimensions and the six capitals are linked in a table, which is an acknowledgment of the importance of the capitals.
Development Bank of Southern Africa
The DBSA is focused on development in South Africa and as such has decided not to include manufactured or natural capital in its business model. It thus only deals with intellectual, social,
financial and human capital. That being said, there are many natural and environmental aspects covered in the performance reports. The capitals are not described in detail elsewhere, except for some references to human capital and financial capital in the report.
Denel SOC Limited
Capitals are not discussed separately in the report – as stated previously, they are simply listed in the business model.
There is no further discussion of these capitals in the integrated report, but the operating performance section and the financial review contain all the sustainability dimensions listed in the table, so it is possible to relate performance to the sustainability dimensions.
It is thus important to read this table in conjunction with both the business model and the operating and financial performance information.

Integrated Reporting – A continued journey
| 29
CHAPTER 2
This section focuses on the findings of a further analysis done on stakeholder engagement as part of social and relationship capital. It must be stressed that not all the SOCs discuss this under social capital – 10 SOCs do not refer to the six capitals and but the information can be found in other sections of these reports.
The first part of the research focused on how SOCs engage stakeholders. Fifteen of the 18 SOCs list examples such as meetings, Parliamentary Portfolio Committees, reports, the AGM, industry associations, site visits, public hearings, forums, teleconferences, open days, contracts, social media, roadshows, workshops, summits, surveys, campaigns, media briefings, interviews, training interventions, collective bargaining, task teams, interaction with local communities, shareholder compacts, a dedicated unit to monitor stakeholder engagement, brand reputation research, conferences, industry networks, and whistle-blowing mechanisms. From this it is clear there are a range of stakeholder engagement channels in use.
Second, the research looked at what stakeholders each SOC engage with. All 18 integrated reports disclose stakeholders, including the following, amongst others:
• Government: parliament, national and provincial departments and municipalities
• Regulators and the relevant Minister(s)• Lenders and investors• Suppliers and contractors• Clients and business partners• The board, management, employees, staff and organised labour
(trade unions)• Business groups, civil society, communities and NGOs• Industry experts, analysts and academics• The media • The public• Industry and related organisations • Schools, students and educational institutions• Job seekers• Environmental organisations• Subsidiaries and associates• Associations and business chambers• Bank and banking associations• Special groups, for example emerging farmers, those with
disabilities, pensioners and sporting bodies• Competitors
The third part of the research focused on the classification of stakeholders – the biggest distinction is between public and private stakeholders (five SOCs made this distinction), but there are various other categories as well. Five SOCs makes no distinction between their stakeholders.
• The Telkom report makes no distinction but separately discussed the public sector.
• ACSA defines four categories over and above public and private as a classification: industry, enabling, value creation and social responsiveness.
• Armscor has three categories: defence environment, industry
and wider society.• ATNS distinguishes its stakeholders in six groups: shareholders
and staff, regulatory, shared interests, employment, training and market and industry partnerships.
• DBSA defines three categories: clients, partners and government.
• Eskom also has three categories: economical, environmental and social.
• The IDC defines two categories. The first set comprises financiers, sector players, black industrialists and strong communities. The second distinguishes between people, clients and other customer surveys.
• The IDT discusses only one stakeholder and group of stakeholders, which is the government.
The fourth aspect looked at the methods and processes used to assess the quality of relationships with stakeholders. Seven of the 18 SOCs do not disclose any such methods. The others include other methods such as:
• Perception Survey and Perception Attributable Score (ACSA)• Mechanisms for concern and feedback (Alexkor)• Stakeholder satisfaction survey (Armscor and the IDC)• Working with stakeholders to improve the Heat Map Framework
(Eskom)• Brand reputation research (Telkom)
The second last aspect examined how SOCs respond to or make changes based on stakeholder engagement and relevant quality assessments. Four SOCs do not disclose anything in this regard. Some SOCs draw attention to the following changes:
• ACSA – Train top and middle management on reputation management.
• Armscor – New strategic direction and more funding received.• ATNS – Overall strategy development.• Eskom – Turnaround strategy developed as well as awareness
campaigns, skills progress and a few more.• Landbank – Improved services, communications and simplified
credit applications.• SABC – and SAPO Turnaround corporate plan developed and.• South African Forestry Company (SAFCOL) – Skills development.• Telkom – A new stakeholder engagement plan for 2016 and a
transformation office was established.• Transnet – Disclosed in the Sustainability Report: a revised
Shareholder’s Compact, establishing a Capital Integration team, address and improve culture gaps, and more. There were a number of responses for each stakeholder included in the report.
The sixth aspect was to determine if any of the SOCs used measurement with respect to stakeholder engagement. In this regard a variety of KPIs, contract details, the value of infrastructure disbursements and outcomes, specific GRI indicators, capital strategic objectives, targets and performance are disclosed. Some of these KPIs are externally assured (Transnet, Telkom and Eskom). Five SOCs do not report anything in relation to measurement.The research also looked at whether there was disclosure of any
2.4 Focus on Social and Relationship Capital and Stakeholder Engagement
30 |
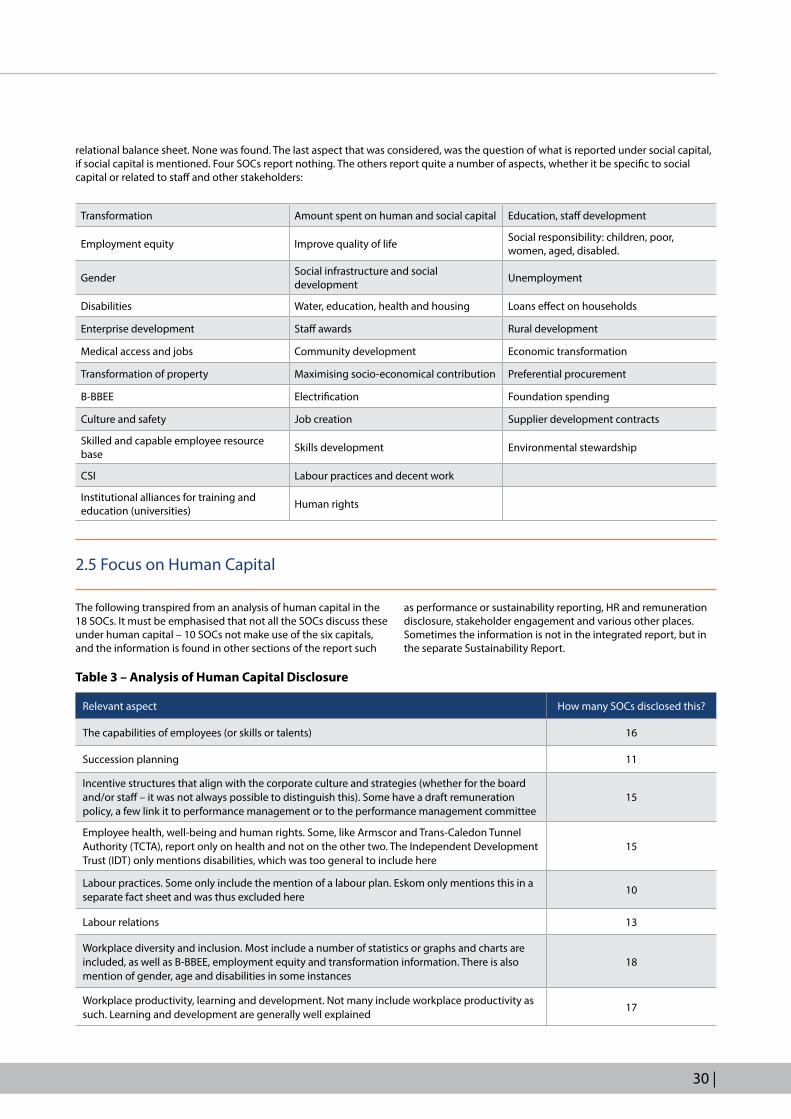
relational balance sheet. None was found. The last aspect that was considered, was the question of what is reported under social capital, if social capital is mentioned. Four SOCs report nothing. The others report quite a number of aspects, whether it be specific to social capital or related to staff and other stakeholders:
Transformation Amount spent on human and social capital Education, staff development
Employment equity Improve quality of life Social responsibility: children, poor, women, aged, disabled.
Gender Social infrastructure and social development Unemployment
Disabilities Water, education, health and housing Loans effect on households
Enterprise development Staff awards Rural development
Medical access and jobs Community development Economic transformation
Transformation of property Maximising socio-economical contribution Preferential procurement
B-BBEE Electrification Foundation spending
Culture and safety Job creation Supplier development contracts
Skilled and capable employee resource base Skills development Environmental stewardship
CSI Labour practices and decent work
Institutional alliances for training and education (universities) Human rights
2.5 Focus on Human Capital
The following transpired from an analysis of human capital in the 18 SOCs. It must be emphasised that not all the SOCs discuss these under human capital – 10 SOCs not make use of the six capitals, and the information is found in other sections of the report such
as performance or sustainability reporting, HR and remuneration disclosure, stakeholder engagement and various other places. Sometimes the information is not in the integrated report, but in the separate Sustainability Report.
Relevant aspect How many SOCs disclosed this?
The capabilities of employees (or skills or talents) 16
Succession planning 11
Incentive structures that align with the corporate culture and strategies (whether for the board and/or staff – it was not always possible to distinguish this). Some have a draft remuneration policy, a few link it to performance management or to the performance management committee
15
Employee health, well-being and human rights. Some, like Armscor and Trans-Caledon Tunnel Authority (TCTA), report only on health and not on the other two. The Independent Development Trust (IDT) only mentions disabilities, which was too general to include here
15
Labour practices. Some only include the mention of a labour plan. Eskom only mentions this in a separate fact sheet and was thus excluded here
10
Labour relations 13
Workplace diversity and inclusion. Most include a number of statistics or graphs and charts are included, as well as B-BBEE, employment equity and transformation information. There is also mention of gender, age and disabilities in some instances
18
Workplace productivity, learning and development. Not many include workplace productivity as such. Learning and development are generally well explained
17
Table 3 – Analysis of Human Capital Disclosure

Integrated Reporting – A continued journey
2.6 Conclusion
This chapter shows that there is excellent application of the IIRC’s International Integrated Reporting Framework amongst the top SOCs. There is, however, much more to be done by the other SOCs, some of which are seemingly not even aware of this Framework. It should also be kept in mind that this survey only deals with some of the largest SOCs in South Africa, as per Schedule 2 of the PFMA. There are hundreds of large and medium SOCs, parastatals, government departments, provincial governments and municipalities not included and which are most likely not yet following the Framework. The Framework should be embraced by all of them. It seems that the only way to get this done, is to let National Treasury include the recommendations in the templates provided to these entities, which are compulsory to follow.
| 31
CHAPTER 2
Despite the reasonably positive number of disclosures evident, it is clear that many SOCs do not provide sufficient depth in covering these aspects. For example, the importance of training and development is often emphasised, but without providing more detail. This is further also evident from section 2.5 – only two SOCs (ACSA and Telkom) provide sufficient details, as well as
statistics, to enable the reader to form a proper understanding and make an informed assessment regarding human capital. ACSA, for example, starts its section on human capital with a few highlights given over two pages, which are like a dashboard of its most important numbers and statistics in this regard.
Telkom starts its discussion on Human Capital with the following important introduction:
“Our human capital includes the competencies, capabilities, experience and motivation to innovate of our people. The alignment of our people with and their support for our approach to governance, risk management and ethical values is all part of our human capital, as is their ability to understand, develop and implement our strategy and to lead, manage and collaborate; as well as their loyalty and motivation to improve our processes, products and services.
Our approach to human resources management is based on international best practice, upholding the United Nation’s (UN) Universal Declaration of Human Rights and the International
Labour Organisation’s Declaration on Fundamental Principles and Rights at Work, which form part of our commitments as a signatory to the UN Global Compact (UNGC). The development of our human resources strategy and its alignment with our group strategy and our employment policies and procedures are the responsibility of the chief of human resources who reports to our group chief executive officer.”
Telkom also perceives human capital to be one of the sources of intellectual capital and thus quite a number of aspects relating to IT, innovation and the Telkom brand, to mention only a few, are discussed in the intellectual capital section.
The comprehensive table included under human capital has already been described in 2.3 above.
The Telkom integrated report also includes some important highlights under the following headings:
Safety, health and wellbeing Talent development
Safety Employment equity
Developing skills and creating job opportunities

32 |
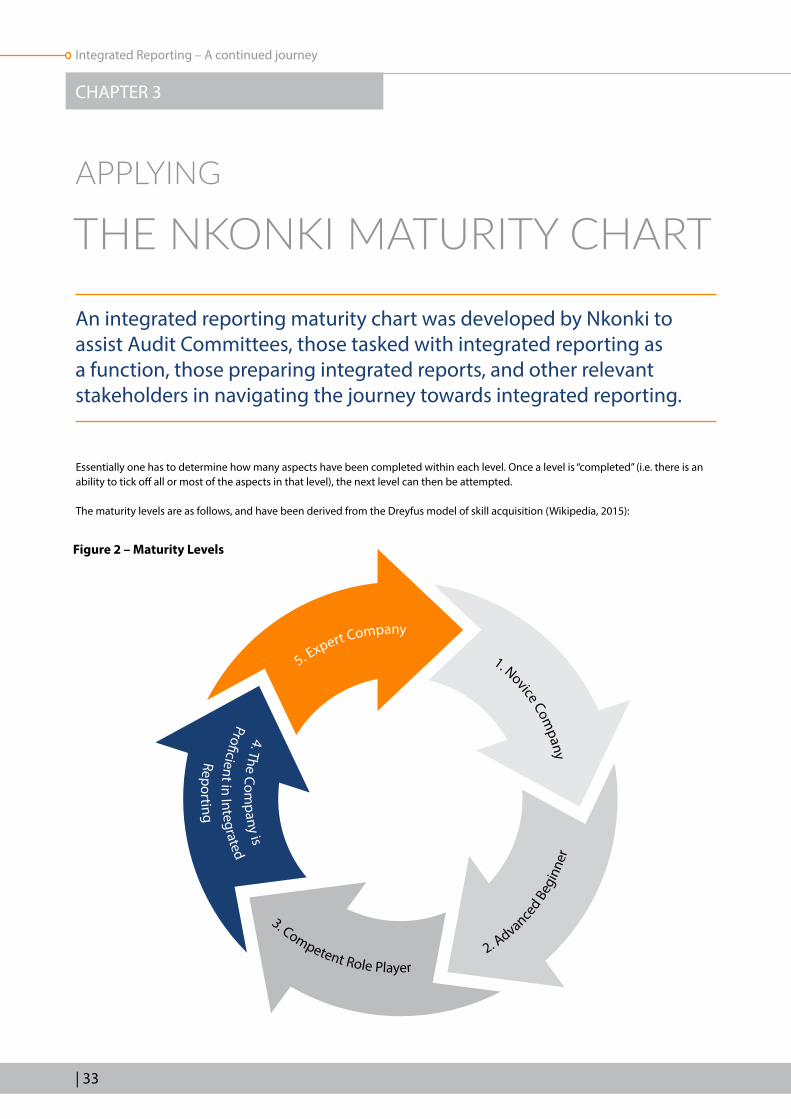
An integrated reporting maturity chart was developed by Nkonki to assist Audit Committees, those tasked with integrated reporting as a function, those preparing integrated reports, and other relevant stakeholders in navigating the journey towards integrated reporting.
Essentially one has to determine how many aspects have been completed within each level. Once a level is “completed” (i.e. there is an ability to tick off all or most of the aspects in that level), the next level can then be attempted.
The maturity levels are as follows, and have been derived from the Dreyfus model of skill acquisition (Wikipedia, 2015):
APPLYING
THE NKONKI MATURITY CHART
5. Expert Company
1. Novice Company
2. Advanced B
egin
ner
3. Competent Role Player
4. The Company is
Profi cient in Integrated
Reporting
| 33
Integrated Reporting – A continued journey
CHAPTER 3
Figure 2 – Maturity Levels

34 |

| 35
Integrated Reporting – A continued journey
CHAPTER 3
AFS = Annual Financial Statements | KPI = Key Performance Indicator
Integrated Reporting
MATURITY CHART LEVELS
• There is a legal requirement to produce an integrated report, or a decision to produce an integrated report is made by the Board
• The Board or Audit Committee members (and other relevant committee members) have received basic governance and Integrated Reporting training
• A governance report is already being published
• Gap analysis has been done to determine the Integrated Reporting maturity level
• The Audit Committee has recommended the planning of an integrated report
• There is a strategy, vision and mission• There is a risk management system• There is a system of stakeholder
engagement
• A champion has been appointed• The company has decided on
resources available• It has decided on a strong team and
internal/ external members and writers• Specific training on Integrated
Reporting for internal team members has been conducted
• Gap analysis has been done to determine information to be gathered
• Gap analysis has been done in terms of the expertise available for Integrated Reporting
• Gap analysis has been done in terms of compliance to legislation and other guidelines
• There are terms of reference for the Integrated Reporting team (approved by the Audit Committee and the Board)
• A team has been appointed• There is full buy-in by the Board or
Audit Committee and management• A plan of the process (or project)
management is drafted and approved
• A workshop or brainstorming session has been held by the Board or Audit Committee and management, with the team or champion facilitating; each role player becomes competent in his/her contribution
• Planned actions are derived from goals• Strategy and risks, boundary, stakeholder
relationships, material matters, outlook and KPIs to be part of the integrated report have been determined as part of the workshop
• The assurance required has been decided upon
• The team decides on the information/content to be gathered
• The name of the report is “Integrated Report”
• Consideration is given to management pay and bonuses and related core KPIs
• All information and content are gathered• There is a business model as per the
Integrated Reporting Framework – with capitals and value creation
• The final layout is determined by the team• “Integrated thinking” is in the process of being adopted in the entity
• A gap analysis has been done of draft against best practices and benchmarks
• The Integrated Reporting process can now be executed
• A draft is ready for next phase
Novice Company Advanced Beginner Competent Role Player
1 2 3

36 |
• Resources are available for internal audit resources – at a minimum (internal assurance)
• “Integrated thinking” is embedded in the entity• The integrated report includes the full AFS with audit
report, if not too lengthy; otherwise the abridged AFS with relevant audit report
• A mature business model is included and proper wealth creation descriptions are applied
• The Audit Committee recommends a draft integrated report to the Board
• The Board or Audit Committee has approved the final integrated report
• The final integrated report is produced and published – print and web
• A post-implementation review is performed
• Resources are available for external assurance• An unqualified report on the AFS is desirable• There is a fully implemented Integrated Assurance
Model• The abridged AFS and relevant audit report are
available• An external assurer expresses an opinion on the
integrated report as a whole• “Integrated thinking” is embedded in the entity• A post-implementation review is performed
The Company is Proficient in Integrated Reporting
Integrated Reporting Expert Company
4 5
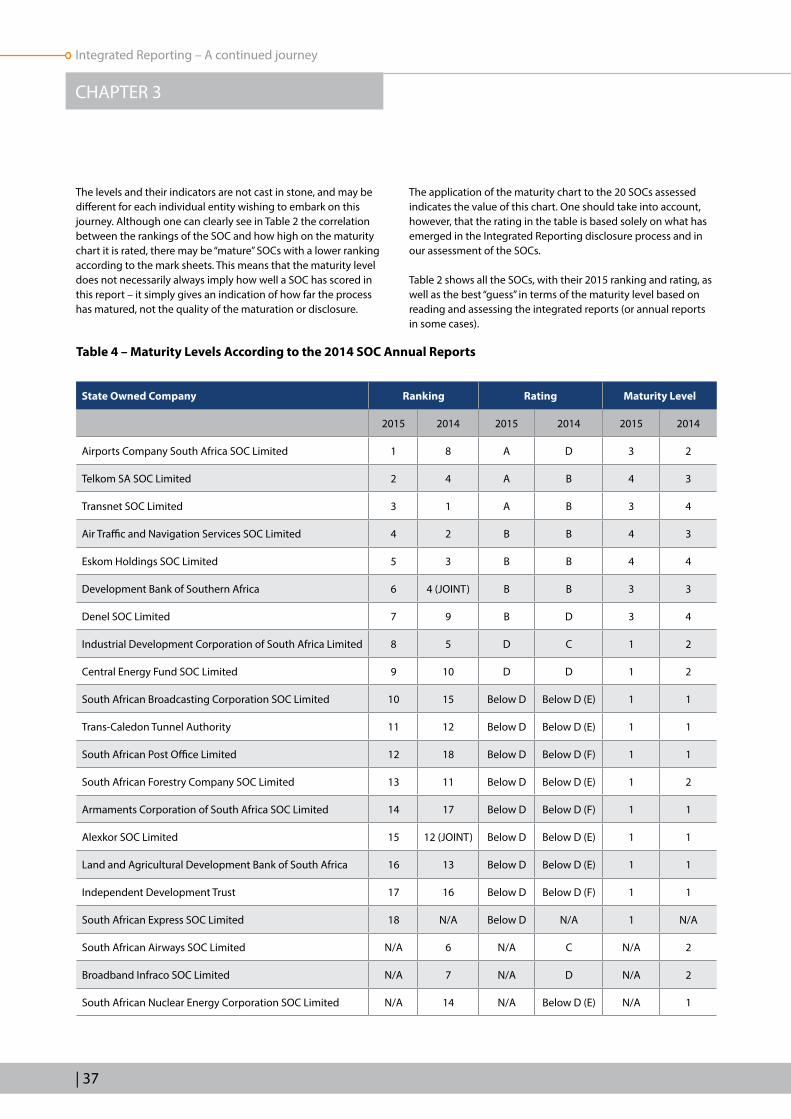
Table 4 – Maturity Levels According to the 2014 SOC Annual Reports
The levels and their indicators are not cast in stone, and may be different for each individual entity wishing to embark on this journey. Although one can clearly see in Table 2 the correlation between the rankings of the SOC and how high on the maturity chart it is rated, there may be “mature” SOCs with a lower ranking according to the mark sheets. This means that the maturity level does not necessarily always imply how well a SOC has scored in this report – it simply gives an indication of how far the process has matured, not the quality of the maturation or disclosure.
The application of the maturity chart to the 20 SOCs assessed indicates the value of this chart. One should take into account, however, that the rating in the table is based solely on what has emerged in the Integrated Reporting disclosure process and in our assessment of the SOCs.
Table 2 shows all the SOCs, with their 2015 ranking and rating, as well as the best “guess” in terms of the maturity level based on reading and assessing the integrated reports (or annual reports in some cases).
| 37
Integrated Reporting – A continued journey
CHAPTER 3
State Owned Company Ranking Rating Maturity Level
2015 2014 2015 2014 2015 2014
Airports Company South Africa SOC Limited 1 8 A D 3 2
Telkom SA SOC Limited 2 4 A B 4 3
Transnet SOC Limited 3 1 A B 3 4
Air Traffic and Navigation Services SOC Limited 4 2 B B 4 3
Eskom Holdings SOC Limited 5 3 B B 4 4
Development Bank of Southern Africa 6 4 (JOINT) B B 3 3
Denel SOC Limited 7 9 B D 3 4
Industrial Development Corporation of South Africa Limited 8 5 D C 1 2
Central Energy Fund SOC Limited 9 10 D D 1 2
South African Broadcasting Corporation SOC Limited 10 15 Below D Below D (E) 1 1
Trans-Caledon Tunnel Authority 11 12 Below D Below D (E) 1 1
South African Post Office Limited 12 18 Below D Below D (F) 1 1
South African Forestry Company SOC Limited 13 11 Below D Below D (E) 1 2
Armaments Corporation of South Africa SOC Limited 14 17 Below D Below D (F) 1 1
Alexkor SOC Limited 15 12 (JOINT) Below D Below D (E) 1 1
Land and Agricultural Development Bank of South Africa 16 13 Below D Below D (E) 1 1
Independent Development Trust 17 16 Below D Below D (F) 1 1
South African Express SOC Limited 18 N/A Below D N/A 1 N/A
South African Airways SOC Limited N/A 6 N/A C N/A 2
Broadband Infraco SOC Limited N/A 7 N/A D N/A 2
South African Nuclear Energy Corporation SOC Limited N/A 14 N/A Below D (E) N/A 1

“The maturity level does not always imply how well a SOC
scored — it simply indicates how far the process has matured.“
38 |

| 39
Integrated Reporting – A continued journey
The roadmap towards integrated reporting comprises the ability to embrace the true spirit of integrated reporting (as contained in the Integrated Reporting Framework).
CHAPTER 4
A PRACTICAL GUIDE ‒
THE ROADMAP TO EXCELLENT INTEGRATED REPORTING
The Roadmap to Excellence
Make the decision to integrate reporting and provide training
19
28
37
65
4
Plan the process
External or internal writer/compiler
Workshop/brainstorming session
Design the business model
Assurance required
Layout of the integrated report
Gathering the information
Draft ready for printing
Figure 3 – Roadmap to Excellence

40 |
1. Make the decision to integrate and provide training
The Board or Audit Committee as a unit should make the decision on when and how a business entity will be implementing integrated reporting. This might be voluntary or it might be compulsory (for example, in the case of listed companies in South Africa, the integrated report is a listing requirement). This should be followed by careful planning to have the first integrated report ready by a particular date.
The Board, Audit Committee members, and executive management may have to undergo relevant training on governance and integrated reporting before making an important decision like this. A vital tool in assisting a Board in deciding whether the business should start the integrated reporting process is the Nkonki Maturity Chart (see Chapter 4).
2. Plan the process
It could take more than a year to prepare for an integrated report, as the planning process must keep in mind the dates set for Board meetings and for Audit Committee meetings (where approvals need to be done). Bear in mind that some information that will form part of the integrated report will have to be gathered and recorded as the year progresses.
It is very difficult in the middle of a financial year to decide that certain performance indicators should be compiled and even audited, for example, when the subject matter (the underlying data) has never been recorded or validated up to that point. The integrated report should cover the same financial year as the AFS.
4.1 EMBRACING THE TRUE SPIRIT OF INTEGRATED REPORTING
According to the IIRC, “Integrated Reporting is an approach to corporate reporting that demonstrates the linkages between an organisation’s strategy, governance and financial performance and the social, environmental and economic context within which it operates” (2013a).
The sustainability reporting process defined by the GRI Sustainability Reporting Framework can help companies wanting to produce integrated reports, in three main ways:
• Identifying material issues – topics that express the core link between business goals and sustainability impacts
• Stakeholder engagement – dialogue to help determine material impacts and manage risks and opportunities
• Performance indicators – measuring, managing and reporting material issues using an internationally-accepted framework
In integrated reporting, there are a number of concepts that not all Audit Committee members, directors, managers or even fund managers are familiar with as yet. These concepts are not easily implemented in a business entity as they are fairly radical. This is the first mind-shift that Audit Committee members, directors and managers should make. The business world is changing dramatically and integrated reporting is certainly playing a big role in this change. Things will never be the same again. It will take personal time and effort from each individual to come to terms with this change.
The biggest questions remain: How do we tackle integrated reporting, and how do we get it embedded in the fibre of our business? The main objective for now would be to become familiar with the IIRC document, “International Integrated Reporting Framework” and to think about how to apply that in the business entity. This chapter provides a suggested roadmap of how to move towards proper integrated thinking, followed by proper integrated reporting.
The Roadmap to Excellence
Make the decision to integrate reporting and provide training
19
28
37
65
4
Plan the process
External or internal writer/compiler
Workshop/brainstorming session
Design the business model
Assurance required
Layout of the integrated report
Gathering the information
Draft ready for printing

| 41
Integrated Reporting – A continued journey
CHAPTER 4
Make sure a champion is appointed to drive this process from beginning to end. It could be an internal person like the Chief Financial Officer (CFO) or the Chief Executive Officer (CEO), the company secretary, public relations (PR) or stakeholder engagement department, the compliance department, or the legal department. It could also be an external person from an advisory service such as an auditing consulting firm, a PR firm, or a graphic design firm, advertising agency or an investor relation consultancy.
The plan should be drafted in coordination with the CFO and other internal role players. The role of the CFO is very important as he/she is responsible for the AFS or the abridged AFS and traditionally he/she was responsible for publishing the annual report (where other teams only became involved by publishing a sustainability report later on– first separately and later included in the annual report). The Board, Audit Committee and executive management should be part and parcel of the process and should first buy into the process to adhere to all requests from the appointed champion.
The champion should present the detailed plan to the Board (often first to the Audit Committee) for authorisation. This should include each step to be taken in order to have an integrated report ready at the end of a particular financial year-end. For companies and corporations with a low maturity in integrated reporting, the Board may decide to phase it in or stagger the implementation over two or three years (especially if a voluntary application to the Integrated Reporting Framework is sought).
Planning should incorporate the following steps:
• Decide in principle to do integrated reporting• Appoint a champion• Training – general background training for all Board members,
committee directors and senior executives
• Training – specific training on integrated reporting for other internal team members
• Use the maturity chart to determine how ready the company is – do a gap analysis
• Decide on the external or internal writer/compiler and teams to use
• Appoint the teams• Facilitate a workshop/brainstorming session by the Board and
senior executives (may have an external facilitator) to determine the following:
- Strategy and risk- Report boundary- Stakeholder relationships- Material matters- Business model (concept or draft)- Outlook- KPIs - Information/content required – full list to be compiled- Determine the assurance required- Decide on the resources to be allocated for Integrated Reporting
• Design the business model as a result of the workshop/brainstorming session
• Determine the assurance required and reliability of the information
• Decide on the layout of the integrated report• Gather the information/content• Get the draft ready for printing• Secure the approval/recommendations by the chairman, CEO,
Audit Committee, Social and Ethics Committee and finally the Board of Directors
• Print, publish and distribute the integrated report (including website)
These steps should be built into a matrix where timelines and responsibilities can be allocated for each step. The champion

42 |
should control this worksheet and report to the Audit Committee and Board as to the progress whenever these meetings take place. The whole process should be run as a project, using the best principles and practice of project management.
Some steps are explored in more detail below.
3. External or internal writer/compiler
Decide on an external engagement if the integrated report is to be written and compiled outside of the company. If not, ensure the best possible internal resources are available for this task.
Decide on the resources (funds and manpower) to be allocated to the project. The writing and publishing of an integrated report may be very costly. One should note, however, that there is nothing stopping a company from starting with integrated thinking!
At this stage, it should be possible for the Board to appoint a team of people to do the Integrated Reporting – including internal and external people, if necessary.
4. Workshop/brainstorming session
Strategy, risk, stakeholder relationships, input and output, values, mission, etc., should be brainstormed by the Board, the Audit Committee (if necessary) and executive management. While many organisations have done this in the past, it is necessary to do this again in the light of designing a new business model that will reflect true integrated thinking and reporting.
Ensure that a process of “Integrated Thinking” is followed, not only for the workshop or brainstorming session, but for all future Board decisions and actions. All considerations and decisions should take into account the business as a whole, as well as all the internal and external stakeholders involved.
For a workshop or brainstorming session to have maximum value, the existing business model should be fully understood by the Board, the Audit Committee and executive management. It’s also imperative they understand the importance of this process, and that they need to be part of developing the new business model. The recommended practice would be that the champion would engage an external facilitator to run the workshop or session – it provides credibility and buy-in.
The following elements must be dealt with comprehensively. This can be done in an innovative and creative way, as long as the process takes into account all aspects of the Integrated Reporting Framework:
1. Determine the strategy, taking into account the type of business, its stakeholders, risks, opportunities, controls and other aspects. Consider the full range of issues that influence the sustainability of the business and the social, economic and physical environments in which it operates and which, in turn, have a direct impact on its future viability.
2. Revisit risk management and the risk register and prioritise the risks.
3. Set the report boundary.
4. Define stakeholder relationships and how they link with risks and opportunities.
5. Material issues:
a) A matter is considered material when it will affect Board, Audit Committee and executive management meeting agendas, for example, strategy, governance, performance, prospects, or the business’s important capitals as defined in the Integrated Reporting Framework.
The Roadmap to Excellence
Make the decision to integrate reporting and provide training
19
28
37
65
4
Plan the process
External or internal writer/compiler
Workshop/brainstorming session
Design the business model
Assurance required
Layout of the integrated report
Gathering the information
Draft ready for printing

| 43
Integrated Reporting – A continued journey
CHAPTER 4
b) The process involves the identification and evaluation of relevant matters based on their ability to affect value creation. These must then be prioritised based on their relative importance and a decision must be made on which issues will be disclosed and how. It should include both positive and negative issues.
6. Business model (concept or draft):
a) It is a massive challenge to design an organisation’s unique business model in concept or draft format. It should be a logical process, following the guidelines in the Integrated Reporting Framework. To do this properly, the team should understand the issues at hand as well as reading up on the subject. It should also make use of sources such as those provided in the bibliography of this report.
7. Outlook:
a) Future outlook is usually covered in either the chairman’s report or the CEO’s report, or in both. Some companies also require the operational divisions/departments/sections to report separately on future outlook.
8. KPIs:
a) For companies not yet following an accepted framework for reporting, such as the GRI G4 guidelines, this might be new ground. Such a company now has to decide which KPIs it must use in order to help measure performance in the future. These KPIs should be both financial and non-financial (financial could, for example, be the gross profit margin of the company, while non-financial could be the CO2 emissions or the carbon footprint).
9. Consideration should also be given to executive and management remuneration, bonuses and the performance indicators related thereto.
10. Information/content required – a full list needs to be compiled. This should enable the Integrated Reporting team to do an information gap analysis.
11. Assurance required:
a) When deciding on sustainability assurance, one should first consider if the information has been subjected to controls and would be auditable. If so, the cost/benefit ratio should be considered.
b) The next move will be towards a single integrated report, covering both the AFS and some of the sustainability or non-financial information. Standards still have to be developed in this regard.
12. Resources to be allocated for integrated reporting:
a) Although costs have been mentioned a few times, now would be the time to really determine if the company is mature enough for an integrated report, and, if so, what will be available to spend on the drafting, design, printing and publishing of the report. For listed companies, it is usually compulsory to have a printed annual report, so only the additional costs need be considered.
b) As mentioned, the workshop might not be the ideal place to make a final decision about costs. The integrated reporting team should investigate, and obtain quotes where required, and make recommendations to the relevant committee or to the Board.

44 |
A company would be fortunate to have some activists amongst its shareholders, as they usually ask critical questions during the annual general meetings – questions which the Board should consider in the workshop/brainstorming session to see if these have any relevance to the process.
Remember that a company can have the best possible reports, the best possible application of governance and sustainability recommendations, and still fail to produce the correct image of itself in its integrated report. This happens when the truth is not told. If the Board, for example, thinks they are above governance rules and controls, then “sugar coating” in the integrated report would be considered dishonest and could signal impending danger for the sustainability of the entity. This scenario was evident in many of the business failures of the past 15 years, e.g. Enron.
5. Design the business model
The Board, Audit Committee and executive management should design the business model according to the results of the workshop. Make sure a logical business model is captured in a type of flow diagram, as suggested by the Integrated Reporting Framework. Note that the Integrated Reporting Framework is a high-level document. When actually designing a business model or a graphic representation thereof, the various aspects and components should be analysed in depth.
At this stage, the end result of the integrated reporting process should be a business model, the strategy, the risks and opportunities, an integrated management approach, performance indicators and future outlook.
6. Assurance required
Most typically the AFS are assured by external auditors. The issue
here would be if and how some of the non-financial information will be assured, e.g. by way of sustainability assurance. The level of assurance is also important, e.g. reasonable assurance versus limited assurance. The scope will be important, i.e. which non-financial performance figures or indicators will be externally assured.
Currently almost all businesses seem to regard external assurance only in terms of the sustainability information and the KPIs. In an integrated report, however, the financial and non-financial information should be integrated and as such a common or single integrated audit report should be issued. This is still in its infancy, but standards and processes will have to be developed in this regard. As the integrated report is the primary report of a business entity, it should be independently assured.
According to the IIRC, assurance is the key mechanism to ensure that integrated reports and the Integrated Reporting process are deemed to be credible and trustworthy. If not, the aims of integrated reporting are not likely to be achieved.
Reliable and trustworthy integrated reports are, however, also given credibility by sound leadership, robust internal systems (controls), Internal Audit involvement and stakeholder involvement.
7. Layout of the integrated report
Together with the step involving materiality, it would be appropriate to decide on the layout of the integrated report, including considering which chapters or sections will be available on the company website in more detail. These may include, for example:
• Introduction and reports of the chairman and CEO (and CFO)• Corporate governance (including the Board and governance
The Roadmap to Excellence
Make the decision to integrate reporting and provide training
19
28
37
65
4
Plan the process
External or internal writer/compiler
Workshop/brainstorming session
Design the business model
Assurance required
Layout of the integrated report
Gathering the information
Draft ready for printing

Integrated Reporting – A continued journey
CHAPTER 4
| 45
structures)• Sustainability• The financial information (the AFS or summaries thereof )
The layout could even be structured around the business model, or even according to the six capitals (the inputs in the business model).
Whatever the decision is in this regard, all the elements of an integrated report as per the Integrated Reporting Framework should be included. There should be no separation between financial and non-financial performance (except for the audited AFS, which have to follow the accounting standards and are usually published as a separate series of pages/section). All functions and divisions of the business entity should share the same strategy.
8. Gathering the information
The next step should be to gather all the information as decided upon in point 10 of step 4 (the brainstorming session). This is a step-by-step collection of information by the champion and his/her team, with the relevant ticking off of items from the list. The AFS should be obtained in final format from the CFO or relevant person, the sustainability information from the relevant department(s), and so too the governance information, as well as the results (refined and approved) of the workshop or
brainstorming session, especially material issues, the business model and capitals, strategy, risk, stakeholder engagement, etc.It is not simply a matter of gathering and putting this information together – it’s crucial to make sure that the same language and tone is used throughout, and that the story is being told in sequence and with logical flow. The chairman’s report, the CEO’s report and the CFO’s report should also now be considered and their reports should form an integral part of the story.
9. Draft ready for printing
The draft must now be distributed and read by all the contributors: the CEO, the CFO, the chairman, the sustainability department, the company secretariat and governance department, the operational and/or divisional managers and all other relevant contributors. Once each person has signed it off, it can be called a final draft that must go to the Audit Committee members for recommendation to the Board for final approval. An organisation can also involve the finance committee and the Social and Ethics Committee if appropriate.
The final draft will now be designed with graphics and proper layout and made ready for printing and for publishing on the website. This should all be done taking into account the final deadline for distribution of the integrated report to all the shareholders, in time for the annual general meeting.
The Roadmap to Excellence
Make the decision to integrate reporting and provide training
19
28
37
65
4
Plan the process
External or internal writer/compiler
Workshop/brainstorming session
Design the business model
Assurance required
Layout of the integrated report
Gathering the information
Draft ready for printing

46 |
“Buy-in by the Board and Audit Committee, as well as of executive management,
is critical to ensure a proper Integrated Reporting process.”
Integrated Reporting – A continued journey
| 47
CHAPTER 5
“It is important for an award like the Nkonki Integrated Reporting Award for SOCs to have a robust and reliable process of evaluating and assessing the integrated reports.”
Integrated reporting is the approach to corporate reporting that demonstrates the integration of an organisation’s strategy, governance and financial performance and the social, environmental and economic context within which it operates. By reinforcing these connections, integrated reporting can help a business to take more sustainable decisions and enable investors and other stakeholders to understand how an organisation is truly performing.
The IIRC was formed in July 2010 and is chaired by Professor Mervyn King. The mission of the IIRC was to create a globally-accepted Integrated Reporting Framework, which brings together financial, environmental, social and governance information in a clear, concise, consistent and comparable format. The aim is to help with the development of more comprehensive and comprehensible information about organisations, prospective as well as retrospective, to meet the needs of a more sustainable global economy.
An important aspect of good corporate governance is to follow best practice and this report aims to support the continued effort and improvement of integrated reporting by SOCs. It also seeks to gain insights in order to provide guidance to others. Furthermore, it acknowledges those SOCs that do apply the true spirit of the Integrated Reporting Framework in corporate governance, financial disclosure, sustainability and Integrated Reporting categories.
It is now the second year in which the Integrated Reporting Framework could be applied since it was issued at the end of 2013. The SOCs that have not yet acted, should start immediately or will simply be left behind, which would be an enormous set-back in the progress shown to date, and no doubt will have serious consequences in terms of disclosure to shareholders and other stakeholders.
The weighting of the elements of the International Integrated Reporting Framework is provided in Chapter 1.
5.1 THE PROCESS
The annual or integrated reports of the 18 SOCs listed in Annexure A were used in the survey, with the most recent reports obtained from their websites. The panel of experts prepared a grading sheet with weighting assigned to the respective guidelines of the Integrated Reporting Framework.
The SOCs which were rated in the top group the previous year, were then evaluated independently by two of the experts (the lower group were evaluated by one expert only), while the third expert acted as independent adjudicators, who also graded a representative sample of the annual reports, including those of the best-rated SOCs.
It must be stated that none of the SOCs surveyed entered a competition or submitted data to the panel and none had any knowledge of this evaluation process. In the spirit of true transparency, the idea is to evaluate/survey/judge the information available to any citizen in the world (either via Internet access or via access to printed annual reports from registrars). Therefore, in the data collection process, the panel used all annual reports, integrated reports and sustainability reports openly available on the Internet.
The detailed grade sheets are not reproduced here, but they contain the full recommendations regarding integrated disclosure from the Integrated Reporting Framework.
Where integrated reporting by itself had a scoring of 47% of the total score in 2013, it made up just 35% in the years before that. Since last year, it is now a full 100% and we believe that this change in scoring and awarding good disclosure came at the perfect time.
Two experts awarded a score out 200 for each SOC and converted the scores into percentages for ease of comparison.
The adjudicator also awarded scores for a selection of the SOCs, as well as for the top scorers and potential winners. The scores
PURPOSE AND RESEARCH METHODOLOGY

48 |
were then further analysed and re-marked where necessary. Finally, the results were used to determine the ratings for the SOCs. It is unfortunate to report that, despite all efforts to obtain the annual reports of South African Airways, Broadband Infrastructure Company and the South African Nuclear Energy Corporation, they could not be found in time to be assessed. Broadband Infraco was taken over by Telkom in the past year.
5.2 THE PANEL
1. Prof Anton du Toit, CA(SA), BA, B Compt, Hons B Compt, CTA, M Com, M.Inst.D., RA, is a corporate governance expert and director of companies. He was the Director of Accountancy Studies at MSA (Monash South Africa), accredited with SAICA as a service provider for CTA, from 2006 to 2014. He is a visiting professor at the University of Zululand. He held the position of Professor in Accounting at both the University of Johannesburg and North-West University for a total of 19 years, during which time he served on the senates of both universities. He is an accomplished computer auditor with research interests in business ethics, corporate governance and sustainability. He presented various seminars and conferences, both internationally and locally, on auditing concepts. He has refereed numerous articles in accredited journals. Anton is a founding presenter of the highly regarded Postgraduate Diploma in Management specialising in Corporate Governance at MSA.
He is on early retirement due to health reasons, but still consults privately and lectures part-time lectures at MSA. He also serves on the audit committees of ICASA, Spectramed Medical Aid, The Tswane University of Technology (TUT), Tlokwe City Council, Capricorn District Municipality and Aganang Municipality. Anton is a council member of the Vaal University of Technology (VUT) and chairman of the Audit and Risk Committee. He is a non-executive director of NG Welfare (NG Welsyn) and chairman of the audit committee. He serves on the boards of three companies. He serves on various committees and interest groups in the profession. He is a past alternate board member of the Independent Regulatory Board of Auditors; past President of the Southern African Accounting Association; past Vice-President of the International Association for Accounting Education and Research; and past editor of Meditari, an accredited professional journal of accountancy. He was part of the working groups of the IoD (Institute of Directors) for the King IV report (draft) in 2016.
Anton has been involved in audit and advisory services for many clients and in association with a variety of big audit firms. The biggest current clients include Workforce, Basil Read, Atlas Finance, IOM, SEW, International SOS and Rand Mutual Assurance. Previous clients included Afrox, Honda SA, BP, the JSE, Sappi, Mondi, South-West Coop, AGN of ABSA and Sanlam.
2. Adrian Pilley – BCompt, BCompt (Honours) MCom, CA(SA) RA. Adrian has been lecturing taxation for eight years at MSA at third-year level and financial accounting for the last four years. Prior to lecturing, he enjoyed a successful career in commerce and industry for over 15 years. His research interests are in the field of integrated reporting.
3. Rufaro Gweshe – LLB, LLM (UCT). Rufaro has been a part of academia since 2008. She has been lecturing business law for the past five years and has lectured students ranging from first to final year at MSA since 2013. Her research interests lie generally within the field of company law, and specifically in business rescue. Rufaro’s two publications and two conference papers lie within the fields of public and commercial law. She is also the former editorial assistant for the South African Journal of Criminal Justice.
“The independent research panel has years of combined expertise in the fields of integrated reporting, corporate governance, accounting and auditing, and are considered experts in their fields.”

Integrated Reporting – A continued journey
| 49
Annexure A: Schedule 2 State Owned Companies Analysed
ANNEXURES
Air Traffic and Navigation Services
SOC Limited
Airports Company South Africa SOC
LimitedAlexkor SOC Limited
Armaments Corporation of South
Africa SOC LimitedBroadband Infraco SOC Central Energy Fund
SOC Limited
Denel SOC Limited Development Bank of Southern Africa
Eskom Holdings SOC Limited
Independent Development Trust
Industrial Development
Corporation of South Africa Limited
Land and Agricultural Development Bank of
South Africa
South African Airways SOC Limited
South African Broadcasting
Corporation SOC Limited
South African Express SOC Limited
South African Forestry Company SOC Limited
South African Nuclear Energy Corporation
Limited
South African Post Office SOC Limited Telkom SA SOC Limited Trans-Caledon Tunnel
Authority
Transnet SOC Limited

50 |
Annexure B: Glossary of Terms
AFS: Annual Financial Statements
CEO: Chief Executive Officer
CFO: Chief Financial Officer
ESG: Environment, Social and Governance
GDP: Gross Domestic Product. The monetary value of all the finished goods and services produced within a country’s borders in a specific time period, though GDP is usually calculated on an annual basis.
GRI:
The Global Reporting Initiative is a network-based organisation that pioneered the world’s most widely used sustainability reporting framework. GRI is committed to the Framework’s continuous improvement and application worldwide. GRI’s core goals include the mainstreaming of disclosure on environmental, social and governance performance (https://www.globalreporting.org/information/about-gri/Pages/default.aspx, accessed on 15 March 2013).
G4: The GRI G4 Guidelines make provision for compliance at a Core or Comprehensive level. Companies should apply the latest GRI G4 guidelines applicable for reports published after 31 December 2015.
IRC: The Integrated Reporting Committee of South Africa
IIRC:
The International Integrated Reporting Council was formed in July 2010 and is currently chaired by Professor Mervyn King. The mission of the IIRC is to create a globally accepted Integrated Reporting Framework, which brings together financial, environmental, social and governance information in a clear, concise, consistent and comparable format. The aim is to help with the development of more comprehensive and comprehensible information about organisations, prospective as well as retrospective, to meet the needs of a more sustainable, global economy.
Integrated thinking:
Is described in the Integrated Reporting Framework as “the active consideration by an organisation of the relationships between its various operating and functional units and the capitals that the organisation uses or affects” (IIRC, 2013c).
Integrated Reporting:
“Integrated reporting” means a holistic and integrated representation of the company’s performance in terms of both its finance and its sustainability (IoD; 2009b). “Integrated reporting is seen by the IIRC as the basis for a fundamental change in the way in which organisations are managed and report to stakeholders. A stated aim of integrated reporting is to support integrated thinking and decision-making.” (IIRC, 2013).
JSE: Johannesburg Stock Exchange. The JSE Ltd (“JSE”) is licensed as an exchange under the Securities Services Act, 2004 and is Africa’s premier exchange.
King III: The King Report on Governance for South Africa 2009 and the King Code of Governance for South Africa 2009.
KPI: Key Performance Indicator
PFMA: The Public Finance and Management Act that regulates the accountability of public entities (RSA, 1999)
RSA: Republic of South Africa
Sustainability:
Sustainability of a company means conducting operations in a manner that meets existing needs without compromising the ability of future generations to meet their needs. It means having regard to the impact that the business operations have on the economic life of the community in which it operates. Sustainability includes environmental, social and governance issues (IoD; 2009b).
SOC: The general term used in South Africa for State Owned Companies

Integrated Reporting – A continued journey
ANNEXURES
Annexure C: Bibliography
Adam, M., 2015: Intangibles and Sustainability: Holistic Approaches to Measuring and Managing Value Creation. Journal of Applied Corporate Finance • Volume 27 Number 2, Spring 2015
Black Sun Plc 2014: Realizing the benefits: The impact of Integrated Reporting ©
GRI, 2013: The GRI Sustainability Reporting Guidelines, version 4. Amsterdam, The Netherlands. Global Reporting Initiative (GRI).
IoD, 2009a: The King Report on Governance for South Africa 2009. Parktown, South Africa: The Institute of Directors in Southern Africa.
IoD, 2009b: The King Code of Governance for South Africa 2009. Parktown, South Africa: The Institute of Directors in Southern Africa.
IIRC, 2013: International Integrated Reporting Framework (IIRC) (December 2013). International Integrated Reporting Council.
IIRC, 2014: Assurance on Integrated Reporting - An Introduction to the Discussion. International Integrated Reporting Council. Available at: [Accessed 2 February 2015].
IRC, 2014: Preparing an Integrated Report – A starter’s guide. Integrated Reporting Committee of South Africa. Graymatter & Finch. Johannesburg
King, M. & Roberts, L., 2013: Integrate – Doing Business in the 21st Century. Juta, Cape Town.
RSA, 1999. Public Finance and Management Act, No1 of 1999. Pretoria: Government printer.
Wikipedia, 2015: Dreyfus model of skill acquisition. Available at: http://en.m.wikipedia.org/wiki/Dreyfus_model_of_skill_acquisition [accessed 10 April 2015].
| 51
52 |
“Integrated Reporting is a journey to ensure the entire
sustainability of an entity – in a manner that meets its existing needs without compromising
the ability of future generations to meet their needs.”
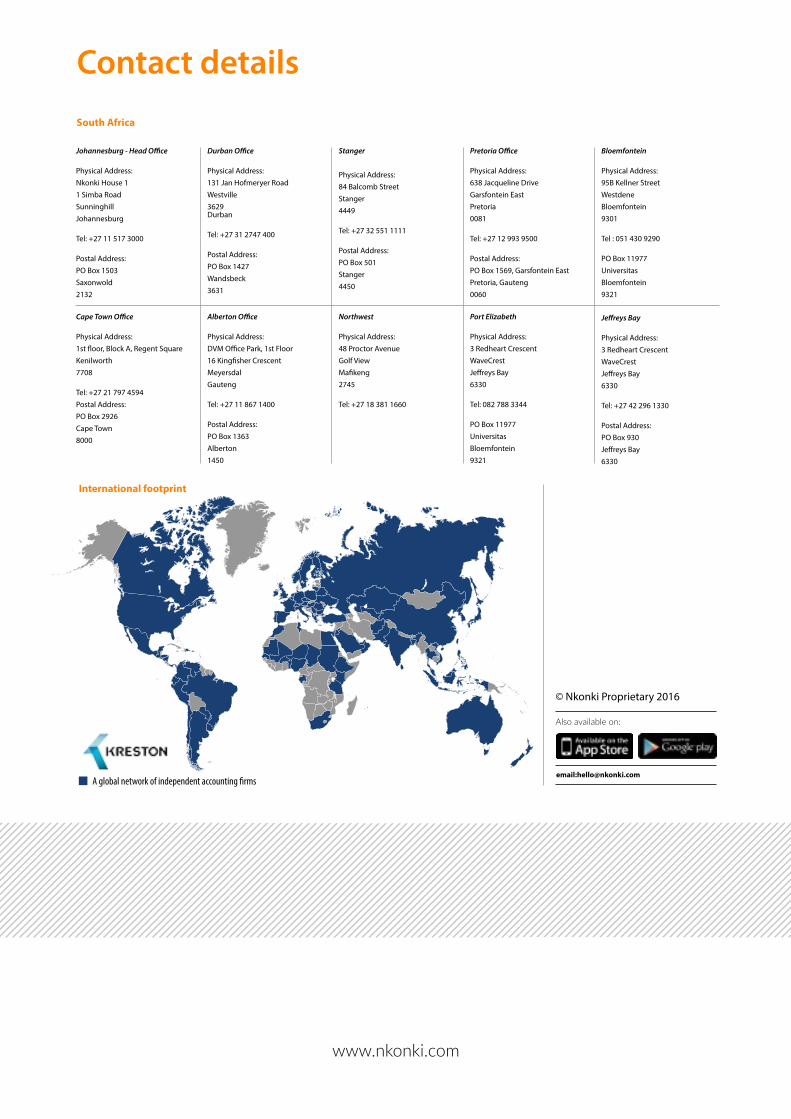
www.nkonki.com
Contact details
© Nkonki Proprietary 2016
International footprint
A global network of independent accounting firms
Johannesburg - Head Office
Physical Address:Nkonki House 11 Simba RoadSunninghillJohannesburg
Tel: +27 11 517 3000
Postal Address:PO Box 1503Saxonwold2132
Durban Office
Physical Address:131 Jan Hofmeryer RoadWestville3629Durban
Tel: +27 31 2747 400
Postal Address:PO Box 1427Wandsbeck3631
Stanger
Physical Address:84 Balcomb StreetStanger4449
Tel: +27 32 551 1111
Postal Address:PO Box 501Stanger4450
Pretoria Office
Physical Address:638 Jacqueline DriveGarsfontein EastPretoria0081
Tel: +27 12 993 9500
Postal Address:PO Box 1569, Garsfontein EastPretoria, Gauteng0060
Bloemfontein
Physical Address:95B Kellner StreetWestdeneBloemfontein9301
Tel : 051 430 9290
PO Box 11977UniversitasBloemfontein 9321
Jeffreys Bay
Physical Address:3 Redheart CrescentWaveCrestJeffreys Bay6330
Tel: +27 42 296 1330
Postal Address:PO Box 930Jeffreys Bay6330
Cape Town Office
Physical Address:1st floor, Block A, Regent SquareKenilworth7708
Tel: +27 21 797 4594Postal Address:PO Box 2926Cape Town8000
Alberton Office
Physical Address:DVM Office Park, 1st Floor16 Kingfisher CrescentMeyersdalGauteng
Tel: +27 11 867 1400
Postal Address:PO Box 1363Alberton1450
Northwest
Physical Address:48 Proctor AvenueGolf ViewMafikeng2745
Tel: +27 18 381 1660
Port Elizabeth
Physical Address:3 Redheart CrescentWaveCrestJeffreys Bay6330
Tel: 082 788 3344
PO Box 11977UniversitasBloemfontein 9321
South Africa
Also available on:
email:[email protected]