nitrogen management practices and colored plastic mulch
TRANSCRIPT
University of Arkansas, FayettevilleScholarWorks@UARK
Theses and Dissertations
8-2014
Nitrogen Management Practices and ColoredPlastic Mulch Films Affecting Spider Mites andAphids on Winter Strawberry in a High TunnelKevin Philip DurdenUniversity of Arkansas, Fayetteville
Follow this and additional works at: http://scholarworks.uark.edu/etd
Part of the Agronomy and Crop Sciences Commons, Entomology Commons, and theHorticulture Commons
This Thesis is brought to you for free and open access by ScholarWorks@UARK. It has been accepted for inclusion in Theses and Dissertations by anauthorized administrator of ScholarWorks@UARK. For more information, please contact [email protected], [email protected].
Recommended CitationDurden, Kevin Philip, "Nitrogen Management Practices and Colored Plastic Mulch Films Affecting Spider Mites and Aphids onWinter Strawberry in a High Tunnel" (2014). Theses and Dissertations. 2267.http://scholarworks.uark.edu/etd/2267

Nitrogen Management Practices and Colored Plastic Mulch Films Affecting Spider Mites and
Aphids on Winter Strawberry in a High Tunnel
Nitrogen Management Practices and Colored Plastic Mulch Films Affecting Spider Mites and
Aphids on Winter Strawberry in a High Tunnel
A thesis submitted in partial fulfillment
of the requirements for the degree of
Masters of Science in Entomology
By
Kevin P. Durden
Southwest Missouri State University
Bachelor of Science in Industrial Management, 1997
Drury University
Bachelor of Science in Biology, 2007
Missouri State University
Masters of Science in Plant Science, 2009
August 2014
University of Arkansas
This thesis is approved for recommendation to the Graduate Council.
____________________________________
Dr. Donn T. Johnson
Thesis Director
___________________________________
Dr. Timothy J. Kring
Committee Member
____________________________________
Dr. M. Elena Garcia
Committee Member

Abstract
Off season high tunnel strawberry production has the potential to augment income for
Arkansas fruit growers during an unproductive time of the year, however management guidelines
do not exist. At the University of Arkansas Agricultural Research and Extension Center in
Fayetteville, AR studies were conducted to evaluate the effects of four nitrogen (46-0-0 urea
fertilizer) fertigation rates (0.75, 0.50, 0.25, 0.0 kg N/day/ha) and red or black colored plastic
mulch films on densities of twospotted spider mite, Tetranychus urticae Koch (Acari:
Tetranychidae), cotton aphid, Aphis gossypii Glover (Hemiptera: Aphididae), numbers of
parasitized cotton aphids, and fruit yield weight. Foliar and petiole nitrogen content were
evaluated in nitrogen fertigation trials. In the nitrogen fertigation experiment twospotted spider
mites, cotton aphids and parasitized cotton aphids were sampled from the younger and older
leaves of strawberry plants. Cowpeas, Vigna unguiculata L. Walp. (Fabales: Fabaceae), were
planted and incorporated into the soil to supplement available nitrogen. Nitrogen fertigation
treatments did not have the expected effect on foliar or petiole nitrogen levels. Preplanting
nitrogen levels due to the cover crop of cowpeas, may have been provided sufficient nitrogen to
the strawberry plants for the duration of the experiment to nullify the effect of the nitrogen
treatments. Therefore, any significant differences in strawberry fruit yield, twospotted spider
mite, cotton aphid, or parasitized aphid numbers would not be attributable to nitrogen fertigation
treatments, and none were found. There were no significant differences among nitrogen
fertilization treatments in the numbers of twospotted spider mites on the younger or older leaves
except for one sample date, 8 January. However there were significantly more cotton aphids and
parasitized cotton aphids in the older leaves compared to the younger leaves. There were no
significant differences in strawberry fruit yield, twospotted spider mite, cotton aphid, or
parasitized cotton aphids in the red or black plastic mulch experiment, although lack of sufficient

replication limited results. Future experiments may compare interaction effects of several high
tunnel plastic film covers with different light transmitting characteristics and different color
mulches on strawberry yields and aphid and mite densities inside high tunnels versus in open
fields.

Acknowledgments
I would like to thank my adviser, Dr. Johnson for his support, encouragement, and
criticism with this project. Thank you to my committee members; Dr. Kring for his advice and
Dr. Garcia for her allowing me to conduct research in conjunction with her high tunnel
strawberry project and guidance. I would also like to thank the North American Strawberry
Growers Association for funding this research project.
Thank you to my parents Philip and Sue Durden and my son, Michael Marah for their
understanding, love and support throughout my graduate school experience.
Brian Cowell and Carolina Proudfoot were instrumental with their help in collecting
samples and generally being good friends. David Dickey is appreciated for taking the time to
teach me the finer points of high tunnel construction and day to day horticultural practices that
made this research possible.
Barbra Lewis is greatly appreciated for her technical help, advice and hospitality.

Table of Contents
1.0 Introduction: Off Season Winter Production of Strawberry ..................................................... 1
1.1 High Tunnels ......................................................................................................................... 1
1.2 Strawberry ............................................................................................................................. 1
1.2.1 Strawberry Physiology ....................................................................................................... 2
1.3 Soil Mulch Film Color .......................................................................................................... 4
1.4 Strawberry Pests in Arkansas ................................................................................................ 5
1.4.1 Twospotted Spider Mite ................................................................................................. 5
1.5 Objective ................................................................................................................................. 10
2.0 Materials and Methods ............................................................................................................ 10
2.1 High Tunnel Construction ................................................................................................... 10
2.1.1 Preplanting Preparations ............................................................................................... 11
2.1.2 Fertigation and Pesticide Application ........................................................................... 11
2.1.3 Pollinators ..................................................................................................................... 12
2.2 Nitrogen Study .................................................................................................................... 12
2.2.1 Experimental Design .................................................................................................... 12
2.2.2 Nitrogen Foliar and Petiole Sampling .......................................................................... 13
2.2.3 Arthropod Sampling ..................................................................................................... 13

2.2.4 Strawberry Sampling .................................................................................................... 14
2.3 Colored Plastic Mulch Study............................................................................................... 14
2.4 Data Analysis ...................................................................................................................... 14
3.0 Results ..................................................................................................................................... 15
3.1 Nitrogen Study .................................................................................................................... 15
3.1.1 Foliar and Petiole Nitrogen ........................................................................................... 15
3.1.2 Strawberry Fruit Yield .................................................................................................. 15
3.1.3 Twospotted Spider Mites .............................................................................................. 16
3.1.4 Cotton Aphids ............................................................................................................... 16
3.1.5 Parasitized Cotton Aphids ............................................................................................ 16
3.2 Colored Plastic Mulch ......................................................................................................... 16
3.2.1 Strawberry Fruit Yield .................................................................................................. 16
3.2.2 Twospotted Spider Mites .............................................................................................. 17
3.2.3 Cotton Aphids ............................................................................................................... 17
.3.2.4 Parasitized Cotton Aphids ........................................................................................... 17
4.0 Discussion ............................................................................................................................... 17
4.1 Nitrogen Study .................................................................................................................... 17
4.2 Colored Plastic Mulch ......................................................................................................... 19
5.0 References ............................................................................................................................... 21
6.0 Tables ...................................................................................................................................... 27

7.0 Appendices .............................................................................................................................. 39
7.1 Appendix A ......................................................................................................................... 39
7.2 Appendix B ......................................................................................................................... 40
7.3 Appendix C ......................................................................................................................... 41
7.4 Appendix D ......................................................................................................................... 42
7.5 Appendix E .......................................................................................................................... 47
7.6 Appendix F .......................................................................................................................... 48
7.7 Appendix G ......................................................................................................................... 50
7.8 Appendix H ......................................................................................................................... 52
7.9 Appendix I ........................................................................................................................... 53
7.10 Appendix J......................................................................................................................... 54

1
1.0 Introduction: Off Season Winter Production of Strawberry
1.1 High Tunnels
Off season strawberry production has the potential to provide growers with income
during a traditionally unproductive period of the year. However, management practices affecting
off season strawberry production in a high tunnel do not exist for northwest Arkansas. High
tunnel cropping systems are not analogous to greenhouses. High tunnels usually lack active,
permanent heating and cooling systems and require only irrigation and fertilizer as active inputs
(Lamont 2009, Giacomelli 2009, Demchak 2009). Pesticide use is greatly reduced in high
tunnels (Giacomelli 2009) because environmental conditions that contribute to their breakdown
are greatly altered. Because high tunnels only passively augment environmental conditions, they
are typically used for season extension, bringing a crop to production a few weeks earlier in the
spring, or allowing production a few weeks later in the fall. In some situations it is possible to
produce crops off season with high tunnels (Lamont 2009). Strawberry (Fragaria × ananassa)
(Duchesne) is the most widely grown high tunnel small fruit crop in the world (Lamont 2009).
Disease management, herbivorous mammals and arthropods, plant nutrition and the prolonged
harvest period are challenges faced when growing strawberry off season in Arkansas (Garcia et
al. 2013).
1.2 Strawberry
Arkansas growers harvested 85 ha of strawberries in 1999, the most recent records for
Arkansas (USDA NASS 2009). Those acres produced 5,830 kg per ha. Principle strawberry
production areas in the United States are California and Florida. In 2012 strawberry growers in
Florida received $2.42 per kg for fresh strawberries and $1.94 per kg in California. Strawberries
produced in December 2008 were worth $4.59 per kg, whereas July produced strawberries were
2
worth $1.45 per kg (USDA NASS 2009). Washington, Oregon, New York and North Carolina
also have in excess of 40ha of strawberries in production.
A study in Florida determined that growing strawberries in greenhouses had the potential
to provide 150% more profit compared to conventional outdoor grown strawberries and that
strawberries grown organically in greenhouses were likely to be 950% more profitable (Cantliffe
et al. 2008). Approximately 140ha of strawberries were grown in Arkansas in 2013, with
Camino Real, St Festival, Chandler, Albion and Camarosa being the dominate cultivars, with
Chandler being the prevalent cultivar (J. Goodson, Personal Interview).
1.2.1 Strawberry Physiology
Wild strawberries are found in temperate areas worldwide. The USDA Germplasm
Resources Information Network states that there are 22 species of Fragariinae. Strawberry
plants have 7 chromosomes, but can be diploid (2n), tetraploid (4n), pentaploid (5n), hexaploid
(6n), octaploid (8n) or decaploid (10n). Because wild strawberries are widely distributed and
easy to harvest, strawberries have only recently been domesticated. The strawberry of
commerce, Fragaria × ananassa (Duschesne), also known as the dessert strawberry, was first
described by Philip Miller in 1759 and named as such in 1766 by Antoine Nicholas Duschesne of
the Royal Garden at Versailles. It is a hybrid of F. chiloensis (Duschesne) × F. virginiana,
(Duschesne) both new world species. A great number of commercial cultivars have been
produced from the dessert strawberry since 1800 (Hancock 1999).
The physiological development of strawberry inflorescences is dependent upon a number
of genetic (cultivar) cues and environmental (temperature, day length, light intensity) factors.
Flowering is classified as either short day, day neutral or long day. Long day plants begin to
produce flowers when day lengths are longer than 12 hours and temperatures are under 30°C
(Hancock 1999). Long day plants only fruit for a short period, typically in June, and are called

3
“June Bearing”. Because of the short production time, long day plants are not suited for
commercial production, but are often found in the home garden. Short day plants will flower
when day lengths are less than 14 hours and temperatures are less than 15°C. If temperatures are
above 15°C then short day plants will only flower between 8-12 hours of day length. Day
neutral plants are not affected by photoperiod. Crowns and flowers develop approximately 3
months after planting. Day time temperatures above 30°C tend to inhibit bud initiation (Hancock
1999).
1.2.2 Strawberry Nutrition
Strawberries require proper nutrition for fruit growth, firmness, total soluble solids and
production of volatiles (Hancock 1999) and recommended foliar nutrition levels have been
established (Table 1). The proper soil pH range for strawberry is 5.5-6.5 (Domoto 2008).
Excessive nitrogen can lead to soft fruit, delayed ripening, reduced yields, increased
susceptibility to powdery mildew and an increase in mite load (Hancock 1999). Reduced boron
can lead to decreased pollen production, delayed or reduced germination, reduced fruit size, and
reduced root development. Reduced zinc leads to small leaves and low fruit yield. Suboptimal
levels of iron cause reduced plant vigor and chlorotic leaves (Hancock 1999). Proper levels of
calcium are necessary for proper berry firmness. Increased nitrogen levels do not have a positive
effect on the overall taste of the strawberry (Ojeda-Real et al. 2009). Miner et al. (1997)
recommend an optimum rate of 120 kg N/ha/season based upon a field grown plasticulture
system with drip irrigation in loamy sand or sandy loam soils. It is recommended to apply half
of the nitrogen in the fall with the remainder applied in the spring via fertigation.

4
1.3 Soil Mulch Film Color
Colored mulch films modify the microenvironment of the plants grown in them compared
to bare ground. Changes include root-zone temperature and the quantity and quality of light
reflected onto the crop (Decoteau et al. 1989). Kasperbauer (2000) noted that red mulch
treatments increased reflection of red and far-red light causing an increase in yield and size of
strawberries compared to those raised on black mulch or soil alone. Loughrin and Kasperbauer
(2002) reported significant increases in total sugars (18.2%), terpenoids and other volatiles
associated with aroma in strawberries grown over red mulch film. However, organic acids did
not increase (Kasperbauer et al., 2001). Exposure to far red (710-850 nm) and red (630-740 nm)
light for five minutes at the end of the photoperiod lead to thinner leaves, longer stems, larger
chloroplast, more grana per chloroplast, and fewer thylakoid layers per granum (Kasperbauer
and Hamilton, 1984).
In a field study of tomato cv. ‘Sunny’ (Lycopersicon esculentum) (Mill.), six mulch
colors were used to study their effect on fruit yield and insect vectors (Csizinszky et al. 1995).
There were high fruit yields from tomatoes grown in blue mulch compared to white mulch in the
fall of 1988. In the spring of 1989 marketable yields of tomatoes grown on red mulch film were
higher than those grown on black mulch in the early season. In the fall of 1989 tomatoes that
were under stress from tomato mottle virus, had higher yields of large fruit on orange mulch
films compared to white mulch films. Marketable yields of tomato fruit were reduced on yellow
mulch in the fall of 1988 and 1989.
Mulch color also affects numbers of insects on plants. Green peach aphid, Myzus
persicae (Sulzer), counts were reduced on tomato cv. ‘Sunny’ grown over aluminum coated
mulch film (Csizinszky et al. 1995). Fewer whiteflies (Hemiptera: Aleyrodidae) were counted
on tomato cv. ‘Sunny’ grown over yellow, aluminum and orange mulches (Csizinszky et al.
5
1995). Tomatoes grown in orange and aluminum mulches early in the fall of 1989 had delayed
symptom development of tomato mottle virus, increased yields and decreased numbers of
whiteflies. Colors of soil mulch films can be selected as much for their effect on the arthropods
present as their effect on modifying the microenvironment for the plant (Csizinszky et al. 1995).
1.4 Strawberry Pests in Arkansas
There are several arthropod pests of field grown strawberries (Johnson et al. 2003).
Among those are the strawberry weevil or clipper, Anthonomus signatus (Say) (Coleoptera:
Curculionidae), twospotted spider mite, Tetranychus urticae Koch (Acari: Tetranychidae)
(TSSM), cyclamen mite, Steneotarsonemus pallidus (Banks) (Acari: Tarsonemidae) a complex
of aphids (Hemiptera: Aphididae), leafhoppers (Hemiptera: Cicadellidae) and Eastern flower
thrips, Frankliniella tritici (Fitch) (Hemiptera: Thripidae). Two of the most common arthropod
pests of Arkansas strawberry are the cotton aphid, Aphis gossypii Glover (Hemiptera: Aphididae)
and the twospotted spider mite. Aphids do not generally become a major pest of field grown
strawberry, but the cotton aphid can become a pest to strawberry grown in a greenhouse (Rondon
et al. 2005). Treatment recommendations for winter strawberry grown in Arkansas high tunnels
have not been established for any arthropod pests.
1.4.1 Twospotted Spider Mite
Twospotted spider mite, a cosmopolitan mite, represents the most pervasive arthropod
pest of small fruits grown in high tunnels (Heidenreich et al. 2012, Gerson and Weintraub 2012).
Spider mite pests in field grown strawberries in British Colombia do not reach high levels until
later in the summer season (July and August), after traditional harvest dates of cv. ‘Totem’
strawberry, a short day strawberry variety (Raworth and Clements 1996). The economic
threshold for TSSM on strawberries grown in open fields in Poland is 1-2 mites per leaflet pre-
bloom, 2-3 mites per leaf after bloom, and 5-6 mites per leaf post-harvest in spring (Labanowska

6
and Bielenin 2000, 2002). Infestations of up to 5 TSSM mites per leaflet have no significant
effect on yield (English-Loeb 2003) and thus the treatment threshold of 10 mites per leaflet
would be more appropriate. English-Loeb (2003) sampled leaflets but reported results as per
leaf. The economic threshold in La Plata, Brazil is 50 TSSM mites per leaf on strawberry (Greco
et al. 2005). High tunnel cropping systems may extend the cropping season or produce a crop
during the winter. However, spider mite densities in the winter may reach damaging levels on
strawberry (Johnson et al. 2013).
When environmental conditions inside high tunnels reach or exceed temperatures of 85°F
and relative humidity levels fall below 50% outbreaks of TSSM should be expected (Hamilton et
al. 2004). Female TSSM complete their life cycle fastest at 35°C (95°F) (Wrensch 1985).
Female TSSM oviposit for 2-3 weeks and lay in excess of 100 eggs inside webbing. As plant
health declines due to mite feeding, TSSM must disperse for survival. Although TSSM do not
balloon, as they do not have trailing strands of silk, they may be carried on a slight breeze (Hoy
2011). Dispersal outdoors is typically wind born or by walking. However, in greenhouses,
walking or human activities are responsible for mite dispersal (Gerson and Weintraub 2012).
Similar dispersal of TSSM among strawberry plants in high tunnels may be by random walking
or human activity and not by wind (Greco et al. 2005), except when end walls are opened for
cooling (Blomgren and Frisch 2007).
Control of spider mites in strawberry has traditionally been with acaricides. There are
several OMRI approved acaricides such as JMS Stylet Oil (JMS Flower Farms, Vero Beach,
FL), SAF-T-SIDE (Lawn and Garden Products Inc., Fresno, CA) and SuffOil-X (BioWorks,
Victor, NY). Several chemicals to control TSSM on strawberry are recommended, apply
Acramite 50WS, Agri-Mek 0.1EC, Athena 0.8EC, Danitol 2.4EC, Kelthane 50WP, Kanemite
15SC, Oberon 2SC, Portal, Fujimite, Savey 50DF, or Zeal (Bordelon 2013). Acramite 50WS

7
provided a significantly lower level of control of TSSM in late season, field grown, strawberry
'Florida Elyana' compared to; MK936/CGA293343 SC + Induce, Abamectin 84 SC + Induce,
Agri-Mek 0.15 EC + Induce or Zoro 0.15 EC + Induce five days after initial applications (Price
2010). Acramite, Agri-Mek, Kanemite, Oberon, and JMS Stylet oil provided comparable
reduction in accumulated mite days compared to untreated control of TSSM on field grown
strawberry cultivar 'Chandler' (Burrack and Chapman 2010). Brigade increased accumulated
mite days compared to untreated control (Burrack and Chapman 2010). However, improper
acaricide use and a mite’s short life cycle have led to resistance in TSSM (Sato et al. 2011,
Gerson and Weintraub 2012, Van Leeuwen et al. 2010).
There are several Phytoseiid mites that are effective biological control predators of plant
feeding Tetranychid mites, longevity, temperature ranges, developmental time, predation rates,
potential secondary food sources and reproductive capacity were considered when selecting
potential predatory mites for release against TSSM or other pest mite species (Greco et al. 1999,
Pratt et al. 1999, Escudero and Ferragut 2005, Gotoh et al. 2003, Rhodes and Liburd 2009,
Stavrinides et al. 2010, Hoy 2011, Shelton 2012).
1.4.2 Aphids
Blackman and Eastop (1984) listed several aphids found on strawberry in North America.
The most common species were: Chaetosiphon minor (Forbes), C. jacobi (Hille Ris Lambers),
C. thomasi Hille Ris Lambers, strawberry aphid, C. fragaefolii (Cockerell), strawberry root
aphid, A. forbesi Weed, cotton aphid, A. gossypii Glover, Macrosiphum rosae (L.), potato aphid,
M. euphorbiae (Thomas). The cotton aphid was found on strawberry plants during the winter of
2012-2013 in Fayetteville, AR (Johnson et al. 2013).
Strawberry plants that have excessive nitrogen levels tend to have high levels of aphids
(Zalom et al. 2010, Jett 2013). Aqueel and Leather (2010) found that the English grain aphid,
8
Stiobion avenae (F.) and the bird cherry-oat aphid, Rhopalosiphum padi (L.) responded to plants
with increased nitrogen levels with increases in adult weight, fecundity and longevity. Results of
manipulating nitrogen levels in apple, Malus domesitca (Borkh) had inconclusive results
(Haltrich et al. 2000, Papp et al. 2001). In Budapest, Hungary, several apple cultivars (Gloster,
Mutsu, Jonagold, Jonathan M41, Idared, Kovelit and Jonathan) were observed to vary in
susceptibility to the apple aphid, A. pomi De Geer, and the rosy leaf curling aphid, Dysaphis
devecta (Walker) depending on the nitrogen fertilization rate (0, 50, 100, 200 kg/ha). Idared and
Jonagold apples given 50 kg/ha of ammonium nitrate had the lowest levels of A. pomi and D.
plantaginea in 1995 and highest levels of A. pomi and D. plantaginea in 1996. Aphis pomi were
always present in higher densities than D. plantaginea. Therefore, nitrogen fertilization rates
were not shown to predict levels of aphid infestation (Haltrich et al. 2000, Papp et al. 2001).
Aphid size, weight, color, fecundity and intrinsic rate of increase may be linked to increased
nitrogen fertilization, however these may also be influenced by temperature (Nevo and Coll
2001). In comparison, the cotton aphid was found to have a reduced intrinsic rate of increase on
chrysanthemum fertilized with a high rate of 240 mg of 15-10-30 fertilizer/liter compared to
lower rates of 80 or 160 mg/liter (Bethke et al. 1998). A 2006 study in France determined that
numbers of the green peach aphid were found to remain static for 4 weeks with low rate of
nitrogen (0.05mM N) (0.700 mg N/l on one year old peach, Prunus persica (L.) grown in a
growth chamber. As nitrogen levels increased [3 mM (42.02 mg N/l), 6 mM (84.04 mg N/l),
10mM (140.07 mg N/l)], numbers of aphids increased with time. However, at high rate of 15
mM (210.11 mg N/l) nitrogen the aphid numbers decreased over time (Suage et al. 2010).
No insecticides are recommended for aphids on field grown strawberry in the midwest, as
aphids are not typically an economic pest of strawberry in field plantings but are in high tunnels
(Johnson et al. 2013, Bordelon et al.2013). Cotton aphid can become an economic pest in

9
greenhouses (Rondon et al. 2005). Admire Pro, Provado 1.6F and Actara are recommended to
control aphids on field grown strawberry (Studebaker 2013). Malathion 57EC is also labeled for
control of aphid on strawberry (Loveland Products, Greely, Colorado). Price and Nagle (2013)
found that Assail 30SG, Movento 2SC+ Non-ionic surfactant (NIS): Induce, Movento 2SC+
NIS, NAI-2302 15%EC+ NIS, and NNI-0101 20% SC+ NIS all controlled cotton aphids
compared to untreated check.
Aphids are attacked by a wide range of natural enemies. There are several taxa of aphid
predators including: Coccinellidae, Syrphidae and Neuroptera larvae, as well as larvae of the
predatory gall midge, Aphidoletes aphidimyza (Rondani) (Diptera: Cecidomyiidae) (Royal
Horticultural Society 2011). Braconid wasps of the subfamily Aphidinae are parasitoids of
aphids. Females oviposit directly into the aphid, the wasp completes its development inside the
aphid and emerges as an adult (Starỷ 1970). The braconid A. matricariae is commonly found on
aphid in greenhouses and it is known to parasitize 40 different aphids (Ramakers 1989) including
A. gossypii (Sanchez et al. 2011) though not in great numbers. Longevity and development time
are dependent upon temperature, food resources (honeydew and water) day length and relative
humidity (Starỷ 1970). Aphidius matricariae were able to complete their life cycle at
temperatures from 10°C to 30°C, with times ranging from 31.4 ± 4.09 d for development from
oviposition to mummy at 10°C and 6.2 ± 1.01 d at 30°C (Zamani et al. 2007) and the average
virgin female contains 93 eggs in her ovaries (Starỷ 1970). A joint study in Belgium, found that
the potato aphid M. euphorbiae could be maintained below economic thresholds on strawberries
grown in a greenhouse with the parasitic wasps, Aphelinus abdominalis (Dalman) (Hymenoptera:
Aphelinidae), Aphidius matricariae (Haliday) (Hymenoptera: Braconidae), and A. ervi Haliday
(Hymenoptera: Braconidae) provided that temperatures were above 15°C (Sterk and Meesters
1997).

10
1.5 Objective
The objectives of this study are (1) to quantify the cumulative effects of four nitrogen
fertigation rates on densities of spider mites, aphids, parasitized aphids; foliar and petiole
nitrogen levels; and strawberry fruit yield and (2) to provide preliminary data describing the
effects of red or black plastic mulch film on spider mites aphids and parasitized aphids and
strawberry fruit yield in strawberry produced in winter in a high tunnel.
2.0 Materials and Methods
2.1 High Tunnel Construction
A Haygrove high tunnel (Haygrove Inc., Mount Joy, PA) (61m x 7.3m wide x 3.7m tall)
was constructed at the University of Arkansas Agricultural Research and Extension Center
(AAREC) in Fayetteville, AR (36° 6'6.40"N, 94°10'4.61"W). The tunnel was covered with
Visqueen Luminance THB AF 5S (bpi.visqueen Horticultural Products, Ardeer, Stevenston,
United Kingdom) supplied with the high tunnel kit. This was a 6 mil polyethylene film that is
UV stabilized, engineered to have high diffusion, and reduces daytime temperatures by blocking
transmission of far-red light. The tunnel contains four rows of plastic covered raised beds (15
cm high x 75 cm wide) with strawberries on silt loam soil spaced 15.5 cm on centers. The east
row of strawberries was a two (2012- 2013) year bio-fumigation study. The north portion of the
west row was an experiment determining the effects on strawberry yield of covering raised beds
with either red or black plastic mulch. The south part of the west row was quantifying
percentage phytophthora (Phytophthora fragariae (Hickman) (Peronosporales: Pythiaceae) in
strawberry transplants dipped in Aleite® as bare roots or plugs before planting. The middle two
rows contained ‘St. Festival’ strawberry plants subjected to four nitrogen fertigation rates.
11
2.1.1 Preplanting Preparations
The high tunnel covers Captina silt loam soil, a moderately well drained silt loam to silty
clay loam soil (USDA, WSS 2013). Soil in the high tunnel was bio-fumigated by planting a
cover crop of white mustard, Sinapis alba L. (Brassicales: Brasicaceae), in the summer of 2011.
Cowpeas, Vigna unguiculata (L.) (Walp). (Fabales: Fabaceae), were planted in May 2012 and
then incorporated into the soil in July 2012. From July to August 2012 the soil was covered with
a clear 4 mill Visqueen polyethylene film (Lowes, Fayetteville, AR) to solarize it, raising
temperatures to sterilize the soil and hastening the breakdown of the cowpea cover crop. Beds
were formed with a 15 x 75 cm vegetable bed shaper. Fertigation lines were installed over the
top of the newly formed beds and covered with black plastic mulch film. After solarization (1
September 2012) the soil was pH 5.5 and the NO3-N was 59 kg /ha. Row middles were covered
with black plastic ground cover to retain heat, block moisture and prevent the establishment of
weeds.
2.1.2 Fertigation and Pesticide Application
Irrigation lines were laid out with a separate line for each nitrogen treatment connected to
a single manifold and valved to allow application of fertilizer to individual treatments. Urea
fertilizer was dissolved in 1000 ml of water and 1 ml of Super Signal Blue (Upstart Products,
Titusville, Florida) marker dye added. The fertilizer solution was injected into all blocks of each
treatment simultaneously with a Dosmatic MicroDos ® 2% Injector (Carrollton, TX). To ensure
complete fertilizer application, a tap was opened at the end of each circuit and the irrigation was
run until the blue marker dye no longer appeared in the irrigation system. Application of
nitrogen fertilizer began on 25 October 2012 and continued weekly until the study was
concluded in late May 2013. Pesticides applications (Table 3) were necessary to prevent the
establishment of fungal pathogens and to reduce mite load when spider mite loads approached
12
1500 cumulated mite days. Applications were made with Stihl SR450 gas powered, airblast back
pack sprayer (Stihl Inc. Virginia Beach, Virginia).
2.1.3 Pollinators
When strawberries began to produce flowers, common eastern bumble bees, Bombus
impatiens (Cresson) (Hymenoptera: Apidae) (Biobest, Wayzata, MN) were introduced into the
high tunnel for pollination. Hives were replaced to augment numbers of bumble bees as needed.
2.2 Nitrogen Study
We compared the estimated numbers of TSSM, cotton aphids and parasitized cotton
aphids per leaflet on cv “St. Festival” strawberry plants grown under four different nitrogen
treatments. Higher levels of nitrogen in the strawberry plants were hypothesized to lead to
greater numbers higher levels of TSSM, aphids, parasitized aphids and strawberry fruit yields.
2.2.1 Experimental Design
On 18 September 2012, cv ‘St. Festival’ strawberries were planted and grown until 28
May 2013 in a high tunnel. The experiment was set up as a randomized complete block, with
five blocks. Each plot had 28 strawberry plants in two rows (30 × 35 cm spacing). Four plants at
either end of the plot were left as a buffer zone between treatment plots. Each N treatment was
applied once a week by direct injection into the irrigation system. Miner et al. (1997) set the
optimum rate of nitrogen for strawberries at 120 kg/N/ha/day with half applied in the fall and the
balance applied thru drip irrigation at the rate of 0.7 kg/N/ha/day. Fertigation treatments, as urea
were 0.75 kg N/day/ha, 0.50 kg N/day/ha, 0.25 kg N/day/ha and 0.0 kg N/day/ha. Actual
application rates were 0.0g per week, 12.39g per week, 24.80g per week and 37.40g per week of
46-0-0 urea fertilizer injected to 140 plants in each trial.

13
2.2.2 Nitrogen Foliar and Petiole Sampling
Foliar and petiole samples from each plot were collected by every two weeks between
November 2012 and February 2013. Samples were collected on late morning or early afternoon
on sunny days, and 8 of the most recent trifoliates were collected for each experimental unit.
Samples placed in appropriately labeled bags and taken to the horticulture field lab. They were
washed twice with deionized water, petioles separated from leaves and both were placed in
appropriately labeled bags (McGinnis et al. 2013). Samples were processed for nitrogen content
at the Soils Testing and Research Laboratory at the University of Arkansas Altheimer lab in
Fayetteville Arkansas.
2.2.3 Arthropod Sampling
A randomly selected fully expanded central leaflet, from the younger portion of the
canopy and a randomly selected fully expanded central leaflet from the older portion of the
canopy were detached from five of the 20 plants in each trial of the nitrogen treatment plots.
Leaf samples were bagged and labeled with the treatment number, block, date, and location in
the canopy. Leaf samples were stored in a refrigerator at 8°C until processed. Mites were
removed from leaves with a mite brushing machine (BioQuip Products, Inc., Rancho
Dominguez, CA) onto 13 cm glass plates coated with dilute dish detergent (Henderson and
McBurnie 1943). Twospotted spider mites, cotton aphids and parasitized cotton aphids
(mummies and aphids containing clearly visible parasitoid larvae) were counted per plate section
under a stereomicroscope. An estimation of arthropods per leaflet was made using the sequential
section sampling protocol developed by Morgan et al. (1955). Counts of mobile twospotted
spider mites, cotton aphids, and parasitized cotton aphids were recorded for each plot
approximately every two weeks from 12 December 2012 to 18 January 2013.

14
2.2.4 Strawberry Sampling
Beginning on 27 November 2012 strawberries were harvested weekly. Harvest was
conducted twice weekly as dictated by fruit load. Fruit weights for each treatment were measured
and recorded for each sample period.
2.3 Colored Plastic Mulch Study
A preliminary colored mulch study was initiated to compare levels of spider mites, aphids
and the percentage of aphids parasitized on strawberries grown on red or black mulch films. On
19 September 2012, cv. ‘Radiance’ strawberries were planted in two treatments with three blocks
alternating 1.0 mill SRM red plastic mulch and 1.0 mill black embossed mulch film (both from
Irrigation Mart, Ruston, LA). Each plot was 4.25m long and contained 22 plants (40 × 35 cm
spacing), four plants from either end of the plot were used as buffer plants and data from them
were not included in the results.
Randomly selected central leaflets were detached from 10 of the 14 plants in each colored
plastic mulch plot. Samples were handled, processed and recorded as above.
2.4 Data Analysis
Estimation of all arthropods per strawberry leaflet were made by following the sequential
sampling protocol established in Morgan et al. (1955). The number of sections necessary to
count is dependent upon the number of arthropods counted per section. In all cases 20 sections
per plate were counted.
Equation for estimating arthropods per leaflet (Morgan et al., 1955):
𝑀𝑙 = (𝑀𝑐 × 50.48) ÷ (# 𝑠𝑒𝑐𝑡𝑖𝑜𝑛𝑠 × # 𝑙𝑒𝑎𝑓𝑙𝑒𝑡𝑠)
Where: Ml = # of mites per leaflet Mc = # of mites counted
# leaflets = # of leaflets brushed # sections = # of sections of disk counted
15
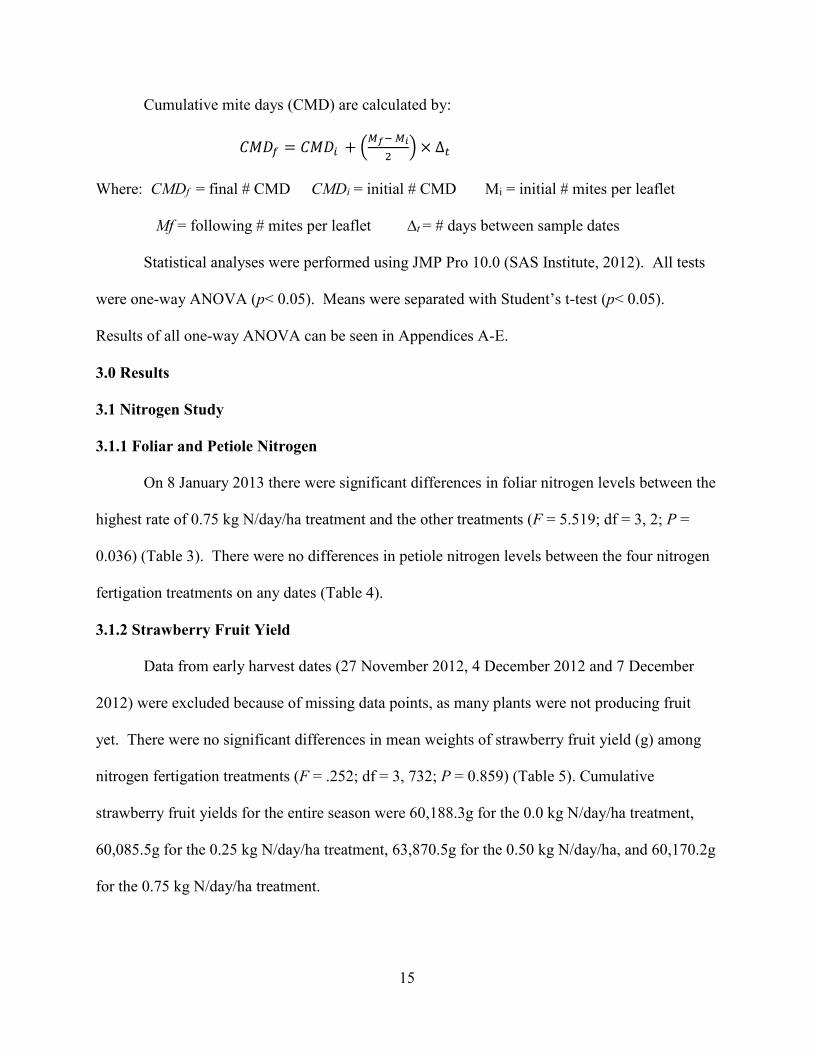
Cumulative mite days (CMD) are calculated by:
𝐶𝑀𝐷𝑓 = 𝐶𝑀𝐷𝑖 + (𝑀𝑓− 𝑀𝑖
2) × ∆𝑡
Where: CMDf = final # CMD CMDi = initial # CMD Mi = initial # mites per leaflet
Mf = following # mites per leaflet ∆t = # days between sample dates
Statistical analyses were performed using JMP Pro 10.0 (SAS Institute, 2012). All tests
were one-way ANOVA (p< 0.05). Means were separated with Student’s t-test (p< 0.05).
Results of all one-way ANOVA can be seen in Appendices A-E.
3.0 Results
3.1 Nitrogen Study
3.1.1 Foliar and Petiole Nitrogen
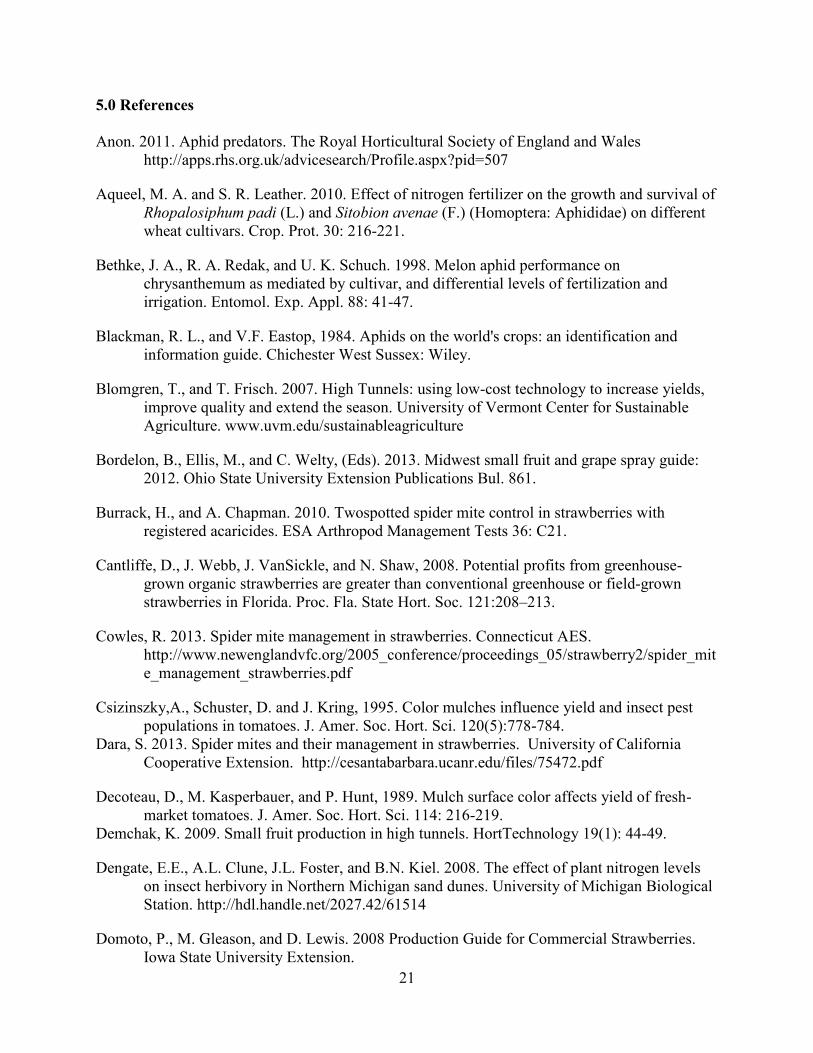
On 8 January 2013 there were significant differences in foliar nitrogen levels between the
highest rate of 0.75 kg N/day/ha treatment and the other treatments (F = 5.519; df = 3, 2; P =
0.036) (Table 3). There were no differences in petiole nitrogen levels between the four nitrogen
fertigation treatments on any dates (Table 4).
3.1.2 Strawberry Fruit Yield
Data from early harvest dates (27 November 2012, 4 December 2012 and 7 December
2012) were excluded because of missing data points, as many plants were not producing fruit
yet. There were no significant differences in mean weights of strawberry fruit yield (g) among
nitrogen fertigation treatments (F = .252; df = 3, 732; P = 0.859) (Table 5). Cumulative
strawberry fruit yields for the entire season were 60,188.3g for the 0.0 kg N/day/ha treatment,
60,085.5g for the 0.25 kg N/day/ha treatment, 63,870.5g for the 0.50 kg N/day/ha, and 60,170.2g
for the 0.75 kg N/day/ha treatment.

16
3.1.3 Twospotted Spider Mites
There were no significant differences in mean numbers of twospotted spider mites per
leaflet between the older and younger strawberry plant canopy (F = 0.215; df = 1, 194; P =
0.640). Mean mite numbers per leaflet were 18.9 ± 2.36 SEM (older) and 17.1 ± 2.90 SEM
(younger) of five sample dates from 12 December 2012 to 18 January 2013. (Table 6).
On 18 January 2013 just prior to pesticide application there were significant differences
among nitrogen treatments in cumulative mite days (CMD) (F =5.690; df = 3, 32; P = 0.003).
There was a greater number of CMD in the 0.75 kg N/day/ha treatment compared to the 0.25 kg
N/day/ha treatment or 0.0 kg N/day/ha treatment. The 0.50 kg N/day/ha treatment was
intermediate (Table 7).
3.1.4 Cotton Aphids
There were significant differences between the mean numbers of cotton aphids in the
younger (2.4 ± 0.29 SEM) and older (15.9 ± 1.29 SEM) canopy of strawberries (F = 114.295; df
= 1, 194; P < 0.001) from12 December 2012 to 18 January 2013 (Table 8).
3.1.5 Parasitized Cotton Aphids
The mean numbers of cotton aphids parasitized were significantly different between the
older leaves (4.67 ± 0.45 SEM) and younger leaves (0.5 ± 0.07 SEM) (F = 852.680; df = 1, 194;
P = 0.001). (Table 9).
3.2 Colored Plastic Mulch
3.2.1 Strawberry Fruit Yield
There were no significant differences in mean weights of strawberry fruit yield (g)
between red and black mulch treatments (F=0.157; df= 1, 224; P= 0.692). Means and SEM were
black 226.9g ± 16.95 and red 217.6g ± 16.55. Total berry weights were 25876.4g black and
24805.6g red.

17
3.2.2 Twospotted Spider Mites
There were no significant differences of mean numbers of spider mites per leaflet
between red or black plastic mulch treatments on any dates (Table 10).
3.2.3 Cotton Aphids
There were no significant differences of mean numbers of cotton aphids per leaflet
between red or black plastic mulch treatments on any dates (Table 11).
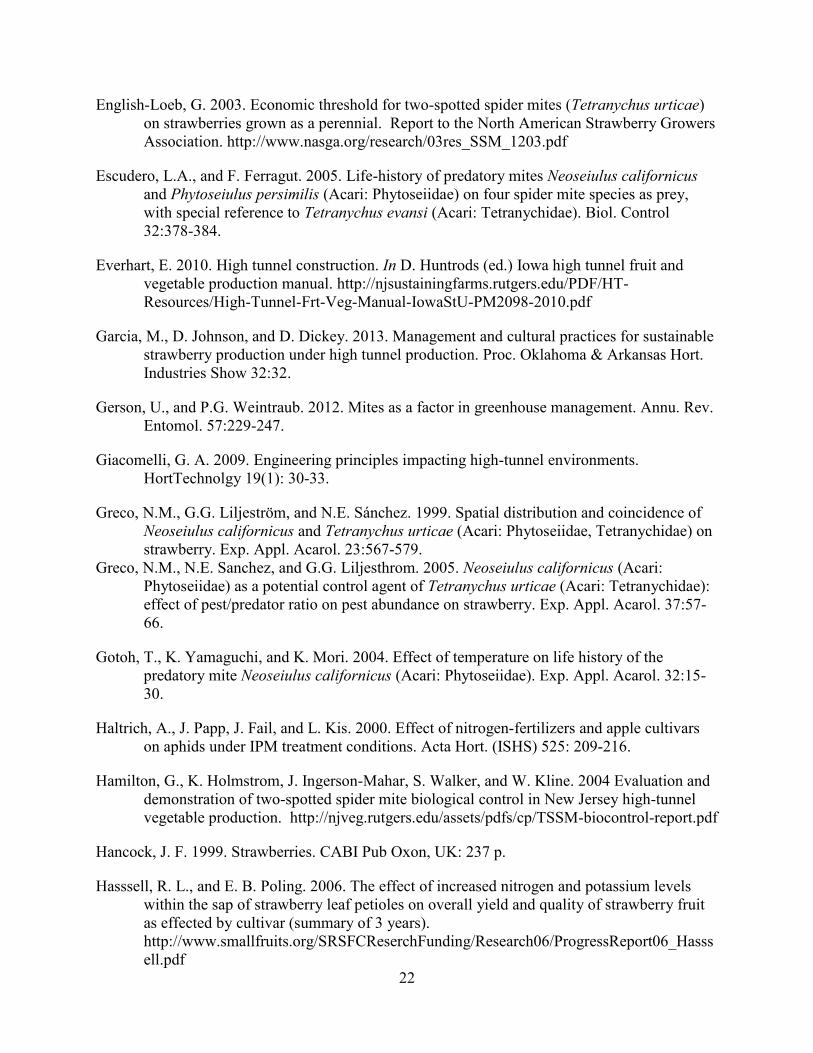
.3.2.4 Parasitized Cotton Aphids
There were no significant differences of mean numbers of parasitized cotton aphids per
leaflet between red or black plastic mulch treatments on any dates (Table 12).
4.0 Discussion
4.1 Nitrogen Study
Nitrogen fertigation treatments did not have any consistent effect on foliar or petiole
nitrogen levels. Differences in foliar nitrogen levels 8 January 2012 may have been caused by a
leak in the irrigation system. Because nitrogen fertigation treatments had no effect on either
foliar or petiole nitrogen levels in strawberry any differences in mite or insect numbers could not
be attributed to manipulation of nitrogen levels. Accordingly, the treatments had no consistent or
expected effects on strawberry fruit yield or numbers of twospotted spider mites, cotton aphids,
or parasitized cotton aphids.
Mean foliar nitrogen levels for the fertigation treatments were 2.87% for 0.0, 0.25, and
0.75 kg N/day/ha treatment but and 2.82% for 0.75 kg N/day/ha treatment. Hancock (1999)
recommends 2.0-2.8% foliar nitrogen (Table 1). Mean petiole nitrogen levels were 1534.4 for
0.0 kg N/day/ha, 1623.3 for 0.25 kg N/day/ha, 1652.9 for 0.50 kg N/day/ha and 1572.9 for 0.75
kg N/day/ha. Petiole nitrogen levels should be between 1500-2000 ppm during the fall
establishment period, but should be 3000-4000 ppm during the fruiting period (Hasssell and

18
Poling 2006) in perennial grown strawberries in North Carolina. Hancock (1999) mentions that
excessive nitrogen levels may lead to reduced yield and increased mite levels, although nitrogen
levels in this study were lower than what was deemed excessive. The cover crop of cowpeas
(May to July 2012) incorporated high amounts of nitrogen into the soil (soil N was 59kgN/ha on
1 September 2012). Thus, it seemed likely that soil nitrogen levels were sufficient for the entire
growing season and the strawberries were not able to incorporate the applied nitrogen in to their
tissue or the N flowed off the beds during application.
Significant differences in mite numbers on strawberry leaves were observed on 30 Dec.
(older leaves) and 11 Jan. (younger leaves) could not be attributed to manipulation of soil or
plant nitrogen levels. A malfunction of the irrigation system in one specific area during these
dates may have led to increased numbers on mites.
Younger and older portions of the strawberry canopy were sampled to determine if there
were differences in spatial distribution in densities of TSSMs and cotton aphids. The mean
numbers of TSSM per leaflet were similar in the younger and older portions of the canopy
whereas cotton aphid numbers per leaflet were greater in the older than younger portion of the
canopy. While controlled studies which include corrections based on leaf area size are needed,
future sampling for cotton aphids on strawberries grown in a high tunnel during winter may
possibly be restricted to the older portion of the canopy whereas TSSM can be sampled from any
portion of the canopy with mature leaves. Future studies should also include absolute sampling
of plants to obtain a measurement of the accuracy of the relative methods (leaf sampling) in
estimating arthropod density.
Dengate (2008) states that increased nitrogen levels in plants often have higher levels of
herbivory because the increased nitrogen allows for faster development, growth and greater
number of offspring. Dara (2013) and Cowles (2005) report that strawberry plants with

19
increased foliar nitrogen level have greater spider mite loads. The lack of significant differences
in mean numbers of spider mites per leaflet in this study was thus expected due to the similar
levels of N detected in foliar and petiole samples across all treatments. Similarly, strawberry
fruit yield among the four nitrogen fertigation treatments were not different as the measured N
levels were not influenced by the treatment.
Numerous studies (Zalom et al. 2010, Jett 2013, Aqueel and Leather 2010) found that
increased levels of nitrogen lead to increased cotton aphid levels, weight and fecundity.
However, the lack of significant differences in cotton aphid levels or levels of parasitized cotton
aphids among any of the nitrogen treatment groups in my study should be attributed only to the
lack of nitrogen levels among treatments. Increases of nitrogen levels above the recommended
value might have different results.
4.2 Colored Plastic Mulch
There were no significant differences in strawberry fruit yield or the numbers of spider
mites, cotton aphids or parasitized cotton aphids between the red and black plastic mulch film
treatments. Greater replication (3 used in this study) would have allowed for a more complete
evaluation of mulch colors. Previous studies documented that strawberries grown on red mulch
in an open field have higher fruit yield than those grown on black mulch. It is probable that
strawberries grown in black mulch are warmer than those grown on red mulch and that increased
temperatures may lead to increased rate of reproduction of spider mites. This may be influenced
by the materials used to construct the high tunnel. This tunnel was covered with Visqueen
Luminance THB AF 5S, which according to the manufacture’s literature reduces day time
temperatures by blocking the transmission of far-red light and block UV to 380 nm. Given that
this experiment was intended to show how reflecting far-red light back to the strawberry plants
affected yields, a different tunnel cover allowing transmission of far-red light might yield the

20
different results mentioned above by Kasperbauer (2000). Light transmission in the high tunnel
could easily be analyzed with a handheld spectroradiometer to determine what wavelengths are
transmitted by a variety of polyethylene films to determine which might be better suited to
increase fruit yields in offseason production of strawberry in high tunnels. Everhart (2010)
maintains that infra-red blocking films may reduce photosynthetic active radiation by 85%, a
figure that significantly reduced production of strawberry yield. Loughrin and Kasperbaur
(2002) noted that increased red and far-red light lead to increased strawberry yield. It is
reasonable to suggest that a reduction of these same wavelengths of light could reduce the same
qualities. Sakai and Osakabe (2010) mentioned that spider mites made no attempt to shield
themselves from the more damaging, higher energy UV-B light (280 to 315 nm) in the absence
of UV-A light (315-400 nm). The UV-B light was lethal to all life stages of spider mite. The
polyethylene film Visqueen Luminance used in high tunnels blocks out all of UV-B light and
most of UV-A light up to 380 nm. A plastic film that allows more UV-B could potentially help
maintain spider mite levels below treatment thresholds.
4.3 Summary
An unintended consequence of this study suggest that the addition of cover crops has the
ability to greatly raise the preplanting soil nitrogen level, to the point that nitrogen fertigation
treatments may be un-necessary or at least ineffective. Excessive nitrogen could lead to
increased loads of arthropod pests and reducing nitrogen may make the environment of the high
tunnel less suitable to those pests, although we could not adequately address this question.
Increased replication may increase our ability to detect differences in strawberry fruit yields and
arthropod numbers in red colored plastic mulch trials as compared to black plastic mulch
treatments. Both of these factors should be addressed in future experiments and may lead to a
sustainable off season strawberry production method in high tunnels.
21
5.0 References
Anon. 2011. Aphid predators. The Royal Horticultural Society of England and Wales
http://apps.rhs.org.uk/advicesearch/Profile.aspx?pid=507
Aqueel, M. A. and S. R. Leather. 2010. Effect of nitrogen fertilizer on the growth and survival of
Rhopalosiphum padi (L.) and Sitobion avenae (F.) (Homoptera: Aphididae) on different
wheat cultivars. Crop. Prot. 30: 216-221.
Bethke, J. A., R. A. Redak, and U. K. Schuch. 1998. Melon aphid performance on
chrysanthemum as mediated by cultivar, and differential levels of fertilization and
irrigation. Entomol. Exp. Appl. 88: 41-47.
Blackman, R. L., and V.F. Eastop, 1984. Aphids on the world's crops: an identification and
information guide. Chichester West Sussex: Wiley.
Blomgren, T., and T. Frisch. 2007. High Tunnels: using low-cost technology to increase yields,
improve quality and extend the season. University of Vermont Center for Sustainable
Agriculture. www.uvm.edu/sustainableagriculture
Bordelon, B., Ellis, M., and C. Welty, (Eds). 2013. Midwest small fruit and grape spray guide:
2012. Ohio State University Extension Publications Bul. 861.
Burrack, H., and A. Chapman. 2010. Twospotted spider mite control in strawberries with
registered acaricides. ESA Arthropod Management Tests 36: C21.
Cantliffe, D., J. Webb, J. VanSickle, and N. Shaw, 2008. Potential profits from greenhouse-
grown organic strawberries are greater than conventional greenhouse or field-grown
strawberries in Florida. Proc. Fla. State Hort. Soc. 121:208–213.
Cowles, R. 2013. Spider mite management in strawberries. Connecticut AES.
http://www.newenglandvfc.org/2005_conference/proceedings_05/strawberry2/spider_mit
e_management_strawberries.pdf
Csizinszky,A., Schuster, D. and J. Kring, 1995. Color mulches influence yield and insect pest
populations in tomatoes. J. Amer. Soc. Hort. Sci. 120(5):778-784.
Dara, S. 2013. Spider mites and their management in strawberries. University of California
Cooperative Extension. http://cesantabarbara.ucanr.edu/files/75472.pdf
Decoteau, D., M. Kasperbauer, and P. Hunt, 1989. Mulch surface color affects yield of fresh-
market tomatoes. J. Amer. Soc. Hort. Sci. 114: 216-219.
Demchak, K. 2009. Small fruit production in high tunnels. HortTechnology 19(1): 44-49.
Dengate, E.E., A.L. Clune, J.L. Foster, and B.N. Kiel. 2008. The effect of plant nitrogen levels
on insect herbivory in Northern Michigan sand dunes. University of Michigan Biological
Station. http://hdl.handle.net/2027.42/61514
Domoto, P., M. Gleason, and D. Lewis. 2008 Production Guide for Commercial Strawberries.
Iowa State University Extension.
22
English-Loeb, G. 2003. Economic threshold for two-spotted spider mites (Tetranychus urticae)
on strawberries grown as a perennial. Report to the North American Strawberry Growers
Association. http://www.nasga.org/research/03res_SSM_1203.pdf
Escudero, L.A., and F. Ferragut. 2005. Life-history of predatory mites Neoseiulus californicus
and Phytoseiulus persimilis (Acari: Phytoseiidae) on four spider mite species as prey,
with special reference to Tetranychus evansi (Acari: Tetranychidae). Biol. Control
32:378-384.
Everhart, E. 2010. High tunnel construction. In D. Huntrods (ed.) Iowa high tunnel fruit and
vegetable production manual. http://njsustainingfarms.rutgers.edu/PDF/HT-
Resources/High-Tunnel-Frt-Veg-Manual-IowaStU-PM2098-2010.pdf
Garcia, M., D. Johnson, and D. Dickey. 2013. Management and cultural practices for sustainable
strawberry production under high tunnel production. Proc. Oklahoma & Arkansas Hort.
Industries Show 32:32.
Gerson, U., and P.G. Weintraub. 2012. Mites as a factor in greenhouse management. Annu. Rev.
Entomol. 57:229-247.
Giacomelli, G. A. 2009. Engineering principles impacting high-tunnel environments.
HortTechnolgy 19(1): 30-33.
Greco, N.M., G.G. Liljeström, and N.E. Sánchez. 1999. Spatial distribution and coincidence of
Neoseiulus californicus and Tetranychus urticae (Acari: Phytoseiidae, Tetranychidae) on
strawberry. Exp. Appl. Acarol. 23:567-579.
Greco, N.M., N.E. Sanchez, and G.G. Liljesthrom. 2005. Neoseiulus californicus (Acari:
Phytoseiidae) as a potential control agent of Tetranychus urticae (Acari: Tetranychidae):
effect of pest/predator ratio on pest abundance on strawberry. Exp. Appl. Acarol. 37:57-
66.
Gotoh, T., K. Yamaguchi, and K. Mori. 2004. Effect of temperature on life history of the
predatory mite Neoseiulus californicus (Acari: Phytoseiidae). Exp. Appl. Acarol. 32:15-
30.
Haltrich, A., J. Papp, J. Fail, and L. Kis. 2000. Effect of nitrogen-fertilizers and apple cultivars
on aphids under IPM treatment conditions. Acta Hort. (ISHS) 525: 209-216.
Hamilton, G., K. Holmstrom, J. Ingerson-Mahar, S. Walker, and W. Kline. 2004 Evaluation and
demonstration of two-spotted spider mite biological control in New Jersey high-tunnel
vegetable production. http://njveg.rutgers.edu/assets/pdfs/cp/TSSM-biocontrol-report.pdf
Hancock, J. F. 1999. Strawberries. CABI Pub Oxon, UK: 237 p.
Hasssell, R. L., and E. B. Poling. 2006. The effect of increased nitrogen and potassium levels
within the sap of strawberry leaf petioles on overall yield and quality of strawberry fruit
as effected by cultivar (summary of 3 years).
http://www.smallfruits.org/SRSFCReserchFunding/Research06/ProgressReport06_Hasss
ell.pdf

23
Henderson, C., and H. McBurnie. 1943. Sampling technique for determining population of the
citrus red mite and its predators. USDA Circ. No. 671.
Heidenreich, C., M. Pritts, K. Demchak, E. Hanson, C. Weber, and M.J. Kelly. 2012. High
tunnel raspberries and blackberries. Dept. Hort. Publ. No.47.
www.fruit.cornell.edu/berry/production/.../hightunnelsrasp2012.pdf
Hoy, M. A. 2011. Agricultural acarology: introduction to integrated mite management. CRC
Press, Boca Raton, FL.
Jett, L. 2013. Growing short day strawberries within high tunnels.
http://anr.ext.wvu.edu/r/download/52995
Johnson, D., K. Durden, C. Trammel, B. Lewis, and SH. Kim. 2013. Pests in high tunnel. Proc.
Oklahoma & Arkansas Hort. Industries Show 32:33.
Johnson, D., Striegler, K., and B. Lewis. 2003. Crop Profile for Strawberries in Arkansas.
http://www.ipmcenters.org/cropprofiles/docs/ARstrawberries.html
Kasperbauer, M. J., and J. L. Hamilton. 1984. Chloroplast structure and starch grain
accumulation in leaves that received different red and far-red levels during development.
Plant Physiol. 74: 967-970.
Kasperbauer, M. J. 2000. Strawberry yield over red versus black plastic mulch. Crop Sci. 40:
171-174.
Kasperbauer, M. J., J. H. Loughrin, and S. Y. Wang. 2001. Light reflected from red mulch to
ripening strawberries affects aroma, sugar and organic acid concentrations. Photochem.
Photobiol. 74: 103-107.
Labanowska, B., and A. Bielenin. 2000. The standard and the integrated strawberry production
in Poland. Integrated Production of Soft Fruits IOBC/WPRS Bul. 23(11):7-10.
Labanowska, B., and A. Bielenin. 2002. Infestation of strawberry cultivars with some pests and
diseases in Poland. Acta Hort. (ISHS) 567:705-708.
Lamont, W. J. 2009. Overview of the use of high tunnels worldwide. HortTechnology 19(1): 25-
29.
Loughrin, J. H., and M. J. Kasperbauer. 2002. Aroma of fresh strawberries is enhanced by
ripening over red versus black mulch. J. Agr. Food Chem. 50: 161-165.
McGinnis, M., C. Stokes, and B. Cleveland. 2013. Plant tissue analysis guide. NCDA&CS
Agronomic Division. http://www.ncagr.gov/agronomi/pdffiles/plantguide.pdf
Miner, G.S., E.B. Poling, D.E. Carroll, and L.A. Nelson. 1997. Influence of fall nitrogen and
spring nitrogen-potassium applications on yield and fruit quality of ‘Chandler’
strawberry. J. Am. Soc. Hortic. Sci. 122(2):290-295.

24
Morgan, C., D. Chant, N. Anderson, and G. Ayre. 1955. Methods of estimating orchard mite
populations, especially with the mite brushing machine. Can. Entomol. 87:189-200.
Nevo, E and M. Coll. 2001. Effect of nitrogen fertilization on Apis gosipii (Homoptera:
Aphididae): Variation in size, color and reproduction. J. Econ. Entomol. 94(1): 27-32
Ojeda-Real, L. A., P. Lobit, R. Cardenas-Navarro, O. Grageda-Cabrera, R. Farias-Rodriguez, E.
Valencia-Cantero, and L. Macias-Rodriguez. 2009. Effect of nitrogen fertilization on
quality markers of strawberry (Fragaria x ananassa Duch. cv. Aromas). J. Sci. Food Agr.
89: 935-939.
Papp, J., G. Jenser, and A. Haltrich. 2001. Effect of nitrogen supply on the population of
European red spider mite and green apple aphid in an IPM apple orchard. Proc. the
Fourth International Symposium on Mineral Nutrition of Deciduous Fruit Crops. Acta
Hort. 564: 407-412.
Pratt, P. D., P. Schausberger, and B. A. Croft. 1999. Prey-food types of Neoseiulus fallacis
(Acari: Phytoseiidae) and literature versus experimentally derived prey-food estimates for
five phytoseiid species. Exp. Appl. Acarol. 23: 551-565.
Price, J. and Nagle, C. 2013. Foliar applied insecticides for control of melon aphid in strawberry,
2011. ESA Arthropod Management Tests 37: C 23.
Price, J. 2010. Efficacy of Abamectin formulations for control of twospotted spider mite in late
season strawberry, 2009. ESA Arthropod Management Tests 35:C23.
Pritts, M. and Handley, D. 1998. Strawberry production guide for the northeast, mideast and
eastern Canada. NRAES-88. Northeast Regional Agricultural Engineering Service,
Ithaca, New York.
Ramakers, P. M. J. 1989. Biological control in greenhouses, pp. 199-208. In A.K. Minks and P.
Harrewijn (Eds), World crop pests: aphids their biology, natural enemies and control.
Elsevier: New York.
Raworth, D. A., and S. J. Clements. 1996. Plant growth and yield of red raspberry following
primocane defoliation. Hortscience 31: 920-922.
Rhodes, E., and O. Liburd, 2009. Featured creatures: Neoseiulus californicus. University of
Florida. http://entnemdept.ufl.edu/creatures/beneficial/Neoseiulus_californicus.htm
Rondon, S. I., D. J. Cantliffe, and J. F. Price. 2005. Population dynamics of the cotton aphid,
Aphis gossypii (Homoptera: Aphididae), on strawberries grown under protected structure.
Fla. Entomol. 88: 152-158.
Sakai, Y., and M. Osakabe. 2010. Spectrum-specific damage and solar ultraviolet radiation
avoidance in the two-spotted spider mite. Photochem. Photobiol. 86: 925-932.
SAS Institute Inc. 2012. JMP® 10 Discovering JMP. Cary, NC: SAS Institute Inc.

25
Sanchez, J. A., M. La-Spina, J. M. Michelena, A. Lacasa, and A. H. de Mendoza. 2011. Ecology
of the aphid pests of protected pepper crops and their parasitoids. Biocontrol Sci. Techn.
21: 171-188.
Sato, M.E., M.Z. da Silva, A. Raga, K.G. Cangani, B. Veronez, and R.L. Nicastro. 2011.
Spiromesifen toxicity to the spider mite Tetranychus urticae and selectivity to the
predator Neoseiulus californicus. Phytoparasitica 39: 437-445.
Shelton, A. 2012. Biological control: a guide to natural enemies in North America. Cornell
University, Ithaca, New York. Retrieved 3 Nov. 2012 from:
http://www.biocontrol.entomology.cornell.edu/predators/Phytoseiulus.html
Stary, P. 1970. Biology of aphid parasites (Hymenoptera: Aphidiidae) with respect to integrated
control. Series Entomologica (Book 6) The Hague: Junk. 656 pp.
Sterk, G., and P. Meesters. 1997. IPM on strawberries in glasshouses and plastic tunnels in
Belgium, new possibilities. Third International Strawberry Symposium, Acta Hort
439:905-911.
Stavrinides, M.C., J.R. Lara, and N.J. Mills. 2010. Comparative influence of temperature on
development and biological control of two common vineyard pests (Acari:
Tetranychidae). Biol. Control 55:126-131.
Studebaker, G. 2013. Insecticide recommendations for Arkansas 2013. University of Arkansas
Cooperative Extension Service, Little Rock, AR.
http://www.uaex.edu/Other_Areas/publications/PDF/MP144/MP144.pdf
Sauge, M. H., I. Grechi, and J. L. Poessel. 2010. Nitrogen fertilization effects on Myzus persicae
aphid dynamics on peach: vegetative growth allocation or chemical defence? Entomol.
Exp. Appl. 136: 123-133.
USDA WSS. 2014. Web Soil Survey.
http://websoilsurvey.sc.egov.usda.gov/App/HomePage.htm
USDA NASS. 2009. Agricultural prices 2008 summary: August 2009. (Pr 1-3 (09))
http://usda01.library.cornell.edu/usda/current/AgriPricSu/AgriPricSu-08-05-2009.pdf.
Ulrich, A. and W. Allen. 1971. Petioles Tell the Nitrogen Story for Strawberries. Calif Agri.
25(3):8.
Van Leeuwen, T., J. Vontas, A. Tsagkarakou, W. Dermauw, and L. Tirry. 2010. Acaricide
resistance mechanisms in the two-spotted spider mite Tetranychus urticae and other
important Acari: A review. Insect Biochem. Mol. Biol. 40(8): 563–572.
Wrensch, D.L. 1985. Reproductive parameters, in spider mites: their biology, natural enemies,
and control, pp. 165-170. In W. Helle, and Sabelis, M. W. (eds.), Spider mites: their
biology, natural enemies, and control. Vol. 1A. Amsterdam: Elsevier.
Zalom, F., M. Bolda, P. Phillips, and N. Toscano. 2010. UC IPM pest management guidelines:
strawberry. UN ANR Publication 3468. 013.

26
Zamani, A. A., A. Talebi, Y. Fathipour, and V. Baniameri. 2007. Effect of temperature on life
history of Aphidius colemani and Aphidius matricariae (Hymenoptera: Braconidae), two
parasitoids of Aphis gossypii and Myzus persicae (Homoptera: Aphididae). Environ.
Entomol. 36: 263-271.

27
6.0 Tables
Table 1. Recommended foliar nutrient levels for strawberry from Pritts and Handley (1998).
Nutrient Deficient Sufficient Toxic
N (%) 1.9 2.0 - 2.8 4.0
P (%) 0.2 0.3 - 0.40 0.5
K (%) 1.3 1.5 - 2.5 3.5
Ca (%) 0.5 0.7 - 1.7 2
Mg (%) 0.25 0.3 - 0.5 0.8
S (%) 0.35 0.4 - 0.6 0.8
B (ppm) 23 30 - 70 90
Fe (ppm) 40 60 - 250 350
Mn (ppm) 35 50 - 200 350
Cu (ppm) 3 6 - 20 30
Zn (ppm) 10 20 - 50 80

28
Table 2. Pesticides applied with a backpack sprayer to off-season strawberry plants grown in a
high tunnel at the University of Arkansas Agricultural Research and Extension Center,
Fayetteville, Arkansas (September 2012 to April 2013).
Date Compound Formulation
Active
ingredient
Application
rate
21 Sep. 12 Aliette WDG
Aluminum tris
(O-ethyl
phosphonate) 5.0 #/Ac
25 Oct. 12 Entrust SC Spinosad 6.0 oz/Ac
6 Nov. 12 Rally 40WSP myclobutanil 5.0 oz/Ac
14 Jan. 13 Captan 50W Captan 3-6 lbs./Ac
Rally 40WSP myclobutanil 5.0 oz/Ac
21 Jan. 13 Agri-Mek 0.15EC Abamectin 16.0 oz/Ac
5 Feb. 13 Captan 50W Captan 3-6 lbs./Ac
26 Apr. 13 Entrust SC Spinosad 6.0 oz/Ac
Agri-Mek 0.15EC Abamectin 16.0 oz/Ac
Actinovate SP Streptomyces
lydicus
6-12 oz/Acre
29
Table 3. Effects of four nitrogen (N) fertigation rates on mean foliar nitrogen (± SEM) of
strawberry cv. ‘Strawberry Festival’ leaves in a high tunnel at the Arkansas Agricultural
Research and Extension Center, Fayetteville, AR (6 November 2012 to 5 February 2013).
Date N Fertigation rate (kg N/day/ha)
0.00 0.25 0.50 0.75
6 Nov. 2012 2.9 ± 0.04 2.9 ± 0.06 2.9 ± 0.06 2.9 ± 0.07
20 Nov. 2012 2.7 ± 0.07 2.8 ± 0.04 2.9 ± 0.06 2.8 ± 0.09
5 Dec. 2012 3.0 ± 0.03 3.0 ± 0.01 2.9 ± 0.09 2.9 ± 0.06
18 Dec. 2012 2.9 ± 0.05 2.9 ± 0.02 2.9 ± 0.03 2.9 ± 0.02
8 Jan. 2013 2.8 ± 0.02a 2.7 ± 0.03a 2.8 ± 0.02a 2.6 ± 0.03b
5 Feb. 2013 2.9 ± 0.08 2.9 ± 0.02 2.8 ± 0.02 2.8 ± 0.09
Average 2.87 2.87 2.87 2.82
Means within a row not followed by the same letter are significantly different (P < 0.05;
Students t- test)

30
Table 4. Effects of four nitrogen (N) fertigation rates on mean petiole nitrogen (ppm) (± SEM)
of strawberry cv. ‘Strawberry Festival’ leaves in a high tunnel at the Arkansas Agricultural
Research and Extension Center, Fayetteville, AR (6 November 2012 to 5 February 2013).
Date N Fertigation rate (kg N/day/ha)
0.00 0.25 0.50 0.75
6 Nov. 2012 1406.7 ± 104.08b 1786.7 ± 165.23ab 1973.3 ± 84.13a 1500.0 ± 31.80b
20 Nov. 2012 1600.0 ± 79.74 1526.7 ± 119.73 1566.8 ± 88.52 1406.7 ± 105.37
5 Dec. 2012 2106.7 ± 108.68b 2513.3 ± 79.65a 2333.3 ± 40.96ab 2446.7 ± 133.46ab
18 Dec. 2012 1366.7 ± 110.97 1206.7 ± 53.67 1266.7 ± 139.22 1342.7 ± 186.18
8 Jan. 2013 1226.7 ± 68.70 1240.0 ± 58.38 1286.7 ± 113.81 1266.7 ± 22.05
5 Feb. 2013 1500.0 ± 77.32 1466.7 ± 40.15 1491.0 ± 74.01 1474.7 ± 128.98
Average 1534.4 1623.3 1652.9 1572.9
Means within a row not followed by the same letter are significantly different (P < 0.05;
Students t- test)

31
Table 5. Effects of four nitrogen (N) fertigation rates on mean strawberry fruit yield (g) (± SEM)
per 20 plant treatment of strawberry cv. ‘Strawberry Festival’ fruit in a high tunnel at the
Arkansas Agricultural Research and Extension Center, Fayetteville, AR (27 November 2012 to
28 May 2013).
N Fertigation rate
(kg N/day/ha) Yield (g)
0.00 323.2 ± 18.31
0.25 321.5 ± 18.65
0.50 339.5 ± 18.58
0.75 (recommended) 318.7 ± 19.20

32
Table 6. Effects of nitrogen fertigation rates on mean numbers (± SEM) of twospotted spider
mites per strawberry cv. ‘Strawberry Festival’ leaflet in a high tunnel at the Arkansas
Agricultural Research and Extension Center, Fayetteville AR (12 December 2012 to 18 January
2013).
Sampled Nitrogen Fertigation Rates (kg N/day/ha)
Date Leavesa 0.00 0.25 0.50 0.75
12 Dec.12 Y 3.5 ± 1.31 4.3 ± 2.36 11.5 ± 6.57 3.9 ± 1.69
O 10.7 ± 9.2 9.6 ± 7.37 27.3 ± 10.56 10.4 ± 4.02
19 Dec.12 Y 1.3 ± 0.41 1.3 ± 1.07 43.3 ± 25.21 18.5 ± 12.49
O 15.8 ± 11.27 22.4 ± 13.44 14.4 ± 7.47 14.5 ± 11.01
30 Dec.12 Y 2.4 ± 1.13 9.7 ± 8.12 17.0 ± 6.41 32.1 ± 25.14
O 6.2 ± 2.34b 11.7 ± 7.28ab 5.8 ± 2.29b 53.9 ± 25.74a
11 Jan.13 Y 17.7 ± 15.78ab 1.5 ± 0.53b 23.4 ± 13.45ab 61.9 ± 24.18a
O 12.2 ± 7.56 11.1 ± 6.97 34.9 ± 10.71 36.9 ± 14.52
18 Jan.13 Y 6.7 ± 3.22b 11.1 ± 6.64b 45.3 ± 13.44a 27.2 ± 4.88ab
O 21.3 ± 8.74 21.0 ± 14.99 16.9 ± 5.02 21.9 ± 4.58
Means within a row not followed by the same letter are significantly different (P < 0.05;
Students t- test) a Y, young leaves; O, older leaves

33
Table 7. Effects of four nitrogen (N) fertigation rates on mean cumulative mite days (CMD) (±
SEM) of twospotted spider mites per strawberry cv. ‘Strawberry Festival’ leaflet in a high tunnel
at the Arkansas Agricultural Research and Extension Center, Fayetteville, AR on 18 January
2013.
N Fertigation rate
(kg N/day/ha treatment) CMD
0.00 344.4 ± 109.96b
0.25 493.3 ± 172.62b
0.50 683.6 ± 138.02ab
0.75 (recommended) 1300.0 ± 387.81a
Means within a row followed by the same letter are not significantly different (P <0.05; Students
t- test

34
Table 8. Effects of nitrogen fertigation rates on mean numbers (± SEM) of cotton aphids per
strawberry cv. ‘Strawberry Festival’ leaflet in a high tunnel at the Arkansas Agricultural
Research and Extension Center, Fayetteville AR (12 December 2012 to 18 January 2013).
Sampled Nitrogen Fertigation Rates (kg N/day/ha)
Date Leavesa 0.0 0.25 0.50 0.75
12 Dec.12 Y 3.1 ± 1.39 2.3 ± 0.90 2.5 ± 1.09 5.9 ± 3.30
O 8.0 ± 2.57 9.7 ± 2.45 8.0 ± 2.31 3.2 ± 1.71
19 Dec.12 Y 0.9 ± .029 0.8 ± 0.25 1.0 ± 0.22 1.0 ± 0.31
O 17.6 ± 4.42 28.7 ± 5.62 16.5 ± 3.34 18.0 ± 4.30
30 Dec.12 Y 4.3 ± 1.38 1.8 ± 0.84 2.4 ± 0.86 2.4 ± 1.35
O 19.1 ± 2.11 13.2 ± 4.50 18.8 ± 7.05 22.2 ± 5.88
11 Jan.13 Y 4.2 ± 0.90a 3.2 ± 0.63ab 1.8 ± 0.30b 1.8 ± 1.07b
O 17.2 ± 2.37 10.1 ± 2.70 11.2± 4.35 10.2 ± 3.80
18 Jan.13 Y 1.5 ± 0.70 2.5 ± 0.76 2.7 ± 1.40 1.8 ± 0.69
O 14.2 ± 2.77 13.2 ± 3.64 13.7 ± 2.79 14.3 ± 2.97
Means within a row followed by the same letter are not significantly different (P <0.05; Students
t- test) a Y, young leaves; O, older leaves

35
Table 9. Effects of nitrogen fertigation rates on mean numbers (± SEM) of parasitized cotton
aphids per strawberry cv. ‘Strawberry Festival’ leaflet in a high tunnel at the Arkansas
Agricultural Research and Extension Center, Fayetteville AR (12 December 2012 to 18 January
2013).
Sampled Nitrogen Fertigation Rates (kg N/day/ha)
Date Leavesa 0.00 0.25 0.50 0.75
12 Dec. 12 Y 0.4 ± 0.21 0.4 ± 0.16 0.5 ± 0.34 0.0 ± 0.09
O 2.6 ± 0.80 3.1 ± 1.32 2.2 ± 1.20 0.6 ± 0.44
19 Dec. 12 Y 0.7 ± 0.29 0.2 ± 0.14 0.0 ± 0.17 0.2 ± 0.09
O 3.0 ± 0.84 5.2 ± 1.44 3.5 ± 1.09 2.5 ± 1.31
30 Dec. 12 Y 0.6 ± 0.31 0.2 ± 0.22 0.9 ± 0.53 0.6 ± 0.30
O 5.5 ± 0.74 2.3 ± 0.58 2.9 ± 0.33 3.5 ± 0.80
11 Jan. 13 Y 1.4 ± 0.42 1.0 ± 0.30 0.3 ± 0.42 0.2 ± 0.19
O 10.0 ± 1.75 4.4 ± 1.18 3.2 ± 2.15 3.3 ± 1.58
18 Jan. 13 Y 0.9 ± 0.22 1.1 ± 0.35 0.9 ± 0.33 0.3 ± 0.20
O 10.0 ± 1.22 9.6 ± 3.18 7.6 ± 2.32 8.0 ± 2.95
Y, young leaves; O, older leaves

36
Table 10. Effects of nitrogen fertigation rates on mean numbers (± SEM) of twospotted spider
mite per strawberry cv. ‘Radiance’ leaflet as affected by red and black plastic mulch treatments
in a high tunnel at the Arkansas Agricultural Research and Extension Center, Fayetteville AR
(12 December 2012 to 18 January 2013).
Date Black Red
19 Dec. 12 4.5 ± 2.06 0.4 ± 2.06
30 Dec. 12 7.3 ± 3.53 0.0 ± 3.53
11 Jan. 13 3.7 ± 1.64 0.1 ± 1.64
18 Jan. 13 1.3 ± 0.40 0.0 ± 0.40

37
Table 11. Effects of nitrogen fertigation rates on mean numbers (± SEM) of cotton aphid per
strawberry cv. ‘Radiance’ leaflet as affected by red and black plastic mulch treatments in a high
tunnel at the Arkansas Agricultural Research and Extension Center, Fayetteville AR (12
December 2012 to 18 January 2013).
Date Black Red
19 Dec. 12 2.0 ± 1.27 4.0 ± 1.27
30 Dec. 12 5.2 ± 1.74 7.1 ± 1.74
11 Jan. 13 7.4 ± 1.85 12.0 ± 1.85
18 Jan. 13 11.5 ± 3.47 5.4 ± 3.47
38
Table 12. Effects of nitrogen fertigation rates on mean numbers (± SEM) of parasitized cotton
aphid per strawberry cv. ‘Radiance’ leaflet as affected by red and black plastic mulch treatments
in a high tunnel at the Arkansas Agricultural Research and Extension Center, Fayetteville AR
(12 December 2012 to 18 January 2013).
Date Black Red
19 Dec. 12 1.0 ± 0.43 1.3 ± 0.43
30 Dec. 12 1.7 ± 0.29 1.0 ± 0.29
11 Jan. 13 2.5 ± 1.10 4.2 ± 1.10
18 Jan. 13 3.1 ± 1.28 1.4 ± 1.28

39
7.0 Appendices
7.1 Appendix A
Appendix A. Biological characteristics and ranges of environmental constraints of predatory mite
species that prey on twospotted spider mites (TSSM).
Predatory
Mite Species
Longevity
(Days)
Develop
time
(Days)
%
RH °C
TSSM
eggs
eaten per
day
Other
food
source
Eggs
per
female
Neoseiulus
californicus 20 4 40-80 15-35 5.3 pollen 41
Galendromus
occidentalis 45 4 40-80 15-35 20-25 none 35
Neoseiulus
fallacis 10-15 7 na na 20-25 pollen 20-50
Phytoseiulus
persimilus 50 5 >70 17-27 20 none 60
Sources: Greco et al., (1999), Rhodes and Liburd, (2009), Gotoh et al., (2003), Escudero and
Ferragut, (2005), Stavrinides et al., (2010), Hoy, (2011), Rhodes and Liburd, (2009),
Greenmethods.com, (2012), Shelton, (2012), Pratt et al. (1999)

40
7.2 Appendix B
Appendix B. ANOVA results of effects of four nitrogen fertigation rates on mean percentage of
foliar nitrogen in leaflets of strawberry cv. ‘Strawberry Festival’ in a high tunnel at Arkansas
Agricultural Research and Extension Center, Fayetteville, AR (December 2012 to April 2013).
Date Source df
Mean
Square F ratio
Prob >
F
6 Nov. 12 Treatment 3 0.003 0.2728 0.843
Block 2 0.030 2.174 0.195
20 Nov. 12 Treatment 3 0.012 0.671 0.600
Block 2 0.000 0.045 0.956
5 Dec. 12 Treatment 3 0.011 0.881 0.501
Block 2 0.001 0.138 0.873
18 Dec. 12 Treatment 3 0.003 0.851 0.514
Block 2 0.001 0.305 0.747
8 Jan. 13 Treatment 3 0.012 5.519 0.036
Block 2 0.008 3.369 0.104
5 Feb. 13 Treatment 3 0.004 0.277 0.839
Block 2 0.000 0.015 0.984

41
7.3 Appendix C
Appendix C. ANOVA results of effects of four nitrogen fertigation rates on mean petiole
nitrogen (ppm) in leaflets of ‘Strawberry Festival’ in a high tunnel at Arkansas Agricultural
Research and Extension Center, Fayetteville, AR (December 2012 to April 2013).
Date Source df
Mean
Square F ratio
Prob >
F
6 Nov. 12 Treatment 3 203822.0 4.409 0.058
Block 2 28933.0 0.626 0.566
20 Nov. 12 Treatment 3 21366.7 0.539 0.672
Block 2 14700.0 0.379 0.704
5 Dec. 12 Treatment 3 95511.0 0.2.537 0.153
Block 2 204400.0 5.429 0.045
18 Jan. 12 Treatment 3 16012.0 0.231 0.871
Block 2 69265.3 1.000 0.421
8 Jan. 13 Treatment 3 2166.7 0.100 0.956
Block 2 9700.0 0.449 0.657
5 Feb. 13 Treatment 3 689.2 0.023 0.994
Block 2 2986.1 0.100 0.905

42
7.4 Appendix D
Appendix D. ANOVA results of mean strawberry fruit yield (g) of strawberry cv. ‘Strawberry
Festival’ as affected by four nitrogen fertigation rates (%) in a high tunnel at Arkansas
Agricultural Research and Extension Center, Fayetteville, AR (December 2012 to May 2013).
Date Source DF
Mean
Square F ratio Prob > F
11 Dec. 12 Treatment 3 16773.9 3.183 0.063
Block 4 5193.1 0.985 0.451
17 Dec. 12 Treatment 3 6816.1 1.894 0.184
Block 4 16721.9 4.648 0.017
21 Dec. 12 Treatment 3 10067.2 2.578 0.102
Block 4 12279.2 3.145 0.055
24 Dec 12 Treatment 3 414.5 0.116 0.948
Block 4 2871.4 0.805 0.545
30 Dec. 12 Treatment 3 2949.9 0.558 0.652
Block 4 1287.5 0.558 0.652
4 Jan. 13 Treatment 3 1166.1 0.612 0.620
Block 4 1061.5 0.557 0.697
10 Jan. 13 Treatment 3 2205.2 0.451 0.720
Block 4 962.1 0.197 0.935
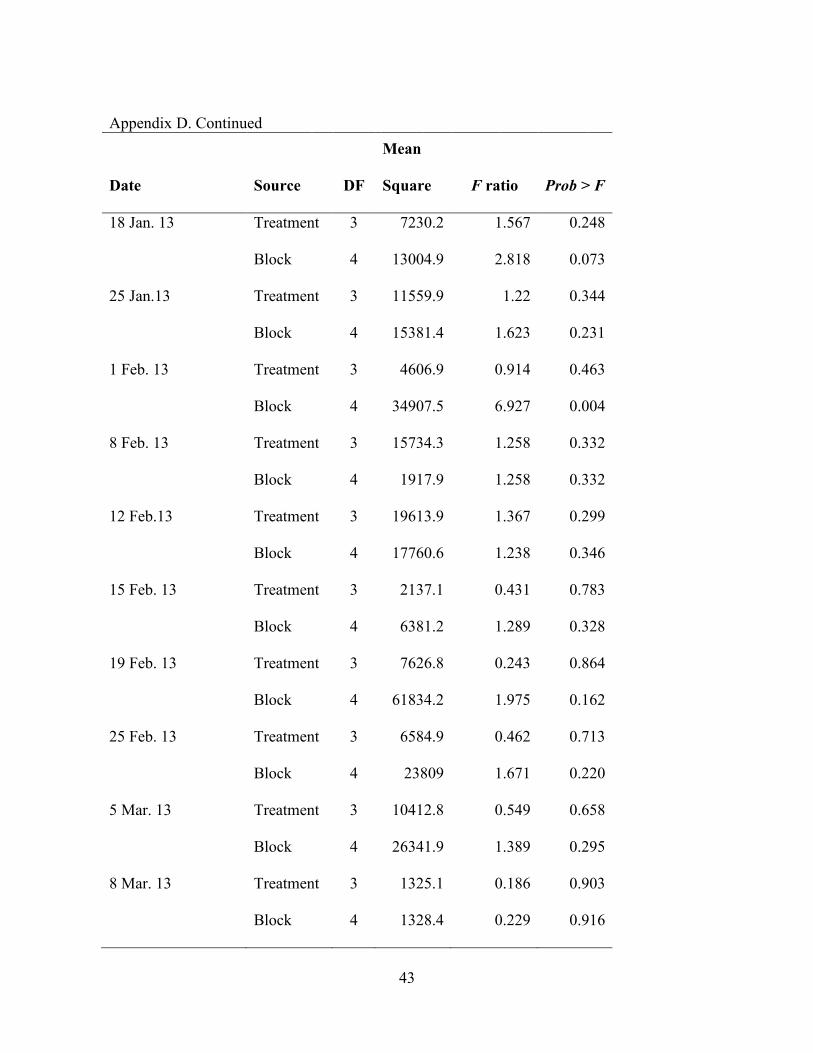
43
Appendix D. Continued
Date Source DF
Mean
Square F ratio Prob > F
18 Jan. 13 Treatment 3 7230.2 1.567 0.248
Block 4 13004.9 2.818 0.073
25 Jan.13 Treatment 3 11559.9 1.22 0.344
Block 4 15381.4 1.623 0.231
1 Feb. 13 Treatment 3 4606.9 0.914 0.463
Block 4 34907.5 6.927 0.004
8 Feb. 13 Treatment 3 15734.3 1.258 0.332
Block 4 1917.9 1.258 0.332
12 Feb.13 Treatment 3 19613.9 1.367 0.299
Block 4 17760.6 1.238 0.346
15 Feb. 13 Treatment 3 2137.1 0.431 0.783
Block 4 6381.2 1.289 0.328
19 Feb. 13 Treatment 3 7626.8 0.243 0.864
Block 4 61834.2 1.975 0.162
25 Feb. 13 Treatment 3 6584.9 0.462 0.713
Block 4 23809 1.671 0.220
5 Mar. 13 Treatment 3 10412.8 0.549 0.658
Block 4 26341.9 1.389 0.295
8 Mar. 13 Treatment 3 1325.1 0.186 0.903
Block 4 1328.4 0.229 0.916

44
Appendix D. Continued
Date Source DF
Mean
Square F ratio Prob > F
11 Mar. 13 Treatment 3 7499.9 1.812 0.198
Block 4 2639.4 0.651 0.637
15 Mar. 13 Treatment 3 1601.8 0.719 0.559
Block 4 3640.7 1.632 0.228
21 Mar. 13 Treatment 3 620.2 0.231 0.872
Block 4 1668.1 0.702 0.605
28 Mar. 13 Treatment 3 4545.4 1.158 0.365
Block 4 8289.7 2.262 0.123
2 Apr. 13 Treatment 3 6147.5 0.264 0.849
Block 4 21774.4 0.936 0.475
7 Apr. 13 Treatment 3 13719.9 1.159 0.365
Block 4 25948.1 2.193 0.131
12 Apr. 13 Treatment 3 11497.8 0.622 0.613
Block 4 30087.4 1.629 0.230
15 Apr. 13 Treatment 3 39300.2 0.694 0.572
Block 4 92730.5 1.639 0.228
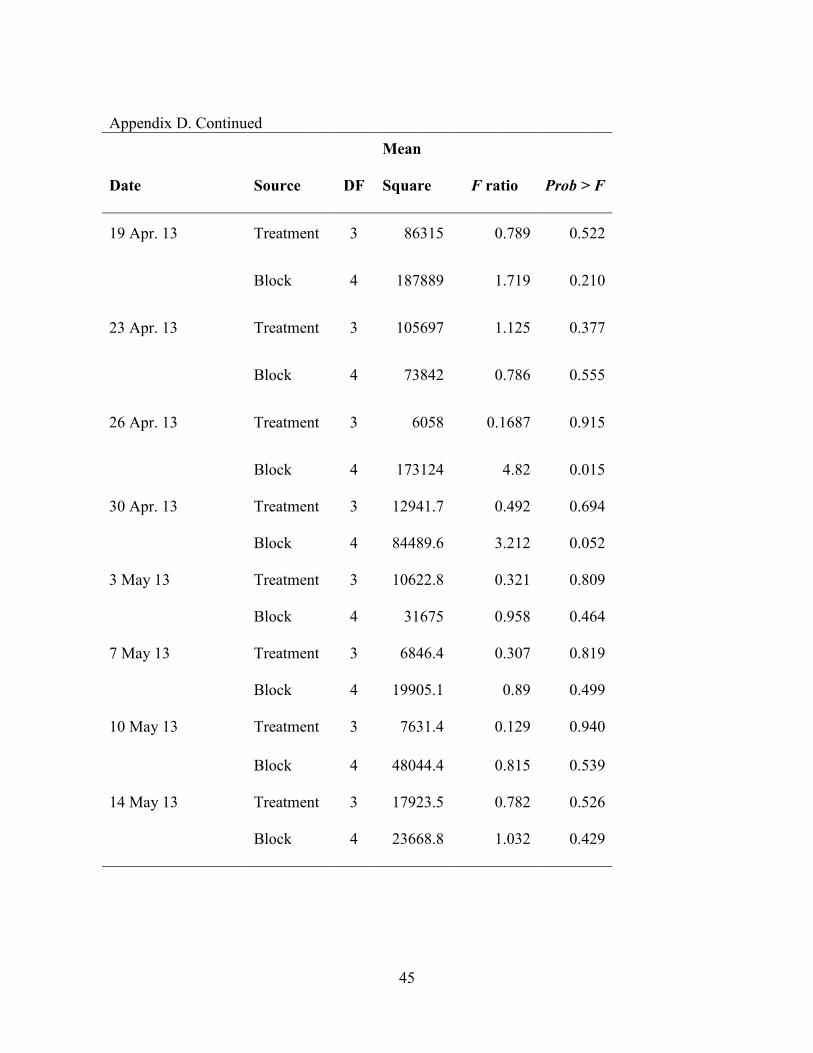
45
Appendix D. Continued
Date Source DF
Mean
Square F ratio Prob > F
19 Apr. 13 Treatment 3 86315 0.789 0.522
Block 4 187889 1.719 0.210
23 Apr. 13 Treatment 3 105697 1.125 0.377
Block 4 73842 0.786 0.555
26 Apr. 13 Treatment 3 6058 0.1687 0.915
Block 4 173124 4.82 0.015
30 Apr. 13 Treatment 3 12941.7 0.492 0.694
Block 4 84489.6 3.212 0.052
3 May 13 Treatment 3 10622.8 0.321 0.809
Block 4 31675 0.958 0.464
7 May 13 Treatment 3 6846.4 0.307 0.819
Block 4 19905.1 0.89 0.499
10 May 13 Treatment 3 7631.4 0.129 0.940
Block 4 48044.4 0.815 0.539
14 May 13 Treatment 3 17923.5 0.782 0.526
Block 4 23668.8 1.032 0.429
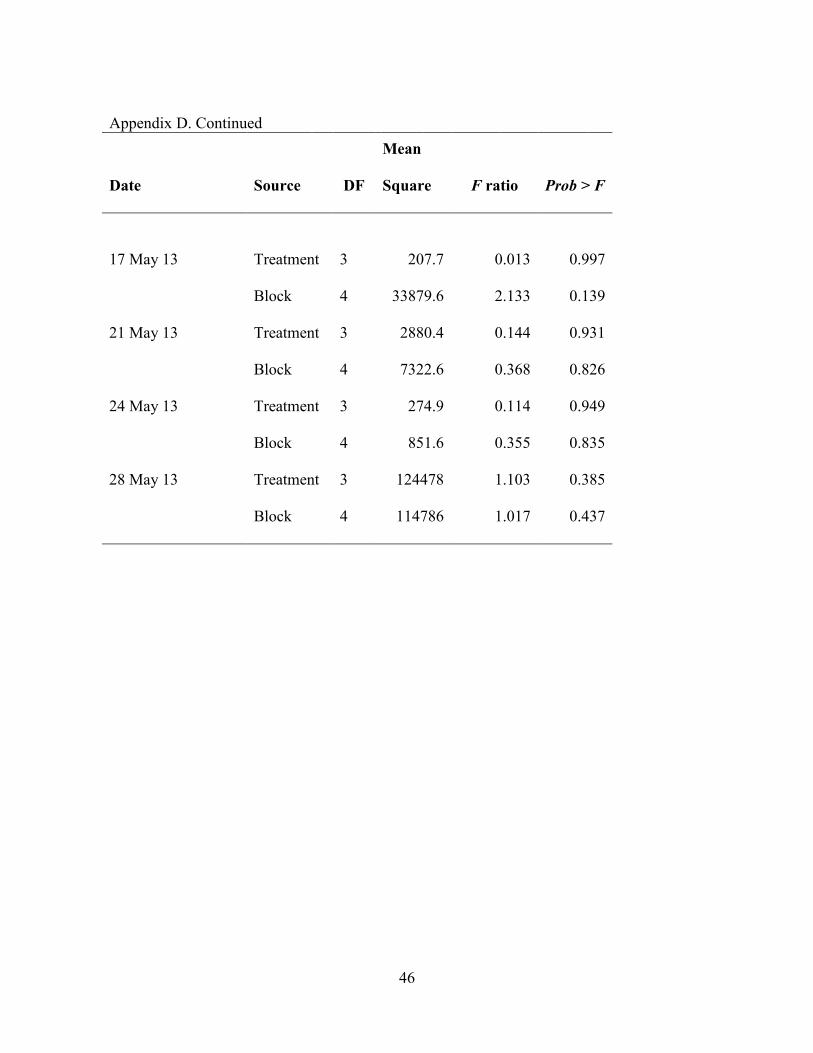
46
Appendix D. Continued
Date Source DF
Mean
Square F ratio Prob > F
17 May 13 Treatment 3 207.7 0.013 0.997
Block 4 33879.6 2.133 0.139
21 May 13 Treatment 3 2880.4 0.144 0.931
Block 4 7322.6 0.368 0.826
24 May 13 Treatment 3 274.9 0.114 0.949
Block 4 851.6 0.355 0.835
28 May 13 Treatment 3 124478 1.103 0.385
Block 4 114786 1.017 0.437

47
7.5 Appendix E
Appendix E. ANOVA results of effects of four nitrogen fertigation rates on mean number of
twospotted spider mites per strawberry cv. ‘Strawberry Festival’ leaflet in a high tunnel at
Arkansas Agricultural Research and Extension Center, Fayetteville, AR (December 2012 to
January 2013).
Date Source DF
Mean
Square F ratio
Prob >
F
12 Dec. 12 Treatment 3 378.423 2.058 0.125
Block 4 358.937 1.952 0.126
19 Dec. 12 Treatment 3 793.813 0.979 0.415
Block 4 837.663 1.033 0.406
30 Dec. 12 Treatment 3 3030.07 3.827 0.019
Block 4 1386.86 1.752 0.163
11 Jan. 13 Treatment 3 3539.57 4.107 0.014
Block 4 887.37 1.03 0.407
18 Jan. 13 Treatment 3 624.891 1.544 0.222
Block 4 511.535 1.264 0.304

48
7.6 Appendix F
Appendix F. ANOVA results of percentage of aphids parasitized per leaflet on strawberry cv.
‘Strawberry Festival’ as affected by four nitrogen fertigation rates (%) in a high tunnel at
Arkansas Agricultural Research and Extension Center, Fayetteville, AR (December 2012 to
April 2013).
Date
Canopy
position Source DF
Mean
Square F ratio
Prob >
F
12 Dec. 12 Lower Treatment 3 5.960 0.884 0.477
Block 4 2.325 0.345 0.843
Upper Treatment 3 0.249 0.767 0.534
Block 4 0.147 0.452 0.770
19 Dec. 12 Lower Treatment 3 7.011 0.736 0.551
Block 4 18.330 1.924 0.171
Upper Treatment 3 0.454 1.965 0.173
Block 4 0.553 2.396 0.108
30 Dec. 12 Lower Treatment 3 9.200 3.380 0.054
Block 4 5.904 2.169 0.134
Upper Treatment 3 0.422 0.489 0.697
Block 4 0.562 0.652 0.637
11 Jan. 13 Lower Treatment 3 51.556 2.657 0.096
Block 4 32.642 1.682 0.218
Upper Treatment 3 1.673 2.099 0.154
Block 4 1.636 2.053 0.151

49
Appendix F. continued
Date
Canopy
position Source DF
Mean
Square F ratio
Prob >
F
18 Jan. 13 Lower Treatment 3 7.224 0.169 0.915
Block 4 29.315 0.686 0.615
Upper Treatment 3 0.610 1.136 0.374
Block 4 1.678 3.124 0.056

50
7.7 Appendix G
Appendix G. ANOVA results of percentage of cotton aphids parasitized per leaflet on
strawberry cv. ‘Strawberry Festival’ as affected by four nitrogen fertigation rates (%) in a high
tunnel at Arkansas Agricultural Research and Extension Center, Fayetteville, AR (December
2012 to April 2013).
Date
Canopy
position Source DF
Mean
Square F ratio
Prob >
F
12 Dec. 12 Lower Treatment 3 5.960 0.884 0.477
Block 4 2.325 0.345 0.843
Upper Treatment 3 0.249 0.767 0.534
Block 4 0.147 0.452 0.770
19 Dec. 12 Lower Treatment 3 7.011 0.736 0.551
Block 4 18.330 1.924 0.171
Upper Treatment 3 0.454 1.965 0.173
Block 4 0.553 2.396 0.108
30 Dec. 12 Lower Treatment 3 9.200 3.380 0.054
Block 4 5.904 2.169 0.134
Upper Treatment 3 0.422 0.489 0.697
Block 4 0.562 0.652 0.637
11 Jan. 13 Lower Treatment 3 51.556 2.657 0.096
Block 4 32.642 1.682 0.218
Upper Treatment 3 1.673 2.099 0.154
Block 4 1.636 2.053 0.151

51
Appendix G. continued
Date
Canopy
position Source DF
Mean
Square F ratio
Prob >
F
18 Jan. 13 Lower Treatment 3 7.224 0.169 0.915
Block 4 29.315 0.686 0.615
Upper Treatment 3 0.610 1.136 0.374
Block 4 1.678 3.124 0.056

52
7.8 Appendix H
Appendix H. ANOVA results of percentage of twospotted spider mites per leaflet on strawberry
cv. ‘Radiance’ leaflet as affected by red and black plastic mulch treatments in a high tunnel at the
Arkansas Agricultural Research and Extension Center, Fayetteville AR (12 December 2012 to 18
January 2013).
Date Source DF
Mean
Square
F ratio Prob > F
19 Dec. 12 Treatment 1 25.493 1.000 0.423
Block 2 29.825 1.170 0.461
30 Dec. 12 Treatment 1 80.365 1.072 0.409
Block 2 74.950 1.000 0.500
11 Jan. 13 Treatment 1 18.730 1.151 0.396
Block 2 14.663 0.901 0.526
18 Jan. 13 Treatment 1 285.572 0.897 0.444
Block 2 318.285 1.000 0.500

53
7.9 Appendix I
Appendix I. ANOVA results of percentage of cotton aphid per leaflet on strawberry cv.
‘Radiance’ leaflet as affected by red and black plastic mulch treatments in a high tunnel at the
Arkansas Agricultural Research and Extension Center, Fayetteville AR (12 December 2012 to 18
January 2013).
Date Source DF
Mean
Square
F ratio Prob > F
19 Dec. 12 Treatment 1 6.116 0.625 0.512
Block 2 3.727 0.381 0.724
30 Dec. 12 Treatment 1 5.617 0.306 0.636
Block 2 6.912 0.377 0.727
11 Jan. 13 Treatment 1 32.118 1.560 0.338
Block 2 45.008 2.186 0.314
18 Jan. 13 Treatment 1 56.581 0.780 0.470
Block 2 195.067 2.689 0.271

54
7.10 Appendix J
Appendix J. ANOVA results of percentage of parasitized cotton aphids per leaflet on strawberry
cv. ‘Radiance’ leaflet as affected by red and black plastic mulch treatments in a high tunnel at the
Arkansas Agricultural Research and Extension Center, Fayetteville AR (12 December 2012 to 18
January 2013).
Date Source DF
Mean
Square
F ratio Prob > F
19 Dec. 12 Treatment 1 0.170 0.155 0.732
Block 2 0.520 0.476 0.678
30 Dec. 12 Treatment 1 0.680 1.306 0.372
Block 2 0.138 0.265 0.790
11 Jan. 13 Treatment 1 4.247 0.581 0.525
Block 2 3.100 0.424 0.702
18 Jan. 13 Treatment 1 4.247 0.430 0.580
Block 2 12.837 1.299 0.435