nitrification and denitrification in the activated...
TRANSCRIPT

4 NITRIFICATION AND DENITRIFICATION IN THE ACTIVATED SLUDGE PROCESS
INTRODUCTION
The deleterious effects of nitrogenous compounds on aquatic environments have long been recognized. Nitrogenous compounds can cause a significant depletion of dissolved oxygen in receiving waters, exhibit toxicity towards fish, and therefore, decrease the productivity of streams and lakes, and present a public health hazard. To preserve receiving water quality, many discharge permits for wastewater treatment plants are being revised to include restrictions on the discharge of the various nitrogen compounds. In order to meet these permit limitations, the biological processes of nitrification and denitrification are commonly employed. Nitrification is the process by which ammonia is first converted to nitrite and, finally, to nitrate. Gaseous nitrogen is produced from nitrite and nitrate during denitrification.
Prior to 1930, most wastewater treatment facilities were designed to accomplish a relatively high degree of nitrification, at least during the warmer months of the year, since highly nitrified effluents were discovered to be unsusceptible to putrefaction.
During the period from 1940 to the late 1960's, the design of wastewater treatment facilities was directed towards the removal of carbonaceous materials in terms of the biochemical oxygen demand (BOD). Designing strictly for BOD removal was favored since it could be accomplished at reduced capital and operating costs as compared to designs incorporating nitrification.
Also, during this time, environmental engineers generally dismissed the effects of unnitrified effluents on receiving waters based on the following concepts:'
151

152 Biotechnology for Waste and Wastewater Treatment
Nitrification is caused by a specific group of microorganisms, the population of which is minimal in natural waters. The reaction rate for nitrogenous oxidation is small in relation to that for carbonaceous material.
0 The oxidation of ammonia to nitrates simply converts dissolved oxygen (DO) to a form in which it is still available to aquatic organisms.
These concepts have been proven inaccurate by biologists who indicated that nitrates would not satisfy the oxygen requirements of fishes and many other aquatic fauna and by numerous river and stream investigations.
Courchaine,2 in a study of the Grand River below the Lansing, Michigan municipal wastewater treatment plant, reported that in a stream where nitrification is active, the nitrogenous oxygen demand (NOD) exerts a demand on the oxygen resources of the stream which can result in a partial depletion of the DO assets if the rate of deoxygenation exceeds the rate of stream reaeration. Therefore, it is evident that the NOD load must be considered in any program of stream improvement having as one of its objectives, the maintenance of a given level of minimum stream DO. Table 1 provides a comparison of nitrification alternatives.
FORMS OF NITROGEN
Nitrogen has the ability to exist in seven oxidation ~ t a t e s , ~ ranging from minus 3 to plus 5, and therefore, is found in many compounds. In wastewaters, nitrogen may be found in four forms: organic nitrogen, ammonia nitrogen, nitrite nitrogen, and nitrate nitrogen.
In fresh wastewater the nitrogen present is primarily combined in proteinaceous matter and urea as organic nitrogen. Decomposition by heterotrophic bacteria, known as ammonification, readily converts organic nitrogen to ammonia nitrogen.
Ammonia nitrogen may exist in aqueous solution as either ammonium ion or unionized ammonia. The relationship between the two forms is pH dependent and may be expressed in accordance with the following equation:

Nitri3cation and DenitriJcation in the Activated Sludge Process 153
NH, + H,O -+ NH,+ + OH-
At a pH greater than 7.0, the reaction is displaced to the left. Ammonium is predominant at any pH less than 7.0. Unionized or free ammonia in concentrations above 0.2 mg/l, has been shown to be fatal to several species of fish.3 In 1972, the National Academy of Sciences/ National Academy of Engineering Committee recommended that no more than 0.02 mg/l free ammonia be permitted in receiving waters to provide a margin of safety. Ammonia toxicity should not be a problem in receiving waters with pH below 8 and ammonia nitrogen concentrations less than about 1 mg/l.3
Nitrite nitrogen is unstable and easily oxidized to nitrate. It exists as an intermediate compound during the oxidation of ammonia nitrogen to nitrate nitrogen. If present in wastewater, the concentration is usually less than 1 .O mg/l. Some industrial wastes may contain nitrite nitrogen in significant concentrations.
Nitrate nitrogen is the most highly oxidized form of nitrogen. Its discharge into receiving waters from wastewater treatment plants will not result in any oxygen demand in terms of NOD. Nitrate is, however, an important nutrient for algae growth and, when present in excessive quantities, may be responsible for promoting eutrophication in streams and lakes. Thus, in certain cases, its discharge might have to be limited or prohibited to prevent excessive algae growth. In the case of potable water supplies, the maximum allowable concentration of nitrate is 10 mg/l since high concentrations (90-104 units mg/l) have been shown to cause methemoglobinemia in infants under four months old.
NITRIFYING BACTERIA
The principal organisms involved in nitrification processes are the genera Nitrosomonas and Nitrobacter. These organisms are considered to be autotrophs since they derive energy for growth and synthesis from the oxidation of inorganic nitrogen and carbon (COJ compounds, rather than from organic compounds. Both of these groups have rather specific environmental requirements in terms of pH, temperature, and dissolved oxygen and reproduce at much slower rates than heterotrophic bacteria. Various heavy metals and organic compounds have been found to

154 Biotechnology for Waste and Wastewater Treatment
Advantages
Combined treatment of carbon
Very low effluent ammonia possible Inventory control of mixed
liquor stable due to high BOD,/TKN ratio
and ammonia in a single stage
Combined treatment of carbon
Stability not lined to secondary and ammonia in a single stage
clarifier as organisms on media
Good protection against most
Stable operation Very low effluent ammonia
toxicants
possible
Good protection against most
Stable operation Less sensitive to low
temperatures Stability not linked to
secondary clarifier as organisms on media
toxicants
Disadvantages
TABLE 1
COMPARISON OF NITRIFICATION ALTERNATIVES
System Type
Combined carbon oxidation - nitrification
Suspended growth
Attached growth
Separate stage nitrification
Suspended growth
Attached growth
No protection against toxicants
Only moderate stability of operation
Stability linked to operation of secondary clarifier for biomass return
Large reactors required in cold weather
No protection against toxicants
Only moderate stability of operation
Effluent ammonia normally 1-3 mgll (except RBD)
Cold weather operation impractical in most cases
Sludge inventory requires careful control when low BOD,AKN ratio
Stability of operation linked to operation of secondary clarifier for biomass return
processes required than for combined carbon oxidation - nitrification
1-3 mgll
processes required than for combined carbon oxidation - nitrification
Greater number of unit
Effluent ammonia normally
Greater number of unit
Nitrification and Denitrification in the Activated Sludge Process 155
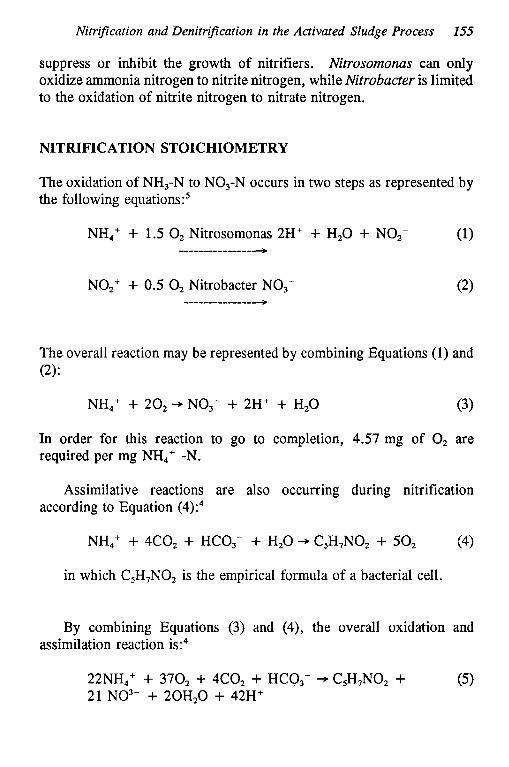
suppress or inhibit the growth of nitrifiers. Nitrosomonas can only oxidize ammonia nitrogen to nitrite nitrogen, while Nitrobacter is limited to the oxidation of nitrite nitrogen to nitrate nitrogen.
NITRIFICATION STOICHIOMETRY
The oxidation of NH,-N to NO,-N occurs in two steps as represented by the following equations?
NH,' + 1.5 0, Nitrosomonas 2H+ + H,O + NO,- (1) ------------------,
NO,+ + 0.5 0, Nitrobacter NO,- -----------------,
The overall reaction may be represented by combining Equations (1) and (2) :
NH,+ + 20, + NO3- + 2H' + H,O (3)
In order for this reaction to go to completion, 4.57 mg of 0, are required per mg NH4+ -N.
Assimilative reactions are also occurring during nitrification according to Equation (4):,
NH,' + 4 c 0 2 + HCO,- + H,O - C5H,N0, + 50 , (4)
in which C5H,N02 is the empirical formula of a bacterial cell.
By combining Equations (3) and (4), the overall oxidation and assimilation reaction is:,
22NH,+ + 370, + 4C0, + HCO,- + C,H,NO, + (5) 21 NO3- + 20H,O + 42H+
156 Biotechnology for Waste and Wastewater Treatment
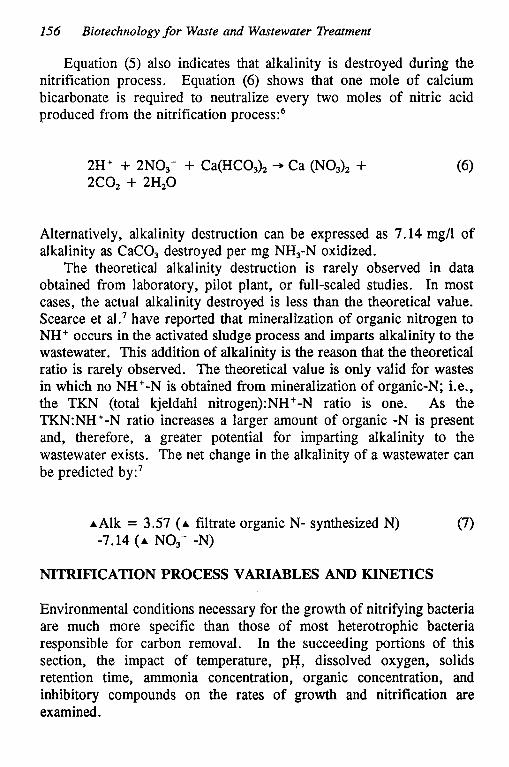
Equation (5) also indicates that alkalinity is destroyed during the nitrification process. Equation (6) shows that one mole of calcium bicarbonate is required to neutralize every two moles of nitric acid produced from the nitrification p r o c e d
2H' + 2NO,- + Ca(HCO,), -, Ca (NO,), + (6) 2C0, + 2H20
Alternatively, alkalinity destruction can be expressed as 7.14 mg/l of alkalinity as CaCO, destroyed per mg NH,-N oxidized.
The theoretical alkalinity destruction is rarely observed in data obtained from laboratory, pilot plant, or full-scaled studies. In most cases, the actual alkalinity destroyed is less than the theoretical value. Scearce et al.7 have reported that mineralization of organic nitrogen to NH' occurs in the activated sludge process and imparts alkalinity to the wastewater. This addition of alkalinity is the reason that the theoretical ratio is rarely observed. The theoretical value is only valid for wastes in which no NH'-N is obtained from mineralization of organic-N; Le., the TKN (total kjeldahl nitrogen):NH+-N ratio is one. As the TKN:NH'-N ratio increases a larger amount of organic -N is present and, therefore, a greater potential for imparting alkalinity to the wastewater exists. The net change in the alkalinity of a wastewater can be predicted by:7
A Alk = 3.57 (A filtrate organic N- synthesized N) (7) -7.14 (A NO,- -N)
NITRIFICATION PROCESS VARIABLES AND KINETICS
Environmental conditions necessary for the growth of nitrifying bacteria are much more specific than those of most heterotrophic bacteria responsible for carbon removal. In the succeeding portions of this section, the impact of temperature, pH, dissolved oxygen, solids retention time, ammonia concentration, organic concentration, and inhibitory compounds on the rates of growth and nitrification are examined.

Nitrification and Denitriication in the Activated Sludge Process 157
Ammonium Oxidation
It is widely reported in the l i terat~re~***~. l~ that the oxidation of ammonium to nitrite is a zero-order reaction with respect to ammonium concentration for concentrations down to about 1 to 5 mg/l.
The rate limiting step in nitrification is the conversion of ammonium to nitrite by Ni t ros~monas .~ .~~~'~ '~ Using the kinetic equation proposed by Monod, the growth rate of Nitrosomonas under steady-state conditions can be described a ~ : ~ ~ ~ '
where:
uN = growth rate of 9 Nitrosomonas days -' u* = maximum growth rate of Nitrosomonas, days
N = NH, + -N concentration, mg/l, and
KN = N concentration at which U, = 0.5u*, mg/l
The oxidation of NH+ -N can then be related to the Nitrosomonas growth rate as follows:
where:
q N = ammonia oxidation rate, mg NH,+-N oxidized/mg VSS/day,
Y, = organism yield coeflcient, mg VSS grown/mg NH4+-N removed,
qN8 = maximum ammonia oxidation rate, mg NH,+-N oxidized/mg VSS/day, and
KN = N concentration at which q N = 0.5 qN, mgA.
158 Biotechnology for Waste and Wastewater Treatment
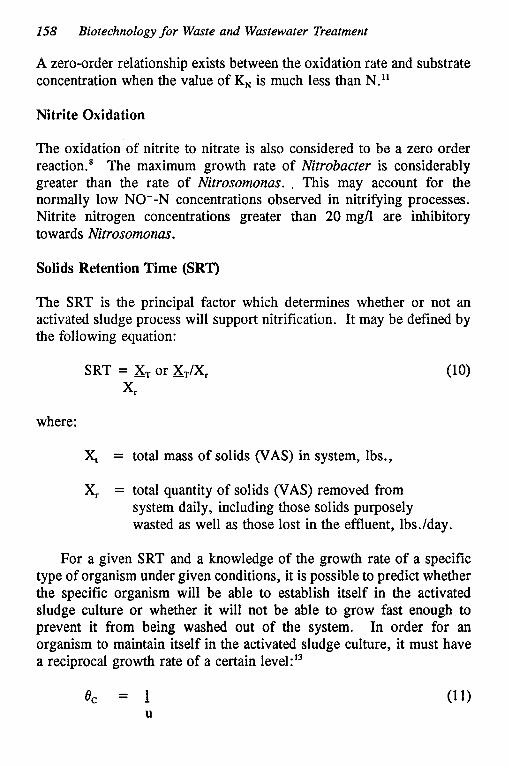
A zero-order relationship exists between the oxidation rate and substrate concentration when the vdue of K, is much less than N."
Nitrite Oxidation
The oxidation of nitrite to nitrate is also considered to be a zero order reaction.* The maximum growth rate of Nitrobacter is considerably greater than the rate of Nitrosomonas. , This may account for the normally low NO--N concentrations observed in nitrifying processes. Nitrite nitrogen concentrations greater than 20 mg/l are inhibitory towards Nitrosomonas.
Solids Retention Time (SRT)
The SRT is the principal factor which determines whether or not an activated sludge process will support nitrification. It may be defined by tRe following equation:
where:
X, = total mass of solids (VAS) in system, lbs.,
XI = total quantity of solids (VAS) removed from system daily, including those solids purposely wasted as well as those lost in the effluent, lbs./day.
For a given SRT and a knowledge of the growth rate of a specific type of organism under given conditions, it is possible to predict whether the specific organism will be able to establish itself in the activated sludge culture or whether it will not be able to grow fast enough to prevent it from being washed out of the system. In order for an organism to maintain itself in the activated sludge culture, it must have a reciprocal growth rate of a certain level:I3
e, = U

Nitrijkation and Denitrijlcation in the Activated Sludge Process 159
where: 0, = SRT, days.
Since nitrifying bacteria have lower rates than the majority of heterotroph in an activated sludge system, it is highly probable that the system will be operated with a SAT that is less than the reciprocal growth rate of the nitrifiers. In such a system, nitrification will not be possible. Therefore, if nitrification is desired, the SAT must be considered with respect to the nitrifiers rather than the heterotroph.
The minimum SAT values reported for which nitrification was observed ranged from 2 to 20 days.’”17 The variations in reported SAT values are due to several factors: temperature of wastewater, pH, DO concentration, and system type. All of these factors and their effect on the SAT are discussed in subsequent sections.
It should be noted that the choice of a design and operating value of SAT fixes only the total system biomass for a given wastewater composition and allows design tradeoffs between the aeration tank volume and the mixed liquor volatile suspended solids (MLVSS) concentration. Thus, nitrification may be achieved at short hydraulic retention times provided that the aeration tank MLVSS concentration and solids wasting policy are chosen correctly to maintain the selected SAT value.l5
Effect of Temperature on Kinetics
While nitrification occurs over a wide temperature range, reduction of temperature results in a reduction of the maximum specific growth of the nitrifying bacteria.’ Therefore, in order to maintain high levels of nitrification at temperatures below 15°C it is necessary to increase the SAT by as much as five If nitrification is desired throughout the entire year, the minimum expected temperature, and the resultant minimum specific growth rate constant must be considered in the design.’.’’ The effect of temperature on the growth rate of Nitrosomonus at any effluent ammonia nitrogen concentration can be illustrated by an equation proposed by Young et aI.:l7
160 Biotechnology for Waste and Wastewater Treatment
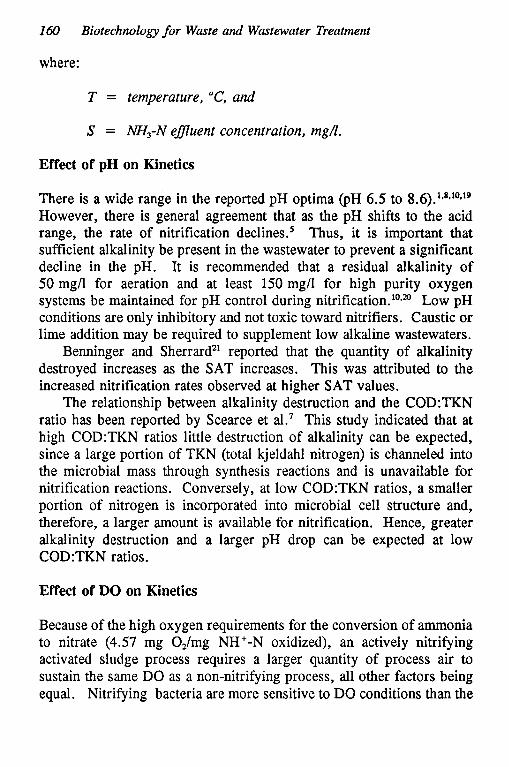
where:
T = temperature, “C, and
S = NH,-N efluent concentration, mgL.
Effect of pH on Kinetics
There is a wide range in the reported pH optima (PH 6.5 to 8.6).1*8*10*19 However, there is general agreement that as the pH shifts to the acid range, the rate of nitrification decline^.^ Thus, it is important that sufficient alkalinity be present in the wastewater to prevent a significant decline in the pH. It is recommended that a residual alkalinity of 50 mg/l for aeration and at least 150 mg/l for high purity oxygen systems be maintained for pH control during nitrification.lO*” Low pH conditions are only inhibitory and not toxic toward nitrifiers. Caustic or lime addition may be required to supplement low alkaline wastewaters.
Benninger and Sherrard’l reported that the quantity of alkalinity destroyed increases as the SAT increases. This was attributed to the increased nitrification rates observed at higher SAT values.
The relationship between alkalinity destruction and the C0D:TKN ratio has been reported by Scearce et aL7 This study indicated that at high C0D:TKN ratios little destruction of alkalinity can be expected, since a large portion of TKN (total kjeldahl nitrogen) is channeled into the microbial mass through synthesis reactions and is unavailable for nitrification reactions. Conversely, at low C0D:TKN ratios, a smaller portion of nitrogen is incorporated into microbial cell structure and, therefore, a larger amount is available for nitrification. Hence, greater alkalinity destruction and a larger pH drop can be expected at low C0D:TKN ratios.
Effect of DO on Kinetics
Because of the high oxygen requirements for the conversion of ammonia to nitrate (4.57 mg OJmg NH+-N oxidized), an actively nitrifying activated sludge process requires a larger quantity of process air to sustain the same DO as a non-nitrifying process, all other factors being equal. Nitrifying bacteria are more sensitive to DO conditions than the

Nitrijlcation and Denitrification in the Activated Sludge Process 161
majority of heterotroph found in activated sludge. Although there is disagreement in the literature as to the minimum DO concentration required for nitrification to proceed, it is generally agreed that 1.5 to 2.0 mg/l of DO are necessary for optima nitrification rates. The Monod Equation may be applied to determine the relationship between a given DO concentration and its effect on the maximum specific growth rate of the nitrifying bacteria.' Nitrification will proceed at dissolved oxygen concentrations as low as 0.2 rng/Lr2 However, the rate at which it proceeds will be significantly lower than those observed at higher concentrations of DO. Therefore, at low DO concentrations, the aeration tank detention time must be increased to permit complete nitrification. Charley et al." observed that high dissolved oxygen concentrations (38 mg/l) are not inhibitory towards nitrifiers following a brief acclimation period.
Effect of Organic Loading on Kinetics
The organic loading to the aeration tanks affects the efficiency of nitrification as the organic matter controls the growth of heter~troph.'~ High organic loads accelerate the heterotrophic growth rate and the sludge quantities produced in the system. Thus, any increase in the BOD,:TKN ratio results in a decrease of the fraction of nitrifiers present in an activated sludge system. For BOD,:TKN ratios between one and three the fraction is less than 20 percent and greater than 8 percent.'
Lawrence and Brown" reported that at a C0D:N ratio of 20: 1, the nitrogen present would be just sufficient to satisfy the nitrogen synthesis requirements of heterotroph. Thus, ammonia oxidation would not occur. However, at a C0D:N ratio of zero, all of the ammonia present would be oxidized. Within these limits, the fraction of NH,-N oxidized versus the fraction assimilated by heterotrophic growth would be a function of the growth rate of the system, since the amount of excess biomass produced is a function of the mean net specific microbial growth rate.
Wild et al.' observed no change in the nitrification rate of a laboratory scale reactor when subjected to instantaneous increases or decreases on BOD concentrations from 50 to 5 mg/l or 50 to 100 mg/l. The author did state, however, that a change in the average BOD concentration of the feed would affect that percentage of MLVSS that is composed of nitrifiers and, consequently, the rate of nitrification.
162 Biotechnology for Waste and Wastewater Treatment
Figure 1 illustrates pretreatment alternatives for separate stage nitrification.
Inhibition of Nitrification
Hockenbury and GradyB reported that aniline, ethylenediamine, hexamethylenediamine, and monoethanolamine were industrially significant organic chemicals capable of inhibiting ammonia oxidation by Nitrosomonas. In a subsequent study by Joel and Grady,” it was determined that at a solids retention time of seven days significant degradation of aniline occurs, thus removing its inhibitory effect toward nitrification.
Laboratory investigations performed by Beckman et al.I9 indicated that slug doses of copper and chromium at concentrations of 1.0 mg/l or less did not retard nitrification. Slug doses of zinc and nickel at concentrations less than 0.5 mg/l reduced the rate of nitrification. Complete inhibition of nitrification was not observed with zinc and nickel concentrations as high as 3.0 mg/l. Effects of other heavy metals were not reported in the literature examined.
Hockenbury et al.z concluded from laboratory studies on domestic and industrial wastes that heterotrophic bacteria do not exert an antagonistic effect on nitrifying organisms, but could in fact stimulate nitrification rates by the release of their, metabolic products into the surrounding medium. He also reported that, in the absence of specific inhibitors, the failure for nitrification to proceed at the head-end of an activated sludge basin is due to the operational characteristics or environmental conditions (low pH and/or DO) of the system, rather than to the presence of organic compounds or active heterotroph in the system.
Shock organic loads to nitrifying sludges have been known to inhibit nitrification. Reinhart% observed an increase in MLVSS concentration and reduced nitrification rates following a peak in the BOD, influent concentration. Severe oil and grease loadings were causing sudden increases in the organic load to the pilot plant resulting in nitrification inhibition. Stover et al.27 reported a similar response to sudden increases in the influent COD. This study concluded that as a result of the abrupt COD increase and subsequent accelerating heterotrophic growth rates, an intermediate by-product is excreted by heterotroph having an inhibitory effect on nitrifiers.

NitriJcation and D
enitrijication in the Activated Sludge Process
163
L
I-
4

I64 Biotechnology for Waste and Wastewater Treatment
Unionized ammonia (free ammonia, NH,, FA) and unionized nitrous acid (free nitrous acid, HNO,, FNA) can also inhibit nitrification. Studies by Anthonisen et a1.2* indicated that FA inhibited Nitrobacter at concentrations substantially lower than those that inhibited Nitrosomonas (0.1 - 1 .O mg/l for Nitrobacter). The ranges of FNA concentrations that begin to inhibit nitrifying organisms are between 0.22 - 2.8 mg/l. When nitrification is incomplete or will not begin, the possibility of inhibition should be investigated by determining the FA and FNA concentrations and comparing them to the above ranges. Inhibition by FA or FNA is not permanent and may be removed by adjusting operational conditions. Dilution, pH adjustment, and denitrification will reduce inhibitory concentrations of FA and FNA.
Neufeld et al.29 examined the effect of phenol on nitrifying cultures in a laboratory fill and draw system. Concentrations of 0 - 75 mg/l of phenol were found to cause progressive inhibition of ammonia oxidation by Nitrosomonas.
DENITRIFICATION
Denitrification is a process by which certain species of bacteria under anoxic conditions reduce nitrate nitrogen to the gaseous end-products of N,, NO, or N,O which can then escape from solution to the atmosphere. Unlike other nitrogen compounds, the gaseous forms of nitrogen are relatively unavailable for biological growth and have no significant effect on environmental quality. The presence of oxidized nitrogen and organic carbon are important requisites for denitrification to proceed.
DENITRIFYING BACTERIA
Unlike the autotrophic nitrifying bacteria responsible for nitrification, denitrifying bacteria are composed of ubiquitous, heterotrophic organisms. The most common denitrifying bacteria are Bacillus denitrijicans, Micrococcus denitrijicans, Pseudomonas stutzeri, and Achrornobacter S P . ~ In the absence of molecular oxygen, these organisms use nitrate or nitrite as terminal electron acceptors, while oxidizing organic matter for energy. This metabolic process, termed nitrate dissimilation, results in the eventual reduction of nitrate to
Nitrification and Denitrijication in the Activated Sludge Process 165
nitrogen gas. At DO concentrations greater than approximately 0.5 mg/l, oxygen will be more readily utilized as the final electron acceptor than nitrates by the above named organi~rns.~' Thus, denitrification will be inhibited when the DO concentration exceeds 0.5 mg/l.
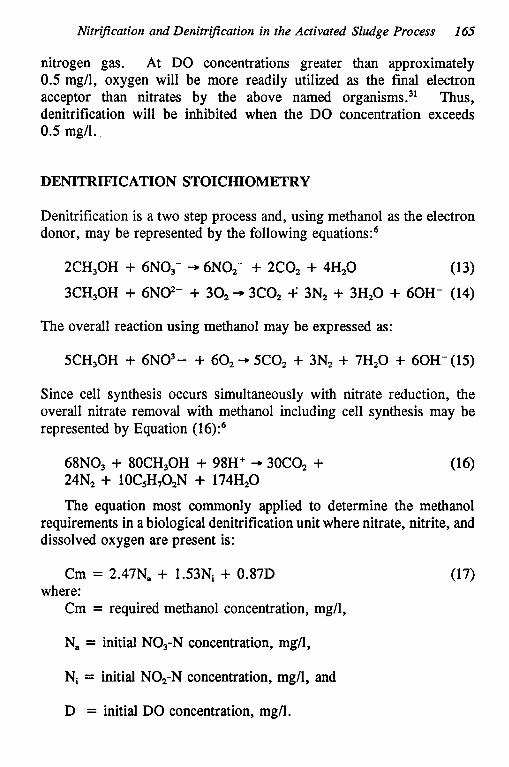
DENITRIFTCATION STOICHIOMETRY
Denitrification is a two step process and, using methanol as the electron donor, may be represented by the following equations:6
2CH30H + 6N03- -, 6NOz- + 2C0, + 4Hz0 (13) 3CH30H + 6N@- + 30, -, 3co2 -P 3N2 + 3Hz0 + 60H- (14)
The overall reaction using methanol may be expressed as:
5CH,OH + 6N03- + 60, --. 5Coz + 3Nz + 7Hz0 + 60H-(15)
Since cell synthesis occurs simultaneously with nitrate reduction, the overall nitrate removal with methanol including cell synthesis may be represented by Equation (16)?
68N03 + 80CH30H + 98H' + 3oco2 + 24Nz + 10C,H,OzN + 174H,O
The equation most commonly applied to determine the methanol requirements in a biological denitrification unit where nitrate, nitrite, and dissolved oxygen are present is:
Cm = 2.47Na + 1.53Ni + 0.87D
Cm = required methanol concentration, mg/l, where:
Na = initial NO3-N concentration, mg/l,
Ni = initial NOz-N concentration, mg/l, and
D = initial DO concentration, mg/l.
166 Biotechnology for Waste and Wastewater Treatment
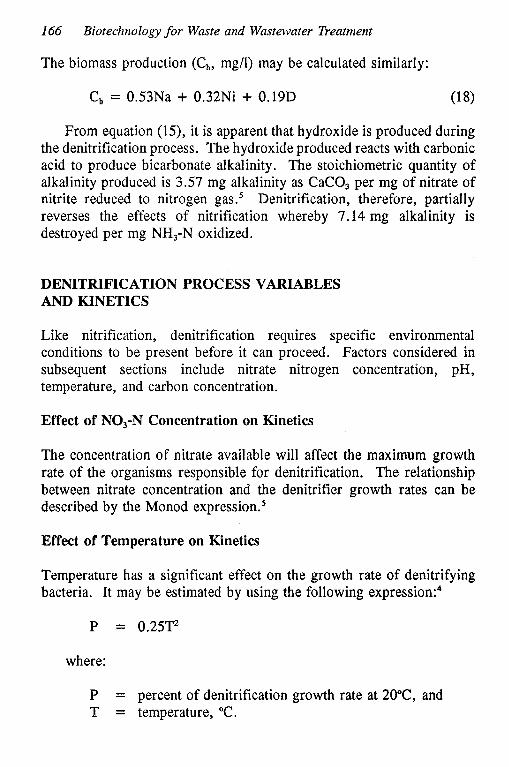
The biomass production (Cb, mg/l) may be calculated similarly:
c b = 0.53Na + 0.32Ni + 0.19D (1 8)
From equation (15), it is apparent that hydroxide is produced during the denitrification process. The hydroxide produced reacts with carbonic acid to produce bicarbonate alkalinity. The stoichiometric quantity of alkalinity produced is 3.57 mg alkalinity as CaCO, per mg of nitrate of nitrite reduced to nitrogen gas.5 Denitrification, therefore, partially reverses the effects of nitrification whereby 7.14 mg alkalinity is destroyed per mg NH,-N oxidized.
DENITRIFICATION PROCESS VARIABLES AND KINETICS
Like nitrification, denitrification requires specific environmental conditions to be present before it can proceed. Factors considered in subsequent sections include nitrate nitrogen concentration, pH, temperature, and carbon concentration.
Effect of NO,-N Concentration on Kinetics
The concentration of nitrate available will affect the maximum growth rate of the organisms responsible for denitrification. The relationship between nitrate concentration and the denitrifier growth rates can be described by the Monod expre~sion.~
Effect of Temperature on Kinetics
Temperature has a significant effect on the growth rate of denitrifying bacteria. It may be estimated by using the following ex~ression:~
P = 0.25T2
where:
P = percent of denitrification growth rate at 20"C, and T = temperature, "C.
Nitrijication and DenitrijZation in the Activated Sludge Process 167
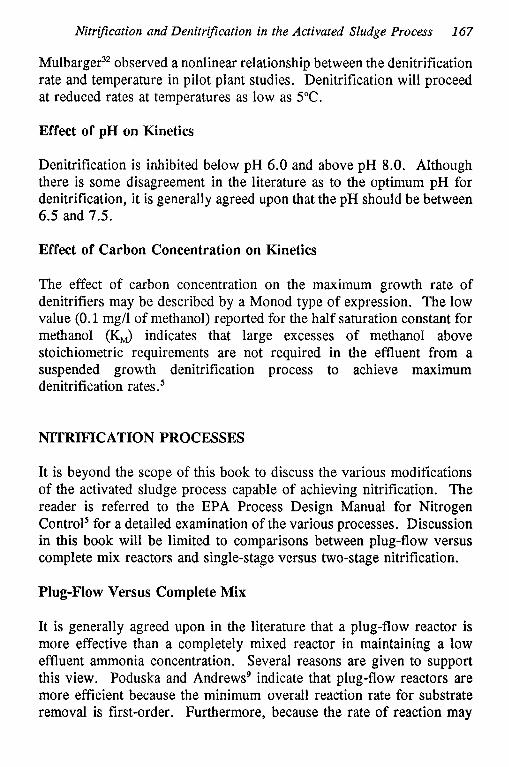
M ~ l b a r g e r ~ ~ observed a nonlinear relationship between the denitrification rate and temperature in pilot plant studies. Denitrification will proceed at reduced rates at temperatures as low as 5°C.
Effect of pH on Kinetics
Denitrification is inhibited below pH 6.0 and above pH 8.0. Although there is some disagreement in the literature as to the optimum pH for denitrification, it is generally agreed upon that the pH should be between 6.5 and 7.5.
Effect of Carbon Concentration on Kinetics
The effect of carbon concentration on the maximum growth rate of denitrifiers may be described by a Monod type of expression. The low value (0.1 mg/l of methanol) reported for the half saturation constant for methanol (KJ indicates that large excesses of methanol above stoichiometric requirements are not required in the effluent from a suspended growth denitrification process to achieve maximum denitrification rates.’
NITRIFICATION PROCESSES
It is beyond the scope of this book to discuss the various modifications of the activated sludge process capable of achieving nitrification. The reader is referred to the EPA Process Design Manual for Nitrogen Control’ for a detailed examination of the various processes. Discussion in this book will be limited to comparisons between plug-flow versus complete mix reactors and single-stage versus two-stage nitrification.
Plug-Flow Versus Complete Mix
It is generally agreed upon in the literature that a plug-flow reactor is more effective than a completely mixed reactor in maintaining a low effluent ammonia concentration. Several reasons are given to support this view. Poduska and Andrewsg indicate that plug-flow reactors are more efficient because the minimum overall reaction rate for substrate removal is first-order. Furthermore, because the rate of reaction may

168 Biotechnology for Waste and Wastewater Treatment
vary, the plug-flow reactor may offer an additional advantage in that the reaction order will increase through the length of the reactor as the substrate concentration decreases to less than 2 mg/l of NH+-N. The completely mixed reactor is limited in this regard because it operates a homogeneous unit in which the reaction rate is uniform throughout the reactor. The same authors also observed that a plug-flow system was also better suited to handled pulses of toxic materials. A short toxic pulse can pass through a plug-flow system, contacting only a small fraction of the nitrifying organisms. However, in a completely mixed reactor, a toxic material will be distributed instantaneously so that it contacts almost all of the organisms. Sawyer et al." suggests that because the rate of oxidation of ammonia is essentially linear (zero-order reaction), short circuiting must be prevented by ensuring plug-flow conditions are present throughout the reactor. This is best accomplished by dividing the tank into a series of compartments (minimum of three) with ports between them.
Singlestage Versus Two-Stage Systems
The current design considerations for activated sludge systems in which both BOD and NH,-N removal is desired, center on whether the removal of both pollutants will be carried out in a single reactor (single-stage nitrification) containing both heterotrophic and autotrophic microorganisms or in two separate reactors (two-stage nitrification) in which separate and distinct heterotrophic and autotrophic populations are maintained. In two-stage nitrification, BOD removal is accomplished in a high rate activated sludge basin prior to the nitrification reactor. An intermediate clarifier between the two reactors prevents the high rate and nitrifying sludges from being mixed together. In the subsequent section, it will be seen that the selection of either system must be done on a case by case basis and will depend upon such things as the amount of ammonia removal desired, seasonal requirements, cost, and land avail ability .
MulbargeP concluded that the separate sludge system with isolated, optimized sludge cultures was preferred over single-stage systems for nitrification. It was observed that mixed BOD removal and nitrification resulted in a loss of soluble carbon removal efficiency, longer aeration times for nitrification, and a loss of nitrogen removal caused by sludge synthesis. Barth et al.33 indicated that the separation of carbonaceous

Nitrijkation and Denitrijkation in the Activated Sludge Process 169
removal and cellular synthesis from nitrification was necessary to prevent the loss of nitrifiers by washout from sludge wasting. In a separate stage, the nitrification biomass becomes an enriched culture of nitrifiers, the population of which is limited only by the ammonia concentration.
Bench-scale studies by Stover et al.16 demonstrated that higher SAT values are required in single-stage systems to achieve comparable nitrification rates and levels of ammonia removal as in two-stage systems. A single-stage reactor with short hydraulic retention times may be unable to maintain the necessary SAT for nitrification. The maximum permissible MLSS concentration in the reactor will be determined by the solids loading rate to the secondary clarifiers. Clarifier upsets resulting in the escape of activated sludge solids to the effluent are detrimental to nitrification since they effectively increase the sludge wasting rate, thereby decreasing the SAT.
The seasonal variation in the temperature of the wastewater is another factor which should be considered before selecting the appropriate type of system. Many engineers feel that, in order to accomplish nitrification, a separate two-stage system is a mandatory requirement in northern climates where wastewater temperatures fall below 18°C. It is believed that since the sludge in the separate nitrification reactor has a significant nitrifier population, nitrification would not be as temperature sensitive as in a sludge with a marginal population. Bench-scale studies by Lawrence and Brown" failed to show any significant difference between the performance of both systems when operated at temperatures of 8°C and 20°C. In both systems, ammonia breakthroughs in the effluent did occur with significant increases in the ammonia mass loading at 8°C. Young et al.17 reported that due to the poor sludge settleability observed at wastewater temperatures less than 15"C, application of the two-stage system is favored at reduced temperatures. A higher percentage of nitrifiers can be maintained in the nitrification stage of the two-stage system than in the single-stage system and nitrification can be achieved with a lower concentration of MLSS in the nitrification reactor.
Two-stage nitrification provides protection from toxic substances and shock organic loads which inhibit nitrification.% Before reaching the second stage intrification reactor, most of the toxics, if biodegradable, and organic materials will be oxidized in the first reactor. Also heavy metals may precipitate or be absorbed by the sludge in the first stage, thus causing no harm to the nitrifiers. However, as Lawrence and

170 Biotechnology for Waste and Wastewater Treatment
Brown" point out, toxic materials might be excluded from wastewater systems by regulation rather than by relying on a "sacrificial" biosystem. Also, if phosphorous removal is required in addition to nitrification and coagulants are used prior to aeration, heavy metals will be removed in addition to the phosphorous.
In spite of the seemingly negative attributes of single-stage nitrification, it has been demonstrated to be a viable means of accomplishing nitrifi~ation'~. 15~17~19p35 and to have certain advantages over two-stage systems. Lawrence and Brown" take issue with the claim that two-stage systems have more positive control capabilities. They point out that the use of the SRT concept and controlled sludge wasting make the single-sludge system as controllable as the two-stage system. In the two-stage system, due to the low MLSS concentration in the nitrification reactor, poor solids separation can occur in the clarifier. This may necessitate the wasting of first stage solids into the nitrification reactor or the use of coagulants at increased operating costs. The additional clarifier required in the two-stage system results in the increased possibility of failure. Finally, because of the higher levels of sludge production and, consequently, the increased demand on sludge disposal processes, plus the additional reactor, clarifier, and land requirements, two-stage nitrification systems will have higher capital and operating costs than comparable single-stage systems.% Thus, it is essential that comprehensive studies of a facility be performed before selecting one of the processes. Figure 2 ilustrates a nitrification-denitrification flow sheet utilizing low porosity fine media in columns. Figure 3 shows a process schematic for submerged high porosity media columns.
DENITRIFICATION PROCESSES
The discussion of denitrification processes will focus on the kind of carbon source applied to the denitrification reactor. Additional consideration will be given to the various combinations of nitrification and denitrification processes reported in the literature.
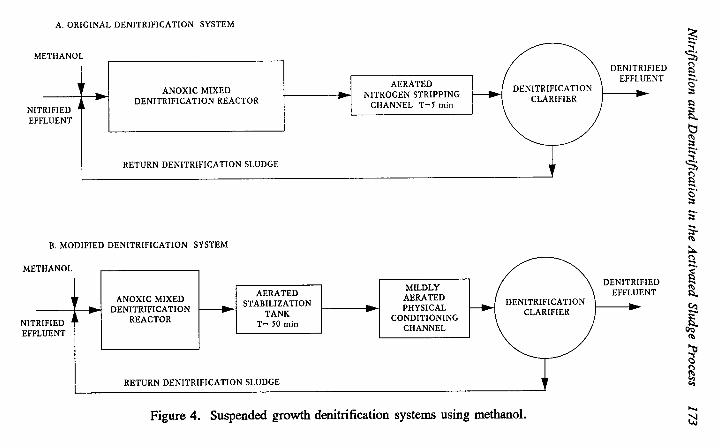
Denitrification Using Methanol as the Carbon Source
Denitrification processes utilizing methanol are most commonly applied following a nitrification system. Refer to Figure 4. The denitrification

Nitrijkation and D
enitrification in the Activated Sludge Process
171
172 Biotechnology for Waste and Wastewater Treatment
- I-
BACKWASH WATER TO STORAGE
DENITRIFTCATION COLUMN
DUMPED MEDIA - (TYPICAL)
J-4 ll EFFLUENT TO CLARIFICATION OR FILTRATION
r f
DENITRIFICATION COLUMN
CLARIFIED BACKWASH
WATER
METHANOL
INFLUENT 7 3 3 BACKWASH P U M P
PUMP
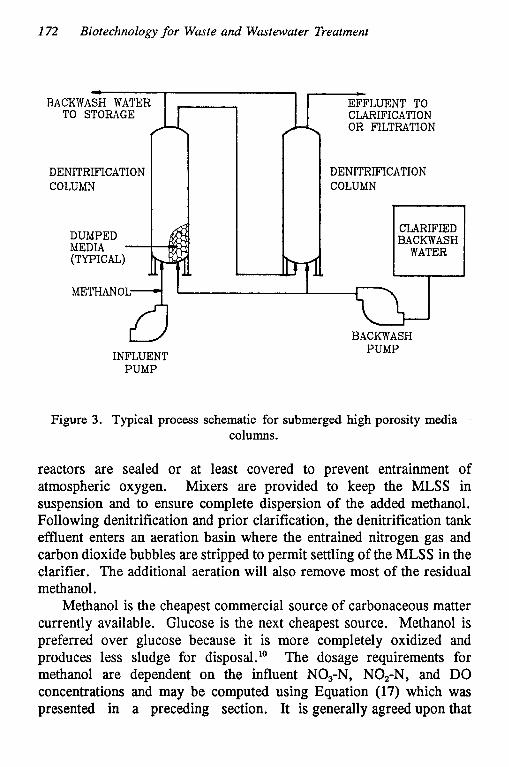
Figure 3. Typical process schematic for submerged high porosity media columns.
reactors are sealed or at least covered to prevent entrainment of atmospheric oxygen. Mixers are provided to keep the MLSS in suspension and to ensure complete dispersion of the added methanol. Following denitrification and prior clarification, the denitrification tank effluent enters an aeration basin where the entrained nitrogen gas and carbon dioxide bubbles are stripped to permit settling of the MLSS in the clarifier. The additional aeration will also remove most of the residual methanol.
Methanol is the cheapest commercial source of carbonaceous matter currently available. Glucose is the next cheapest source. Methanol is preferred over glucose because it is more completely oxidized and produces less sludge for disposal." The dosage requirements for methanol are dependent on the influent NO,-N, NO,-N, and DO concentrations and may be computed using Equation (17) which was presented in a preceding section. It is generally agreed upon that
Nitrification and D
enitrification in the Activated Sludge Process
173
w 0
3
z n
d E d B
E
n e: z W
5 t; 3
e:
z c 0 b
L
d e:
z w
CI
w 0
3
z n
d E 3 2 E b
E
e: E K
174 Biotechnology for Waste and Wastewater Treatment
3-4 parts parts of methanol are required per part of NO3-N for efficient denitrification. If sufficient methanol is not added to the system, the NO3-N is mostly converted to NOz-N.33 Since excess methanol will appear in the effluent as BOD, automated methanol addition as a function of the mass flow of NO3-N will maximize the efficiency of denitrification systems. According to Sherrard et al.37 methanol requirements decrease as the SRT is increased due to a reduction in the net sludge production. Increased methanol dosages are required at higher temperatures at a constant SRT.
Denitrification Using Organic Matter Resent in Raw Wastewater
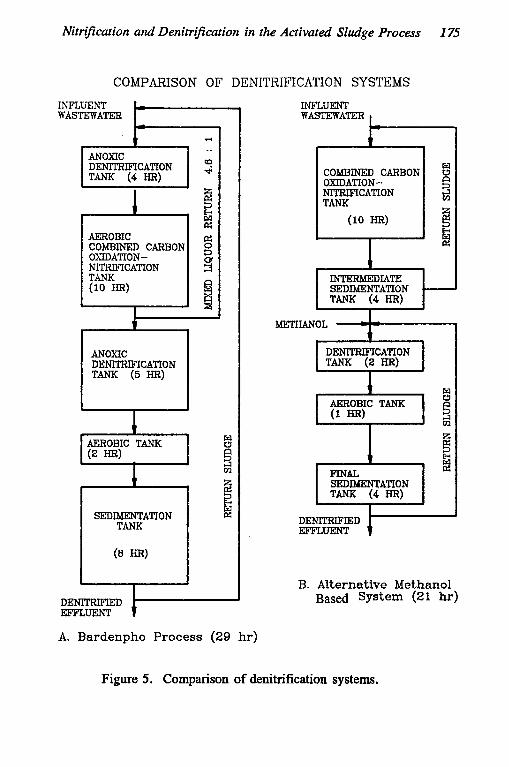
Lower denitrification rates may be expected when oxidizable organic substances in raw wastewater are substituted for methanol. More importantly, when domestic sewage is applied as the organic carbon source in the flow scheme described in the preceding section for methanol, increased NH3-N levels are observed in the effluent. Any ammonia present in the sewage will pass through the denitrification system essentially unaltered. However, because of the operating expense associated with methanol addition, flow schemes have been devised to permit the use of organics derived from wastewater while preventing ammonia bleedthrough in the effluent. A brief discussion of these processes follows. A comparison of denitrification processes is shown in Figure 5.
In a one-sludge predenitrification and nitrification process, denitrification is accomplished in the anoxic first stage with the organics present in the raw wastewater being utilized as electron donors for nitrate reduction. The conversion of ammonia to nitrate and the oxidation of any biodegradable organics not removed in the first stage is accomplished in the aerobic second stage. In this type of system, both sludge and mixed liquor are recycled. Sludge recycling is to maintain a desired level of MLVSS concentration3* and mixed liquor recycling is required to produce a final effluent which has a low residual nitrate c~ncentration.~~ The low BOD concentration in the denitrification effluent prevents high organic loadings to the aerobic second stage, thus providing optimal conditions for nitrification." The lower organic
Nitrification and Denitri@cation in the Activated Sludge Process 175
SEDIMENTATION TANK
(8 HR)
-
COMPARISON OF DENITRIFICATION SYSTEMS
i? w !x
INFm'ENT "ASTEWATER
P DENITRIFICATION ANOXIC I TANK (4HR)
I I
AEROBIC
OMDATION- NITRIFICATION
ANOMC DENITRIFICATION TANK ( 5 H R )
1
INFLUENT WASEXATEX I .-
COMBINED CARBON 8 OXIDATION- NITRLFICATION
ITANK , 1 (10 HR)
z
SEDIMENTATION TANK (4 HR)
METHANOL I- 1
DENITRIFICATION TANK ( Z H R )
I 3 AEROBIC TANK (1 HR) I 1 s rn
SEDIMENTATION TANK (4 HR)
DENITRIFIED 1- EFFLUENT
B. Alternative Methanol Based System (21 h)
Figure 5. Comparison of denitrification systems.

176 Biotechnology for Waste and Wastewater Treatment
loadings also result in decreased oxygen transfer requirements for the aerated bashs The feasibility of one-sludge predenitrification systems has been demonstrated in pilot-planel and full-scale studies." Reduced capital costs are also realized in predenitrification systems since primary clarification as well as intermediate clarification may be eliminated. This savings, however, is partially offset by increased volumes required for the nitrification and denitrification basins. Another process variation utilizing the indigenous organic carbon material in wastewater for denitrification involves the utilization of alternating periods or zones of aerobic and anoxic conditions. Nitrification readily proceeds during the aerobic phase, while denitrification occurs during the anoxic phase. Oxidation of carbonaceous material will occur during both phases. According to Bishop et al.," the application of such processes results in: a reduction in the volume of air required for nitrification and BOD removal; minimization or elimination of methanol for denitrification; substantial nitrogen removal achieved without special recycle of the mixed liquor; and elimination of intermediate and primary clarification. This kind of process has been successfully demonstrated in both pilot- plant'" and full-scalea*" operations.
Denitrification Using Thiosulfate and Sulfide
The rising costs and increasing scarcity of methanol and similar organic compounds make it increasingly undesirable to use them as chemical additives. Thus, it is advantageous to develop denitrification processes which do not involve organic supplements.
7hiobaciZZus denirrijkans is a species of autotrophic bacteria capable of oxidizing sulfur and sulfur compounds while reducing nitrate to free nitrogen gas. Lab-scale studies by Biscogni and Driscoll,46 indicated that reliable autotrophic denitrification could be obtained using thiosulfate and/or sulfide as electron donors for T. denitrifcans in a completely mixed suspended growth system. Further study in this area should be applied to a full-scale system to determine its feasibility in terms of chemical requirements and costs.

Nitrification and Denitrijkation in the Activated Sludge Process 177
SUMMARY AND CONCLUSIONS
Significant quantities of data and a variety of process alternatives have been generated for nitrification and denitrification activated sludge systems during the past decade. The selection of an appropriate nitrification process will depend upon the following factors:
System classification - upgrade or new. Permit limitations - seasonal or continuous. Lowest expected wastewater temperatures. Inclusion of phosphorous removal. Frequency of shock organic loads. Presence of inhibitors from industrial discharges. Land availability. Costs - capital, operating, and maintenance.
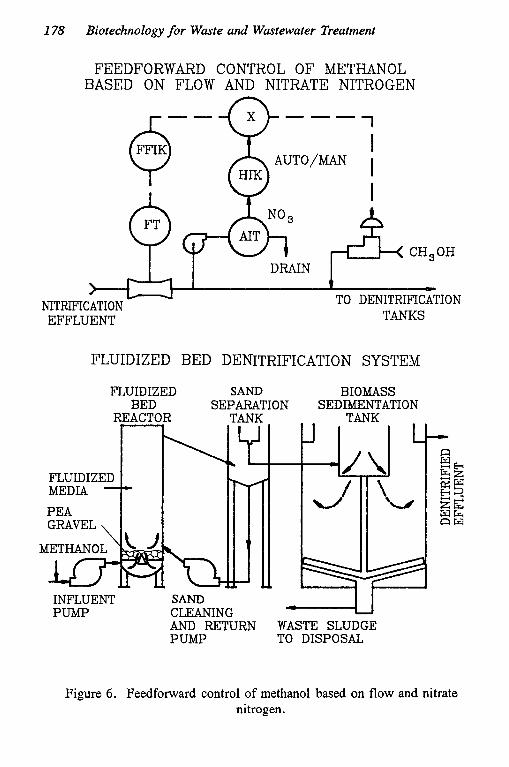
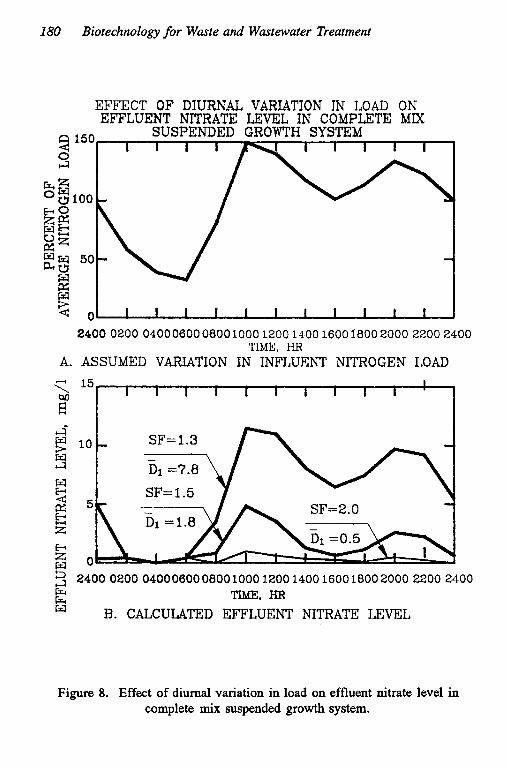
The selection of a denitrification process will be influenced by the kind of nitrification process chosen. If i t is determined that two-stage nitrification is required then, most likely, the denitrification process will follow the nitrification stage and utilize methanol as the carbon source. Conversely, if single-stage nitrification is acceptable, the denitrification process may be incorporated into the combined carbon oxidation- nitrification reactor and utilize the organic carbon compounds present in the raw wastewater. Alternating anoxic and aerobic periods are required in this kind of combined system. A separate pre-denitrification process may also be used in conjunction with single-stage nitrification. Pre- denitrification one-sludge systems have lower oxygen, methanol, and lime requirements than for similar two-sludge post-denitrification processes and, consequently, reduced operating and capital costs. Figure 6 shows a feedforward control of methanol based on flow and nitrate nitrogen. Figure 7 shows the effect of safety factor on effluent nitrate level in suspended growth systems. Figure 8 shows the effect of diurnal variation in load on effluent nitrate level in complete mix suspended growth systems. Figure 9 shows the endless channel system for nitrogen removal. Figures 10 and 11 illustrate various nitrification systems.
178 Biotechnology for Waste and Wastewater Treatment
FEEDFORWARD CONTROL O F METHANOL BASED ON FLOW AND NITRATE NITROGEN
CH,OH
t >
TO DENITRIFICATION TANKS
NITRIFICATION EFFLUENT
FLUIDIZED BED DENITRIFICATION SYSTEM
FLUIDIZED SAND BIOMASS BED SEPARATION
REACTOR TANK
INFLUENT PUMP
SEDIMENTATION TANK
4 \ I \ u u
c
SAND CLEANING AND RETURN WASTE SLUDGE P U M P TO DISPOSAL
Figure 6 . Feedforward control of methanol based on flow and nitrate nitrogen.

Nitrij?cation and Denitrification in the Activated Sludge Process 179
2.0
2 E
2
!2
2 1.5 I
k l
P=
z
E 0.5
0
E 1.0
crr crr w
EFFECT FOR FACTOR ON EFFLUENT NITRATE LEVEL IN SUSPENDED GROWTH SYSTEM
1.0
when: Do =
bo - Dl - E l - Q - a - - cD
L
pD -
2.0 SAFETY FACTOR, SF
influent nitrate -N level at any time, m d ,
mas a m p influent nitrate -N Iml over 24 houn, m d . mu, average effluent nitrate -N level at any time, mfl.
mass average effluent nilntc -N h-I mu 24 hwn. rng/t,
Influent flow rate at any time,
avenge ddly lnnuent flow rate,
d d m dedtdller powth rate. dry-', and
mrxlmum dmltrlfler growth n l a , dry".
3.0
Figure 7. Effect of safety factor on effluent nitrate level in suspended growth system.
180 Biotechnology for Waste and Wastewater Treatment
A
EFFECT OF DIURNAL VARIATION IN LOAD ON EFFLUENT NITRATE LEVEL IN COMPLETE MIX
SUSPENDED GROWTH SYSTEM
2400 0200 0400060008001000 1200 1400 1600 1800 2000 2200 2400 TIME, HR
A. ASSUMED VARIATION IN INFLUENT NITROGEN LOAD
SUSPENDED GROWTH SYSTEM 150
0 I I i 1 I I I I I I I J
2400 0200 0400060008001000 1200 1400 1600 1800 2000 2200 2400 TIME, HR
. ASSUMED VARIATION IN INFLUENT NITROGEN LOAD
E E k z 2 2400 0200 04000600 0800 1000 1200 1400 1600 1800 2000 2200 2400 E4 E4 TIME, HR
B. CALCULATED EFFLUENT NITRATE LEVEL
Figure 8. Effect of diurnal variation in load on effluent nitrate level in complete mix suspended growth system.

Nitri3cation and D
enitrijkation in the Activated Sludge Process
181
a .I L t
n
--
e

182 Biotechnology for Waste and Wastewater Treatment
ATTF SYSTEM FOR NITROGEN AND PHOSPHORUS REMOVAL
RAW WASTEWATER
POLYMER OR FERRIC CHLORIDE
PRIMARY SLUDGE TO SEDIMEEPTATON TANK SOLIDS
CHEMICAL C O a
- w PROCESSMG
ATR OXIDATION-
NlTRIFICATION TANK SLUDGE
SECONDARY WASTE SLUDGE SEDIMENTATION TANK TO
R A W WASTEWATER
DENITRIPICATON MWNG
I REmw SLUDGE
AERATED STABILIZATON TANK
I
WASTE SLUDGE
RAW WASTEWATER SEDIMENTATION TANK
Figure 10. A'ITF system for nitrogen and phosphorus removal.

Nitrification and D
enitrification in the Activated Sludge Process
183
184
REFERENCES
Biotechnology for Waste and Wastewater Treatment
1 .
2.
3.
4.
5.
6.
7.
8.
9.
10.
1 1 .
Wild, H.E., et al. "Factors Affecting Nitrification Kinetics," Jour. Water Poll. Control Fed., 1971, (43), 1845.
Courchaine, R. J. "Significance of Nitrification in Stream Analysis - Effects on the Oxygen Balance," Jour. Water Poll. Control Fed., 1968, (40), 835.
Sawyer, C.N., and P.L. McCarty. Chemistry for Environmental Engineering. New York: McGraw-Hill Inc., 1978.
Metcalf and Eddy, Inc. Wastewater Engineering: Treatment, Dis- posal, Reuse. New York: McGraw-Hill Inc., 1979.
U.S. EPA, "Process Design Manual for Nitrogen Control," Office of Technology Transfer, Wash. D.C., 1975.
Wang, L.K., et al. "Chemistry of Nitrification-Denitrification Process," Jour. of Env. Sci., 1978, (21) #6, 23.
Scearce, S.N., et al. "Prediction of Alkalinity Changes in the Activated Sludge Process," Jour. Water Poll. Control Fed., 1980, (52), 399.
Wong-Chong, G.M., and R.C. Loehr. "The Kinetics of Microbial Nitrification," Water Research (G.B.), 1975, (9), 1099.
Poduska, R.A., and J.F. Andrews. "Dynamics of Nitrification in the Activated Sludge Process," Jour. Water Poll. Control Fed., 1975, (47), 2599.
Sawyer, C.N., et al. "Nitrification and Denitrification Facilities," EPA Technology Transfer Seminar Publication, 1973, EPA-62514- 73-004a.
Sutton, P.M., and D.S. Parker. "Nitrification Design Approach for High Strength Ammonia Wastewaters," Jour. Water Poll. Control Fed., 1978, (50), 2050.
Nitrijkation and Denitrijlcation in the Activated Sludge Process 185
12. Charley, R.C., et al. "Nitrification Kinetics in Activated Sludge at Various Temperatures and Dissolved Oxygen Concentrations, 'I Water Research (G.B.), 1980, (14), 1387.
13. Jenkins, D., and W.E. Garrison. "Control of Activated Sludge by Mean Cell Residence Time," Jour. Wafer Poll. Control Fed., 1968, (40), 1905.
14. Munch, W.L. "Control Ammonia Nitrogen with Single-Stage Nitrification," Water and Wastes Eng., 1978, (15) #8, 16.
15. Lawrence, A.W., and C.G. Brown. "Design and Control of Nitrifying Activated Sludge Systems," Jour. Water Poll. Control Fed., 1976, (48), 645.
16. Stover, E.L., et al. "One-Versus Two-Stage Nitrification in the Activated Sludge Process," Jour. Water Poll. Control Fed., 1976, (48), 645.
17. Young, J.C., et al. "Control Strategy for Biological Nitrification Systems," Jour. Water Poll. Control Fed., 1979, (51), 1824.
18. Mulbarger, M.C. "Three Sludge * System for Nitrogen and Phosphorous Removal," National Technical Information Service, PB-213 778, 1972.
119. Beckman, W.J., et al. "Combined Carbon Oxidation-Nitrification," Jour. Water Poll. Control Fed., 1972, (44), 1917.
20. "Wastewater Treatment Plant Design," Manual of Practice No. 8, Water Pollution Control Federation, Wash. D.C., 1977.
21. Benninger, R.W., and J.H. Sherrard. "Nitrification and Alkalinity Relationships in Activated Sludge," Jour. Water Poll. Control Fed., 1978, (SO), 2132.
22. Stenstrom, M.K. "The Effect of Dissolved Oxygen Concentration on Nitrification," Water Research (G.B.), 1980, (14), 643.
186 Biotechnology for Waste and Wastewater Treatment
23. Hockenbury, M.R., and C. P. Grady. "Inhibition of Nitrification- Effects of Selected Organic Compounds, '' Jour. Water Poll. Control Fed., 1977, (49), 768.
24. Joel, A.R., and C.P. Grady. "Inhibition of Nitrification-Effects of Aniline after Biodegradtion," Jour. Water Poll. Control Fed., 1977, (49), 768.
25. Hockenbury, M.R., et al. "Factors Affecting Nitrification," Jour. Env. Eng. Div., ASCE, 1977, (103) #EE1, 9.
26. Reinhart, D.R. "Nitrification Treatability Study for Carrollton, Ga.," Jour. Water Poll. Control Fed., 1979, (51), 1032.
27. Stover, E.L., et al. "Inhibiting Nitrification in Wastewater Treatment Plants," Water and Sew. Works, 1976, (133) #8, 56.
28. Anthonisen, A.C., et al. "Inhibition of Nitrification by Ammonia and Nitrous Acid," Jour. Water Poll. Control Fed., 1976, (48), 835.
29. Neufeld, R.D., et al. "Phenol and Free Ammonia Inhibition to Nitrosomonas Activity," Water Research (G.B.), 1980, (14), 1695.
30. Mitchell, R. Introduction to Environmental Microbiology, New Jer- sey: Prentice-Hall, Inc., 1974.
31. Irvine, R.L., et al. "Stoichiometry and Kinetics of Biological Waste Treatment," Jour. Water Poll. Control Fed., 1980, (52), 1987.
32. Mulbarger, M.C. "Nitrification and Denitrification in Activated Sludge System," Jour. Water Poll. Control Fed., 1971, (43), 2059.
33. Barth, E.F., et al. "Chemical-Biological Control of Nitrogen and Phosphrous in Wastewater Effluent," Jour. Water Poll. Control Fed., 1968, (40), 2040.
34. Beccari, M., et al. "A Critical Analysis of Nitrification Alterna- tives," Water Research (G.B.), 1979, (13), 185.
Nitrification and Denitripcation in the Activated Sludge Process 187
35. Clarkson, R.A., et al. "Single-Sludge Pure-Oxygen Nitrification and Phosphorous Removal," Jour. Water Poll. Control Fed., 1980, (52), 770.
36. Sutton, P.M., et al. "Efficacy of Biological Nitrification," Jour. Water Poll. Control Fed., 1975, (47), 2655.
37. Sherrard, J.H., et al. "Utilizing Stoichiometry for Denitrification," Water and Sew. Works, 1978, (125) #6, 104.
38. Argaman, Y . , and E. Miller. "Modeling Recycled Systems for Biological Nitrification and Denitrification," Jour. Water Poll. Control Fed., 1979, (51), 749.
39. Wilson, R.W., et al. "Design and Cpst Comparison of Biological Nitrogen Removal Processes," Jour. Water Poll. Control Fed., 1981, (53), 1294.
40. Narkis, N., et al. "Denitrification at Various Carbon to Nitrogen Ratios," Water Research (G.B.), 1979, (13), 93.
41. Sutton, P.M., et al. "Nutrient Removal in Suspended Growth Systems Without Chemical Addition," Jour. Water Poll. Control Fed., 1980, (52), 98.
42. Sutton, P.M., et al. "Nitrification and Denitrification of an Industrial Wastewater," Jour. Water Poll. Control Fed., 1981, (53), 176.
43. Bishop, D.F., et al. "Single-Stage Nitrification-Denitrification," Jour. Water Poll. Control Fed., 1976, (48), 52.
44. Matsche', N.F., and G. Spatzierer. "Austrian Plant Knocks Out Nitrogen," Water and Wastes Eng., 1975, (12) #1, 19.
45. Schwinn, D.E., and D.F. Storrier. "One Step for Nitrogen Removal--A Giant Step for Optimum Performance," Water and Wastes Eng., 1978, (15) #12, 33.

188 Biotechnology for Waste and Wastewater Treatment
46. Biscogni, J.J., and C.T. Driscoll. "Denitrification Using Thiosulfate and Sulfide," Jour. Env. Eng. Div . , ASCE, 1977, (103) #EE4,593.