nitric oxide inside a realistic heavy-duty diesel engine · nitric oxide inside a realistic...
TRANSCRIPT

Nitric oxide inside a realistic heavy-duty diesel engine E.J. van den Boom, C.M.I. Spaanjaars, W.L Meerts, RB. Monkhouse',
N.J. Dam^ and J.J. ter Meulen Applied Physics, University of Nijmegen, Toernooiveld 1,
6525 ED Nijmegen, the Netherlands ' Present address: Physikalisch-Chemisches Institut, Universitat Heidelberg,
lm Neuenheimer Feld 253, 0-69120 Heidelberg, Gerrnany ^ Correspondingauthor. E-mail: n i c o d @ s c i . k u n . n l
C
Corresponding autiior:
Dr. Nico J. Dam > Dept. of Applied Physics University of Nijmegen Toernooiveld 1 6525 ED Nijmegen The Netherlands Fax: +31 24 365 3311 E-mail: n i c o d ê s c i . kun . n l
Colloquium; Intemal Combustion Engines
Word count: (using d e t e x f i l e n a m e | wc on Unix; paper is in LaTeX 2^) 4150 words (includes everything) 4000 words (excluding abstract and figures) 7 Standard figures (1400 words)
Preferred presentation; Oral
1

Abstract First results on laser induced fluorescence detection of nitric oxide {y system) in an optically accessible, 6-cylinder heavy-duty diesel truck engine are presented. The combustion chamber corresponds to that of the production line DAF XF 95 series, and the engine is run on commercial diesel fuel. The use of diesel fuel is found to cause strong attenuation of the 226 nm laser radiation used to induce fluorescence from nitric oxide. Fluorescence could be detected from 14° aTDC onwards, about 6° crank angle after the peak heat release. Curves for the NO density as a function of crank angle are found to reproduce well for different measurement series and with different optical configurations. Under the present engine operating conditions the maximum NO formation rate is found to occur during the diffusion bum phase of the combustion. Point measurements show first signs of NO fluorescence between rather than within the spray flames.
2

Introduction Diesel engines arguably power the majority of road transportation vehicles. As such, their impact both on economy and on the environment can hardly be underestimated. In many countries legis-lation seeks to strike a balance between the demands for increased capacity and those for reducing adverse effects on the environment. To this end, emission regulations are imposed that, more or less in pace with (expected) technological advances, are sharpened every few years [1]. Up to the present, engine manufacturers can meet these ever more stringent legislative requirements, but the lack of detailed, fundamental knowledge about the diesel combustion process itself becomes ever more evident. Of course, this scantiness of basic knowledge is for a large part due to the extreme complexity of (multi-component) diesel fuel combustion, which typically takes place under conditions hardly amenable to experimental analysis.
Nevertheless, several research groups are involvedin studying details of combustion in engines, most often using laser-based techniques in order to minimize perturbation of the process (see e.g. [2-7]). Compression-ignition engines running under realistic conditions (standard diesel fuel, not skip-fired, minimized modification of the combustion chamber) provide very adverse measurement conditions. As a result, most work reported to date concerns diesel engines running on substitute fuel [2] and/or oxygen-enriched intake air [3,5]. Regular diesel fuel and ambient intake air were used in the work of Stoffels et al. [6,7], but the engine concemed was considerably modified and not very representative for modem diesel engines. This recent work, most notably that of Dec and coworkers, has led to conceptual views of diesel combustion that partly challenge the "established" views [8,9].
The objective of the present work is to assess the nitric oxide fluorescence yield at specific locations within the combustion chamber of a regular, heavy-duty diesel truck engine under operating conditions as realistic as possible. Since these are the first results from this engine, the engine is described in some detail below, after which results on nitric oxide laser-induced fluorescence yields are given as a function of engine load and crank angle. Quantification of the results is the main subject of the discussion.
Experimental
Engine The research engine is a six-cylinder 11.6 liter heavy-duty 4-stroke diesel engine produced by DAF Trucks (Eindhoven, the Netherlands). One of the cylinders has been modified for the ex-periments (figure 1). This cylinder has been elongated by 40 cm, to provide access to the head. The latter corresponds to the DAF XF 95 series, a 4-valve head with central 6- or 8-hole injector and symmetrical configuration. One outlet valve has been removed, and in this position either a pressure transducer (AVL QHC32) or a quartz observation window (referred to as 'top window') can be mounted. Three other rectangular (47.5 x 22.5 mm^) quartz windows (Wi_3 in fig. 1) are mounted in the sides of the cylinder head, providing optical access to the uppermost part of the combustion chamber at all times during a stroke.
The piston in the measurement cylinder consists of an elongation bolted onto the original piston. The elongation can be capped either by an original mexican-hat type crown of aluminium alloy, or by a flat-bowl crown with a quartz bottom part. The latter provides full optical access to
3
the central 74 mm of the combustion chamber (bore 130 mm). Light emitted through the piston window can be observed through slots in the side of the piston elongation and in the side of the cylinder wall via a 45° mirror that can be shifted into the engine during operation. In order to reduce soot formation the elongated piston runs without lubrication.
Intake air temperature and boost pressure as well as cooling water temperature are all continu-ously controlled and electronically adjustable. Break load is provided by a water-cooled dyname-ter. All experiments are performed with the engine running on commercial low-sulphur "City diesel" fuel, obtained from a local retailer. (The same fuel is used for the public transportation buses in Nijmegen.) Dehumidified ambient air is used as intake air. The engine runs in skip-fired mode (typically 1:20 to 1:40) in order to avoid excessive heating of the (non-lubricated) measurement cylinder. Steady-state conditions are simulated by preheating the combustion chamber by the cooling water.
Fuel injection starts at 3° bTDC' and combustion starts at about 1° to 5° aTDC, depending on the load. The compression ratio varies between e = 15.5 (aluminium crown) and e = 15 (quartz-bottom crown); in the unmodified engine e = 16.
A more detailed description of the engine will be reported elsewhere, together with full speci-fications [11].
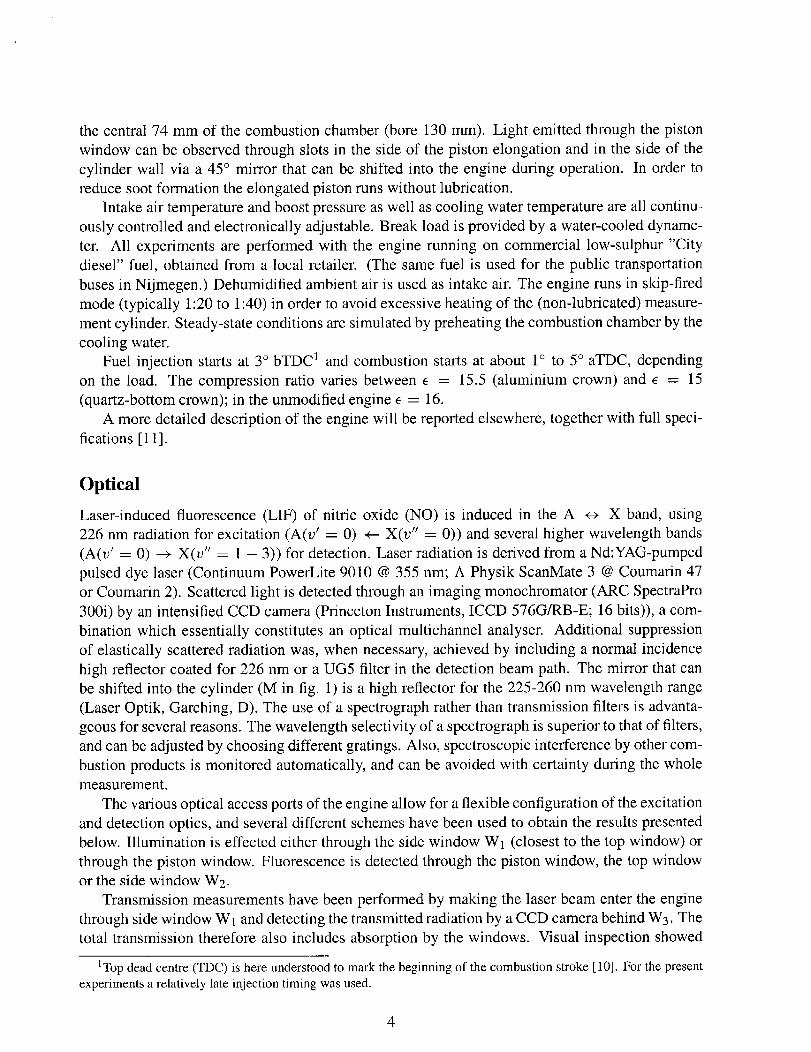
Optical Laser-induced fluorescence (LIF) of nitric oxide (NO) is induced in the A -o- X band, using 226 nm radiation for excitation (A(i; ' = 0) X{v" = 0)) and several higher wavelength bands (A(i; ' = 0) ^ X(v" = 1 - 3 ) ) for detection. Laser radiation is derived from a Nd:YAG-pumped pulsed dye laser (Continuüm PowerLite 9010 @ 355 nm; A Physik ScanMate 3 @ Coumarin 47 or Coumarin 2). Scattered light is detected through an imaging monochromator (ARC SpectraPro 300i) by an intensified CCD camera (Princeton Instruments, ICCD 576G/RB-E; 16 bits)), a com-bination which essentially constitutes an optical multichannel analysen Additional suppression of elastically scattered radiation was, when necessary, achieved by including a normal incidence high reflector coated for 226 nm or a UG5 filter in the detection beam path. The mirror that can be shifted into the cylinder (M in fig. 1) is a high reflector for the 225-260 nm wavelength range (Laser Optik, Garching, D). The use of a spectrograph rather than transmission filters is advanta-geous for several reasons. The wavelength selectivity of a spectrograph is superior to that of filters, and can be adjusted by choosing different gratings. Also, spectroscopie interference by other combustion products is monitored automatically, and can be avoided with certainty during the whole measurement.
The various optical access ports of the engine allow for a flexible configuration of the excitation and detection opties, and several different schemes have been used to obtain the results presented below. Illumination is effected either through the side window Wi (closest to the top window) or through the piston window. Fluorescence is detected through the piston window, the top window or the side window W2.
Transmission measurements have been performed by making the laser beam enter the engine through side window W i and detecting the transmitted radiation by a CCD camera behind W 3 . The total transmission therefore also includes absorption by the windows. Visual inspection showed
'Top dead centre (TDC) is here understood to mark the beginning of the combustion stroke [10]. For the present experiments a relatively late injection timing was used.
4

the side windows and the top window to remain clear even after prolonged operation of the engine. Only the piston window was found to slowly become covered by a thin, grey layer, starting at the edges where the sprays hit the combustion bowl. In the course of an engine run this grey deposit slowly grows inwards, but it has been verified that fluorescence signal levels from various locations within the combustion chamber remain steady over hundreds of work cycles (engine firing 1:40).
Results The results presented here are the first data obtained from the engine described above. Most of them have been obtained with the engine running at 1600 rpm at 10% or 50% load. The pressure, temperature and heat release curves for the 50% load case are given in fig. 2. No te that the relatively late start of injection results, at this load, in a small ignition delay (about 4.5°). The heat release (fig. 2) is dominated by the premixed bum, with only a small contribution from the diffusion flame.
Since the attenuation of laser radiation and induced fluorescence within the combustion chamber is expected to be a main concern in LIF experiments, transmission measurements have been performed at several engine loads. Representative curves for the relative transmission of 226 nm radiation through the engine for 50% and 90% load are shown in fig. 3. Relative transmission is defined here as the ratio of measured transmission through the firing engine versus that of the motored engine, so that window absorption is accounted for. The figure shows a strong decline of the transmission as soon as fuel injection starts (note the logarithmic ordinale), which recovers only much later in the stroke. The fuel injection rate at 90% load is larger than that at 50% load, which probably explains the deeper transmission minimum in the former case. Later in the stroke, however, the combustion chamber is seen to be more transparent in the 90% load case, possibly due to the higher temperatures maintained for a longer time, that can be expected to result in more complete soot bum-out. The large impact that (commercial) diesel fuel injection has on the transmission of 226 nm radiation poses a violent contrast to the negfigible effect that low-sooting diesel fuel is reported to have [2].
Nitric oxide fluorescence measurements have mostly been performed using 226.037 nm excitation (Qi ^- P2i(14) and Q2 - I - Ri2(21), see [12]), initially with the laser beam entering the combustion chamber through the side window Wi and fluorescence detection through the top window. The Standard aluminium piston crown was used. This configuration has the advantage of small pathlength of both laser beam and fluorescence within the combustion chamber, but has the disadvantage that the top window offers only a limited view of the combustion bowl. (The main part of the top window is located above the squish region; see fig. 1). Data from a representative engine run are presented in figure 4. The raw NO fluorescence data (curve • ) correspond to averages over five successive engine cycles, and the datapoints at different crank angles were recorded in arbitrary order. Single shot data scatter around the average by about 10-30%. Fluorescence could be observed (in the averages) from 30° aTDC onwards. In order to transform the raw fluorescence data into NO densities, they must be corrected for the effects of /) coUisional fluorescence quenching (incl. Electronic Energy Transfer (EET)), //) the absorption linewidth, iiï) the varying thermal population of the probed energy level (Boltzmann fraction) and iv) the in-cylinder attenuation. The successive effects of these corrections is included in fig. 4. Contrary to previous work of our group [6,7], in which a 193 nm excimer laser was used to excite the D(i; ' = 0) X{v" = 1) band, the correction for the Boltzmann fraction is now of minor importance (compare curves • and o).
5

Another difference with the 193 nm excitation scheme lies in the coUisional quenching correction. Quenching of the NO D^S+-state is expected to be dominated by N2 collision-induced EET to the A-state [11]. Quenching of the (lowest electronically excited) A^S"^-state, on the other hand, is hardly affected by collisions with N2 [13], but depends on collision partners like O2, C0(2), H2O and hydrocarbons [14-16]. Using the known coUisional quenching cross sections and estimated concentrations of the major chemical species in the combustion chamber, quenching rates, Q, have been calculated. Temperature and pressure dependences were found to be well described by the re-lationship Q oc P T~^/'^, with P the total pressure (data not shown). This relation has subsequently been used in correcting the fluorescence data. As expected, fig. 4 shows the quenching correction to be substantial (compare curves • and • ) , especially at lower crank angles. Another important factor is to be found in the varying excitation efficiency (compare curves • and • ) , which is mainly due to the absorption linewidth. Both the laser and the absorption line profiles are here assumed gaussian, with widths (FWHM) of A L = 0.15 cm"' and A^è^ = 0 .58^(295/7)° ' ' ^ cm- ' (total pressure P in bars, T in K) [17,18], respectively. Because of the minimized pathlength that the light has to cover in the setup used, the attenuation correction (using the 226 nm transmission data of fig. 3 for the 248 nm fluorescence as well) is seen to have only a relatively small effect (compare curves o and A). The net effect of all the processing factors is a change of the roughly monotoni-cally rising raw data curve ( • ) into a NO density curve (A) that shows a maximum at small crank angles (close to the detection limit, in fact). Conceming the decline of the density curve towards larger crank angles, it should be noted that the trivial effect of the expanding in-cylinder volume has not been incorporated in figure 4 (which displays density rather than amount).
A series of NO density curves obtained from different engine runs on different days is presented in figure 5. In all cases the excitation laser beam entered the engine through the side window Wi (but in various lateral positions), but the fluorescence was detected either through the top window (curve from fig. 4) or through the side window W2 (other curves); the attenuation correction was modified accordingly. Most datapoints correspond to averages over several engine cycles (the number n is indicated in the figure). Excitation on the Q2 + Qi2(14) at 226.373 nm [19] was used for one of the curves (o); for the others the scheme mentioned above was used. The curves in figure 5 are seen to agree well with each other, both in the onset of detectable NO fluorescence and in the decline of the density towards larger crank angles. The single shot data ( • ) showed NO fluorescence only from 40° aTDC onwards.
A much more detailed view of the combustion is obtained by looking from below, using the piston with the quartz bottom plate. Figure 6 shows a partial view (back side in fig. 1) of the combustion, recorded through the monochromator (grating in O* order) at 14° aTDC. The position of the injector is indicated at the right, with the 8 jet axes, four of which give rise to the spray flames visible in fig. 6. The large white circle in the image indicates the rim of the piston window. By having the unfocussed laser beam enter the combustion chamber through the piston window as well, it is possible to probe the combustion chamber contents along a line of sight, typically a cylinder with a diameter corresponding to that of the laser beam (about 3 mm) and a height that, in principle, is limited by the distance Zp from the upper side of the piston window to the cylinder head. In practice, however, the penetration depth is often limited by in-cylinder attenuation. Fluorescence is detected through the monochromator at 259 nm {A{v' = 0) ^ X ( Ü " = 3)). This configuration has the disadvantage that spatial resolution is lost along the line of sight, but this is, for the present purpose, outweighted by the fact that the laser beam enters the observation volume immediately, so that attenuation losses (of both laser beam and fluorescence) are kept to a min-
6

imum. Three locations for the probe volume are indicated in fig. 6; the size of the white disks roughly corresponds to the width of the laser beam. Points a and c lie along one of the spray axes (or, rather, along the plume of visible combustion, which is rotated counterclockwise by about 10° with respect to the spray direction due to swirl), whereas point b is located in between two spray flames. Using this configuration, the earliest unambiguous fluorescence signals from NO could be detected on location a (tip of the spray flame) at 14° aTDC, with the engine running at 10% load. Curves for the fluorescence yield (raw data) as a function of crank angle, load and measurement location are given in fig. 7. Interestingly, the fluorescence yield is lower at 50% load than at 10% load (panel a). Yet, first signs of NO could, also at 50% load, be detected at 14° aTDC, but then only between rather than within the spray flames (panel b). Al l curves show a steep rise of the fluorescence intensity towards larger crank angles (note the logarithmic ordinale). This rise actually (and not quite unexpectedly) corresponds well to the rise in transmission documented in fig. 3, and it therefore seems that, in spite of the favourable optical configuration, the steep rise of the curves in fig. 7 is again due to the changing opacity of the combustion chamber contents.
The correction procedure for the laser and fluorescence intensity attenuation is now in fact somewhat different from the one used for figs. 4 and 5, because now the integration along the line of sight must be accounted for. In principle this could be done along the same lines as indicated above. However, the use of an average absorption coëfficiënt is not a very good approximation for a configuration which probes the early combustion very locally. Indeed, applying the above algorithm to the measured data of fig. 7 leads to large scatter in the final datapoints (data not shown). Therefore, only the raw fluorescence data will be discussed below.
Discussion The results presented above show that nitric oxide fluorescence signals can be obtained from a minimally modified combustion chamber of a realistic diesel truck engine (DAF XF 95 series), running on Standard commercial diesel fuel. Window fouling was found not to seriously limit measurement time. In spite of this, large attenuation factors for 226 nm radiation were found early in the combusdon stroke, abruptly setting in at start of injection (SOI; fig. 3). At present it is not clear whether this is due to scattering or absorption. Although we have not run the engine on low-sooting fuel ourselves, comparison with literature (notably [2]) suggests that commercial diesel fuel in this respect behaves very differently from low-sooting fuel.
The results presented in figs. 4, 5 and 7 concern NO LIF data recorded with several optical configurations. The data processing steps that one has to go through in order to anive at density Information are well understood in principle, albeit not necessarily straightforward to perform in pracdce. For fluorescence data obtained relatively late in the combustion stroke ( 0 ~ 30° aTDC) the individual correction steps are illustrated in fig. 4. The resulting density Information is seen to reproduce well, as illustrated by the data obtained from several engine runs (weeks apart) and different optical configurations (fig. 5).
The curves in fig. 5 show a NO density that declines with increasing crank angle. Most of the decline can trivially be explained by the increasing combustion chamber volume. The curves of fig. 5 do, however, decrease slightly faster, indicating that some of the initially produced NO is removed later in the stroke, e.g. due to conversion into NO2 [7]. In combination with the fluorescence data of fig. 7, these curves also imply that the NO formation rate possesses a maximum
7

somewhere between 14° aTDC (first signs of NO; fig. 7) and about 38° aTDC (near tiie detection limit of the curves in fig. 5). This maximum therefore occurs after the peak heat release (at 8° aTDC; fig. 2), at some point during the diffusion bum phase. Although the highest local temperatures will probably be reached during the early spike in the heat release (premixed bum phase), local temperatures in the diffusion flame will still be much higher than the mean gas temperature ( R i 1300 K at 14° aTDC). It cannot, at this stage, be decided whether the NO is formed via the thermal (Zeldovich) mechanism or that another (e.g. the Fenimore) mechanism contributes significantly.
An interesting conclusion from the curves in fig. 7b is that NO is seen eariier between the spray flames (location b in fig. 6) than at the position of the flames (locations a and c). The difference is at least partly to be explained by local differences in optical thickness of the cylinder contents this early in the stroke. Between the spray flames the penetration depth of the laser radiation within the combustion chamber is expected to be much larger than at locations where it has to cut through a flame. Qualitative experimental evidence for this is provided by the fact that during measurements at location b large back reflections of laser light were often seen, very likely due to scattering of laser radiation off the cylinder head. This hardly ever occurred during measurements at the other two locations. As a result of the larger penetration depth, the probe volume at location b is larger than that at positions a and c.
The question remains where the NO between the sprays comes from. It may of course be formed locally, but it can also not be excluded a priori that it is formed elsewhere eariier in the combustion and is transported by gas flow to the measurement location. For instance, if it is sup-posed that NO is formed within the spray flame at position a during the peak heat release (at 8° aTDC), where it would probably be invisible for LIF detection due to the limited local penetration depth, gas velocities of about 20 m/sec would be required to transport it to measurement location b at 14° aTDC (the average piston speed is only about 3 m/sec at these crank angles), A l though LDA or PIV data on the gas flow velocities in this engine are not available, time-resolved images of the visible combustion (data not shown) do not provide evidence for the occurrence of such flow pattems, but of course the luminous soot particles need not be faithful tracers of the gas flow. Local formation of NO between the spray flames seems more likely. The oxygen con-centration is high, nothing yet being consumed by combustion, and elevated temperatures can be expected because of the vicinity of the flame fronts. Results reported by Dec [2, fig. 4] also provide evidence for early NO formation along the outside of the flame front.
Measurements at eariier injection timing (normal operating conditions for this engine correspond to SOI at 6.2° bTDC) are in progress. Future work will be directed towards improving the detection sensitivity, towards more quantitative interpretation of the results and towards correlating local NO densities with those of other combustion products.
Acknowledgements This work is supported by the Dutch Technology Foundation (STW). P.B.M. acknowledges a grant from the EU in the framework of the Marie Curie programme. We gratefully acknowledge DAF tmcks for providing the engine and much advice, as well as R. Baert (TUE), R. Klein-Douwel (KUN), J. Kmithof (DAF Tmcks) and D. Stapersma (KIM) for enlightening discussions.
8

References [1] For a summary see e.g. h t t p : / /www. d i e s e l n e t . com/s t anda rds
[2] Dec, J.E. and Canaan, R.E., SAE paper 980147 (1998).
[3] Nakagawa, H., Endo, H., Deguchi, Y., Noda, M. , Oikawa, H. and Shimada, T., SAE paper 970874 (1997).
[4] Hildenbrand, F., Schulz, C , Sick, V., Josefsson, G., Magnusson, I . , Andersson O. and Aldèn, M. , SAE paper 980148 (1998).
[5] Brugman, Th.M., Stoffels, G.G.M., Dam, N., Meerts, W.L. and ter Meulen, J.J., AppL Phys. 5 64,717-724(1997).
[6] Stoffels, G.G.M., Nitric oxide in a diesel engine: laser-based detection and interpretation, PhD thesis, University of Nijmegen (1999).
[7] Stoffels, G.G.M., van den Boom, E.J., Spaanjaars, C.M.I., Dam, N. , Meerts, W.L., ter Meulen, J.J., Duff J.L.C. andRickeard, D.J., SAE paper 1999-01-1487 (1999).
[8] Dec, J.E., SAE paper 970873 (1997).
[9] Flynn, PR, Durrett, R.P, Hunter, G.L., zur Loye, A.O., Akinyemi, O.C., Dec, J.E. and West-brook, C.K., SAE paper 1999-01-0509 (1999).
[10] Heywood, J.B., Intemal combustion engine fundamentais, McGraw-Hill, Singapore (1988).
[11] van den Boom, E.J. et al., in preparation.
[12] di Rosa, M.D., Klavuhn K.G. and Hanson, R.K., Combust. Sci. Technol. 118, 257 (1996).
[13] Thoman, J.W. et al., J. Chem. Phys. 97, 8156 (1992).
[14] Drake, M.C. and Ratcliffe, J.W., J. Chem. Phys. 98, 3850 (1993).
[15] Haas, Y. and Greenblatt, G.D., /. Phys. Chem. 90, 513 (1986).
[16] Furlanetto, M.R. etal.,J. Chem. Phys. 101, 10452 (1994).
[17] Chang, A.Y., di Rosa, M.D. and Hanson, R.K., J. Quant, Spectrosc. Radiat. Transf 47, 375 (1992).
[18] Vyrodov, A.O., Heinze, J. and Meier, U.E., /. Quant. Spectrosc. Radiat. Transf 53, 277 (1995).
[19] Luque, J., LIFBASE: Database and spectral simulation program (version 1.4), SRI (1998).
9

Figure 1
10 cm ^
Figure 1: Schematical drawing of the modified part of the DAF diesel truck engine (cross section of the measurement cylinder). W i ^ : side windows (W2 not visible); W j : top window; Wp: piston window; M : mirror under 45° that can be shifted into the elongation during operation of the engine.
10

Figure 2
TDC
- 2 0 O 2 0 4 0 6 0 8 0 1 0 0
Crank angle (degrees)
Figure 2: In-cylinder pressure (upper panel), heat release rate (in Joule per degree crank angle; middle panel) and mean gas temperature (for 313 K inlet air temperature; lower panel) for the measurement cylinder of the engine running at 50% load. The premixed bum phase (pm) is indicated in the heat release panel.
11

Figure 3
-| ' 1 ' 1 • r —
O 50 100 150
Crank angle (degrees aTDC)
Figure 3: Relative transmission of 226 nm radiation through the firing engine (relative to that of the motored engine) for two different loads. Start of injection (SOI) is indicated.
12

Figure 4
50
20 40 60 80 100 120
crank angle (degrees aTDC)
Figure 4: NO fluorescence intensities as a function of crank angle (curve • ) and the corresponding NO densities (curve A). The other curves correspond to various stages of the correction procedure that transforms the fluorescence signal into density (see text). The raw signal ( • ) is successively corrected for quenching ( • ) plus excitation efficiency (•) plus Boltzmann fraction (o) plus finally attenuation (A). The signal-to-noise ratio in the raw data varies from about S/N=2 at 33° aTDC to 40 at 123° aTDC.
13

Figure 5
1 . 0 -•
- •
— • —
- sw; n=10 - sw; n=10
0 . 8 - — • — - sw; n-1 ' c
0 . 6 - " \O —
A —
sw; n=10-40 - tw; n-5
c 0
T3
0 . 4 -
O 0 . 2 -
0 . 0 - — 1 1 1 —
20 40 60 80 100 120 140
Crank angle (degrees aTDC)
Figure 5: Several NO density curves obtained during different engine runs and several optical configurations (see text), sw = side window detection; tw = top window detection; n = number of engine cycles over which is averaged.
14

Figure 6
Figure 6: Location of the sites probed by LIF in the combustion chamber relative to the natural spray flame luminosity (recorded at 14° aTDC). The sites are marked with white circles; the letters are referred to in the text. The flame luminosity is represented in a linear grey scale (white = maximum). At the right the position of the 8-hole injector and the spray directions are indicated.
15
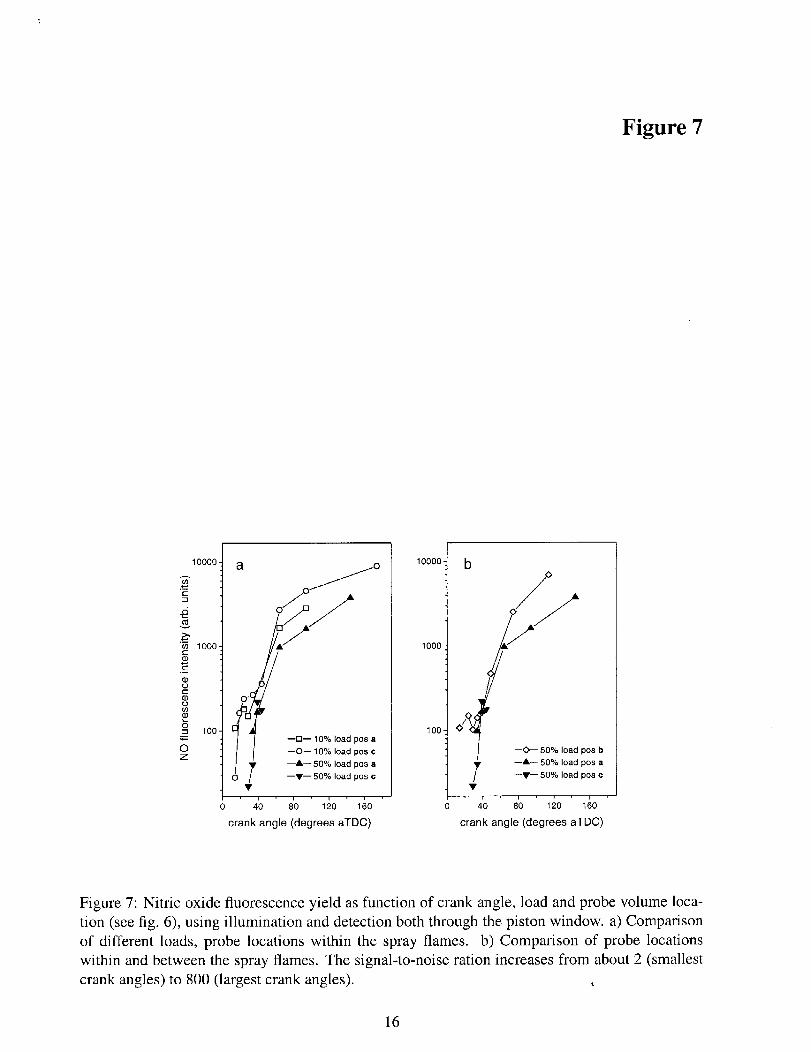
Figure 7
O / — • — 5 0 % l o a d p o s c •
' 1 ' 1 ' 1 ' 1 — O 4 0 8 0 1 2 0 1 6 0
crank angle (degrees aTDC)
1 0 0 0 0 : b
1 0 0 0 -
1 0 0 : / — O — 5 0 % l o a d p o s b
r —A— 5 0 % l o a d p o s a / • — T — 5 0 % l o a d p o s c
O 4 0 8 0 1 2 0 1 6 0
crank angle (degrees aTDC)
Figure 7: Nitric oxide fluorescence yield as function of crank angle, load and probe volume location (see fig. 6), using illumination and detection both through the piston window. a) Comparison of different loads, probe locations within the spray flames. b) Comparison of probe locations within and between the spray flames. The signal-to-noise ration increases from about 2 (smallest crank angles) to 800 (largest crank angles).
16