nitrate and nitrite in vegetables available in hong kong · risk assessment studies report no. 40...
TRANSCRIPT
Risk Assessment Studies
Report No. 40
Chemical Hazard Evaluation
Nitrate and Nitrite in Vegetables Available in
Hong Kong
July 2010
Centre for Food Safety
Food and Environmental Hygiene Department
The Government of the Hong Kong Special Administrative Region

ii
This is a publication of the Centre for Food
Safety of the Food and Environmental Hygiene
Department of the Government of the Hong Kong
Special Administrative Region. Under no
circumstances should the research data contained
herein be reproduced, reviewed, or abstracted in
part or in whole, or in conjunction with other
publications or research work unless a written
permission is obtained from the Centre for Food
Safety. Acknowledgement is required if other
parts of this publication are used.
Correspondence:
Risk Assessment Section
Centre for Food Safety,
Food and Environmental Hygiene Department,
43/F, Queensway Government Offices,
66 Queensway, Hong Kong.
Email: [email protected]
iii
Table of Contents
Page
Executive Summary 2
Objectives 6
Background 6
Scope of Study 19
Methods 19
Results 21
Discussion 27
Limitations 29
Conclusion and Recommendation 29
References 32
Annex 35

1
Risk Assessment Studies
Report No.40
Nitrate and Nitrite in Vegetables Available in
Hong Kong
2
EXECUTIVE SUMMARY
The Centre for Food Safety (CFS) has conducted a study on
nitrate and nitrite in fresh vegetables available in Hong Kong and
assessed the associated health risk posed to the local population
through dietary exposure to nitrate and nitrite. Based on the results,
advice to the public and the trade was formulated.
Vegetables are essential to human health since they are good
source of vitamins, minerals and biologically active substances.
However, vegetables also contain nitrate and nitrite. Nitrate itself is
relatively non-toxic but its metabolites, nitrite, is associated with
methaemoglobinaemia (commonly known as Blue Baby Syndrome).
Nitrite might also react with amines to form carcinogenic nitrosamines
in the stomach.
Nitrates and nitrites occur naturally in the environment. They
are important plant nutrients and can be used in fertilisers. In addition,
they can be added to some food products as preservatives. Vegetables
account for about 70-90% of the total estimated dietary nitrate intake.
The concentration of nitrate in vegetables depends on species variation,
season, light, temperature, method of growth, and fertiliser used.
The Study
A total of 73 types of different groups of vegetables such as
leafy, legumes, root and tuber, and fruiting vegetables were collected in
winter and summer for the analysis of nitrate and nitrite concentrations.
Laboratory analysis was conducted by the Food Research Laboratory of
the CFS.

3
Results
There was a large variation in mean concentrations of nitrate in
different vegetables from a low of 5 mg/kg in oyster mushroom (range
<4-9 mg/kg) to a high of 4 800 mg/kg in Chinese spinach (range 3 700-6
300 mg/kg). The nitrate concentrations of different groups of
vegetables in descending order were leafy vegetables > root and tuber
vegetables > fruiting and legume vegetables. More than 80% of
vegetables had mean nitrate concentrations less than 2 000 mg/kg but
the mean nitrate concentrations of three types of leafy vegetables
namely Chinese spinach, Shanghai cabbage, and petiole Chinese
cabbage were over 3 500 mg/kg. Nitrate in vegetables (i.e. Chinese
flowering cabbage, Chinese spinach and celery) could be reduced
significantly (12-31%) after blanching for 1 to 3 minutes. On the other
hand, the nitrite concentrations of vegetable were generally low, with
less than 1 mg/kg on average.
Conclusion and recommendation
The levels of nitrate and nitrite found in vegetables in this study
were unlikely to pose any immediate health risk to the general
population. However, health risk to infants from consuming
improperly handled vegetables that contain high nitrite levels cannot be
ruled out. Current knowledge and evidence indicated there are strong
beneficial effects of consumption of vegetables. In order to maximise
the health benefits from eating vegetables, measures have to be taken to
reduce the nitrate and nitrite exposure while maintaining the
recommended intake of vegetables of the public.
4
Advice to public
1. Maintain a balanced diet with at least two servings of fruit and
three servings of vegetables every day and eat a wide variety of
vegetables including leafy vegetables, brassica vegetables, root
and tuber vegetables, fruiting vegetables, legume vegetables, etc.
2. Handle and cook vegetables properly (i.e. keep vegetables under
refrigeration if they are not being cooked immediately; cook
vegetables soon after chopping or mashing; wash, peel,
vegetables; blanch high-nitrate vegetables in water and discard
the cooking water before consumption.)
3. WHO recommends exclusive breastfeeding for infants up to 6
months of age with appropriate complementary foods afterwards.
Generally, infants about 6 months of age are ready for solid
foods. Infant foods such as vegetable puree and vegetable
congee should be prepared for immediate use. If storage is
needed, they should be kept in freezer (at or below -18oC) to
avoid accumulation of nitrite due to contamination of bacteria of
the food.
Advice to trade
1. Farmers are advised to observe good agriculture practice (GAP)
to minimize nitrate concentrations in vegetables.
2. The trade should obtain vegetables from reliable sources and
maintain proper records to enable source tracing when required.
5
3. The trade should store vegetables in either refrigerator or cool
and dry places to avoid excessive formulation of nitrite due to
spoilage of the vegetables.

6
Risk Assessment Studies –
Nitrate and Nitrite in Vegetables Available in Hong Kong
OBJECTIVES
The Centre for Food Safety (CFS) has conducted a study on nitrate and
nitrite in fresh vegetables available in Hong Kong. The study aims to (i) examine
the nitrate and nitrite levels of vegetables on Hong Kong market, (ii) explore the
effects of preparation and cooking methods on nitrate levels in vegetables, and (iii)
assess the associated health risk posed to the population through dietary exposure
to nitrate.
BACKGROUND
2. In 2008, an 8-month-old baby in Hong Kong suffered from
methaemoglobinaemia (commonly know as blue baby syndrome) induced by
nitrite after consuming congee made of Chinese spinach. Improper handling
and storage of vegetables can lead to bacteria contamination. The bacteria can
then convert the relatively non-toxic nitrate naturally present in vegetables to the
more toxic nitrite. This incident has aroused public awareness about the nitrate
and nitrite levels in local vegetables. In this connection, a risk assessment study
was conducted to determine the situation in the local scene.
3. Vegetables are essential to human health since they are good source of
vitamins, minerals and biologically active substances. The Joint World Health
Organization (WHO) recommends intake of a minimum of 400 g (five servings)
of fruits and vegetables per day for the prevention of chronic diseases.1 The
Department of Health in Hong Kong also promotes the consumption of at least
7
two servings of fruit and three servings of vegetables every day (2 plus 3 a day) as
part of a balanced diet for optimal health.
4. While vegetables can impact health positively, their nitrate and nitrite
levels should not be overlooked. Nitrate and nitrite are found naturally in the
environment, and form part of the nitrogen cycle. Nitrate is formed from
oxidation of organic wastes by the action of nitrogen-fixing bacteria. The nitrite
ion is relatively unstable and is readily oxidized to nitrate.2 Nitrate and nitrite are
chemicals used in fertilisers and can be readily migrate from fertilised soil to
groundwater. Nitrate and nitrite has been shown to be produced endogenously in
animals and humans. In addition, they are also used as food preservatives in
processed foods.2.3
5. Nitrates in the soil are a primary source of nitrogen which is essential for
plant growth. Nitrate itself is relatively non-toxic but its metabolites, nitrite, is
associated with methaemoglobinaemia. Nitrite might also react with amines to
form carcinogenic nitrosamines in the stomach.4
6. In fact, high nitrate concentrations in vegetables is a worldwide problem.
Very high concentration (over 5 000 mg/kg) of nitrate in vegetables especially
leafy vegetables has been reported in different places such as Mainland China as
well as various countries in Europe.4,5
Due to the increased use of synthetic
nitrogen fertilisers and livestock manure in intensive agriculture, vegetables and
drinking water may contain higher concentrations of nitrate than in the past.6
8
Source of nitrate and nitrite exposure
7. Human exposure to nitrate is mainly exogenous through the consumption
of vegetables (about 70-90%), and to a lesser extent water and other foods.2,4,7
Nitrate is also formed endogenously. On the contrary, exposure to nitrite is
mainly from endogenous nitrate conversion (about 70-80%).4,8
Nitrate and nitrite in vegetable
8. Nitrate plays an important role in the nutrition and function of plants.
The nitrate concentration in vegetables depends on a number of factors including
species variation, season, light, temperature, method of growth, and fertiliser used.
The nitrate and nitrite levels of vegetables after harvesting can be affected by the
storage and processing methods.2,4
9. Nitrate is mainly to be found in cell vacuoles and is transported in the
xylem. The xylem carries water and nutrients from the roots to the leaves, while
the phloem carries the products of photosynthesis from the leaves to the growth
points of the plant (i.e. storage organs such as seeds or tubers). This means leaf
crops such as cabbage, lettuce and spinach have fairly large nitrate concentrations
whereas storage organs such as potato, carrot, and pea and beans have relatively
small concentrations.4
10.
Applying nitrogen fertiliser increases nitrate concentrations in the xylem
but has virtually no effect on concentrations in the phloem, and therefore leaf
crops such as lettuce or cabbage show an increased concentration of nitrate in
response to nitrogen fertiliser, except in their very youngest leaves, while storage
organs such as peas and beans that are fed by the phloem tend to show little
9
effect.4
11.
In Europe, the concentrations of nitrate in vegetables are generally higher
in winter owing to the low light intensity and fewer daylight hours.2,4
However,
this difference was not observed in a study conducted in Korea. The author
suggested that the disparity in data may due to different environmental conditions
and the use of fertilisers in summer by Korean farmers.9
A study showed that
the nitrate concentrations of cold season vegetables in Iran (e.g. cabbage, lettuce,
radish, and carrot) was lower in winter than in summer while that of warm season
vegetables (e.g. basil and cucumber) was lower in spring than in winter.10
The
Federal Institute for Risk Assessment of Germany (BfR) also opined that when
vegetables are in season, they have a lower nitrate concentration as they can
mature under optimal growth conditions and less fertiliser is needed.11
Influence of storage and food processing
12. The nitrite concentrations in fresh, undamaged vegetables are usually very
low but under adverse post-harvest storage conditions nitrite concentration can
increase in vegetables as a result of bacterial or endogenous nitrate reductase
reducing the nitrate to nitrite.4,13
Under refrigerated storage, the endogenous
nitrate reductase in vegetable is inactivated. However, high levels of nitrite have
been found in home-made vegetable purees even after refrigerated storage for only
12 hours or more. Presumably pureeing releases endogenous nitrate reductase
causing excessive formation of nitrite. Nitrite accumulation is inhibited under
frozen storage.4
13. The distribution of nitrate is not even across the product, e.g. removal of
10
stem and midrib resulted in a decrease of nitrate content by 30-40% in lettuce and
spinach. On the other hand, nitrate content was found to decrease by 20 to 62%
after peeling of potatoes, bananas, melons and beetroot. Nitrate is soluble in
water and washing of leafy vegetables can reduce nitrate levels by 10-15%.4
14. Different studies have shown reduction of nitrate levels (16 to 79% loss)
when vegetables such as peas, cabbage, beans, carrots, potatoes spinach, endives,
and celery leaves are cooked in water. For potatoes, a study found that the
greatest decrease in reducing nitrate (36-58%) and nitrite (82-98%) was observed
when peeled potatoes were boiled in water compared to steaming.4
Toxicity of nitrate and nitrite
Kinetics and metabolism
15. Ingested nitrate is readily and completely absorbed from stomach and the
upper small intestine. Nitrate is rapidly distributed throughout the tissues. In
humans, about 25% of ingested nitrate is secreted in the saliva and approximately
20% of the secreted salivary nitrate is then converted to nitrite by microorganisms
on the tongue and thus for normal individuals about 5-7% of ingested nitrate can
be detected as salivary nitrite. However, for individuals with a high rate of
conversion this figure maybe up to 20%. The major site for nitrate reduction is at
the base of the tongue where a stable, nitrate-reducing mircroflora is present.
Oral reduction of nitrate is the most important source of nitrite for humans, and
will account for approximately 70-80% of the human total nitrite exposure.4,8,13
16. Nitrate can be reduced to nitrite by both enteric bacteria and mammalian
nitrate reductase activity. Many species of microorganism resident in the
11
gastrointestinal tract have nitrate reductase activity. Therefore, bacterial
reduction of nitrate may also take place in other parts of the human gastrointestinal
tract, but not normally in the stomach; exceptions are reported in humans with low
gastric acidity, such as artificially fed infants, certain patient in whom
hydrochloric acid secretion is slower than normal, or patients using antacids.
Absorbed nitrite is rapidly oxidized to nitrate in blood.13
17. In the stomach, under acidic conditions, nitrite will be transformed to
nitric oxide and other metabolites. In humans, about 65-70% of the ingested
nitrate is eventually excreted in urine as nitrate, ammonia, or urea, and the
elimination half-life was estimated to be about 5 hour.13
Low levels of nitrate
and nitrite are excreted in faeces. Nitrate levels in breast milk are low, up to 5
mg/kg have been reported, and they did not exceed the simultaneously measured
maternal plasma nitrate levels from lactating women after a normal meal.8
Endogenous formation of nitrate and nitrite
18. Nitrate excretion in excess of nitrate intake by humans was reported and
further investigation revealed about the endogenous synthesis of nitrate. The
major pathway involved the conversion of the amino acid L-arginine by
macrophages to nitric oxide. Further oxidation of the nitric oxide will yield
nitrite, which is rapidly oxidized to nitrate. Increased endogenous synthesis of
nitrate, as reported in animals with induced infections and inflammatory reactions,
was also observed in humans.4,14
Endogenous formation of N-nitroso compounds and protective effects of a
12
balanced diet
19. There is an active endogenous nitrogen cycle in humans that involves
nitrate and nitrite. In the presence of amines or amides, endogenous nitrosation
takes place in the acidic environment of the human stomach. In a dynamaic in
vitro gastrointestinal model, the formation of N-nitrosodimethylamine (NDMA)
was observed after gradually adding nitrite to food samples (fish). For some of
the samples the model produced measurable NDMA levels, and the addition of
orange juice or tea (antioxidants) generally decrease the NDMA formation.
20. A study quoted by the Joint Food and Agriculture Organization
(FAO)/World Health Organization (WHO) Expert Committee on Food Additives
(JECFA) that concluded that of 120 mg ascorbic acid taken with a meal containing
nitrate at 360 mg/day would significantly reduce nitrosamine formation in vivo.15
Another study quoted by the European Food Safety Authority (EFSA) showed that
that when nitrate is consumed as part of a normal diet containing vegetables, other
bioactive substances concomitantly consumed such as the antioxidant vitamin C
can reduce the amount of nitrosamine formed by up to half.4
Acute toxicity
21. The acute oral toxicity of nitrate in animals is generally low. It has been
observed that the oral lethal dose of nitrate in humans is around 330 mg/kg body
weight (bw).4 Nitrite is a more toxic than nitrate. Various oral lethal doses of
nitrite in human adults have been reported.16
Methaemoglobinaemia
22. The major acute toxic effect of nitrite poisoning is methaemoglobinaemia.
13
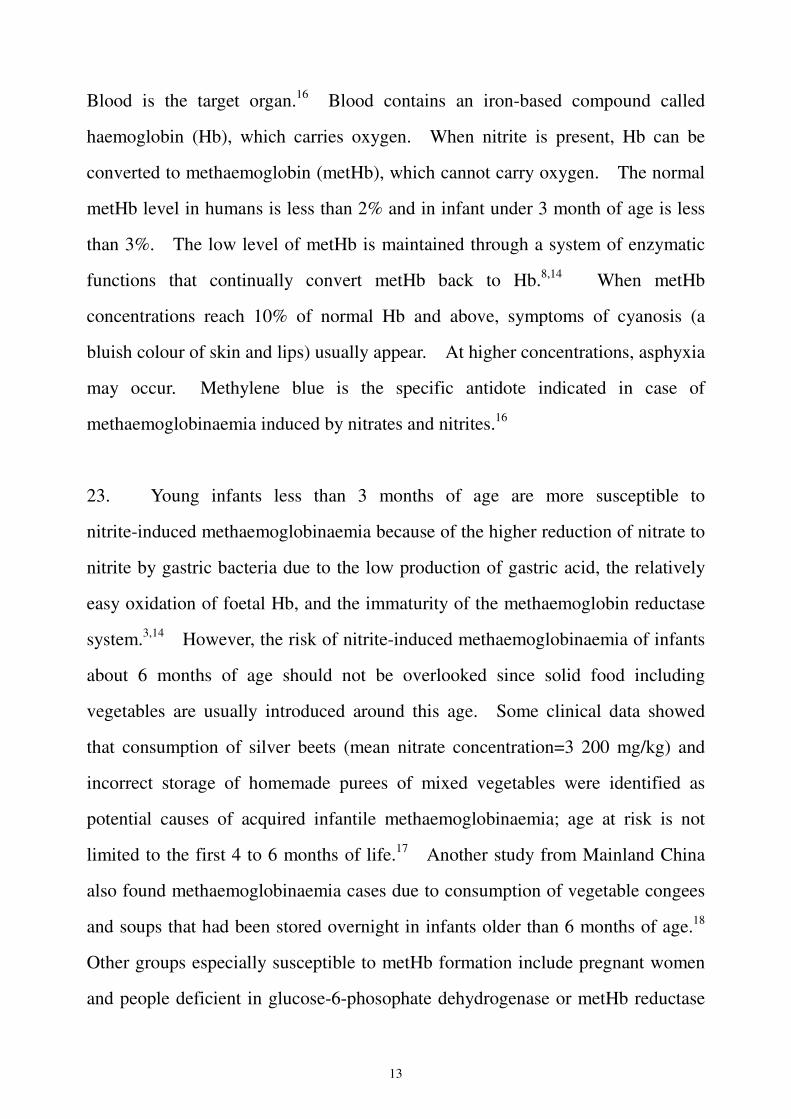
Blood is the target organ.16
Blood contains an iron-based compound called
haemoglobin (Hb), which carries oxygen. When nitrite is present, Hb can be
converted to methaemoglobin (metHb), which cannot carry oxygen. The normal
metHb level in humans is less than 2% and in infant under 3 month of age is less
than 3%. The low level of metHb is maintained through a system of enzymatic
functions that continually convert metHb back to Hb.8,14
When metHb
concentrations reach 10% of normal Hb and above, symptoms of cyanosis (a
bluish colour of skin and lips) usually appear. At higher concentrations, asphyxia
may occur. Methylene blue is the specific antidote indicated in case of
methaemoglobinaemia induced by nitrates and nitrites.16
23. Young infants less than 3 months of age are more susceptible to
nitrite-induced methaemoglobinaemia because of the higher reduction of nitrate to
nitrite by gastric bacteria due to the low production of gastric acid, the relatively
easy oxidation of foetal Hb, and the immaturity of the methaemoglobin reductase
system.3,14
However, the risk of nitrite-induced methaemoglobinaemia of infants
about 6 months of age should not be overlooked since solid food including
vegetables are usually introduced around this age. Some clinical data showed
that consumption of silver beets (mean nitrate concentration=3 200 mg/kg) and
incorrect storage of homemade purees of mixed vegetables were identified as
potential causes of acquired infantile methaemoglobinaemia; age at risk is not
limited to the first 4 to 6 months of life.17
Another study from Mainland China
also found methaemoglobinaemia cases due to consumption of vegetable congees
and soups that had been stored overnight in infants older than 6 months of age.18
Other groups especially susceptible to metHb formation include pregnant women
and people deficient in glucose-6-phosophate dehydrogenase or metHb reductase

14
and probably the elderly.14
24. Nitrate has to be converted to nitrite before it can cause acute toxicity.
At present, JECFA has not set acute reference doses for nitrate and nitrite that
cause methaemoglobinaemia.
25. JECFA in 2002 considered the results of studies in humans on the
potential of a high nitrate intake to cause methaemoglobinaemia were equivocal.
Some of the studies showed an association between a high nitrate concentration in
drinking-water and methaemoglobinaemia, and others indicated that
gastrointestinal infections, inflammation and the ensuing overproduction of nitric
oxide are major factors in infantile methaemoglobinaemia.13
26. EFSA in 2008 reviewed new epidemiological studies that have been
published from 2002 onwards and considered the findings also raise questions
about the role of diarrhoeal disease in the development of methaemoglobinaemia.
It stated that a number of factors are critical to metHb formation including the
presence of increased nitrite, intestinal infection together with inflammation of the
stomach lining and a lower activity of metHb reductase which converts metHb
back to Hb.4
Genotoxicity
27. Sodium nitrate was not mutagenic in in vitro test. Sodium nitrite was
mutagenic in in vitro test but gave negative results on mutagenic activities in in
vivo tests. JECFA concluded that there was no evidence for the reclassification
of either nitrate or nitrite as genotoxic compounds.13,15

15
Carcinogenicity
28. Nitrite was shown to react with nitrosatable compounds in the human
stomach to form N-nitroso compounds. Many of these N-nitroso compounds
have been found to be carcinogenic in all the animal species tested, although some
of the most readily formed compounds, such as N-nitrosoproline, are not
carcinogenic in humans.14
29. Several studies had found association between high nitrite intake and
gastric and/or oesophageal cancer; however, other studies, particularly prospective
cohort studies, revealed no such association. On the other hand, case-control
studies revealed a negative correlation between nitrate intake and gastric cancer.
Most likely this is due to the known strong protective effect of vegetables and
fruits on the risk of gastric cancer.6,14
Overall, the epidemiological studies
reviewed by JECFA in 2002 and EFSA in 2008 did not provide evidence that
nitrate and nitrite are carcinogenic to humans.4,13,15,
Safety reference value
30. JECFA allocated an acceptable daily intake of 0-5 mg/kg bw, expressed
as sodium nitrate, or 0-3.7 mg/kg bw, expressed as nitrate ion 3.7 mg/kg bw/day
for nitrate, on the basis of the no-observed-effect-level (NOEL) for growth
depression in a short-term study in dog and a long-term study in rat. The ADI
does not apply to infants below the age of 3 months.8
31. JECFA stated that it took a cautious position in deriving an ADI for
nitrate. It was aware that vegetables are an important potential source of intake
of nitrate. However, in view of the well-known benefits of vegetables and the

16
lack of data on the possible effects of vegetable matrices on the bio-availability of
nitrate, the JECFA considered it to be inappropriate to compare exposure to
nitrate from vegetables directly with the ADI and hence to derive limits for nitrate
in vegetables directly from it.8
32. JECFA established an ADI of 0-0.07 mg/ kg bw for nitrite, expressed as
nitrite ion, on the basis of the NOEL for effects on heart and lung in a 2-year study
in rat.15
Potential beneficial effects of nitrate
33. There is evidence linking nitrate and nitrite to the prevention of microbial
infections, reduction of hypertension and cardiovascular diseases.6 Nitric oxide
and solutions of acidified nitrite, mimicking gastric conditions, have been shown
to have antimicrobial activity against a wide range of organisms, in particular,
gastrointestinal pathogens such as Yersinia and Salmonella. Thus nitrate in the
form of nitric oxide may play a role in host defence.4,13
34. Nitric oxide is also known to have vasodilatory properties and to
modulate platelet function. A recent study quoted by ESFA hypothesized that a
high nitrate content of beetroot juice represented a vasoprotective nitric oxide via
bioactivation. In healthy volunteers, approximately 3 hours after ingestion of
500 ml of beetroot juice, a dietary nitrate load of 2.9 g/L, a significant reduction of
blood pressure was observed (-10.4/8 mm Hg) and this effect was correlated with
peak increases in plasma nitrite concentration.4
The potential beneficial effects of
nitrate and nitrite subject to further study.

17
Regulatory control of nitrate and nitrite
As food additive
35. Currently, no provisions on nitrates and nitrites have been established
under the Codex General Standard for Food Additives. However, Codex has
established maximum permitted levels for nitrates and nitrites in some commodity
standards for various cheese products and cured meat products respectively.
Nitrates and nitrites have also been permitted to be used as food additives in some
specified food in countries such as Australia, Canada, Mainland China, member
countries in the European Union (EU) and the USA.
36. As stipulated in the Preservatives in Food Regulation (Cap. 132BD) in
Hong Kong, nitrates and nitrites are permitted in specified food categories with
maximum permitted levels of nitrates, expressed as sodium nitrate, ranged from 50
mg/kg (in various cheese products) to 500 mg/kg (in certain cured meat product).
For nitrites, the maximum permitted levels of nitrites, expressed as sodium nitrite,
ranged from 10 mg/kg (in various cheese products) to 200 mg/kg (in certain cured
meat product).
As contaminant in food
37. Codex has not discussed or established any food safety standard for
nitrate as food contaminant. Overseas food authorities in Australia, Canada,
Mainland China, and the USA have also not established any legal standard for
nitrate as contaminant in food. However, according to the Commission Regulation
(EC) No. 1881/2006, maximum levels for nitrate as contaminants in certain
foodstuffs have been established in EU. Because of widely varying climatic
conditions, production methods and eating habits in different parts of the EU,

18
maximum levels for fresh spinach and fresh lettuce are set depending on the
season (see Table 1).19
Table 1: Maximum levels for nitrate in certain foodstuffs in EU.
Foodstuffs Maximum level (mg nitrate/kg)
Fresh spinach
(Spinacia oleracea)
Harvested 1 October to 31 March
Harvested 1 April to 30 September
3 000
2 500
Preserved,
deep-frozen or frozen
spinach
2 000
Fresh Lettuce
(Lactuca sativa L.)
(protected and
open-grown lettuce)
excluding lettuce
below
Harvested 1 October to 31 March:
Lettuce grown under cover
Lettuce grown in the open air
Harvested 1 April to 30 September
Lettuce grown under cover
Lettuce grown in the open air
4 500
4 000
3 500
2 500
Iceberg-type lettuce Lettuce grown under cover
Lettuce grown in the open air
2 500
2 000
Processed
cereal-based foods and
baby foods for infants
and young children
200

19
SCOPE OF STUDY
38. To estimate the nitrate levels of fresh vegetables the dietary exposure to
nitrate, this study covered a total of 73 types of commonly consumed vegetables.
For better estimation of exposure, 5 samples of each types were collected in winter
(December 2008 to January 2009) and in summer (from June to July 2009),
respectively.
METHODS
Laboratory analysis
39. Laboratory analysis was conducted by the Food Research Laboratory of
the CFS. Fresh vegetable samples (edible portion) will be analysed for both
nitrate and nitrite as purchased. The analysis of nitrate in vegetables is
conducted according to the standard method BS EN 12014-2:1997, Foodstuffs -
Determination of nitrate and /or nitrite content - Part 2: HPLC/IC method for the
determination of nitrate content of vegetables and vegetable products. The
determination of nitrite content was referenced to Part 7 of the same BS standard:
Continuous flow method for the determination of nitrate content of vegetables and
vegetable products after cadmium reduction, followed by flow injection analysis.
The limit of detection (LOD) of nitrate ions is 4 mg/kg and for nitrite ions is 0.8
mg/kg.
Setting analytical value for results below limit of detection
40. According to the WHO’s recommendation on evaluation of low-level
contamination of food, half of LOD is used for all results less than LOD when less
than or equal to 60% of results are below LOD. When greater than 60% but
20
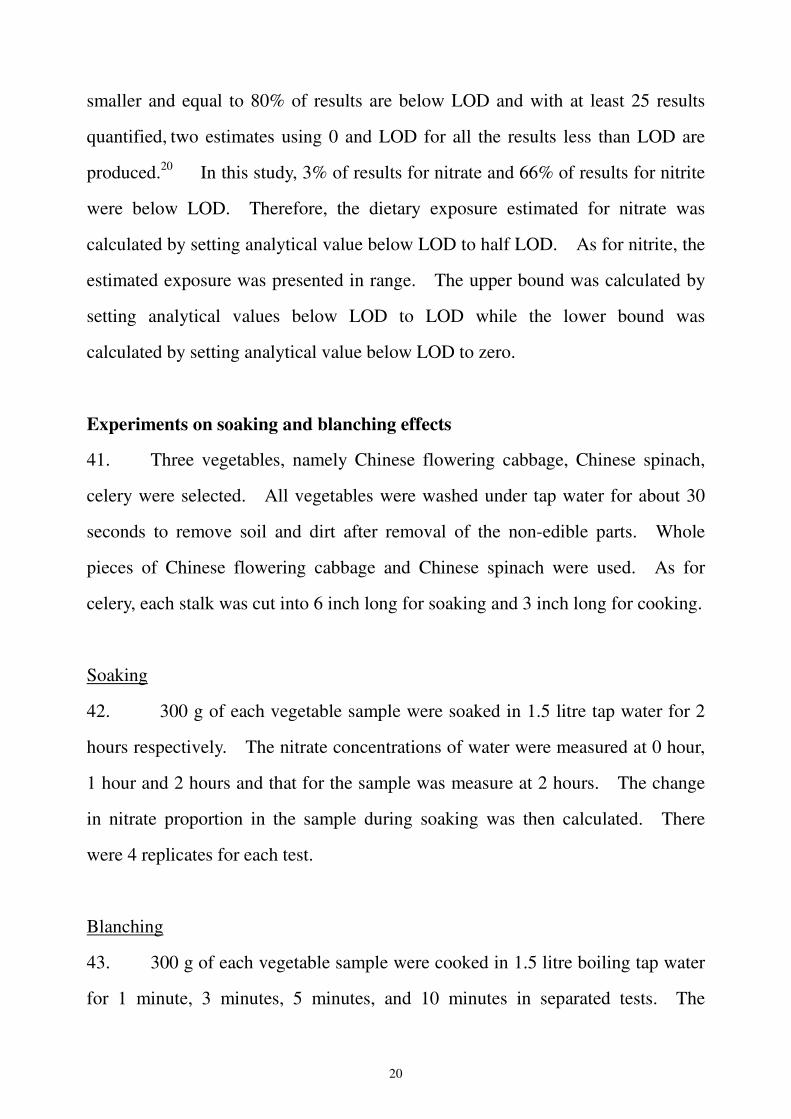
smaller and equal to 80% of results are below LOD and with at least 25 results
quantified, two estimates using 0 and LOD for all the results less than LOD are
produced.20
In this study, 3% of results for nitrate and 66% of results for nitrite
were below LOD. Therefore, the dietary exposure estimated for nitrate was
calculated by setting analytical value below LOD to half LOD. As for nitrite, the
estimated exposure was presented in range. The upper bound was calculated by
setting analytical values below LOD to LOD while the lower bound was
calculated by setting analytical value below LOD to zero.
Experiments on soaking and blanching effects
41. Three vegetables, namely Chinese flowering cabbage, Chinese spinach,
celery were selected. All vegetables were washed under tap water for about 30
seconds to remove soil and dirt after removal of the non-edible parts. Whole
pieces of Chinese flowering cabbage and Chinese spinach were used. As for
celery, each stalk was cut into 6 inch long for soaking and 3 inch long for cooking.
Soaking
42. 300 g of each vegetable sample were soaked in 1.5 litre tap water for 2
hours respectively. The nitrate concentrations of water were measured at 0 hour,
1 hour and 2 hours and that for the sample was measure at 2 hours. The change
in nitrate proportion in the sample during soaking was then calculated. There
were 4 replicates for each test.
Blanching
43. 300 g of each vegetable sample were cooked in 1.5 litre boiling tap water
for 1 minute, 3 minutes, 5 minutes, and 10 minutes in separated tests. The
21
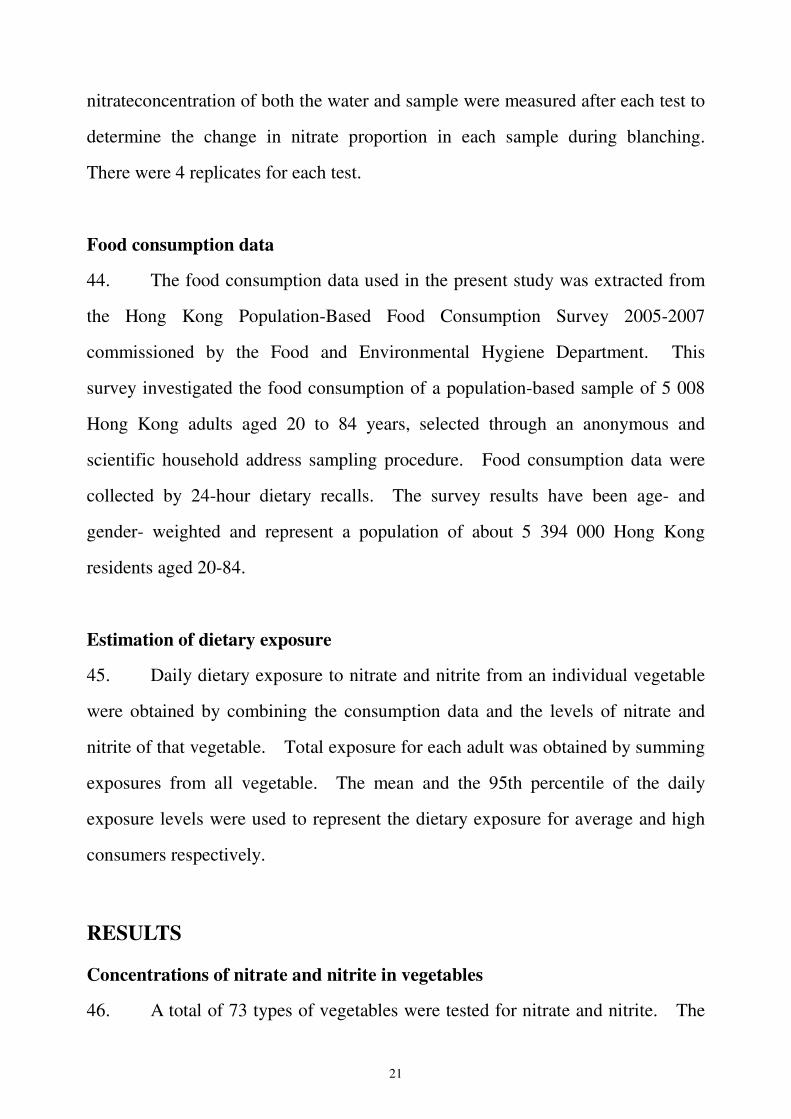
nitrateconcentration of both the water and sample were measured after each test to
determine the change in nitrate proportion in each sample during blanching.
There were 4 replicates for each test.
Food consumption data
44. The food consumption data used in the present study was extracted from
the Hong Kong Population-Based Food Consumption Survey 2005-2007
commissioned by the Food and Environmental Hygiene Department. This
survey investigated the food consumption of a population-based sample of 5 008
Hong Kong adults aged 20 to 84 years, selected through an anonymous and
scientific household address sampling procedure. Food consumption data were
collected by 24-hour dietary recalls. The survey results have been age- and
gender- weighted and represent a population of about 5 394 000 Hong Kong
residents aged 20-84.
Estimation of dietary exposure
45. Daily dietary exposure to nitrate and nitrite from an individual vegetable
were obtained by combining the consumption data and the levels of nitrate and
nitrite of that vegetable. Total exposure for each adult was obtained by summing
exposures from all vegetable. The mean and the 95th percentile of the daily
exposure levels were used to represent the dietary exposure for average and high
consumers respectively.
RESULTS
Concentrations of nitrate and nitrite in vegetables
46. A total of 73 types of vegetables were tested for nitrate and nitrite. The
22
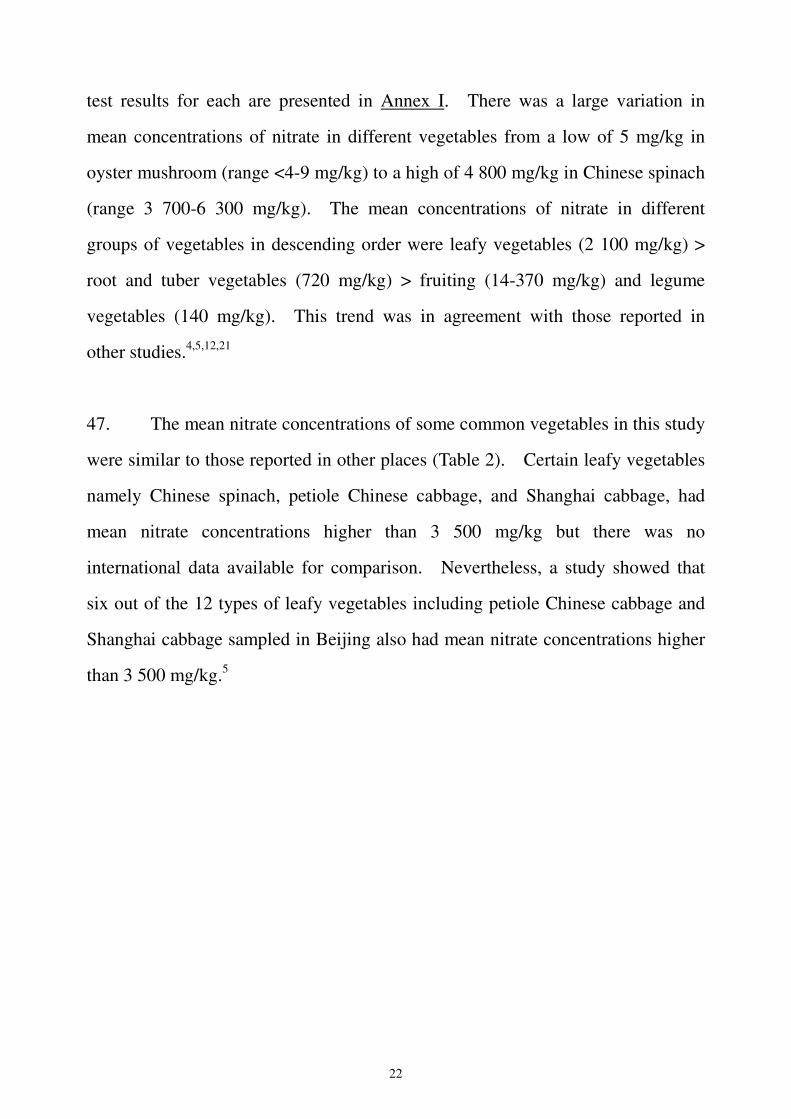
test results for each are presented in Annex I. There was a large variation in
mean concentrations of nitrate in different vegetables from a low of 5 mg/kg in
oyster mushroom (range <4-9 mg/kg) to a high of 4 800 mg/kg in Chinese spinach
(range 3 700-6 300 mg/kg). The mean concentrations of nitrate in different
groups of vegetables in descending order were leafy vegetables (2 100 mg/kg) >
root and tuber vegetables (720 mg/kg) > fruiting (14-370 mg/kg) and legume
vegetables (140 mg/kg). This trend was in agreement with those reported in
other studies.4,5,12,21
47. The mean nitrate concentrations of some common vegetables in this study
were similar to those reported in other places (Table 2). Certain leafy vegetables
namely Chinese spinach, petiole Chinese cabbage, and Shanghai cabbage, had
mean nitrate concentrations higher than 3 500 mg/kg but there was no
international data available for comparison. Nevertheless, a study showed that
six out of the 12 types of leafy vegetables including petiole Chinese cabbage and
Shanghai cabbage sampled in Beijing also had mean nitrate concentrations higher
than 3 500 mg/kg.5

23
Table 2. Comparison of Nitrate Mean Values in Vegetables of Different Places.
Mean concentration of nitrate (mg/kg)
Vegetables Hong Kong,
China
Beijing,
China5
Xiamen,
China2
European
Countries4
New
Zealand22
Korea
9
Aubergine/
Eggplant 350 371 250 314 -- --
Beetroot 3 000 -- -- 1 379 635 --
Bell pepper 77 218 -- -- -- 76
Broccoli 420 -- 416 279 111 --
Cabbage 1 200 1 978 630 311 275 725
Carrot 220 457 352 296 48 316
Cauliflower 250 -- 237 148 -- --
Celery 1 700 -- -- 1 103 1 339 --
Chili pepper 33 203 178 67 -- --
Chinese cabbage 1 300 2 533 1 764 933 -- 1 740
Coriander 3 200 3 400 -- 2 445 -- --
Cucumber 110 256 186 185 -- 212
Garlic 18 -- -- 69 -- 124
Common beans 470 -- 300 323 -- --
Lettuce 950 2 419 -- 1 324 1 323 2 430
Mushroom 43 -- -- 61 -- --
Onions 13 -- -- 164 -- 23
Potato 170 351 335 168 107 452
Pumpkin 260 -- -- 894 55 639
Spinach 3 100 3 177 2 824 1 066 824 4 259
String bean 190 523 151 618 -- --
Tomato 57 35 58 43 -- --
Watercress 1 300 -- 688 136 1 364 --
White radish 1 400 2 078 936 1 416 -- 1 878
Notes: - “—“ denotes data not available.
-Results of Beijing and Xiamen are rounded to whole figure.

24
48. The nitrite concentrations in vegetables were generally low with average
mean nitrite concentration less than 1 mg/kg. The nitrite concentrations in 66%
of vegetable samples were below the limit of detection. Beet root was found to
have the highest mean nitrite concentration 7.6 mg/kg (range 3.1-8.9 mg/kg) and
one garlic spear sample had nitrite concentration up to 21 mg/kg.
49. Due to the different climates of origin of vegetables and limited sample
size for each type of vegetables, it is difficult to conclude whether the difference,
if any, in nitrate concentrations between vegetables sampled in summer and winter
was caused by seasonal variation or other factors.
Effects on soaking and blanching on reducing nitrate in vegetables
50. The change in nitrate proportion of Chinese flowering cabbage, Chinese
spinach and celery during soaking was shown in Table 3. There were 97 to 100%
of nitrate reminded in the three vegetables after soaking in water for 2 hours.
Table 3: Nitrate proportion in vegetables (%) during soaking.
0 h 1 h 2 h
Chinese flowering cabbage 100 99 99
Chinese spinach 100 98 97
Celery 100 100 100
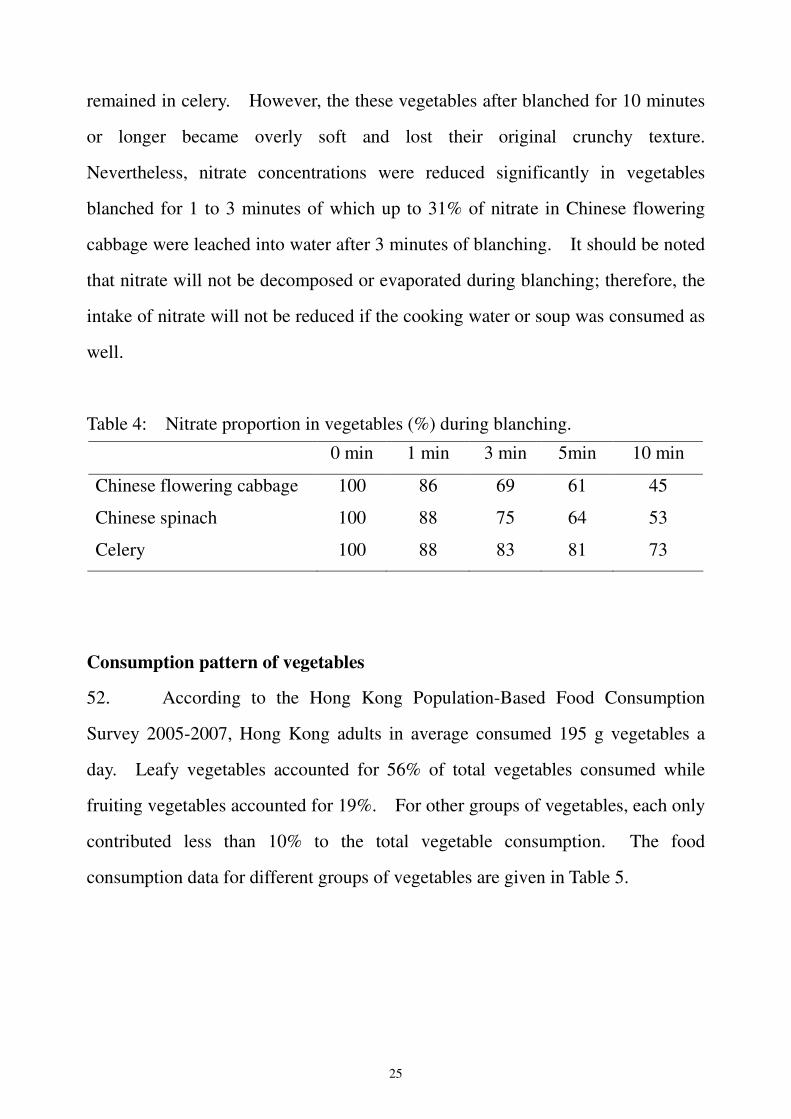
51. The change in nitrate proportion in vegetables during cooking was shown
in Table 4. The nitrate proportion in vegetables decreased with the blanching
time. After 10 minutes of blanching, only 45% and 53% of nitrate remained in
Chinese flowering cabbage and Chinese spinach, respectively, and 73% of nitrate
25
remained in celery. However, the these vegetables after blanched for 10 minutes
or longer became overly soft and lost their original crunchy texture.
Nevertheless, nitrate concentrations were reduced significantly in vegetables
blanched for 1 to 3 minutes of which up to 31% of nitrate in Chinese flowering
cabbage were leached into water after 3 minutes of blanching. It should be noted
that nitrate will not be decomposed or evaporated during blanching; therefore, the
intake of nitrate will not be reduced if the cooking water or soup was consumed as
well.
Table 4: Nitrate proportion in vegetables (%) during blanching.
0 min 1 min 3 min 5min 10 min
Chinese flowering cabbage 100 86 69 61 45
Chinese spinach 100 88 75 64 53
Celery 100 88 83 81 73
Consumption pattern of vegetables
52. According to the Hong Kong Population-Based Food Consumption
Survey 2005-2007, Hong Kong adults in average consumed 195 g vegetables a
day. Leafy vegetables accounted for 56% of total vegetables consumed while
fruiting vegetables accounted for 19%. For other groups of vegetables, each only
contributed less than 10% to the total vegetable consumption. The food
consumption data for different groups of vegetables are given in Table 5.

26
Table 5: Consumption pattern of vegetables of Hong Kong adults.
Type of vegetables Mean consumption
(g/day)
Percentage
(%)
Leafy vegetables 110 56
Brassica vegetables 9 4
Stalk and Stem vegetables 5 2
Bulb vegetables 7 3
Legume vegetables 14 7
Root and tuber vegetables 15 8
Fruiting vegetables 36 19
Others (not specified) 1 <1
Note: Data are rounded to whole figure.
Exposure to nitrate and nitrite from vegetables
53. If all vegetables consumed were raw, the dietary exposure to nitrate from
vegetables for average consumers was estimated to be 4.4 mg/kg bw/day and for
high consumers was estimated to be 13 mg/kg bw/day which are about 120% and
350% of ADI, respectively.. If all vegetables consumed were cooked, the dietary
exposure to nitrate from vegetables for the average consumer of adults was
estimated to be 3.5 mg/kg bw/day and for high consumer was estimated to be 10
mg/kg bw/day which are about 95% and 270% of ADI, respectively. A
conservative assumption was made that there was a 20% reduction of nitrate levels
in cooked vegetables in general based on the results of the cooking experiment in
the present study and the data from EFSA’s report.4
54. The dietary exposure to nitrite from vegetables for average consumers
was estimated to be 0.0038 mg/kg bw/day (lower bound) to 0.0051 mg/kg bw/day
27
(upper bound) and for high consumers was estimated to be 0.012 mg/kg bw/day
(lower bound) to 0.015 mg/kg bw/day (upper bound). The estimated exposures
to nitrite were well below the ADI.
DISCUSSION
55. The WHO/FAO expert consultation report on diet, nutrition and
prevention of chronic diseases, sets population nutrient goals. The report states
that there is convincing evidence that fruits and vegetables decrease the risk for
cardiovascular disease and obesity, and evidence that they probably decrease the
risk of diabetes.1 In addition, the IARC stated that vegetables provide
biologically active substances as well as nutrients like pro-vitamin A, vitamin C,
calcium, iron, folate, potassium, magnesium, fibre, etc. and concluded that eating
fruits and vegetables may lower the risk of cancer, particularly cancers of the
gastrointestinal tract.23
56. EFSA stated that a toxicological endpoint of concern for nitrate is
nitrosamine formation and the potential for tumour formation. However, when
nitrate is consumed in a normal diet containing vegetables, other bioactive
substances concomitantly consumed, such as the antioxidant vitamin C, may
inhibit the endogenous formation of nitrosamines. Epidemiological studies
relating to nitrate and human cancer risk do not suggest that nitrate intake from
diet or drinking water is associated with increased cancer risk. EFSA considered
that the beneficial effects of eating vegetables and fruit outweigh potential risk to
human health from exposure to nitrate through vegetables.4
57. When assessing risk from nitrate in vegetable, both the potential risk of
28
nitrate and the benefits of eating vegetables have to be considered. According to
JECFA, it is inappropriate to compare exposure to nitrate from vegetables
directly with the ADI because of well-known benefits of vegetables and the lack of
data on the possible effects of vegetable matrices on the bio-availability of nitrate.8
In addition, negative correlation between nitrate intake and gastric cancer was
found by some studies which may due to the known strong protective effect of
vegetables and fruits on the risk of gastric cancer.6
58. The French Food Safety Agency commented that based on present
toxicological studies, the nitrate and nitrite effects on human health are still not
agreed upon, it is therefore important to keep conducting toxicological studies to
establish more accurate ADIs.24
59. Nevertheless, a reduce nitrate contamination in vegetables can represent
added value for vegetable already rich in essential nutrients. Furthermore, it is
prudent to reduce dietary nitrate and nitrite intake by maintaining a balance diet
and avoiding over-indulgent in foods that contain nitrate or nitrite as food
additives as well as vegetables containing high levels of nitrate.
60. Incorrect storage of homemade purees of mixed vegetables were potential
causes of acquired infantile methaemoglobinaemia and age at risk is not limited to
the first 4 to 6 months of life.17
This indicates health risk to young infants from
consuming improperly handled vegetables resulting from nitrite accumulation
cannot be ruled out.

29
LIMITATIONS
61. The nitrate concentrations varied greatly among vegetables. Although
over 700 individual samples from 73 types of vegetables were taken in this study,
increasing the number of sample for each vegetable for laboratory analysis could
provide a more precise estimate of the average concentrations of nitrate and nitrite
for each vegetable.
62. There are uncertainties in this study. Firstly, the study did not cover all
nitrate and nitrite containing foods. The estimated dietary exposures of nitrate
and nitrite were based on vegetables consumption only. Secondly, raw
vegetables were analysed for nitrate and nitrite while the consumption data were
based on vegetables as consumed and they were mostly eaten cooked. The
nitrate and nitrite concentrations of cooked vegetables could be lower from their
raw counterparts.
CONCLUSION AND RECOMMEDATIONS
63. The levels of nitrate and nitrite found in vegetables in this study were
unlikely to pose any immediate health risk to the general population. However,
health risk to infants from consuming improperly handled vegetables that contain
high nitrite levels cannot be ruled out. Current knowledge and evidence
indicated there are strong beneficial effects of consumption of vegetables. In
order to maximise the health benefits from eating vegetables, measures have to be
taken to reduce the nitrate and nitrite exposure while maintaining the
recommended intake of vegetables of the public.
30
Advice to public
1. Maintain a balanced diet with at least two servings of fruit and three
servings of vegetables every day and eat a wide variety of vegetables
including leafy vegetables, brassica vegetables, root and tuber vegetables,
fruiting vegetables, legume vegetables, etc.
2. Handle and cook vegetables properly (i.e. keep vegetables under
refrigeration if they are not being cooked immediately; cook vegetables
soon after chopping or mashing; wash, peel, vegetables; blanch high-nitrate
vegetables in water and discard the cooking water before consumption.)
3. WHO recommends exclusive breastfeeding for infants up to 6 months of
age with appropriate complementary foods afterwards. Generally, infants
about 6 months of age are ready for solid foods. Infant foods such as
vegetable puree and vegetable congee should be prepared for immediate
use. If storage is needed, they should be kept in freezer (at or below -18oC)
to avoid accumulation of nitrite due to contamination of bacteria of the
food.
Advice to trade
1. Farmers are advised to observe good agriculture practice (GAP) to
minimize nitrate concentrations in vegetables. These include:
-reduce the use of chemical fertilizers (particularly nitrogen source
fertilizer, e.g. urea) to avoid excess nitrate build up in soil or
vegetables;

31
-conduct regular laboratory check (e.g. at least once a year) on
nitrate/ammonium level in irrigation water; and
-follow good soil management practices (e.g. crop rotation, organic
matter application) to enhance growth of soil microbes hence
facilitating a balanced nitrogen cycle.
2. The trade should obtain vegetables from reliable sources and maintain
proper records to enable source tracing when required.
3. The trade should store vegetables in either refrigerator or cool and dry
places to avoid excessive formulation of nitrite due to spoilage of the
vegetables.
32
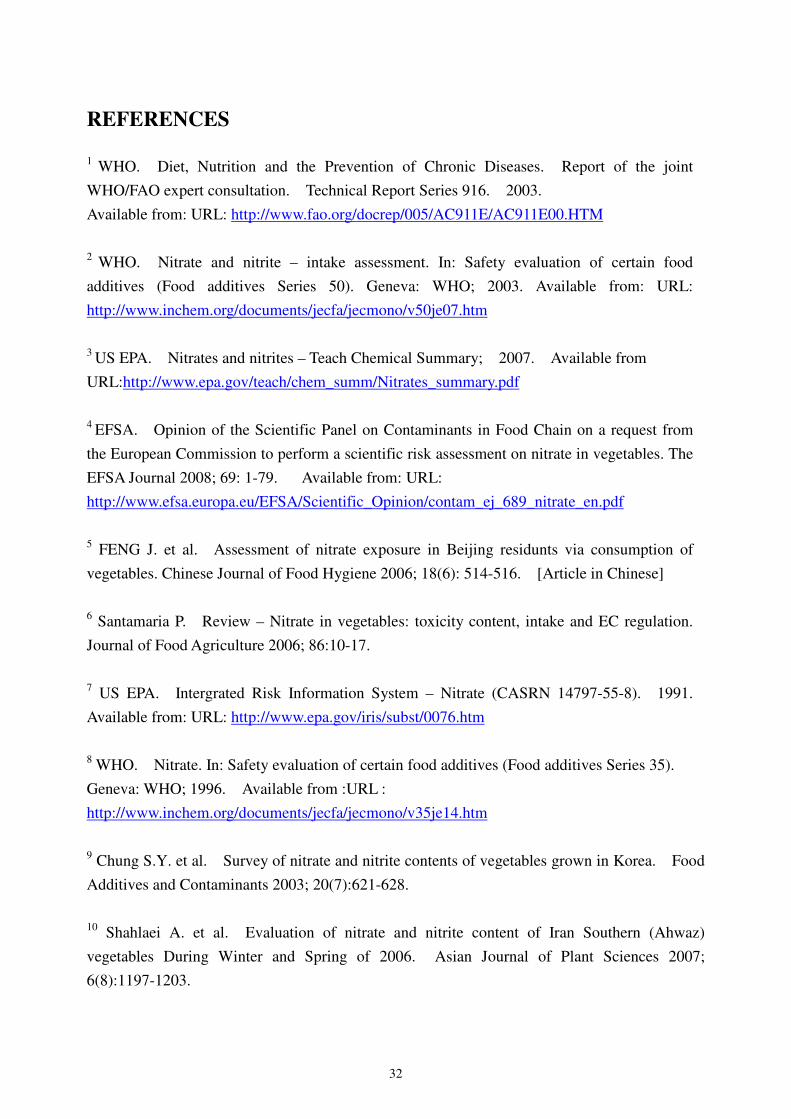
REFERENCES
1 WHO. Diet, Nutrition and the Prevention of Chronic Diseases. Report of the joint
WHO/FAO expert consultation. Technical Report Series 916. 2003.
Available from: URL: http://www.fao.org/docrep/005/AC911E/AC911E00.HTM
2 WHO. Nitrate and nitrite – intake assessment. In: Safety evaluation of certain food
additives (Food additives Series 50). Geneva: WHO; 2003. Available from: URL:
http://www.inchem.org/documents/jecfa/jecmono/v50je07.htm
3 US EPA. Nitrates and nitrites – Teach Chemical Summary; 2007. Available from
URL:http://www.epa.gov/teach/chem_summ/Nitrates_summary.pdf
4
EFSA. Opinion of the Scientific Panel on Contaminants in Food Chain on a request from
the European Commission to perform a scientific risk assessment on nitrate in vegetables. The
EFSA Journal 2008; 69: 1-79. Available from: URL:
http://www.efsa.europa.eu/EFSA/Scientific_Opinion/contam_ej_689_nitrate_en.pdf
5 FENG J. et al. Assessment of nitrate exposure in Beijing residunts via consumption of
vegetables. Chinese Journal of Food Hygiene 2006; 18(6): 514-516. [Article in Chinese]
6 Santamaria P. Review – Nitrate in vegetables: toxicity content, intake and EC regulation.
Journal of Food Agriculture 2006; 86:10-17.
7 US EPA. Intergrated Risk Information System – Nitrate (CASRN 14797-55-8). 1991.
Available from: URL: http://www.epa.gov/iris/subst/0076.htm
8 WHO. Nitrate. In: Safety evaluation of certain food additives (Food additives Series 35).
Geneva: WHO; 1996. Available from :URL :
http://www.inchem.org/documents/jecfa/jecmono/v35je14.htm
9 Chung S.Y. et al. Survey of nitrate and nitrite contents of vegetables grown in Korea. Food
Additives and Contaminants 2003; 20(7):621-628.
10 Shahlaei A. et al. Evaluation of nitrate and nitrite content of Iran Southern (Ahwaz)
vegetables During Winter and Spring of 2006. Asian Journal of Plant Sciences 2007;
6(8):1197-1203.
33
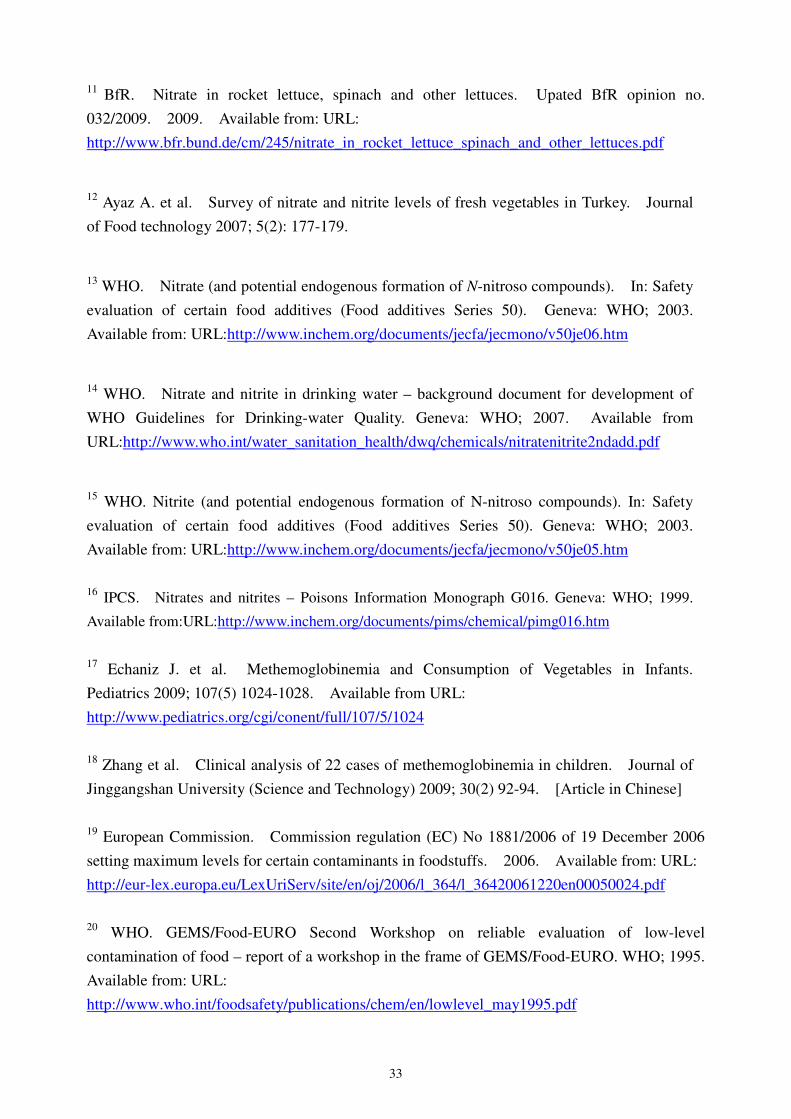
11 BfR. Nitrate in rocket lettuce, spinach and other lettuces. Upated BfR opinion no.
032/2009. 2009. Available from: URL:
http://www.bfr.bund.de/cm/245/nitrate_in_rocket_lettuce_spinach_and_other_lettuces.pdf
12 Ayaz A. et al. Survey of nitrate and nitrite levels of fresh vegetables in Turkey. Journal
of Food technology 2007; 5(2): 177-179.
13
WHO. Nitrate (and potential endogenous formation of N-nitroso compounds). In: Safety
evaluation of certain food additives (Food additives Series 50). Geneva: WHO; 2003.
Available from: URL:http://www.inchem.org/documents/jecfa/jecmono/v50je06.htm
14 WHO. Nitrate and nitrite in drinking water – background document for development of
WHO Guidelines for Drinking-water Quality. Geneva: WHO; 2007. Available from
URL:http://www.who.int/water_sanitation_health/dwq/chemicals/nitratenitrite2ndadd.pdf
15 WHO. Nitrite (and potential endogenous formation of N-nitroso compounds). In: Safety
evaluation of certain food additives (Food additives Series 50). Geneva: WHO; 2003.
Available from: URL:http://www.inchem.org/documents/jecfa/jecmono/v50je05.htm
16 IPCS. Nitrates and nitrites – Poisons Information Monograph G016. Geneva: WHO; 1999.
Available from:URL:http://www.inchem.org/documents/pims/chemical/pimg016.htm
17
Echaniz J. et al. Methemoglobinemia and Consumption of Vegetables in Infants.
Pediatrics 2009; 107(5) 1024-1028. Available from URL:
http://www.pediatrics.org/cgi/conent/full/107/5/1024
18
Zhang et al. Clinical analysis of 22 cases of methemoglobinemia in children. Journal of
Jinggangshan University (Science and Technology) 2009; 30(2) 92-94. [Article in Chinese]
19
European Commission. Commission regulation (EC) No 1881/2006 of 19 December 2006
setting maximum levels for certain contaminants in foodstuffs. 2006. Available from: URL:
http://eur-lex.europa.eu/LexUriServ/site/en/oj/2006/l_364/l_36420061220en00050024.pdf
20
WHO. GEMS/Food-EURO Second Workshop on reliable evaluation of low-level
contamination of food – report of a workshop in the frame of GEMS/Food-EURO. WHO; 1995.
Available from: URL:
http://www.who.int/foodsafety/publications/chem/en/lowlevel_may1995.pdf
34
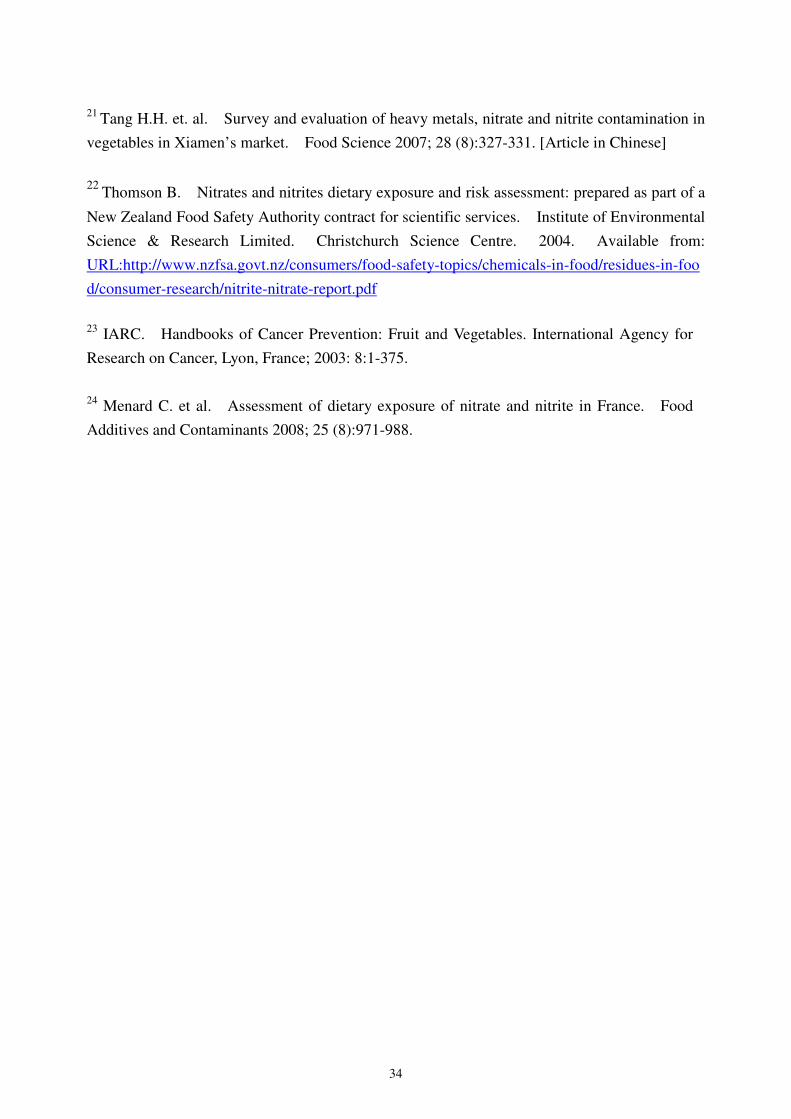
21
Tang H.H. et. al. Survey and evaluation of heavy metals, nitrate and nitrite contamination in
vegetables in Xiamen’s market. Food Science 2007; 28 (8):327-331. [Article in Chinese]
22 Thomson B. Nitrates and nitrites dietary exposure and risk assessment: prepared as part of a
New Zealand Food Safety Authority contract for scientific services. Institute of Environmental
Science & Research Limited. Christchurch Science Centre. 2004. Available from:
URL:http://www.nzfsa.govt.nz/consumers/food-safety-topics/chemicals-in-food/residues-in-foo
d/consumer-research/nitrite-nitrate-report.pdf
23
IARC. Handbooks of Cancer Prevention: Fruit and Vegetables. International Agency for
Research on Cancer, Lyon, France; 2003: 8:1-375.
24
Menard C. et al. Assessment of dietary exposure of nitrate and nitrite in France. Food
Additives and Contaminants 2008; 25 (8):971-988.

35
An
nex
Nit
rate
an
d N
itri
te C
on
cen
trati
on
s in
Veg
etab
les
(mg/k
g)
N
itra
te
N
itri
te
Veg
etab
les
Nu
mb
er
of
sam
ple
s M
ean
R
an
ge
Mea
nR
an
ge
Lea
fy V
eget
ab
les
(in
clu
din
g B
rass
ica L
eafy
Veg
etab
les)
20 (
typ
es)
2 1
00
79-6
300
1.2
N
D-9
.1
Bab
y C
hin
ese
cabb
age
10
2 100
540-2
800
0.6
N
D-1
.2
Bea
n s
hoota
5
260
120-4
30
0.5
N
D-0
.9
Cey
lon s
pin
ach
b
5
1 100
79-2
300
ND
N
D
Chin
ese
spin
ach/C
hin
ese
amar
anth
b
5
4 8
00
3 7
00-6
300
1.7
0.9
-2.6
Chin
ese
cabbag
e/ T
iennts
in c
abbag
e 10
1 3
00
480-2
900
0.6
N
D-1
.2
Chin
ese
flow
erin
g c
abbag
e
10
2 4
00
1 2
00-3
500
3.3
N
D-7
.8
Chin
ese
kal
e
10
1 6
00
340-2
700
1.6
N
D-5
.9
Chin
ese
lett
uce
10
1 3
00
670-1
800
0.5
N
D-1
.3
Chin
ese
wolf
ber
ry
10
2 4
00
1 4
00-3
000
1.1
N
D-1
.7
Cori
ander
10
3 2
00
1 8
00-5
000
0.6
N
D-1
.1
Euro
pea
n l
ettu
ce
10
950
600-1
400
0.5
N
D-1
.0
Gre
en w
ater
spin
ach
10
870
190-2
500
0.5
N
D-1
.2
India
n l
ettu
ce
10
1 3
00
510-1
900
0.5
N
D-0
.9
Lea
f m
ust
ard
10
3 3
00
2 1
00-4
500
1.2
N
D-2
.2
Pet
iole
Chin
ese
cabbag
e/P
etio
le b
ok c
hoi
10
4 1
00
2 3
00-5
400
2.6
N
D-9
.1
Red
Chin
ese
spin
ach
b
5
2 0
00
94-3
900
1.3
0.8
-1.9
Shan
ghai
cab
bag
e
10
3 6
00
2 3
00-5
100
2.2
N
D-5
.0
Spin
ach
10
3 1
00
1 1
00-4
700
2.3
N
D-5
.7
Wat
ercr
ess
10
1 3
00
580-2
200
0.7
N
D-1
.9
Whit
e w
ater
spin
ach
b
5
1 2
00
290-2
400
0.6
N
D-1
.6
Bra
ssic
a (
Cole
or
Cab
bage)
Veg
etab
les,
Hea
d C
ab
bages
, F
low
erh
ead
Cab
bages
3 (t
yp
es)
620
16-2
800
0.5
N
D-0
.9
Bro
ccoli
10
420
280-6
70
0.5
N
D-0
.9
Cau
lifl
ow
er
10
250
25-7
20
0.5
N
D-1
.1
Euro
pea
n v
arie
ty c
abbag
e
10
1 2
00
16-2
800
0.5
N
D-0
.9
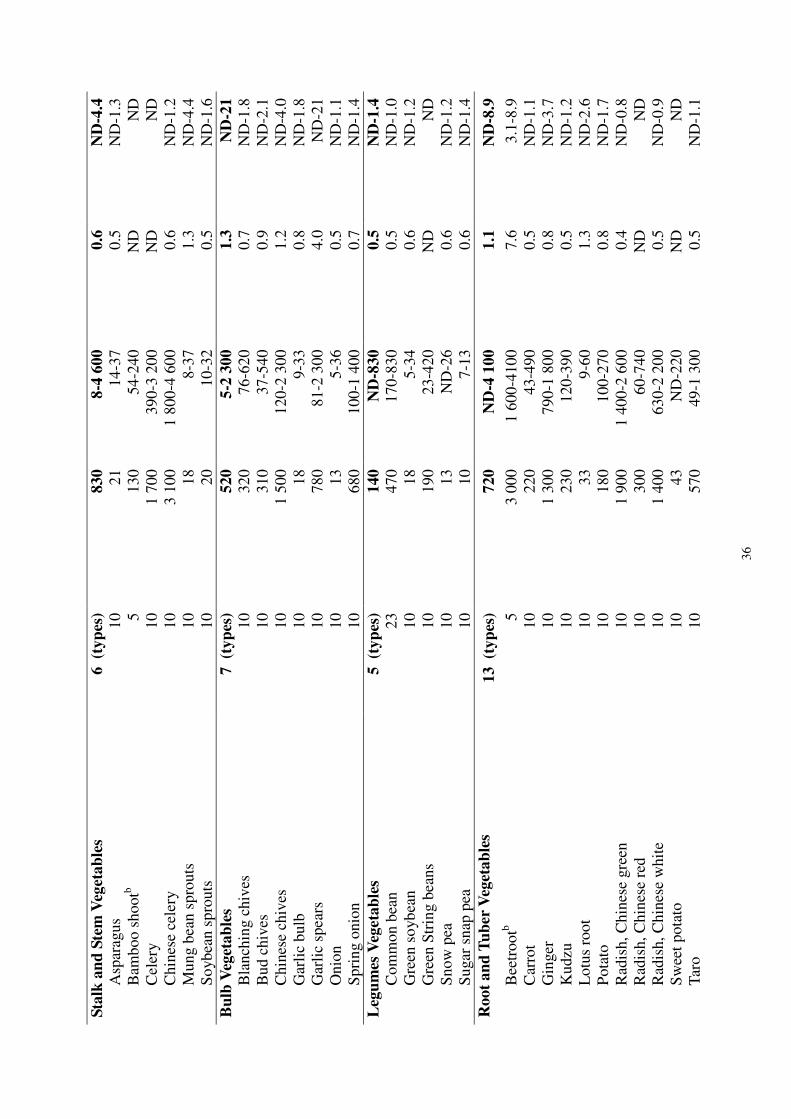
36
Sta
lk a
nd
Ste
m V
eget
ab
les
6 (t
yp
es)
830
8-4
600
0.6
N
D-4
.4
Asp
arag
us
10
21
14-3
7
0.5
N
D-1
.3
Bam
boo s
hootb
5
130
54-2
40
ND
N
D
Cel
ery
10
1 7
00
390-3
200
ND
N
D
Chin
ese
cele
ry
10
3 1
00
1 8
00-4
600
0.6
N
D-1
.2
Mung b
ean s
pro
uts
10
18
8-3
7
1.3
N
D-4
.4
So
ybea
n s
pro
uts
10
20
10-3
2
0.5
N
D-1
.6
Bu
lb V
eget
ab
les
7 (t
yp
es)
520
5-2
300
1.3
N
D-2
1
Bla
nch
ing c
hiv
es
10
320
76-6
20
0.7
N
D-1
.8
Bud c
hiv
es
10
310
37-5
40
0.9
N
D-2
.1
Chin
ese
chiv
es
10
1 5
00
120-2
300
1.2
N
D-4
.0
Gar
lic
bulb
10
18
9-3
3
0.8
N
D-1
.8
Gar
lic
spea
rs
10
780
81-2
300
4.0
N
D-2
1
Onio
n
10
13
5-3
6
0.5
N
D-1
.1
Spri
ng o
nio
n
10
680
100-1
400
0.7
N
D-1
.4
Leg
um
es V
eget
ab
les
5 (t
yp
es)
140
ND
-830
0.5
N
D-1
.4
Com
mon b
ean
23
470
170-8
30
0.5
N
D-1
.0
Gre
en s
oyb
ean
10
18
5-3
4
0.6
N
D-1
.2
Gre
en S
trin
g b
eans
10
190
23-4
20
ND
N
D
Snow
pea
10
13
ND
-26
0.6
N
D-1
.2
Sugar
sn
ap p
ea
10
10
7-1
3
0.6
N
D-1
.4
Root
an
d T
ub
er V
eget
ab
les
13 (t
yp
es)
720
ND
-4 1
00
1.1
N
D-8
.9
Bee
trootb
5
3 0
00
1 6
00-4
100
7.6
3.1
-8.9
Car
rot
10
220
43-4
90
0.5
N
D-1
.1
Gin
ger
10
1 3
00
790-1
800
0.8
N
D-3
.7
Kudzu
10
230
120-3
90
0.5
N
D-1
.2
Lotu
s ro
ot
10
33
9-6
0
1.3
N
D-2
.6
Pota
to
10
180
100-2
70
0.8
N
D-1
.7
Rad
ish, C
hin
ese
gre
en
10
1 9
00
1 4
00-2
600
0.4
N
D-0
.8
Rad
ish, C
hin
ese
red
10
300
60-7
40
ND
N
D
Rad
ish, C
hin
ese
whit
e
10
1 4
00
630-2
200
0.5
N
D-0
.9
Sw
eet
pota
to
10
43
ND
-220
ND
N
D
Tar
o
10
570
49-1
300
0.5
N
D-1
.1

37
Wat
er c
hes
tnuts
10
20
11-3
6
0.7
N
D-1
.5
Yam
bea
ns
10
170
39-4
00
0.5
N
D-1
.1
Fru
itin
g V
eget
ab
les,
Cu
curb
its
7 (t
yp
es)
370
11-1
400
0.6
N
D-2
.2
Bit
ter
gourd
10
380
99-7
30
0.7
N
D-1
.7
Cucu
mber
10
110
28-2
60
0.5
N
D-0
.9
Hai
ry g
ourd
10
250
190-3
40
0.6
N
D-1
.2
Pum
pkin
10
260
11-8
10
0.8
N
D-2
.2
Sponge
gourd
10
260
30-4
70
ND
N
D
Wax
gourd
/Win
ter
mel
on
10
520
260-1
000
0.5
N
D-1
.0
Zu
cchin
i/Ja
de
mel
on
10
840
480-1
400
0.7
N
D-1
.3
Fru
itin
g V
eget
ab
les,
Mu
shro
om
s 6 (t
yp
es)
14
ND
-140
0.7
N
D-2
.5
Chic
ken
-leg
mush
room
10
5
ND
-11
0.5
N
D-0
.9
Gold
-nee
dle
mush
room
10
6
ND
-12
0.8
N
D-1
.5
Oyst
er m
ush
room
10
5
ND
-9
1.1
N
D-2
.5
Shii
take
mush
room
10
6
ND
-13
ND
N
D
Str
aw m
ush
room
10
16
11-2
9
0.5
N
D-1
.0
Whit
e butt
on m
ush
room
10
43
10-1
40
1.0
N
D-2
.2
Fru
itin
g V
eget
ab
les,
Oth
er t
han
Cu
curb
its
an
d M
ush
room
s 6 (t
yp
es)
93
ND
-470
0.9
N
D-2
.9
Eggpla
nt
10
350
250-4
70
0.8
N
D-1
.5
Bel
l pep
per
10
77
9-1
80
1.1
N
D-1
.7
Lon
g p
epper
10
57
9-1
50
0.9
N
D-1
.6
Tom
ato
10
57
ND
-180
0.5
N
D-0
.9
Sm
all
Red
pep
per
(hot)
10
9
ND
-24
1.3
N
D-2
.9
Sw
eet
corn
10
7
ND
-16
0.5
N
D-1
.1
No
tes:
-N
D d
eno
tes
no
t d
etec
ted
.
-L
imit
s o
f d
etec
tio
n (
LO
D)
for
nit
rate
io
ns
is 4
mg/k
g a
nd
fo
r n
itri
te i
on
s is
0.8
mg
/kg.
-M
ean v
alues
are
cal
cu
late
d b
y a
ssig
nin
g N
D r
esult
s as
hal
f L
OD
.
-Resu
lts
are
round
ed t
o 1
or
2 s
ignif
icant
fig
ure
s d
epen
ds
on t
he
det
ecti
on l
imit
.
-a w
inte
r sa
mp
les
only
.
-b s
um
mer
sam
ple
s o
nly
.