nissim silanikove department of animal physiology, agricultural research organization, the volcani...
TRANSCRIPT

Nissim SilanikoveDepartment of Animal Physiology,Agricultural Research Organization,
The Volcani Center, Israel
Interactions between bacteria type,
caseinolysis and physico-chemical
properties in caprine, ovine and bovine milk
Cork 2005
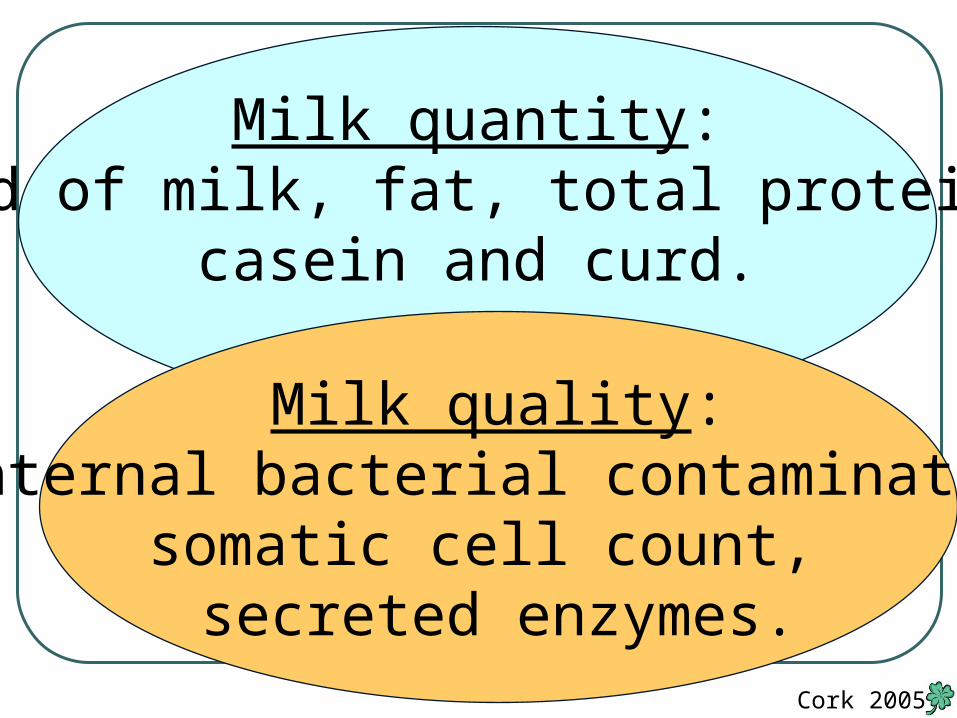
Milk quantity:Yield of milk, fat, total proteins,
casein and curd.
Milk quality: Internal bacterial contamination,
somatic cell count, secreted enzymes.
Cork 2005

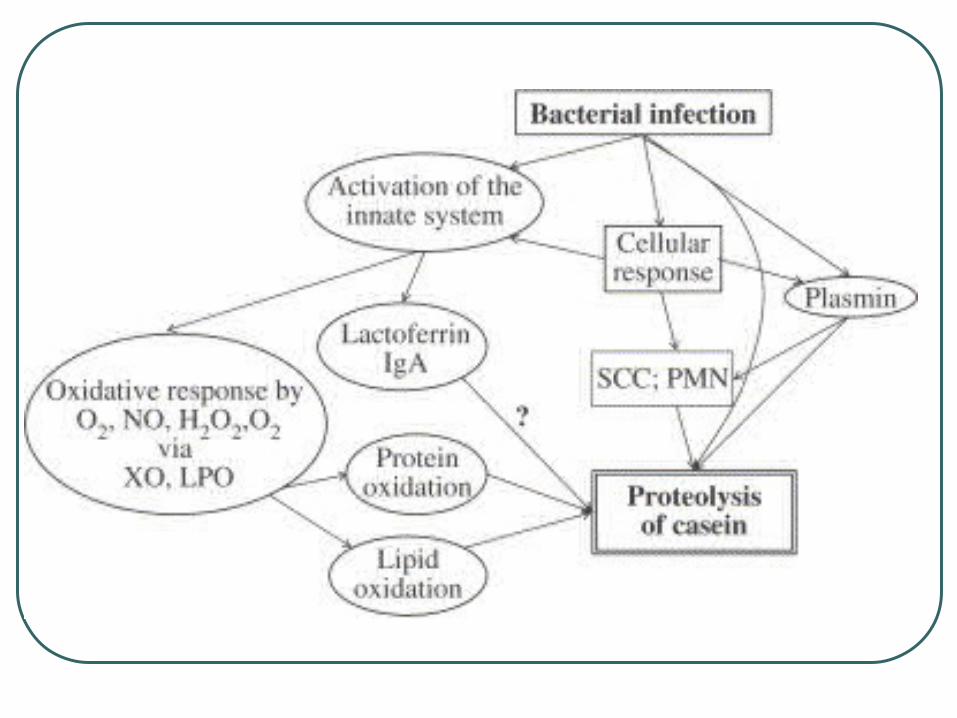
Bacterial infection may affect
caseinolysis and micelle properties
by three main routes:
1. directly, by secreting extracellular enzymes different bacteria will cause different "type"
of physico-chemical damage to the milk
Cork 2005

3. a combination of 1 and 2
2. activate the host innate immune system
milk from different type of bacteria with similar
SCC will result in similar damage to the milk
Cork 2005
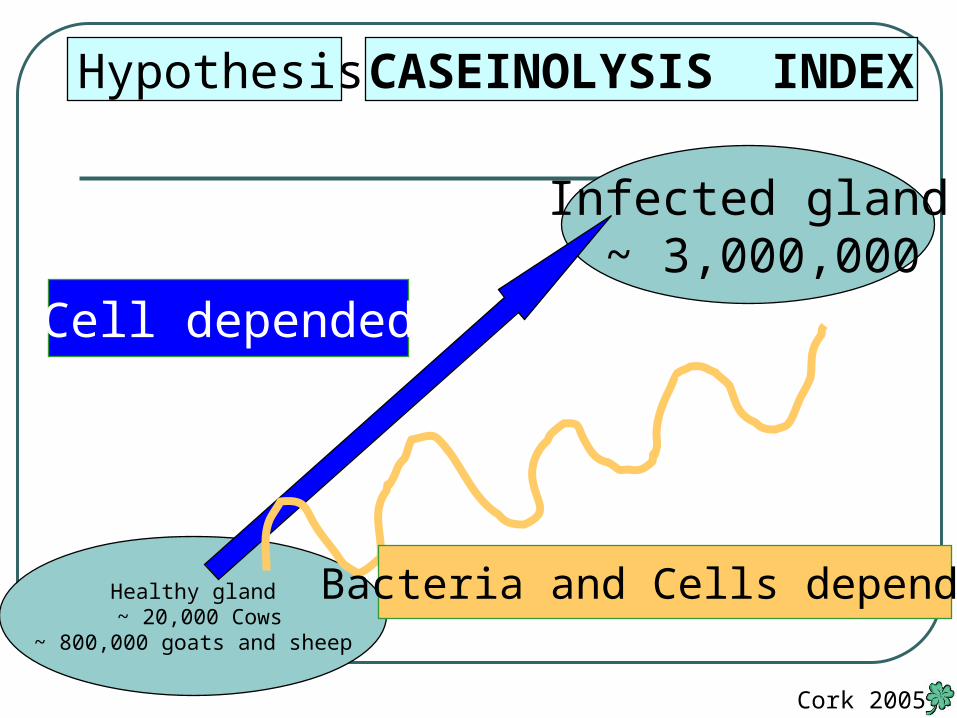
Hypothesis:
Healthy gland ~ 20,000 Cows
~ 800,000 goats and sheep
Infected gland ~ 3,000,000
CASEINOLYSIS INDEX
Cell depended
Bacteria and Cells depended
Cork 2005
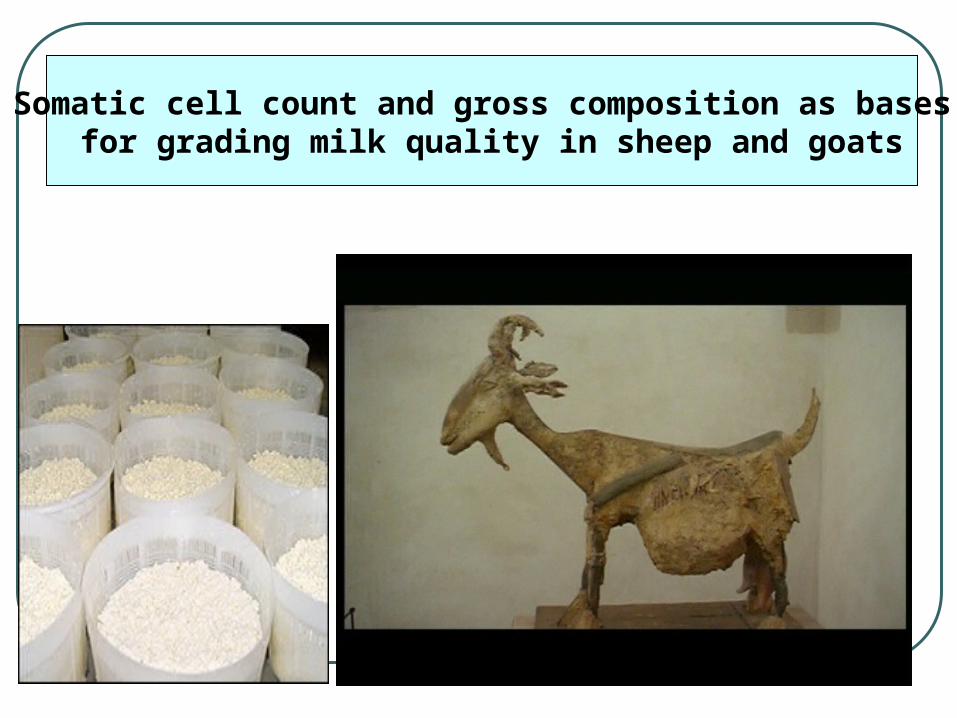
Somatic cell count and gross composition as bases for grading milk quality in sheep and goats
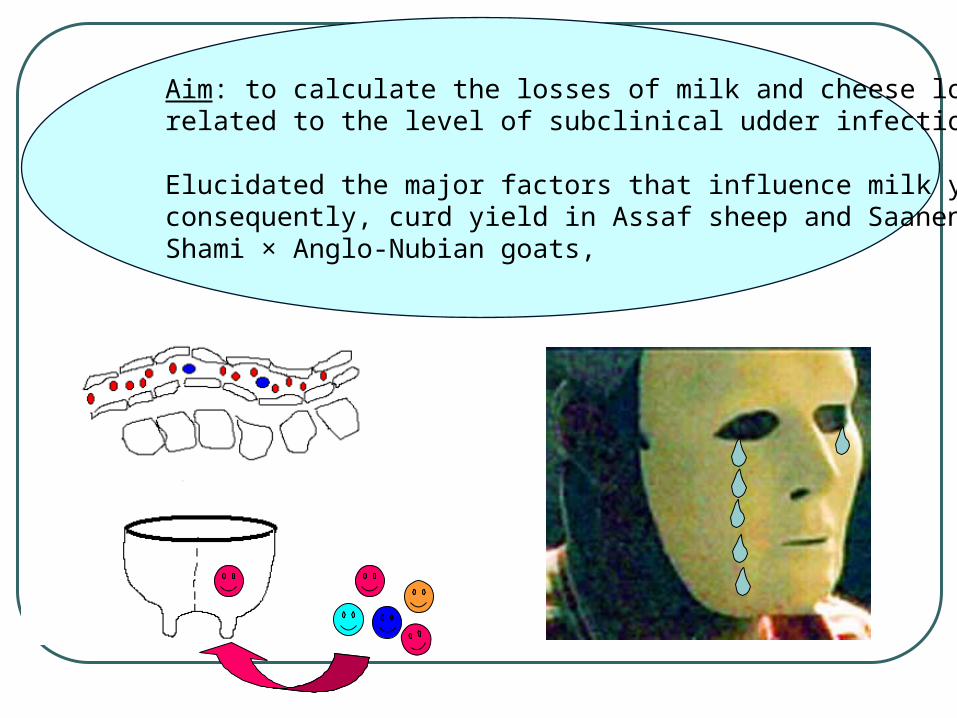
Aim: to calculate the losses of milk and cheese loss as related to the level of subclinical udder infection in a herd.
Elucidated the major factors that influence milk yield and, consequently, curd yield in Assaf sheep and Saanen and Shami × Anglo-Nubian goats,

CMTLog SCCCMTLog SCC
Uninfected0.65 b5.33 b0.91 b5.51 b
Infected2.23 a6.38 a1.59 a6.12 a
P [F]0.00010.00010.00010.0001
Bacteriological
Status
SheepGoats
The LS Means of CMT and log SCC in uninfected and infected udders and their different significance level (P [F]).
Bacteriological
Status
SheepGoats
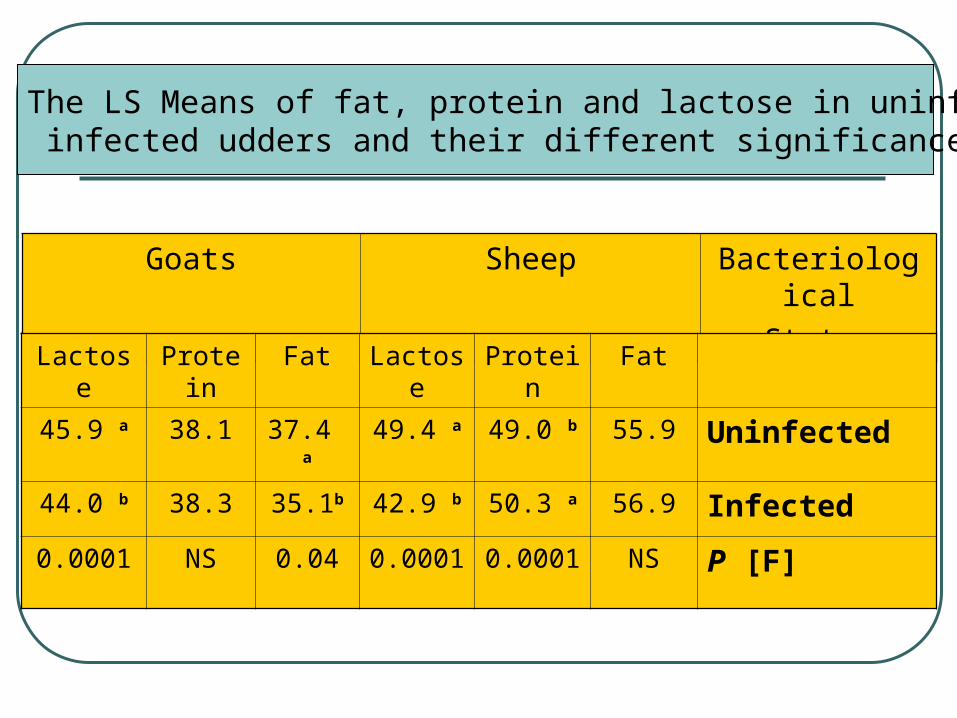
The LS Means of fat, protein and lactose in uninfected and infected udders and their different significance level (P [F]).
FatProteinLactoseFatProteinLactose
Uninfected55.949.0 b49.4 a37.4 a38.145.9 a
Infected56.950.3 a42.9 b35.1b38.344.0 b
P [F]NS0.00010.00010.04NS0.0001
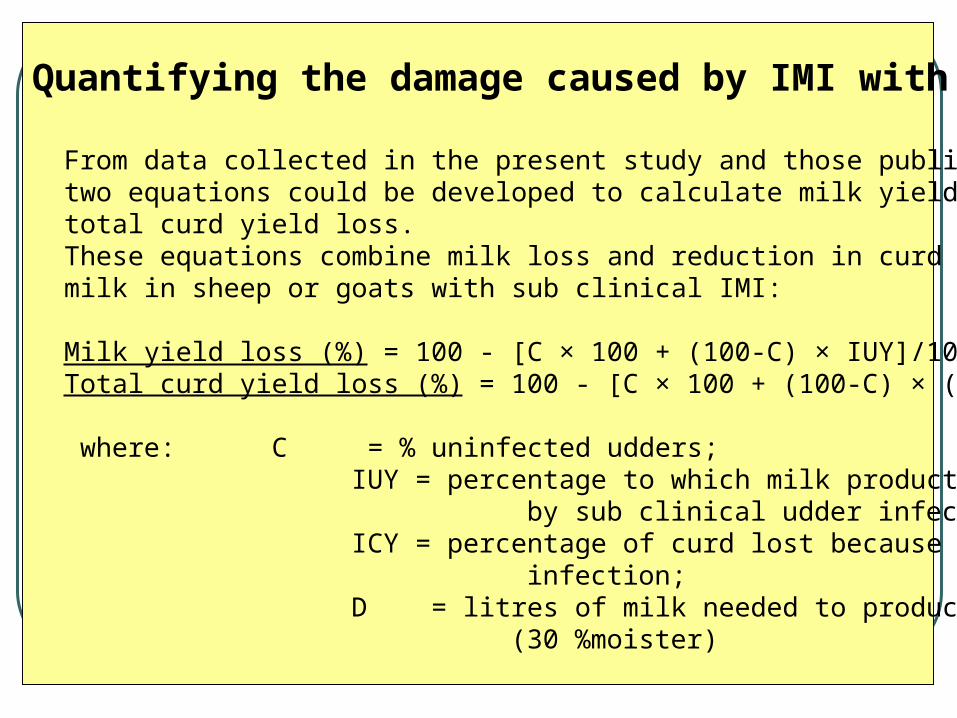
Quantifying the damage caused by IMI with CNS
From data collected in the present study and those published recently two equations could be developed to calculate milk yield loss and total curd yield loss. These equations combine milk loss and reduction in curd yield per litre of milk in sheep or goats with sub clinical IMI:
Milk yield loss (%) = 100 - [C × 100 + (100-C) × IUY]/100 Total curd yield loss (%) = 100 - [C × 100 + (100-C) × (IUY-ICY × D)]/100
where: C = % uninfected udders; IUY = percentage to which milk production is reduced by sub clinical udder infection; ICY = percentage of curd lost because of sub clinical udder infection; D = litres of milk needed to produce 1 kg of cheese (30 %moister)
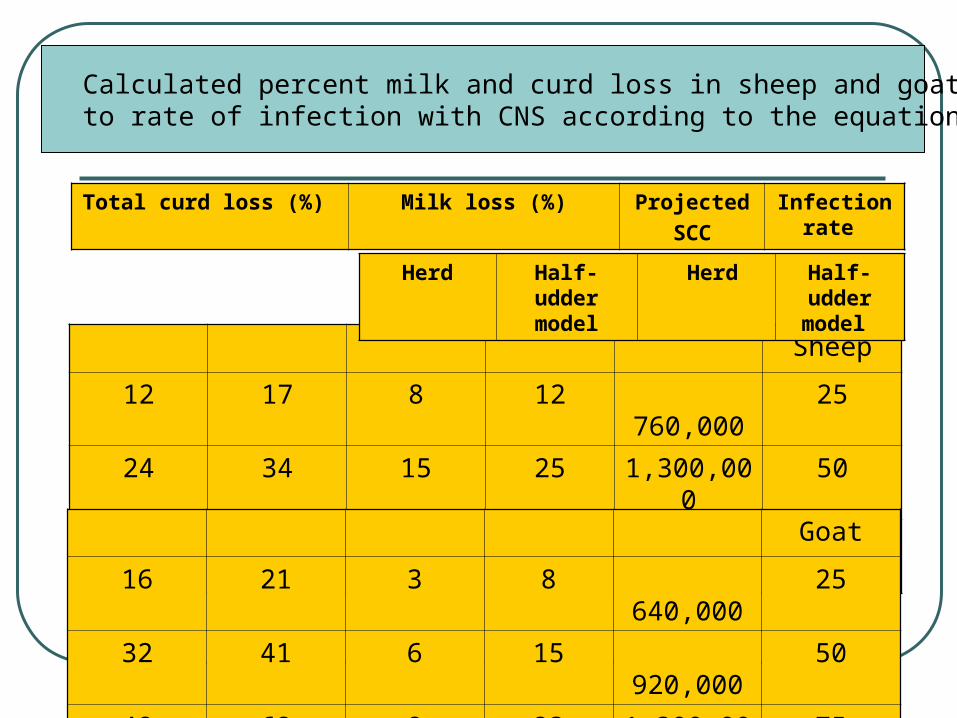
Calculated percent milk and curd loss in sheep and goats herd due to rate of infection with CNS according to the equations
Sheep
25 760,0001281712
501,300,00025153424
752,100,00038235136
Goat
25 640,000832116
50 920,0001564132
751,300,0002386248
Half-udder model
Herd Half-udder model
Herd
Infection rate
Projected
SCC
Milk loss (%)Total curd loss (%)
+ -
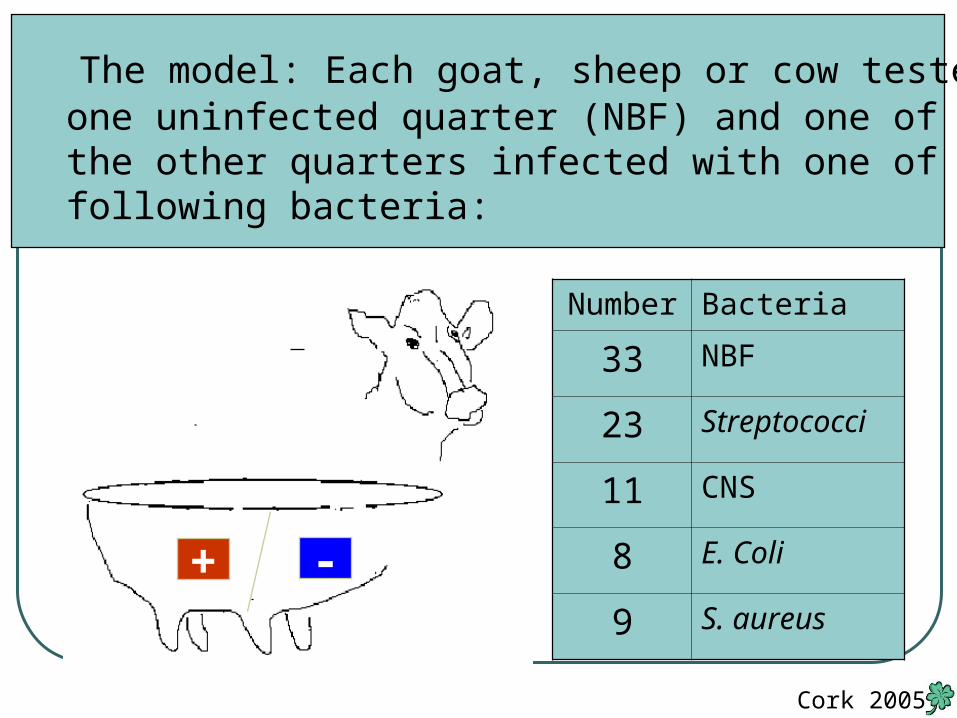
The model: Each goat, sheep or cow tested had at least one uninfected quarter (NBF) and one of the other quarters infected with one of the following bacteria:
BacteriaNumber
NBF33
Streptococci23
CNS11
E. Coli8
S. aureus9
Cork 2005
05
1015202530
35404550
Uninfected Infected
Sheep
GoatLac
tose
, g/L
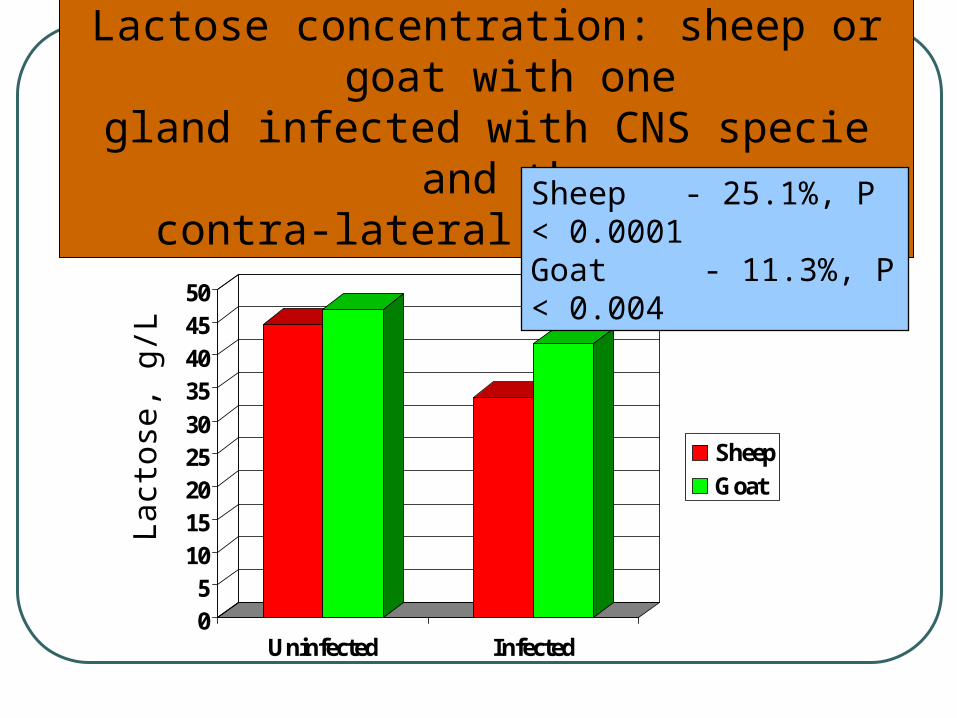
Lactose concentration: sheep or goat with onegland infected with CNS specie and the
contra-lateral being free Sheep - 25.1%, P < 0.0001Goat - 11.3%, P < 0.004

Milk yield (half) of sheep or goat infected with CNS specie in one gland and the contra-lateral being free.Open bars – S; Hatched bars – G
0.0
0.5
1.0
1.5
2.0
Uninfected Infected
Milk
yie
ld (
kg/d
ay)
00.10.20.30.40.50.6
Ratio ofreduction inMY between
goats andsheep
Ratio ofreduction in
lactosebetween
goats andsheep
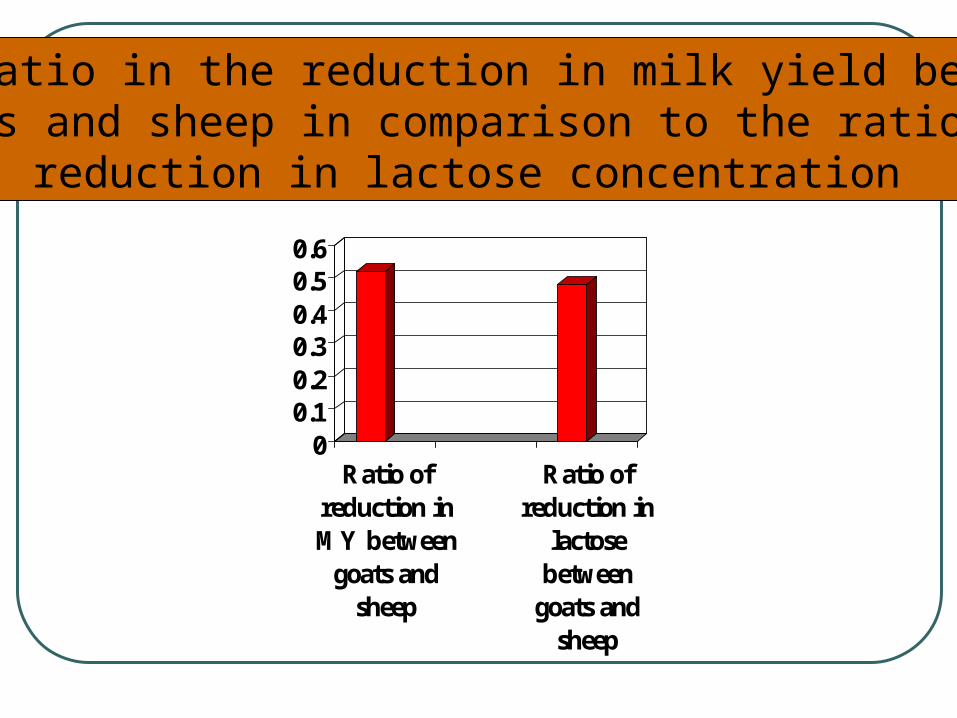
The ratio in the reduction in milk yield betweengoats and sheep in comparison to the ratio of
reduction in lactose concentration
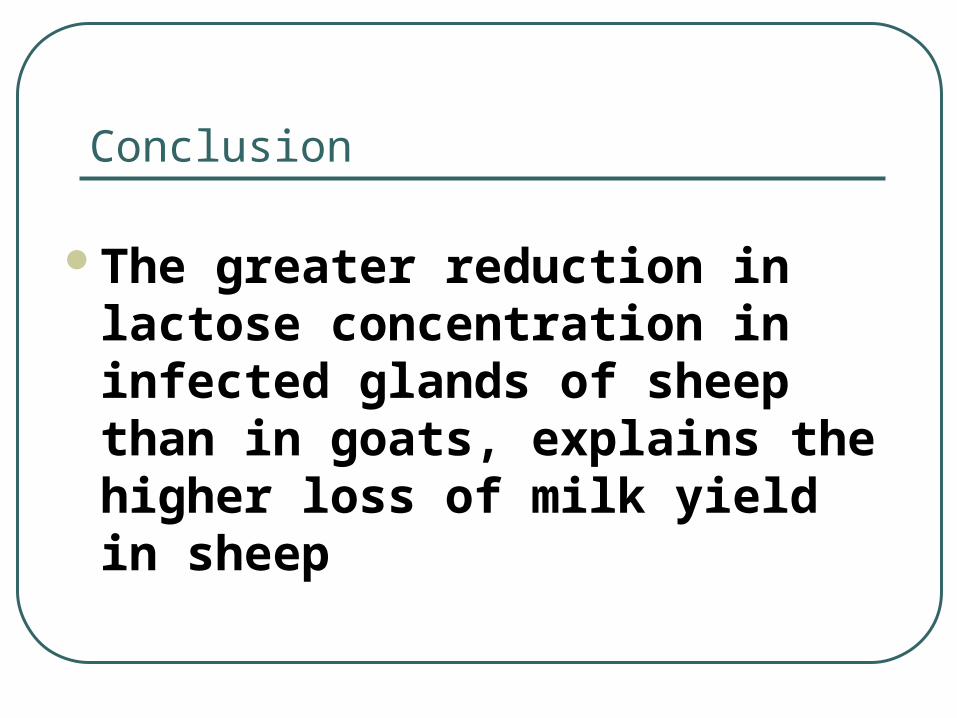
Conclusion
The greater reduction in lactose concentration in infected glands of sheep than in goats, explains the higher loss of milk yield in sheep
0
10
20
30
40
50
60
70
Uninfected Infected
Speep
Goat
fat,
g/L
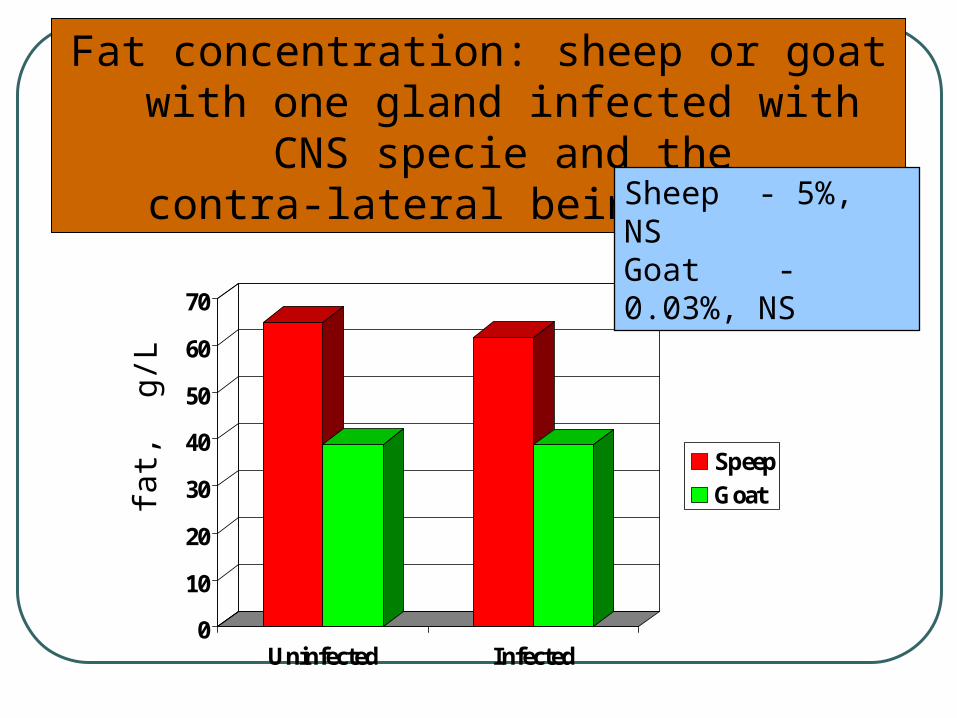
Fat concentration: sheep or goat with one gland infected with CNS specie and the
contra-lateral being free Sheep - 5%, NSGoat - 0.03%, NS
0
10
20
30
40
50
60
Uninfected Infected
Sheep
Goat
pro t
ein,
g/L
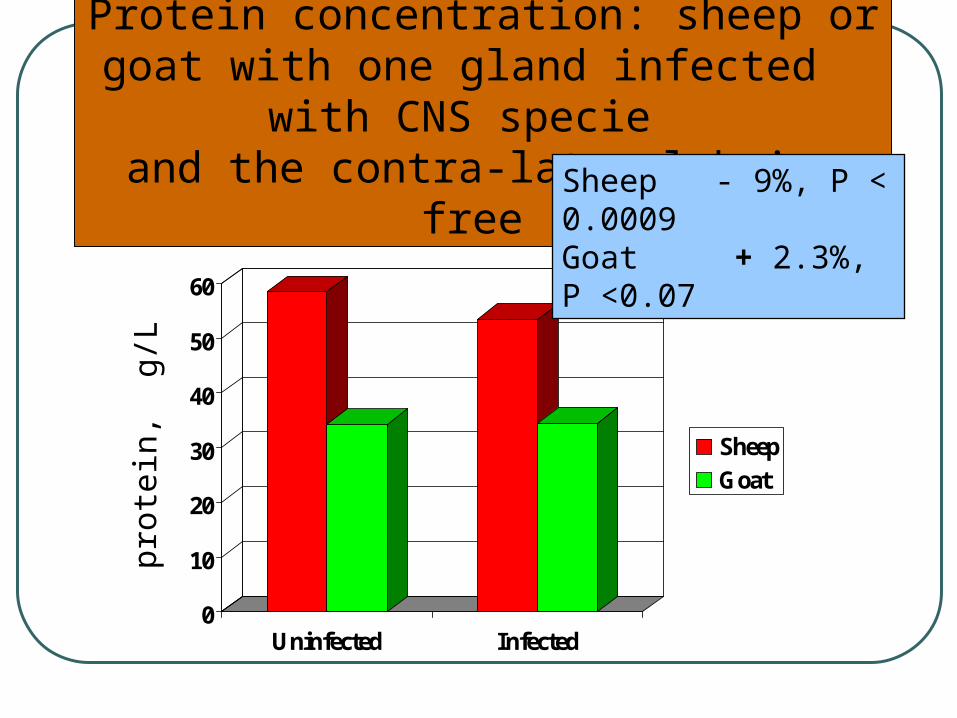
Protein concentration: sheep or goat with one gland infected with CNS specie
and the contra-lateral being free Sheep - 9%, P < 0.0009Goat + 2.3%, P <0.07

05
1015202530
35404550
Uninfected Infected
Sheep
Goatcase
in ,
g/L
Casein concentration: sheep or goat with one gland infected with CNS specie
and the contra-lateral being free Sheep - 12%, P < 0.0002Goat + 0.003%, NS

0
2
4
6
8
10
12
14
Uninfected Infected
Sheep
Goat
Whe
y, g
/L
Whey concentration: sheep or goat with one gland infected with CNS specie
and the contra-lateral being free Sheep + 7.5%, P < 0.07Goat +11.5%, P < 0.0001
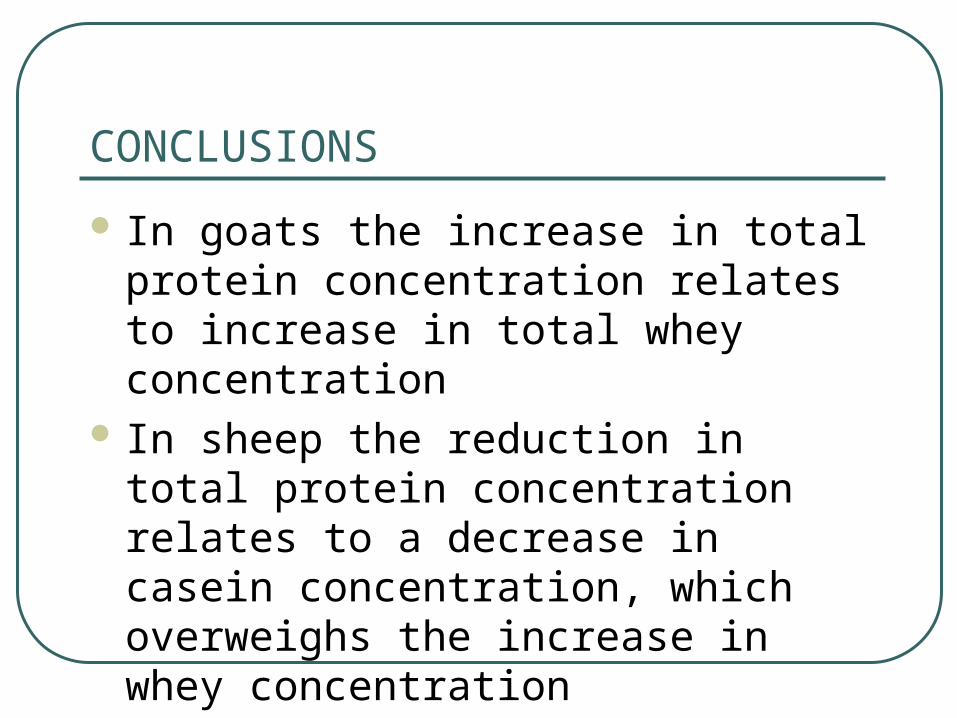
CONCLUSIONS
In goats the increase in total protein concentration relates to increase in total whey concentration
In sheep the reduction in total protein concentration relates to a decrease in casein concentration, which overweighs the increase in whey concentration

0
0.5
1
1.5
2
2.5
Uninfected Infected
Sheep
Goat
P-p
, g/L
Proteose-peptone concentration: sheep or goat with one gland infected with CNS specie
and the contra-lateral being free Sheep + 247%, P < 0.0001Goat +151%, P < 0.0001
00.20.40.60.8
11.2
1.41.61.8
2
Uninfected Infected
Speep
GoatCa,
mm
o l
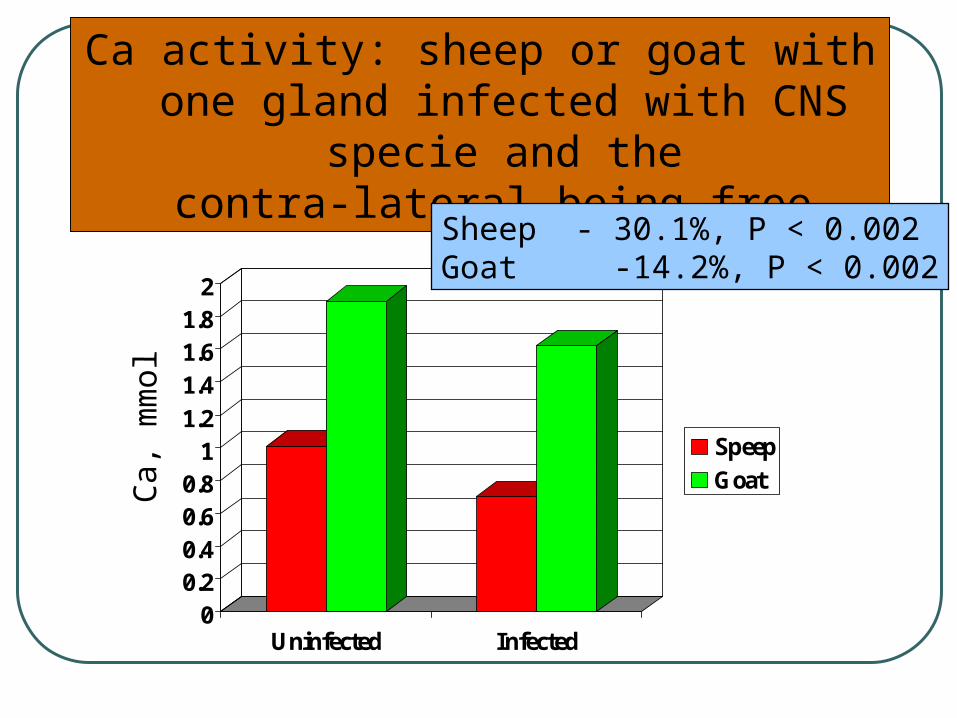
Ca activity: sheep or goat with one gland infected with CNS specie and the
contra-lateral being free Sheep - 30.1%, P < 0.002Goat -14.2%, P < 0.002

Conclusions
In both goats and sheep, infection is associated with increased casein degradation
The increase in casein degradation is greater in sheep then in goats
Measurement of Ca activity is potentially a convenient and cheap method to track casein degradation

0
500
1000
1500
2000
2500
3000
3500
4000
4500
Uninfected Infected
Sheep
Goat
PA
act
ivit
y, u
n its
/mL
Plasminogen activator activity: sheep or goat with one gland infected with CNS specie
and the contra-lateral being free Sheep + 239%, P < 0.002Goat +128%, P < 0.05

0102030405060
708090
100
Uninfected Infected
Sheep
Goat
PL
ac t
ivit
y, u
n its
/mL
Plasminogen activity: sheep or goat with one gland infected with CNS specie
and the contra-lateral being free Sheep - 32.2%, P < 0.001Goat 0%, NS

Conclusions
Plasminogen activator activity in goats is unusually high and consequently all the plasminogen in the gland is converted to plasmin
0
10
20
30
40
50
60
Uninfected Infected
Sheep
Goat
PL
ac t
ivit
y, u
n its
/mL
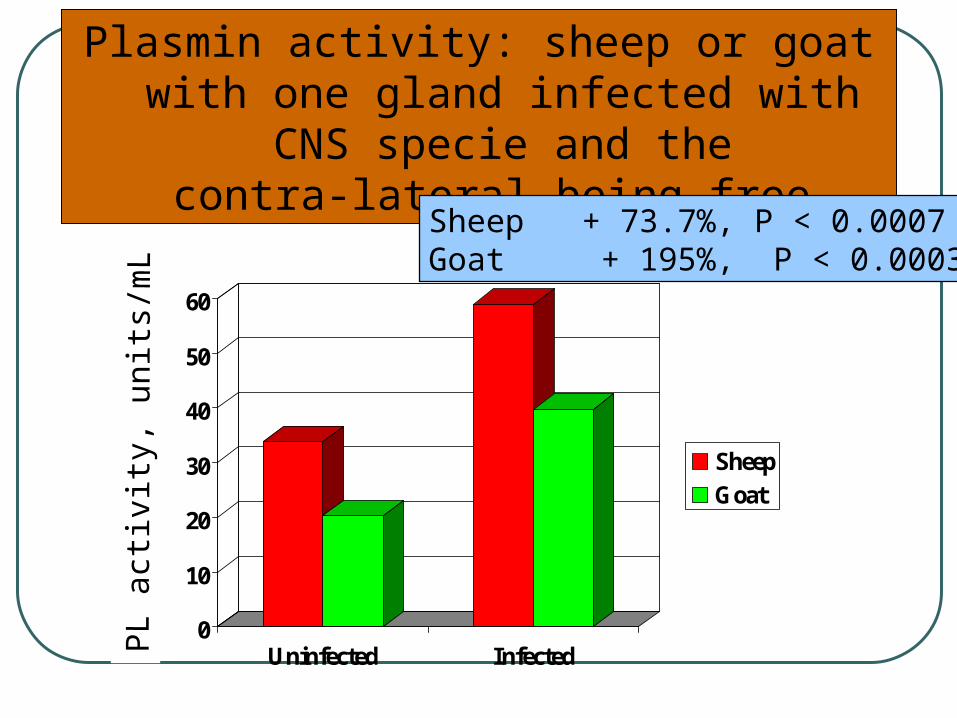
Plasmin activity: sheep or goat with one gland infected with CNS specie and the
contra-lateral being free Sheep + 73.7%, P < 0.0007Goat + 195%, P < 0.0003
Conclusions The basal level of PL activity is higher in
sheep than in goats, which explains the higher basal level of proteose-peptones
PL activity in infected glands is higher in sheep than in goats, which explain the higher increase in proteose-peptones
In sheep, the source of increased PL activity in the infected gland is accelerated conversion of plasminogen to plasmin, whereas in goats the source is external
Question: How comes that in goats accelerated degradation of casein is not reflected in casein concentration, whereas in sheep it does?
Answer: In goats the reduction in casein output (30%) is essentially similar to the reduction in milk yield, whereas in sheep the reduction in casein output (60%) is higher than in milk volume (53%).
Thus, both in goats and sheep part of the increased loss in casein yield is related to increased degradation of casein

Effect of subclinical mastitis on curd yield Yc, and clotting time Tc,
in milk of infected vs. uninfected udder halves of sheep.
0
10
20
30
300
400
500
600
700
800
900
1000
1100
1200
P < 0.0001
P < 0.0001
Gra
ms
Sec
onds
Curd yield Clotting time
Infected Uninfected

Effect of subclinical mastitis on curd yield, Yc (a) and clotting time, Tc (b), in milk of infected vs. uninfected udder halves of goats.Open bars – uninfected; Hatched bars – infected
150
175
200
225
250
aP < 0.0001
Cur
d yi
eld
(g/L
)
0
50
100
150
200
250
300
350
b P < 0.02
Clo
tting
tim
e (s
)
BacteriaNumberSCC (x1000)
PMN
(%)
CD8+
(%)
CD14+
(%)
NBF33116±20
c
32±3.3
c
4.4±0.8
b
5.0±1.1
Strep.233379±350
a
58±5.2
ab
8.9±1.6
ab
9.4±1.6
CNS11543±129
b
54±8.5 ab
17.7±3.6 a
11.3±2.9
E. coli94333±443 a
63±20.1 a
9.3±7.5 ab
10.3±7.2
S. aureus91148±163
b
82±1.7
a
1.3±0.1
c
5.8±0.6
SCC and cell differentiation according to bacteria isolates in the milk
Cork 2005

No significant differences were fund among the
different bacteria in fat, protein and casein
Lactose concentrations was significantly
Lower in milk from all infected quarters
compared to milk from uninfected quarters,
regardless of type of bacteria
Cork 2005
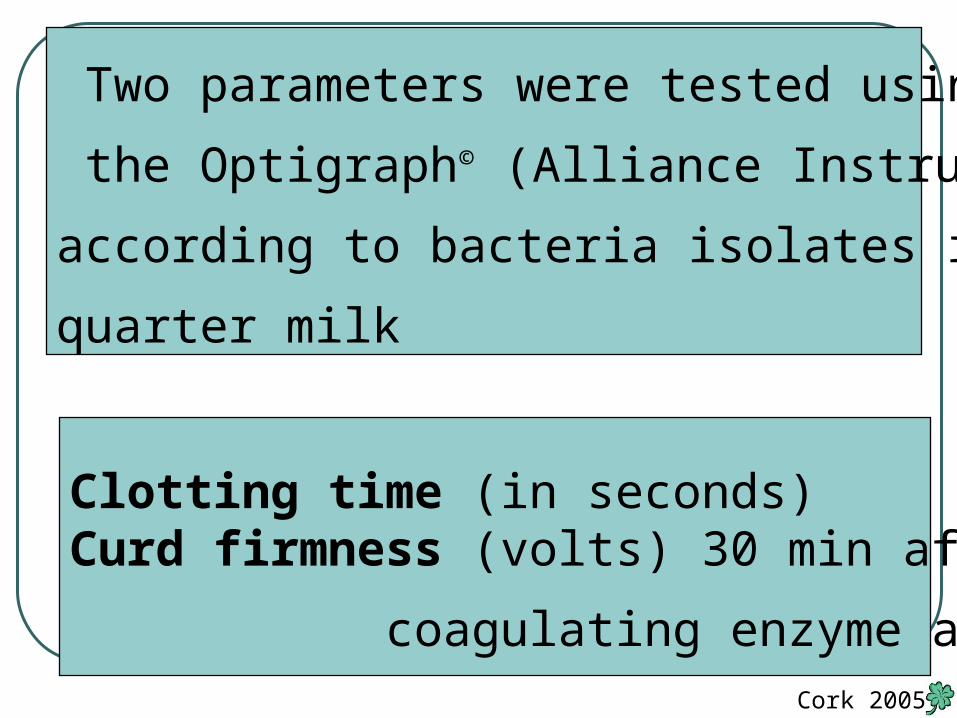
Clotting time (in seconds) Curd firmness (volts) 30 min after
coagulating enzyme additions
Two parameters were tested using
the Optigraph© (Alliance Instruments)
according to bacteria isolates in the
quarter milk
Cork 2005
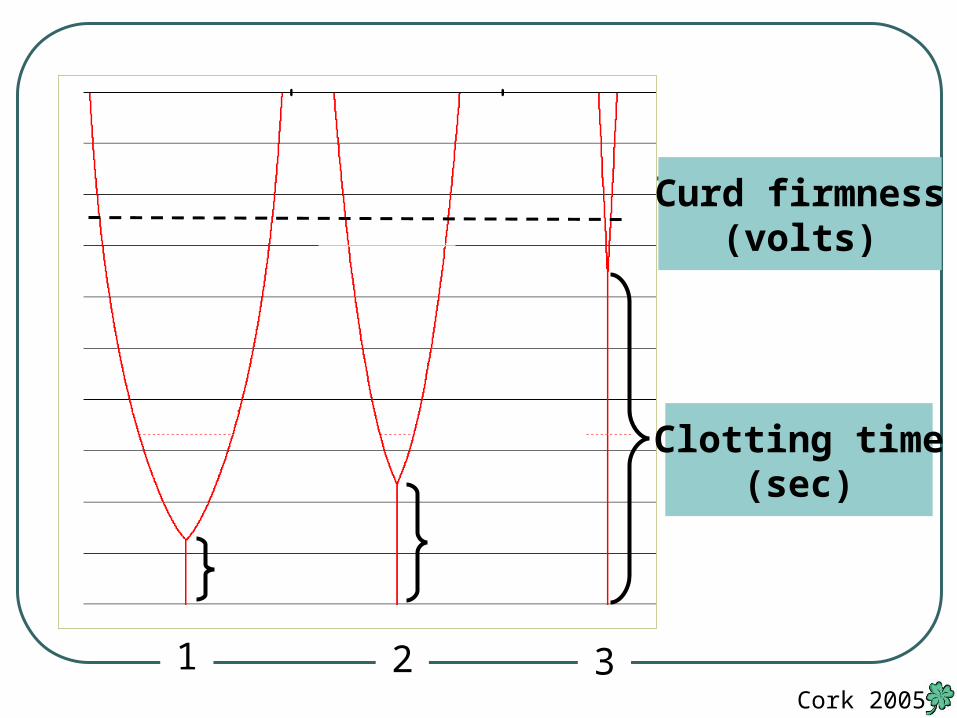
1 2 3
Curd firmness(volts)
Clotting time(sec)
Cork 2005
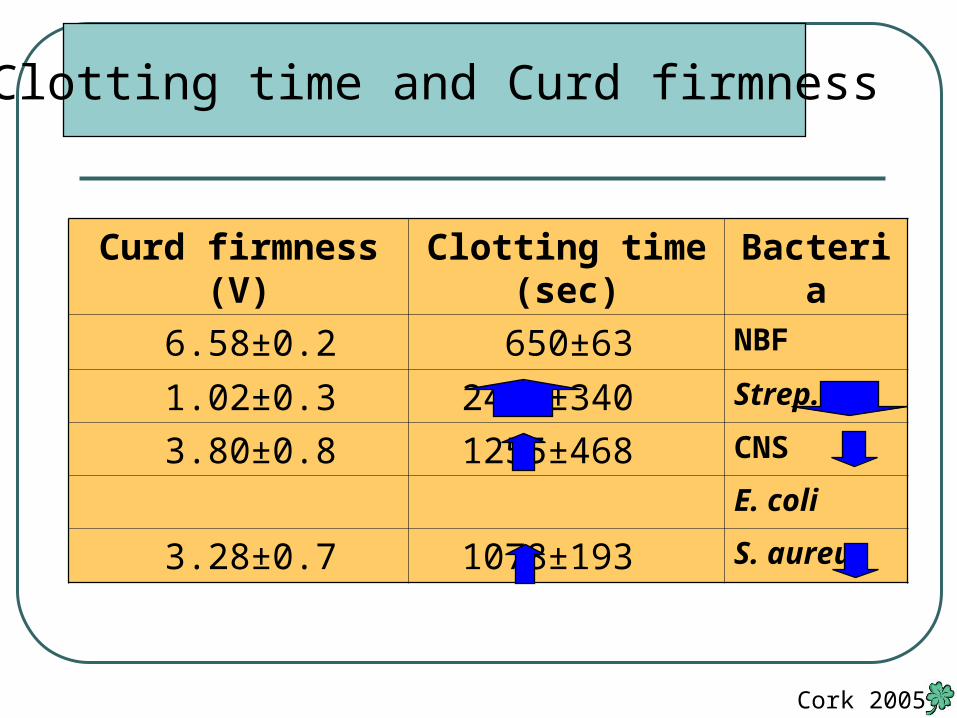
Clotting time and Curd firmness
BacteriaClotting time (sec)
Curd firmness(V)
NBF 650±63 6.58±0.2Strep. 2490±340 1.02±0.3CNS 1255±468 3.80±0.8E. coli S. aureus 1078±193 3.28±0.7
Cork 2005
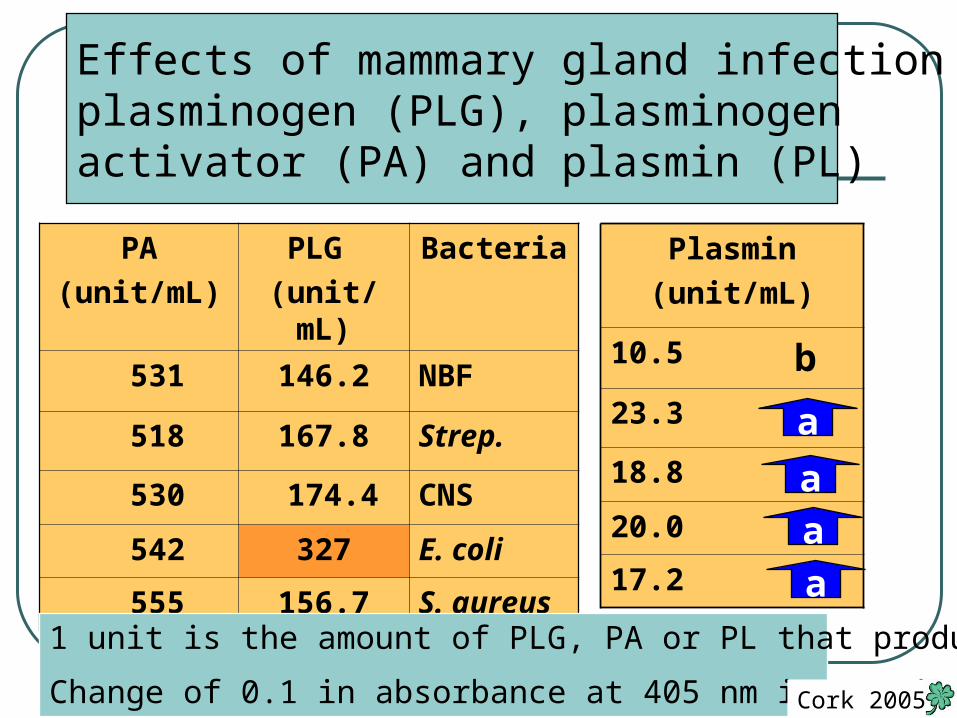
Effects of mammary gland infection on plasminogen (PLG), plasminogenactivator (PA) and plasmin (PL)
BacteriaPLG
(unit/mL)
PA
(unit/mL)
NBF146.2 531
Strep.167.8 518
CNS 174.4 530
E. coli327 542
S. aureus156.7 555
1 unit is the amount of PLG, PA or PL that produces a
Change of 0.1 in absorbance at 405 nm in 60 min Cork 2005
Plasmin
)unit/mL(
10.5
23.3
18.8
20.0
17.2
a
a
a
a
b
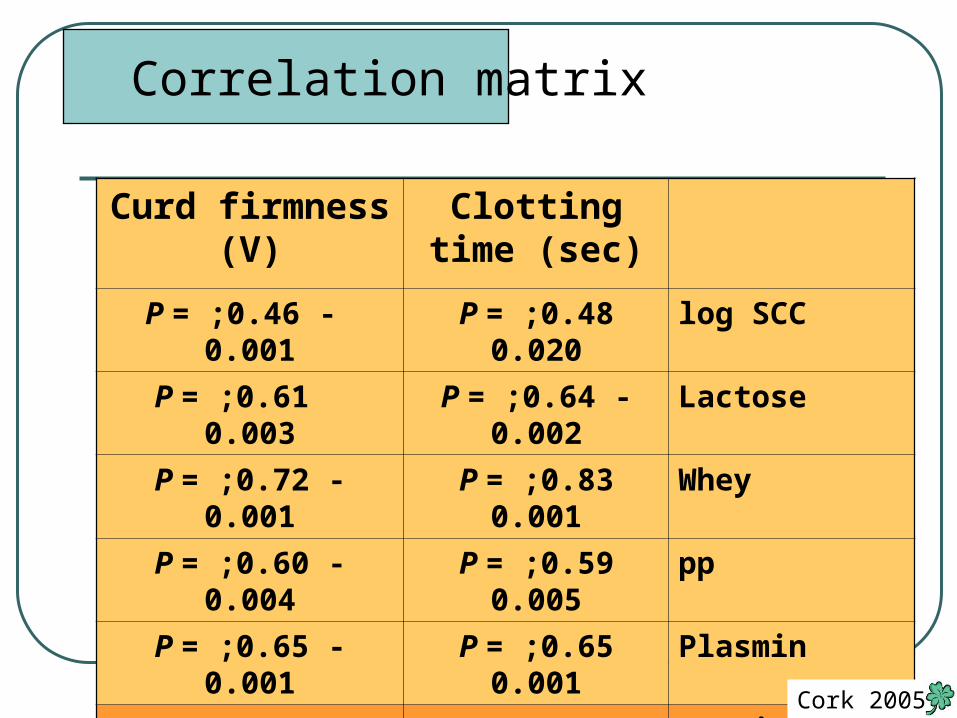
Correlation matrix
Clotting time (sec)
Curd firmness)V(
log SCC0.48 ;P = 0.020 - 0.46 ;P = 0.001
Lactose -0.64 ;P = 0.002 0.61 ;P = 0.003
Whey0.83 ;P = 0.001 -0.72 ;P = 0.001
pp0.59 ;P = 0.005 -0.60 ;P = 0.004
Plasmin0.65 ;P = 0.001 -0.65 ;P = 0.001
Casein0.01 ;NS0.08 ;NS
Cork 2005

0 1 2 3 4 5 6 7 8 90
5
10
15
Whe
y pr
otei
ns (
g/L)
Curd firmness (A30 Optigraph)
0 1 2 3 4 5 6 7 8 90
10
20
30
40
50
Tot
al p
rote
in (
g/L)
Curd firmness (A30 Optigraph)
Protein, r - NS
0 1 2 3 4 5 6 7 8 90
10
20
30
40
50
Cas
ein
(g/L
)
Curd firmness (A30 Optigraph)
Whey, r = 0.83
Casein, r - NS
Cork 2005

0 1 2 3 4 5 6 7 8 9
10
100
1000
10000lo
g S
omat
ic C
ell C
ount
Curd firmness (A30 Optigraph)
SCC, r = 0.46
Cork 2005

100
1000
0 1 2 3 4 5 6
Strep. dysgalactiae S. aureus
Curd firmness (A30 Optigraph)
log
Som
atic
Cel
l Cou
nt
Cork 2005
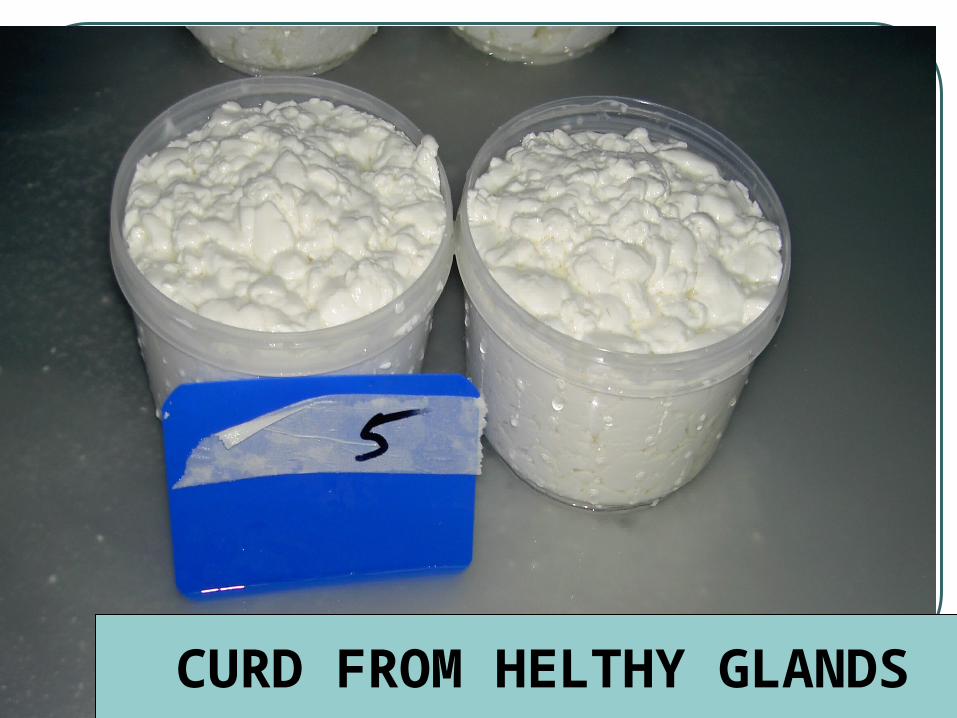
CURD FROM HELTHY GLANDS
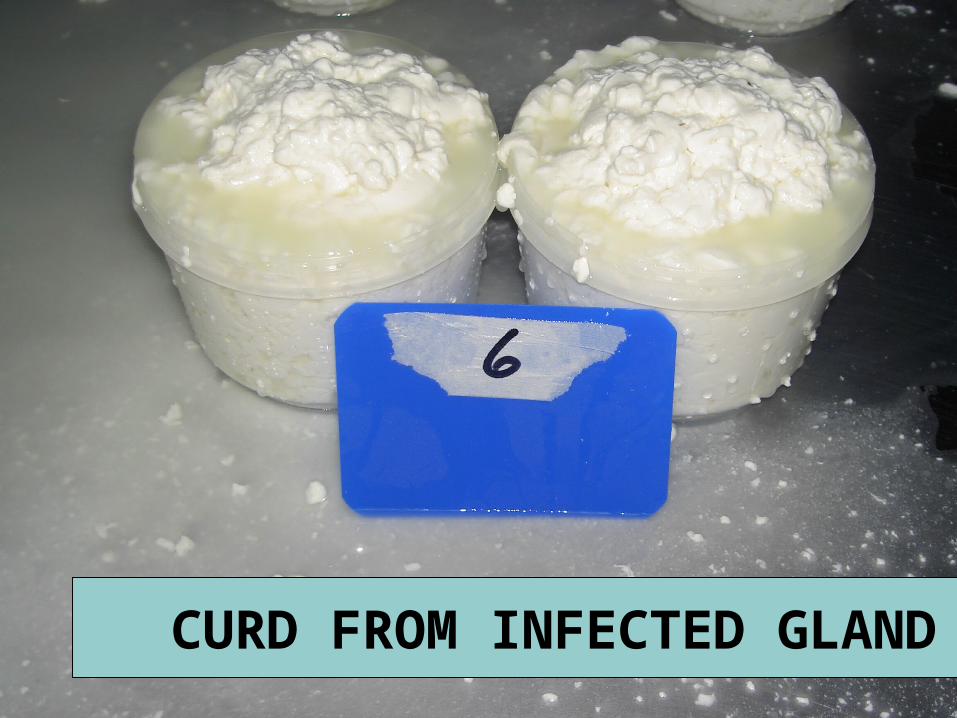
CURD FROM INFECTED GLAND
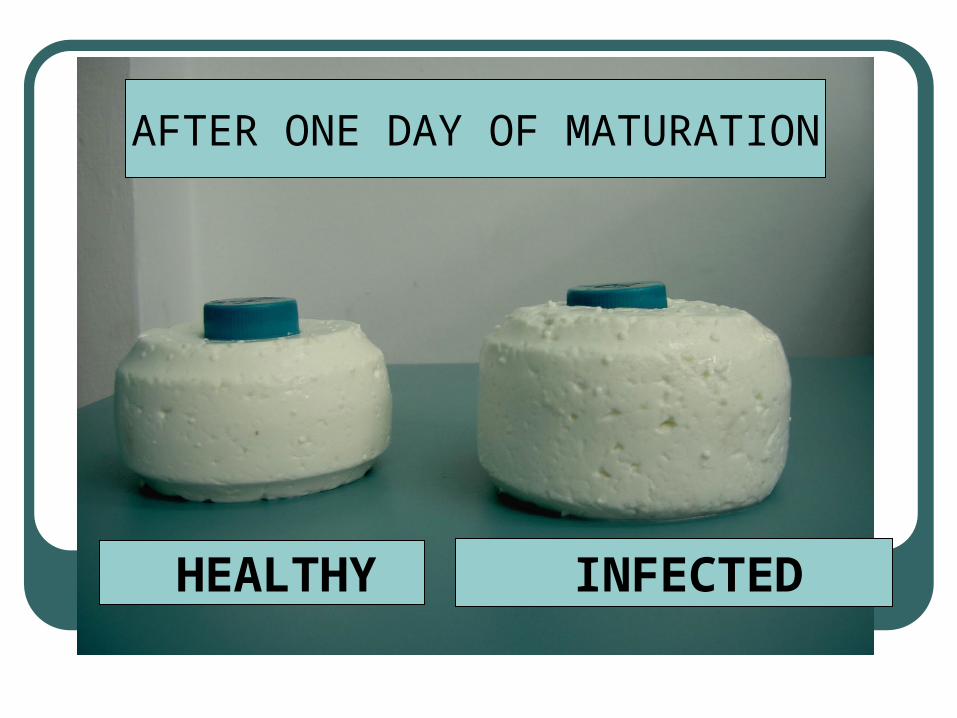
AFTER ONE DAY OF MATURATION
HEALTHY INFECTED

HEALTHY INFECTED
AFTER 3 MONTH OF MATURATION
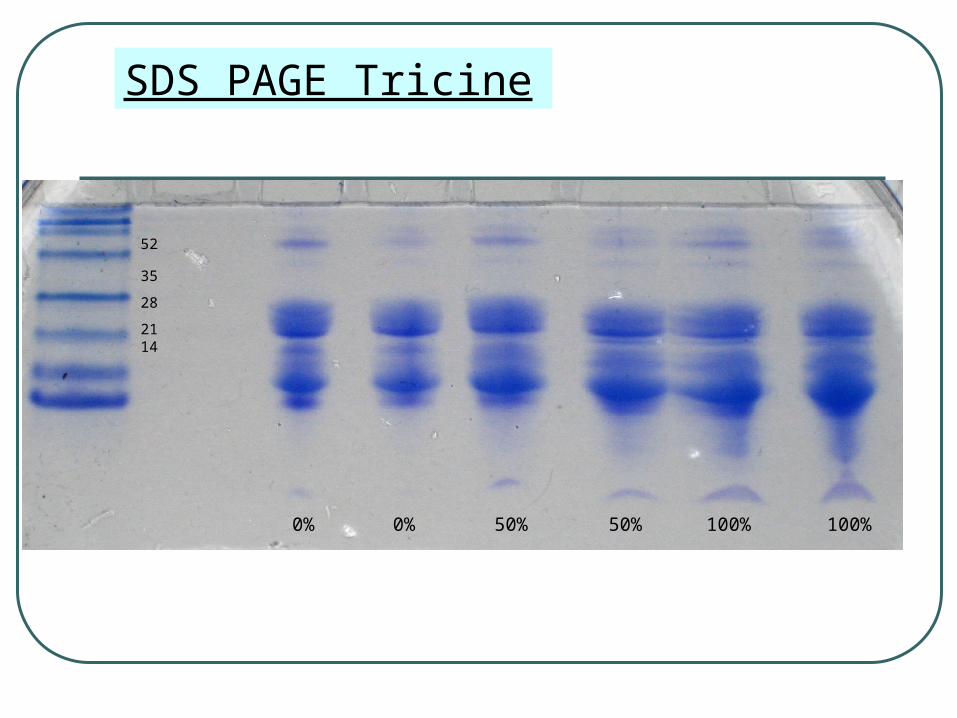
SDS PAGE Tricine
0% 0% 50% 50% 100% 100%
52
35
28
2114
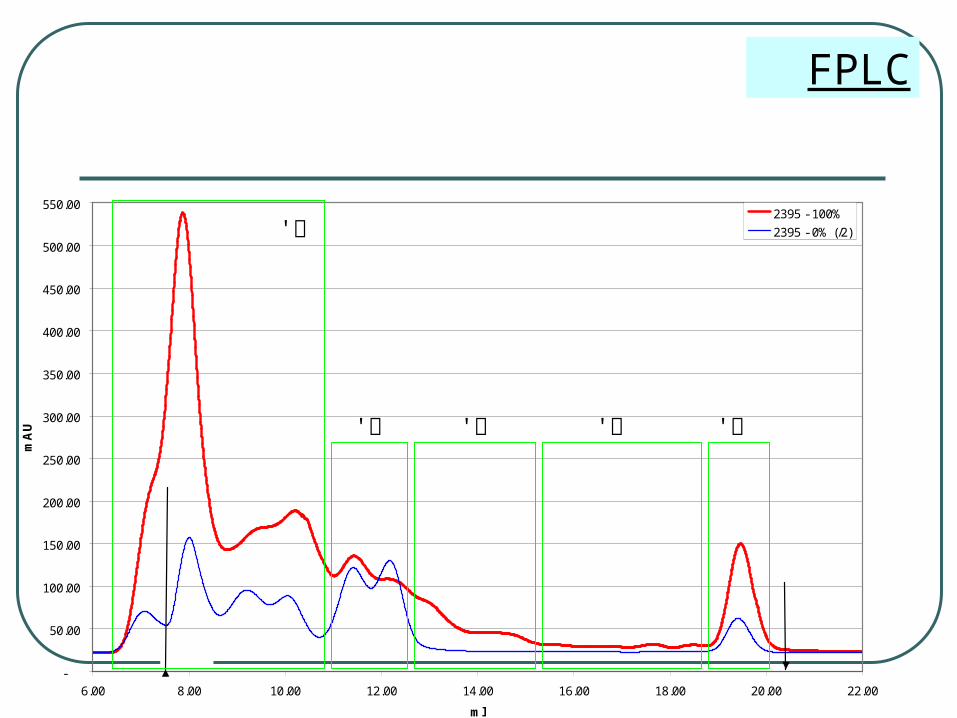
FPLC
-
50.00
100.00
150.00
200.00
250.00
300.00
350.00
400.00
450.00
500.00
550.00
6.00 8.00 10.00 12.00 14.00 16.00 18.00 20.00 22.00
ml
mA
U
2395 - 100%
2395 - 0% (/2)
ב'ג'ד'ה'
א'
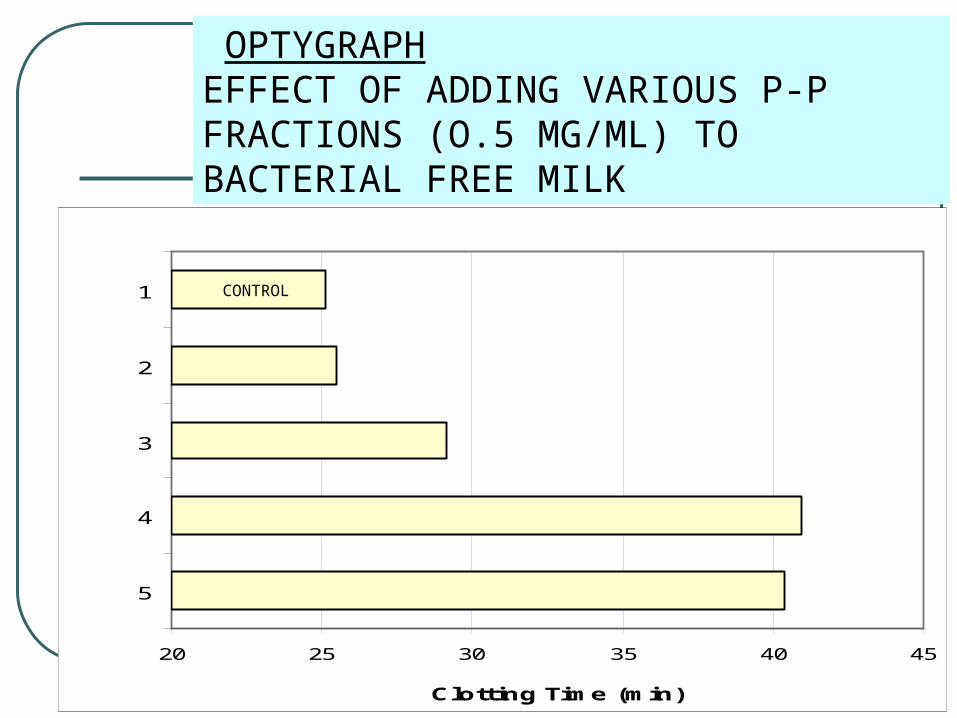
OPTYGRAPH EFFECT OF ADDING VARIOUS P-P FRACTIONS (O.5 MG/ML) TO BACTERIAL FREE MILK
20 25 30 35 40 45
1
2
3
4
5
Clotting Time (min)
CONTROL
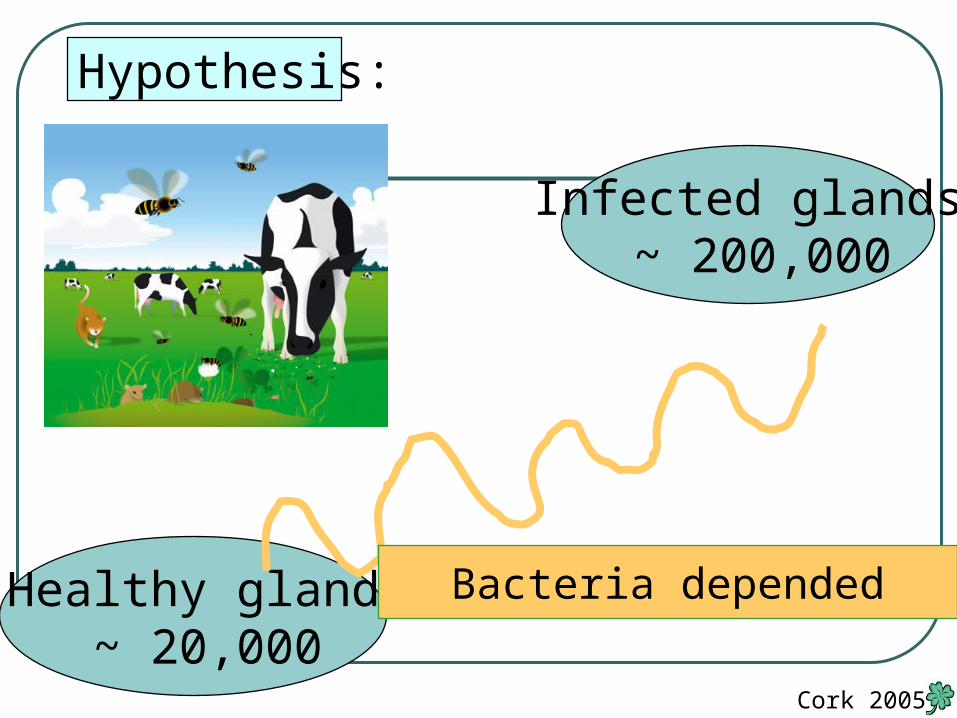
Hypothesis:
Healthy gland ~ 20,000
Infected glands ~ 200,000
Bacteria depended
Cork 2005
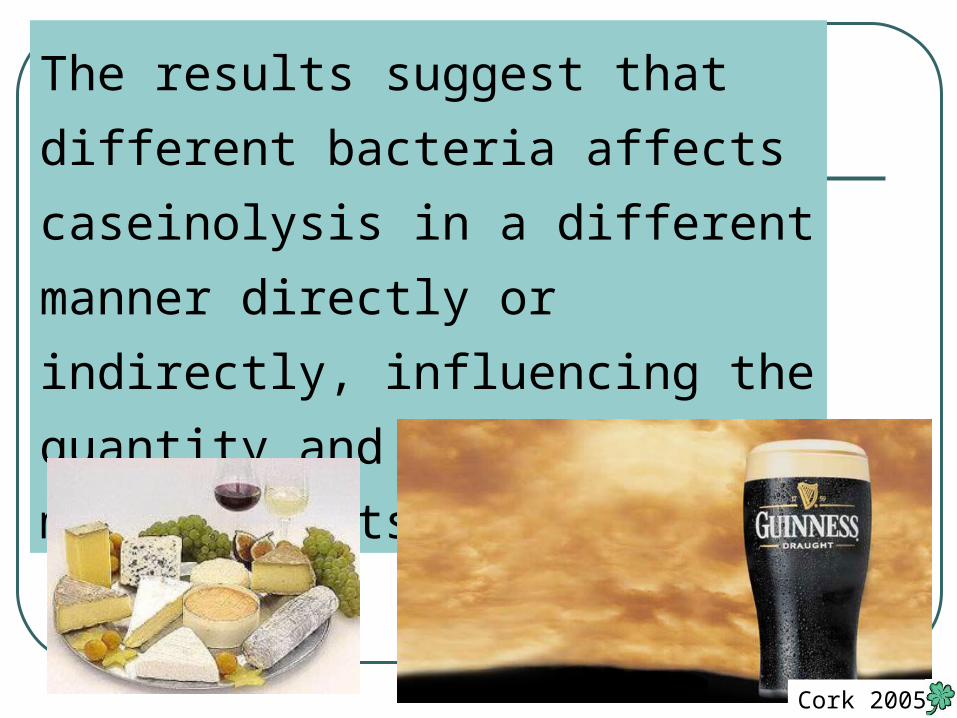
The results suggest that different
bacteria affects caseinolysis in a
different manner directly or
indirectly, influencing the quantity
and quality of milk products
Cork 2005
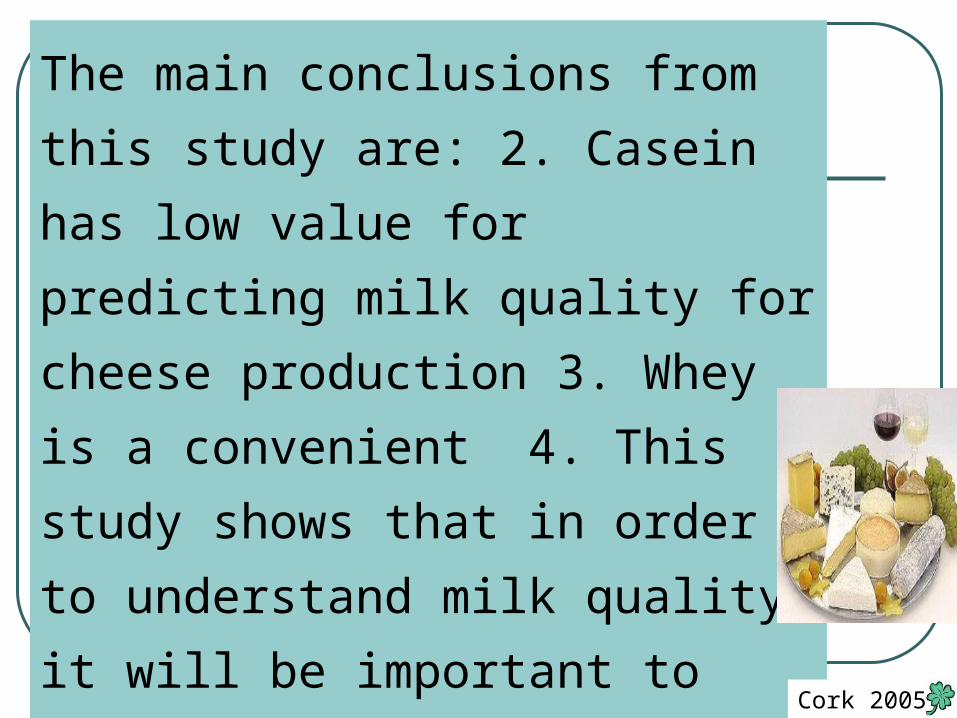
The main conclusions from this
study are: 2. Casein has low value
for predicting milk quality for cheese
production 3. Whey is a convenient
4. This study shows that in order to
understand milk quality it will be
important to study the interactions
among specific bacteria the innate
immune system and caeinolysisCork 2005

Thank you: I hope that this lecture
will contribute to our ability to
raise healthier cows and produce
better dairy products
BOLFA 2006