nishat mills limitednishatmillsltd.com/wp/wp-content/uploads/2019/10/nishat...processed cloth 4...
TRANSCRIPT

Nishat Mills Limited
Interim Financial Report of Nishat Mills Limitedfor the quarter ended September 30, 2019
Accelerating
focussed growth

Nishat Mills Limited
Company Information..........................................................................02
Directors’ Report .................................................................................03
Unconsolidated Condensed Interim Statement
of Financial Position .........................................................................08
Unconsolidated Condensed Interim Statement of Profit or Loss .......10
Unconsolidated Condensed Interim Statement of
Comprehensive Income ...................................................................11
Unconsolidated Condensed Interim Statement of
Changes in Equity ............................................................................12
Unconsolidated Condensed Interim Statement of Cash Flows ..........13
Selected Notes to the Unconsolidated Condensed Interim
Financial Information ........................................................................14
Nishat Mills Limited and its Subsidiary Companies
Consolidated Condensed Interim Statement of Financial Position ....26
Consolidated Condensed Interim Statement of Profit or Loss ...........28
Consolidated Condensed Interim Statement of Comprehensive
Income..............................................................................................29
Consolidated Condensed Interim Statement of Changes in Equity....30
Consolidated Condensed Interim Statement of Cash Flows ..............31
Selected Notes to the Consolidated Condensed Interim
Financial Information ........................................................................32
Directors’ Report in Urdu ....................................................................52
Contents

Board of DirectorsMian Umer ManshaChief Executive Officer
Mian Hassan ManshaChairman
Syed Zahid HussainMr. Mahmood AkhtarMr. Farid Noor Ali FazalMr. Ghazanfar Husain MirzaMr. Maqsood Ahmad
Audit CommitteeSyed Zahid HussainChairman / Member
Mr. Mahmood AkhtarMember
Mr. Farid Noor Ali FazalMember
Human Resource & Remuneration (HR & R) Committee
Syed Zahid HussainChairman / Member
Mian Umer ManshaMember
Mr. Mahmood AkhtarMember
Chief Financial OfficerMr. Muhammad Azam
Company SecretaryMr. Khalid Mahmood Chohan
AuditorsRiaz Ahmad & CompanyChartered Accountants
Legal Advisor Mr. M. Aurangzeb Khan, Advocate, Chamber No. 6, District Court, Faisalabad.
Bankers to the CompanyAlbaraka Bank (Pakistan) Limited Allied Bank LimitedAskari Bank LimitedBank Alfalah LimitedBank Al Habib LimitedBank Islami Pakistan LimitedCitibank N.A.Dubai Islamic Bank Pakistan Limited Faysal Bank LimitedFaysal Bank Limited - Islamic BankingHabib Bank LimitedHabib Metropolitan Bank Limited Industrial and Commercial Bank of China LimitedJS Bank LimitedMeezan Bank LimitedMCB Bank LimitedMCB Islamic Bank Limited National Bank of PakistanPak Brunei Investment Company LimitedPakistan Kuwait Investment Company (Private) LimitedSamba Bank LimitedSilk Bank LimitedSoneri Bank LimitedSummit Bank LimitedStandard Chartered Bank (Pakistan) LimitedThe Bank of PunjabThe Bank of Punjab - Taqwa Islamic BankingThe Bank of KhyberUnited Bank Limited
Mills
Spinning units, Yarn Dyeing& Power plantNishatabad, Faisalabad.
Spinning units & Power plantPlot No. 172-180 & 188-197,M-3 Industrial City, Sahianwala, FIEDMC, 2 K.M. Jhumra Chiniot Road, Chak Jhumra, Faisalabad.
Spinning units & Power plant20 K.M. Sheikhupura FaisalabadRoad, Feroze Watwan.
Weaving units & Power plant12 K.M. Faisalabad Road, Sheikhupura.
Weaving units, Dyeing & Finishing unit, Processing unit, Stitching units and Power plants5 K.M. Nishat Avenue Off 22 K.M. Ferozepur Road, Lahore.
Stitching unit21 K.M. Ferozepur Road, Lahore.
Apparel Units7 K.M. Nishat Avenue Off 22 K.M. Ferozepur Road, Lahore.
2 K.M. Nishat Avenue Off 22 K.M. Ferozepur Road, Lahore.
Registered officeNishat House,53 - A, Lawrence Road, Lahore.Tel: 042-36360154, 042-111 113 333 Fax: 042-36367414
Shares RegistrarTHK Associates (Private) Limited
Head Office, Karachi1st Floor, 40-C, Block-6,P.E.C.H.S, Karachi-75400Tel: 021-34168270,021-111 000 322Fax: 021-34168271
Branch Office, Lahore1st Floor, DYL Motorcycles Limited Office, 147-Q Block, behind Emporium Mall, Johar Town, LahoreTel: 0303-4444795, 0323-8999514
Head Office7, Main Gulberg, Lahore.Tel: 042-35716351-59,042-111 332 200Fax: 042-35716349-50E-mail: [email protected] Website: www.nishatmillsltd.com
Liaison OfficeIst Floor, Karachi Chambers, Hasrat Mohani Road, Karachi. Tel: 021-32414721-23Fax: 021-32412936
Company Information
2
Nis
hat
Mill
s Li
mite
dA
cce
lera
ting
focu
sse
d g
row
th
3
Acc
ele
ratin
gfo
cuss
ed
gro
wth
Unc
onso
lidat
ed C
onde
nsed
Inte
rim F
inan
cial
Info
rmat
ion
for
the
quar
ter
ende
d Se
ptem
ber
30, 2
019
Yarn
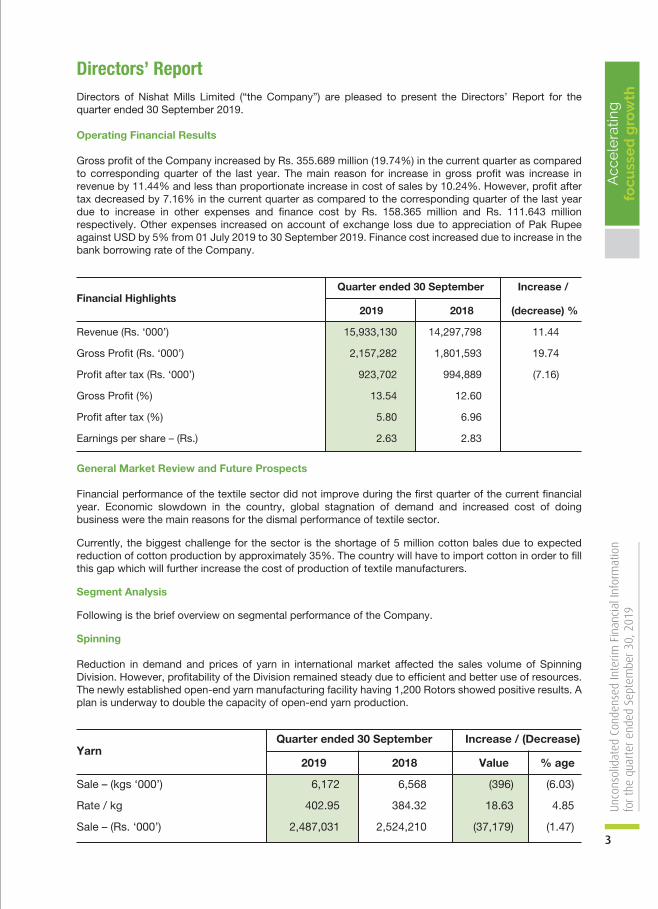
Directors’ ReportDirectors of Nishat Mills Limited (“the Company”) are pleased to present the Directors’ Report for the quarter ended 30 September 2019.
Operating Financial Results
Gross profit of the Company increased by Rs. 355.689 million (19.74%) in the current quarter as compared to corresponding quarter of the last year. The main reason for increase in gross profit was increase in revenue by 11.44% and less than proportionate increase in cost of sales by 10.24%. However, profit after tax decreased by 7.16% in the current quarter as compared to the corresponding quarter of the last year due to increase in other expenses and finance cost by Rs. 158.365 million and Rs. 111.643 million respectively. Other expenses increased on account of exchange loss due to appreciation of Pak Rupee against USD by 5% from 01 July 2019 to 30 September 2019. Finance cost increased due to increase in the bank borrowing rate of the Company.
Quarter ended 30 September Increase /
2019 2018 (decrease) %
Revenue (Rs. ‘000’) 15,933,130 14,297,798 11.44
Gross Profit (Rs. ‘000’) 2,157,282 1,801,593 19.74
Profit after tax (Rs. ‘000’) 923,702 994,889 (7.16)
Gross Profit (%) 13.54 12.60
Profit after tax (%) 5.80 6.96
Earnings per share – (Rs.) 2.63 2.83
General Market Review and Future Prospects
Financial performance of the textile sector did not improve during the first quarter of the current financial year. Economic slowdown in the country, global stagnation of demand and increased cost of doing business were the main reasons for the dismal performance of textile sector.
Currently, the biggest challenge for the sector is the shortage of 5 million cotton bales due to expected reduction of cotton production by approximately 35%. The country will have to import cotton in order to fill this gap which will further increase the cost of production of textile manufacturers.
Segment Analysis
Following is the brief overview on segmental performance of the Company.
Spinning
Reduction in demand and prices of yarn in international market affected the sales volume of Spinning Division. However, profitability of the Division remained steady due to efficient and better use of resources. The newly established open-end yarn manufacturing facility having 1,200 Rotors showed positive results. A plan is underway to double the capacity of open-end yarn production.
Quarter ended 30 September Increase / (Decrease)
2019 2018 Value % age
Sale – (kgs ‘000’) 6,172 6,568 (396) (6.03)
Rate / kg 402.95 384.32 18.63 4.85
Sale – (Rs. ‘000’) 2,487,031 2,524,210 (37,179) (1.47)
Financial Highlights

Processed Cloth
4
Nis
hat
Mill
s Li
mite
dA
cce
lera
ting
focu
sse
d g
row
th
International yarn market dynamics remained challenging throughout the quarter despite improvements in local market. Demand in Hong Kong / China and other far eastern countries remained low during the quarter. We foresee that remaining part of the year will be tough for yarn business due to US-China economic trade war and weak Chinese currency.
Weaving
Sales volume of the Division decreased during the first quarter ended 30 September 2019 because many customers of fashion wear / workwear fabric have requested to postpone or delay shipments of their orders in line with change in the forecast of their sales. This has created pressure on prices of griege cloth.
Most of the customers are demanding incorporation of the idea of environmental sustainability in our products with the usage of organic and recycled materials (cotton and polyester). Some of our European customers have already placed orders for greige cloth made of pure organic cotton. This trend is expected to continue in future. Our strategy as always will be to follow the demand of our customers and venture upon new products and markets. Also, we are planning to buy four new state of the art rapier machines which shall replace our old machines.
Quarter ended 30 September Increase / (Decrease)
2019 2018 Value % age
Sale – (meters ‘000’) 20,416 20,680 (264) (1.28)
Rate / meter 186.08 169.28 16.80 9.92
Sale – (Rs. ‘000’) 3,798,967 3,500,665 298,302 8.52
Dyeing
A balanced product mix comprising of core and fashion fabric enabled the Division to maintain its profitability despite steady sales volume during the quarter ended 30 September 2019. The Division has already sold its capacities for the second quarter and marketing department is working on booking for third quarter. Rising cost of production and trade suspension with India are the biggest challenges for the Division which may adversely affect the sale in the remaining part of the financial year 2019-20.
Quarter ended 30 September Increase / (Decrease)
2019 2018 Value % age
Sale – (meters ‘000’) 9,214 9,125 89 0.98
Rate / meter 375.02 316.18 58.84 18.61
Sale – (Rs. ‘000’) 3,455,437 2,885,100 570,337 19.77
Home Textile
The momentum of increased sales volume built during the last half of financial year 2018-19 continued during the quarter ended 30 September 2019. Resultantly, production lines of the Division are running at full capacity. The management expects this trend will continue in the next quarter as well. The Division foresees more exports opportunities in the second half of financial year 2019-20 due to expected rise in demand of Pakistani textile products as a result of recent tariffs imposed by USA on Chinese products including many home textile categories.
The Division is also planning to establish a towel manufacturing unit with project cost of approximatelyRs. 1.5 billion which is the last missing link in our Home Textile product mix. First phase of our Towel section is expected to be operational by June 2020 that will give a massive support to enhance export sales volume in the following years. Initial capacity of the project will be 10 Tons per day.
Grey Cloth
5
Acc
ele
ratin
gfo
cuss
ed
gro
wth
Unc
onso
lidat
ed C
onde
nsed
Inte
rim F
inan
cial
Info
rmat
ion
for
the
quar
ter
ende
d Se
ptem
ber
30, 2
019
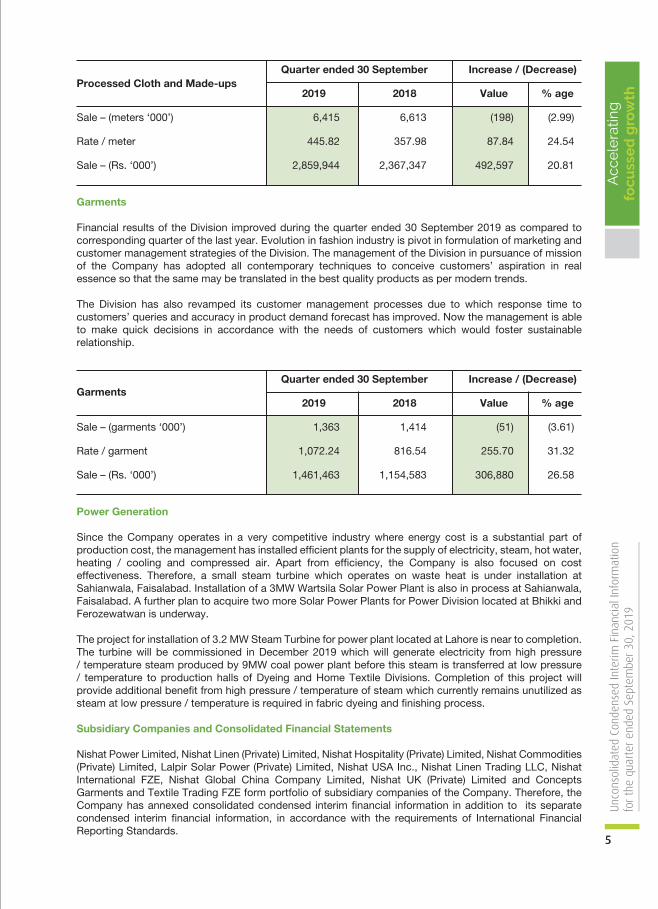
Processed Cloth and Made-ups
Garments
Quarter ended 30 September Increase / (Decrease)
2019 2018 Value % age
Sale – (meters ‘000’) 6,415 6,613 (198) (2.99)
Rate / meter 445.82 357.98 87.84 24.54
Sale – (Rs. ‘000’) 2,859,944 2,367,347 492,597 20.81
Garments
Financial results of the Division improved during the quarter ended 30 September 2019 as compared to corresponding quarter of the last year. Evolution in fashion industry is pivot in formulation of marketing and customer management strategies of the Division. The management of the Division in pursuance of mission of the Company has adopted all contemporary techniques to conceive customers’ aspiration in real essence so that the same may be translated in the best quality products as per modern trends.
The Division has also revamped its customer management processes due to which response time to customers’ queries and accuracy in product demand forecast has improved. Now the management is able to make quick decisions in accordance with the needs of customers which would foster sustainable relationship.
Quarter ended 30 September Increase / (Decrease)
2019 2018 Value % age
Sale – (garments ‘000’) 1,363 1,414 (51) (3.61)
Rate / garment 1,072.24 816.54 255.70 31.32
Sale – (Rs. ‘000’) 1,461,463 1,154,583 306,880 26.58
Power Generation
Since the Company operates in a very competitive industry where energy cost is a substantial part of production cost, the management has installed efficient plants for the supply of electricity, steam, hot water, heating / cooling and compressed air. Apart from efficiency, the Company is also focused on cost effectiveness. Therefore, a small steam turbine which operates on waste heat is under installation at Sahianwala, Faisalabad. Installation of a 3MW Wartsila Solar Power Plant is also in process at Sahianwala, Faisalabad. A further plan to acquire two more Solar Power Plants for Power Division located at Bhikki and Ferozewatwan is underway.
The project for installation of 3.2 MW Steam Turbine for power plant located at Lahore is near to completion. The turbine will be commissioned in December 2019 which will generate electricity from high pressure/ temperature steam produced by 9MW coal power plant before this steam is transferred at low pressure/ temperature to production halls of Dyeing and Home Textile Divisions. Completion of this project will provide additional benefit from high pressure / temperature of steam which currently remains unutilized as steam at low pressure / temperature is required in fabric dyeing and finishing process.
Subsidiary Companies and Consolidated Financial Statements
Nishat Power Limited, Nishat Linen (Private) Limited, Nishat Hospitality (Private) Limited, Nishat Commodities (Private) Limited, Lalpir Solar Power (Private) Limited, Nishat USA Inc., Nishat Linen Trading LLC, Nishat International FZE, Nishat Global China Company Limited, Nishat UK (Private) Limited and Concepts Garments and Textile Trading FZE form portfolio of subsidiary companies of the Company. Therefore, the Company has annexed consolidated condensed interim financial information in addition to its separate condensed interim financial information, in accordance with the requirements of International Financial Reporting Standards.

6
Nis
hat
Mill
s Li
mite
dA
cce
lera
ting
focu
sse
d g
row
th
Composition of Board
Total number of Directors: a) Male 7 b) Female 0
Composition i) Independent Director 1 ii) Non-executive Directors 4 iii) Executive Directors 2
Committees of the Board
Audit Committee of the Board:
Sr. No. Name of Directors 1 Syed Zahid Hussain Chairman / Member 2 Mr. Mahmood Akhtar Member 3 Mr. Farid Noor Ali Fazal Member
Human Resource and Remuneration Committee:
Sr. No. Name of Directors 1 Syed Zahid Hussain Chairman / Member 2 Mian Umer Mansha Member 3 Mr. Mahmood Akhtar Member
Directors’ Remuneration
The Board of Directors has approved Directors’ Remuneration Policy. The main features of the policy are as follows:
• The Company shall not pay remuneration to its non-executive directors including independent directors except for meeting fee for attending Board and its Committees meetings.
• The Company will reimburse or incur expenses of travelling and accommodation of Directors in relation to attending of Board and its Committees meetings.
• The Directors’ Remuneration Policy will be reviewed and approved by the Board of Directors from time to time.
Acknowledgement
The Board is pleased about the efforts of the management, staff and workers.
For and on behalf of the Board of Directors
Mian Umer Mansha Maqsood AhmedChief Executive Officer Director
29 October 2019Lahore

Unconsolidated Condensed Interim
Financial Information of Nishat Mills Limited
For the quarter ended 30 September 2019
8
Nis
hat
Mill
s Li
mite
dA
cce
lera
ting
focu
sse
d g
row
th As at 30 September 2019
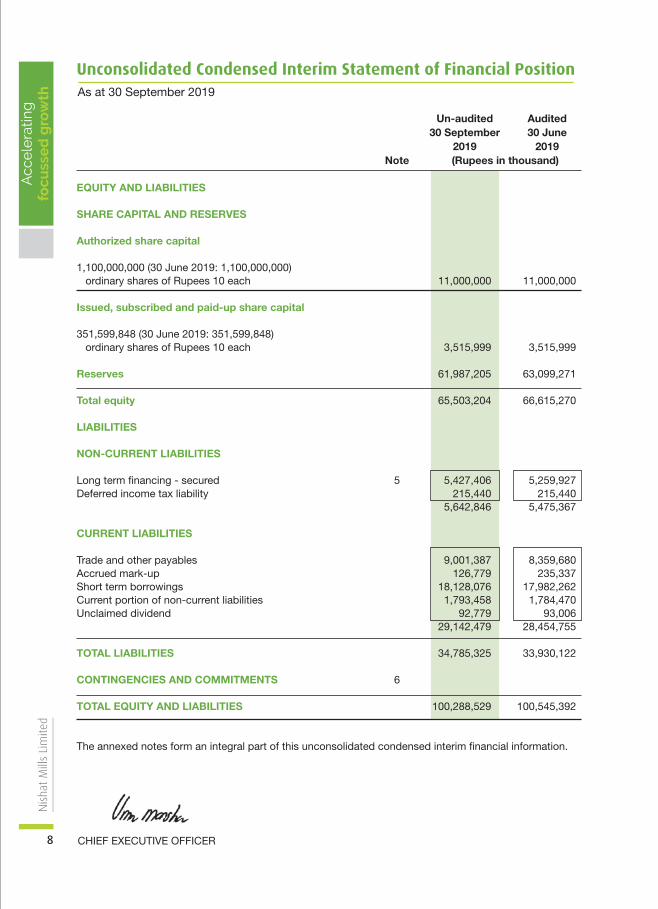
Unconsolidated Condensed Interim Statement of Financial Position
Un-audited Audited 30 September 30 June 2019 2019 Note (Rupees in thousand) EQUITY AND LIABILITIES
SHARE CAPITAL AND RESERVES
Authorized share capital
1,100,000,000 (30 June 2019: 1,100,000,000) ordinary shares of Rupees 10 each 11,000,000 11,000,000
Issued, subscribed and paid-up share capital
351,599,848 (30 June 2019: 351,599,848) ordinary shares of Rupees 10 each 3,515,999 3,515,999
Reserves 61,987,205 63,099,271
Total equity 65,503,204 66,615,270 LIABILITIES
NON-CURRENT LIABILITIES
Long term financing - secured 5 5,427,406 5,259,927Deferred income tax liability 215,440 215,440 5,642,846 5,475,367
CURRENT LIABILITIES
Trade and other payables 9,001,387 8,359,680Accrued mark-up 126,779 235,337Short term borrowings 18,128,076 17,982,262Current portion of non-current liabilities 1,793,458 1,784,470Unclaimed dividend 92,779 93,006 29,142,479 28,454,755
TOTAL LIABILITIES 34,785,325 33,930,122
CONTINGENCIES AND COMMITMENTS 6
TOTAL EQUITY AND LIABILITIES 100,288,529 100,545,392
The annexed notes form an integral part of this unconsolidated condensed interim financial information.
CHIEF EXECUTIVE OFFICER

9
Acc
ele
ratin
gfo
cuss
ed
gro
wth
Unc
onso
lidat
ed C
onde
nsed
Inte
rim F
inan
cial
Info
rmat
ion
for
the
quar
ter
ende
d Se
ptem
ber
30, 2
019
CHIEF FINANCIAL OFFICERDIRECTOR
Un-audited Audited 30 September 30 June 2019 2019 Note (Rupees in thousand) ASSETS NON-CURRENT ASSETS
Property, plant and equipment 7 29,477,142 28,968,219Investment properties 458,860 459,974Long term investments 33,356,179 34,930,333Long term loans 278,550 275,246Long term deposits 93,711 114,360 63,664,442 64,748,132
CURRENT ASSETS
Stores, spare parts and loose tools 3,030,363 3,102,988Stock in trade 14,616,848 17,008,459Trade debts 4,231,815 4,711,061Loans and advances 7,809,738 8,040,700Short term deposits and prepayments 67,011 74,969Other receivables 2,909,271 2,253,678Accrued interest 44,470 28,780Cash and bank balances 3,914,571 576,625 36,624,087 35,797,260
TOTAL ASSETS 100,288,529 100,545,392

10
Nis
hat
Mill
s Li
mite
dA
cce
lera
ting
focu
sse
d g
row
th For the quarter ended 30 September 2019 (Un-audited)
Unconsolidated Condensed Interim Statement of Profit or Loss
Quarter ended 30 September 30 September 2019 2018 Note (Rupees in thousand)
REVENUE 15,933,130 14,297,798
COST OF SALES 8 (13,775,848) (12,496,205)
GROSS PROFIT 2,157,282 1,801,593
DISTRIBUTION COST (738,316) (627,592)
ADMINISTRATIVE EXPENSES (306,662) (268,070)
OTHER EXPENSES (215,257) (56,892)
(1,260,235) (952,554)
897,047 849,039
OTHER INCOME 596,717 511,269
PROFIT FROM OPERATIONS 1,493,764 1,360,308
FINANCE COST (324,062) (212,419)
PROFIT BEFORE TAXATION 1,169,702 1,147,889
TAXATION (246,000) (153,000)
PROFIT AFTER TAXATION 923,702 994,889
EARNINGS PER SHARE - BASIC AND DILUTED (RUPEES) 9 2.63 2.83
The annexed notes form an integral part of this unconsolidated condensed interim financial information.
CHIEF FINANCIAL OFFICERDIRECTORCHIEF EXECUTIVE OFFICER
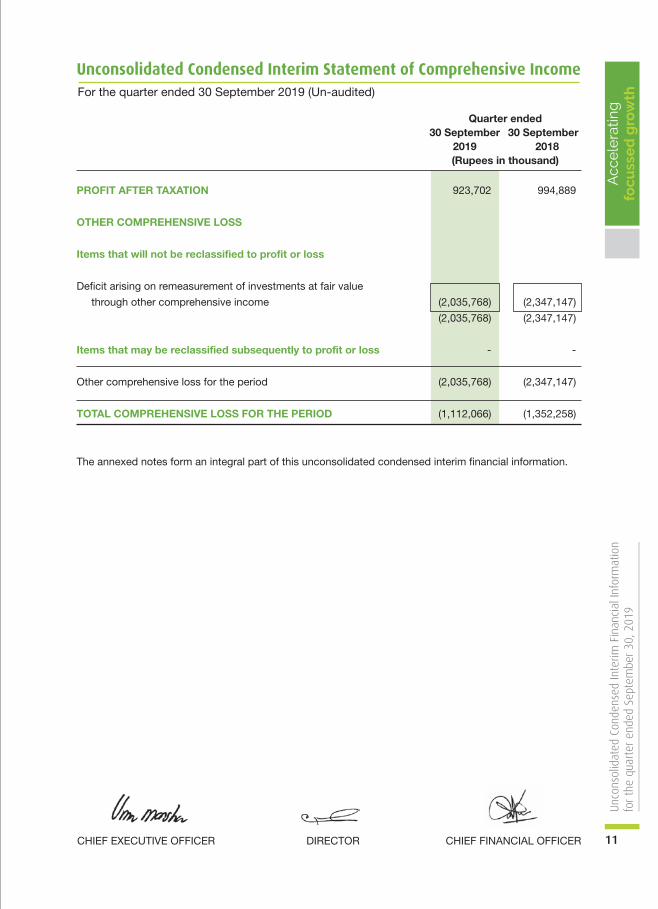
Quarter ended 30 September 30 September 2019 2018 (Rupees in thousand)
PROFIT AFTER TAXATION 923,702 994,889
OTHER COMPREHENSIVE LOSS
Items that will not be reclassified to profit or loss
Deficit arising on remeasurement of investments at fair value
through other comprehensive income (2,035,768) (2,347,147)
(2,035,768) (2,347,147)
Items that may be reclassified subsequently to profit or loss - -
Other comprehensive loss for the period (2,035,768) (2,347,147)
TOTAL COMPREHENSIVE LOSS FOR THE PERIOD (1,112,066) (1,352,258)
The annexed notes form an integral part of this unconsolidated condensed interim financial information.
CHIEF FINANCIAL OFFICERDIRECTORCHIEF EXECUTIVE OFFICER 11
Acc
ele
ratin
gfo
cuss
ed
gro
wth
Unc
onso
lidat
ed C
onde
nsed
Inte
rim F
inan
cial
Info
rmat
ion
for
the
quar
ter
ende
d Se
ptem
ber
30, 2
019
For the quarter ended 30 September 2019 (Un-audited)
Unconsolidated Condensed Interim Statement of Comprehensive Income
12
Nis
hat
Mill
s Li
mite
dA
cce
lera
ting
focu
sse
d g
row
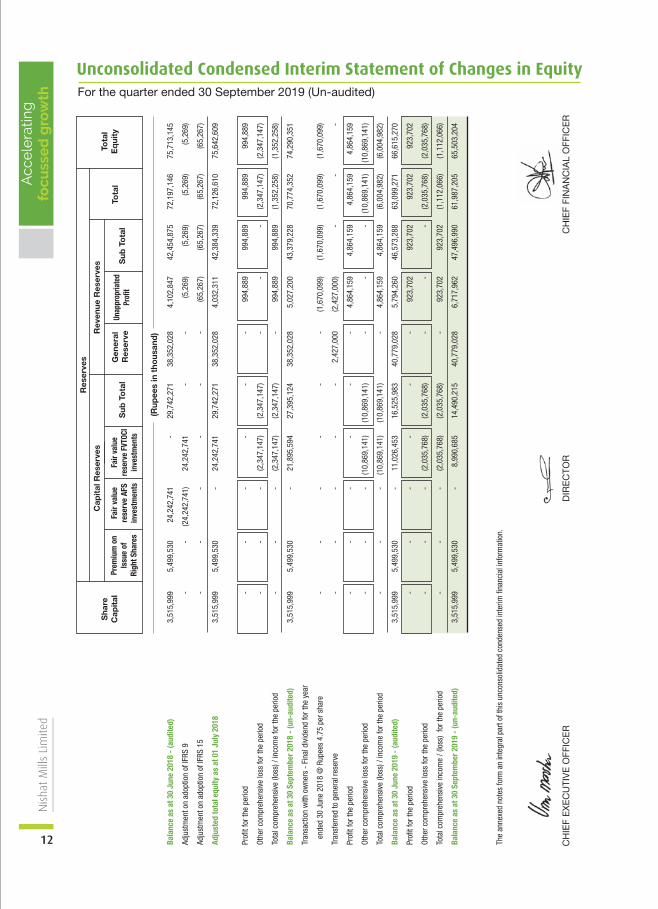
th For the quarter ended 30 September 2019 (Un-audited)
Unconsolidated Condensed Interim Statement of Changes in Equity
CH
IEF
EX
EC
UTI
VE
OFF
ICE
RC
HIE
F FI
NA
NC
IAL
OFF
ICE
RD
IRE
CTO
R
Res
erve
s
Cap
ital
Res
erve
sR
even
ue R
eser
ves
Sha
reC
apit
alTo
tal
Eq
uity
Prem
ium
on
Issu
e of
Righ
t Sha
res
Fair
valu
ere
serv
e AF
Sin
vest
men
ts
Fair
valu
ere
serv
e FV
TOCI
inve
stm
ents
Gen
eral
Res
erve
Unap
prop
riate
dPr
ofit
Tota
lS
ub T
ota
lS
ub T
ota
l
Bala
nce
as a
t 30
June
201
8 -
(aud
ited)
3
,515
,999
5,
499,
530
24,2
42,7
41
- 29
,742
,271
38
,352
,028
4,
102,
847
42,4
54,8
75
72,1
97,1
46
75,7
13,1
45
Adju
stm
ent o
n ad
optio
n of
IFRS
9
-
- (2
4,24
2,74
1)
24,2
42,7
41
- -
(5,2
69)
(5,2
69)
(5,2
69)
(5,2
69)
Adju
stm
ent o
n ad
optio
n of
IFRS
15
-
- -
- -
- (6
5,26
7)
(65,
267)
(6
5,26
7)
(65,
267)
Adju
sted
tota
l equ
ity a
s at
01
July
201
8 3
,515
,999
5,
499,
530
- 24
,242
,741
29
,742
,271
38
,352
,028
4,
032,
311
42,3
84,3
39
72,1
26,6
10
75,6
42,6
09
Prof
it fo
r the
per
iod
-
- -
- -
- 99
4,88
9 99
4,88
9 99
4,88
9 99
4,88
9
Othe
r com
preh
ensi
ve lo
ss fo
r the
per
iod
- -
- (2
,347
,147
) (2
,347
,147
) -
- -
(2,3
47,1
47)
(2,3
47,1
47)
Tota
l com
preh
ensi
ve (l
oss)
/ in
com
e fo
r the
per
iod
-
- -
(2,3
47,1
47)
(2,3
47,1
47)
- 99
4,88
9 99
4,88
9 (1
,352
,258
) (1
,352
,258
)
Bala
nce
as a
t 30
Sept
embe
r 201
8 -
(un-
audi
ted)
3
,515
,999
5,
499,
530
- 21
,895
,594
27
,395
,124
38
,352
,028
5,
027,
200
43,3
79,2
28
70,7
74,3
52
74,2
90,3
51
Tran
sact
ion
with
ow
ners
- F
inal
div
iden
d fo
r the
yea
r
en
ded
30 J
une
2018
@ R
upee
s 4.
75 p
er s
hare
-
-
- -
- -
(1,6
70,0
99)
(1,6
70,0
99)
(1,6
70,0
99)
(1,6
70,0
99)
Tran
sfer
red
to g
ener
al re
serv
e -
- -
- -
2,42
7,00
0 (2
,427
,000
) -
- -
Prof
it fo
r the
per
iod
- -
- -
- -
4,86
4,15
9 4,
864,
159
4,86
4,15
9 4,
864,
159
Othe
r com
preh
ensi
ve lo
ss fo
r the
per
iod
-
- -
(10,
869,
141)
(1
0,86
9,14
1)
- -
- (1
0,86
9,14
1)
(10,
869,
141)
Tota
l com
preh
ensi
ve (l
oss)
/ in
com
e fo
r the
per
iod
-
-
- (1
0,86
9,14
1)
(10,
869,
141)
-
4,86
4,15
9 4,
864,
159
(6,0
04,9
82)
(6,0
04,9
82)
Bala
nce
as a
t 30
June
201
9 -
(aud
ited)
3
,515
,999
5,
499,
530
- 11
,026
,453
16
,525
,983
40
,779
,028
5,
794,
260
46,5
73,2
88
63,0
99,2
71
66,6
15,2
70
Prof
it fo
r the
per
iod
- -
- -
- -
923,
702
923,
702
923,
702
923,
702
Othe
r com
preh
ensi
ve lo
ss fo
r the
per
iod
- -
- (2
,035
,768
) (2
,035
,768
) -
- -
(2,0
35,7
68)
(2,0
35,7
68)
Tota
l com
preh
ensi
ve in
com
e / (
loss
) fo
r the
per
iod
-
- -
(2,0
35,7
68)
(2,0
35,7
68)
- 92
3,70
2 92
3,70
2 (1
,112
,066
) (1
,112
,066
)
Bala
nce
as a
t 30
Sept
embe
r 201
9 -
(un-
audi
ted)
3
,515
,999
5,
499,
530
- 8,
990,
685
14,4
90,2
15
40,7
79,0
28
6,71
7,96
2 47
,496
,990
61
,987
,205
65
,503
,204
The
anne
xed
note
s fo
rm a
n in
tegr
al p
art o
f thi
s un
cons
olid
ated
con
dens
ed in
terim
fina
ncia
l inf
orm
atio
n.
(Rup
ees
in t
hous
and)
13
Acc
ele
ratin
gfo
cuss
ed
gro
wth
Unc
onso
lidat
ed C
onde
nsed
Inte
rim F
inan
cial
Info
rmat
ion
for
the
quar
ter
ende
d Se
ptem
ber
30, 2
019
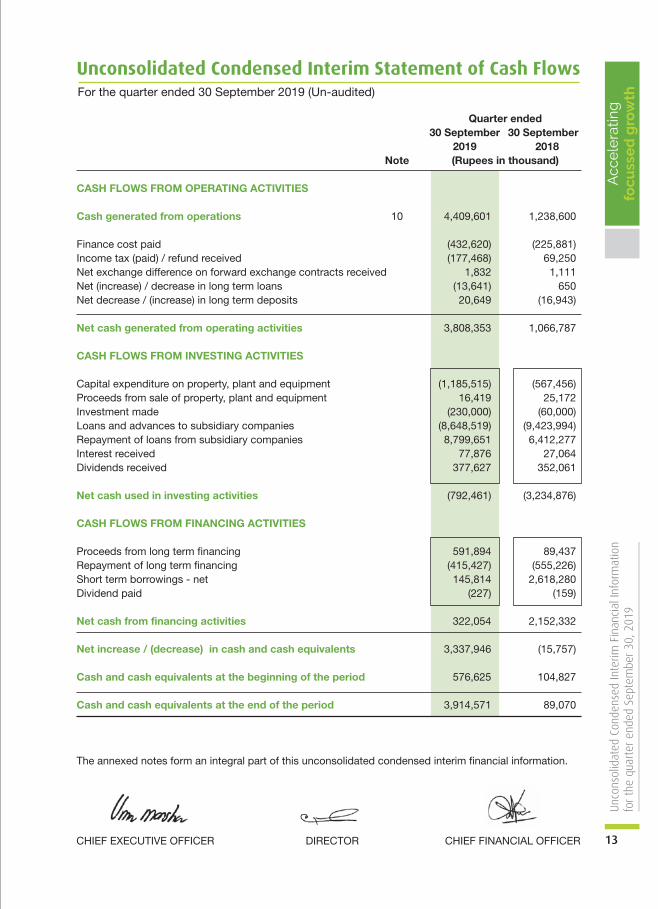
For the quarter ended 30 September 2019 (Un-audited)
Unconsolidated Condensed Interim Statement of Cash Flows
Quarter ended 30 September 30 September 2019 2018 Note (Rupees in thousand) CASH FLOWS FROM OPERATING ACTIVITIES
Cash generated from operations 10 4,409,601 1,238,600 Finance cost paid (432,620) (225,881)Income tax (paid) / refund received (177,468) 69,250Net exchange difference on forward exchange contracts received 1,832 1,111Net (increase) / decrease in long term loans (13,641) 650Net decrease / (increase) in long term deposits 20,649 (16,943)
Net cash generated from operating activities 3,808,353 1,066,787 CASH FLOWS FROM INVESTING ACTIVITIES
Capital expenditure on property, plant and equipment (1,185,515) (567,456)Proceeds from sale of property, plant and equipment 16,419 25,172Investment made (230,000) (60,000)Loans and advances to subsidiary companies (8,648,519) (9,423,994)Repayment of loans from subsidiary companies 8,799,651 6,412,277Interest received 77,876 27,064Dividends received 377,627 352,061
Net cash used in investing activities (792,461) (3,234,876) CASH FLOWS FROM FINANCING ACTIVITIES
Proceeds from long term financing 591,894 89,437Repayment of long term financing (415,427) (555,226)Short term borrowings - net 145,814 2,618,280Dividend paid (227) (159)
Net cash from financing activities 322,054 2,152,332 Net increase / (decrease) in cash and cash equivalents 3,337,946 (15,757) Cash and cash equivalents at the beginning of the period 576,625 104,827
Cash and cash equivalents at the end of the period 3,914,571 89,070
The annexed notes form an integral part of this unconsolidated condensed interim financial information.
CHIEF FINANCIAL OFFICERDIRECTORCHIEF EXECUTIVE OFFICER

14
Nis
hat
Mill
s Li
mite
dA
cce
lera
ting
focu
sse
d g
row
th For the quarter ended 30 September 2019 (Un-audited)
Selected Notes to the Unconsolidated Condensed Interim Financial Information
1 THE COMPANY AND ITS OPERATIONS
Nishat Mills Limited is a public limited Company incorporated in Pakistan under the Companies Act,
1913 (Now Companies Act, 2017) and listed on Pakistan Stock Exchange Limited. Its registered office
is situated at 53-A, Lawrence Road, Lahore. The Company is engaged in the business of textile
manufacturing and of spinning, combing, weaving, bleaching, dyeing, printing, stitching, apparel,
buying, selling and otherwise dealing in yarn, linen, cloth and other goods and fabrics made from raw
cotton, synthetic fibre and cloth, and to generate, accumulate, distribute, supply and sell electricity.
2 BASIS OF PREPARATION
2.1 These unconsolidated condensed interim financial statements have been prepared in
accordance with the accounting and reporting standards as applicable in Pakistan for interim
financial reporting. The accounting and reporting standards as applicable in Pakistan for
interim financial reporting comprise of:
• International Accounting Standard (IAS) 34, Interim Financial Reporting, issued by the
International Accounting Standards Board (IASB) as notified under the Companies Act,
2017; and
• Provisions of and directives issued under the Companies Act, 2017.
Where the provisions of and directives issued under the Companies Act, 2017 differ with the
requirements of IAS 34, the provisions of and directives issued under the Companies Act,
2017 have been followed.
2.2 These unconsolidated condensed interim financial statements are unaudited and do not
include all the information and disclosures required in annual financial statements and should
be read in conjunction with the annual audited financial statements of the Company for the
year ended 30 June 2019.
3 ACCOUNTING POLICIES
The accounting policies and methods of computations adopted for the preparation of this
unconsolidated condensed interim financial information are the same as applied in the preparation
of the preceding audited annual published financial statements of the Company for the year ended
30 June 2019.
4 CRITICAL ACCOUNTING ESTIMATES AND JUDGEMENTS
The preparation of this unconsolidated condensed interim financial information in conformity with
the approved accounting standards requires the use of certain critical accounting estimates. It also
requires the management to exercise its judgment in the process of applying the Company's
accounting policies. Estimates and judgments are continually evaluated and are based on historical
experience and other factors, including expectations of future events that are believed to be
reasonable under the circumstances.
15
Acc
ele
ratin
gfo
cuss
ed
gro
wth
Unc
onso
lidat
ed C
onde
nsed
Inte
rim F
inan
cial
Info
rmat
ion
for
the
quar
ter
ende
d Se
ptem
ber
30, 2
019
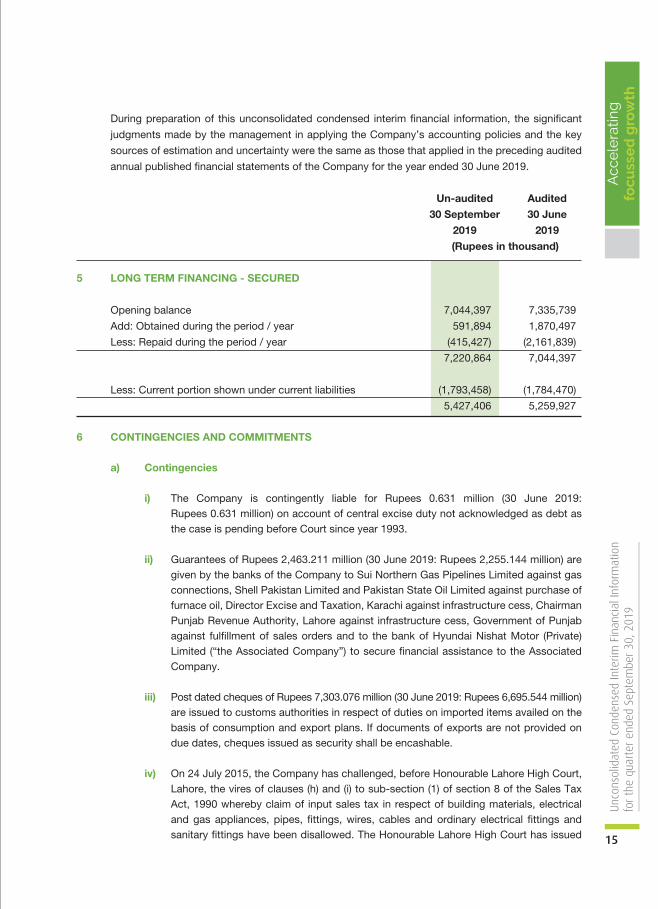
During preparation of this unconsolidated condensed interim financial information, the significant
judgments made by the management in applying the Company’s accounting policies and the key
sources of estimation and uncertainty were the same as those that applied in the preceding audited
annual published financial statements of the Company for the year ended 30 June 2019.
Un-audited Audited
30 September 30 June
2019 2019
(Rupees in thousand)
5 LONG TERM FINANCING - SECURED
Opening balance 7,044,397 7,335,739
Add: Obtained during the period / year 591,894 1,870,497
Less: Repaid during the period / year (415,427) (2,161,839)
7,220,864 7,044,397
Less: Current portion shown under current liabilities (1,793,458) (1,784,470)
5,427,406 5,259,927
6 CONTINGENCIES AND COMMITMENTS
a) Contingencies i) The Company is contingently liable for Rupees 0.631 million (30 June 2019: Rupees 0.631 million) on account of central excise duty not acknowledged as debt as
the case is pending before Court since year 1993.
ii) Guarantees of Rupees 2,463.211 million (30 June 2019: Rupees 2,255.144 million) are given by the banks of the Company to Sui Northern Gas Pipelines Limited against gas connections, Shell Pakistan Limited and Pakistan State Oil Limited against purchase of furnace oil, Director Excise and Taxation, Karachi against infrastructure cess, Chairman Punjab Revenue Authority, Lahore against infrastructure cess, Government of Punjab against fulfillment of sales orders and to the bank of Hyundai Nishat Motor (Private) Limited (“the Associated Company”) to secure financial assistance to the Associated Company.
iii) Post dated cheques of Rupees 7,303.076 million (30 June 2019: Rupees 6,695.544 million) are issued to customs authorities in respect of duties on imported items availed on the basis of consumption and export plans. If documents of exports are not provided on due dates, cheques issued as security shall be encashable.
iv) On 24 July 2015, the Company has challenged, before Honourable Lahore High Court, Lahore, the vires of clauses (h) and (i) to sub-section (1) of section 8 of the Sales Tax Act, 1990 whereby claim of input sales tax in respect of building materials, electrical and gas appliances, pipes, fittings, wires, cables and ordinary electrical fittings and sanitary fittings have been disallowed. The Honourable Lahore High Court has issued

16
Nis
hat
Mill
s Li
mite
dA
cce
lera
ting
focu
sse
d g
row
th For the quarter ended 30 September 2019 (Un-audited)
Selected Notes to the Unconsolidated Condensed Interim Financial Information
stay order in favour of the Company and has allowed the Company to claim input sales tax paid on such goods in its monthly sales tax returns. Consequently, the Company has claimed input sales tax amounting to Rupees 108.345 million (30 June 2019: Rupees 106.312 million) paid on such goods in its respective monthly sales tax returns. The management, based on advice of the legal counsel, is confident of favorable outcome of its appeal.
b) Commitments
i) Contracts for capital expenditure are approximately of Rupees 1,890.593 million
(30 June 2019: Rupees 970.420 million).
ii) Letters of credit other than for capital expenditure are of Rupees 869.304 million
(30 June 2019: Rupees 874.187 million).
iii) Outstanding foreign currency forward contracts of Rupees 1,547.162 million
(30 June 2019: Rupees 463.868 million).
7 PROPERTY, PLANT AND EQUIPMENT
Un-audited Audited
30 September 30 June
2019 2019
Note (Rupees in thousand)
Operating fixed assets - owned 7.1 28,000,370 28,450,899
Capital work-in-progress 7.2 1,476,772 517,320
29,477,142 28,968,219
7.1 Operating fixed assets - Owned
Opening book value 28,450,899 26,026,033
Add: Cost of additions during the period / year 7.1.1 227,460 5,194,332
28,678,359 31,220,365
Less: Book value of deletions during the period / year 7.1.2 (11,454) (113,648)
Less: Book value of assets written off during the year - (14,513)
28,666,905 31,092,204
Less: Depreciation charged during the period / year (666,535) (2,641,305)
28,000,370 28,450,899
17
Acc
ele
ratin
gfo
cuss
ed
gro
wth
Unc
onso
lidat
ed C
onde
nsed
Inte
rim F
inan
cial
Info
rmat
ion
for
the
quar
ter
ende
d Se
ptem
ber
30, 2
019
Un-audited Audited
30 September 30 June
2019 2019
(Rupees in thousand)
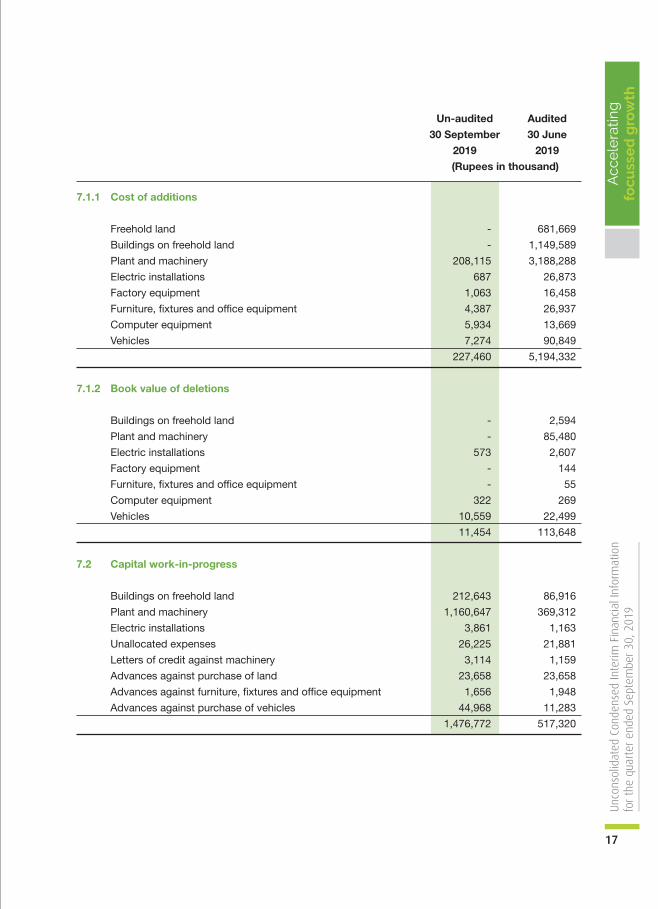
7.1.1 Cost of additions
Freehold land - 681,669
Buildings on freehold land - 1,149,589
Plant and machinery 208,115 3,188,288
Electric installations 687 26,873
Factory equipment 1,063 16,458
Furniture, fixtures and office equipment 4,387 26,937
Computer equipment 5,934 13,669
Vehicles 7,274 90,849
227,460 5,194,332
7.1.2 Book value of deletions
Buildings on freehold land - 2,594
Plant and machinery - 85,480
Electric installations 573 2,607
Factory equipment - 144
Furniture, fixtures and office equipment - 55
Computer equipment 322 269
Vehicles 10,559 22,499
11,454 113,648
7.2 Capital work-in-progress
Buildings on freehold land 212,643 86,916
Plant and machinery 1,160,647 369,312
Electric installations 3,861 1,163
Unallocated expenses 26,225 21,881
Letters of credit against machinery 3,114 1,159
Advances against purchase of land 23,658 23,658
Advances against furniture, fixtures and office equipment 1,656 1,948
Advances against purchase of vehicles 44,968 11,283
1,476,772 517,320

18
Nis
hat
Mill
s Li
mite
dA
cce
lera
ting
focu
sse
d g
row
th For the quarter ended 30 September 2019 (Un-audited)
Selected Notes to the Unconsolidated Condensed Interim Financial Information
Quarter ended 30 September 30 September 2019 2018 (Rupees in thousand)
8 COST OF SALES
Raw materials consumed 8,115,876 7,698,069 Processing charges 71,349 50,985 Salaries, wages and other benefits 1,629,534 1,364,605 Staff retirement benefits 44,748 41,675 Stores, spare parts and loose tools consumed 1,726,922 1,316,936 Packing materials consumed 326,624 277,434 Repair and maintenance 96,987 70,199 Fuel and power 1,704,022 1,726,314 Insurance 12,303 11,705 Other factory overheads 156,417 135,697 Depreciation 643,342 604,896 14,528,124 13,298,515 Work-in-process
Opening stock 2,015,512 2,022,712 Closing stock (2,129,956) (2,056,449) (114,444) (33,737) Cost of goods manufactured 14,413,680 13,264,778
Finished goods
Opening stock 3,857,431 3,229,351 Closing stock (4,495,263) (3,997,924) (637,832) (768,573) 13,775,848 12,496,205
Quarter ended 30 September 30 September 2019 2018
9 EARNINGS PER SHARE - BASIC AND DILUTED
There is no dilutive effect on the basic earnings per share which is based on: Profit attributable to ordinary shareholders (Rupees in thousand) 923,702 994,889
Weighted average number of ordinary shares (Numbers) 351,599,848 351,599,848
Earnings per share (Rupees) 2.63 2.83
19
Acc
ele
ratin
gfo
cuss
ed
gro
wth
Unc
onso
lidat
ed C
onde
nsed
Inte
rim F
inan
cial
Info
rmat
ion
for
the
quar
ter
ende
d Se
ptem
ber
30, 2
019
Quarter ended 30 September 30 September 2019 2018 Note (Rupees in thousand)
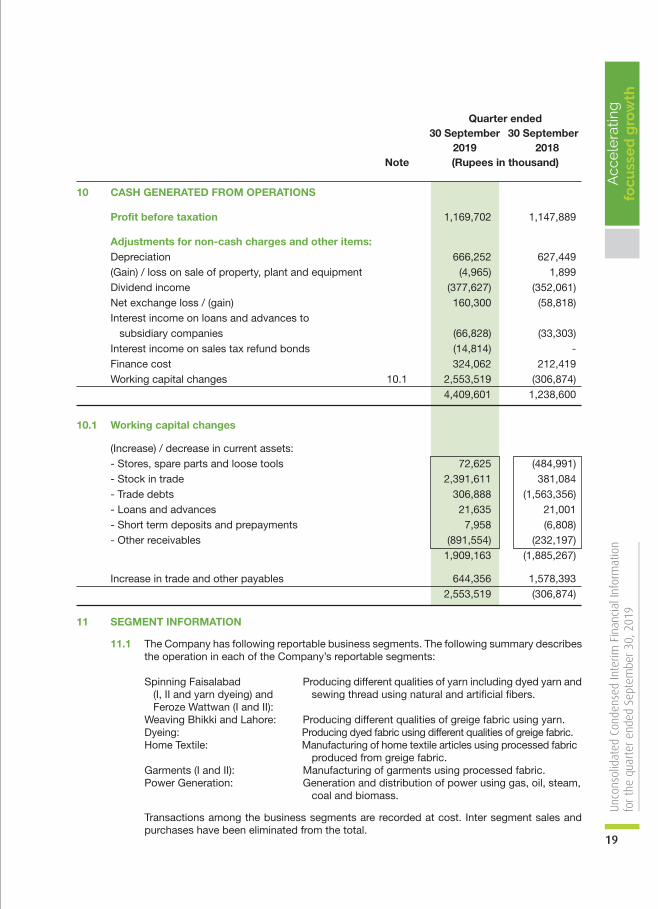
10 CASH GENERATED FROM OPERATIONS
Profit before taxation 1,169,702 1,147,889
Adjustments for non-cash charges and other items: Depreciation 666,252 627,449 (Gain) / loss on sale of property, plant and equipment (4,965) 1,899 Dividend income (377,627) (352,061) Net exchange loss / (gain) 160,300 (58,818) Interest income on loans and advances to subsidiary companies (66,828) (33,303) Interest income on sales tax refund bonds (14,814) - Finance cost 324,062 212,419 Working capital changes 10.1 2,553,519 (306,874) 4,409,601 1,238,600
10.1 Working capital changes
(Increase) / decrease in current assets: - Stores, spare parts and loose tools 72,625 (484,991) - Stock in trade 2,391,611 381,084 - Trade debts 306,888 (1,563,356) - Loans and advances 21,635 21,001 - Short term deposits and prepayments 7,958 (6,808) - Other receivables (891,554) (232,197) 1,909,163 (1,885,267)
Increase in trade and other payables 644,356 1,578,393 2,553,519 (306,874)
11 SEGMENT INFORMATION
11.1 The Company has following reportable business segments. The following summary describes the operation in each of the Company’s reportable segments:
Spinning Faisalabad Producing different qualities of yarn including dyed yarn and (I, II and yarn dyeing) and sewing thread using natural and artificial fibers. Feroze Wattwan (I and II): Weaving Bhikki and Lahore: Producing different qualities of greige fabric using yarn.
Dyeing: Producing dyed fabric using different qualities of greige fabric. Home Textile: Manufacturing of home textile articles using processed fabric produced from greige fabric. Garments (I and II): Manufacturing of garments using processed fabric. Power Generation: Generation and distribution of power using gas, oil, steam, coal and biomass.
Transactions among the business segments are recorded at cost. Inter segment sales and purchases have been eliminated from the total.

20
Nis
hat
Mill
s Li
mite
dA
cce
lera
ting
focu
sse
d g
row
th For the quarter ended 30 September 2019 (Un-audited)
Selected Notes to the Unconsolidated Condensed Interim Financial InformationSp
inni
ngW
eavi
ngDy
eing
*Ho
me
Text
ile *
Garm
ents
Pow
er G
ener
atio
nTo
tal -
Com
pany
(Un-
aud
ited
)
Sep
2019
Sep
2018
Sep
2019
Sep
2018
Sep
2019
Sep
2018
Sep
2019
Sep
2018
(Rup
ees
in th
ousa
nd)
Sep
2019
Sep
2019
Sep
2018
Sep
2019
Sep
2018
Sep
2018
Sep
2019
Sep
2018
Sep
2019
Sep
2018
Sep
2019
Sep
2019
Sep
2018
Sep
2019
Sep
2018
Sep
2018
Sep
2019
Sep
2018
Fais
alab
ad I
Quar
ter e
nded
Quar
ter e
nded
Quar
ter e
nded
Quar
ter e
nded
Quar
ter e
nded
Quar
ter e
nded
Quar
ter e
nded
Quar
ter e
nded
Quar
ter e
nded
Quar
ter e
nded
Quar
ter e
nded
Quar
ter e
nded
Quar
ter e
nded
Quar
ter e
nded
Fais
alab
ad II
Fero
ze W
attw
an II
Fero
ze W
attw
an I
Fais
alab
ad Y
arn
Dyei
ngBh
ikki
Laho
re *
Sep
2019
Sep
2018
Elim
inat
ion
of
inte
r-se
gmen
ttra
nsac
tions
III
11.2
Reve
nue
Exte
rnal
1,263
,529
1,840
,795
1,105
,289
406,6
98
134,4
56
105,0
54
1,037
,440
1,218
,482
56,49
8 -
3,130
,034
2,454
,588
754,6
66
1,018
,562
3,528
,042
2,965
,544
3,389
,091
3,032
,024
363,6
46
696,3
59
1,152
,894
545,7
64
17,54
5 13
,928
- -
15,93
3,130
14
,297,7
98
Inte
rsegm
ent
650,8
98
401,3
54
192,0
71
85,26
6 79
,206
65,00
3 49
2,701
35
0,864
13
,278
- 1,6
54,81
2 1,9
20,08
1 1,2
51,51
5 84
8,505
14
0,137
12
3,122
13
8,557
69
,285
74,94
0 26
,258
80,22
9 35
,777
1,751
,488
1,810
,792
(6,51
9,832
) (5,
736,3
07)
- -
1,9
14,42
7 2,2
42,14
9 1,2
97,36
0 49
1,964
21
3,662
17
0,057
1,5
30,14
1 1,5
69,34
6 69
,776
- 4,7
84,84
6 4,3
74,66
9 2,0
06,18
1 1,8
67,06
7 3,6
68,17
9 3,0
88,66
6 3,5
27,64
8 3,1
01,30
9 43
8,586
72
2,617
1,2
33,12
3 58
1,541
1,7
69,03
3 1,8
24,72
0 (6,
519,8
32)
(5,73
6,307
) 15
,933,1
30
14,29
7,798
Cost
of sa
les
(1,72
9,185
) (2,
011,9
27)
(1,33
4,173
) (48
9,102
) (18
5,603
) (14
3,589
) (1,
478,7
06)
(1,39
0,789
) (66
,751)
- (4,
282,4
23)
(3,97
5,181
) (1,
852,9
73)
(1,66
7,596
) (2,
980,9
68)
(2,60
9,299
) (3,
147,6
99)
(2,71
0,481
) (38
8,029
) (80
8,388
) (1,
087,8
96)
(605,7
18)
(1,76
1,274
) (1,
820,4
42)
6,519
,832
5,736
,307
(13,77
5,848
) (12
,496,2
05)
Gros
s prof
it / (lo
ss)
185,2
42
230,2
22
(36,81
3) 2,8
62
28,05
9 26
,468
51,43
5 17
8,557
3,0
25
- 50
2,423
39
9,488
15
3,208
19
9,471
68
7,211
47
9,367
37
9,949
39
0,828
50
,557
(85,77
1) 14
5,227
(24
,177)
7,759
4,2
78
- -
2,157
,282
1,801
,593
Distrib
ution
cost
(43,87
4) (55
,835)
(4,22
0) (3,
316)
(9,50
6) (3,
438)
(41,69
7) (28
,663)
(110)
- (14
5,515
) (11
0,016
) (30
,983)
(38,4
07)
(159,1
84)
(151,4
40)
(174,8
74)
(129,6
94)
(17,32
1) (62
,734)
(111,0
32)
(44,04
4) -
(5)
- -
(738,3
16)
(627,5
92)
Admi
nistra
tive e
xpen
ses
(43,63
3) (43
,233)
(15,97
5) (9,
972)
(2,17
5) (1,
879)
(23,59
1) (18
,302)
(515)
- (44
,594)
(40,89
1) (23
,062)
(20,15
0) (48
,116)
(40,42
7) (60
,123)
(50,24
0) (7,
636)
(20,84
0) (25
,977)
(11,36
3) (11
,265)
(10,77
3) -
- (30
6,662
) (26
8,070
)
(87
,507)
(99,06
8) (20
,195)
(13,28
8) (11
,681)
(5,31
7) (65
,288)
(46,96
5) (62
5) -
(190
,109)
(150,9
07)
(54,04
5) (58
,557)
(207,3
00)
(191,8
67)
(234,9
97)
(179,9
34)
(24,95
7) (83
,574)
(137,0
09)
(55,4
07)
(11,26
5) (10
,778)
- -
(1,04
4,978
) (89
5,662
)
Profi
t/ (lo
ss) b
efore
taxati
on an
d
una
lloca
ted in
come
and e
xpen
ses
97,73
5 13
1,154
(5
7,008
) (10
,426)
16,37
8 21
,151
(13,85
3) 13
1,592
2,4
00
- 31
2,314
24
8,581
99
,163
140,9
14
479,9
11
287,5
00
144,9
52
210,8
94
25,60
0 (16
9,345
) 8,2
18
(79,58
4) (3,
506)
(6,50
0) -
- 1,1
12,30
4 90
5,931
Unall
ocate
d inc
ome a
nd ex
pens
es:
Othe
r exp
ense
s
(2
15,25
7) (5
6,892
)
Othe
r inco
me
596
,717
511,2
69
Finan
ce co
st
(3
24,06
2) (2
12,41
9)
Taxa
tion
(246
,000)
(153
,000)
Profi
t afte
r tax
ation
9
23,70
2 99
4,889
Spin
ning
Wea
ving
Dyei
ng *
Hom
e Te
xtile
*Ga
rmen
tsPo
wer
Gen
erat
ion
Tota
l - C
ompa
ny
Sep
2019
June
201
9Se
p 20
19Ju
ne 2
019
Sep
2019
June
201
9
(Rup
ees
in th
ousa
nd)
Sep
2019
Sep
2019
June
201
9Se
p 20
19Ju
ne 2
019
June
201
9Se
p 20
19Ju
ne 2
019
Sep
2019
June
201
9Se
p 20
19Se
p 20
19Ju
ne 2
019
Sep
2019
June
201
9Ju
ne 2
019
Sep
2019
June
201
9
Fais
alab
ad I
Fais
alab
ad II
Fero
ze W
attw
an II
Fero
ze W
attw
an I
Fais
alab
ad Y
arn
Dyei
ngBh
ikki
Laho
re *
Sep
2019
June
201
9
Un-a
udite
dAu
dite
dUn
-aud
ited
Audi
ted
Un-a
udite
dAu
dite
dUn
-aud
ited
Un-a
udite
dAu
dite
dUn
-aud
ited
Audi
ted
Audi
ted
Un-a
udite
dAu
dite
dUn
-aud
ited
Audi
ted
Un-a
udite
dUn
-aud
ited
Audi
ted
Un-a
udite
dAu
dite
dAu
dite
dUn
-aud
ited
Audi
ted
Un-a
udite
dAu
dite
d
III
11.3
Rec
onci
liatio
n of
repo
rtabl
e se
gmen
t ass
ets
and
liabi
litie
s
Total
asse
ts for
repo
rtable
segm
ents
3,46
0,593
5,
407,2
84
5,273
,625
5,221
,230
478,2
40
471,9
54
6,635
,448
7,363
,931
826,0
70
772,3
90
6,314
,407
6,773
,821
1,258
,302
1,364
,567
8,885
,409
7,675
,552
7,486
,866
7,479
,977
275,0
25
1,275
,949
3,283
,889
3,025
,872
7,927
,239
7,865
,622
52,10
5,113
54
,698,1
49
Unall
ocate
d ass
ets:
Long
term
inve
stmen
ts
3
3,356
,179
34,93
0,333
Othe
r rec
eivab
les
2,90
9,271
2,2
53,67
8
Cash
and b
ank b
alanc
es
3,91
4,571
57
6,625
Othe
r corp
orate
asse
ts
8
,003,3
95
8,086
,607
Total
asse
ts as
per s
tatem
ent
of f
inanc
ial po
sition
10
0,288
,529
100,5
45,39
2
Total
liabil
ities f
or re
porta
ble se
gmen
ts 8
77,34
0 73
0,888
29
8,981
34
8,720
36
,779
37,11
5 14
5,626
11
0,873
14
,744
10,76
4 88
9,782
49
3,954
20
6,835
17
4,141
1,
232,5
18
877,9
69
1,080
,149
1,127
,595
157,8
00
182,0
56
491,0
04
439,9
23
2,983
,246
3,026
,437
8,414
,804
7,560
,435
Unall
ocate
d liab
ilities
:
Defer
red in
come
tax l
iabilit
y
2
15,44
0 21
5,440
Othe
r corp
orate
liabil
ities
26,15
5,081
26
,154,2
47
Total
liabil
ities a
s per
state
ment
of
fina
ncial
posit
ion
34,7
85,32
5 33
,930,1
22
* Figu
res of
thes
e seg
ments
inclu
de ex
tensio
n / BM
R.

21
Acc
ele
ratin
gfo
cuss
ed
gro
wth
Unc
onso
lidat
ed C
onde
nsed
Inte
rim F
inan
cial
Info
rmat
ion
for
the
quar
ter
ende
d Se
ptem
ber
30, 2
019
12 RECOGNIZED FAIR VALUE MEASUREMENTS - FINANCIAL INSTRUMENTS
i) Fair value hierarchy
Judgements and estimates are made in determining the fair values of the financial instruments that are recognized and measured at fair value in these financial statements. To provide an indication about the reliability of the inputs used in determining fair value, the Company has classified its financial instruments into the following three levels. An explanation of each level follows underneath the table.
Recurring fair value measurements Level 1 Level 2 Level 3 Total At 30 September 2019 (Rupees in thousand)
Financial assets
Fair value through other comprehensive income 25,203,006 - 3,004,950 28,207,956 Derivative financial assets - 8,535 - 8,535 Total financial assets 25,203,006 8,535 3,004,950 28,216,491
Financial liabilities
Derivative financial liabilities - 4,934 - 4,934 Total financial liabilities - 4,934 - 4,934
Recurring fair value measurements Level 1 Level 2 Level 3 Total At 30 June 2019 - Audited (Rupees in thousand)
Financial assets
Fair value through other comprehensive income 27,238,774 - 3,004,950 30,243,724 Derivative financial assets - 958 - 958 Total financial assets 27,238,774 958 3,004,950 30,244,682
Financial liabilities
Derivative financial liabilities - 7,583 - 7,583 Total financial liabilities - 7,583 - 7,583
The above table does not include fair value information for financial assets and financial liabilities not measured at fair value if the carrying amounts are a reasonable approximation of fair value. Due to short term nature, carrying amounts of certain financial assets and financial liabilities are considered to be the same as their fair value. For the majority of the non-current receivables, the fair values are also not significantly different to their carrying amounts.
There were no transfers between levels 1 and 2 for recurring fair value measurements during the quarter ended 30 September 2019. Further there was no transfer out of level 3 measurements.
The Company’s policy is to recognize transfers into and transfers out of fair value hierarchy levels as at the end of the reporting period.
Level 1: The fair value of financial instruments traded in active markets (such as publicly traded derivatives, and trading and equity securities) is based on quoted market prices at the end of the reporting period. The quoted market price used for financial assets held by the Company is the current bid price. These instruments are included in level 1.
Level 2: The fair value of financial instruments that are not traded in an active market (for example, over-the-counter derivatives) is determined using valuation techniques which maximize the use of observable market data and rely as little as possible on entity-specific estimates. If all significant inputs required to fair value an instrument are observable, the instrument is included in level 2.
22
Nis
hat
Mill
s Li
mite
dA
cce
lera
ting
focu
sse
d g
row
th For the quarter ended 30 September 2019 (Un-audited)
Selected Notes to the Unconsolidated Condensed Interim Financial Information
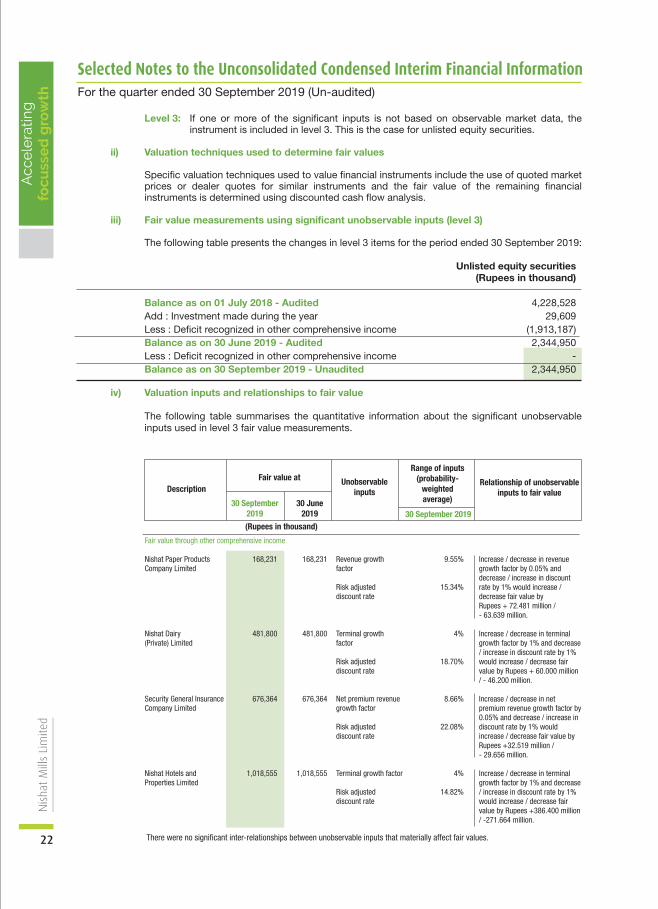
Level 3: If one or more of the significant inputs is not based on observable market data, the instrument is included in level 3. This is the case for unlisted equity securities.
ii) Valuation techniques used to determine fair values
Specific valuation techniques used to value financial instruments include the use of quoted market prices or dealer quotes for similar instruments and the fair value of the remaining financial instruments is determined using discounted cash flow analysis.
iii) Fair value measurements using significant unobservable inputs (level 3)
The following table presents the changes in level 3 items for the period ended 30 September 2019:
Unlisted equity securities (Rupees in thousand)
Balance as on 01 July 2018 - Audited 4,228,528 Add : Investment made during the year 29,609 Less : Deficit recognized in other comprehensive income (1,913,187) Balance as on 30 June 2019 - Audited 2,344,950 Less : Deficit recognized in other comprehensive income - Balance as on 30 September 2019 - Unaudited 2,344,950
iv) Valuation inputs and relationships to fair value
The following table summarises the quantitative information about the significant unobservable inputs used in level 3 fair value measurements.
There were no significant inter-relationships between unobservable inputs that materially affect fair values.
DescriptionFair value at Unobservable
inputs
Range of inputs(probability-
weightedaverage)
Relationship of unobservableinputs to fair value
30 September2019
(Rupees in thousand)30 September 2019
30 June2019
Fair value through other comprehensive income Nishat Paper Products 168,231 168,231 Revenue growth 9.55%Company Limited factor Risk adjusted 15.34% discount rate
Nishat Dairy 481,800 481,800 Terminal growth 4%(Private) Limited factor Risk adjusted 18.70% discount rate
Security General Insurance 676,364 676,364 Net premium revenue 8.66%Company Limited growth factor
Risk adjusted 22.08% discount rate
Nishat Hotels and 1,018,555 1,018,555 Terminal growth factor 4%Properties Limited Risk adjusted 14.82% discount rate
Increase / decrease in revenue growth factor by 0.05% and decrease / increase in discount rate by 1% would increase / decrease fair value byRupees + 72.481 million / - 63.639 million.
Increase / decrease in terminal growth factor by 1% and decrease / increase in discount rate by 1% would increase / decrease fair value by Rupees + 60.000 million / - 46.200 million.
Increase / decrease in net premium revenue growth factor by 0.05% and decrease / increase in discount rate by 1% would increase / decrease fair value by Rupees +32.519 million /- 29.656 million.
Increase / decrease in terminal growth factor by 1% and decrease / increase in discount rate by 1% would increase / decrease fair value by Rupees +386.400 million / -271.664 million.

23
Acc
ele
ratin
gfo
cuss
ed
gro
wth
Unc
onso
lidat
ed C
onde
nsed
Inte
rim F
inan
cial
Info
rmat
ion
for
the
quar
ter
ende
d Se
ptem
ber
30, 2
019
Valuation processes
Independent valuers perform the valuations of non-property items required for financial reporting purposes, including level 3 fair values. The independent valuers report directly to the Chief Financial Officer. Discussions of valuation processes and results are held between the Chief Financial Officer and the valuation team at least once every six month, in line with the Company’s half yearly reporting periods.
The main level 3 inputs used by the Company are derived and evaluated as follows:
Discount rates for financial instruments are determined using a capital asset pricing model to calculate a rate that reflects current market assessments of the time value of money and the risk specific to the asset.
Earnings growth factor for unlisted equity securities are estimated based on market information for similar types of companies.
Changes in level 2 and 3 fair values are analyzed at the end of each half yearly reporting period during the valuation discussion between the Chief Financial Officer and the independent valuers. As part of this discussion the independent valuers present a report that explains the reason for the fair value movements.
13 TRANSACTIONS WITH RELATED PARTIES
The related parties comprise subsidiary companies, associated undertakings, other related companies, key management personnel and provident fund trust. The Company in the normal course of business carries out transactions with various related parties. Detail of transactions with related parties are as follows:
i) Transactions Quarter ended 30 September 30 September 2019 2018 (Rupees in thousand)
Subsidiary companies Investment made 230,000 - Short term loans made 8,648,519 9,423,994 Repayment of short term loans made 8,799,651 6,412,277 Interest income 66,828 33,303 Rental income 14,574 13,499 Sale of goods and services 1,749,063 1,654,992 Purchase of goods and services 57,186 70,090
Associated companies Investment made - 60,000 Purchase of goods and services 6,347 11,725 Sale of goods and services 3,956 92 Sale of operating fixed assets 819 - Rental income 10,081 314 Dividend income 377,627 352,061 Insurance premium paid 37,591 39,771 Insurance claims received 11,819 5,332 Finance cost 3,436 2,380
Other related parties Purchase of goods and services 616,619 481,740 Sale of goods and services 104,369 6,334 Company's contribution to provident fund trust 59,850 55,273 Remuneration paid to Chief Executive Officer, Director and Executives 245,894 177,448
24
Nis
hat
Mill
s Li
mite
dA
cce
lera
ting
focu
sse
d g
row
th For the quarter ended 30 September 2019 (Un-audited)
Selected Notes to the Unconsolidated Condensed Interim Financial Information
CHIEF FINANCIAL OFFICERDIRECTORCHIEF EXECUTIVE OFFICER
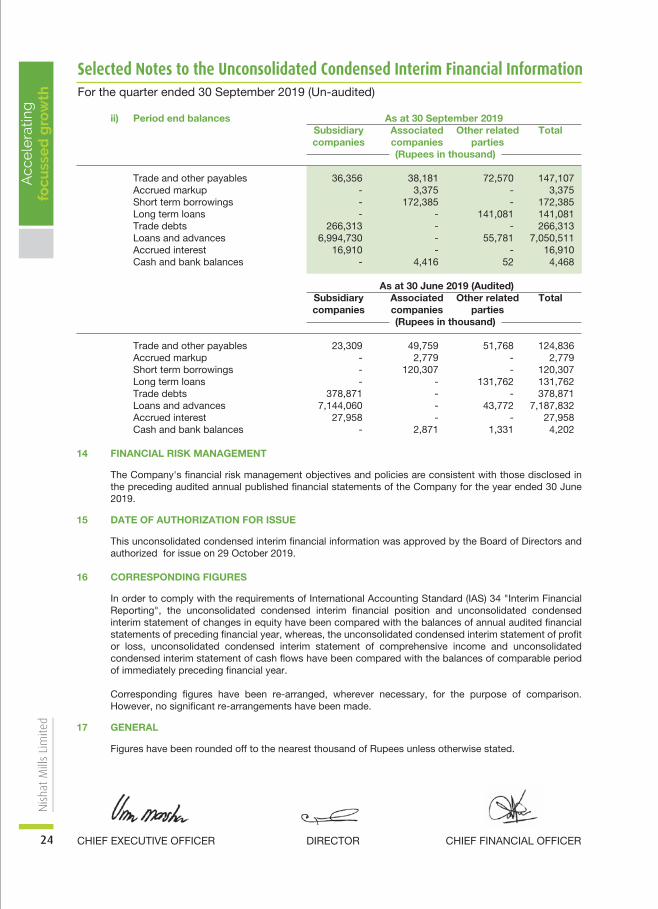
ii) Period end balances As at 30 September 2019 Subsidiary Associated Other related Total companies companies parties (Rupees in thousand)
Trade and other payables 36,356 38,181 72,570 147,107 Accrued markup - 3,375 - 3,375 Short term borrowings - 172,385 - 172,385 Long term loans - - 141,081 141,081 Trade debts 266,313 - - 266,313 Loans and advances 6,994,730 - 55,781 7,050,511 Accrued interest 16,910 - - 16,910 Cash and bank balances - 4,416 52 4,468
As at 30 June 2019 (Audited) Subsidiary Associated Other related Total companies companies parties (Rupees in thousand)
Trade and other payables 23,309 49,759 51,768 124,836 Accrued markup - 2,779 - 2,779 Short term borrowings - 120,307 - 120,307 Long term loans - - 131,762 131,762 Trade debts 378,871 - - 378,871 Loans and advances 7,144,060 - 43,772 7,187,832 Accrued interest 27,958 - - 27,958 Cash and bank balances - 2,871 1,331 4,202
14 FINANCIAL RISK MANAGEMENT
The Company's financial risk management objectives and policies are consistent with those disclosed in the preceding audited annual published financial statements of the Company for the year ended 30 June 2019.
15 DATE OF AUTHORIZATION FOR ISSUE
This unconsolidated condensed interim financial information was approved by the Board of Directors and authorized for issue on 29 October 2019.
16 CORRESPONDING FIGURES
In order to comply with the requirements of International Accounting Standard (IAS) 34 "Interim Financial Reporting", the unconsolidated condensed interim financial position and unconsolidated condensed interim statement of changes in equity have been compared with the balances of annual audited financial statements of preceding financial year, whereas, the unconsolidated condensed interim statement of profit or loss, unconsolidated condensed interim statement of comprehensive income and unconsolidated condensed interim statement of cash flows have been compared with the balances of comparable period of immediately preceding financial year.
Corresponding figures have been re-arranged, wherever necessary, for the purpose of comparison. However, no significant re-arrangements have been made.
17 GENERAL
Figures have been rounded off to the nearest thousand of Rupees unless otherwise stated.
Consolidated Condensed Interim
Financial Information of Nishat Mills Limited
and its Subsidiaries
For the quarter ended 30 September 2019
26
Nis
hat
Mill
s Li
mite
d an
d its
Sub
sidi
arie
s A
cce
lera
ting
focu
sse
d g
row
th As at 30 September 2019
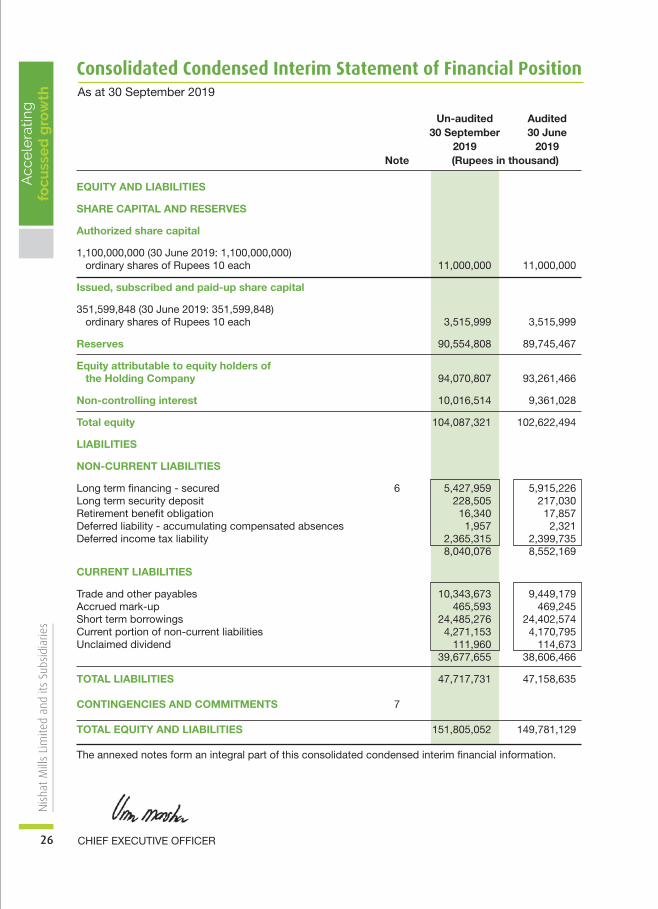
Consolidated Condensed Interim Statement of Financial Position
Un-audited Audited 30 September 30 June 2019 2019 Note (Rupees in thousand) EQUITY AND LIABILITIES
SHARE CAPITAL AND RESERVES
Authorized share capital
1,100,000,000 (30 June 2019: 1,100,000,000) ordinary shares of Rupees 10 each 11,000,000 11,000,000
Issued, subscribed and paid-up share capital
351,599,848 (30 June 2019: 351,599,848) ordinary shares of Rupees 10 each 3,515,999 3,515,999
Reserves 90,554,808 89,745,467
Equity attributable to equity holders of the Holding Company 94,070,807 93,261,466
Non-controlling interest 10,016,514 9,361,028
Total equity 104,087,321 102,622,494
LIABILITIES
NON-CURRENT LIABILITIES
Long term financing - secured 6 5,427,959 5,915,226Long term security deposit 228,505 217,030Retirement benefit obligation 16,340 17,857Deferred liability - accumulating compensated absences 1,957 2,321Deferred income tax liability 2,365,315 2,399,735 8,040,076 8,552,169
CURRENT LIABILITIES
Trade and other payables 10,343,673 9,449,179Accrued mark-up 465,593 469,245Short term borrowings 24,485,276 24,402,574Current portion of non-current liabilities 4,271,153 4,170,795Unclaimed dividend 111,960 114,673 39,677,655 38,606,466
TOTAL LIABILITIES 47,717,731 47,158,635
CONTINGENCIES AND COMMITMENTS 7 TOTAL EQUITY AND LIABILITIES 151,805,052 149,781,129
The annexed notes form an integral part of this consolidated condensed interim financial information.
CHIEF EXECUTIVE OFFICER
27
Acc
ele
ratin
gfo
cuss
ed
gro
wth
Cons
olid
ated
Con
dens
ed In
terim
Fin
anci
al In
form
atio
nfo
r th
e qu
arte
r en
ded
Sept
embe
r 30
, 201
9
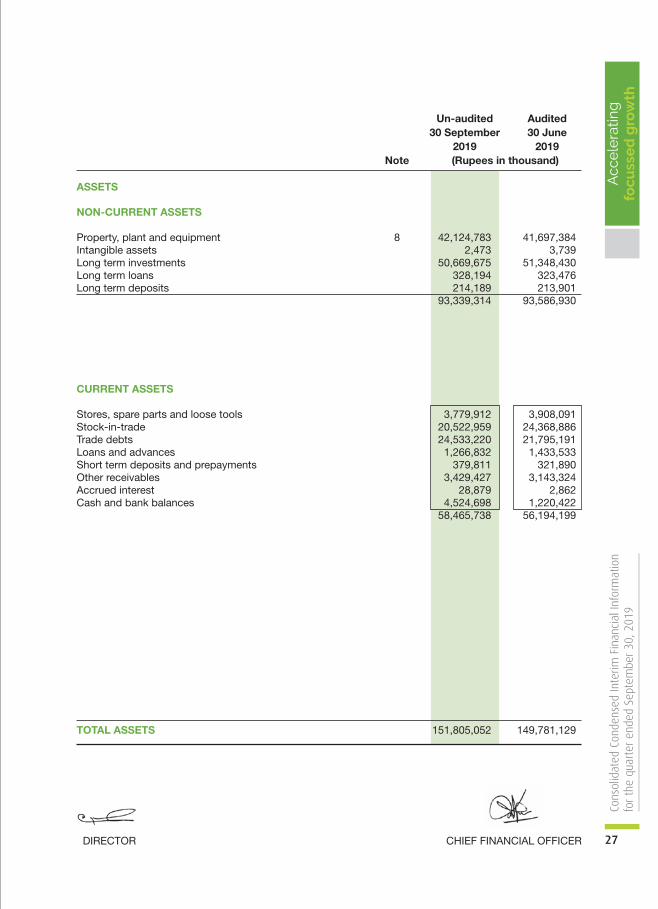
Un-audited Audited 30 September 30 June 2019 2019 Note (Rupees in thousand) ASSETS NON-CURRENT ASSETS
Property, plant and equipment 8 42,124,783 41,697,384Intangible assets 2,473 3,739Long term investments 50,669,675 51,348,430Long term loans 328,194 323,476Long term deposits 214,189 213,901 93,339,314 93,586,930
CURRENT ASSETS
Stores, spare parts and loose tools 3,779,912 3,908,091Stock-in-trade 20,522,959 24,368,886Trade debts 24,533,220 21,795,191Loans and advances 1,266,832 1,433,533Short term deposits and prepayments 379,811 321,890Other receivables 3,429,427 3,143,324Accrued interest 28,879 2,862Cash and bank balances 4,524,698 1,220,422 58,465,738 56,194,199
TOTAL ASSETS 151,805,052 149,781,129
CHIEF FINANCIAL OFFICERDIRECTOR
28
Nis
hat
Mill
s Li
mite
d an
d its
Sub
sidi
arie
s A
cce
lera
ting
focu
sse
d g
row
th For the quarter ended 30 September 2019 (Un-audited)
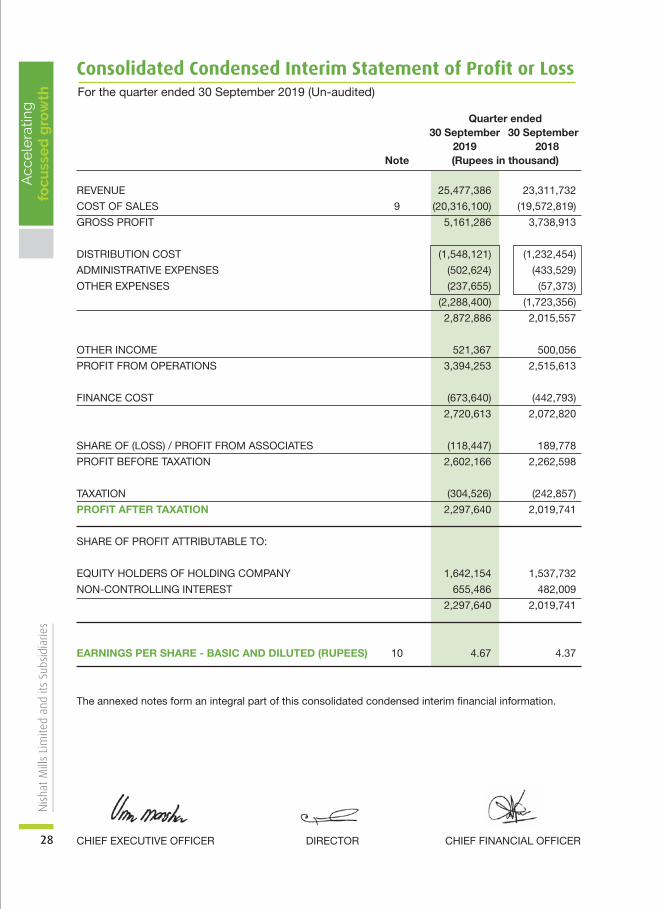
Consolidated Condensed Interim Statement of Profit or Loss
CHIEF FINANCIAL OFFICERDIRECTORCHIEF EXECUTIVE OFFICER
Quarter ended 30 September 30 September 2019 2018 Note (Rupees in thousand)
REVENUE 25,477,386 23,311,732
COST OF SALES 9 (20,316,100) (19,572,819)
GROSS PROFIT 5,161,286 3,738,913
DISTRIBUTION COST (1,548,121) (1,232,454)
ADMINISTRATIVE EXPENSES (502,624) (433,529)
OTHER EXPENSES (237,655) (57,373)
(2,288,400) (1,723,356)
2,872,886 2,015,557
OTHER INCOME 521,367 500,056
PROFIT FROM OPERATIONS 3,394,253 2,515,613
FINANCE COST (673,640) (442,793)
2,720,613 2,072,820
SHARE OF (LOSS) / PROFIT FROM ASSOCIATES (118,447) 189,778
PROFIT BEFORE TAXATION 2,602,166 2,262,598
TAXATION (304,526) (242,857)
PROFIT AFTER TAXATION 2,297,640 2,019,741
SHARE OF PROFIT ATTRIBUTABLE TO:
EQUITY HOLDERS OF HOLDING COMPANY 1,642,154 1,537,732
NON-CONTROLLING INTEREST 655,486 482,009
2,297,640 2,019,741
EARNINGS PER SHARE - BASIC AND DILUTED (RUPEES) 10 4.67 4.37
The annexed notes form an integral part of this consolidated condensed interim financial information.

29
Acc
ele
ratin
gfo
cuss
ed
gro
wth
Cons
olid
ated
Con
dens
ed In
terim
Fin
anci
al In
form
atio
nfo
r th
e qu
arte
r en
ded
Sept
embe
r 30
, 201
9
CHIEF FINANCIAL OFFICERDIRECTORCHIEF EXECUTIVE OFFICER
Quarter ended 30 September 30 September 2019 2018 (Rupees in thousand)
PROFIT AFTER TAXATION 2,297,640 2,019,741
OTHER COMPREHENSIVE (LOSS) / INCOME
Items that will not be reclassified to profit or loss:
(Deficit) / Surplus arising on remeasurement of investments at fair
value through other comprehensive income (486,096) 421,797
Share of other comprehensive (loss) / income of associates (315,326) 82,559
(801,422) 504,356
Items that may be reclassified subsequently to profit or loss:
Exchange differences on translating foreign operations (31,391) 9,311
Other comprehensive (loss) / income for the period (832,813) 513,667
TOTAL COMPREHENSIVE INCOME FOR THE PERIOD 1,464,827 2,533,408
SHARE OF TOTAL COMPREHENSIVE INCOME ATTRIBUTABLE TO:
Equity holders of holding company 809,341 2,051,399
Non-controlling interest 655,486 482,009
1,464,827 2,533,408
The annexed notes form an integral part of this consolidated condensed interim financial information.
For the quarter ended 30 September 2019 (Un-audited)
Consolidated Condensed Interim Statement of Comprehensive Income
30
Nis
hat
Mill
s Li
mite
d an
d its
Sub
sidi
arie
s A
cce
lera
ting
focu
sse
d g
row
th For the quarter ended 30 September 2019 (Un-audited)
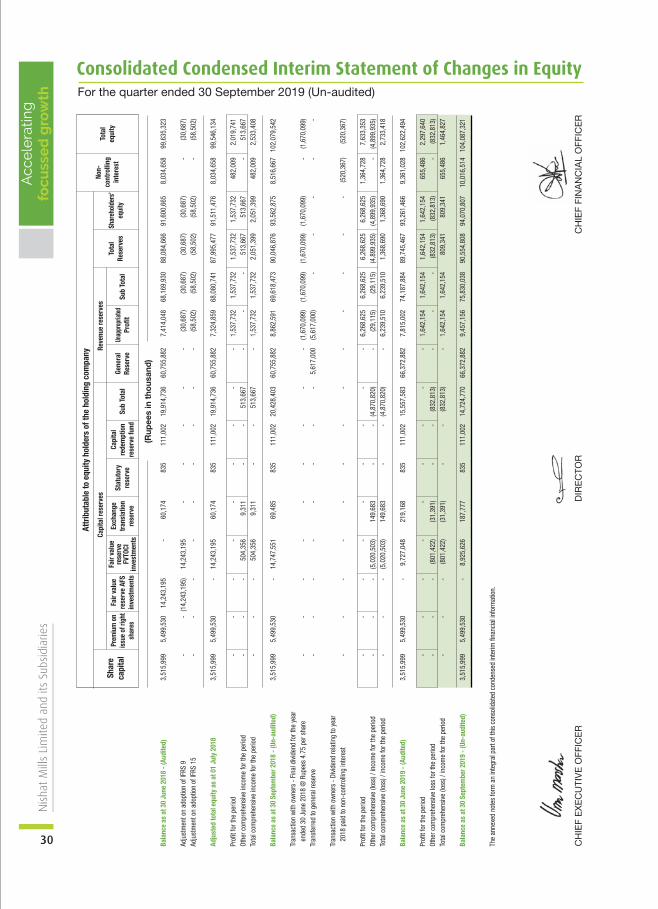
Consolidated Condensed Interim Statement of Changes in Equity
CH
IEF
EX
EC
UTI
VE
OFF
ICE
RC
HIE
F FI
NA
NC
IAL
OFF
ICE
RD
IRE
CTO
R
Attr
ibut
able
to e
quity
hol
ders
of t
he h
oldi
ng c
ompa
ny
(Rup
ees
in t
hous
and)
Shar
eca
pita
lPr
emiu
m o
nis
sue
of ri
ght
shar
es
Exch
ange
tran
slat
ion
rese
rve
Capi
tal
rede
mpt
ion
rese
rve
fund
Stat
utor
yre
serv
eSu
b To
tal
Sub
Tota
l
Tota
lRe
serv
es
Tota
leq
uity
Non-
cont
rolli
ngin
tere
stSh
areh
olde
rs’
equi
tyGe
nera
lRe
serv
eUn
appr
opria
tedPr
ofit
Fair
valu
ere
serv
e AF
Sin
vest
men
ts
Fair
valu
ere
serv
eFV
TOCI
inve
stm
ents
Capi
tal r
eser
ves
Reve
nue
rese
rves
Bala
nce
as a
t 30
June
201
8 - (
Audi
ted)
3,
515,
999
5,49
9,53
0 14
,243
,195
-
60,
174
835
111,
002
19,9
14,7
36
60,7
55,8
82
7,41
4,04
8 68
,169
,930
88
,084
,666
91
,600
,665
8,
034,
658
99,6
35,3
23
Adju
stm
ent o
n ad
optio
n of
IFRS
9
- -
(14,
243,
195)
14
,243
,195
-
- -
- -
(30,
687)
(3
0,68
7)
(30,
687)
(3
0,68
7)
- (3
0,68
7)Ad
just
men
t on
adop
tion
of IF
RS 1
5 -
- -
- -
- -
- -
(58,
502)
(5
8,50
2)
(58,
502)
(5
8,50
2)
- (5
8,50
2)
Adju
sted
tota
l equ
ity a
s at
01
July
201
8 3
,515
,999
5,
499,
530
- 14
,243
,195
60
,174
83
5 11
1,00
2 19
,914
,736
60
,755
,882
7,
324,
859
68,0
80,7
41
87,9
95,4
77
91,5
11,4
76
8,03
4,65
8 99
,546
,134
Prof
it fo
r the
per
iod
- -
- -
- -
- -
- 1,
537,
732
1,53
7,73
2 1,
537,
732
1,53
7,73
2 48
2,00
9 2,
019,
741
Othe
r com
preh
ensi
ve in
com
e fo
r the
per
iod
- -
- 50
4,35
6 9,
311
- -
513,
667
- -
- 51
3,66
7 51
3,66
7 -
513,
667
Tota
l com
preh
ensi
ve in
com
e fo
r the
per
iod
-
- -
504,
356
9,31
1 -
- 51
3,66
7 -
1,53
7,73
2 1,
537,
732
2,05
1,39
9 2,
051,
399
482,
009
2,53
3,40
8
Bala
nce
as a
t 30
Sept
embe
r 201
8 - (
Un-a
udite
d)
3,51
5,99
9 5,
499,
530
- 14
,747
,551
69
,485
83
5 11
1,00
2 20
,428
,403
60
,755
,882
8,
862,
591
69,6
18,4
73
90,0
46,8
76
93,5
62,8
75
8,51
6,66
7 10
2,07
9,54
2
Tran
sact
ion
with
ow
ners
- Fi
nal d
ivid
end
for t
he y
ear
en
ded
30 J
une
2018
@ R
upee
s 4.
75 p
er s
hare
-
- -
- -
- -
- -
(1,6
70,0
99)
(1,6
70,0
99)
(1,6
70,0
99)
(1,6
70,0
99)
- (1
,670
,099
)Tr
ansf
erre
d to
gen
eral
rese
rve
- -
- -
- -
- -
5,61
7,00
0 (5
,617
,000
) -
- -
- -
Tran
sact
ion
with
ow
ners
- Di
vide
nd re
latin
g to
yea
r
2018
pai
d to
non
-con
trolli
ng in
tere
st
- -
- -
- -
- -
- -
- -
- (5
20,3
67)
(520
,367
)
Prof
it fo
r the
per
iod
- -
- -
- -
- -
- 6,
268,
625
6,26
8,62
5 6,
268,
625
6,26
8,62
5 1,
364,
728
7,63
3,35
3Ot
her c
ompr
ehen
sive
(los
s) /
inco
me
for t
he p
erio
d -
- -
(5,0
20,5
03)
149,
683
- -
(4,8
70,8
20)
- (2
9,11
5)
(29,
115)
(4
,899
,935
) (4
,899
,935
) -
(4,8
99,9
35)
Tota
l com
preh
ensi
ve (l
oss)
/ in
com
e fo
r the
per
iod
-
- -
(5,0
20,5
03)
149
,683
-
- (4
,870
,820
) -
6,23
9,51
0 6,
239,
510
1,36
8,69
0 1,
368,
690
1,36
4,72
8 2,
733,
418
Bala
nce
as a
t 30
June
201
9 - (
Audi
ted)
3,
515,
999
5,49
9,53
0 -
9,72
7,04
8 21
9,16
8 83
5 11
1,00
2 15
,557
,583
66
,372
,882
7,
815,
002
74,1
87,8
84
89,7
45,4
67
93,2
61,4
66
9,36
1,02
8 10
2,62
2,49
4
Prof
it fo
r the
per
iod
- -
- -
- -
- -
- 1,
642,
154
1,64
2,15
4 1,
642,
154
1,64
2,15
4 65
5,48
6 2,
297,
640
Othe
r com
preh
ensi
ve lo
ss fo
r the
per
iod
- -
- (8
01,4
22)
(31,
391)
-
- (8
32,8
13)
- -
- (8
32,8
13)
(832
,813
) -
(832
,813
)To
tal c
ompr
ehen
sive
(los
s) /
inco
me
for t
he p
erio
d
- -
- (8
01,4
22)
(31,
391)
-
- (8
32,8
13)
- 1,
642,
154
1,64
2,15
4 80
9,34
1 80
9,34
1 65
5,48
6 1,
464,
827
Bala
nce
as a
t 30
Sept
embe
r 201
9 - (
Un-a
udite
d)
3,51
5,99
9 5,
499,
530
- 8,
925,
626
187,
777
835
111,
002
14,7
24,7
70
66,3
72,8
82
9,45
7,15
6 75
,830
,038
90
,554
,808
94
,070
,807
10
,016
,514
10
4,08
7,32
1
The
anne
xed
note
s fo
rm a
n in
tegr
al p
art o
f thi
s co
nsol
idat
ed c
onde
nsed
inte
rim fi
nanc
ial i
nfor
mat
ion.
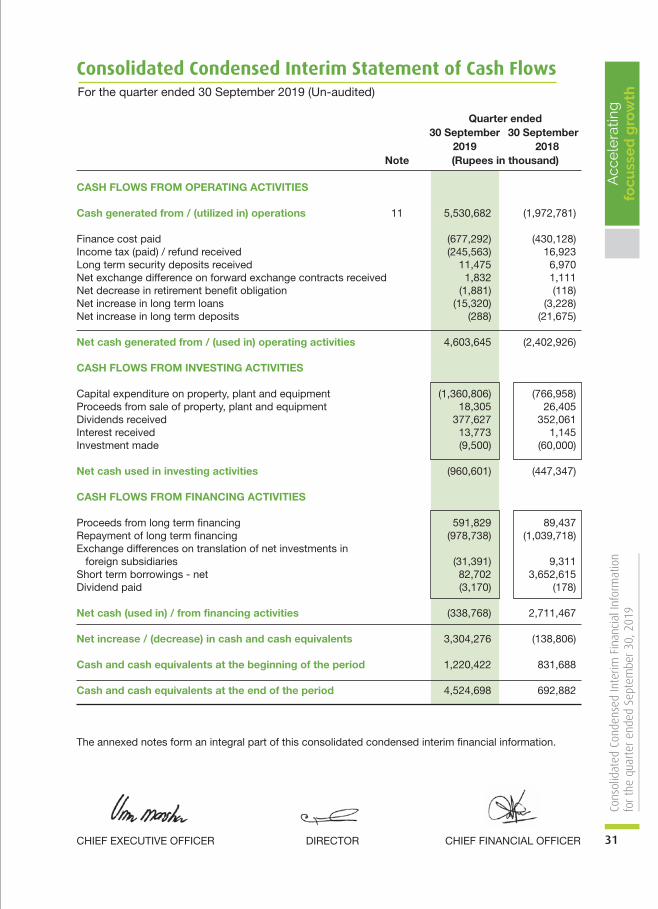
31
Acc
ele
ratin
gfo
cuss
ed
gro
wth
Cons
olid
ated
Con
dens
ed In
terim
Fin
anci
al In
form
atio
nfo
r th
e qu
arte
r en
ded
Sept
embe
r 30
, 201
9
CHIEF FINANCIAL OFFICERDIRECTORCHIEF EXECUTIVE OFFICER
Quarter ended 30 September 30 September 2019 2018 Note (Rupees in thousand) CASH FLOWS FROM OPERATING ACTIVITIES
Cash generated from / (utilized in) operations 11 5,530,682 (1,972,781)
Finance cost paid (677,292) (430,128)Income tax (paid) / refund received (245,563) 16,923Long term security deposits received 11,475 6,970Net exchange difference on forward exchange contracts received 1,832 1,111Net decrease in retirement benefit obligation (1,881) (118)Net increase in long term loans (15,320) (3,228)Net increase in long term deposits (288) (21,675) Net cash generated from / (used in) operating activities 4,603,645 (2,402,926) CASH FLOWS FROM INVESTING ACTIVITIES
Capital expenditure on property, plant and equipment (1,360,806) (766,958)Proceeds from sale of property, plant and equipment 18,305 26,405Dividends received 377,627 352,061Interest received 13,773 1,145Investment made (9,500) (60,000)
Net cash used in investing activities (960,601) (447,347) CASH FLOWS FROM FINANCING ACTIVITIES Proceeds from long term financing 591,829 89,437Repayment of long term financing (978,738) (1,039,718)Exchange differences on translation of net investments in foreign subsidiaries (31,391) 9,311Short term borrowings - net 82,702 3,652,615Dividend paid (3,170) (178)
Net cash (used in) / from financing activities (338,768) 2,711,467 Net increase / (decrease) in cash and cash equivalents 3,304,276 (138,806) Cash and cash equivalents at the beginning of the period 1,220,422 831,688 Cash and cash equivalents at the end of the period 4,524,698 692,882
The annexed notes form an integral part of this consolidated condensed interim financial information.
For the quarter ended 30 September 2019 (Un-audited)
Consolidated Condensed Interim Statement of Cash Flows
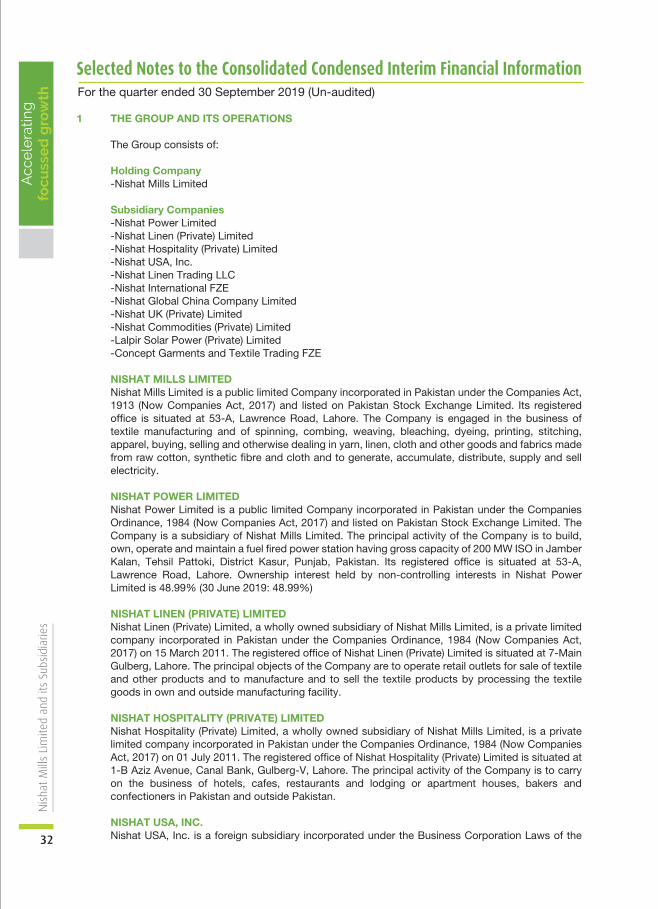
32
Nis
hat
Mill
s Li
mite
d an
d its
Sub
sidi
arie
s A
cce
lera
ting
focu
sse
d g
row
th For the quarter ended 30 September 2019 (Un-audited)
Selected Notes to the Consolidated Condensed Interim Financial Information
1 THE GROUP AND ITS OPERATIONS
The Group consists of:
Holding Company -Nishat Mills Limited Subsidiary Companies -Nishat Power Limited -Nishat Linen (Private) Limited -Nishat Hospitality (Private) Limited -Nishat USA, Inc. -Nishat Linen Trading LLC -Nishat International FZE -Nishat Global China Company Limited -Nishat UK (Private) Limited -Nishat Commodities (Private) Limited -Lalpir Solar Power (Private) Limited -Concept Garments and Textile Trading FZE
NISHAT MILLS LIMITED Nishat Mills Limited is a public limited Company incorporated in Pakistan under the Companies Act,
1913 (Now Companies Act, 2017) and listed on Pakistan Stock Exchange Limited. Its registered office is situated at 53-A, Lawrence Road, Lahore. The Company is engaged in the business of textile manufacturing and of spinning, combing, weaving, bleaching, dyeing, printing, stitching, apparel, buying, selling and otherwise dealing in yarn, linen, cloth and other goods and fabrics made from raw cotton, synthetic fibre and cloth and to generate, accumulate, distribute, supply and sell electricity.
NISHAT POWER LIMITED Nishat Power Limited is a public limited Company incorporated in Pakistan under the Companies
Ordinance, 1984 (Now Companies Act, 2017) and listed on Pakistan Stock Exchange Limited. The Company is a subsidiary of Nishat Mills Limited. The principal activity of the Company is to build, own, operate and maintain a fuel fired power station having gross capacity of 200 MW ISO in Jamber Kalan, Tehsil Pattoki, District Kasur, Punjab, Pakistan. Its registered office is situated at 53-A, Lawrence Road, Lahore. Ownership interest held by non-controlling interests in Nishat Power Limited is 48.99% (30 June 2019: 48.99%)
NISHAT LINEN (PRIVATE) LIMITED Nishat Linen (Private) Limited, a wholly owned subsidiary of Nishat Mills Limited, is a private limited
company incorporated in Pakistan under the Companies Ordinance, 1984 (Now Companies Act, 2017) on 15 March 2011. The registered office of Nishat Linen (Private) Limited is situated at 7-Main Gulberg, Lahore. The principal objects of the Company are to operate retail outlets for sale of textile and other products and to manufacture and to sell the textile products by processing the textile goods in own and outside manufacturing facility.
NISHAT HOSPITALITY (PRIVATE) LIMITED Nishat Hospitality (Private) Limited, a wholly owned subsidiary of Nishat Mills Limited, is a private
limited company incorporated in Pakistan under the Companies Ordinance, 1984 (Now Companies Act, 2017) on 01 July 2011. The registered office of Nishat Hospitality (Private) Limited is situated at 1-B Aziz Avenue, Canal Bank, Gulberg-V, Lahore. The principal activity of the Company is to carry on the business of hotels, cafes, restaurants and lodging or apartment houses, bakers and confectioners in Pakistan and outside Pakistan.
NISHAT USA, INC. Nishat USA, Inc. is a foreign subsidiary incorporated under the Business Corporation Laws of the

33
Acc
ele
ratin
gfo
cuss
ed
gro
wth
Cons
olid
ated
Con
dens
ed In
terim
Fin
anci
al In
form
atio
nfo
r th
e qu
arte
r en
ded
Sept
embe
r 30
, 201
9
State of New York. The registered office of Nishat USA, Inc. is situated at 676 Broadway, New York, NY 10012, U.S.A. The principal business of the Subsidiary Company is to provide marketing services to Nishat Mills Limited - Holding Company. Nishat Mills Limited acquired 100% shareholding of Nishat USA, Inc. on 01 October 2008.
NISHAT LINEN TRADING LLC Nishat Linen Trading LLC is a limited liability company formed in pursuance to statutory provisions
of the United Arab Emirates (UAE) Federal Law No. (8) of 1984 as amended and registered with the Department of Economic Development, Government of Dubai. Nishat Linen Trading LLC is a subsidiary of Nishat Mills Limited as Nishat Mills Limited, through the powers given to it under Article 11 of the Memorandum of Association, exercise full control on the management of Nishat Linen Trading LLC. Date of incorporation of the Company was 29 December 2010. The registered office of Nishat Linen Trading LLC is situated at P.O. Box 28189 Dubai, UAE. The principal business of Nishat Linen Trading LLC is to operate retail outlets in UAE for sale of textile and related products. The registered address of Nishat Linen Trading LLC in U.A.E. is located at Shop No. SC 128, Dubai Festival City, P.O. Box 28189 Dubai, United Arab Emirates.
NISHAT INTERNATIONAL FZE Nishat International FZE is incorporated as free zone establishment with limited liability in accordance
with the Law No. 9 of 1992 and Licensed by the Registrar of Jabel Ali Free Zone Authority. Nishat International FZE is a wholly owned subsidiary of Nishat Mills Limited. Date of incorporation of the Company was 07 February 2013. The registered office of Nishat International FZE is situated at P.O. Box 114622, Jabel Ali Free Zone, Dubai. The principal business of the Company is trading in textile and related products.
NISHAT GLOBAL CHINA COMPANY LIMITED Nishat Global China Company Limited is a Company incorporated in People's Republic of China on
25 November 2013. It is a wholly owned subsidiary of Nishat International FZE which is a wholly owned subsidiary of Nishat Mills Limited. The primary function of Nishat Global China Company Limited is to competitively source products for the retail outlets operated by Group companies in Pakistan and the UAE. The registered office of Nishat Global China Company Limited is situated at N801, No. 371-375 East Huanshi Road, Yuexiu District, Guangzhou City, China.
NISHAT UK (PRIVATE) LIMITED Nishat UK (Private) Limited is a private limited Company incorporated in England and Wales on 8
June 2015. It is a wholly owned subsidiary of Nishat International FZE which is a wholly owned subsidiary of Nishat Mills Limited. The primary function of Nishat UK (Private) Limited is sale of textile and related products in England and Wales through retail outlets and wholesale operations. The registered office of Nishat UK (Private) Limited is situated at 71 Queen Victoria Street, London EC4V 4BE. The management of Nishat International FZE, pursuant to resolution of board of directors of Nishat Mills Limited dated 26 February 2019, decided to liquidate Nishat UK (Private) Limited as Nishat UK (Private) Limited never commenced its primary operations, therefore, Nishat UK (Private) Limited’s financial statements have been prepared using the non-going concern basis of accounting. No adjustments to the assets or liabilities of Nishat UK (Private) Limited was considered necessary and Nishat UK (Private) Limited was dissolved on 23 July 2019.
NISHAT COMMODITIES (PRIVATE) LIMITED Nishat Commodities (Private) Limited is a private limited Company incorporated in Pakistan on 16 July 2015 under the Companies Ordinance, 1984 (Now Companies Act, 2017). It is a wholly
owned subsidiary of Nishat Mills Limited. Its registered office is situated at 53-A, Lawrence Road, Lahore. The principal objects of the Company are to carry on the business of trading of commodities including fuels, coals, building material in any form or shape manufactured, semi-manufactured, raw materials and their import and sale in Pakistan.
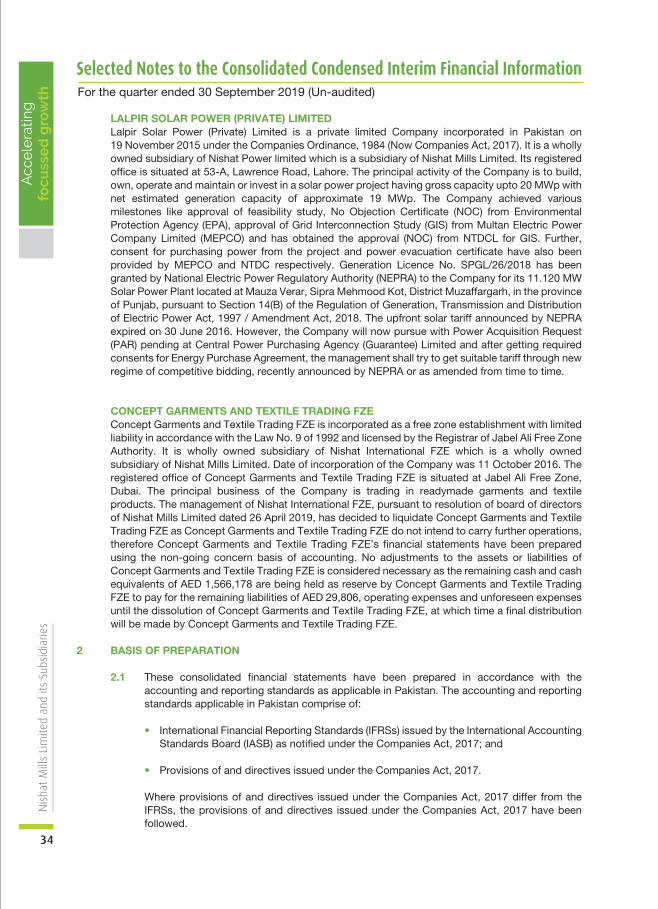
34
Nis
hat
Mill
s Li
mite
d an
d its
Sub
sidi
arie
s A
cce
lera
ting
focu
sse
d g
row
th For the quarter ended 30 September 2019 (Un-audited)
Selected Notes to the Consolidated Condensed Interim Financial Information
LALPIR SOLAR POWER (PRIVATE) LIMITED Lalpir Solar Power (Private) Limited is a private limited Company incorporated in Pakistan on 19 November 2015 under the Companies Ordinance, 1984 (Now Companies Act, 2017). It is a wholly
owned subsidiary of Nishat Power limited which is a subsidiary of Nishat Mills Limited. Its registered office is situated at 53-A, Lawrence Road, Lahore. The principal activity of the Company is to build, own, operate and maintain or invest in a solar power project having gross capacity upto 20 MWp with net estimated generation capacity of approximate 19 MWp. The Company achieved various milestones like approval of feasibility study, No Objection Certificate (NOC) from Environmental Protection Agency (EPA), approval of Grid Interconnection Study (GIS) from Multan Electric Power Company Limited (MEPCO) and has obtained the approval (NOC) from NTDCL for GIS. Further, consent for purchasing power from the project and power evacuation certificate have also been provided by MEPCO and NTDC respectively. Generation Licence No. SPGL/26/2018 has been granted by National Electric Power Regulatory Authority (NEPRA) to the Company for its 11.120 MW Solar Power Plant located at Mauza Verar, Sipra Mehmood Kot, District Muzaffargarh, in the province of Punjab, pursuant to Section 14(B) of the Regulation of Generation, Transmission and Distribution of Electric Power Act, 1997 / Amendment Act, 2018. The upfront solar tariff announced by NEPRA expired on 30 June 2016. However, the Company will now pursue with Power Acquisition Request (PAR) pending at Central Power Purchasing Agency (Guarantee) Limited and after getting required consents for Energy Purchase Agreement, the management shall try to get suitable tariff through new regime of competitive bidding, recently announced by NEPRA or as amended from time to time.
CONCEPT GARMENTS AND TEXTILE TRADING FZE Concept Garments and Textile Trading FZE is incorporated as a free zone establishment with limited
liability in accordance with the Law No. 9 of 1992 and licensed by the Registrar of Jabel Ali Free Zone Authority. It is wholly owned subsidiary of Nishat International FZE which is a wholly owned subsidiary of Nishat Mills Limited. Date of incorporation of the Company was 11 October 2016. The registered office of Concept Garments and Textile Trading FZE is situated at Jabel Ali Free Zone, Dubai. The principal business of the Company is trading in readymade garments and textile products. The management of Nishat International FZE, pursuant to resolution of board of directors of Nishat Mills Limited dated 26 April 2019, has decided to liquidate Concept Garments and Textile Trading FZE as Concept Garments and Textile Trading FZE do not intend to carry further operations, therefore Concept Garments and Textile Trading FZE’s financial statements have been prepared using the non-going concern basis of accounting. No adjustments to the assets or liabilities of Concept Garments and Textile Trading FZE is considered necessary as the remaining cash and cash equivalents of AED 1,566,178 are being held as reserve by Concept Garments and Textile Trading FZE to pay for the remaining liabilities of AED 29,806, operating expenses and unforeseen expenses until the dissolution of Concept Garments and Textile Trading FZE, at which time a final distribution will be made by Concept Garments and Textile Trading FZE.
2 BASIS OF PREPARATION 2.1 These consolidated financial statements have been prepared in accordance with the
accounting and reporting standards as applicable in Pakistan. The accounting and reporting standards applicable in Pakistan comprise of:
• International Financial Reporting Standards (IFRSs) issued by the International Accounting Standards Board (IASB) as notified under the Companies Act, 2017; and
• Provisions of and directives issued under the Companies Act, 2017.
Where provisions of and directives issued under the Companies Act, 2017 differ from the IFRSs, the provisions of and directives issued under the Companies Act, 2017 have been followed.

35
Acc
ele
ratin
gfo
cuss
ed
gro
wth
Cons
olid
ated
Con
dens
ed In
terim
Fin
anci
al In
form
atio
nfo
r th
e qu
arte
r en
ded
Sept
embe
r 30
, 201
9
2.2 These consolidated condensed interim financial statements are un-audited and do not include all the information and disclosures required in annual financial statements and should be read in conjunction with the annual audited financial statements of the Group for the year ended 30 June 2019.
3 ACCOUNTING POLICIES The accounting policies and methods of computations adopted for the preparation of this consolidated
condensed interim financial information are the same as applied in the preparation of the preceding audited annual published financial statements of the Group for the year ended 30 June 2019.
4 CONSOLIDATION a) Subsidiaries Subsidiaries are all entities over which the Group has control. The Group controls an entity
when the Group is exposed to, or has rights to, variable returns from its involvement with the entity and has the ability to affect those returns through its power to direct the activities of the entity. Subsidiaries are fully consolidated from the date on which control is transferred to the Group. They are deconsolidated from the date that control ceases.
The assets and liabilities of Subsidiary Companies have been consolidated on a line by line basis and carrying value of investments held by the Holding Company is eliminated against Holding Company's share in paid up capital of the Subsidiary Companies.
Intragroup balances and transactions have been eliminated.
Non-controlling interests are that part of net results of the operations and of net assets of Subsidiary Companies attributable to interest which are not owned by the Holding Company. Non-controlling interests are presented as separate item in the consolidated financial statements.
b) Associates Associates are all entities over which the Group has significant influence but not control or
joint control. Investments in associates are accounted for using the equity method of accounting, after initially being recognised at cost.
Under the equity method of accounting, the investments are initially recognised at cost and adjusted thereafter to recognise the Group’s share of the post-acquisition profits or losses of the investee in profit or loss, and the Group’s share of movements in other comprehensive income of the investee in other comprehensive income. Dividends received or receivable from associates are recognised as a reduction in the carrying amount of the investment.
When the Group’s share of losses in an equity-accounted investment equals or exceeds its interest in the entity, including any other unsecured long-term receivables, the Group does not recognise further losses, unless it has incurred obligations or made payments on behalf of the other entity.
Unrealised gains on transactions between the Group and its associates are eliminated to the
extent of the Group’s interest in these entities. Unrealised losses are also eliminated unless the transaction provides evidence of an impairment of the asset transferred. Accounting policies of equity accounted investees have been changed where necessary to ensure consistency with the policies adopted by the Group.

36
Nis
hat
Mill
s Li
mite
d an
d its
Sub
sidi
arie
s A
cce
lera
ting
focu
sse
d g
row
th For the quarter ended 30 September 2019 (Un-audited)
Selected Notes to the Consolidated Condensed Interim Financial Information
Investments in equity method accounted for associates are tested for impairment in accordance with the provision of IAS 36 `Impairment of Assets`.
5 CRITICAL ACCOUNTING ESTIMATES AND JUDGEMENTS The preparation of this consolidated condensed interim financial information in conformity with the
approved accounting standards requires the use of certain critical accounting estimates. It also requires the management to exercise its judgment in the process of applying accounting policies. Estimates and judgments are continually evaluated and are based on historical experience and other factors, including expectations of future events that are believed to be reasonable under the circumstances.
During preparation of this consolidated condensed interim financial information, the significant judgments made by the management in applying the accounting policies and the key sources of estimation and uncertainty were the same as those that applied in the preceding audited annual published consolidated financial statements of the Group for the year ended 30 June 2019.
Un-audited Audited 30 September 30 June 2019 2019 (Rupees in thousand) 6 LONG TERM FINANCING - SECURED
Opening balance 10,086,021 12,429,612 Add: Obtained during the period / year 591,894 1,870,498 Less: Repaid during the period / year (978,738) (4,214,625) (Less) / Add: Currency translation (65) 536 9,699,112 10,086,021
Less: Current portion shown under current liabilities (4,271,153) (4,170,795) 5,427,959 5,915,226
7 CONTINGENCIES AND COMMITMENTS
a) Contingencies
i) Nishat Mills Limited - Holding Company is contingently liable for Rupees 0.631 million (30 June 2019: Rupees 0.631 million) on account of central excise duty not
acknowledged as debt as the case is pending before Court since year 1993.
ii) Guarantees of Rupees 2,463.211 million (30 June 2019: Rupees 2,255.144 million) are given by the banks of Nishat Mills Limited - Holding Company to Sui Northern Gas Pipelines Limited against gas connections, Shell Pakistan Limited and Pakistan State Oil Limited against purchase of furnace oil, Director Excise and Taxation, Karachi against infrastructure cess, Chairman Punjab Revenue Authority, Lahore against infrastructure cess and Government of Punjab against fulfillment of sales orders and to the bank of Hyundai Nishat Motor (Private) Limited (associated company) to secure financial assistance to the associated company.

37
Acc
ele
ratin
gfo
cuss
ed
gro
wth
Cons
olid
ated
Con
dens
ed In
terim
Fin
anci
al In
form
atio
nfo
r th
e qu
arte
r en
ded
Sept
embe
r 30
, 201
9
iii) Post dated cheques of Rupees 7,303.076 million (30 June 2019: Rupees 6,695.544 million) are issued by Nishat Mills Limited - Holding Company to customs authorities in respect of duties on imported items availed on the basis of consumption and export plans. If documents of exports are not provided on due dates, cheques issued as security shall be encashable.
iv) On 24 July 2015, the Holding Company has challenged, before Honourable Lahore High Court, Lahore, the vires of clauses (h) and (i) to sub-section (1) of section 8 of the Sales Tax Act, 1990 whereby claim of input sales tax in respect of building materials, electrical and gas appliances, pipes, fittings, wires, cables and ordinary electrical fittings and sanitary fittings have been disallowed. The Honourable Lahore High Court has issued stay order in favour of the Holding Company and has allowed the Holding Company to claim input sales tax paid on such goods in its monthly sales tax returns. Consequently, the Holding Company has claimed input sales tax amounting to Rupees 108.345 million (30 June 2019: Rupees 106.312 million) paid on such goods in its respective monthly sales tax returns. The management, based on advice of the legal counsel, is confident of favorable outcome of its appeal.
v) Holding Company's share in contingencies of associates accounted for under equity method is Rupees 6,346 million (30 June 2019: Rupees 6,346 million).
vi) A sales tax demand of Rs 1,218.132 million was raised against Nishat Power Limited - Subsidiary Company through order dated December 11, 2013, passed by the Assistant Commissioner Inland Revenue ('ACIR') disallowing input sales tax for the tax periods of July 2010 through June 2012. The disallowance was primarily made on the grounds that since revenue derived by the Subsidiary Company on account of 'capacity revenue' was not chargeable to sales tax, input sales tax claimed by the Subsidiary Company was required to be apportioned with only the input sales tax attributable to other revenue stream i.e. 'energy revenue' admissible to the Subsidiary Company. Upon appeal before Commissioner Inland Revenue (Appeals) ['CIR(A)'], such issue was decided in Subsidiary Company's favour, however, certain other issues agitated by the Subsidiary Company were not adjudicated. Both the Subsidiary Company and department have filed appeals against the order of CIR(A) before Appellate Tribunal Inland Revenue ('ATIR'), which are pending adjudication.
Subsequently, the above explained issue was taken up by department for tax periods of July 2009 to June 2013 (involving input sales tax of Rs 1,722.811 million), however, the Subsidiary Company assailed the underlying proceedings before Lahore High Court ('LHC') directly and in this respect, through order dated October 31, 2016, LHC accepted the Subsidiary Company's stance and annulled the proceedings. The department has challenged the decision of LHC before Supreme Court of Pakistan and has also preferred an Intra Court Appeal against such order which are pending adjudication.
Similarly, for financial year 2014, Subsidiary Company's case was selected for 'audit' and such issue again formed the core of audit proceedings (involving input sales tax of Rs 596.091 million). Subsidiary Company challenged the jurisdiction in respect of audit proceedings before LHC and while LHC directed the management to join the subject proceedings, department was debarred from passing the adjudication order. During the year 2019, LHC has dismissed the petition in favour of the department, by allowing the department to complete the audit proceedings that are pending completion.
Since the issue has already been decided in Subsidiary Company's favour on merits by LHC and based on advice of the Subsidiary Company's legal counsel, no provision on these accounts have been made in this consolidated condensed interim financial information.

38
Nis
hat
Mill
s Li
mite
d an
d its
Sub
sidi
arie
s A
cce
lera
ting
focu
sse
d g
row
th For the quarter ended 30 September 2019 (Un-audited)
Selected Notes to the Consolidated Condensed Interim Financial Information
vii) During the year 2019, the Commissioner Inland Revenue has raised a demand of Rs 179.046 million against Nishat Power Limited - Subsidiary Company through his
order dated April 16, 2019, mainly on account of input tax claimed on inadmissible expenses in sales tax return for the tax periods of July 2014 to June 2017 and sales tax default on account of suppression of sales related to tax period June 2016. The Subsidiary Company filed application for grant of stay before the ATIR against recovery of the aforesaid demand that was duly granted. Further, the Subsidiary Company has filed appeals before CIR(A) and ATIR against the order which is pending adjudication. Management of the Subsidiary Company has strong grounds to believe that the case will be decided in Subsidiary Company's favour. Therefore, no provision has been made on this account in this consolidated condensed interim financial information.
viii) During the year 2019, National Electric Power Regulatory Authority (NEPRA) issued a show cause notice dated February 13, 2019, to Nishat Power Limited - Subsidiary Company along with other Independent Power Producers to provide rationale of abnormal profits earned since commercial operation date (COD) that eventually led to initiation of proceedings against the Subsidiary Company by NEPRA on March 18, 2019. The Subsidiary Company has challanged the authority of NEPRA to take suo moto action before the Islamabad High Court (IHC) wherein IHC has provided interim relief by suspending the suo moto proceedings. The case is currently pending adjudication before IHC. Management of the Subsidiary Company is confident that based on the facts and law, there will be no adverse implications for the Subsidiary Company.
ix) The banks have issued the following on behalf of Nishat Power Limited - Subsidiary Company:
a) Letter of guarantee of Rupees 11 million (30 June 2019: Rupees 11 million) in favour of Director Excise and Taxation, Karachi, under direction of Sindh High Court in respect of suit filed for levy of infrastructure cess.
b) Letters of guarantee of Rupees 100 million (30 June 2019: Rupees 100 million) in favour of fuel suppliers.
c) Letter of guarantee of Rupees 1.5 million (30 June 2019: Rupees 1.5 million) in favour of Punjab Revenue Authority, Lahore.
x) Guarantees of Rupees 89.350 million (30 June 2019: Rupees 89.350 million) are given by the banks of Nishat Linen (Private) Limited - Subsidiary Company to Director Excise and Taxation, Karachi against infrastructure cess, Chairman Punjab Revenue Authority, Lahore against infrastructure cess and Collectors of Customs against import consignments.
xi) Nishat Linen (Private) Limited - Subsidiary Company has challenged, before Honourable Lahore High Court, Lahore, the vires of clauses (h) and (i) to sub-section (1) of section 8 of the Sales Tax Act, 1990 whereby claim of input sales tax in respect of building materials, electrical and gas appliances, pipes, fittings, wires, cables and ordinary electrical fittings and sanitary fittings have been disallowed. The Honourable Lahore High Court has issued stay order in favour of the Subsidiary Company and has allowed the Subsidiary Company to claim input sales tax paid on such goods in its monthly sales tax returns. Consequently, the Subsidiary Company has claimed input sales tax amounting to Rupees 4.241 million (30 June 2019: Rupees 4.241 million) paid on such goods in its respective monthly sales tax returns.

39
Acc
ele
ratin
gfo
cuss
ed
gro
wth
Cons
olid
ated
Con
dens
ed In
terim
Fin
anci
al In
form
atio
nfo
r th
e qu
arte
r en
ded
Sept
embe
r 30
, 201
9
xii) Through orders, the deemed assessments for tax years 2016, 2015, 2014, 2013 and 2012 were amended by Additional Commissioner Inland Revenue (ACIR) and Commissioner Inland Revenue (CIR) under section 122(5A) of the Income Tax Ordinance, 2001. Nishat Linen (Private) Limited - Subsidiary Company’s appeals before Commissioner Inland Revenue [CIR(A)] were successful except for the legal issue of treating the Subsidiary Company as a manufacturer with relation to toll-manufactured goods. Appeals on this point have been filed before the Appellate Tribunal Inland Revenue which are pending adjudication. The Subsidiary Company is confident of favorable outcome of its appeals based on advice of the tax advisor and has carry forward minimum tax paid in tax years 2016, 2015 and 2014.
xiii) Through notice dated 25 January 2018, issued by the Deputy Commissioner Inland Revenue (DCIR) under sections 161/205 of the Ordinance, Nishat Linen (Private) Limited - Subsidiary Company had been called upon to demonstrate its compliance with various withholding provisions of the Income Tax Ordinance, 2001. The subject proceedings have been finalized through order dated 03 August 2018, whereby, aggregate default amounting to Rupees 2.551 million has been adjudged against the Subsidiary Company. The Subsidiary Company’s appeal before Commissioner Inland Revenue (Appeals) [CIR(A)] was successful except for the legal issue amounting to Rupees 1.419 million. Appeal on this point has been filed before the Appellate Tribunal Inland Revenue which is pending adjudication. The Subsidiary Company is confident of favorable outcome of its appeal based on advice of the tax advisor.
xiv) Bank guarantee of Rupees 1.9 million (30 June 2019: Rupees 1.9 million) is given by the bank of Nishat Commodities (Private) Limited - Subsidiary Company in favour of Director, Excise and Taxation to cover the disputed amount of infrastructure cess.
b) Contingent asset
i) On August 07, 2017, Nishat Power Limited - Subsidiary Company instituted arbitration proceedings against NTDC/Government of Pakistan by filing a Request for Arbitration ('RFA') with the London Court of International Arbitration ('LCIA') (the 'Arbitration Proceedings') for disallowing an amount of Rs 1,084.748 million relating to delayed payment charges on outstanding delayed payment invoices. The Subsidiary Company believes it is entitled to claim delayed payment charges on outstanding delayed payments receivables from NTDC as per terms of the PPA. However, NTDC has denied this liability and objected on the maintainability of the Arbitration Proceedings, terming it against the PPA and refused to pay delayed payment charges on outstanding delayed payments receivables.
The LCIA appointed a sole Arbitrator and a hearing was also held in March 2018. During the year 2019, the Arbitrator has issued Partial Final Award in which he has rejected the NTDC’s objection to the maintainability of the Arbitration Proceedings.
While the Arbitration Proceedings on merits of the case are underway, the Subsidiary Company has submitted the Partial Final Award before LHC and obtained interim relief from honourable LHC, whereby, LHC has restrained NTDC from taking steps for delaying the arbitration proceedings and challenging the award in Civil Courts of Pakistan. As the above amount is disputed, therefore, on prudence basis, the Subsidiary Company has not recognised the income and corresponding asset for such amount in this consolidated condensed interim financial information.

40
Nis
hat
Mill
s Li
mite
d an
d its
Sub
sidi
arie
s A
cce
lera
ting
focu
sse
d g
row
th For the quarter ended 30 September 2019 (Un-audited)
Selected Notes to the Consolidated Condensed Interim Financial Information
c) Commitments
i) Contracts for capital expenditure of the Group are approximately of Rupees 1,925.638 million (30 June 2019: Rupees 1,005.666 million).
ii) Letters of credit other than for capital expenditure of the Group are of Rupees 960.121 million (30 June 2019: Rupees 1,040.985 million).
iii) Outstanding foreign currency forward contracts of Rupees 1,547.162 million (30 June 2019: Rupees 463.868 million)
iv) The amount of future payments under operating lease and the period in which these payments will become due from Nishat Power Limited - Subsidiary Company are as follows:
Un-audited Audited 30 September 30 June 2019 2019 Note (Rupees in thousand)
Not later than one year 3,894 3,894
8 PROPERTY, PLANT AND EQUIPMENT
Operating fixed assets - owned 8.1 40,222,783 40,835,226
Capital work in progress 8.2 1,792,312 687,957
Major spare parts and standby equipments 109,688 174,201
42,124,783 41,697,384
8.1 Operating fixed assets - Owned
Opening book value 40,835,226 38,812,949
Add: Cost of additions during the period / year 8.1.1 328,007 5,886,104
41,163,233 44,699,053
Less: Book value of deletions during the period / year 8.1.2 (13,228) (226,463)
Less: Book value of assets written off during the year - (14,910)
41,150,005 44,457,680
Less: Depreciation charged for the period / year (921,576) (3,655,960)
(Less) / Add: Currency translation (5,646) 33,506
40,222,783 40,835,226
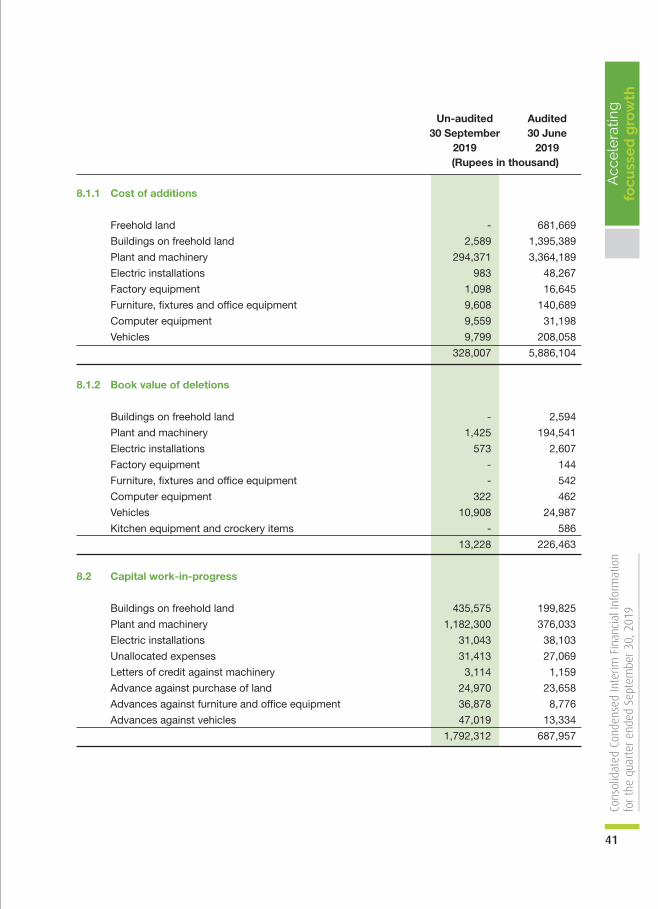
Un-audited Audited 30 September 30 June 2019 2019 (Rupees in thousand)
8.1.1 Cost of additions
Freehold land - 681,669
Buildings on freehold land 2,589 1,395,389
Plant and machinery 294,371 3,364,189
Electric installations 983 48,267
Factory equipment 1,098 16,645
Furniture, fixtures and office equipment 9,608 140,689
Computer equipment 9,559 31,198
Vehicles 9,799 208,058
328,007 5,886,104
8.1.2 Book value of deletions
Buildings on freehold land - 2,594
Plant and machinery 1,425 194,541
Electric installations 573 2,607
Factory equipment - 144
Furniture, fixtures and office equipment - 542
Computer equipment 322 462
Vehicles 10,908 24,987
Kitchen equipment and crockery items - 586
13,228 226,463
8.2 Capital work-in-progress
Buildings on freehold land 435,575 199,825
Plant and machinery 1,182,300 376,033
Electric installations 31,043 38,103
Unallocated expenses 31,413 27,069
Letters of credit against machinery 3,114 1,159
Advance against purchase of land 24,970 23,658
Advances against furniture and office equipment 36,878 8,776
Advances against vehicles 47,019 13,334
1,792,312 687,957
41
Acc
ele
ratin
gfo
cuss
ed
gro
wth
Cons
olid
ated
Con
dens
ed In
terim
Fin
anci
al In
form
atio
nfo
r th
e qu
arte
r en
ded
Sept
embe
r 30
, 201
9
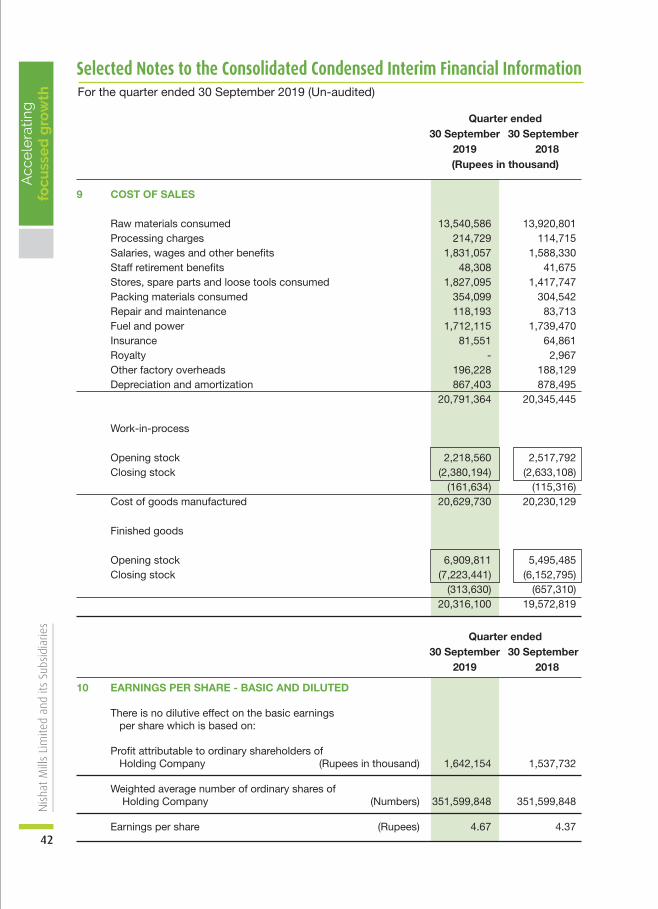
42
Nis
hat
Mill
s Li
mite
d an
d its
Sub
sidi
arie
s A
cce
lera
ting
focu
sse
d g
row
th For the quarter ended 30 September 2019 (Un-audited)
Selected Notes to the Consolidated Condensed Interim Financial Information
Quarter ended 30 September 30 September 2019 2018 (Rupees in thousand)
9 COST OF SALES
Raw materials consumed 13,540,586 13,920,801 Processing charges 214,729 114,715 Salaries, wages and other benefits 1,831,057 1,588,330 Staff retirement benefits 48,308 41,675 Stores, spare parts and loose tools consumed 1,827,095 1,417,747 Packing materials consumed 354,099 304,542 Repair and maintenance 118,193 83,713 Fuel and power 1,712,115 1,739,470 Insurance 81,551 64,861 Royalty - 2,967 Other factory overheads 196,228 188,129 Depreciation and amortization 867,403 878,495 20,791,364 20,345,445
Work-in-process
Opening stock 2,218,560 2,517,792 Closing stock (2,380,194) (2,633,108) (161,634) (115,316) Cost of goods manufactured 20,629,730 20,230,129
Finished goods
Opening stock 6,909,811 5,495,485 Closing stock (7,223,441) (6,152,795) (313,630) (657,310) 20,316,100 19,572,819
Quarter ended 30 September 30 September 2019 2018
10 EARNINGS PER SHARE - BASIC AND DILUTED
There is no dilutive effect on the basic earnings per share which is based on:
Profit attributable to ordinary shareholders of
Holding Company (Rupees in thousand) 1,642,154 1,537,732
Weighted average number of ordinary shares of Holding Company (Numbers) 351,599,848 351,599,848
Earnings per share (Rupees) 4.67 4.37
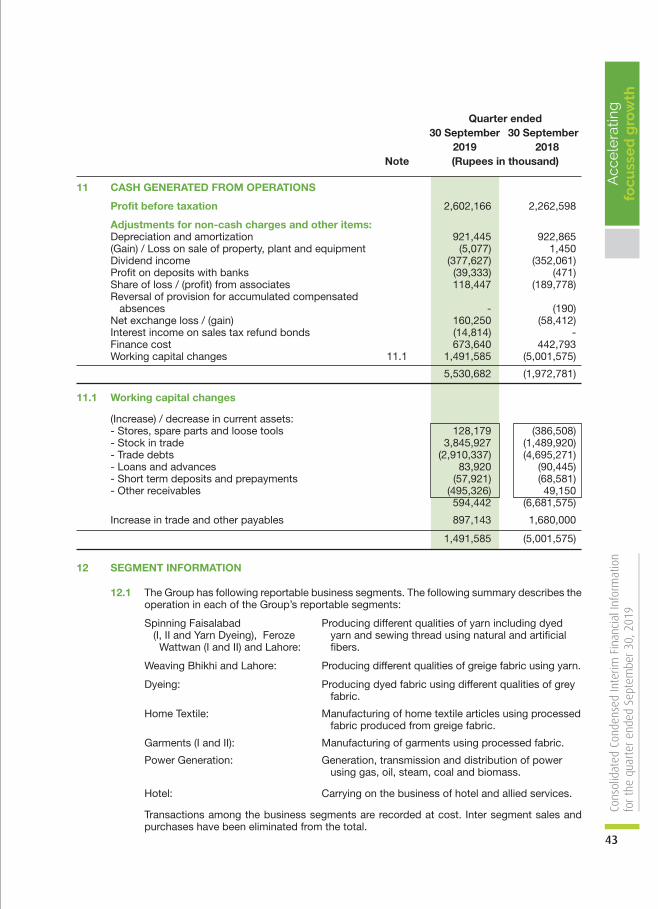
Quarter ended 30 September 30 September 2019 2018 Note (Rupees in thousand)
11 CASH GENERATED FROM OPERATIONS
Profit before taxation 2,602,166 2,262,598
Adjustments for non-cash charges and other items: Depreciation and amortization 921,445 922,865 (Gain) / Loss on sale of property, plant and equipment (5,077) 1,450 Dividend income (377,627) (352,061) Profit on deposits with banks (39,333) (471) Share of loss / (profit) from associates 118,447 (189,778) Reversal of provision for accumulated compensated absences - (190) Net exchange loss / (gain) 160,250 (58,412) Interest income on sales tax refund bonds (14,814) - Finance cost 673,640 442,793 Working capital changes 11.1 1,491,585 (5,001,575)
5,530,682 (1,972,781)
11.1 Working capital changes
(Increase) / decrease in current assets: - Stores, spare parts and loose tools 128,179 (386,508) - Stock in trade 3,845,927 (1,489,920) - Trade debts (2,910,337) (4,695,271) - Loans and advances 83,920 (90,445) - Short term deposits and prepayments (57,921) (68,581) - Other receivables (495,326) 49,150 594,442 (6,681,575)
Increase in trade and other payables 897,143 1,680,000
1,491,585 (5,001,575)
12 SEGMENT INFORMATION
12.1 The Group has following reportable business segments. The following summary describes the operation in each of the Group’s reportable segments:
Spinning Faisalabad Producing different qualities of yarn including dyed (I, II and Yarn Dyeing), Feroze yarn and sewing thread using natural and artificial Wattwan (I and II) and Lahore: fibers.
Weaving Bhikhi and Lahore: Producing different qualities of greige fabric using yarn.
Dyeing: Producing dyed fabric using different qualities of grey fabric.
Home Textile: Manufacturing of home textile articles using processed fabric produced from greige fabric.
Garments (I and II): Manufacturing of garments using processed fabric.
Power Generation: Generation, transmission and distribution of power using gas, oil, steam, coal and biomass.
Hotel: Carrying on the business of hotel and allied services.
Transactions among the business segments are recorded at cost. Inter segment sales and purchases have been eliminated from the total.
43
Acc
ele
ratin
gfo
cuss
ed
gro
wth
Cons
olid
ated
Con
dens
ed In
terim
Fin
anci
al In
form
atio
nfo
r th
e qu
arte
r en
ded
Sept
embe
r 30
, 201
9
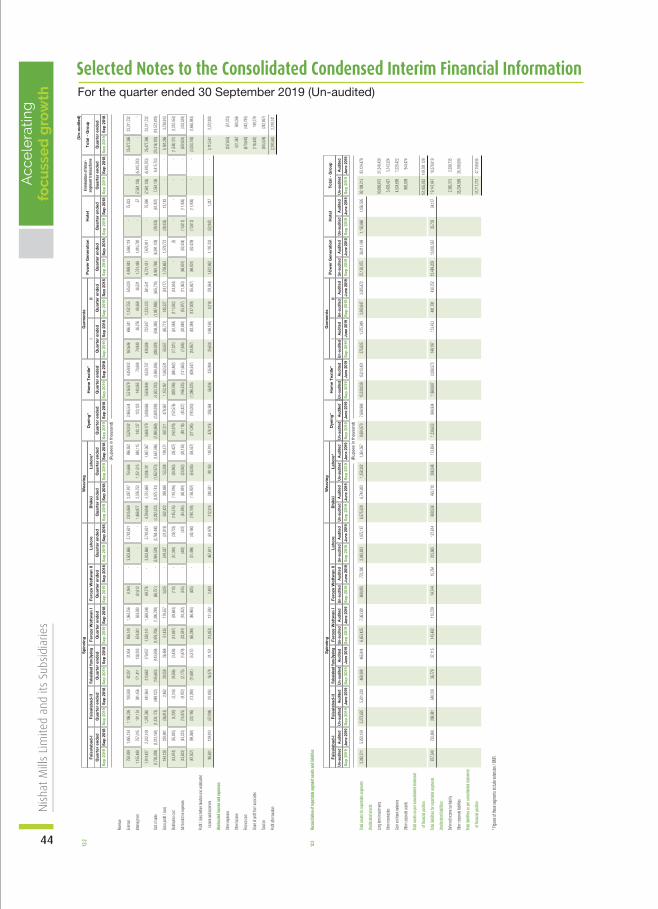
44
Nis
hat
Mill
s Li
mite
d an
d its
Sub
sidi
arie
s A
cce
lera
ting
focu
sse
d g
row
th For the quarter ended 30 September 2019 (Un-audited)
Selected Notes to the Consolidated Condensed Interim Financial Information
(Rup
ees
in t
hous
and
)
Wea
ving
S
pin
ning
Gar
men
ts
Elim
inat
ion
of In
ter-
segm
ent t
rans
actio
nsFa
isal
abad
-II
Fais
alab
ad-I
Qua
rter
end
edQ
uart
er e
nded
Qua
rter
end
edQ
uart
er e
nded
Qua
rter
end
edQ
uart
er e
nded
Qua
rter
end
edQ
uart
er e
nded
Qua
rter
end
edQ
uart
er e
nded
Qua
rter
end
edQ
uart
er e
nded
Qua
rter
end
edQ
uart
er e
nded
Qua
rter
end
edQ
uart
er e
nded
Fero
ze W
attw
an I
Fer
oze
Wat
twan
IIB
hikk
iLa
hore
*D
yein
g*
Ho
me
Tex
tile
*II
IP
ow
er G
ener
atio
nH
ote
lT
ota
l - G
roup
Sep
201
9S
ep 2
018
Sep
201
9S
ep 2
018
Sep
201
9S
ep 2
018
Sep
201
9S
ep 2
018
Sep
201
9S
ep 2
018
Sep
201
9S
ep 2
018
Sep
201
9S
ep 2
018
Sep
201
9S
ep 2
018
Sep
201
9S
ep 2
019
Sep
201
8S
ep 2
019
Sep
201
8S
ep 2
018
Sep
201
9S
ep 2
018
Sep
201
9S
ep 2
018
Sep
201
9S
ep 2
019
Sep
201
8S
ep 2
019
Sep
201
8S
ep 2
018
Laho
reFa
isal
abad
Yam
Dye
ing
Re
venu
e
Ex
terna
l 75
8,939
1,4
85,13
4 1,1
06,22
6 10
0,508
42
,251
31,85
4 85
6,140
1,0
64,75
6 8,1
64
- 3,5
03,86
6 2,7
42,62
1 2,9
15,86
9 2,2
97,91
7 75
4,666
98
6,952
3,5
28,04
2 2,9
65,54
4 5,
516,8
79
4,459
,933
363,6
46
696,3
41
1,15
2,755
54
5,020
4,9
69,94
3 5,8
60,11
9 -
75,03
3 -
- 25
,477,3
86
23,31
1,732
Int
erseg
ment
1,155
,488
757,0
15
191,1
34
391,4
56
171,4
11
138,2
03
674,0
01
504,5
90
61,61
2 -
- -
1,868
,977
2,076
,752
1,251
,515
880,1
15
140,1
37
123,1
22
140,0
65
70,80
4 74
,940
26,27
6 80
,368
36,52
1 1,7
51,48
8 1,8
10,79
2 -
57
(7,56
1,136
) (6,
815,7
03)
- -
1,914
,427
2,242
,149
1,297
,360
491,9
64
213,6
62
170,0
57
1,530
,141
1,569
,346
69,77
6 -
3,503
,866
2,742
,621
4,784
,846
4,374
,669
2,006
,181
1,867
,067
3,668
,179
3,088
,666
5,656
,944
4,530
,737
438,5
86
722,6
17
1,233
,123
581,5
41
6,72
1,431
7,6
70,91
1 -
75,09
0 (7,
561,1
36)
(6,81
5,703
) 25
,477,3
86
23,31
1,732
Co
st of
sales
(1,
730,2
99)
(2,01
3,168
) (1,
334,1
73)
(489,1
02)
(185,6
03)
(143,5
89)
(1,47
8,706
) (1,
390,7
89)
(66,75
1) -
(2,98
4,529
) (2,
764,4
40)
(4,28
2,423
) (3,
975,1
81)
(1,85
2,973
) (1,
667,5
96)
(2,98
0,968
) (2,
609,2
99)
(4,50
3,783
) (3,
468,2
06)
(388,0
29)
(808,3
88)
(1,08
7,896
) (60
5,718
) (4,
961,7
68)
(6,39
1,139
) (39
,335)
(61,90
7) 7,5
61,13
6 6,8
15,70
3 (20
,316,1
00)
(19,57
2,819
)
Gr
oss p
rofit /
(loss
) 18
4,128
22
8,981
(36
,813)
2,862
28
,059
26,46
8 51
,435
178,5
57
3,025
-
519,3
37
(21,81
9) 50
2,423
39
9,488
15
3,208
19
9,471
68
7,211
47
9,367
1,1
53,16
1 1,0
62,53
1 50
,557
(85,77
1) 14
5,227
(24
,177)
1,759
,663
1,279
,772
(39,33
5) 13
,183
- -
5,161
,286
3,738
,913
Dis
tributi
on co
st (43
,874)
(55,83
5) (4,
220)
(3,31
6) (9,
506)
(3,43
8) (41
,697)
(28,66
3) (11
0) -
(51,09
4) (39
,723)
(145,5
15)
(110,0
16)
(30,98
3) (38
,407)
(162,9
79)
(152,5
76)
(929,7
90)
(694,8
82)
(17,32
1) (61
,549)
(111,0
32)
(44,04
4) -
(5)
- -
- -
(1,54
8,121
) (1,
232,4
54)
Ad
minis
trativ
e exp
ense
s (43
,633)
(43,2
33)
(15,97
5) (9
,972)
(2,17
5) (1,
879)
(23,5
91)
(18,30
2) (51
5) -
(402)
(437)
(44,5
94)
(40,89
1) (23
,062)
(20,15
0) (48
,116)
(40,42
7) (16
6,535
) (13
1,665
) (7,
636)
(20,84
0) (25
,977)
(11,36
3) (86
,801)
(82,43
4) (13
,612)
(11,93
6) -
- (50
2,624
) (43
3,529
)
(87,50
7) (99
,068)
(20,19
5) (13
,288)
(11,68
1) (5,
317)
(65,28
8) (46
,965)
(625)
- (51
,496)
(40,16
0) (19
0,109
) (15
0,907
) (54
,045)
(58,55
7) (21
1,095
) (19
3,003
) (1,
096,3
25)
(826,5
47)
(24,95
7) (82
,389)
(137,0
09)
(55,40
7) (86
,801)
(82,43
9) (13
,612)
(11,93
6) -
- (2,
050,7
45)
(1,66
5,983
)
Pr
ofit /
(loss
) befo
re tax
ation
and u
nallo
cated
i
ncom
e and
expe
nses
96
,621
129,9
13
(57,00
8) (10
,426)
16,37
8 21
,151
(13,85
3) 13
1,592
2,4
00
- 46
7,841
(61
,979)
312,3
14
248,5
81
99,16
3 14
0,914
47
6,116
28
6,364
56
,836
235,9
84
25,60
0 (16
8,160
) 8,2
18
(79,58
4) 1,6
72,86
2 1,1
97,33
3 (52
,947)
1,247
-
- 3,1
10,54
1 2,0
72,93
0
Un
alloc
ated i
ncom
e and
expe
nses
:
Ot
her e
xpen
ses
(237,6
55)
(57,37
3)
Ot
her in
come
52
1,367
50
0,056
Fin
ance
cost
(673,6
40)
(442,7
93)
Sh
are of
profi
t from
asso
ciates
(11
8,447
) 18
9,778
Ta
xatio
n
(30
4,526
) (24
2,857
)
Pr
ofit a
fter t
axati
on
2,297
,640
2,019
,741
12.2
(Un-
aud
ited
)
(Rup
ees
in t
hous
and
)
Wea
ving
S
pin
ning
Gar
men
ts
Fais
alab
ad-I
IFa
isal
abad
-IFe
roze
Wat
twan
I F
ero
ze W
attw
an II
Bhi
kki
Laho
re*
Dye
ing
*H
om
e T
exti
le*
II I
Po
wer
Gen
erat
ion
Ho
tel
To
tal -
Gro
up
Sep
201
9Ju
ne 2
019
Sep
201
9Ju
ne 2
019
Sep
201
9Ju
ne 2
019
Sep
201
9Ju
ne 2
019
Sep
201
9Ju
ne 2
019
Sep
201
9Ju
ne 2
019
Sep
201
9Ju
ne 2
019
Sep
201
9S
ep 2
019
June
201
9S
ep 2
019
June
201
9Ju
ne 2
019
Sep
201
9Ju
ne 2
019
Sep
201
9Ju
ne 2
019
Sep
201
9S
ep 2
019
June
201
9S
ep 2
019
June
201
9Ju
ne 2
019
Un-
audi
ted
Aud
ited
Un-
audi
ted
Aud
ited
Un-
audi
ted
Aud
ited
Un-
audi
ted
Aud
ited
Un-
audi
ted
Aud
ited
Un-
audi
ted
Aud
ited
Un-
audi
ted
Aud
ited
Un-
audi
ted
Un-
audi
ted
Aud
ited
Un-
audi
ted
Aud
ited
Aud
ited
Un-
audi
ted
Aud
ited
Un-
audi
ted
Aud
ited
Un-
audi
ted
Un-
audi
ted
Aud
ited
Un-
audi
ted
Aud
ited
Aud
ited
Laho
reFa
isal
abad
Yam
Dye
ing
To
tal as
sets
for re
porta
ble se
gmen
ts 3,
392,5
11
5,250
,134
5,27
3,625
5,2
21,23
0 46
9,389
46
5,944
6,6
53,42
5 7,3
63,93
1 80
8,093
77
2,390
2,0
83,82
3 1,8
75,18
7 6,2
75,32
9 6,7
44,92
2 1,2
58,30
2 1,3
64,56
7 8,8
84,87
0 7,6
88,98
8 15
,239,0
39
15,01
3,451
27
5,025
1,2
75,94
9 3,2
83,84
7 3,0
25,87
2 37
,150,0
75
36,01
1,409
1,1
50,86
0 1,0
50,50
5 92
,198,2
13
93,12
4,479
Un
alloc
ated a
ssets
:
Lo
ng te
rm in
vestm
ents
50,66
9,675
51
,348,4
30
Ot
her r
eceiv
ables
3,4
29,42
7 3,1
43,32
4
Ca
sh an
d ban
k bala
nces
4,5
24,69
8 1,2
20,42
2
Ot
her c
orpora
te as
sets
983,0
39
944,4
74
To
tal as
sets
as pe
r con
solid
ated s
tatem
ent
o
f fina
ncial
posit
ion
151,8
05,05
2 14
9,781
,129
To
tal lia
bilitie
s for
repor
table
segm
ents
877,3
40
730,8
88
298,9
81
348,7
20
36,77
9 37
,115
145,4
82
110,7
29
14,74
4 10
,764
313,0
65
127,6
14
889,5
38
493,7
10
206,5
48
173,8
54
1,239
,633
884,9
34
1,969
,807
2,008
,573
149,1
97
173,4
53
481,7
91
430,7
52
12,48
9,209
13
,005,5
67
35,73
3 34
,137
19,14
7,847
18
,570,8
10
Un
alloc
ated l
iabilit
ies:
De
ferred
inco
me ta
x liab
ility
2,365
,315
2,399
,735
Ot
her c
orpora
te lia
bilitie
s
26
,204,5
69
26,18
8,090
To
tal lia
bilitie
s as p
er co
nsoli
dated
state
ment
o
f fina
ncial
posit
ion
47,71
7,731
47
,158,6
35
* F
igures
of th
ese s
egme
nts in
clude
exten
sion /
BMR.
12.3
Reco
ncilia
tion o
f rep
ortab
le se
gmen
t ass
ets an
d liab
ilities
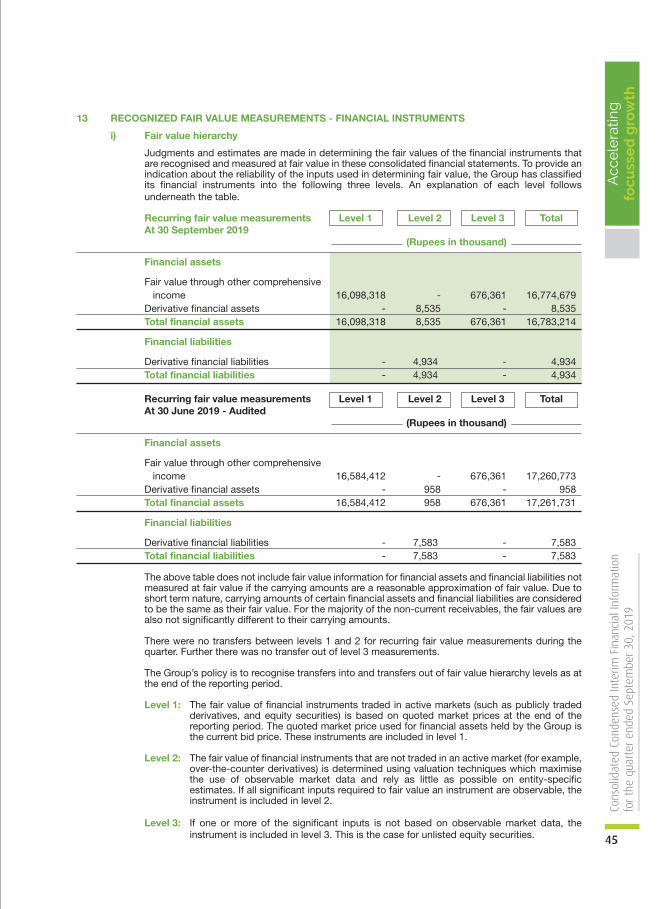
45
Acc
ele
ratin
gfo
cuss
ed
gro
wth
Cons
olid
ated
Con
dens
ed In
terim
Fin
anci
al In
form
atio
nfo
r th
e qu
arte
r en
ded
Sept
embe
r 30
, 201
9
13 RECOGNIZED FAIR VALUE MEASUREMENTS - FINANCIAL INSTRUMENTS
i) Fair value hierarchy
Judgments and estimates are made in determining the fair values of the financial instruments that are recognised and measured at fair value in these consolidated financial statements. To provide an indication about the reliability of the inputs used in determining fair value, the Group has classified its financial instruments into the following three levels. An explanation of each level follows underneath the table.
Recurring fair value measurements Level 1 Level 2 Level 3 Total At 30 September 2019 (Rupees in thousand)
Financial assets
Fair value through other comprehensive income 16,098,318 - 676,361 16,774,679 Derivative financial assets - 8,535 - 8,535 Total financial assets 16,098,318 8,535 676,361 16,783,214
Financial liabilities
Derivative financial liabilities - 4,934 - 4,934 Total financial liabilities - 4,934 - 4,934
Recurring fair value measurements Level 1 Level 2 Level 3 Total At 30 June 2019 - Audited (Rupees in thousand)
Financial assets
Fair value through other comprehensive income 16,584,412 - 676,361 17,260,773 Derivative financial assets - 958 - 958 Total financial assets 16,584,412 958 676,361 17,261,731
Financial liabilities
Derivative financial liabilities - 7,583 - 7,583 Total financial liabilities - 7,583 - 7,583
The above table does not include fair value information for financial assets and financial liabilities not measured at fair value if the carrying amounts are a reasonable approximation of fair value. Due to short term nature, carrying amounts of certain financial assets and financial liabilities are considered to be the same as their fair value. For the majority of the non-current receivables, the fair values are also not significantly different to their carrying amounts.
There were no transfers between levels 1 and 2 for recurring fair value measurements during the quarter. Further there was no transfer out of level 3 measurements.
The Group’s policy is to recognise transfers into and transfers out of fair value hierarchy levels as at the end of the reporting period.
Level 1: The fair value of financial instruments traded in active markets (such as publicly traded derivatives, and equity securities) is based on quoted market prices at the end of the reporting period. The quoted market price used for financial assets held by the Group is the current bid price. These instruments are included in level 1.
Level 2: The fair value of financial instruments that are not traded in an active market (for example, over-the-counter derivatives) is determined using valuation techniques which maximise the use of observable market data and rely as little as possible on entity-specific estimates. If all significant inputs required to fair value an instrument are observable, the instrument is included in level 2.
Level 3: If one or more of the significant inputs is not based on observable market data, the instrument is included in level 3. This is the case for unlisted equity securities.
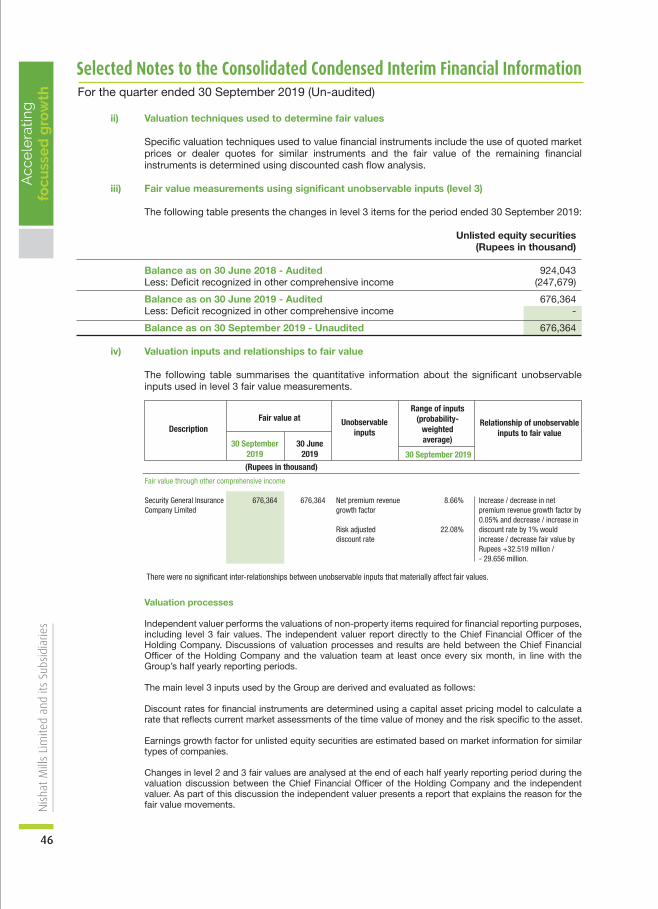
46
Nis
hat
Mill
s Li
mite
d an
d its
Sub
sidi
arie
s A
cce
lera
ting
focu
sse
d g
row
th For the quarter ended 30 September 2019 (Un-audited)
Selected Notes to the Consolidated Condensed Interim Financial Information
Valuation processes
Independent valuer performs the valuations of non-property items required for financial reporting purposes, including level 3 fair values. The independent valuer report directly to the Chief Financial Officer of the Holding Company. Discussions of valuation processes and results are held between the Chief Financial Officer of the Holding Company and the valuation team at least once every six month, in line with the Group’s half yearly reporting periods.
The main level 3 inputs used by the Group are derived and evaluated as follows:
Discount rates for financial instruments are determined using a capital asset pricing model to calculate a rate that reflects current market assessments of the time value of money and the risk specific to the asset.
Earnings growth factor for unlisted equity securities are estimated based on market information for similar types of companies.
Changes in level 2 and 3 fair values are analysed at the end of each half yearly reporting period during the valuation discussion between the Chief Financial Officer of the Holding Company and the independent valuer. As part of this discussion the independent valuer presents a report that explains the reason for the fair value movements.
ii) Valuation techniques used to determine fair values
Specific valuation techniques used to value financial instruments include the use of quoted market prices or dealer quotes for similar instruments and the fair value of the remaining financial instruments is determined using discounted cash flow analysis.
iii) Fair value measurements using significant unobservable inputs (level 3)
The following table presents the changes in level 3 items for the period ended 30 September 2019:
Unlisted equity securities (Rupees in thousand)
Balance as on 30 June 2018 - Audited 924,043 Less: Deficit recognized in other comprehensive income (247,679)
Balance as on 30 June 2019 - Audited 676,364 Less: Deficit recognized in other comprehensive income -
Balance as on 30 September 2019 - Unaudited 676,364
iv) Valuation inputs and relationships to fair value
The following table summarises the quantitative information about the significant unobservable inputs used in level 3 fair value measurements.
There were no significant inter-relationships between unobservable inputs that materially affect fair values.
DescriptionFair value at Unobservable
inputs
Range of inputs(probability-
weightedaverage)
Relationship of unobservableinputs to fair value
30 September2019
(Rupees in thousand)30 September 2019
30 June2019
Fair value through other comprehensive income Security General Insurance 676,364 676,364 Net premium revenue 8.66%Company Limited growth factor
Risk adjusted 22.08% discount rate
Increase / decrease in net premium revenue growth factor by 0.05% and decrease / increase in discount rate by 1% would increase / decrease fair value by Rupees +32.519 million / - 29.656 million.

47
Acc
ele
ratin
gfo
cuss
ed
gro
wth
Cons
olid
ated
Con
dens
ed In
terim
Fin
anci
al In
form
atio
nfo
r th
e qu
arte
r en
ded
Sept
embe
r 30
, 201
9
14 TRANSACTIONS WITH RELATED PARTIES
The related parties comprise associated undertakings, other related companies, key management personnel and provident fund trust. The Group In the normal course of business carries out transactions with various related parties. Detail of transactions with related parties is as follows:
i) Transactions Quarter ended 30 September 30 September 2019 2018 (Rupees in thousand) Associated companies
Investment made 9,500 60,000 Purchase of goods and services 47,438 42,111 Sharing of expenses 414 - Sale of goods and services 22,140 1,248 Sale of operating fixed assets 819 - Rental income 10,081 314 Rent paid 19,987 18,453 Insurance premium paid 112,342 97,087 Insurance claims received 12,550 6,146 Interest income 162 405 Finance cost 8,563 6,521
Other related parties
Purchase of goods and services 636,733 487,841 Sale of goods and services 149,274 6,445 Finance cost 170 107 Group's contribution to provident fund trust 75,784 68,771 Remuneration paid to Chief Executive Officer, Director and Executives of the Holding Company 245,894 177,448
ii) Period end balances As at 30 September 2019 Associated Other related Total companies parties (Rupees in thousand)
Trade and other payables 73,202 80,956 154,158 Accrued markup 3,375 - 3,375 Short term borrowings 172,385 - 172,385 Long term loans - 159,394 159,394 Trade debts 10,451 34,902 45,353 Loans and advances 285 58,862 59,147 Accrued interest 526 - 526 Cash and bank balances 98,696 21,516 120,212
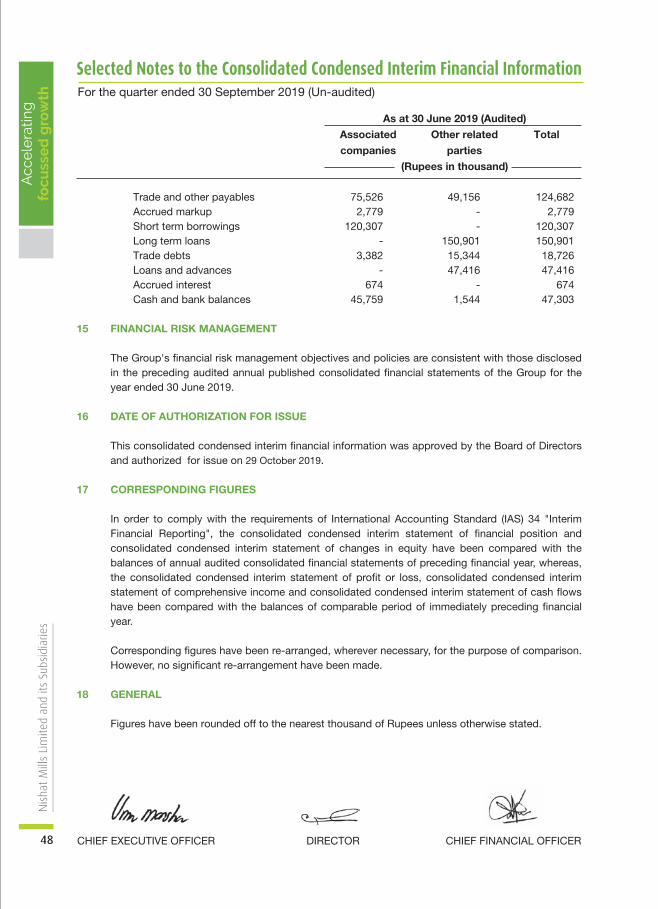
48
Nis
hat
Mill
s Li
mite
d an
d its
Sub
sidi
arie
s A
cce
lera
ting
focu
sse
d g
row
th For the quarter ended 30 September 2019 (Un-audited)
Selected Notes to the Consolidated Condensed Interim Financial Information
CHIEF FINANCIAL OFFICERDIRECTORCHIEF EXECUTIVE OFFICER
As at 30 June 2019 (Audited)
Associated Other related Total
companies parties
(Rupees in thousand)
Trade and other payables 75,526 49,156 124,682 Accrued markup 2,779 - 2,779 Short term borrowings 120,307 - 120,307 Long term loans - 150,901 150,901 Trade debts 3,382 15,344 18,726 Loans and advances - 47,416 47,416 Accrued interest 674 - 674 Cash and bank balances 45,759 1,544 47,303
15 FINANCIAL RISK MANAGEMENT
The Group's financial risk management objectives and policies are consistent with those disclosed in the preceding audited annual published consolidated financial statements of the Group for the year ended 30 June 2019.
16 DATE OF AUTHORIZATION FOR ISSUE
This consolidated condensed interim financial information was approved by the Board of Directors and authorized for issue on 29 October 2019.
17 CORRESPONDING FIGURES
In order to comply with the requirements of International Accounting Standard (IAS) 34 "Interim Financial Reporting", the consolidated condensed interim statement of financial position and consolidated condensed interim statement of changes in equity have been compared with the balances of annual audited consolidated financial statements of preceding financial year, whereas, the consolidated condensed interim statement of profit or loss, consolidated condensed interim statement of comprehensive income and consolidated condensed interim statement of cash flows have been compared with the balances of comparable period of immediately preceding financial year.
Corresponding figures have been re-arranged, wherever necessary, for the purpose of comparison. However, no significant re-arrangement have been made.
18 GENERAL
Figures have been rounded off to the nearest thousand of Rupees unless otherwise stated.

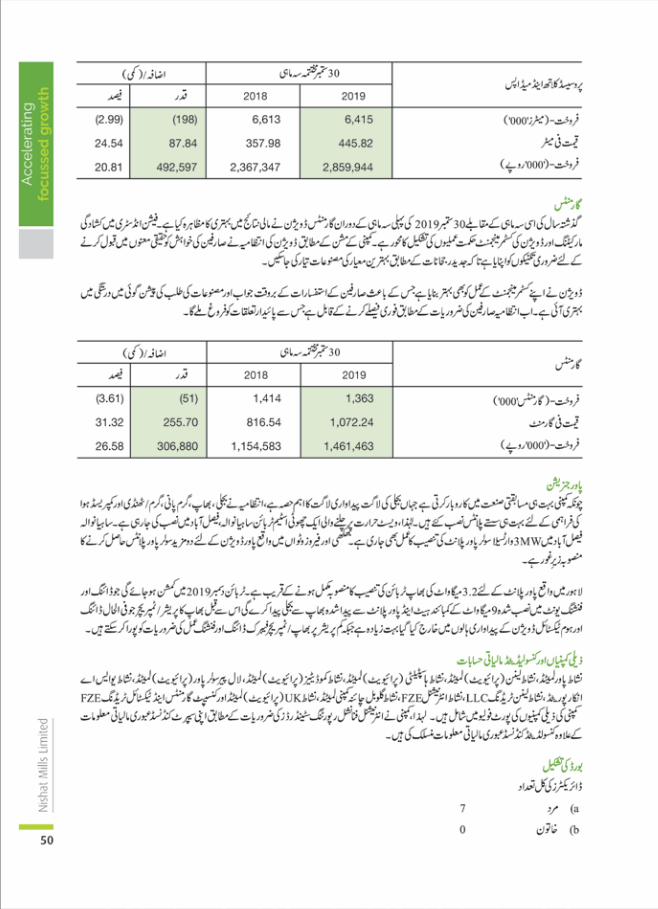
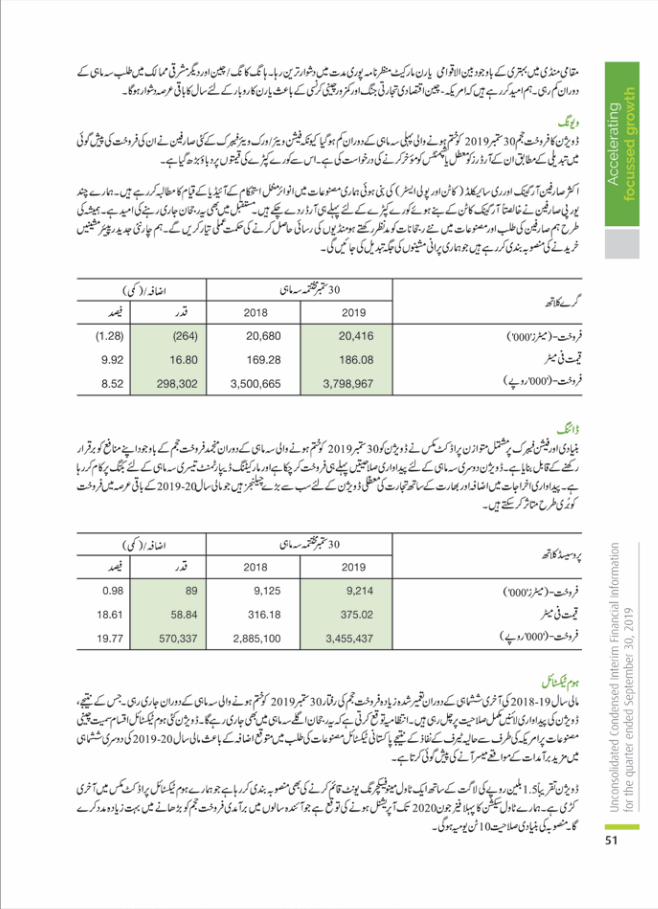


REGISTERED OFFICE:Nishat House, 53-A, Lawrence Road, LahoreTel: 042-36360154, 042-111 113 [email protected]
VE
RS
AT
ILE
Ph
: +92
42
3712
192
0