nine fallacies of floodssciencepolicy.colorado.edu/admin/publication_files/1999.15.pdf · nine...
TRANSCRIPT

NINE FALLACIES OF FLOODS ∗
ROGER A. PIELKE, JR.Environmental and Societal Impacts Group, National Center for Atmospheric Research,†
P.O. Box 3000, Boulder, Colorado, U.S.A.E-mail: [email protected]
Abstract. A number of important misconceptions or fallacies stand in the way of a better under-standing of the nation’s flood problem. The fallacies are not universal, with many flood experts,decision makers, and sectors of the public escaping their seductive logic. But enough people do fallprey to these fallacies of floods so as to create obstacles to improved utilization of the lessons ofexperience. This paper uses three of these lessons to organize presentation of the nine fallacies:
• We know the wrong thingsabout the nature of the problem.Fallacy 1: Flood frequencies are well understood.Fallacy 2: Damaging flooding in recent years is unprecedented because of ‘global warming’.Fallacy 3: Levees ‘prevent’ damages.Fallacy 4: Flood forecasts are universally available.
• We don’t know enoughabout why and with what intensity we should act.Fallacy 5: Societal vulnerability to floods is well understood.Fallacy 6: Data on flood casualties is a proxy for flood risk.Fallacy 7: Data on flood damages is a proxy for flood risk.
• We know enoughabout what might be done.Fallacy 8: Knowledge leads to action.Fallacy 9: The U.S. flood problem can be addressed without Federal leadership and support.
The purpose of raising the fallacies in this paper is to contribute to a systematic definition of thenation’s flood problem.
1. Introduction
Flood policy in the United States is characterized by numerous assessments of so-ciety’s response to particular events as well as periodic summaries of the commonlessons distilled from those assessments.‡ A central theme running through this
∗ The title and structure of this paper were inspired by M. H. Glantz (1977). ‘Nine Fallacies ofNatural Disaster: The Case of the Sahel’,Clim. Change1, 69–84.
† The National Center for Atmospheric Research is sponsored by the National Science Founda-tion.
‡ Examples of assessments published in the aftermath of the 1993 floods in the U.S. Midwestinclude Changnon (1996), the Corps of Engineers Floodplain Management Assessment (FPMA,1995), the Galloway Report (IFMRC, 1994), and the Department of Commerce’s Natural DisasterSurvey Report (DOC, 1994). More general reviews include Committee on Public Works (1959),Unified National Program reports (TFFCP, 1996; USWRC, 1976, 1979; ITFFM, 1986; FIFMTF,1994), and the comprehensive Floodplain Management Assessment (FIFMTF, 1992).
Climatic Change42: 413–438, 1999.© 1999Kluwer Academic Publishers. Printed in the Netherlands.
414 ROGER A. PIELKE, JR.
literature is that society has learned through experience what actions will lead toa reduction in vulnerability to floods, but that these ‘thoughtful past recommen-dations of how to attain flood mitigation had never been adequately implemented’(Changnon, 1996, p. 312). The central thesis of this paper is that while experiencehas provided sufficient knowledge of steps necessary to begin to reduce society’svulnerability to floods, society lacks an accurate understanding of the nature of theflood problem itself.∗ Because decision makers lack knowledge of the policy prob-lem, potential policy solutions developed by flood experts are often implementedunsystematically (if at all), overlooked in favor of false solutions, or without theleadership needed to ensure their success.
A number of important misconceptions or fallacies stand in the way of abetter understanding of the nation’s flood problem. The fallacies are not uni-versal, with many flood experts, decision makers, and sectors of the public es-caping their seductive logic. But enough people do fall prey to these fallaciesof floods so as to create obstacles to improved utilization of the lessons of ex-perience. This paper uses three of these lessons to organize presentation of the ninefallacies:
1. We know the wrong thingsabout the nature of the problem(Fallacies 1, 2, 3and 4).
2. We don’t know enoughabout why and with what intensity we should act(Fallacies 5, 6 and 7).
3. We know enoughabout what might be done(Fallacies 8 and 9).
Of course, there are other fallacies of floods (and disasters more generally) whichwould expand the list presented here (e.g., Glantz, 1976).
The purpose of raising the fallacies in this paper is to contribute to a systematicdefinition of the nation’s flood problem. It makes sense that effective actions inresponse to floods ought to be based upon an accurate and realistic definition of theproblem. While this paper focuses on river floods (i.e., large-scale and flash) in theUnited States, the fallacies have potential broader relevance to the extent to whichthey influence policy in other flood-prone regions of the world. Simply correctingmistaken beliefs will not in itself ‘solve’ the nation’s flood problem, but it canremove obstacles to the implementation of previously unseen or underappreciatedpolicy alternatives. It is certain that the challenge of improving society’s responseto floods will face obstacles so long as these fallacies persist.
∗ One influential branch of the policy literature views policy solutions distinct from policy prob-lems, with the two meeting only under certain circumstances. See particularly the ‘garbage canmodel’ of Cohen et al. (1972) and the policy and problem ‘streams’ of Kingdon (1984). A review ofthe problem definition literature is found in Pielke (1997a).
NINE FALLACIES OF FLOODS 415
2. Flood Fallacies
2.1. FLOOD FREQUENCIES ARE WELL UNDERSTOOD
Flood experts use the terms ‘stage’ and ‘discharge’ to refer to the size of a flood(Belt, 1975). A flood stage is the depth of a river at some point and is a functionof the amount of water, but also the capacity of a river channel and floodplainand other factors. Hence, upstream and downstream levees and different uses offloodplain land can alter a flood’s stage. A flood discharge refers to the volume ofwater passing a particular point over a period of time. For example, in 1993 St.Louis experienced ‘the highest stage we’ve ever had, but not the biggest volume’.
We’ve had bigger flows, but the stage was different because the water couldflow from bluff to bluff. Now we have communities in the floodplain. Everytime you do something on a floodplain, you change the flood relationship.Every time a farmer plants a field or a town puts in a levee, it affects upstreamflooding. That’s why you can’t really compare flooding at different times inhistory (G. R. Dryhouse quoted in Corrigan, 1993).
According to the World Meteorological Organization’s International Glossaryof Hydrology, ‘flood frequency’ is defined as ‘the number of times a flood above agiven discharge or stage is likely to occur over a given number of years’ (WMO,1993). In the United States, flood frequencies are central to the operations of theNational Flood Insurance Program, which uses the term ‘base flood’ to note ‘that inany given year there is a one percent chance that a flood of that magnitude could beequalled or exceeded’ (FIFMTF, 1992, p. 9-7). The ‘base flood’ is more commonlyknown as ‘the 100-year flood’ and is ‘probably the most misunderstood floodplainmanagement term’ (FIFMTF, 1992, p. 9-7).
A determination of the probability of inundation for various elevations withina community is based on analysis of peak flows at a point on a particular river orstream. However, ‘there is no procedure or set of procedures that can be adoptedwhich, when rigidly applied to the available data, will accurately define the floodpotential of any given watershed’ (USWRC, 1981, p. 1). For many reasons, in-cluding limitations on the data record and potential change in climate, ‘risk anduncertainty are inherent in any flood frequency analysis’ (USWRC, 1981, p. 2).Nevertheless, quantification of risk is a fundamental element of flood insurance aswell as many aspects of flood-related decision making.
In order to quantify flood risk, in the early 1970s the National Flood Insur-ance Program adopted the 100-year-flood standard (FIFMTF, 1992, p. 8-2). Thestandard was adopted in order to standardize comparison of areas of risk betweencommunities. Since that time the concept of theN-year flood has become a com-mon fixture in policy, media, and public discussions of floods. Unfortunately, ‘thegeneral public almost universally does not properly understand the meaning ofthe term’ (FIFMTF, 1992, p. 9-7). Misconceptions about the meaning of the term

416 ROGER A. PIELKE, JR.
creates obstacles to proper understanding of the flood problem and, consequently,the development of effective responses.
The 100-year standard refers to a flood that has a one percent chance of beingexceeded in any given year. It doesnot refer to a flood that occurs ‘once every 100years’. In fact, for a home in a 100-year flood zone there is a greater than 26%chance that it will see at least one 100-year flood over a period of 30 years (and,similarly, more than a 74% chance over 100 years). The general formula for thecumulative probability of at least one flood of annual probabilityP is (1−P)N ≥ CwhereN equals the number of years from now, andC is the cumulative probabilityover periodN (P is assumed to be constant and events are independent from yearto year). By choosing values forP andC one can compute the number of yearsthat the cumulative probability (C) covers.
The concept and terminology of the ‘100-year floodplain’ was formally adoptedby the federal government as a standard for all public agencies in 1977 under Exec-utive Order 11988. In 1982 FEMA reviewed the policy and found that it was beingused in the agencies and, lacking a better alternative, concluded that the policyshould be retained (FIFMTF, 1992, p. 8-3). However, despite the FEMA review,use of the concept of the 100-year flood is encumbered by a number of logical andpractical difficulties (cf. Lord, 1994).
First, there is general confusion among users of the term about what it means.Some use the term to refer to a flood that occurs every 100 years, as did the Mid-western mayor who stated that ‘after the 1965 flood, they told us this wouldn’thappen again for another 100 years’ (IFMRC, 1994, p. 59). Public confusion iswidespread: A farmer suffering through Midwest flooding for the second time inthree years complained that ‘Two years ago was supposed to be a 100-year flood,and they’re saying this is a 75-year flood, What kind of sense does that make?You’d think they’d get it right’ (Peterson, 1995).
Second, the ‘100-year flood’ is only one of many possible probabilistic mea-sures of an area’s flood risk. For instance, in the part of the floodplain that isdemarcated as the ‘100-year floodplain’ it is only the outer edge of that area thatis estimated to have an annual probability of flooding of 0.01, yet confusion ex-ists (Myers, 1994). Areas closer to the river have higher probabilities of flooding,e.g., there are areas of a floodplain with a 2% annual chance of flooding (50-yearfloodplain), 10% annual chance (10-year floodplain), 50% annual chance (2-yearfloodplain) etc., and similarly, areas farther from the river have lower probabilitiesof flooding. The ‘100-year floodplain’ is arbitrarily chosen for regulatory reasonsand does not reflect anything fundamentally intrinsic to the floodplain.
Third, the ‘100-year floodplain’ is determined based on past flood records and isthus subject to considerable errors with respect to the probabilities of future floods.According to Burkham (1978) errors in determination of the ‘100-year flood’ maybe off by as much as 50% of flood depth. Depending on the slope of the floodplain, this could translate into a significant error in terms of distance from the riverchannel. A FEMA press release notes that ‘in some cases there is a difference of

NINE FALLACIES OF FLOODS 417
only inches between the 10- and the 100-year flood levels’ (FEMA, 1996). Further,researchers are beginning to realize an ‘upper limit’ on what can be known aboutflood frequencies due to the lack of available trend data (Bobée and Rasmussen,1995).
Fourth, the 100-year floodplain is not a natural feature, but rather is definedby scientists and engineers based on the historical record. Consequently, whilethe ‘100-year floodplain’ is dynamic and subject to redefinition based on newflood events that add to the historical record, the regulatory definition is muchmore difficult to change. For instance, following two years of major flooding onthe Salt River in Phoenix, Arizona, the previously estimated 100-year flood wasreduced to a 50-year flood (FIFMTF, 1992, p. 9-7). What happens to the structuresin redefined areas? Any changes in climate patterns, especially precipitation, willalso modify the expected probabilities of inundation. For example, some areas ofthe upper Midwest have documented a trend of increasing precipitation this cen-tury (Changnon and Kunkel, 1995; Bhowmik et al., 1994). Furthermore, humanchanges to the river environment, e.g., levees and land use changes, can also alterthe hydraulics of floods. Finally, the extensive use of the term ‘100-year flood’focuses attention on that aspect of flooding, sometimes to the neglect of the areabeyond the 100-year flood plain (Myers, 1994).
What can be done? Given the pervasive use of the concept of the ‘100-yearflood’ in flood insurance and regulatory decision-making it seems that adoption ofan alternative concept is unlikely. Nevertheless, there are a number of steps thatcan be taken by those who use the concept when dealing with policy makers andthe public. First, we need to be more precise with language. The FIFMTF (1992)recommends the phrase ‘one percent annual chance flood’ as a preferred alterna-tive to ‘100-year flood’, ‘base flood’, or ‘one percent flood’. Another alternativeis ‘national base flood standard’ which removes reference to probability (Thomas,1996, personal communication). Second, when communicating with the public andthe media, flood experts could take care to convert annual exceedances into annualprobabilities. And third, policy documents could rely less on the ‘100-year flood’to illustrate examples and propose policies, and at the very least explicitly discussfloods of different magnitudes.
2.2. DAMAGING FLOODING IN RECENT YEARS IS UNPRECEDENTED BECAUSE
OF ‘ GLOBAL WARMING ’
The phrase ‘global warming’ refers to the possibility that the earth’s climate maychange because human activities are altering the composition of the atmosphere.Scientists first raised this possibility more than a century ago, and in recent decadespolicy makers have begun to express concern about the possibility of climatechange. Possible changes that have been discussed in the context of global warm-ing include increasing or decreasing tropical cyclone activity, increased spread ofinfectious diseases, change in mean global temperature and regional and local tem-

418 ROGER A. PIELKE, JR.
perature variability, and a more active hydrological cycle, including the possibilityof more floods (see IPCC, 1996a,b, on the science and impacts associated withclimate change).
One result of scientific and political concern about the possibility of globalwarming is a frequent association by the media and the public of almost everyextreme weather event with global warming. For instance, the cover ofNewsweekfrom 22 January 1996 carried the following title: ‘THE HOT ZONE: Blizzards,Floods, and Hurricanes: Blame Global Warming’. This article, and others likeit, carry the implication that global warming is responsible for recent climaticextremes. In fact, it is essentially impossible to attribute any particular weatherevent to global warming. At the regional level scientists have documented variousincreasing and decreasing trends in the frequency or magnitude of extreme events,but are not able to associate those changes to global warming. Globally it is diffi-cult for scientists to discern recent trends in extreme events. As the IPCC (1996a,p. 173) notes:
Overall, there is no evidence that extreme weather events, or climate vari-ability, has increased, in a global sense, through the 20th century, althoughdata and analyses are poor and not comprehensive. On regional scales there isclear evidence of changes in some extremes and climate variability indicators.Some of these changes have been toward greater variability; some have beentoward lower variability.
Does the lack of a linkage between extreme weather events and global warmingmean that the public and policymakers need not concern themselves with climatechange? On the contrary; there are many reasons for the public and policymakers tohave anincreasingconcern about the impacts of extreme events. And this concernis largely independent of the global warming hypothesis, for the following reasons.
Current knowledge is limited as to the potential impacts of a changing climateon the number and intensity of hydrologic flood events (IPCC, 1996a; OTA, 1993;Dracup and Kendall, 1990). It is certain that for particular regions and communitiesthe climate will change in some way or another. There will likely be some regionsthat experience more flood events and others that experience less. It will almostcertainly be more straightforward to document these changes than to attribute themto specific causes such as human-caused global warming. For example, severalregions in the Upper Mississippi River Basin have seen trends (at 80% and 90%confidence for different regions) of increasing precipitation since 1965 (Bhowmiket al., 1994). Meanwhile, the Colorado river basin has seen a decrease in streamflowover the latter two thirds of the twentieth century (Frederick and Kneese, 1990).Such ‘winners and losers’ have been documented in regions and nations aroundthe world (e.g., Rao, 1995; Karl et al., 1995). In the United States (about 6% ofthe Earth’s land surface), recent decades have seen an increasing trend (at variouslevels of confidence) in precipitation in certain regions and also streamflow (Kunkelet al., 1997; Karl et al., 1996; Lins and Michaels, 1994). But it is not clear that moreprecipitation (or changed frequencies of precipitation events) in the United States

NINE FALLACIES OF FLOODS 419
are the cause of the documented increase in losses in recent decades; other factors(such as human occupancy of flood plains, land use change, channel engineering,nonstructural mitigation policies, etc.) must also be taken into account to arrive ata final determination of the relation of climate and impacts.
There are at least three implications of the uncertain climate future for societalresponses to floods. First, there is a continued need to document how climate haschanged in the past. So much attention is focused on developing better predictionsof the future that we often neglect the wealth of data about the past. Second, thereis a need to systematically evaluate successes and failures in responding to pastclimatic extremes. While we do not know exactly what the future will bring, we doin many cases know that our responses to past events has been less than optimal.Thus, at a minimum we should take care to ensure that we are at least prepared todeal with the variability and extremes that have already occurred and been docu-mented (Glantz, 1988). Finally, the uncertainty in the climate future underscoresthe need to better understand the societal dimensions of the climate threat and totake those adaptive measures that make sense based on our imperfect knowledge ofthe certain past and uncertain future. A first step in that effort is to better understandsocietal exposure to variability and extreme events.
No matter what the climate future holds, flood impacts on society may continueto get worse. A study conducted by the U.S. Congressional Office of TechnologyAssessment concluded that ‘despite recent efforts, vulnerability to flood damagesis likely to continue to grow’ (OTA, 1993, p. 253). The study based this conclusionon the following factors, which have very little to do with climate:
1. Populations in and adjacent to flood-prone areas, especially in coastal areas,continue to increase, putting more property and greater numbers of people atrisk,
2. flood-moderating wetlands continue to be destroyed,
3. little has been done to control or contain increased runoff from upstreamdevelopment (e.g., runoff caused by paving over land),
4. many undeveloped areas have not yet been mapped (mapping has been con-centrated in already-developed areas), and people are moving into such areaswithout adequate information concerning risk,
5. many dams and levees are beginning to deteriorate with age, leaving propertyowners with a false sense of security about how well they are protected,
6. some policies (e.g., provision of subsidies for building roads and bridges) tendto encourage development in flood plains.
At a minimum, when people blame climate change for damaging flood events, theydirect attention away from the fact that decision makers already have the means attheir disposal to significantly address the documented U.S. flood problem.

420 ROGER A. PIELKE, JR.
2.3. LEVEES ‘ PREVENT’ DAMAGES
The United States, one flood expert has commented, has had an ‘undying love af-fair’ with levees (Tobin, 1995). Another flood expert has called the late-eighteenth/early nineteenth century policy of sole reliance on levees to control floods ‘perni-cious beyond belief’ (Wright, 1996, p. 247). A levee is a structure built to keep wa-ter from inundating an area that would otherwise be flooded.∗ The United States ishome to approximately 25,000 miles of levees – or enough to encircle the world atthe equator (FIFMTF, 1992). The U.S. Army Corps of Engineers has been respon-sible for building more than 10,500 miles of levees. Levees built by other federaland state agencies, as well as by individuals, make up the remainder. The funding,design, construction, and repair of levees by the federal government is overseenby five federal agencies: USACE, Agriculture, National Resources ConservationService,† Federal Emergency Management Agency (FEMA), Economic Develop-ment Administration, and HUD (Housing and Urban Development). The multipleagencies and their differing requirements and responsibilities ‘confuses’ the issueof levee systems (Tobin, 1995, p. 364). Local agencies and privately-owned leveesfurther complicate the issue.
According to Tobin (1995, p. 365) levees can serve to actuallyincreasethepotential for flood losses. He calls this the ‘levee effect’ and defines it as follows:
Once [a levee] has been constructed, however, the structure may generate afalse sense of security to the extent that floodplain inhabitants perceive that allflooding has been eliminated. With the incentive to take precautions removed,few residents will be prepared for remedial action in the event of future floods.Even more costly, however, this false sense of security can also lead to greaterdevelopment in the so-called safe areas, thus adding to the property placedat risk . . . when the levee does fail, the increase in development can actuallyraise losses even higher than if no levee system had been constructed in thefirst place.
The ‘levee effect’ can increase society’s vulnerability to floods in two ways: bycreating a sense of complacency, which can act to reduce preparedness and bycreating incentives to build structures in areas subject to flooding. Tobin observesthat a comprehensive study of the ‘levee effect’ has yet to be undertaken.
The fallacy that ‘levees prevent damages’ is a subset of a much broader issueabout the role of structural measures in flood mitigation. Structural approaches toflood control are characterized by attempts to keep high water from inundating pub-lic and private property and thus causing damage. Since the 1940s, beginning withthe pioneering work of Gilbert White, floodplain management has increasinglyincluded ‘nonstructural’ approaches that emphasize adjusting human behavior (see
∗ Both levees and floodwalls are defined as a form of ‘dike’ – a general term for ‘longitudinalstructures that serve to retain water’ (FIFMTF, 1992, p. 12-27). This paper uses the more commonterm ‘levee’ to refer to all types of levees, floodwalls, and dikes.
† Formerly the Soil Conservation Service.
NINE FALLACIES OF FLOODS 421
FIFMTF (1992), Chapters 12 and 15 for discussion). Issues of structural and com-plementing nonstructural approaches to flood mitigation go well beyond the scopeof this paper. It is worth noting, however, that in spite of widespread agreementamong flood experts that structural measures alone cannot adequately address thenation’s flood problem, the proper role of structural measures has yet to be ade-quately defined. Lack of understanding of the ‘levee effect’ is a prime exampleof how an incomplete understanding of the role of structural and nonstructuralmeasures in flood mitigation limits what can be authoritatively said with respect tothe flood problem.
2.4. FLOOD FORECASTS ARE UNIVERSALLY AVAILABLE
The Unified National Program for Floodplain Management report asserted that‘regional warnings for floods and hurricanes are becoming universally available’(FIFMTF, 1994, p. 16). This stands in stark contrast to Changnon (1996, p. 309)who stated with respect to the 1993 Midwest flood that ‘the flood condition pro-nouncements of the National Weather Service (NWS) and those of the Corps ofEngineers for the St. Louis area were often inaccurate and sometimes controver-sial’ (cf. Gruntfest and Pollack, 1994). As a consequence, ‘these forecasts andpronouncements likely worked to the detriment of the strategies used to fight theflood, shipping alternatives, and other flood-impacted endeavors’ (p. 27). Further-more, even the Weather Service’s self evaluation found ‘substantial opportunitiesfor improvements’ (DOC, 1994, p. 2-1). More recently, residents of the Red Riverof the North basin have criticized the flood forecasts issued during the spring 1997floods (see, for example, Glassheim, 1997). In short, in spite of the progress madeover the last century in weather and flood forecasting, there remains considerablepotential for improvements in flood forecasts. Further, there also remains a vastpotential for improved use of those forecasts by decision makers (Pielke, 1999;Changnon, 1996; cf. Gruntfest and Pollack, 1994).
One potential area for improvement of flood forecasting lies with continuingimprovements in ‘Quantitative Precipitation Forecasting’ (QPF), which is definedas ‘the forecasting of the amount of rain or water equivalent of frozen precipitationthat will fall over a particular area over a given period’ (Schwein, 1996, p. 1). Suchimprovements have been described as ‘steady, albeit slow’ (Krzysztofowicz, 1995,p. 1143). The goal of using QPF in the flood forecasting process is to provide alonger lead time for flash flood and river stage forecasts. Of course, the success ofthis tool depends on large part upon the ability to forecast reliably the amount ofprecipitation that will fall over a particular watershed. To date, QPF has not beenfully implemented. Results have been mixed in experimental uses of QPF withboth improvements and degradation in forecasts. One review cites several studiesof the use of QPF that show benefits to decisions associated with flood warning,reservoir control, and commercial navigation (Krzysztofowicz, 1995). Accordingto Schwein (1996) a key to beneficial use of QPF in flood forecasting will be to train

422 ROGER A. PIELKE, JR.
forecasters on how to interpret and use appropriately the additional information thatis generated.
Other areas where flood forecasts might be improved include the use of ad-vanced radar technologies to identify in real-time (as well as to forecast) areasof heavy rainfall, improvements to rainfall-runoff models, improvements in datacollection with river basins using satellites, radiosondes, and ground stations(Krszysztofowicz, 1995). Of course, to be most valuable to society any scientific ortechnological advances in flood forecasting must be accompanied by commensu-rate ability to use those advances in the decision processes of warning and response.Growing evidence suggests that decision makers’ ability touseflood forecasts hasnot kept pace with technical advances (Pielke, 1999).
2.5. SOCIETAL VULNERABILITY TO FLOODS IS WELL UNDERSTOOD
One of the goals recommended in 1994 by the Federal Interagency FloodplainManagement Task Force recommended in its Unified National Program is to ‘re-duce by half the risks to life and property and the risks to the natural resources ofthe Nation’s floodplains’ (FIFMTF, 1994, p. 31). The Task Force recognized that inorder to reduce risks by half, the dimensions of that risk must first be understood.Therefore, the Task Force recommended the compilation of an inventory of flood-plain structures, areas for development, and natural resources by 2005. The reasonthat such an inventory is needed is the ‘great uncertainty that exists in attempting todetermine the total area of the United States that is subject to flooding’ and ‘thereis no complete record of past flood damages in the United States’ (FIFMTF, 1992,pp. 1-2 and 3-15). In short, we do not know with accuracy how many people inhabitand the quantity, value, and types of property in U.S. floodplains. Consequently,societal vulnerability to floods is poorly understood.
Societal VulnerabilityOnce it was thought that a society’s vulnerability to extreme weather and climateevents was simply a function of an event’s characteristics and incidence in placeswhere people were at risk. This led to conclusions that a prediction of an extremeevent, coupled with a technological or engineering solution (e.g., a levee systemto prevent floods or an accurate forecast of a pending severe storm), would besufficient to reduce vulnerability (Anderson, 1995). But as scientific and technicaltools and techniques have advanced in recent decades, so too have losses of humanlives and property because of the impacts of extreme events in the United Statesand around the world (Pielke, 1997b; White, 1994).∗ The implication of the twintrends of increasing technical sophistication and increasing losses signaled thatvulnerability had more to it than implied by the perspective of nature-causing-disaster. There were obviously other factors at work.
∗ Loss of life was greater in the United States and worldwide in the early decades of this century.
NINE FALLACIES OF FLOODS 423
A more accurate conception of societal vulnerability emphasizes the role thatpeople play in creating their own vulnerabilities, as well as the role of others.∗Anderson (1995, p. 45) summarizes a number of the factors responsible for human-caused-vulnerability.
Whereas previous assessments focused on acts of nature that come from out-side human agency, later assessments acknowledged that it is largely humanactions, decisions, and choices that result in people’s vulnerability to naturalevents. Choices about where to live (or, in some cases, the lack of choicedue to political, economic, or social position), decisions about where to lo-cate a chemical plant, and acts of cutting forests, farming marginal lands, orevading building codes are examples of how humans cause a ‘natural’ hazardto become a disaster. Humans make themselves – or, quite often, others –vulnerable.
A broad definition of ‘vulnerability’ seeks to capture an ‘aggregate measure of hu-man welfare that integrates environmental, social, economic, and political exposureto a range of potential harmful perturbations’ (Bohle et al., 1994). An understand-ing of vulnerability requires integration of both its physical and societal aspects. AsChambers (1989, p. 1) notes that vulnerability has ‘two sides’, an ‘external side ofrisks, shocks and stress . . . and an internal side which is defenselessness, meaninga lack of means to cope without damaging loss’. Vulnerability to a climate- orweather-related event is thus a function of both society’s exposure and of an event’sincidence. Or as a 1966 Federal Task Force eloquently stated: ‘Floods are an act ofGod; flood damages result from the acts of [people]’ (TFFFCP, 1966, p. 14).
Flood events in recent years provide vivid evidence that people and property inthe United States remain extremely vulnerable to floods. However, data is lack-ing (or unavailable) that would allow accurate and useful determination of thetrends in and current level of societal vulnerability to floods. The 1992 assessmentof floodplain management in the United States found that ‘the actual amount ofUnited States land in flood plains has not been clearly determined, nor has theamount of property and other economic investments at risk to flooding been firmlyestablished’ (FIFMTF, 1992, p. 3-1). A review of various estimates of floodproneregions in the United States shows considerable disagreement as to the areal ex-tent of floodprone regions, the number of people who inhabit those areas, and theamount of property at risk to flooding. In 1942, Gilbert White estimated that 35million acres of U.S. land was subject to flooding (White, 1945). In 1955, Hoytand Langbein (1955) estimated that 10 million people live or work within thenation’s 50 million acres of floodprone land. The 1955 estimate equates to 7%of the population living on flood prone regions which comprise about 3% of theUnited States land area. A 1978 study estimated that 4.5 million households werein flood hazard areas. A 1987 study classified about 94 million acres of land as
∗ For discussions of vulnerability see Palm (1990), Alexander (1991), and Burton, et al. (1993).More recently see Dow and Downing (1995).
424 ROGER A. PIELKE, JR.
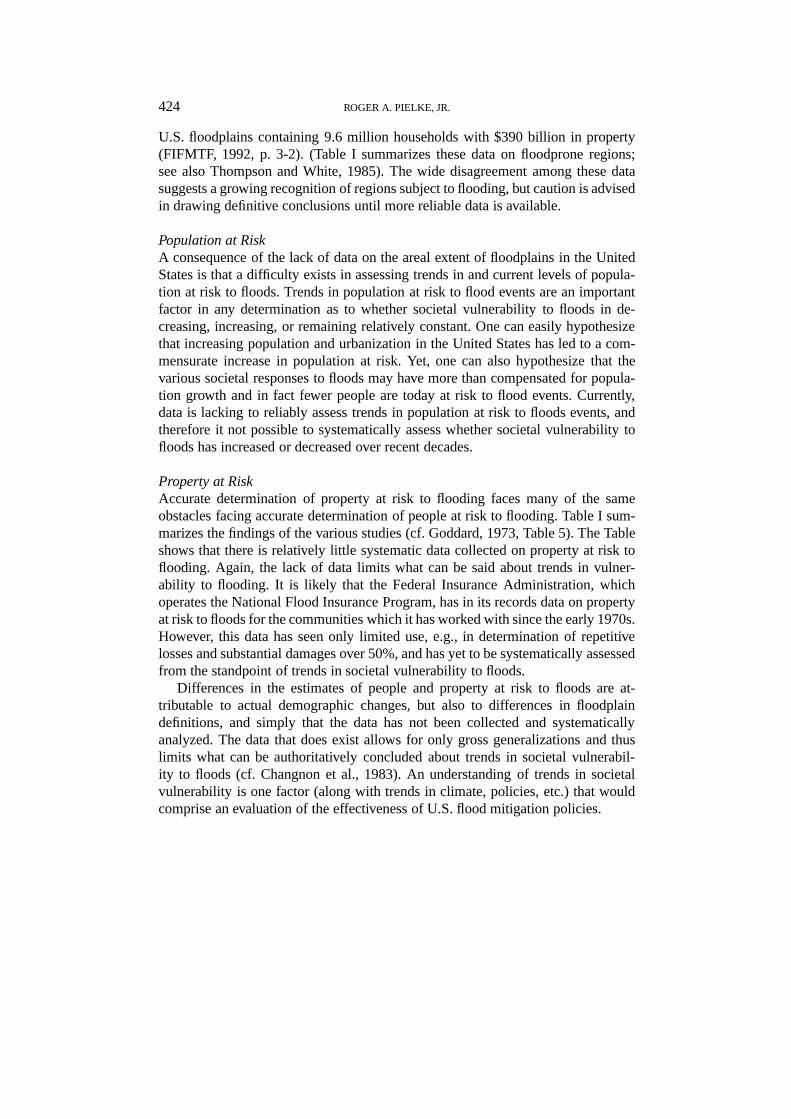
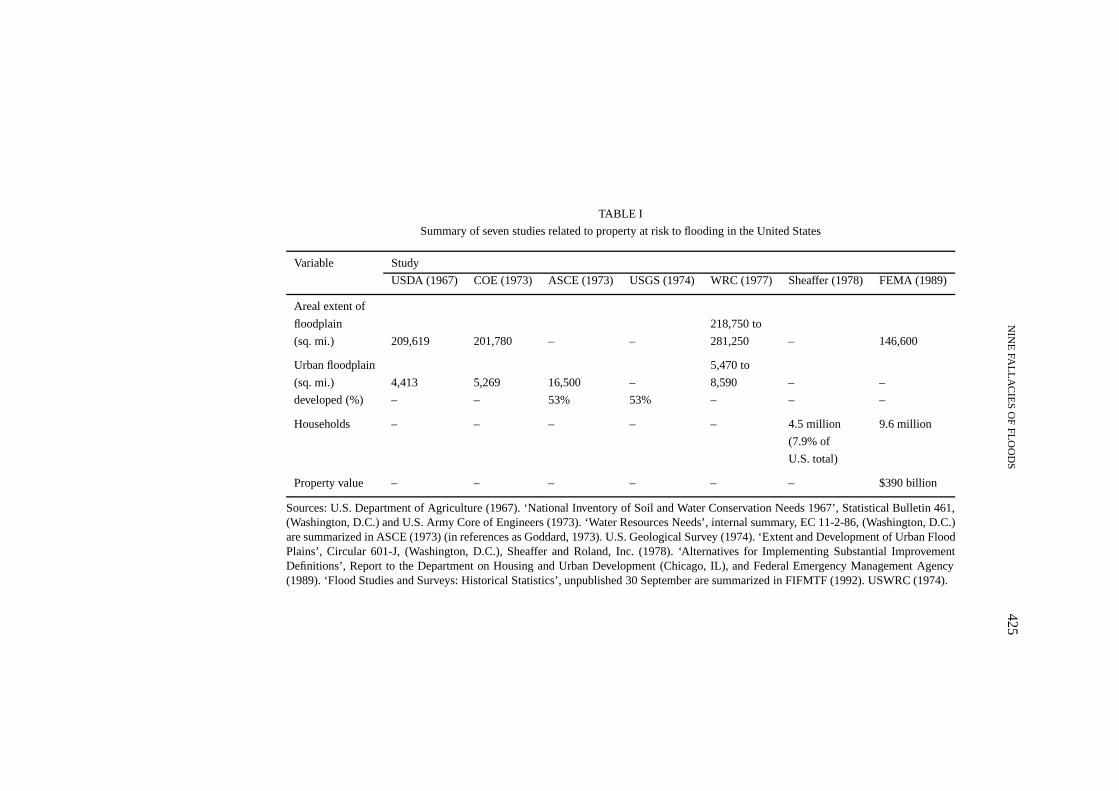
U.S. floodplains containing 9.6 million households with $390 billion in property(FIFMTF, 1992, p. 3-2). (Table I summarizes these data on floodprone regions;see also Thompson and White, 1985). The wide disagreement among these datasuggests a growing recognition of regions subject to flooding, but caution is advisedin drawing definitive conclusions until more reliable data is available.
Population at RiskA consequence of the lack of data on the areal extent of floodplains in the UnitedStates is that a difficulty exists in assessing trends in and current levels of popula-tion at risk to floods. Trends in population at risk to flood events are an importantfactor in any determination as to whether societal vulnerability to floods in de-creasing, increasing, or remaining relatively constant. One can easily hypothesizethat increasing population and urbanization in the United States has led to a com-mensurate increase in population at risk. Yet, one can also hypothesize that thevarious societal responses to floods may have more than compensated for popula-tion growth and in fact fewer people are today at risk to flood events. Currently,data is lacking to reliably assess trends in population at risk to floods events, andtherefore it not possible to systematically assess whether societal vulnerability tofloods has increased or decreased over recent decades.
Property at RiskAccurate determination of property at risk to flooding faces many of the sameobstacles facing accurate determination of people at risk to flooding. Table I sum-marizes the findings of the various studies (cf. Goddard, 1973, Table 5). The Tableshows that there is relatively little systematic data collected on property at risk toflooding. Again, the lack of data limits what can be said about trends in vulner-ability to flooding. It is likely that the Federal Insurance Administration, whichoperates the National Flood Insurance Program, has in its records data on propertyat risk to floods for the communities which it has worked with since the early 1970s.However, this data has seen only limited use, e.g., in determination of repetitivelosses and substantial damages over 50%, and has yet to be systematically assessedfrom the standpoint of trends in societal vulnerability to floods.
Differences in the estimates of people and property at risk to floods are at-tributable to actual demographic changes, but also to differences in floodplaindefinitions, and simply that the data has not been collected and systematicallyanalyzed. The data that does exist allows for only gross generalizations and thuslimits what can be authoritatively concluded about trends in societal vulnerabil-ity to floods (cf. Changnon et al., 1983). An understanding of trends in societalvulnerability is one factor (along with trends in climate, policies, etc.) that wouldcomprise an evaluation of the effectiveness of U.S. flood mitigation policies.
NIN
EFA
LL
AC
IES
OF
FL
OO
DS
425
TABLE I
Summary of seven studies related to property at risk to flooding in the United States
Variable Study
USDA (1967) COE (1973) ASCE (1973) USGS (1974) WRC (1977) Sheaffer (1978) FEMA (1989)
Areal extent of
floodplain 218,750 to
(sq. mi.) 209,619 201,780 – – 281,250 – 146,600
Urban floodplain 5,470 to
(sq. mi.) 4,413 5,269 16,500 – 8,590 – –
developed (%) – – 53% 53% – – –
Households – – – – – 4.5 million 9.6 million
(7.9% of
U.S. total)
Property value – – – – – – $390 billion
Sources: U.S. Department of Agriculture (1967). ‘National Inventory of Soil and Water Conservation Needs 1967’, Statistical Bulletin 461,(Washington, D.C.) and U.S. Army Core of Engineers (1973). ‘Water Resources Needs’, internal summary, EC 11-2-86, (Washington, D.C.)are summarized in ASCE (1973) (in references as Goddard, 1973). U.S. Geological Survey (1974). ‘Extent and Development of Urban FloodPlains’, Circular 601-J, (Washington, D.C.), Sheaffer and Roland, Inc. (1978). ‘Alternatives for Implementing Substantial ImprovementDefinitions’, Report to the Department on Housing and Urban Development (Chicago, IL), and Federal Emergency Management Agency(1989). ‘Flood Studies and Surveys: Historical Statistics’, unpublished 30 September are summarized in FIFMTF (1992). USWRC (1974).
426 ROGER A. PIELKE, JR.
A Prototype: the Scientific Assessment and Strategy Team (SAST)In the aftermath of the 1993 floods the White House established a Scientific As-sessment and Strategy Team (SAST) of scientists from various agencies ‘to providescientific advice and assistance to officials responsible for making decisions withrespect to flood recovery in the Upper Mississippi River Basin’ (SAST, 1994,p. xiii). One of the responsibilities given to the SAST was to ‘organize the infor-mation in existing databases to aid in the near-term and long-term decision-makingprocess’ (SAST, 1994, p. 232). In its review of existing data on the floodplain theSAST found that ‘some data vitally important to making informed management de-cisions on the floodplain were not readily available, or were not uniformly acquiredthroughout the floodplains or river basin’ (SAST, 1995, p. 13).
As a prototype, the SAST has begun to collect, document, and distribute flood-plain data for the Upper Mississippi River Basin. Some of the data collected bythe Team includes: hydrology, land use/cover, soil, topography, vegetation, flood,agriculture, infrastructure, climate, biology/ecology, reservoir, etc. Data has beencollected from federal, regional, state, and local organizations.∗ If the SAST is tocontribute broadly to the U.S. flood problem by helping to fill the ‘data gap’ thatit identified, then it must include societal data (e.g., demographics) in its mappingefforts. Further, its efforts must be evaluated from the standpoint of whether ornot the information it collects is usable by decision makers. If the Team’s work isjudged by decision makers to be useful, then the SAST is a model that ought to beemulated for other U.S. river basins.
2.6. DATA ON FLOOD CASUALTIES IS A PROXY FOR FLOOD RISK
Due to the lack of systematic data on the number of people at risk to floods, trendsin flood casualties, for which relatively systematic data is available, are sometimesused as a proxy for trends in population at risk. An assumption underlying manysuch analyses is that a rise in flood-related casualties is indicative of a rise in thenumber of people at risk to flood events. Unfortunately, at least three confoundingfactors limit the use of trends in flood casualties as a proxy for trends in the grossnumber of people who are vulnerable to floods.
First, many flood-related deaths are concentrated in single extreme events, likea hurricane or a severe flash flood. Second, society has taken many steps to reduceits level of exposure, with mixed results. This means that a moving baseline of ex-posure underlies any record of flood-related casualties. Consequently, there may bea number of trends within a trend record of flood casualties (e.g., level of exposure,success and failures of mitigation efforts, etc.). Finally, the data on flood casualtiesis generally not perceived to be accurate enough to lead to definitive causal conclu-sions (Richards, 1995, personal communication). The longest continuous recordof flood casualty data is that of the National Weather Service (1903–present).
∗ Data and information on the ongoing status of the SAST can be accessed on the World WideWeb at http://edcwww.cr.usgs.gov/SAST-home.html.

NINE FALLACIES OF FLOODS 427
Figure 1.Flood fatalities in the United States: 1903–1994 (by year and five-year average).
However, there are different sources of data which have different numbers (e.g.,Red Cross data in FIFMTF (1992) and Wood (1994)). For these reasons, trend dataon flood-related casualties does not lend much insight into broader questions offactors which underlie trends on vulnerability to floods.
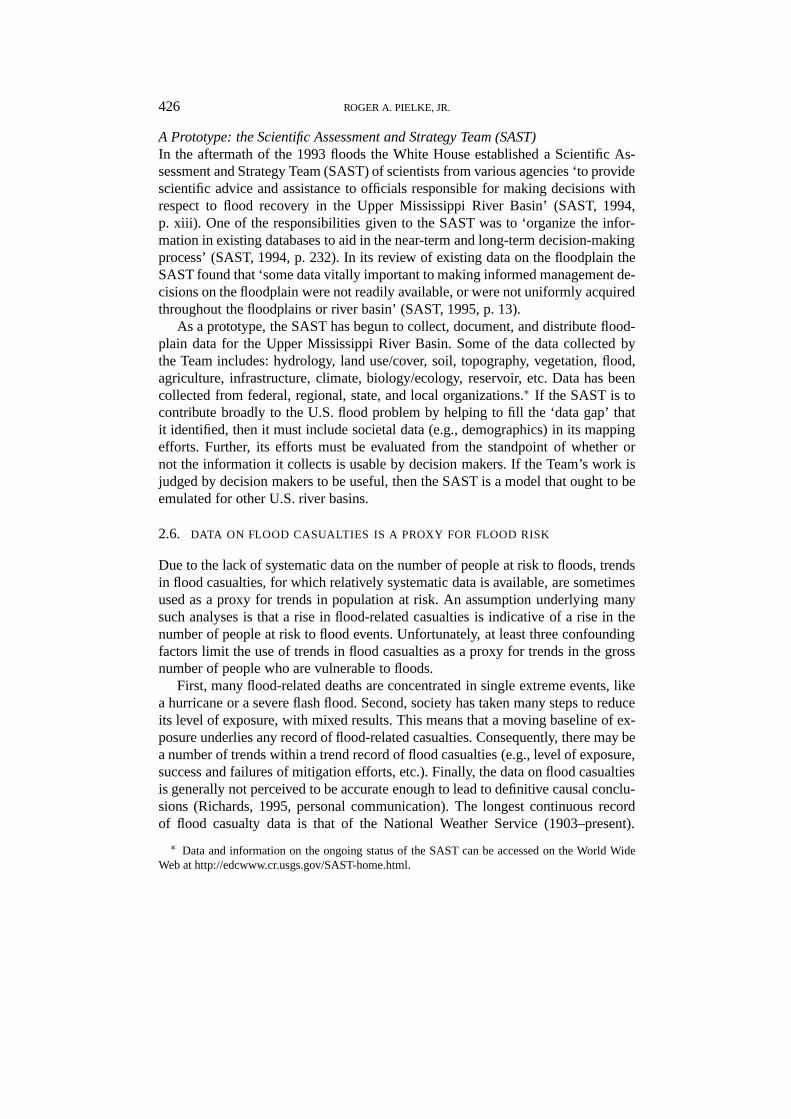
Figure 1 shows the data kept by the National Weather Service on flood-relatedfatalities in the United States from 1903–1994.∗ The data shows a downward trendin flood-related deaths since the early 1970s, but also an increased frequency ofyears with high deaths. Figure 2 shows the trend of flood-related deaths over amoving 25-year period beginning with 1927 (i.e., sum of 1903–1927) and endingin 1994 (i.e., sum of 1970–1994).† At this time scale, the more recent period con-tains more deaths (Wood (1993), using a different dataset finds a similar trend).However, this data must be viewed with caution, as it may be possible that part ofthe trend is due to better accounting in the more recent years. Of the annual deathsrelated to floods, 80–90 percent are caused by flash floods and 40 percent of these‘are related to stream crossing or highway fatalities’ (Zevin, 1994, p. 1267).
In sum, available data indicates that flood-related deaths have increased in re-cent decades. However, because of the nature of the data, little can be said withauthority about what the trend of increased deaths means from the standpoint ofpeople at risk to floods.
∗ Data is kept by ‘water year’ which runs from October 1 through September 30 the followingyear. For instance, Water Year 1996 started on October 1, 1995 and ended September 30, 1996.
† A 25-year moving average is used because it is the approximate period between the mostextreme flood events (as measured by economic impacts), e.g., 1903, 1927, 1951, 1972, 1993.
428 ROGER A. PIELKE, JR.
Figure 2.Flood deaths in the United States: 1903–1994; each point represents average annual deathsof previous 25 years.
2.7. DATA ON FLOOD DAMAGES IS A PROXY FOR FLOOD RISK
As in the case of trends in people at risk to floods, analysts have sought to usetrends in flood damages as a proxy for trends in property at risk to floods. However,it is at least as difficult to form definitive conclusions about vulnerability from thedamage data as it is from the casualty data. Flood damages occur every year invarious places around the United States. Such damages, per se, are not sufficientevidence of a policy problem. As the Task Force on Federal Flood Control Policynoted in 1966 (p. 13), ‘it may well be that the advantages of flood plain locationoutweigh the intermittent costs of damages from floods. Further, there are somekinds of activity which can only be conducted near a watercourse’.
Flood damages (or losses) have been defined as the ‘destruction or impairment,partial or complete, of the value of goods or services, or of health, resulting fromthe action of flood waters and the silt and debris they carry. Easy to define, floodlosses are difficult to set down in dollar figures’ (Hoyt and Langbein, 1955, p. 77).Because of the methodological difficulties in assessing flood damages, as well asthe limited data available, ‘taking all in all, it is evident that any evaluation offlood damage is only a rough approximation’ (Hoyt and Langbein, 1955, p. 79).Nevertheless, the historical record of flood damages provides some insight as totrends in flood impacts on society.
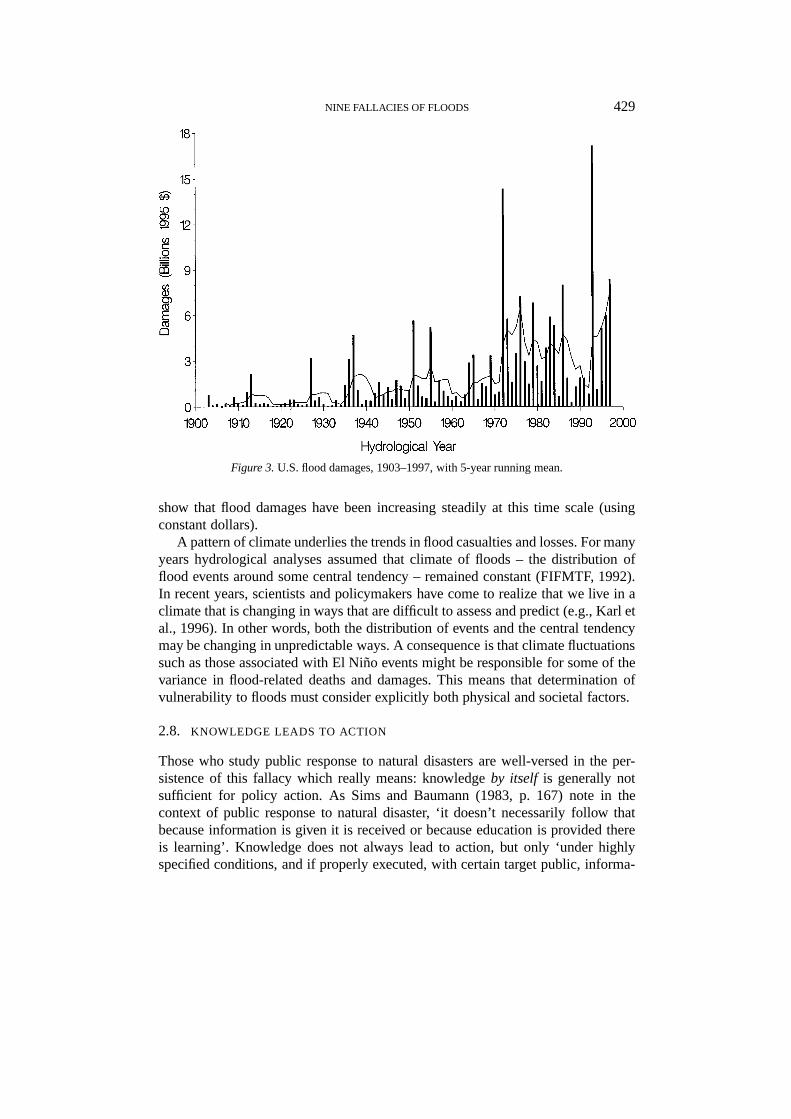
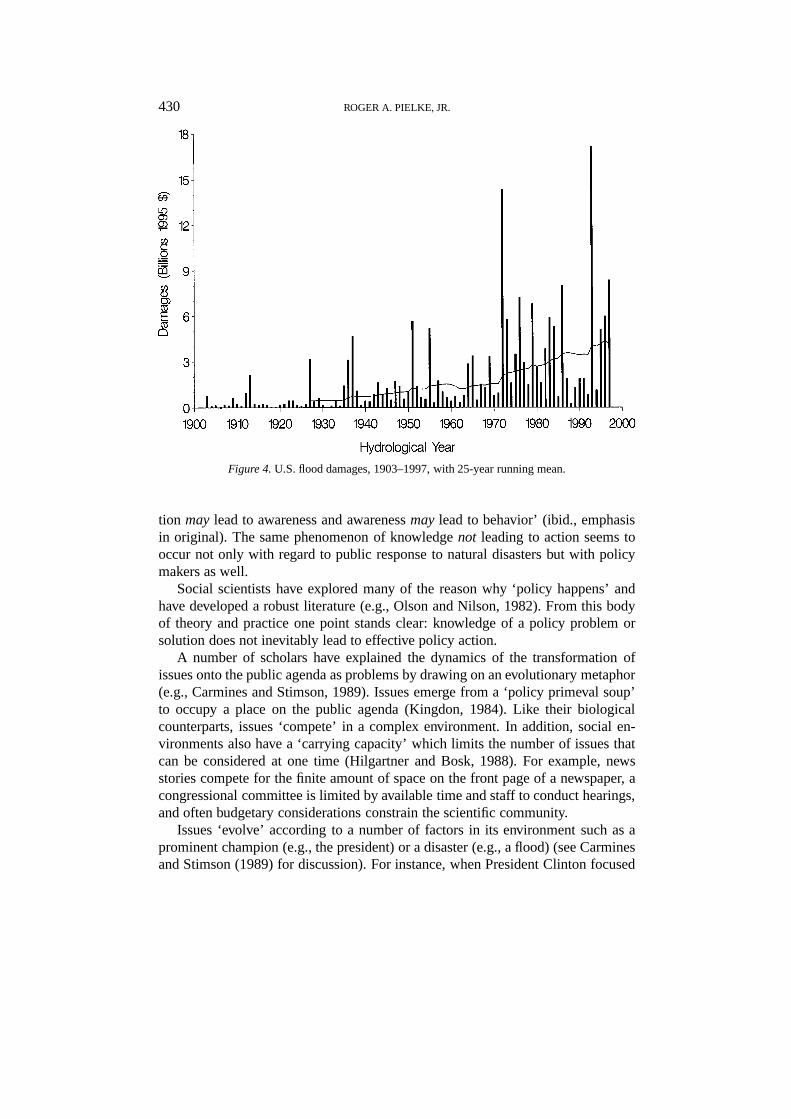
Figure 3 shows annual flood damages for the period 1903–1994 as tabulated bythe National Weather Service (cf. F. Richards, personal communication). Figure 4shows the same data from the standpoint of a 25-year moving average. The data
NINE FALLACIES OF FLOODS 429
Figure 3.U.S. flood damages, 1903–1997, with 5-year running mean.
show that flood damages have been increasing steadily at this time scale (usingconstant dollars).
A pattern of climate underlies the trends in flood casualties and losses. For manyyears hydrological analyses assumed that climate of floods – the distribution offlood events around some central tendency – remained constant (FIFMTF, 1992).In recent years, scientists and policymakers have come to realize that we live in aclimate that is changing in ways that are difficult to assess and predict (e.g., Karl etal., 1996). In other words, both the distribution of events and the central tendencymay be changing in unpredictable ways. A consequence is that climate fluctuationssuch as those associated with El Niño events might be responsible for some of thevariance in flood-related deaths and damages. This means that determination ofvulnerability to floods must consider explicitly both physical and societal factors.
2.8. KNOWLEDGE LEADS TO ACTION
Those who study public response to natural disasters are well-versed in the per-sistence of this fallacy which really means: knowledgeby itself is generally notsufficient for policy action. As Sims and Baumann (1983, p. 167) note in thecontext of public response to natural disaster, ‘it doesn’t necessarily follow thatbecause information is given it is received or because education is provided thereis learning’. Knowledge does not always lead to action, but only ‘under highlyspecified conditions, and if properly executed, with certain target public, informa-
430 ROGER A. PIELKE, JR.
Figure 4.U.S. flood damages, 1903–1997, with 25-year running mean.
tion may lead to awareness and awarenessmay lead to behavior’ (ibid., emphasisin original). The same phenomenon of knowledgenot leading to action seems tooccur not only with regard to public response to natural disasters but with policymakers as well.
Social scientists have explored many of the reason why ‘policy happens’ andhave developed a robust literature (e.g., Olson and Nilson, 1982). From this bodyof theory and practice one point stands clear: knowledge of a policy problem orsolution does not inevitably lead to effective policy action.
A number of scholars have explained the dynamics of the transformation ofissues onto the public agenda as problems by drawing on an evolutionary metaphor(e.g., Carmines and Stimson, 1989). Issues emerge from a ‘policy primeval soup’to occupy a place on the public agenda (Kingdon, 1984). Like their biologicalcounterparts, issues ‘compete’ in a complex environment. In addition, social en-vironments also have a ‘carrying capacity’ which limits the number of issues thatcan be considered at one time (Hilgartner and Bosk, 1988). For example, newsstories compete for the finite amount of space on the front page of a newspaper, acongressional committee is limited by available time and staff to conduct hearings,and often budgetary considerations constrain the scientific community.
Issues ‘evolve’ according to a number of factors in its environment such as aprominent champion (e.g., the president) or a disaster (e.g., a flood) (see Carminesand Stimson (1989) for discussion). For instance, when President Clinton focused

NINE FALLACIES OF FLOODS 431
on health care shortly after his inauguration, it became an issue of national promi-nence because of his highly visible and influential position (compare TheodoreRoosevelt’s ‘bully pulpit’). Similarly, most policies to deal with disasters are put inplace in the immediate aftermath of an extreme event. According to Hilgartner andBosk (1988), drama, novelty and saturation, and culture and politics also influencewhat becomes defined as a social problem and what does not.
A disaster or extreme event can serve to open a ‘window of opportunity’ forchange (Ungar, 1995; Solecki and Michaels, 1994). At this time agents of changeought to be prepared with a well-defined plan of action. As Downs (1972, p. 40)notes, following a window of opportunity for change soon follows ‘a prolongedlimbo – a twilight realm of lesser attention or spasmodic recurrences of interest’.Consequently, those with an interest in improving policy outcomes with respect tofloods ought to have a plan of action ready for when conditions do become favor-able for policy change. But it is often the case that communities are surprised byfloods, and are therefore unprepared to respond effectively (Solecki and Michaels,1994). This means that efforts of flood policy advocates will be enhanced withan ability to recognize and capitalize on a window of opportunity. Thus, whileknowledge of the flood problem is not a sufficient condition for action, knowledgeis a necessary element of a rational plan put forward at the right time, to thosewith authority and interest to act. One example of this is that the recommendationsof the IFMRC (1995) were in large part incorporated into the FEMA NationalMitigation Strategy (FEMA, 1995). Here, knowledge plus the floods of 1993 beganto stimulate broader policy change (Thomas, 1997, personal communication).
In the absence of an extreme event that mobilizes political action, policy forreducing a community’s vulnerability to floods must meet several criteria in abusiness-as-usual environment (according to Nilson, 1985). First, the threat mustbe demonstrated (i.e., the problem must be defined). Second, potential responsesmust be shown to have a significant likelihood of being effective. And third, policyoptions must not be viewed to impose excessive costs or changes on the commu-nity. Many of the most effective mitigation actions are those which can be takenby the individual, such as a homeowner. Yet, studies indicate that neither improvedawareness of hazards nor previous experience with hazards are sufficient to compelpeople to take actions to reduce their vulnerability (Sims and Baumann, 1983).
2.9. THE U.S. FLOOD PROBLEM CAN BE ADDRESSED WITHOUT FEDERAL
LEADERSHIP AND SUPPORT
Recent trends in public and political opinion that government must be downsizedand policy decisions ought to be increasingly made at the state and local level arecounter to the needs of an effective response to the U.S. flood problem (cf. Wilkins,1996). While most experts familiar with floods recognize this point, prevailingattitudes of the public and elected officials in recent years have emphasized limitingthe role of the federal government in a range of areas. Responses to floods ought

432 ROGER A. PIELKE, JR.
not be one such area. While it is at the state, local, and individual level that manydecisions will be made to reduce vulnerability to floods, an effective long-term so-lution to the U.S. flood problem will necessarily require some form of coordinationat the scale of the river basin. This is for the simple reason that no flood-vulnerablecommunity can effectively address its flood problem without having its responseaffect other communities both up and down stream. As one assesses the interactionof communities, one finds that the largest unit of analysis that can be consideredwithout concern for community interaction is the river basin, e.g., the Mississippiriver basin. Consequently, coordination is required between communities withina particular basin or sub-basin: because communities and river basins span local,state, and federal jurisdictions, some form of regional or national level cooperationis unavoidable.
While cooperation, in theory, appears unavoidable, in practice it has in manyrespects been avoided. White (1991, VI-2) notes that ‘cooperation among the ad-ministrators of Federal programs, while generally cordial and helpful, has not yetyielded a genuinely unified effort. Lacking exemplary effectiveness at that level,State and local agencies cannot be expected to act in concord in meeting nationalgoals’. A need for federal leadership in flood policy has been long recognized (e.g.,CPW, 1959). Yet, although there has been progress with respect to responding tothe U.S. flood problem, many observers continue to identify a need for improvedcoordination and leadership at the federal level (e.g., White, 1991; Myers andWhite, 1993; Kusler and Larson, 1993; Rasmussen, 1994; Galloway, 1995; Faberand Hunt, 1996; Wright, 1996).
Calls for changes in federal flood policy are seemingly paradoxical because theyidentify a need to be simultaneously more comprehensive and more localized, witha focus on individual and community responsibility (Kusler and Larson, 1993). Theseeming paradox vanishes upon closer scrutiny: ‘individuals, not the government,must assume responsibility for their locational decisions, and future governmentpolicies must stand firm over time to seek such an approach’ (Changnon, 1996,p. 313). In important respects, the federal government establishes the context inwhich individual, local, state, and other public and private decisions related tofloods will be made. For instance, recent claims that generous flood relief poli-cies are ‘moving the country in the opposite direction from which many feel theyshould go’ point to the incentives toward abdication of individual and communityresponsibility that such policies create (Wright, 1996, p. 271). Just as policy cancreate an unhealthy context for flood-related decisionmaking, it can also create ahealthy context, in which individuals and communities will strive to reduce theirown flood vulnerabilities.
NINE FALLACIES OF FLOODS 433
3. Conclusion: Implementing What We Know
How might the U.S. reach a healthy federal flood policy? Knowledge of whatmight be done is available, yet remains to be put to effective use. Not surprisingly,Gilbert White (1991) provides guidance in this regard worth repeating and difficultto improve upon:
First, ‘unless a strong statement is made by the Congress on the ways in whichthe basic policies of the individual Federal agencies are to be related to the un-derlying aims in managing floodplain resources those policies will have little sig-nificance in the field where they influence or are constrained by State and localpractices’ (White, 1991, p. VI-3). White further notes there has not been legislationpassed by the Congress stating clearly the overarching goals of U.S. flood policy.There is no lack of ideas for what such goals ought to be (recently, e.g., Myers andWhite, 1993; Kusler and Larson, 1993; FIFMTF, 1994; IFMRC, 1994; Shabman,1994; Philippi, 1994/95; Faber and Hunt, 1996; Wright, 1996). A national debate,resulting in federal legislation delineating both the dimensions of the U.S. floodproblem and the steps needed to address it, would be valuable both as an outcomeand as a process. Such a debate would require leadership at the national level.
Second, ‘floodplain policy changes must be taken in the context of broad en-vironmental goals applied to local conditions’ (White, 1991, p. VI-4). The federalrole in flood policy is not to specify in great detail how individuals and locales areto respond to particular situations. Instead, it is to provide a common frameworkwithin which communities and individuals will be able to exercise choice. Thefederal government is needed also to coordinate the voluminous meteorological,hydrological, demographic, ecological, economic and other societal informationneeded to understand human occupancy of a river basin and floodplain. In addi-tion, it is the federal government that has the ability to evaluate the interactioneffects of communities acting in parallel and in series in a particular floodplain.Finally, it is the federal government that can establish and enforce statements ofnational interest in floodplain management. Policy change will not occur withoutbroad support for a process of formulation, promulgation, and implementation of aoverarching vision of federal flood policy.
Third, ‘as new improvements are made in Federal programs, it would be impor-tant to craft them on an experimental basis with careful provision for evaluationas they are launched’ (White, 1991, p. VI-3). The value of such experimentalprograms is well documented (see, e.g., Brunner (1996) for a discussion). ‘Unfor-tunately, little formal recognition has been given to “what works” at the state level’(BTFFDR, 1995, p. 37). Thus, more attention needs to be paid to why certainflood policies succeed or fail with respect to addressing the U.S. flood problem.With the improved understanding gained from experience and practical knowledge,policymakers will be in better position to replicate successes and terminate failures.
Leadership, vision, and practical knowledge are easy to call for, but much moredifficult to achieve in practice. However, without such an approach from national

434 ROGER A. PIELKE, JR.
decision makers intent upon improving federal flood policy, it is likely that theUnited States will persist in a state of knowing what to do about floods, but notdoing it.
We, as a society, have invested considerable effort and suffered much hard ex-perience to learn the lessons of floods. The time is now appropriate to seek to askand answer why those lessons have not always been effectively linked to policyaction. Overcoming the obstacles to improved societal response to floods will befar more complex than simply exposing persistent misconceptions. Nevertheless,through a discussion of such fallacies, what they are, their deleterious effects, andwhy they persist, previously unseen opportunities for action may develop.
Acknowledgements
The author gratefully acknowledges helpful discussions with and comments onan earlier draft from Mary Fran Myers, Frank Thomas, Gilbert White, and threeanonymous reviewers. Frank Richards of the National Weather Center providedthe casualty and economic data. The research reported in this paper was supportedby the National Science Foundation.
References
Alexander, D.: 1993,Natural Disasters, Chapman and Hall, New York.Anderson, M. B.: 1995, ‘Vulnerability to Disaster and Sustainable Development: A General Frame-
work for Assessing Vulnerability’, in Munasinghe, M. and Clarke, C. (eds.),Disaster Preventionfor Sustainable Development: Economic and Policy Issues, IDNDR and The World Bank,Washington, D.C.
Belt, Jr., C. B.: 1975, ‘The 1973 Flood and Man’s Constriction of the Mississippi River’,Science189, 681–684.
Bhowmik, N. G., Buck, A. G., Changnon, S. A., Dalton, R. H., Durgunoglu, A., Demissie, M., Juhl,A. R., Knapp, H. V., Kunkel, K. E., McConkey, S. A., Scott, R. W., Singh, K. P., Soong, T. D.,Sparks, R. E., Visocky, A. P., Vonnahme, D. R., and Wendland, W. M.: 1994,The 1993 Floodon the Mississippi River in Illinois, Illinois State Water Survey, Miscellaneous Publication 151,Champaign, IL.
Bobée, B. and Rasmussen, P. F.: 1995,Recent Advances in Flood Frequency Analysis, U.S. NationalReport to the International Union of Geodesy and Geophysics 1991–1994, pp. 1111–1116.
Bohle, H. G., Downing, T. E., and Watts, M. J.: 1994, ‘Climate Change and Social Vulnerability’,Global Environ. Change4, 37–48.
Brunner, R. D.: 1996, ‘Policy and Global Change Research’,Clim. Change32, 121–147.BTFFDR (Bipartisan Task Force on Funding Disaster Relief): 1995,Federal Disaster Assistance,
U.S. Senate, p. 104-4.Burkham, D. E.: 1978, ‘Accuracy of Flood Mapping’,J. Res., U.S. Geol. Survey6 (4), 515–527.Burton, I., Kates, R. W., and White, G. F.: 1993,The Environment as Hazard, 2nd ed., Guilford Press,
New York.
NINE FALLACIES OF FLOODS 435
Carmines, E. and Stimson, J.: 1989,Issue Evolution: Race and the Transformation of AmericanPolitics, Princeton University Press, Princeton, NJ.
Chambers, R.: 1989, ‘Vulnerability, Coping and Policy’,IDS Bulletin20, 1–7.Changnon, S. A. (ed.): 1996,The Great Flood of 1993: Causes, Impacts, and Responses, Westview
Press, Boulder, CO.Changnon, S. A. and Kunkel, K. E.: 1995, ‘Climate-Related Fluctuations in Midwestern Floods
During 1921–1985’,J. Water Resour. Plan. Manage.(July/August), 326–334.Changnon, S. A., Schicht, R., and Semonin, R.: 1983,A Plan for Research on Floods and Their
Mitigation in the United States, Final Report to the National Science Foundation, Illinois StateWater Survey.
Cohen, M. D., March, J. G., and Olsen, J. P.: 1972, ‘A Garbage Can Model of Organizational Choice’,Admin. Sci. Quart.22, 1–5.
Corrigan, P.: 1993, ‘Flood Forecast Gets Dimmer: St. Louis Harbor Closed, River Des Peres Rising’,St. Louis Post-DispatchJuly 9, 1A.
CPW (Committee on Public Works): 1959,A Program for Reducing the National Flood DamagePotential, Memorandum of the chairman to members of the CPW, U.S. GPO, Washington, D.C.
DOC (Department of Commerce): 1994,Natural Disaster Survey Report – The Great Flood of 1993,Washington, D.C.
Dow, K. and Downing, T. E.: 1995, ‘Vulnerability Research: Where Things Stand’,Human Dimen.Quart.1 (3), 3–5.
Downs, A.: 1972, ‘Up and Down with Ecology: The Issue Attention Cycle’,The Public Interest(Summer), 38–50.
Dracup, J. A. and Kendall, D. R.: 1990, ‘Floods and Droughts’, in Waggoner, P. E. (ed.),ClimateChange and U.S. Water Resources, John Wiley and Sons, New York, pp. 243–267.
Faber, S. and Hunt, C.: 1994, ‘River Management Post-1993: The Choice is Ours’,Water Resour.Update95, 15–20.
FEMA (Federal Emergency Management Agency): 1996,A Dangerous Assumption: The 100-YearFlood, press release, 15 July.
FEMA, 1995:Partnerships for Building Safer Communities, National Mitigation Strategy, FEMA,Washington, D.C.
FEMA: 1989,Flood Studies and Surveys: Historical Statistics, unpublished, summarized in FIFMTF(1992).
FIFMTF (Federal Interagency Floodplain Management Task Force): 1992,Floodplain Managementin the United States: An Assessment Report, Volume 2: Full Report, L. R. Johnston Associates,Washington.
FIFMTF: 1994,A Unified National Program for Floodplain Management 1994, FEMA No. 248,Federal Emergency Management Agency, Washington, D.C.
Frederick, K. D. and Kneese, A. V.: 1990, ‘Reallocation by Markets and Prices’, in Waggoner, P. E.(ed.),Climate Change and U.S. Water Resources, John Wiley and Sons, New York, pp. 395–420.
FPMA (Floodplain Management Assessment): 1995,Floodplain Management Assessment of the Up-per Mississippi River and Lower Missouri Rivers and Tributaries, U.S. Army Corps of Engineers,St. Louis, MO.
Galloway, G. E.: 1995, ‘New Directions in Floodplain Management’,Water Resour. Bull.31, 351–357.
Glantz, M. H. (ed.): 1976,Politics of Natural Disaster: The Case of the Sahel Drought, PraegerPublishers, New York.
Glantz, M. H.: 1988,Forecasting by Analogy, Westview Press, Boulder, CO.Glassheim, E.: 1997, ‘Fear and Loathing in North Dakota’,Natural Hazards Observer21(6) (July),
1–4.Goddard, J. E.: 1973,An Evaluation of Urban Flood Plains, ASCE Urban Water Resources Research
Program Technical Memorandum No. 19, American Society of Civil Engineers, New York, NY.
436 ROGER A. PIELKE, JR.
Gruntfest, E. and Pollack, D.: 1994, ‘Warnings, Mitigation and Litigation: Lessons for Research fromthe 1993 Floods’,Water Resour. Update95, 40–44.
Hilgartner, Stephen and Bosk, C.: 1988, ‘The Rise and Fall of Social Problems: A Public ArenasModel’, Amer. J. Sociol.94(1), 53–78.
Hoyt, W. and Langbein, W. B.: 1955,Floods, Princeton University Press, Princeton, New Jersey.IFMRC (Interagency Floodplain Management Review Committee): 1994,A Blueprint for Change –
Sharing the Challenge: Floodplain Management into the 21st Century, Report of the IFMRC tothe Administration Floodplain Management Task Force, U.S. GPO.
IPCC (Intergovernmental Panel on Climate Change): 1996a,Climate Change 1995: The Scienceof Climate Change, Contribution of Working Group I to the Second Assessment Report of theIPCC, Cambridge University Press, London.
IPCC (Intergovernmental Panel on Climate Change): 1996b,Climate Change 1995: Impacts,Adaptations, and Mitigation of Climate Change, Scientific-Technical Analyses, Contribution ofWorking Group II to the Second Assessment Report of the IPCC, Cambridge University Press,London.
ITFFM (Interagency Task Force on Floodplain Management): 1986,A Unified National Program forFloodplain Management, FEMA, Washington, D.C.
Karl, T. R., Knight, R. W., and Plummer, N.: 1995, ‘Trends in High-Frequency Climate Variabilityin the Twentieth Century’,Nature377, 217–220.
Karl, T. R., Knight, R. W., Easterling, D. R., and Quayle, R. C.: 1996, ‘Indices of Climate Changefor the United States’,Bull. Amer. Meteorol. Soc.77(2), 279–292.
Kingdon, J.: 1984,Agendas, Alternatives, and Public Policies, Harper Collins, Boston, p. 240.Krzysztofowicz, R.: 1995,Recent Advances Associated with Flood Forecast and Warning Systems,
U.S. National Report to the International Union of Geodesy and Geophysics 1991–1994, pp.1139–1147.
Kunkel, K. E., Andsager, R. A., and Easterling, D. R.: 1997,Trends in the Frequency of HeavyPrecipitation Events over the U.S., Preprints, Conference on Applied Climatology, December,American Meteorological Society, Boston, MA.
Kusler, J. and Larson, L.: 1993, ‘Beyond the Ark: A New Approach to U.S. Floodplain Management’,Environment35, 7–11, 31–34.
Lins, H. F. and Michaels, P. J.: 1994, ‘Increasing U.S. Streamflow Linked to Greenhouse Forcing’,EOS: Transact. Amer. Geophys. Union75, 281ff.
Lord, W. B.: 1994, ‘Flood Hazard Delineation: The One Percent Standard’,Water Resour. Update:Coping with the Flood: The Next Phase95, 36–39.
Myers, M. F.: 1994, ‘Challenges for the Floodplain Management Tomorrow’, inProceedings of theEighteenth Annual Conference of the Association of State Floodplain Managers, pp. 441–445.
Myers, M. F. and White, G.: 1993, ‘The Challenge of the Mississippi Flood’,Environment35, 6–9,25–35.
Nilson, D.: 1985, ‘Natural Hazard Political Contexts and Adoption Strategies’,Policy Studies Review4, 734–738.
Olson, R. S. and Nilson, D. C.: 1982, ‘Public Policy Research and Natural Hazards Research: NaturalComplements’,Soc. Sci. J.19, 89–103.
OTA (Office of Technology Assessment): 1993,Preparing for an Uncertain Climate – Volume I,OTA-O-567, U.S. GPO, Washington, D.C.
Palm, R. I.: 1990,Natural Hazards: An Integrative Framework for Research and Planning, JohnsHopkins University Press, Baltimore, MD.
Philippi, N.: 1994/95, ‘Plugging the Gaps in Flood-Control Policy’,Issues Sci. Technol.(Winter),71–78.
Pielke Jr., R. A.: 1997a, ‘Asking the Right Questions: Atmospheric Sciences Research and SocietalNeeds’,Bull. Amer. Meteorol. Soc.78(2), 255–264.
NINE FALLACIES OF FLOODS 437
Pielke Jr., R. A. (ed.): 1997b,Workshop on the Social and Economic Impacts of Weather, held 2–4April 1997 in Boulder, Colorado, Environmental and Societal Impacts Group, National Centerfor Atmospheric Research, Boulder, Colorado.
Pielke Jr., R. A.: 1999, ‘Who Decides? Forecasts and Responsibilities in the 1997 Red River Floods’,Appl. Behavioral Sci. Rev., in press.
Peterson, I.: 1995, ‘In a Missouri Town, Floods are Getting Easier to Recall’,The New York Times,May 22, A1.
Rao, P. G.: 1995, ‘Effect of Climate Change on Streamflows in the Mahanadi River Basin, India’,Water Internat.20, 205–212.
Rasmussen, J. L.: 1994, ‘Floodplain Management in the 21st Century: A Blueprint for Change –Sharing the Challenge’,Water Internat.19, 166–176.
Schwein, N. O.: 1996,The Effect of Quantitative Precipitation Forecasts on River Forecasts, NOAATechnical Memorandum NWS CR-110, National Weather Service Office, Kansas City, MO.
Shabman, L.: 1994, ‘Responding to the 1993 Flood: The Restoration Option’,Water Resour. Update95, 26–30.
Sheaffer and Roland Inc.: 1978,Alternatives for Implementing Substantial Improvement Definitions,Report to the Department on Housing and Urban Development, Chicago, IL.
Sims, J. H. and Baumann, D. D.: 1983, ‘Educational Programs and Human Response to NaturalHazards’,Environ. Behavior15(2), 165–169.
Solecki, W. D. and Michaels, S.: 1994, ‘Looking through the Postdisaster Policy Window’,Environ.Manage.18(4), 587–595.
TFFFCP (Task Force on Federal Flood Control Policy):1966, A Unified National Program forManaging Flood Losses, Report No. 67-663, U.S. GPO, Washington, D.C.
Tobin, G. A.: 1995, ‘The Levee Love Affair: A Stormy Relationship’,Water Resour. Bull.31, 359–367.
Thompson, S. A. and White, G. F.: 1985, ‘A National Floodplain Map’,J. Soil Water Conserv.40,417–419.
Ungar, S.: 1995, ‘Social Scares and Global Warming: Beyond the Rio Convention’,Soc. NaturalResour.8, 443–456.
USACE (U.S. Army Corp of Engineers): 1973,Water Resource Needs, Internal summary EC 11-2-86, Washington, D.C.
U.S. Department of Agriculture: 1967,National Inventory of Soil and Water Conservation Needs1967, Statisical Bulletin 461, Washington, D.C.
USGS (U.S. Geological Survey): 1974,Extent and Development of Urban Flood Plains, Circular601-J, Washington, D.C.
USWRC (U.S. Water Resources Council): 1976,A Unified National Program for Flood PlainManagement, Washington, D.C.
USWRC (U.S. Water Resources Council): 1977,Estimated Flood Damages: Appendix B, NationwideAnalysis Report, U.S. GPO, Washington, D.C. USWRC (U.S. Water Resources Council): 1979,A Unified National Program for Flood Plain Management, Washington, D.C.
USWRC (U.S. Water Resources Council): 1981,Guideline for Determining Flood Flow Frequency,Bulletin #17B of the Hydrology Committee, revised September.
White, G. F.: 1945,Human Adjustments to Floods: A Geographical Approach to the Flood Problemin the United States, Doctoral Dissertation, Department of Geography, University of Chicago.
White, G. F.: 1991, ‘Retrospect and Prospect: An Invited Comment’, in FIFMTF (Federal Intera-gency Floodplain Management Task Force) 1992,Floodplain Management in the United States:An Assessment Report, Volume 2: Full Report, L. R. Johnston Associates, Washington, pp.VI–1–4.
White, G. F.: 1994, ‘A Perspective on Reducing Losses from Natural Hazards’,Bull. Amer. Meteorol.Soc.75, 1237–1240.

438 ROGER A. PIELKE, JR.
Wilkins, L.: 1996, ‘Living with the Flood: Human and Governmental Responses to Real and Sym-bolic Risk’, (Chapter 10), in Changnon, S. A. (ed.),The Great Flood of 1993: Causes, Impacts,and Responses, Westview Press, Boulder, CO.
WMO (World Meteorological Organization): 1992,International Glossary of Hydrology, UNESCOand WMO, Geneva, Switzerland.
Wood, R. A.: 1993, ‘Flash Flood/Flood State-by-State Fatality Statistics 1945–93’, inStorm Data1993: A Composite of Outstanding Storms35(13), NOAA, Washington, D.C., pp. 80–81.
Wood, R. A.: 1994, ‘Flash Flood/Flood Fatalities – 1960 through 1994 – United States, PuertoRico and the Virgin Islands, Year-by-Year/State-by-State’, inStorm Data and Unusual WeatherPhenomena with Late Reports and Corrections36(12), NOAA, Washington, D.C., pp. 56–58.
Wright, J.: 1996, ‘Effects of the Flood on National Policy: Some Achievements, Major ChallengesRemain’, (Chapter 11), in Changnon, S. A. (ed.),The Great Flood of 1993: Causes, Impacts, andResponses, Westview Press, Boulder, CO.
Zevin, S. F.: 1994, ‘Steps Toward an Integrated Approach to Hydrometeorological ForecastingServices’,Bull. Amer. Meteorol. Soc.75(7), 1267–1276.
(Received 13 March 1998; in revised form 27 August 1998)