nina wernecke advisor: dr andrew campbell wernecke advisor: dr andrew campbell geol394 may 1, 2009...
TRANSCRIPT

Nina Wernecke Advisor: Dr Andrew Campbell
GEOL394
May 1, 2009

Page | 2
ABSTRACT: Magnesium silicate perovskite is a lower mantle mineral which can accept the substitution of ferric and ferrous iron in its structure. These substitutions can change the mineral’s physical and chemical properties. Investigating how the color mineral changes between the ferric and ferrous end members of magnesium silicate perovskite can lead to indications of how the mineral transfers radiative energy through the crystal lattice. A diamond anvil cell is the method of analysis used to investigate the colors and discover the relationship between various compositions of magnesium silicate perovskite. To compensate for the color of each sample being influenced by thickness, there are multiple measurements made on each sample and then these spectra are normalized to one wavelength. This is used to make error bars that show the accuracy and reproducibility of the results between each sample. The end result of comparing different compositions as Fe3+/Fetotal over various wavelengths shows that the relationship is not linear and is complicated. The changes in color between various compositions of magnesium silicate perovskite influence how the mineral composition loses energy by glowing; or radiative conductivity. Radiative conductivity of the various compositions of magnesium silicate perovskite increases as temperature increases.
Page | 3
TABLE OF CONTENTS: Introduction Hypotheses Methods of Analysis Presentation of Data Analysis of Uncertainty Discussion of Results Suggestions for Future Work Conclusions Acknowledgements Bibliography Index A: Tables of Data and Photos of Sample Synthesis Index B: Graphs of Results Section
Page | 4
INTRODUCTION: Magnesium silicate perovskite [(Mg,Fe)SiO3] is the most abundant mineral in the lower
mantle (Fiquet et al., 2008). Other minerals in the lower mantle include ferropericlase [(Mg,Fe)O] and calcium silicate perovskite [CaSiO3]. The lower mantle is at depths of 660-2890 km and pressures of 24-136 GPa. The boundary between the lower mantle and the upper mantle is identified by the seismic wave variations. The seismic variations are caused by the change in the mineral assemblages of the lower mantle. Olivine, [(Mg,Fe)2SiO4], the most abundant mineral in the upper mantle, goes through a series of phase transition with increasing depth, yielding magnesium silicate perovskite and ferropericlase in the lower mantle. Minerals in the lower mantle have a different crystal structure in comparison to upper mantle minerals. Lower mantle minerals are under greater pressures so the crystal lattice is changed to be more compact and have higher coordination numbers in comparison to upper mantle minerals (Prewitt et al., 1998).
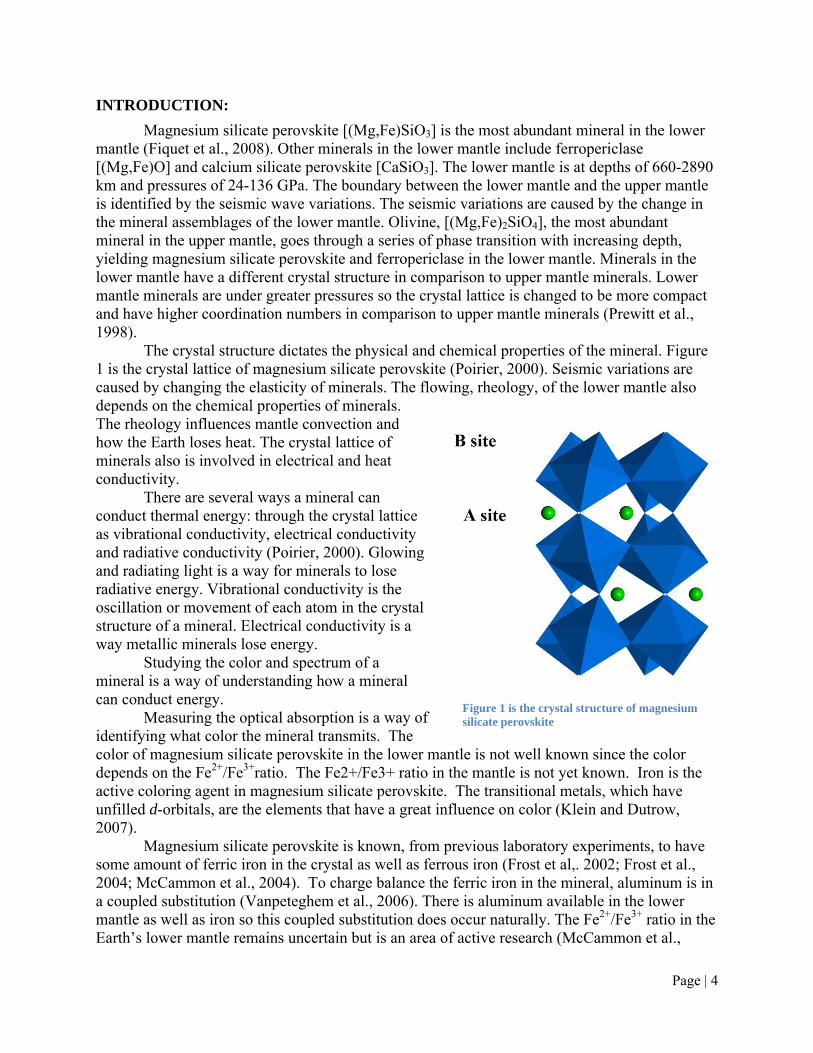
The crystal structure dictates the physical and chemical properties of the mineral. Figure 1 is the crystal lattice of magnesium silicate perovskite (Poirier, 2000). Seismic variations are caused by changing the elasticity of minerals. The flowing, rheology, of the lower mantle also depends on the chemical properties of minerals. The rheology influences mantle convection and how the Earth loses heat. The crystal lattice of minerals also is involved in electrical and heat conductivity.
There are several ways a mineral can conduct thermal energy: through the crystal lattice as vibrational conductivity, electrical conductivity and radiative conductivity (Poirier, 2000). Glowing and radiating light is a way for minerals to lose radiative energy. Vibrational conductivity is the oscillation or movement of each atom in the crystal structure of a mineral. Electrical conductivity is a way metallic minerals lose energy.
Studying the color and spectrum of a mineral is a way of understanding how a mineral can conduct energy.
Measuring the optical absorption is a way of identifying what color the mineral transmits. The color of magnesium silicate perovskite in the lower mantle is not well known since the color depends on the Fe2+/Fe3+ratio. The Fe2+/Fe3+ ratio in the mantle is not yet known. Iron is the active coloring agent in magnesium silicate perovskite. The transitional metals, which have unfilled d-orbitals, are the elements that have a great influence on color (Klein and Dutrow, 2007).
Magnesium silicate perovskite is known, from previous laboratory experiments, to have some amount of ferric iron in the crystal as well as ferrous iron (Frost et al,. 2002; Frost et al., 2004; McCammon et al., 2004). To charge balance the ferric iron in the mineral, aluminum is in a coupled substitution (Vanpeteghem et al., 2006). There is aluminum available in the lower mantle as well as iron so this coupled substitution does occur naturally. The Fe2+/Fe3+ ratio in the Earth’s lower mantle remains uncertain but is an area of active research (McCammon et al.,
Figure 1 is the crystal structure of magnesium silicate perovskite

Page | 5
2004a, 2004b). Aluminum is substituted for silicon in the B site shown in Figure 1, and ferric iron moves into the 8 to 12 coordination A site, which can be symbolized as: [Al3+][Fe3+]↔[Si4+][Fe2+]. This coupled substitution controls the elastic, chemical, rheological and optical properties of perovskite. The mineral properties change depends on how much ferric iron versus ferrous iron is present (McCammon et al., 2003).
The optical properties of (Mg,Fe2+)SiO3 are known from the work of Keppler et al. 2004, and the effects of high pressure on this composition has been recently studied by Goncharov et al. 2008. The light wavelength versus absorbance graph is shown in Figure 2. The optical properties of ferric iron in perovskite, (Mg,Fe3+)(Si,Al)O3, are not known. This study examines the optical properties of both ferric and ferrous iron substitution in magnesium silicate perovskite to evaluate the difference in optical properties. This study address two questions: Does ferric iron cause silicate perovskite to have different optical properties in comparison to ferrous iron? and What is the effect of mixed valences of iron on the optical properties of magnesium silicate perovskite? Hypotheses:
1. Substituting Fe2+ with Fe3+ in the A site of magnesium silicate perovskite will causes optical absorption spectrum to change.
2. Optical absorption will vary linearly with the change in Fe3+/Fetotal. METHODS OF ANALYSIS: The color of the mineral magnesium silicate perovskite is important in the understanding the properties of the lower mantle. The diamond anvil cell method of analysis was used for investigating how the color changes with varying amounts of ferric and ferrous iron contained in the mineral. All mineral samples were synthesized in a laser heated diamond anvil cell from powders. Even though the powders were under high pressure, the powders need heat to form a mineral. Optical absorption properties were measured using a spectrograph. The two end members, one having all ferrous iron and the other having all ferric iron, are described in the formula:
1. (1-y) MgO + y Fe(1-x)O + xy Fe0 + SiO2 ↔ (Mg(1-y)Fey2+)SiO3
2. (1-y) MgO + y/2 Fe2O3 + y/2 Al2O3 + (1-y) SiO2 ↔ (Mg(1-y) Fey3+)(Si(1-y) Aly)O3
The powders used were MgO, FeO, Fe0, SiO2, Fe2O3, and Al2O3. The scale used has an error of approximately ±0.00002g. Each powder was scooped out of the container with a spatula and placed on to a weight scale. Every powder was weighted out in proportion according to the above subscripts of the two listed formulas. The powders are mixed together by an agate mortar
Figure 2 is a spectrum of polycrystalline Mg.0.94Fe0.06SiO3 from Keppler et al. (1994).
Page | 6
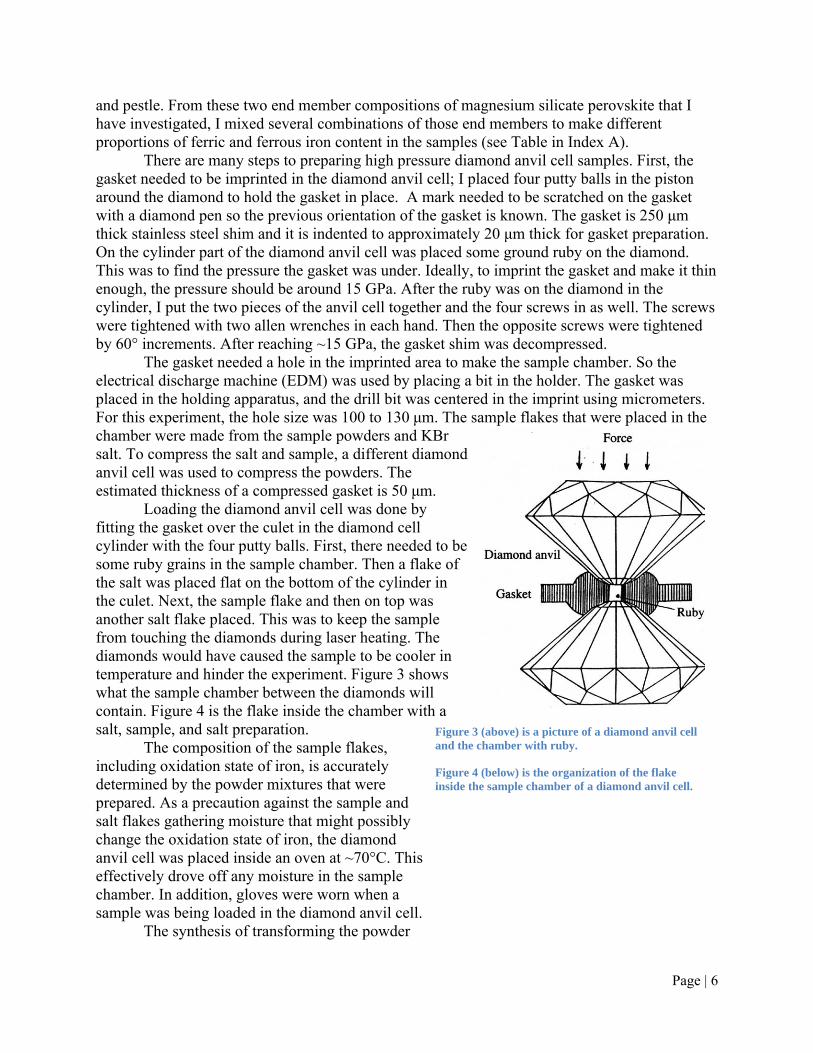
and pestle. From these two end member compositions of magnesium silicate perovskite that I have investigated, I mixed several combinations of those end members to make different proportions of ferric and ferrous iron content in the samples (see Table in Index A). There are many steps to preparing high pressure diamond anvil cell samples. First, the gasket needed to be imprinted in the diamond anvil cell; I placed four putty balls in the piston around the diamond to hold the gasket in place. A mark needed to be scratched on the gasket with a diamond pen so the previous orientation of the gasket is known. The gasket is 250 μm thick stainless steel shim and it is indented to approximately 20 μm thick for gasket preparation. On the cylinder part of the diamond anvil cell was placed some ground ruby on the diamond. This was to find the pressure the gasket was under. Ideally, to imprint the gasket and make it thin enough, the pressure should be around 15 GPa. After the ruby was on the diamond in the cylinder, I put the two pieces of the anvil cell together and the four screws in as well. The screws were tightened with two allen wrenches in each hand. Then the opposite screws were tightened by 60° increments. After reaching ~15 GPa, the gasket shim was decompressed. The gasket needed a hole in the imprinted area to make the sample chamber. So the electrical discharge machine (EDM) was used by placing a bit in the holder. The gasket was placed in the holding apparatus, and the drill bit was centered in the imprint using micrometers. For this experiment, the hole size was 100 to 130 μm. The sample flakes that were placed in the chamber were made from the sample powders and KBr salt. To compress the salt and sample, a different diamond anvil cell was used to compress the powders. The estimated thickness of a compressed gasket is 50 μm. Loading the diamond anvil cell was done by fitting the gasket over the culet in the diamond cell cylinder with the four putty balls. First, there needed to be some ruby grains in the sample chamber. Then a flake of the salt was placed flat on the bottom of the cylinder in the culet. Next, the sample flake and then on top was another salt flake placed. This was to keep the sample from touching the diamonds during laser heating. The diamonds would have caused the sample to be cooler in temperature and hinder the experiment. Figure 3 shows what the sample chamber between the diamonds will contain. Figure 4 is the flake inside the chamber with a salt, sample, and salt preparation. The composition of the sample flakes, including oxidation state of iron, is accurately determined by the powder mixtures that were prepared. As a precaution against the sample and salt flakes gathering moisture that might possibly change the oxidation state of iron, the diamond anvil cell was placed inside an oven at ~70°C. This effectively drove off any moisture in the sample chamber. In addition, gloves were worn when a sample was being loaded in the diamond anvil cell. The synthesis of transforming the powder
Figure 3 (above) is a picture of a diamond anvil cell and the chamber with ruby.
Figure 4 (below) is the organization of the flake inside the sample chamber of a diamond anvil cell.

Page | 7
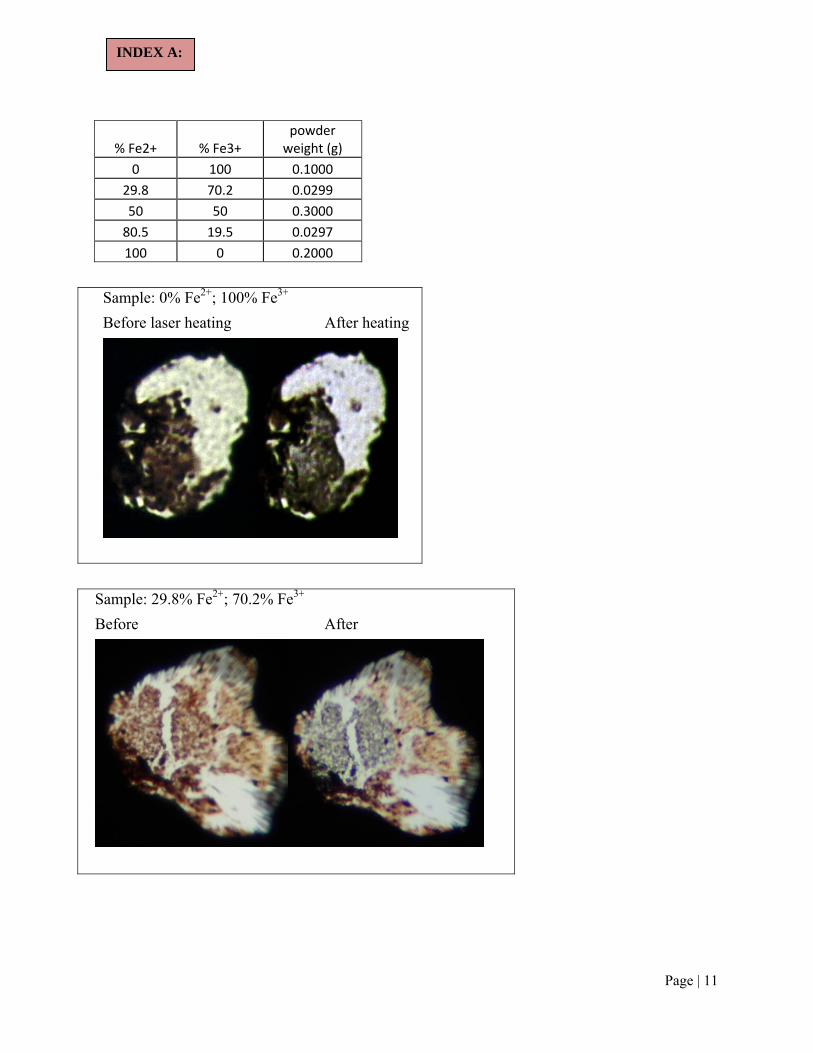
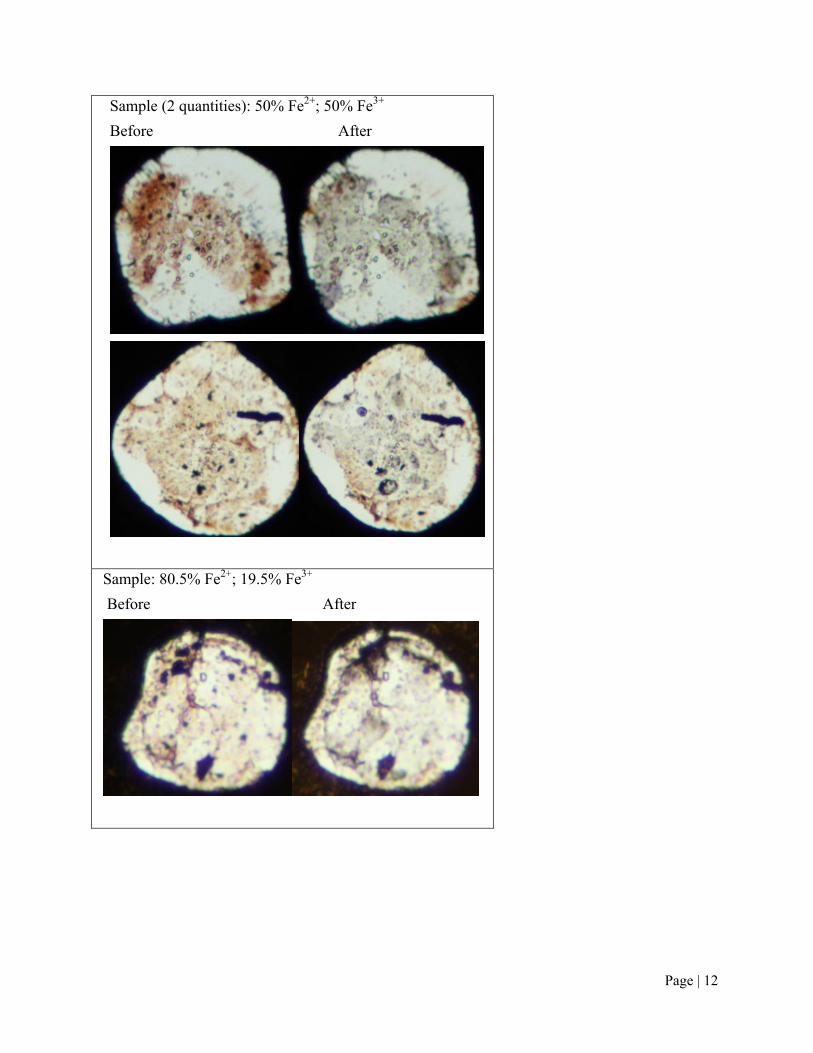
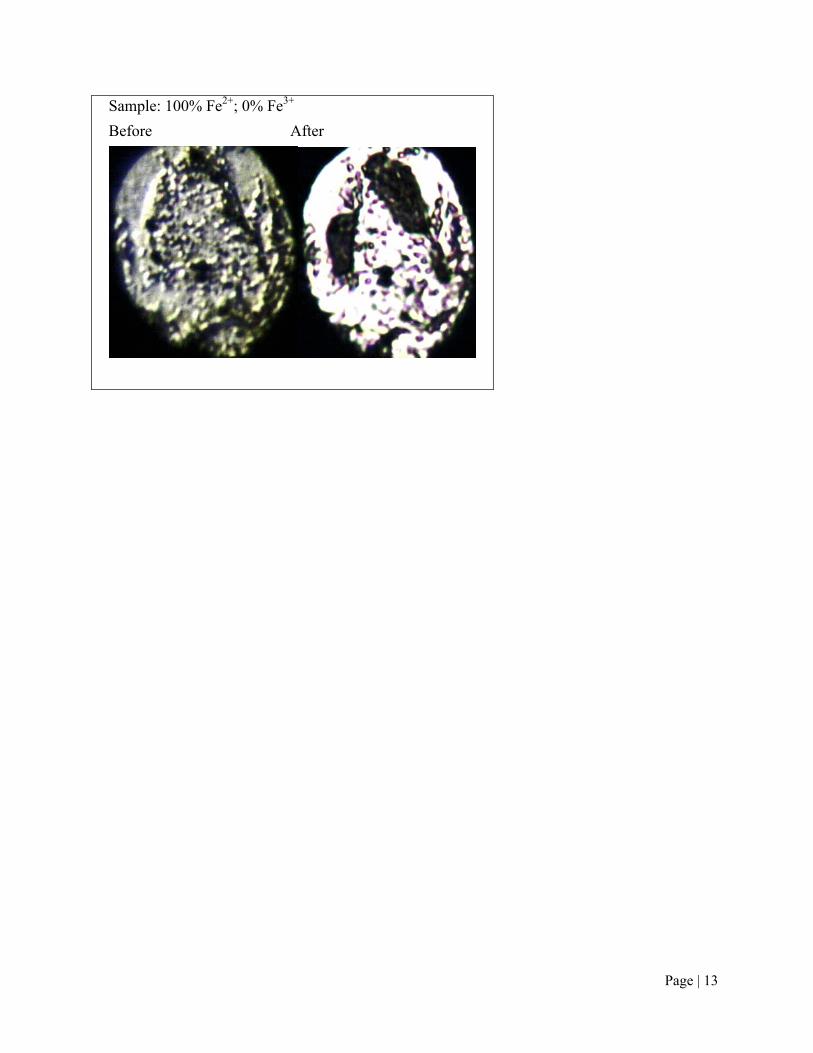
into the mineral was done by laser heating using a Class 4 1064 nm fiber laser. This laser beam was scanned around the sample inside the chamber for the heating of the powder in to the mineral phase. The temperature of synthesis was ~1800K. The phase inside the sample chamber was under ~30 GPa. The measurements of mineral color were analyzed at room temperature. Each optical absorption spectrum was determined by analyzing the unpolarized white light that was transmitted through the diamond anvil cell and measured with a 400 nm to 1400 nm spectrograph. There were several varying compositions made by mixing the two end member compositions. To analyze and minimize the error, there will be several laser heated spots on the powder on each sample in the diamond anvil cell. For each sample in the diamond anvil cell the variation in optical absorbance spectra from different laser heated spots will indicate the range in error. The color spectrum will also be an average of the several laser heated spots. To normalize these data, the background light will be subtracted and the sample’s spectrum will be normalized to the spectrum from the transparent KBr medium. When the color spectrum is collected, the crystal orientations of the polycrystalline mineral are all random so the average of the color is what the data will show. PRESENTATION OF DATA: The color, or optical absorption, spectra of multiple compositions of magnesium silicate perovskite are different. When the end members of magnesium silicate perovskite are laser heated, the (Mg,Fe3+)(Si,Al)O3 end member is grey in color and the starting powder of this composition is red. The end member: (Mg,Fe2+)SiO3 is a brown color when laser heated and has a starting composition powder color of grey. Index A contains pictures of before and after the laser heating of all the samples. Absorption is a dimentionless quantity of how much light is absorbed or taken in by the mineral. A higher amount of absorption by a mineral indicates the mineral is dark and a lower amount of absorption indicates a lighter color mineral. The grey ferrous magnesium silicate perovskite end member therefore has a lower absorbance than the brown ferric magnesium silicate perovskite. Each perovskite has a different compositon and has a unique color it. But the color of the mineral also is effected by the thickness. A different way to look at the optical absorption without the influence of thickness is to divide all wavelengths by a certain value. The effect of thickness on the absorption coefficient is described by the Beer-Lambert Law which is
. Absorbance (Ad) is different from the absorption coefficient (A) and is derived from Beer-Lambert Law which is given by: . This is absorption times the thickness equals
the natural log of incident light (I0) divided by transmitted light (It). Figure 5 shows all the spectra values divided by the spectra value at 900 nm. This will make all the spectra for each composition equal to 1 at 900 nm. The y-axis is the absorption coefficient. This is a clearer view of how the intermediate compositions’ colors are without thickness influencing data analysis. Figure 6 is a graph that describes how the absorbance changes over wavelengths as the composition of magnesium silicate perovskite increases in ferric iron. These absorbance values are again divided by the value at 900 nm to deal with the problem of thickness influencing color. ANALYSIS OF UNCERTAINTY:
Page | 8
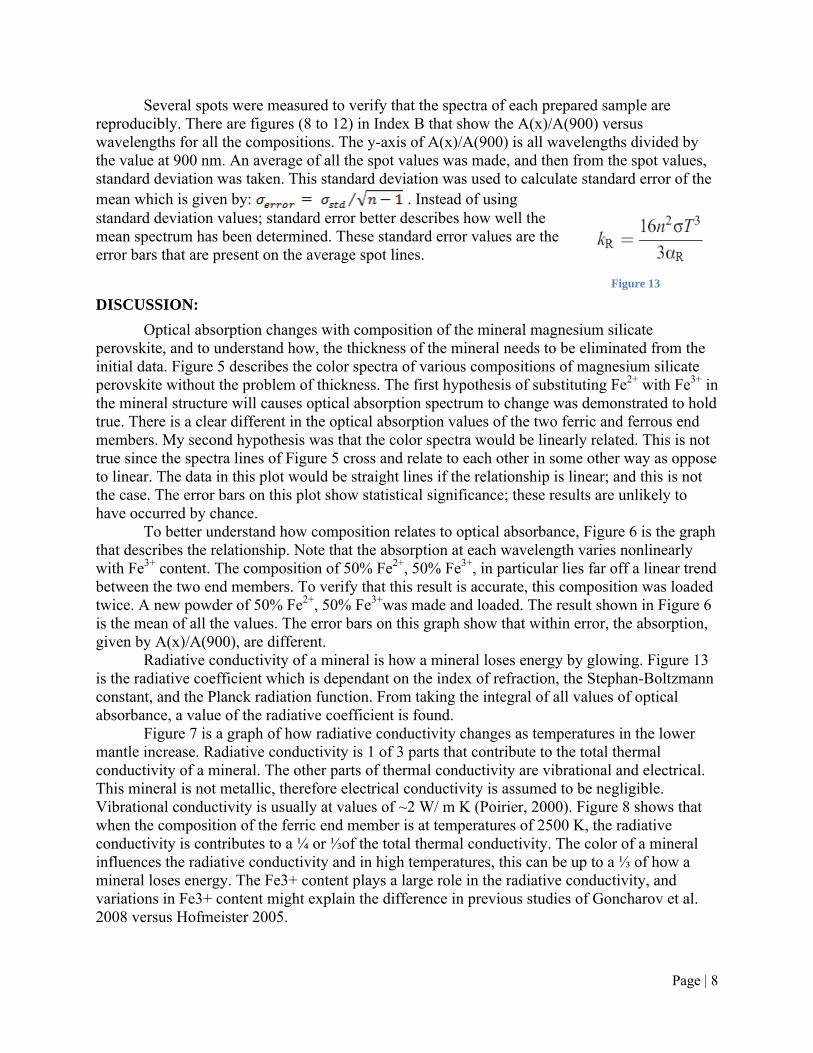
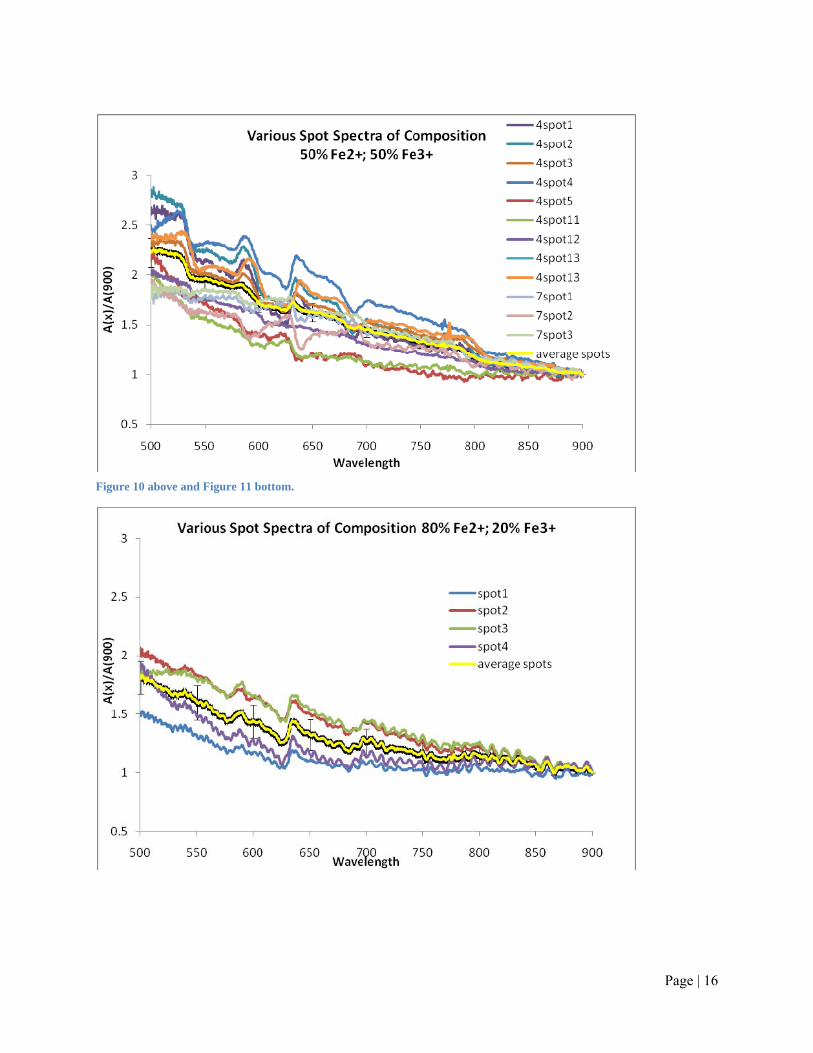
Several spots were measured to verify that the spectra of each prepared sample are reproducibly. There are figures (8 to 12) in Index B that show the A(x)/A(900) versus wavelengths for all the compositions. The y-axis of A(x)/A(900) is all wavelengths divided by the value at 900 nm. An average of all the spot values was made, and then from the spot values, standard deviation was taken. This standard deviation was used to calculate standard error of the mean which is given by: . Instead of using standard deviation values; standard error better describes how well the mean spectrum has been determined. These standard error values are the error bars that are present on the average spot lines. DISCUSSION: Optical absorption changes with composition of the mineral magnesium silicate perovskite, and to understand how, the thickness of the mineral needs to be eliminated from the initial data. Figure 5 describes the color spectra of various compositions of magnesium silicate perovskite without the problem of thickness. The first hypothesis of substituting Fe2+ with Fe3+ in the mineral structure will causes optical absorption spectrum to change was demonstrated to hold true. There is a clear different in the optical absorption values of the two ferric and ferrous end members. My second hypothesis was that the color spectra would be linearly related. This is not true since the spectra lines of Figure 5 cross and relate to each other in some other way as oppose to linear. The data in this plot would be straight lines if the relationship is linear; and this is not the case. The error bars on this plot show statistical significance; these results are unlikely to have occurred by chance. To better understand how composition relates to optical absorbance, Figure 6 is the graph that describes the relationship. Note that the absorption at each wavelength varies nonlinearly with Fe3+ content. The composition of 50% Fe2+, 50% Fe3+, in particular lies far off a linear trend between the two end members. To verify that this result is accurate, this composition was loaded twice. A new powder of 50% Fe2+, 50% Fe3+was made and loaded. The result shown in Figure 6 is the mean of all the values. The error bars on this graph show that within error, the absorption, given by A(x)/A(900), are different. Radiative conductivity of a mineral is how a mineral loses energy by glowing. Figure 13 is the radiative coefficient which is dependant on the index of refraction, the Stephan-Boltzmann constant, and the Planck radiation function. From taking the integral of all values of optical absorbance, a value of the radiative coefficient is found. Figure 7 is a graph of how radiative conductivity changes as temperatures in the lower mantle increase. Radiative conductivity is 1 of 3 parts that contribute to the total thermal conductivity of a mineral. The other parts of thermal conductivity are vibrational and electrical. This mineral is not metallic, therefore electrical conductivity is assumed to be negligible. Vibrational conductivity is usually at values of ~2 W/ m K (Poirier, 2000). Figure 8 shows that when the composition of the ferric end member is at temperatures of 2500 K, the radiative conductivity is contributes to a ¼ or ⅓of the total thermal conductivity. The color of a mineral influences the radiative conductivity and in high temperatures, this can be up to a ⅓ of how a mineral loses energy. The Fe3+ content plays a large role in the radiative conductivity, and variations in Fe3+ content might explain the difference in previous studies of Goncharov et al. 2008 versus Hofmeister 2005.
Figure 13

Page | 9
SUGGESTIONS FOR FUTURE WORK: There is future work in the area of investigating how the composition on a mineral changes its properties. Finding how varying pressures change radiative conductivity values is useful in understanding how a lower mantle mineral transfers energy. CONCLUSIONS: There is substitution of ferric and ferrous iron in the mineral magnesium silicate perovskite. To find out how the substitution changes the optical properties of the mineral, specifically how the optical absorption changes, the spectra is gathered from multiple compositions of magnesium silicate perovskite. Because the spectra of the various compositions of magnesium silicate perovskite are not related linearly, the relationship between the substitution of Fe3+for Fe2+ is complicatedly correlated. There is a clear difference between the Fe2+ and Fe3+ end members, but for intermediate compositions that have mixed valence states, the relationship between optical absorption and composition was not linear as hypothesized. Radiative conductivity calculations show that at high temperatures, glowing contributes up to a ⅓ of how magnesium silicate perovskite. The optical absorption or color of a mineral changes the radiative conductivity values. Understanding the radiative conductivity of magnesium silicate perovskite gives more information on the properties of this mineral. Insight on these properties provides more information on the lower mantle. Minerals in the lower mantle cannot be sampled, so lab work is essential for comprehending the phases of the lower mantle. ACKNOWLEDGEMENTS: Thank you to Dr. Campbell for advising this project, answering many emails, providing delicious Girl Scout cookies and making this a successful senior thesis. Thank you to Noah Miller for answering many questions on lab work in the Laboratory for Mineral Physics. Thank you to Greg Shofner for giving moral support on loading samples in to diamond anvil cells. BIBLIOGRAPHY: Bina, C.R., Lower mantle mineralogy and the geophysical perspective, Reviews in Mineralogy,
vol. 37 (1998), p. 205-233. Fiquet, G., Guyot, F., Badro, J., The Earth’s Lower Mantle and Core, Elements vol. 4 (2008) p.
177-182 Frost, D.J., Llebsske, C., The eject of Al2O3 on Fe/Mg partitioning between magnesiowusite and
magnesium silicate perovskite, Earth and Planetary Science Letters, vol. 199 (2002) p. 227-241.
Frost, D.J., Llebsske, C., Langenhorst, F., Experimental evidence for the existence of iron-rich metal in the Earth’s lower mantle, Nature, vol. 428 (2004) p. 409-411.
Goncharov, A.F., Haugen, B.D., Struzhkin, V.V., Beck, P., Jacobsen, S.D.,Radiative conductivity in the Earth’s lower mantle, Nature, vol.456 (2008) p. 231-234.
Page | 10
Hofmeister, A.M., Dependence of diffusive radiative transfer on grain-size, temperature, and Fe-content: Implications for mantle processes, Journal of Geodynamics, vol. 40 (2005), p. 51-72.
Keppler, H., McCammon, C.A., Rubie, D.C., Crystal-field and charge-transfer spectra of (Mg,Fe) SiO3 perovskite, American Mineralogist, vol. 79 (1994) p. 1215-1218.
Keppler, H. Dubrovinsky, L.S., Narygina, O., Kantor, I., Optical Absorption and Radiative Thermal Conductivity of Silicate Perovskite to 125 i, Science, vol. 322 (2008) p. 1529-1532.
Klein, C., Dutrow, B., (2007). Manual of Mineral Science. John Wiley & Sons, Inc. McCammon, C.A., Ross, N.L., Crystal chemistry of ferric iron in (Mg,Fe)(Si,Al)O3 majorite
with implications for the transition zone, Phys Chem Minerals vol. 30 (2003) p. 206-216. McCammon, C.A., Lauterbach, S., Seifert, F., Langenhorst F., Van Aken, P.A., Iron oxidation
state in the lower mantle mineral assemblages: I. Empirical relations derived from high-pressure experiments, Earth and Planetary Science Letters, vol. 222 (2004a) p.435-449.
McCammon, C.A., Stachel, T., Harris, J.W., Iron oxidation state in lower mantle mineral assemblages: II. Inclusions in diamonds from Kankan, Guinea, Earth and Planetary Science Letters, vol. 222 (2004b) p.423-434.
Poirier, J.P., (2000). Introduction to the Physics of the Earth’s Interior. Cambridge University Press.
Prewitt, C.T., Downs, R.T., High-Pressure Crystal Chemistry, Ultrahigh-pressure mineralogy, Reviews in Mineralogy, vol. 37 (1998) p. 284-317.
Vanpeteghem, C.B., Angel, R.J., Ross, N.L., Al, Fe substitution in the MgSiO3 perovskite structure: A single-crystal X-ray diffraction study, Physics of the Earth and Planetary Interiors vol. 155 (2006) p. 96-103.
Figure Credit: Figure 3 taken from http://www.earth.northwestern.edu/research/jacobsen/ by S.D. Jacobsen.
Page | 11
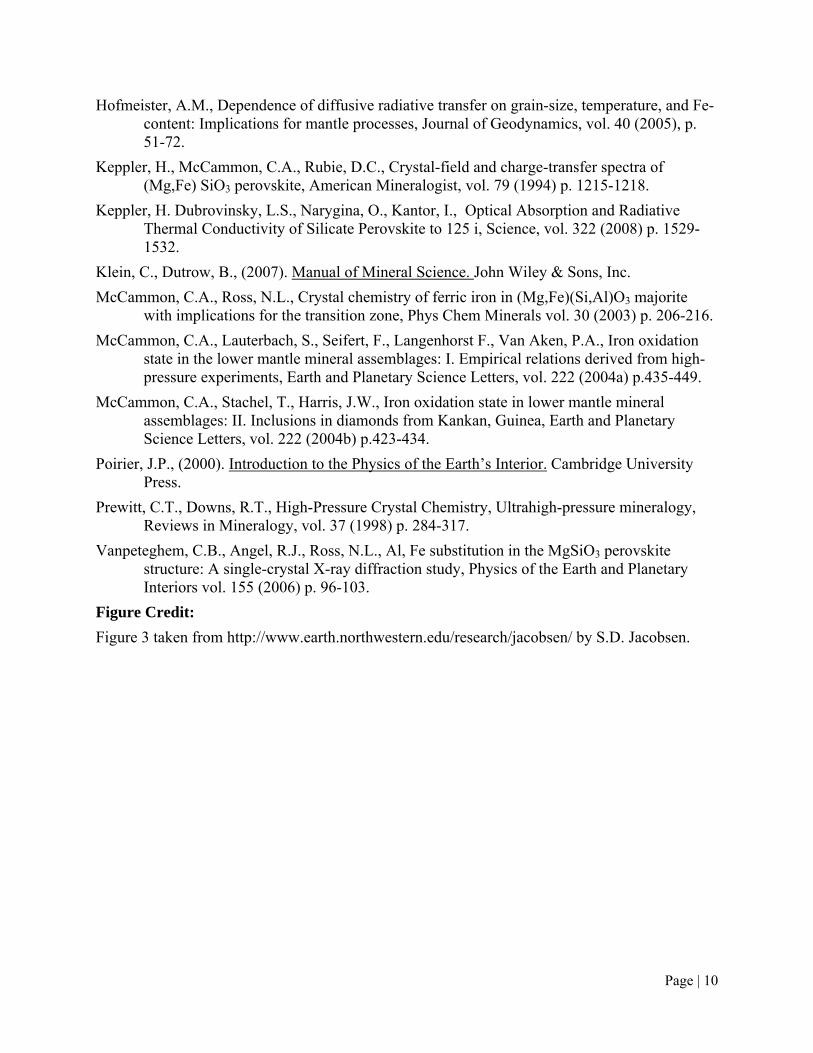
% Fe2+ % Fe3+ powder weight (g)
0 100 0.1000 29.8 70.2 0.0299 50 50 0.3000 80.5 19.5 0.0297 100 0 0.2000
Sample: 0% Fe2+; 100% Fe3+
Before laser heating After heating
Sample: 29.8% Fe2+; 70.2% Fe3+
Before After
INDEX A:
Page | 12
Sample (2 quantities): 50% Fe2+; 50% Fe3+
Before After
Sample: 80.5% Fe2+; 19.5% Fe3+
Before After
Page | 13
Sample: 100% Fe2+; 0% Fe3+
Before After

Page | 14
Figure 5 is located just below. Figure 6 is in the middle. Figure 7 is at the very bottom.
INDEX B:

Page | 15
Figure 8 above and Figure 9 below.
Page | 16
Figure 10 above and Figure 11 bottom.

Page | 17
Figure 12 below.