nina holmengen og marte o. kittilsen - ssb.no · reports 2009/14 nina holmengen og marte o....
TRANSCRIPT
Reports 2009/14
Nina Holmengen og Marte O. Kittilsen
Estimating emissions of NMVOC from solvent and other product use
Revised model
Statistisk sentralbyrå • Statistics NorwayOslo–Kongsvinger

This series contains statistical analyses and method and model descriptions from the different research and statistics areas. Results of various single surveys are also published here, usually with supplementary comments and analyses.
Reports
Symbols in tables SymbolCategory not applicable .Data not available ..Data not yet available …Not for publication :Nil -Less than 0.5 of unit employed 0Less than 0.05 of unit employed 0.0Provisional or preliminary figure *Break in the homogeneity of a vertical series
—
Break in the homogeneity of a horizontal series
|
© Statistics Norway, April 2009 When using material from this publication, Stastistics Norway shall be quoted as the source. ISBN 978-82-537-7567-8 Printed version ISBN 978-82-537-7568-5 Electronic version ISSN 0806-2056 Subject: 01.04.10 Print: Statistics Norway
Decimal punctuation mark .

Reports 2009/14 Estimating emissions of NMVOC from solvent and other product use
Statistisk sentralbyrå 3
Abstract This report is the end product of a project revising the Norwegian emission calculations of NMVOCs1 from the use of solvents and other products. The development of a new emission model started in 2007, and the results will be used for reporting from the year 2008. According to international emission reporting guidelines, emissions shall be recalculated if new information about emission factors or improved calculation methods is available. The emissions of NMVOC from solvents and other product use were previously calculated using data on import, export and production of solvent-containing substances. The previous solvent balance was developed in 1995, and by the year 2000 the method was considered obsolete. It was thus decided to keep the emission estimates at the year 2000 level until a revised method was developed. A replacement of the solvent balance was due because the assumptions about solvent content and the emission factors were out of date. The new model uses a new data source, namely the Norwegian Product Register. The data includes information on a substance level of the product type in which the substance enters into and the industrial sector in which the product is used (including private households). Because the data are given on a substance level, no assumptions about solvent content must be made. A list of substances satisfying the NMVOC criteria has been developed as part of the project, and these substances form the basis for the data selection from the Product Register. The emission of NMVOCs to air is calculated by multiplying the amount consumed of an NMVOC by an emission factor. The consumption is expressed as the sum of production and import, minus export, declared to the Product Register. The emission factor represents the fraction of the substance emitted to air, and takes into account if a substance is incorporated in another product, transformed into a new compound, or handled in some other way (e.g. as waste). The fraction of an NMVOC emitted is dependent both on the type of product used and the industrial sector (including private households) in which it is used. The emission factors are specific for the combination of product type and industrial sector (including private households), and are mainly gathered from two Swedish reports. The total NMVOC emissions in Norway was 199 000 tonnes in 2007, of which NMVOC emissions from solvent and other product constituted 48 570 tonnes. The use of solvents and other products was thus responsible for about 25 per cent of the total emissions. The lion’s share of the emissions from solvents and other product use took place within the NFR2/CRF3 category “Other”, which is NMVOC emissions from sources other than paint application, degreasing and dry cleaning and manufacture and processing of chemical products. The new solvent model makes it possible to study emissions of NMVOC at a detailed level. The substance with the highest emissions in 2007 is ethanol, followed by hydrodesulfurized heavy naphta and ethylene glycol. Emissions were highest within construction, households, and sale, maintenance and repair of motor vehicles and motorcycles and retail sale of automotive fuel. The product types leading to the largest emissions of NMVOC were biocides, cleaning agents and degreasers, paint and varnish, and solvents. International reporting requires the time series of NMOVC emissions to be consistent from 1989. The Product Register data were only deemed of sufficient
1 Non-Methane Volatile Organic Compounds 2 Reporting format in which emissions are reported to the Convention on Long-Range Transboundary Air Pollution (Gothenburg protocol) 3 Reporting format in which emissions are reported to the UNFCCC according to the Kyoto protocol

Estimating emissions of NMVOC from solvent and other product use Reports 2009/14
4 Statistisk sentralbyrå
quality from the year 2005, however, and the time series from the previous solvent balance was thus adjusted in order to obtain as much consistency as possible in the time series. This resulted in an elevation of emission estimates of between 3 500 to 5 500 tonnes per year for the years 1989 to 2004.
Conclusion The new calculation method for emissions of NMVOC from solvents and other product use covers a wide range of substances and a wide range of industrial sectors and product types at a much more detailed level than the previous solvent balance. The coverage is deemed to be better for the new than for the previous model, and sufficient for reporting requirements. In addition, the new model makes no assumptions about solvent content in products, as the calculations are based on amounts of the substances deemed to be NMVOC. The new model is thus more accurate than the previous model. Acknowledgements: This work was carried out in cooperation with Mette Follestad (the Norwegian Product Register), Jan Kraft (the Norwegian Product Register) and Kathrine Loe Hansen (Statistics Norway). The uncertainty analysis was performed by Marie Lillehammer (Statistics Norway). The project received financial support from the Norwegian Pollution Control Authority (SFT). Eilev Gjerald and Hans Kolshus at the Norwegian Pollution Control Authority made important consultative contributions during the work process.

Reports 2009/14 Estimating emissions of NMVOC from solvent and other product use
Statistisk sentralbyrå 5
Sammendrag Denne rapporten er sluttproduktet fra et prosjekt som hadde som mål å revidere beregningene av utslipp av NMVOC4 fra bruk av løsemidler og andre produkter. Utviklingen av den nye modellen startet i 2007, og resultatene vil bli brukt i rapportering fra og med 2008. Ifølge internasjonale retningslinjer for rapportering av utslipp skal utslipps-estimatene rekalkuleres dersom man får ny informasjon om utslippsfaktorer eller hvis bedre beregningsmetoder foreligger. Utslippene av NMVOC fra bruk av løsemidler og andre produkter ble tidligere beregnet ved hjelp av import-, eksport- og produksjonsdata for løsemiddelholdige produkter. Den forrige løsemiddel-balansen ble utviklet i 1995, og i år 2000 ble metoden ansett for å være utdatert. Det ble derfor besluttet å holde utslippsestimatene på 2000-nivå inntil revidert beregningsmodell var på plass. En utskifting av løsemiddelbalansen var nødvendig fordi antagelsene om løsemiddelinnholdet i produkter og utslippsfaktorene ikke lenger var av tilstrekkelig god kvalitet. Den nye modellen henter data fra en ny datakilde; Produktregisteret. Dataene inneholder informasjon på stoffnivå om produkttypen hvor stoffet inngår og den industrielle sektoren (inkludert private husholdninger) hvor produktet blir brukt. Fordi informasjonen blir gitt på stoffnivå, er det ikke nødvendig med antagelser angående løsemiddelinnhold i produkter. En liste over stoffer som tilfredsstiller kriteriene for NMVOC har blitt utviklet som en del av prosjektet, og disse stoffene danner basisen for utvelgelsen av aktuelle stoffer i Produktregisteret. Utslipp av NMVOC til luft er beregnet ved å multiplisere forbruksmengden av et stoff med en utslippsfaktor. Stoffmengden brukt er summen av produksjon og import minus eksport, i henhold til deklarasjoner til Produktregisteret. Utslipps-faktoren er den andelen av stoffmengden som slippes ut, og tar høyde for at en andel kan inngå i nye produkter, omdannes til andre stoffer eller håndteres på en måte som forhindrer utslipp (f.eks. avfallshåndtering). Andelen av et stoff som slippes ut antas å avhenge av både typen produkt stoffet inngår i og i hvilken næring (private husholdninger inkludert) produktet brukes. Utslippsfaktorene er både produkt- og næringsspesifikke, og er hovedsakelig hentet fra to svenske studier. De totale utslippene av NMVOC i Norge i 2007 ble beregnet til å være 199 000 tonn, hvorav utslippene av NMVOC fra løsemidler og andre produkter stod for 48 570 tonn. Utslipp fra løsemidler og andre produkter står dermed for om lag 25 prosent av de total NMVOC-utslippene. Brorparten av utslippene fra bruk av løse-midler og andre produkter plasseres i NFR5/CRF6-kategorien ”Andre”, som er NMVOC-utslipp fra andre kilder enn bruk av maling, avfetting og renserivirk-somhet og fremstilling og foredling av kjemiske produkter. Den nye løsemiddelmodellen gjør det mulig å studere utslippene av NMVOC på et detaljert nivå. Etanol var det stoffet som hadde de høyeste utslippene i 2007, fulgt av nafta (tung, avsvovlet) og etylenglykol. Næringene som stod for de største utslippene var bygge- og anleggsvirksomhet, private husholdninger og allmenn-heten, vedlikehold og reparasjon av motorkjøretøyer og motorsykler og detalj-handel av drivstoff. Produkttypene med de største utslippene av NMVOC var biocider, rengjøringsmidler og avfettingsmidler, maling og lakk og løsemidler.
4 Flyktige organiske forbindelser untatt metan 5 Rapporteringsformat benyttet til rapportering til konvensjonen for langtransporterte luftforurensninger (Gøteborgprotokollen) 6 Rapporteringsformat benyttet til rapportering FN i forbindelse med Kyotoavtalen

Estimating emissions of NMVOC from solvent and other product use Reports 2009/14
6 Statistisk sentralbyrå
Internasjonale rapporteringsretningslinjer krever at tidsserien for utslipp av NMVOC er konsistent fra 1989. Data fra Produktregisteret ble funnet å ha tilstrekkelig kvalitet fra 2005. Tidsserien fra den foregående løsemiddelmodellen ble justert for å oppnå så mye konsistens som mulig i tidsserien. Dette førte til en oppjustering av tidsserien på mellom 3 500 og 5 500 tonn per år i perioden 1989 til 2004.
Konklusjon Den nye beregningsmetoden for utslipp av NMVOC fra bruk av løsemidler og andre produkter dekker et vidt spekter av stoffer, industrielle sektorer og produkt-typer på et mer detaljert nivå enn i den foregående metoden. Dekningsgraden er vurdert til å være bedre for den nye enn for den foregående modellen, og tilstrekke-lig for rapporteringskravene. I tillegg bygger den nye modellen ikke på antagelser om løsemiddelinnhold i produkter fordi beregningen gjøres direkte på deklarerte mengder av stoffer som regnes som NMVOC. Dette gjør den nye modellen mer sikker enn den foregående modellen. Takk til: Dette arbeidet ble gjennomført i samarbeid med Mette Follestad (Produktregisteret), Jan Kraft (Produktregisteret) og Kathrine Loe Hansen (Statistisk sentralbyrå). Usikkerhetsanalysen ble utført av Marie Lillehammer (Statistisk sentralbyrå). Prosjektet har mottatt finansiell støtte fra Statens forurensningtilsyn (SFT). Vi takker Eilev Gjerald og Hans Kolshus ved SFT for viktige faglige innspill under arbeidet.

Reports 2009/14 Estimating emissions of NMVOC from solvent and other product use
Statistisk sentralbyrå 7
Contents Abstract................................................................................................................................. 3 Sammendrag......................................................................................................................... 5 1. Introduction ............................................................................................................. 8 1.1. Environmental effects of NMVOC.............................................................................. 8 1.2. Solvents and reporting requirements......................................................................... 8 1.3. Previous solvent model ............................................................................................. 8 1.4. Objectives of this project ........................................................................................... 9 1.5. Structure of this report............................................................................................... 9 2. Abbreviations and definitions.............................................................................. 10 3. Methodology.......................................................................................................... 11 3.1. Overview ................................................................................................................. 11 3.2. Emission factors ...................................................................................................... 11 3.3. Source allocation..................................................................................................... 13 3.4. Model completeness ............................................................................................... 13 3.5. Methods in other countries ...................................................................................... 14 3.6. Analogy to statistics on use and emissions of hazardous substances .................... 14 3.7. Conversion to CO2 .................................................................................................. 14 3.8. Technical solution.................................................................................................... 14 3.9. Uncertainties ........................................................................................................... 14 4. Activity data........................................................................................................... 17 4.1. Overview ................................................................................................................. 17 4.2. Substance list .......................................................................................................... 17 4.3. Product Register data.............................................................................................. 17 4.4. Possible sources for error relating to the activity data ............................................. 21 4.5. Quality Control (QC)................................................................................................ 22 4.6. Confidentiality.......................................................................................................... 23 4.7. Point sources and side models ............................................................................... 23 4.8. Time series from the previous model (1989-2000) and interpolation 2001-2004 .... 24 5. Results ................................................................................................................... 28 5.1. Emission trends....................................................................................................... 28 5.2. Reported source specific emissions ........................................................................ 29 5.3. Main emission sources 2005-2007.......................................................................... 33 5.4. Uncertainty .............................................................................................................. 38 6. Discussion ............................................................................................................. 39 6.1. Comparison to results from the previous model ...................................................... 39 6.2. Comparison to the results in other countries ........................................................... 40 6.3. Conclusions............................................................................................................. 43 7. Areas of methodological improvement ............................................................... 44 7.1. Solvent balance....................................................................................................... 44 7.2. Other aspects.......................................................................................................... 45 References.......................................................................................................................... 47 Appendix A ......................................................................................................................... 50 Substance- and code lists .................................................................................................... 50 A1: Substances included in this study .................................................................................. 50 A2: Standard Industrial Classification (SIC2002/NACE)....................................................... 56 A3: Use Code Nordic (UCN)................................................................................................. 58 A4: Raw materials (Intermediates) ....................................................................................... 65 A5: CRF and NFR codes in which emissions of NMVOC are reported ................................ 65 A6: NFR source allocation.................................................................................................... 66 A7: Exclusions...................................................................................................................... 71 A8: Emission factors............................................................................................................. 72 Appendix B ......................................................................................................................... 75 Result attachments............................................................................................................... 75 B1: Time series of emissions of NMVOC from solvent and other product use, 1989-2007 .. 75 B2: Substances with the highest NMVOC emissions in 2007............................................... 76 B3: Product type groups with the highest NMVOC emissions in 2007 ................................. 77 B4: Industrial sectors with the highest NMVOC emissions in 2007 ...................................... 77 Contents of figures and tables.......................................................................................... 78

Estimating emissions of NMVOC from solvent and other product use Reports 2009/14
8 Statistisk sentralbyrå
1. Introduction
1.1. Environmental effects of NMVOC While ozone in the stratosphere protects life on Earth from detrimental ultraviolet radiation, ozone at ground level can be harmful to humans, animals and plants. Ground-level ozone can cause respiratory problems, damage vegetation and weaken constructions. At ground level, ozone is formed when nitrogen oxides (NOx) or volatile organic components (VOC) are exposed to sunlight. Although concentrations of ground-level ozone are lower in Norway than in most parts of Europe, pollution episodes where ozone concentrations exceed recommended limit values occur every year, usually in spring and early summer. Furthermore, as carbon dioxide (CO2) is formed when VOC break down in the atmosphere, VOC emissions are considered to be indirect emissions of the greenhouse gas CO2.
1.2. Solvents and reporting requirements The use of solvents is an important source of emissions of non-methane volatile organic components (NMVOC). Solvent use contributes to around 25 per cent of the anthropogenic NMVOC emissions in Europe (European Environment Agency 2007). Solvents include cleaning substances used for e.g. metal degreasing, dry cleaning, printing, ingredients of solvent-containing products like paints, thinners and lacquers, pesticides, glues and adhesives, as well as raw materials for products not containing solvents, such as rubber and plastics. Estimates on emissions of NMVOC from solvent use are included in the national emission inventories that are prepared and submitted to the secretariat of the UNECE-Convention on Long-Range, Transboundary Air Pollution (LRTAP), in order to fulfil national obligations under the Gothenburg-protocol. In addition, NMVOC emissions are included in the National Emission Inventory for green-house gas emissions, set by the United Nations Framework Convention on Climate Change (UNFCCC). In the future, information on NMVOC emissions from diffuse sources will also be included in the reporting to UNECE-Aarhus Convention Protocol on Pollutant Release and Transfer Registers (PRTR) (Economic Commission for Europe 2007). Moreover, there is a desire to make emission inventories comparable to results from the GAINS model developed under the Atmospheric Pollution and Economic Development program at The International Institute for Applied Systems Analysis (IIASA). Reporting follows chapter 6 in the EMEP/CORINAIR Emission Inventory Guidebook 2007 (European Environment Agency 2007), and the revised 2006 Guidelines for National Greenhouse gas Inventories (IPCC 2006a). According to the EMEP/CORINAIR Guidebook, solvents that are inventoried must represent at least 90 % of the NMVOC emissions. NMVOC emissions from solvent use must be allocated to several different source categories (see section 3.3).
1.3. Previous solvent model A model of NMVOC emissions from solvent use was first developed in 1995 (Rypdal 1995). In this model, emissions were calculated using data on solvent-containing products obtained from trade, manufacture and waste statistics. The disadvantage of this model is that its accuracy depends on the validity of certain assumptions that are known to vary over time. Most important are the assumptions regarding the solvent content of products that constitute the input data, and that the emission factors only depend on type of product, not industrial sector of use. Furthermore, allocation to source categories had to be made using surrogate data. Thus, by 2000 some principal model parameters were considered to be outdated, and so updating of the input data for the mass balance was discontinued. Since then, the need for a revised model has become an increasingly dire necessity.
Reports 2009/14 Estimating emissions of NMVOC from solvent and other product use
Statistisk sentralbyrå 9
In addition, calculations were previously done using Excel spreadsheets, which rendered the production process unnecessarily comprehensive and sensitive to manual errors. Recalculations following new information were especially difficult and increasingly so for every year added to the time series.
1.4. Objectives of this project This report is the end product of a revision of the calculations of NMVOC emissions from all solvent source categories in Norway. The main objectives of this project have been to find the best available data source, improve emission factors and construct a model for emission calculations. While the level of detail of the previous model was on the CRF source level, it has been a goal for this project to fascilitate emission reporting on the more detailed NFR source level. The model was to have the following attributes: • Be complete, i.e. fulfilling the requirements of the international guidelines • Register the effects of new legislations and other emissions reducing efforts • Rely on a minimum of assumptions (to maximize robustness) • Be easily updated annually, with a SAS-based technical solution • Give detailed results, comparable to results form e.g. GAINS • Be transparent and consistent The use of solvents and other products may be considered a minor source of emissions in Norway. Even so, considerable effort has been put into improving the emission estimates from this source. The justification for this is that the overall Norwegian emission inventory to a large extent is built on emissions from many small sources, and the quality of the overall inventory is enhanced by improving each of these sources.
1.5. Structure of this report An overview of some of the abbreviations and definitions used in the report is given in chapter 2, followed by a chapter describing the new model, emission factors and uncertainties (chapter 3). Chapter 4 contains information regarding the substances included in this study, the activity data used for estimating the emissions and the recalculation of the time series from the previous model. The resulting time series on use and emission patterns of NMVOC from the use of solvents and other products are presented in chapter 5. Chapter 6 discusses the results, with comparisons to other countries using a similar emission model for solvent use. Chapter 7 focuses on areas for potential methodological improvement.

Estimating emissions of NMVOC from solvent and other product use Reports 2009/14
10 Statistisk sentralbyrå
2. Abbreviations and definitions Non-methane volatile organic compound. The term “volatile organic compound” (VOC) refers to any organic compound having a vapour pressure of 0.01 kPa or more at 293.15 degrees K, or having a corresponding volatility under the particular conditions of use (European Commission 1999). The Greenhouse Gas and Air Pollution Interactions and Synergies (GAINS) model is an analytic tool for assessing co-benefits reduction strategies from air pollution and greenhouse gas sources in Europe. An identification number for substances described in the literature, assigned by Chemical Abstract Services, a division of the American Chemical Society (American Chemical Society 2007). Most CAS numbers refer to individual substances, but some are mixtures, such as petroleum solvents, e.g. naphtha. Use Code Nordic. The Nordic Product Registers’ classification system for products (Product Register 2007). International nomenclature system for industrial classification (industrial sectors). Codes according to Statistics Norway Standard Industrial Classification (Statistics Norway 2002b), based on EU’s international industrial standard NACE Rev.1.1., 2002 update. Common Reporting Format. Category classification in which emissions should be reported under the United Nations Framework Convention on Climate Change (UNFCCC) according to the Kyoto protocol. Nomenclature For Reporting. Category classification in which emissions should be reported under the convention on Long Range Transboundary Air Pollution (LRTAP) according to the Gothenburg protocol.
NMVOC
GAINS
CAS number
UCN
NACE
CRF
NFR

Reports 2009/14 Estimating emissions of NMVOC from solvent and other product use
Statistisk sentralbyrå 11
3. Methodology
3.1. Overview The general model is a simplified version of the detailed methodology described in chapter 6 of the EMEP/CORINAIR Guidebook 2007 (European Environment Agency 2007). It represents a mass balance per substance, where emissions are calculated by multiplying relevant activity data with an emission factor, according to the equation:
consumption = production + import - export emission = consumption x emission factor (fraction emitted) total emission = sum of all emissions
When used in the simplest form, all activities that can lead to or prevent emissions, i.e. waste management, are included in the one emission factor. The general model can be modified so as to integrate various pieces of information on the life cycle of different products. For some products we might have data on the fraction converted into other chemical compounds or the fraction destroyed during waste treatment. This can be expressed through variations of the simple equation, e.g.:
emission = consumption x (1 - (factor1 + factor2 + factor3)) where factor1 is the fraction converted to other chemical compounds, factor2 is the fraction that becomes part of a new product (without being converted) and factor3 is the fraction destroyed during waste management. Some emissions generated by the use of declared products may be delayed, relative to the time of declaration. Firstly, the data from the Product Register contain no information on whether products are used the year of registration or stored for later use (so-called hold up). Therefore it is assumed that all products are used the same year as they are registered. Secondly, the possibility that substances may accumulate in long-lived products is not taken into account. In other words, it is presupposed that all emissions generated by the use of a given product during its lifetime take place in the same year as the product is declared to the Product Register. In sum, this leads to emission estimates that do not fully reflect the actual emissions taking place in a given year. Emissions that in real life are spread out over several years all appear in the emission estimate for the year of registration. However, this systematic overestimation for a given year probably more or less compensates for emissions due to previously accumulated amounts not being included in the estimate figures. Despite data and model limitations, it is believed that the resulting emission estimates are a relatively good indicator of the level and trend in the emissions of NMVOC caused by products use.
3.2. Emission factors Emission factors are specific for combinations of product type and industrial sector. The source of the emission factor values for volatile organic compounds is the Swedish model for estimating NMVOC emissions from solvent and other product use (Skårman et al. 2006). During several studies, Sweden has developed emission factors that take into account different application techniques, abating measures and alternative pathways of release (e.g. waste or water). These country-specific emission factors apply to 12 different industries or activities that correspond to sub-divisions of the four major emission source categories for solvents used in international reporting of air pollution (European Environment Agency 2007).

Estimating emissions of NMVOC from solvent and other product use Reports 2009/14
12 Statistisk sentralbyrå
It was deemed that the factors developed for Sweden are representative for Norwegian conditions, as we at present have no reasons to believe that product types, patterns of use or abatement measures differ significantly between the two countries. However, a few adjustments had to be made: 1. In the Swedish model, a series of industrial sectors are excluded from the
calculations, in order to avoid double counting. As fewer industrial sectors report emissions of NMVOC to the Norwegian inventory, fewer exclusions from the solvent model is necessary. In fact, it is desirable to include as many unreported industrial sectors as possible. It was deemed that the emission factors given for industries included in the Swedish model were representative for similar industries included in the Norwegian model (cf. Appendix A8).
2. The emission factor for ensilage means was set specifically based on expert judgment, as the emission factor given in the Swedish model seemed unsuitable for describing the usage of ensilage in Norway (cf. Appendix A8).
3. The emission factor for anti-freezing agents from the Swedish model was only used for commercial land, water and air transport (NACE 60-62) (value of 0.1, cf. Appendix A8). The radiator in a car is a closed system. However, when anti-freezing agent must be refilled in a private car, this entails that some of it has evaporated or otherwise been emitted. Thus, the emission factor for anti-freezing agents was set higher industrial sectors and private households in the Norwegian model.
4. For each emission source category, two emission factors are applied, one for NMVOCs used as raw materials and one for other uses. Emission factors for raw materials are generally low, since most of the substance will be converted or end up in the product with only small emissions during this process. Products with a high content of the substance will themselves be declared to the product register, thus being included in the activity data and in most cases being assigned a higher emission factor. However, there are two problems concerning the identification of raw material: i. Some products are declared with a product code for raw material, although
they are not used as raw material. This problem is solved by combining the product type codes for raw materials with a list of VOC that are considered “true” raw materials (Fischer et al. 2005) (cf. Appendix A4). Hence, the emission factors for raw materials are only applied to products declared as raw materials when in combination with these substances.
ii. Some products that are used as raw materials are declared as other product types. This second problem was solved by applying the emission factor for raw materials to other product types assumed to be used as raw materials in the industrial sectors “Manufacture of chemicals and chemical products” (NACE 24) and “Manufacture of rubber and plastic products” (NACE 25).
In accordance with the Swedish model, emission factors were set to zero for a few products that are deemed to be completely converted through combustion processes, such as EP-additives (product type E20100), soldering agents (product type group L15), and welding auxiliaries (product type group S75). Quantities that have not been registered to industrial sector or product type are given emission factor 0.95 (maximum). Emission factors may change over time, and such changes may be included in this model. However, all emission factors are constant for the 2005 to 2007 period. A collaboration project between the Nordic countries, sponsored by the Nordic Council of Ministers, took place in 2008 in order to compare and possibly improve the emission factors and source allocations of emissions from solvent use in the Nordic countries (Fauser et al. In prep). This project included a discussion about allocation, and led to improvements in some emission factors in the Norwegian emission model.

Reports 2009/14 Estimating emissions of NMVOC from solvent and other product use
Statistisk sentralbyrå 13
The emission factor matrix is designed so that information on individual substances can be integrated. i.e. that factors can be made product, industrial sector and substance specific. For a summary of the industrial sector and product specific emission factors, see Appendix A8.
3.3. Source allocation NMVOC emissions are allocated to eleven different source categories (see Appendix A5 and A6), according to the reporting requirements under LRTAP (NFR codes with extentions). These categories aggregate to the four sources for which emissions must be reported under UNFCCC (CRF 3A-D). The NFR and CRF reporting format is coordinated (see Appendix A5), such that the NMVOC emissions reported to the aggregated NFR (3A-D) are the same as reported to CRF 3A-D. The extentions in the CRF and NFR reporting formats are however somewhat diverging, but this has no practical implications for the reporting of NMVOC emissions from solvents and other product use, as the CRF 3A-D has no extentions. The model also includes an opportunity for the Norwegian Pollution Control Authority to study the emissions on the level of the source definitions given in the GAINS model. However, due to rules of confidentiality, results can generally not be published for all GAINS source codes. The matrix of the product and industrial sector specific emission factors was used as a basis for the source allocation matrix. The product and industrial sector code combinations were compared to the source descriptions of the GAINS model given in the Interim report from 2000 (Klimont et al. 2000) and the source allocation of the Swedish model. A few differences exist between the Norwegian and the Swedish model, in most cases equivalent to the adjustments to the emission factor matrix. In order to avoid double counting, substance quantities that cause NMVOC emissions, and which are reported elsewhere, are excluded from the source allocation of emissions. These quantities were identified by industrial sector and product code. It was assumed that only emissions due to the use of these specified products are reported in other source categories. Emissions generated from the use of other products were not excluded. The exclusions are given in Appendix A7. Note that quantities that have not been assigned a product type are allocated to source category 3D iv. Quantities that have not been registered to an industrial sector are allocated to source category 3A iii for all paints and varnishes and 3D iv for all other product types.
3.4. Model completeness The model estimates NMVOC emissions generated by the use of products that are subject to the duty of declaration in all industrial sectors as well as private households. Manufacture where the selected substances are used as raw materials are included. However, emissions during primary production of the substances are not included in this model, as these are not covered by the Product Register data. Some manufacture using NMVOCs as raw materials may produce NMVOC-containing products that are not subject to the duty of declaration. In such cases emissions from the resulting products can be included by increasing the emission factor used on the manufacturing process or by using side models to produce supplementary time series. Double counting is potentially a problem in any account following the path of a product from production to disposal. For NMVOC, there are however potentially emissions in any part of the life cycle. This means that emissions during production

Estimating emissions of NMVOC from solvent and other product use Reports 2009/14
14 Statistisk sentralbyrå
do not contradict emissions during later life stages, and double counting of emissions does not pose a problem. However, emissions from some products may be reported in other parts of the Norwegian inventory (e.g. point source emissions and emissions from the oil industry), and these potential sources of double counting must be avoided, and are dealt with in this model.
3.5. Methods in other countries By deciding to use data per substance instead per solvent-containing product, the Norwegian model for NMVOC emissions from the use of solvents is similar to the models used by Sweden, Germany and the UK. This facilitates between-country comparison of both model and the resulting emission estimates.
3.6. Analogy to statistics on use and emissions of hazardous substances
The NMVOC emissions are estimated in concert with calculations of use and emissions of hazardous substances (Kittilsen & Hansen 2008). The methodology and the source of activity data are the same for the two models, and some scale advantages are obtained by these merged calculations. In addition, there is some overlap in emission factors for the two statistics, and improvements of emission factors for one of the statistics may lead to improved emission factors for the other. However, the selection of substances is only partially overlapping, and thus only some of the revisions of activity data and emission factors are relevant for both statistics.
3.7. Conversion to CO2 According to UNFCCC Reporting Guidelines (IPCC 2006b), indirect emissions of CO2 from atmospheric oxidation of emitted NMVOC are to be included in the national emission inventory. The average amount of carbon in NMVOC is assumed to be 82 per cent. This leads to an emission factor for indirect CO2 release of 3 kg CO2/kg NMVOC (0.82*44/12 = per cent carbon in NMVOC*molecular weight [carbon dioxide]/atomic weight [carbon]). Not all NMVOC are of fossil origin, e.g. some are the products of wood conversion. However, an attempt to exclude the substances of non-fossil origin has not been made in this project (section 7.1.7).
3.8. Technical solution The process of estimating emissions of substances employs both Excel and the SAS system software (SAS Institue Inc. 1999a, b). Data from the Product Register are provided once a year as flat files that are converted directly into a SAS data matrix. The emission factor matrix and the source allocation matrix are revised in Excel and transferred to SAS. Generation of the complete activity dataset, data revision, emission estimation and source allocation and production of result tables are all done using SAS.
3.9. Uncertainties When an uncertainty analysis was performed for LRTAP pollutants by Statistics Norway in 2000 (Rypdal & Zhang 2000), the source category “Solvent use” was one of the highest ranked NMVOC sources with regard to uncertainty. The amount of raw material used and the fraction emitted was pointed out as contributing most to the uncertainty of the emission figures. A comparison to the previous solvent balance provides an indication of the relative uncertainty. Firstly, the amount of raw materials used and thus extracted from the calculations was more uncertain in the previous solvent balance, since data for the new model are provided annually from the Product Register, while the previous

Reports 2009/14 Estimating emissions of NMVOC from solvent and other product use
Statistisk sentralbyrå 15
model used data from one survey. Secondly, the emission factor applied in the previous model included assumptions on the solvent content of the products included in the mass balance. In the new model (except for the cosmetics side model), no assumptions need to be made on solvent content, since calculations are performed on a substance level. A mass balance model identical to the previous Norwegian model is the reference for the uncertainty estimate in the EMEP/CORINAIR Guidebook (European Environment Agency 2006). According to the Guidebook, overall uncertainty per capita for the detailed methodology is estimated to be factor 1.25 to 2, depending on completeness and quality of the mass balance data and the quality of production, import, export, disposal, destruction and hold-up data. As described in sections 4.3.1 and 3.2, both errors in activity data and emission factors contribute to uncertainty in the estimates. For the activity data, the simplified declarations and the negative figures due to exports lead to known overestimations, for which the uncertainty to a large extent is known. The negative figures due to export is not taken into account in this uncertainty analysis; these constitute a very small fraction of the activity data (see section 4.4.8). A more elaborate problem in calculations of uncertainty is estimating the level of omissions in declaration for products where the duty of declaration does apply. In addition, while declarations with large, incorrect consumption figures are routinely identified during the QA/QC procedure, faulty declarations with small consumption figures will only occasionally be discovered. There is however no reason to believe that the Product Register data are more uncertain than the data source used in the previous model (statistics on production and external trade), as similar QA/QC routines are used for these statistics. The emission factors are more detailed in the new NMVOC model than in the previous model, as this model can take into account that emissions are different in different industrial sectors and products, even when the substance is the same. However, for this to be correct, a thorough evaluation of each area of use is desirable, but not possible within a limited time frame. Thus, the emission factor is set with general evaluations, which leads to uncertainty. The calculations of NMVOC emissions are performed in concert with calculations of emissions of dangerous substances (Kittilsen & Hansen 2008). An uncertainty analysis was performed for both these analyses for the years 2005 to 2007. The uncertainty (defined as two standard deviations) is calculated for the main data source (i.e. the Product Register data), and uncertainty in the emissions from the cosmetics side model and from point sources is not included. The uncertainty is dependent both on uncertainty in emission factors and in activity data.
3.9.1. Uncertainty in emission factors The emission factors are gathered from several different sources, with different level of accuracy (see section 3.2). The uncertainties in emission factors depend on how detailed assessment has been undertaken when the emission factor was established. Some emission factors are deemed to be unbiased, while others are set close to the expected maximum of the range of probable emission factors. This, together with the fact that the parameter range is limited, gives us a non-symmetrical confidence interval around some of the emission factors. For each emission factor we thus have two uncertainties; one negative (n) and one positive (p). These are aggregated separately, and the aggregated uncertainty is thus not necessarily symmetrical. The aggregated uncertainties are calculated using standard formulas. Most emission factors were gathered from Skårman et al. (2006). An uncertainty of 20 per cent was stated in this source, and this is assumed in this uncertainty analysis as well. The uncertainty is thus calculated as emission factor*0.2 for both

Estimating emissions of NMVOC from solvent and other product use Reports 2009/14
16 Statistisk sentralbyrå
n and p. The confidence intervals are truncated where they would exceed the limit value 1. For the substances assumed to be raw materials, only small amounts are emitted, and the uncertainty in emission factor is assumed to be very low. This also holds for emission factors set specifically for a substance or a combination of industry and product type.
3.9.2. Uncertainty in activity data The errors in activity data are not directly quantifiable. Any undercoverage in the Product Register is not taken into account. Skårman et al. (2006) found that the activity data from the Swedish Product register had an uncertainty of about 15 per cent. The Norwegian Product Register is deemed to be comparable to the Swedish, and thus the uncertainty in the activity data is set to be 15 per cent. For some products, simplified declarations (cf. section 4.4.7) give an indication of maximum and minimum possible amounts. In these cases, the maximum amount is used, and the positive uncertainty is set to 15 per cent as for other activity data, while the negative uncertainty is assumed to be the interval between maximum and minimum amount. All activity data are set to zero if negative.
3.9.3. Aggregated uncertainty in level The variance of the activity data and emission factors is combined by the formula
)()()()()()()( 22 AVarfVarfEAVarAEfVarUVar ×+×+×= where U is the emissions, f is the emission factor and A is the activity data. It is assumed that the emission factors and activity data are independent of one another. The uncertainty is calculated to
)(2 UVarus ×=
Both variance and uncertainty is calculated separately for negative and positive variance/uncertainty, as many of the confidence intervals are one sided or biased. The variance of the total emission is calculated as the sum of the variances of all the substances. It is presupposed that an emission from one substance is independent of the emissions from the other substances.
3.9.4. Aggregated uncertainty of trend There are no changes in emission factors between years in the 2005-2007 period. Variation in emissions is thus a result of changes in activity data within each combination of industrial sector and product type. The uncertainty of the difference between years is then connected to the uncertainty in the variance in activity:
))(())(())(( 12
22
12 AVarfAVarfAAfVar +=− The variance of the trend is calculated for each substance and summed in the same manner as for the uncertainty in level.

Reports 2009/14 Estimating emissions of NMVOC from solvent and other product use
Statistisk sentralbyrå 17
4. Activity data
4.1. Overview The Norwegian Product Register was chosen as the primary data source. The Product Register is the Norwegian government’s central register on chemical products that are subject to duty of declaration7 and labelling, such as paint, adhesives and cleaning products (Kraft & Follestad 2007). The Product Register was considered to be a data source that could easily provide activity data of relatively high quality, with much appurtenant information and fairly good coverage of emission sources.
4.2. Substance list Although reporting requirements refer to the term “solvents”, no official definition of solvents exists. Furthermore, solvents cannot be easily identified in the product codes of the Product Register. Since the aim of the LRTAP is to reduce the emissions of NMVOC, and data from the Product Register can be extracted for individual substances, the data selection was based on a substance list containing as many NMVOC not reported elsewhere in the Norwegian inventory as possible. The Product Register data themselves could not be used for compilation of such a list, as these data contain no information on physical or chemical properties of the registered substances. Therefore, the substance list used in the Swedish NMVOC inventory (Skårman et al. 2006) was used as a basis. This substance list is based on the definition stated in the UNECE Guidelines8. However, the Swedish list is limited to the substances found in the Swedish Product register. As Norwegian industry differs somewhat from the industry in Sweden, due to the importance of the oil industry, the substance list was supplemented by NMVOC reported in the UK’s National Atmospheric Emissions Inventory (NAEI) (AEA Energy and Environment 2007). However, not all NMVOC on the NAEI list are supplied with a CAS number. Hence, the supplement from NAEI was limited to the substances with given CAS numbers. The resulting list was comprised by 678 substances. Of these, 355 were found in the Norwegian Product Register for one or more years in the period 2005-2007 (Appendix A1). Creosote was not defined as a NMVOC and is therefore not included. In addition, five substances were found to be hydrofluorocarbons (HFCs) for which emissions are reported in other parts of the emissions inventory (CRF 2F). Although some substances on the NAEI list are not included in our data selection, the coverage was considered to be sufficient in relation to the reporting requirements.
4.3. Product Register data The Product Control Act (Miljøverndepartementet 1976), the Working Environment Act (Arbeids- og inkluderingsdepartementet 2005) and the Fire Prevention Act (Justis- og politidepartementet 2002) form the basis for the central regulations on classification and labelling of dangerous chemicals. Additional rules for declarations to the Norwegian Product Register are stipulated in the Act on Declaration and labelling of microbiological products (Miljøverndepartementet 1998). Any person placing dangerous chemicals on the Norwegian market for
7 Cosmetics and health care products are examples of products not subject to the duty of declaration. 8 “Volatile compound (VOC) shall mean any organic compound having at 293.15 degrees K a vapor pressure of 0.01 kPa or more, or having a corresponding volatility under the particular conditions of use."

Estimating emissions of NMVOC from solvent and other product use Reports 2009/14
18 Statistisk sentralbyrå
professional or private use has duties pursuant to these regulations. The duty of declaration applies annually to import, export and manufacturing. The only exception is when the amount of a given product placed on the market by a given importer/producer is less than 100 kg per year. Around 25 000 declarations of products are updated annually, of which 15 000 are obliged to report according to regulations (Kraft & Follestad 2007). These 15 000 mandatory declarations form the basis for these analyses. One declaration can include several closely comparable products belonging to the same product series. Furthermore, the same product may be declared more than once if imported by several importers (rarely more than three). Thus, 15 000 declarations correspond to about 40 000 products being declared. A total of 3 000-4 000 declarations are omitted each year, as products leave the market. Nevertheless, the total number of declarations increases by about 500 every year, indicating an increasing number of products on the market and/or reflecting changes in the regulations. In addition, some declarations are submitted to the Product Register even though the products are not under the duty of declaration. When a product is declared to the Product Register, information about the registrant and the product must be reported. Most importantly, the chemical composition and the appurtenant volume of individual components are disclosed to the Product Register. Statistics Norway is authorised to use the net quantity of import, export and manufacture of individual components, given by CAS number (classification by Chemical Abstract Services (American Chemical Society 2007)). The appurtenant information includes: • Intended use/type of product, given by a code for product type (UCN; (Product
Register 2007)) • Area of use, given by industrial sector to which the product is sold (following
standard industrial classification – NACE; (Statistics Norway 2002)), including private households (using specific Product Register codes;(Product Register 2007))
• Number of declarations The information pertained in the data from the Product Register makes it possible to present results on a substance level, distributed over product types, industrial sectors or a combination of both. As a consequence, the identification of specific substances, products or industrial sectors that have a major influence on the emissions is greatly facilitated. NACE codes and UCN codes are listed in Appendix A2 and A3, respectively.
4.3.1. Data completeness The duty of declaration to the Product Register does not apply to all solvent-containing products. Some product groups are not covered by the regulations, while other product groups are covered only when the solvent content is above a certain level. The basis for the duty of declaration is that the product is labelled according to the Act on classification, labelling etc. of dangerous chemicals (Arbeids- og inkluderingsdepartementet & Miljøverndepartementet 2002), and the weight percentage of the substances in the product determines wether the product is to be labelled or not. Unless these solvent-containing products have been declared due to regulations concerning other ingredients than the solvent, these NMVOC quantities are not included in the activity data. NMVOC emissions from such products can be estimated using manufacturing statistics and external trade statistics. Using an average solvent content as well as emissions factors, emissions can be calculated (i.e. the method used in the previous solvent balance). For two product groups such estimates were calculated, in order to check the completeness of the

Reports 2009/14 Estimating emissions of NMVOC from solvent and other product use
Statistisk sentralbyrå 19
Product Register data and, if necessary, supplement the emission estimates based on the primary data source: 1. Cosmetics are not subject to the duty of declaration, and may contain
considerable amounts of NMVOCs. Estimates obtained as described above revealed that such products constitute a relatively large emission source. Thus, a supplementary time series of NMVOC emissions from cosmetics was produced (cf. section 4.7.2).
2. VOC levels in paint and varnish are regulated through the Product Control act. For water based paints, limits are set from 50 to150 grams per litre, depending on paint type (Miljøverndepartementet 2004). Water based paint can thus contain some organic solvent, but the solvent content is below the limit for the duty of declaration and labelling to apply. Consumption volumes of water-based paints are so significant that these products were suspected to constitute a considerable source of NMVOC emissions. However, the solvent content of water based paint from the major paint producer in Norway is far below this limit. Based on mean solvent contents declared on technical data sheets from a range of water based paints, emissions from this source were considered negligible, compared to the estimates for other product groups included in the Product Register data.
It is considered unlikely that other products containing only small amounts of solvents, i.e. not subject to the duty of declaration, and at the same time not covered by regulations on other ingredients, represent a large source of NMVOC emissions. Still it is important to be aware of this limitation of the data source, especially if the use of solvent-containing products not liable for declaration increases substantially. In such cases, these products can be included by using data from the trade and manufacture statistics. Changes to the regulations for classification and labelling will lead to changes in the coverage of the Product Register. For instance, the duty to label solvent-containing products was abolished in 2005. The effect of this specific regulatory change on the coverage of the Product Register is believed to be limited, as most of the products in question are subject to the duty of labelling for other reasons, such as flammability (J. Kraft, Product Register, pers. comm. 2008). Some of products not covered by the duty of declaration are in fact declared to the Product Register voluntarily. In order to avoid random effects known to be related to voluntary declarations, most of these declarations, representing approximately 10 000 products, were excluded from this study. Including the voluntary declarations would introduce more variability without adding considerable quantities, and these quantities are omitted.
4.3.2. Time series in the Product Register The duty of declaration forms the basis for data in the Product Register. It was first passed in 1981 and has since been extended to include more effects and products several times. Thus, the coverage and data quality of the Product Register has changed dramatically over time:
Before 1997: Coverage and data quality of NMVOC is very low. • 1997-1999: Coverage of NMVOC is low, except for 1999, and quantities can
only be extracted as the sum over all products and industrial sectors for a given substance used in a given year.
• 2000-2004: Coverage is considered to be sufficiently good, however due to the nature of the registrations, quantities can only be extracted as the sum of over all industrial sectors for a given substance in a given product used in a given year or as the sum of all products for a given substance used in a given industrial sector a given year.
• 2005 and onwards: Coverage is considered to be good, and quantities of given substances a given year can be extracted from the register for combinations of products and industrial sectors.

Estimating emissions of NMVOC from solvent and other product use Reports 2009/14
20 Statistisk sentralbyrå
Figure 4.1. Activity data and method used and adjustments, assumptions and evaluations made in the model for estimating emissions of NMVOC from solvent and other product use, 1989 onwards
The emission factors are both product- and sector specific (cf. section 3.2), and information about both these characteristics is necessary in order to effectively assign an emission factor to the activity data. Ideally, there should be an overlap between the time series from the new and the previous model in order to assess differences in emissions and source allocations. The previous model was last updated in 2000, and the times series in the new model should thus preferably start in this year. Modelling the distribution of the Product Register data from 2000 to 2004 based on product type and industrial sector marginals and the mean distributions in 2005 to 2007 was attempted, but the resulting activity data had serious faults, and the modelling added an extra level of uncertainty to the activity data. Thus, the Product Register data was deemed of sufficient quality from 2005, and modified emission estimates from the previous solvent balance was used for the preceding years (cf. section 4.8). The data sources used in different periods of
Reports 2009/14 Estimating emissions of NMVOC from solvent and other product use
Statistisk sentralbyrå 21
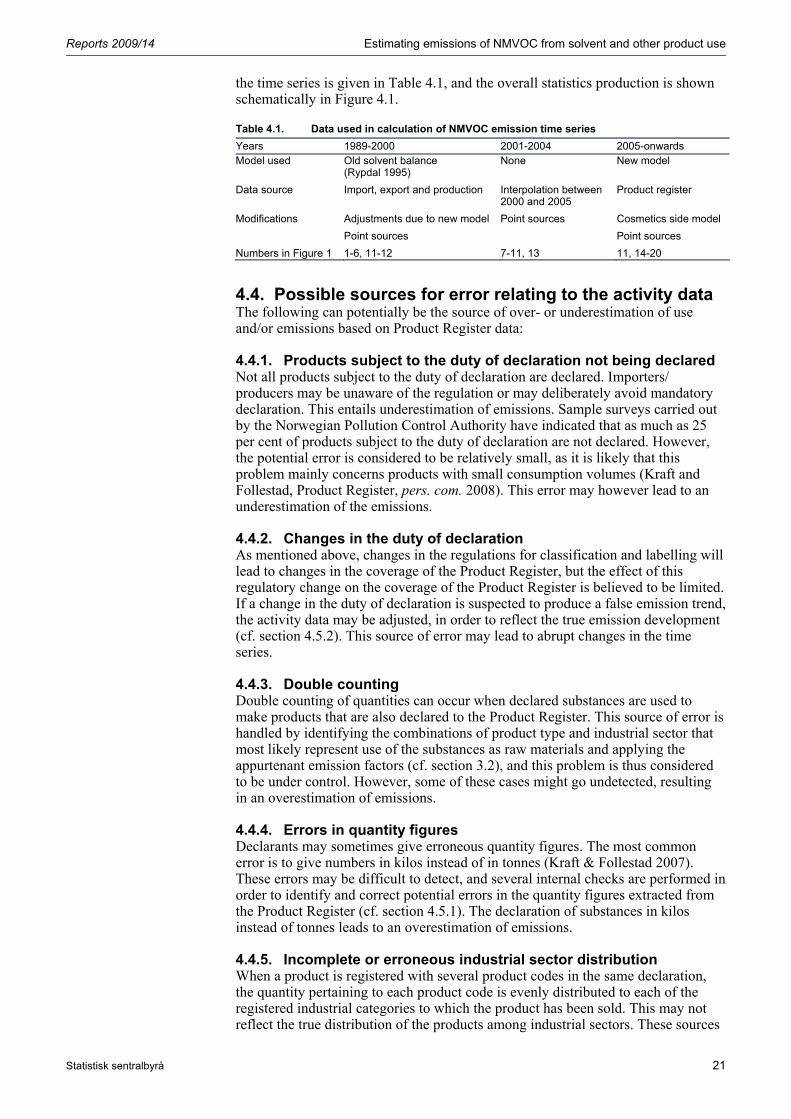
the time series is given in Table 4.1, and the overall statistics production is shown schematically in Figure 4.1.
Table 4.1. Data used in calculation of NMVOC emission time series
Years 1989-2000 2001-2004 2005-onwards Model used Old solvent balance
(Rypdal 1995) None New model
Data source Import, export and production Interpolation between 2000 and 2005
Product register
Modifications Adjustments due to new model
Point sources
Point sources Cosmetics side model
Point sources
Numbers in Figure 1 1-6, 11-12 7-11, 13 11, 14-20
4.4. Possible sources for error relating to the activity data The following can potentially be the source of over- or underestimation of use and/or emissions based on Product Register data:
4.4.1. Products subject to the duty of declaration not being declared Not all products subject to the duty of declaration are declared. Importers/ producers may be unaware of the regulation or may deliberately avoid mandatory declaration. This entails underestimation of emissions. Sample surveys carried out by the Norwegian Pollution Control Authority have indicated that as much as 25 per cent of products subject to the duty of declaration are not declared. However, the potential error is considered to be relatively small, as it is likely that this problem mainly concerns products with small consumption volumes (Kraft and Follestad, Product Register, pers. com. 2008). This error may however lead to an underestimation of the emissions.
4.4.2. Changes in the duty of declaration As mentioned above, changes in the regulations for classification and labelling will lead to changes in the coverage of the Product Register, but the effect of this regulatory change on the coverage of the Product Register is believed to be limited. If a change in the duty of declaration is suspected to produce a false emission trend, the activity data may be adjusted, in order to reflect the true emission development (cf. section 4.5.2). This source of error may lead to abrupt changes in the time series.
4.4.3. Double counting Double counting of quantities can occur when declared substances are used to make products that are also declared to the Product Register. This source of error is handled by identifying the combinations of product type and industrial sector that most likely represent use of the substances as raw materials and applying the appurtenant emission factors (cf. section 3.2), and this problem is thus considered to be under control. However, some of these cases might go undetected, resulting in an overestimation of emissions.
4.4.4. Errors in quantity figures Declarants may sometimes give erroneous quantity figures. The most common error is to give numbers in kilos instead of in tonnes (Kraft & Follestad 2007). These errors may be difficult to detect, and several internal checks are performed in order to identify and correct potential errors in the quantity figures extracted from the Product Register (cf. section 4.5.1). The declaration of substances in kilos instead of tonnes leads to an overestimation of emissions.
4.4.5. Incomplete or erroneous industrial sector distribution When a product is registered with several product codes in the same declaration, the quantity pertaining to each product code is evenly distributed to each of the registered industrial categories to which the product has been sold. This may not reflect the true distribution of the products among industrial sectors. These sources
Estimating emissions of NMVOC from solvent and other product use Reports 2009/14
22 Statistisk sentralbyrå
of error in the industrial sector distribution of the data are considered to be negligible, as most products are sold to only one industrial sector (J. Kraft and M. Follestad, Product Register, pers. comm. 2008). However, erroneous distributions may lead to faulty emission factors being applied, and the emissions may be over- or under- estimated.
4.4.6. Missing product type codes Some declarations are missing codes for product type. This might lead to an overestimation of consumption of some products and underestimation for others. However, these incomplete declarations constitute a minute contribution to the total consumption figures.
4.4.7. Quantities given in intervals (simplified declarations) For some so-called simplified declarations, substance quantities are given in intervals. The maximum quantity is used for these substances, as it is expected that there is a higher probability that the true quantity will be close to the maximum value than to the minimum value. Internal checks are performed in order to identify intervals where the quantity figure used is substantially higher than the lower limit of the interval, in order to prevent overestimation (cf. section 4.5.1).
4.4.8. Negative figures When declared quantities imported or produced one year are declared as exported the next, net quantities for the latter year are negative. This is currently handled by setting these figures to zero, resulting in an overestimation of intra-country emissions. The negative figures that are set to zero amount to approximately 6 400 tonnes for the whole period (2005-2007). Setting these figures to zero lead to an increase of the activity data of 0.4 per cent. The resulting overestimation of emissions is dependent on the product type and industrial sector in which the negative figures appear (due to different emission factors).
4.5. Quality Control (QC) The current QC procedures conducted by Statistics Norway include the following:
4.5.1. Internal checks for data consistency • Large between-year discrepancies in the time series of substance quantities are
routinely identified and investigated, in order to correct errors in consumption figures.
• Large within-year discrepancies between minimum and maximum quantities in simplified declarations are routinely identified and investigated, in order to prevent overestimation for substances where consumption figures are given in intervals. For 2005-2007 the potential overestimation of emission figures generated by the use of maximum quantities were estimated. When using the mean of the interval values instead of the maximum, total emissions were reduced by approximately 3 400 tonnes (i.e. 6.8 per cent) in 2005, 1 900 tonnes (i.e. 4.3 per cent) in 2006, and 950 tonnes (i.e. 2.1 per cent) in 2007.
• Large within-year discrepancies between totals for industrial sectors (NACE) and totals for products (UCN) are routinely identified and investigated, in order to detect erroneous or incomplete industrial sectoral and product type distribution.
No corrections made on individual data sets are reported back to the Product Register.
4.5.2. Check for possible effects of changes in the duty of declaration The trend in declared volume of substances that are expected to be affected by changes in the duty of declaration to the Product Register is analysed subsequent to substantial changes in the regulations. This is done in order to remove false emission trends. If changes in the duty of declaration lead to substantial changes in

Reports 2009/14 Estimating emissions of NMVOC from solvent and other product use
Statistisk sentralbyrå 23
volumes of the substances in concern, the time series prior to the change in duty of declaration may be adjusted in order to avoid false emissions trends due to the duty of declaration. Currently, the data have been analysed with respect to changes in the duty of declaration taking place prior to 2005 (Kittilsen & Hansen 2008). This gives us an indication of possible effects of regulatory changes on the activity data. No changes in the duty of declaration have taken place since 2005.
4.6. Confidentiality According to § 2-6 of the Statistics Act (Finansdepartementet 1989), figures shall not be published in such a way that they can be traced to a particular respondent. Under Statistics Norway’s rules regarding confidentiality, in order for the statistics to be publishable, aggregated data must consist of at least three observations. In this study one observation corresponds to one declaration. As a consequence, some results are grouped into a less detailed level in order to conceal confidential information.
4.7. Point sources and side models
4.7.1. Point sources For the sake of coverage, data on emissions from nine point sources reported from the plants to the Norwegian Pollution Control Authority are added to the emissions estimates of NFR/CRF source 3C (see Appendix A5). NMVOC emissions are reported for additional four point sources that are already included in NFR/CRF 2 (see Appendix A5). These emissions are not presented in this report. The Norwegian Pollution Control Authority provides the point source data. All point sources of NMVOC from the use of solvents that are included in either NFR/CRF 3 or NFR/CRF 2 belong to the industrial sector “Manufacture of chemicals and chemical products” (NACE 24). In order to avoid double counting, NMVOC used as raw material in this sector are excluded from the emission estimates. Point source emissions are reported to the Norwegian Pollution Control Authority as total NMVOC emissions. While the results from the main model are available on a substance level, distributed on various product types and industrial sectors, the point source emissions are reported total NMVOC emissions. The plants reporting the emissions can be allocated to an industrial sector, but no information on substances or product types is available. Thus, the point source emissions must be omitted when emissions are analyzed on the substance or product type level.
4.7.2. Cosmetics side model Estimates obtained on NMVOC emissions from cosmetics revealed that emissions from such products, which are not subject to the duty of declaration, were significant. Thus, a supplementary time series of NMVOC emissions from cosmetics was produced. The Norwegian Pollution Control Authority calculated the consumption of pharmaceuticals and cosmetics in 2004, based on sales figures (given in Norwegian kroner) from the Norwegian Association of Cosmetics, Toiletries and Fragrance Suppliers (KLF) and Swedish turnover numbers (given in tonnes) (Norwegian Pollution Control Authority 2005). The consumption was calculated for product groups such as shaving products, hair dye, body lotions and antiperspirants. A consumption time series (in tonnes) from 2005 to 2007 was calculated from the the relationship between consumption in Norwegian kroner and in tonnes in 2004, and a consumption (in Norwegian kroner) from 2005 to 2007 from KLF (Norwegian Association of Cosmetics Toiletries and Fragrance Suppliers (KLF) 2008). Figures on VOC content and emission factors for each product group were taken for the

Estimating emissions of NMVOC from solvent and other product use Reports 2009/14
24 Statistisk sentralbyrå
most part from a study in the Netherlands (IVAM 2005), with some supplements from the previous Norwegian solvent balance (the previous NMVOC model). Cosmetics have product type codes in the Product register, although they are not subject to the duty of declaration. The emissions from this product group were allocated to these product type codes. Because of lack of on sector distribution of cosmetics consumption, the emissions were divided equally between the sectors private households (no NACE) and “Other personal services” (NACE 93), where sectors such as hairdressers and beauty salons are included.
4.8. Time series from the previous model (1989-2000) and interpolation 2001-2004
According to the 2005 Gothenburg Protocol on the Control of Emissions of NMVOC, the base year for the Norwegian reporting of NMVOC is 1989. Hence, the first year in the time series presented in this report is 1989. However, data from the Product Register cannot be used to produce the complete time series back to this year. The Product register was deemed of sufficient quality for the NMVOC emissions model from 2005 (cf. section 4.3.2), and will consequently be used as the data source from this year onwards. Prior to this year the declared amounts were only available as sums over all product types within each sector or sums over all sectors within each product type. Due to the nature of our emission factor matrix, this information is not sufficient to produce good emission estimates.
4.8.1. Substances with emission factor zero in the previous model: Consumption and emissions
The trend in the previous solvent balance was considered reliable, but the emission level was lower than results from the new model. Differences in emission factors between the two models may be one explanation for this discrepancy. While the old model had emission factors set to zero for a range of substances, the new model assumes that emissions are completely eliminated only for a few product groups (cf Appendix A6) and never on a substance level. The substances with emission factor set to zero in the previous model contribute considerably to the emissions estimated using the new model. The consumption and emissions for each of the substances were investigated in order to pinpoint areas where the previous solvent balance should be adjusted. The substances with emission factor zero in the previous solvent balance are given in Table 4.2. For some of these substances, CAS numbers could not be found.
Table 4.2. Substances with emission factor zero in the previous solvent balance
Name Cas number Commodity number 1 Prodcom code 2
Formic acid .............................................. 64-18-6 29.15.1100 24.14.32.53Saturated cyclic hydrocarbons ..................... Several 29.01.1000 24.14.11.20Acetic acid ............................................... 64-19-7 29.15.2100 24.14.32.71 Acetylene ................................................ 74-86-2 29.01.2910 24.14.11.67Esters from acetic acid ............................... Several 29.15.3000 24.14.31.15/17/19Esters from formic acid ............................... Several 29.15.1300 24.14.32.55Ethylene ................................................. 74-85-1 29.01.2100 24.14.11.30Propene .................................................. 115-07-1 29.01.2200 24.14.11.40Buta-1,3-diene og isoprene ......................... 106-99-0 29.01.2400 24.14.11.65Octanol ................................................... 111-87-5 29.05.1600 24.14.22.63 Naphta (crude oil) ..................................... Several 27.10.0016 Other unsaturated acyclic hydrocarbons ........ Several 29.01.2990 24.14.11.901 From the commodity list for external trade (Statistcs Norway 2007a) 2 Eurostats’s standard for production of manufactured goods (European Commission 2009)
Formic acid Formic acid (CAS number 64-18-6) had emission factor zero in the old model, and contributes considerably to the emissions in the new model. This substance is used as ensilage means in ensiling processes in agriculture, and has an emission factor of 0.1 for this use in the new model. The formic acid is not transformed during the ensilage process, and can evaporate both when the grass is wrapped and unwrapped. An emission factor of zero is not likely for this process (O. Kjus, Addcon Nordic, pers. comm. 2007). The mean consumption of formic acid (raw

Reports 2009/14 Estimating emissions of NMVOC from solvent and other product use
Statistisk sentralbyrå 25
materials not included) in 2005-2007 was 30 000 tonnes, while the mean emission per year was 3 200 tonnes. Formic acid explains a discrepancy in emissions of 1 000-3 000 tonnes between the new and the previous model.
Saturated acyclic hydrocarbons For some substances, including the saturated acyclic hydrocarbons, the old solvent balance assumed that the substance was used in combustion processes only. For instance, pentane (CAS number 109-66-0) was incorporated in the collective term saturated acyclic hydrocarbons in the old model. This is however a substance that, in addition to being combusted, also is used in insulation materials. An emission factor of zero thus seems unrealistic for this substance. From the substance list, 85 substances could be classified to be included in the group saturated acyclic hydrocarbons. Of these, 20 were found in our emission estimates. They comprised a mean consumption of 8 446 tonnes and mean emission of 1 080 tonnes.
Acetic acid Acetic acid (CAS number 64-19-7) had a mean consumption of 6 949 tonnes per year in 2005 to 2007. The mean emission per year from this substance was 362 tonnes.
Acetylene Acetylene (CAS number 74-86-2) had a mean consumption of 794 tonnes per year in 2005 to 2007. The mean emission per year from this substance was 77 tonnes.
Esters of acetic acid From the substance list, 18 substances were identified as esters of acetic acid. Of these, 14 were found in our emission estimates. The mean consumption of these substances was 3 983 tonnes per year from 2005 to 2007, and the mean emission was 1 100 tonnes per year.
Esters of formic acid Only one substance in the substance list was found that could be included in this category. This was methyl formate (CAS number 107-31-3), and there were no declared amounts of this substance in our data.
Ethylene, propene, buta-1,3-diene and octanol Ethylene (CAS number 74-85-1), propene (CAS number 115-07-1), buta-1,3-diene and isoprene (CAS number 106-99-0), and octanol (CAS number 111-87-5) has negligible consumption levels in the new model. This is considered to be representative for the time period 1989-2000 as well, and the time series from the previous model is not adjusted with emissions from these substances. For naphta (crude oil) and other unsaturated acyclic hydrocarbons it was deemed difficult to find the relevant CAS numbers, and thus no estimates of consumption and emissions was made.
4.8.2. Substances with emission factor zero in the previous model: Emission time series
The investigation described above indicates that the most important consequences in the differences in emission factors between old and new models are for formic acid, saturated acyclic hydrocarbons and esters from acetic acid. For these substances, the emission estimates added to the old time series (1989-2000) should ideally be adjusted according to import, export and production figures for each year in the time series. However, due to lack of data, the following procedure was chosen:
Formic acid production and import The net import of formic acid has increased dramatically during the 1989-2007 period. There has been little or no production of formic acid in Norway during the

Estimating emissions of NMVOC from solvent and other product use Reports 2009/14
26 Statistisk sentralbyrå
period (J. H. Kingsrød, Norwegian agricultural purchasing and marketing cooperation, pers. comm.). Small volumes may have been produced in Norway in the beginning of the period, but the majority was imported from BP in England. Thus, the net import was used to calculate the emission time series for formic acid from 1989-2000. The calculated emissions are in the range 850-2 400 tonnes each year.
Other substances with emission factor set to zero in the previous solvent balance It has proven difficult to get reliable production numbers for the other substances with emission factor set to zero in the previous solvent balance. Import and export numbers alone do not give a reliable indication of the trend in the consumption time series. We have no information available that indicates that there is a conspicuous trend in the consumption of these substances. Thus, the mean emissions from the new model for the time period 2005 to 2007 were added to each year from 1989 to 2000. The sum of these emissions amounts to about 2 622 tonnes. The time series from the previous model (1989-2000) is thus adjusted with emissions in the range of 3 500 to 5 000 tonnes each year. The adjustments are composed of one fixed part, and one share that vary over time, depending on the level of the calculated emission time series from the use of ensilage means.
4.8.3. Source allocation of adjusted emissions The sector allocation within each source was redefined for the old time series, based on the mean allocation within the years 2005-2007 (cf. section 4.8.4).This implies that it was only necessary to allocate the calculated extra emissions to the source level, and these numbers where then included in the new sector allocation. In the new model, more than 99.8 per cent of the formic acid emissions are placed in 3D. Thus, the calculated formic acid emission time series for 1989-2000 is placed in this source category. The 2 622 tonnes of emissions from the substances that were distributed with the same emissions for the years 1989-2000 are distributed among sources according to their mean distributions in 2005-2007. The distribution of these emissions is given in Table 4.3.
Table 4.3. NFR/CRF sector allocation of emissions from saturated acyclic hydrocarbons, acetic acid, acetylene and esters of acetic acid
NFR/CRF sector NFR sector with extentions Emissions allocated (tonnes)
Paint application (3A) Decorative paint application (3A i) Industrial paint application (3A ii) Other paint application (3A iii) 789
Degreasing and dry cleaning (3B) Degreasing (3B i) Dry cleaning (3B ii) Other (industrial cleaning) (3B iii) 130
Chemical products, manufact. & proc. (3C) Chemical products, manufact. & proc. (3C) 10
Other product use (3D) Printing (3D i) Wood preservation (3D ii) Domestic solvent use (3D iii) Other (3D iv) 1693
Total 2622
4.8.4. Sector allocation 1989-2004 In the previous solvent balance, the allocation to sectors and sources were done according to a set pattern. The source distribution from the previous model was retained, while the sector distribution within each source was redistributed, to obtain consistency within the subdivided source categories. First, the emission time series for formic acid and the set emissions from the other substances with emission factor zero were added to the 1989-2000 time series according to their

Reports 2009/14 Estimating emissions of NMVOC from solvent and other product use
Statistisk sentralbyrå 27
2005-2007 source allocation. Second, the sources were divided into sectors based on the mean distribution of sectors within each source for the years 2005-2007. The widest distribution of sectors is seen within the CRF source category 3D. This is to be expected, as this is least specific source, including both industrial and domestic solvent use. The narrowest spread in allocations is in the 3C source category, which includes only the chemical industry. The reported point sources included in the previous solvent balance were allocated to CRF sectors by the same set pattern as the as the estimated emissions. These reported point source emissions are all moved to CRF sector 3C, as they are all reported from sources within the chemical industry (NACE 24). The CRF source categories were kept as in the previous model. The emissions from 1989 to 2000 were previously not allocated to the more detailed NFR source allocation, and are now allocated to the general “other” category within each CRF source, i.e within paint application (3A), the emissions are allocated to 3A iii “Other paint application”, within degreasing and dry cleaning they are allocated to 3B iii, and within other solvent use (3D) the emissions are allocated to 3D iv (Other). Within the CRF source category 3C there is no further division according to the NFR regime. The emissions for the years 2001 to 2004 were calculated for each sector within each source, as a linear interpolation between emissions in 2000 from the previous model and 2005 from the new model. For those source-sector combinations that did not have a value for 2005, the emissions for 2006 (or 2007) were used as a measuring point. The calculated emissions from the cosmetics side model were added to the 2005-2007 time series prior to interpolation, as emission estimates from the previous solvent balance included emissions from cosmetics.

Estimating emissions of NMVOC from solvent and other product use Reports 2009/14
28 Statistisk sentralbyrå
5. Results
5.1. Emission trends In 2007, the emissions of NMVOC from solvent and other product use totalled 48 570 tonnes, including point sources and estimates of emissions from cosmetics. The grand total of NMVOC emissions from all sources in Norway in 2007 was 199 000 tonnes, and the emissions from the use of solvents and other products thus constitute 24 per cent of the total. The largest source of overall NMVOC emissions are the evaporation of hydrocarbons by loading and unloading of crude oil (Statistics Norway 2009a). The 1989-2007 time series includes adjusted emission figures from the previous time series (1989-2000), interpolated emission estimates (2001-2004), and emission estimates from the new emission model (2005-2007) (cf. section 4.3.2). The overall emission estimates presented below are based on this time series, including emissions from reported point sources and emission estimates for cosmetics.
5.1.1. Overall emission time series The 1989-2007 time series of total NMVOC emissions shows that the emissions are relatively stable around 50 000 tonnes per year (Figure 5.1). There is an emission increase during the interpolated period 2001-2004, due to the fact that the emission level in 2005 was higher than in 2000. The emissions are however lower in 2006 and 2007 than in 2005, and the emissions are now at approximately the same level as in 2000. We have no reason to believe that the high emission figures in 2005 are misleading. The time series from 1989-2007 of emissions of NMVOC from solvent and other product use, by NFR source category, is given in Appendix B1.
Figure 5.1. NMVOC emissions from solvent and other product use, by NFR/CRF category, including emissions from point sources and cosmetics, 1989-2007. Tonnes
0
10 000
20 000
30 000
40 000
50 000
60 000
1989 1991 1993 1995 1997 1999 2001 2003 2005 2007
Tonnes
Total
Paint application (3A)Degreasing and dry cleaning (3B)
Chemical products, manufact. & proc. (3C)Other product use (3D)
In the beginning of the NMVOC emission time series there are some abrupt between-year changes in estimated emissions. This is particularly noticeable for 1990, which had higher estimated emissions than both 1989 and 1991. This difference was mainly due to an unusually large net import of white spirit in 1990. In addition there was an increase from 1989 in the import and production of ethers and halogen derivates of hydro carbons. This increase was partly counteracted by a decrease in emissions from complex solvents, aromates and oils and cosmetics. Besides the decrease in white spirit import, the decrease from 1990 to 1991 was also caused by a decrease in import and production of polyester paint and varnish, ethanol and other alcohols.

Reports 2009/14 Estimating emissions of NMVOC from solvent and other product use
Statistisk sentralbyrå 29
5.1.2. Adjustment of time series from previous model The time series from the previous model was adjusted within all source categories. The adjustments were due to additions from substances with emission factor set to zero in the previous model and from reallocation of reported point source emissions (cf. section 4.8.2) (Table 5.1). From 2001 onwards, no adjustments are made, since the old model has been rejected for these years.
Table 5.1. Emissions added within each NFR/CRF source category due to adjustments of the time series from the previous modell, 1989-2000. Tonnes
CRF source category 1989 1990 1991 1992 1993 1994 1995 1996 1997 1998 1999 2000Total ......................... 3 486 3 721 3 869 3 731 3 984 4 306 4 192 4 455 4 477 4 934 4 912 5 064
Paint application (3A) .. 790 790 572 551 577 571 602 652 664 675 654 659
Degreasing and dry cleaning (3B) ............. 129 129 82 88 124 126 127 126 126 125 125 124
Chemical products, manufact. & proc. (3C) 10 11 813 934 757 749 806 618 566 762 736 727
Other product use (3D) 2 557 2 791 2 402 2 158 2 525 2 859 2 658 3 060 3 121 3 373 3 396 3 553
5.2. Reported source specific emissions Source category 3D (“Other product use”) is by far the most predominant of the four main source categories (Figure 5.1). A general increase in emissions from this source from 1989 to 2007 is counteracted by a decline in emissions from source category 3C (“Chemical products, manufacture and processing”). The diverging trends for sources 3C and 3D occur when converting from the previous to the new model. The source allocations in the new and previous model are, however, not directly comparable; for instance may some emissions previously included in 3C now be included in 3D. Thus, the consistency in the complete time series is most reliable on the total emissions level. From 2005, the four source categories NFR/CRF 3A-D can be studied in more detailed using the NFR extentions. The results presented below are the emissions reported within each of the NFR extentions according to the 2008 NFR reporting format.
5.2.1. Paint application (3A) The emissions of NMVOC from paint application have been quite stable between 1989 and 2007. There was a decrease from 2005-2007, presumably due to a shift toward water-based paint and varnish, and consequently lower consumption of solvent-based products. In 2007, the emissions in this source category were calculated to be the lowest since 1989. A side model calculating emissions from water-based paint not subject to the duty of declaration was deemed not necessary, but there are still some NMVOC in water-based paint, and thus the emissions from 2005 are slightly underestimated. Decorative paint application (NFR ectention 3A i, see Appendix A5) is by far the largest of the three extentions within the NFR paint source codes (Figure 5.2). Paint and varnish used in construction (NACE 45), in private households and for public use (no NACE) is allocated to this NFR code. Industrial paint application (NFR extention 3A ii) includes the use of paint and varnish in manufacture of motor equipment, motor vehicles and wood products, among others. The largest emissions from this group are estimated to stem from the use of paint and varnish in the manufacture of non-motor vehicles (NACE 35), manufacture of fabricated metal products other than motor vehicles (NACE 28), and sale, repair and maintenance of motor vehicles and motor cycles (NACE 50) (Figure 5.2). The consumed amount in decorative paint application (NFR extention 3A i) and industrial paint application (NFR extention 3A ii) were approximately the same in 2007, and the difference in emissions is due to different emission factors.

Estimating emissions of NMVOC from solvent and other product use Reports 2009/14
30 Statistisk sentralbyrå
Figure 5.2. NMVOC emissions in NFR extentions 3A i-iii, by industrial sector, 2007. Tonnes
0
1 000
2 000
3 000
4 000
5 000
6 000
Decorative paint application(3A i)
Industrial paint application(3A ii)
Other paint application (3A iii)
Tonnes
Construction (NACE 45)
Private households and public use (no NACE)
Manufacture of non-motor vehicle transport equipent (NACE 35)
Manufacture of fabricated metal products, except machinery and equipment (NACE 28)
Sale, maintenance, and repair of motor vehicles and motor cycles (NACE 50)
Other
5.2.2. Degreasing and dry cleaning (3B) The emissions of NMVOC from degreasing and dry cleaning are very low, and have been consistently so since 1993. There was a considerable fall in emissions from 1992-1993. In the mid-90’s, the CFC machinery used in dry cleaning was phased out (Thorud et al. 1997). Such a change in machinery used might also have led to a reduction in emissions of non-CFC gases. Degreasing (NFR extention 3B i, see Appendix A5) is the smallest of the three NFR extentions within this NFR/CRF code (Figure 5.3). Here, degreasers used in the manufacturing industries (NACE 27-35) are allocated. Degreasers and other cleaning agents used in other sectors than the manufacturing industries are placed in source category 3B iii. Dry cleaning (NFR extention 3B ii) include cleaning agents, solvents and some other product types used in NACE 93 and 93.1.
Figure 5.3. Emissions of NMVOC in NFR extentions 3B i-iii, by product type, 2007. Tonnes
0
50
100
150
200
250
Degreasing (3B i)
Dry cleaning (3B ii)
Other (industrial cleaning) (3B iii)
Tonnes
OtherSolvents (O15)Degreasers and cleaning agents (R10)

Reports 2009/14 Estimating emissions of NMVOC from solvent and other product use
Statistisk sentralbyrå 31
5.2.3. Chemical products, manufature and processing (3C) According to the previous model, there was a considerable increase in the emissions of NMVOC from the chemical industry in the early 1990’s. As mentioned above, the dramatic decline from 2000 to 2005 is probably due to differences in source allocation between the new and previous model. The source category “Chemical products, manufacture and processing” (3C) does not have any further division into extentions according to the NFR reporting scheme. Included in this sector are emissions from substances consumed in manufacture of chemicals and chemical products (NACE 24) and manufacture of rubber and plastic products (NACE 25). In addition, styrene (CAS number 100-42-5) used as a solvent declared to public use (no NACE) and raw materials used in NACE 17-19 are included here. Styrene has no known area of application in private and public use, and it is assumed that this substance declared for this use is actually used in the manufacture of chemical products. All point source emissions (reported to the Norwegian Pollution Control Authority) from solvent and other product use are included in this source category. The emissions from point sources were reported to be the highest in the time series in 1992, with approximately 1 000 tonnes, while the reported emissions were the lowest in the time series in 2007, with only 270 tonnes.
5.2.4. Other- including products containing HMs and POPs (3D) The time series from 1989 to 2000 was adjusted both with the time series for NMVOC emissions from formic acid consumption, amounting to 1 000 to 3 000 tonnes per year, and with the emissions from the other substances with emission factor zero in the previous model, amounting to 1 693 tonnes per year (cf. section 4.8.2). In addition, the calculated emissions from the cosmetics side model were added to this source category for the years 2005 to 2007. The source category 3D is divided into four extentions according to the NFR reporting scheme (see Appendix A5). This source category is the largest of the CRF source categories, and the NFR source category 3D iv (“Other”) is the largest within this again (Figure 5.4).
Figure 5.4. Emissions within the NFR/CRF category 3D, by NFR extention, 2007. Tonnes
0
5 000
10 000
15 000
20 000
25 000
30 000
35 000
Printing (3D i)
Wood preservation (3D ii)
Domestic solvent use(3D iii)
Other (3D iv)
Tonnes

Estimating emissions of NMVOC from solvent and other product use Reports 2009/14
32 Statistisk sentralbyrå
The source category “printing” (NFR category 3D i) includes emissions from solvents and other products used in the printing and publishing industry (NACE 22). The most important product types are printing ink, solvents, and moisturisers. Preservation of wood (NFR category 3D ii) includes emissions from solvents and other products used in the manufacture of wood and of products of wood and cork (except furniture) (NACE 20). The most important product types are wood preservatives and wood impregnation agents. Domestic solvent use (NFR category 3D iii) includes emissions from solvents and other products deemed to be consumed in private households. This includes products declared used in retail sale of automotive fuel (NACE 50.5), retail trade (except motor vehicles) (NACE 52), recreational, cultural and sporting activities (NACE 92), private households and for public use (no NACE). The most important product types are degreasers and cleaning agents, anti-freezing agents, as well as biocides (Figure 5.5).
Figure 5.5. Emissions from most important product types within each sector in NFR extention 3D iii, 2007. Tonnes
0
500
1 000
1 500
2 000
2 500
3 000
3 500
4 000
4 500
5 000
Private households andpublic use (no NACE)
Retail trade, except motorvehicles (NACE 52)
Sale, maintenance and repairof motor vehicles and retail
trade of automotive fuel(NACE 50)
Industrial sector
Tonnes
Other
Anti-freezing agents (A40)Biocides (B15)
Solvents (O15)Degreasers and cleaning agents (R10)
Product types
Figure 5.6. Emissions from most important product types within dominant sectors in NFR extention 3D iv, 2007. Tonnes
0 1 000 2 000 3 000 4 000 5 000 6 000 7 000 8 000
Other
Sale, maintenance and repair of motor vehicles (50)
Manufacture of chemicals and chemical products (24)
Construction (45)
Manufacture of other transport equipments (35)
Manufacture of furniture etc (36)
Manufacture of food products and beverages (15)
Agriculture (1)
Extraction of crude oil (11)
Industrial sector
Tonnes
AllBinding agents (B20)Biocides (B15)Construction materials (K35)Degreasers and cleaning agents (R10)Anti-freezing agents (A40)OtherEnsilage means (S42)Solvents (O15)
Product types

Reports 2009/14 Estimating emissions of NMVOC from solvent and other product use
Statistisk sentralbyrå 33
The NFR source extention 3D iv has the largest emissions of the four extentions within 3D (Figure 5.6). This group includes emissions that do not have a natural place in any other source category, such as biocides used in chemical industry (NACE 24) and the manufacture of furniture (NACE 36), solvents used in the manufacture of other transport equipment (NACE 35) and construction (NACE 45), degreasers and other cleaning agents used in sale, maintenance and repair of motor vehicles and retail trade of automotive fuel (NACE 50), ensilage means used in agriculture (NACE 1) and manufacture of food product and beverages (NACE 15), and cooling agents used in the sale, maintenance and repair of motor vehicles and retail trade of automotive fuel (NACE 50).
5.3. Main emission sources 2005-2007 For a more detailed analysis of the emissions from specific products and sectors, figures from 2005-2007 are used, as only the new model provides information on this level. The emissions of NMVOC are spread over a wide variety of substances, product types and sectors. The following analyses are based on emissions calculated from the main model, and are, if not stated otherwise, excluding emissions from point sources or the cosmetics side model. The total emissions from solvent and other product use are here disaggregated on a sector and product level, and do not follow the NFR reporting scheme.
5.3.1. Dominant substances To account for 95 per cent of the total NMVOC emissions from solvent and other product use in 2007, 57 substances need to be included (Appendix B2). Ethanol (CAS number 64-17-5) was the predominant substance, amounting to 25 per cent of total emissions, followed by naphtha (hydrodesulfurized heavy) (CAS number 64742-82-1) and ethylene glycol (CAS number 107-21-1) (Figure 5.7).
Figur 5.7. Substances contributing most to emissions of NMVOC from solvent and other product use, 2007. CAS number in parenthesis. Tonnes
0 2 000 4 000 6 000 8 000 10 000 12 000
Ethanol (64-17-5)
Naphtha (petroleum), hydrodesulfurized heavy (64742-82-1)
Ethylene glycol (107-21-1)
Formic acid (64-18-6)
Ethenyl-benzene (100-42-5)
2-propanol (67-63-0)
Naphtha (petroleum), hydrotreated heavy(64742-48-9)
Ethyldimethylbenzene (1330-20-7)
Distillates (petroleum), hydrotreated light (64742-47-8)
Formaldehyde (50-00-0)
Tonnes
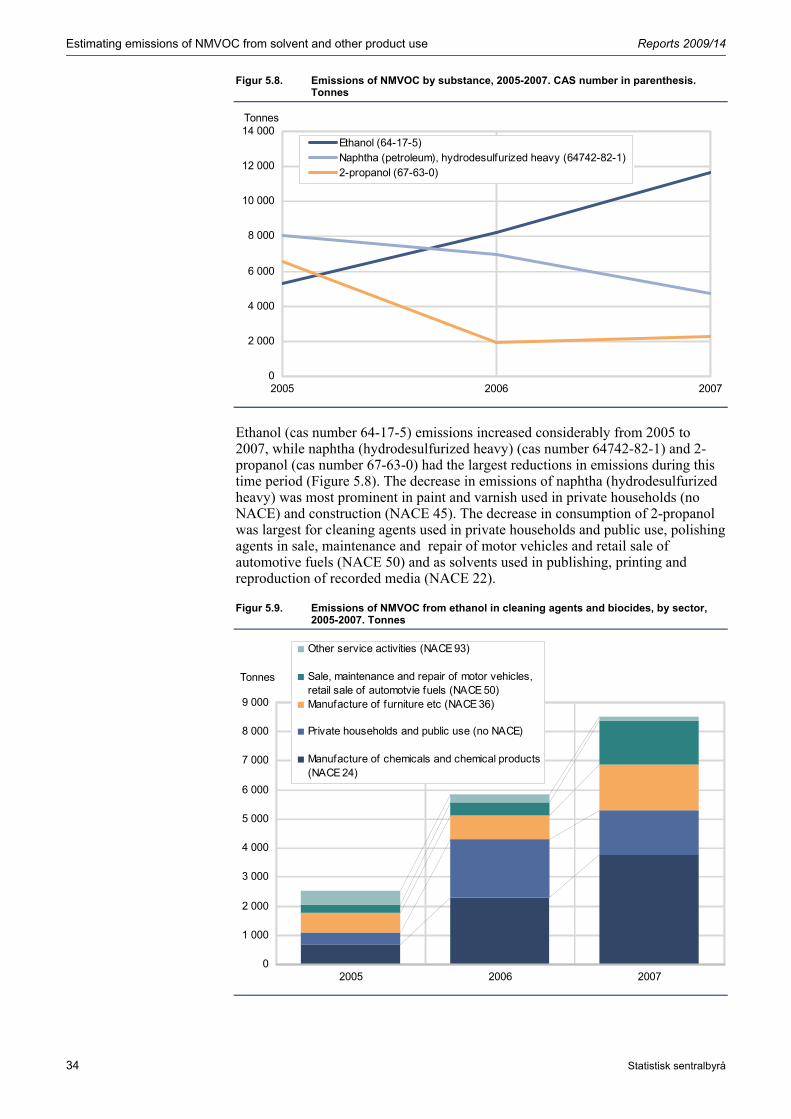
Estimating emissions of NMVOC from solvent and other product use Reports 2009/14
34 Statistisk sentralbyrå
Figur 5.8. Emissions of NMVOC by substance, 2005-2007. CAS number in parenthesis. Tonnes
0
2 000
4 000
6 000
8 000
10 000
12 000
14 000
2005 2006 2007
Tonnes
Ethanol (64-17-5)Naphtha (petroleum), hydrodesulfurized heavy (64742-82-1)2-propanol (67-63-0)
Ethanol (cas number 64-17-5) emissions increased considerably from 2005 to 2007, while naphtha (hydrodesulfurized heavy) (cas number 64742-82-1) and 2-propanol (cas number 67-63-0) had the largest reductions in emissions during this time period (Figure 5.8). The decrease in emissions of naphtha (hydrodesulfurized heavy) was most prominent in paint and varnish used in private households (no NACE) and construction (NACE 45). The decrease in consumption of 2-propanol was largest for cleaning agents used in private households and public use, polishing agents in sale, maintenance and repair of motor vehicles and retail sale of automotive fuels (NACE 50) and as solvents used in publishing, printing and reproduction of recorded media (NACE 22).
Figur 5.9. Emissions of NMVOC from ethanol in cleaning agents and biocides, by sector, 2005-2007. Tonnes
0
1 000
2 000
3 000
4 000
5 000
6 000
7 000
8 000
9 000
2005 2006 2007
Tonnes
Other service activities (NACE 93)
Sale, maintenance and repair of motor vehicles,retail sale of automotvie fuels (NACE 50)Manufacture of furniture etc (NACE 36)
Private households and public use (no NACE)
Manufacture of chemicals and chemical products(NACE 24)

Reports 2009/14 Estimating emissions of NMVOC from solvent and other product use
Statistisk sentralbyrå 35
Ethanol emissions increased most from the use of biocides and cleaning agents in the manufacture of chemicals and chemical products (NACE 24), manufacture of furniture etc. (NACE 36), private and public purposes (no NACE) and in sale, maintenance and repair of motor vehicles and retail sale of automotive fuels (NACE 50). This was partly counteracted by a decrease in use of these product types within other service activities (NACE 93) (Figure 5.9).
5.3.2. Dominant product types To account for 95 per cent of the total NMVOC emissions from solvent and other product use in 2007, 23 product type groups need to be included (Appendix B3). The ten most dominant of these product type groups are shown in Figure 5.10. In 2007, biocides was the product group contributing most to the emissions of NMVOC from solvent and other product use, followed by cleaning agents and paint and varnish (Figure 5.11). Cosmetics is a distinct product type group, and is included in Figure 5.11, even though these emission estimates do not stem from the main model (cf. section 4.7.2).
Figur 5.10. Product types contributing most to emissions of NMVOC, 2007. Tonnes
0 2 000 4 000 6 000 8 000 10 000
Other
Biocides
Cleaning agents
Paint and varnish
Solvents
Anti-freezing agents
Ensilage means
Cosmetics #1
Binding agents
Raw materials
Construction materials
Tonnes
Cosmetics 1
1 The emission estimate for cosmetics is based on production and import figures, as cosmetics are not subject to the duty of declaration.
The three product groups with the largest emissions are also the groups with the biggest numeric changes in emissions between 2005 and 2007 (Figure 5.11). The emissions from cleaning agents and paint and varnish have decreased during this period, while the emissions from biocides have increased. Biocides became subject to the duty of declaration in 2004, and it often takes some time before such changes in the duty of declaration are completely incorporated in the declaration routines of the declarants (Mette Follestad, Norwegian Product Register, pers. Comm 2008). At the same time the declarations of antifouling agents (growth inhibiting paint) were transferred from paint and varnish to biocides for paint containing biocides, and cleaning agents with an active component were moved from cleaning agents to biocides. These changes in declaration rules may account for some of the decrease in emissions from paint and varnish and cleaning agents and the concurrent increase in emissions from biocides. For cleaning agents, it is the consumption in private households and general use that has decreased. 2-propanol is the substance with the largest decrease in this

Estimating emissions of NMVOC from solvent and other product use Reports 2009/14
36 Statistisk sentralbyrå
product group. The amount of cleaning agents declared for use in maintenance and repair of motor vehicles, except for motor cycles (NACE 50.2), has also declined. Increased emissions of ethanol partly counteract this trend. For paint and varnish, the decrease in emissions is spread over a wide variety of sectors. The most prominent decline is found in private households, construction (NACE 45), and maintenance and repair of motor vehicles, except for motor cycles (NACE 50). This is probably due to a transition from use of solvent-based paint to use of water-based paint. This could possibly be a false trend, caused by the fact that the small amounts of NMVOCs in water-based paint are not included in the data (cf section 4.3.1), giving the impression that emissions were reduced when they were actually just transferred to water-based paints. However, the number of declarations in the product group paint and varnish increases within each of the sectors where we find a reduction in emissions during the time period in question, and thus it seems unlikely that this is the cause of the reduction in emissions. The increase in emissions from biocides is mainly caused by increased use of ethanol (CAS number 64-17-5) in the manufacturing industries (NACE 24 and 36).
Figur 5.11. Emissions of NMVOC by product type group, 2005-2007. Tonnes
0
2 000
4 000
6 000
8 000
10 000
12 000
2005 2006 2007
Tonnes
Cleaning agentsPaint and varnishBiocides
5.3.3. Dominant industrial sectors To account for 95 per cent of the total NMVOC emissions from solvent and other product use in 2007 (not including point source emissions and emissions from cosmetics), 22 industrial sectors need to be included (Appendix B4). The ten most dominant of these sectors are shown in Figure 5.12. There are emissions of NMVOC from a large array of sectors, but the most predominant are construction (NACE 45), private households (no NACE), sale, maintenance and repair of motor vehicles and retail sale of automotive fuels (NACE 50), and manufacture of chemicals and chemical products (NACE 24). There is a large decrease in emissions of NMVOC from private and public use of solvents (no NACE), construction (NACE 45) and from sale, maintenance and repair of motor vehicles and retail sale of automotive fuel (NACE 50), while the emissions increase in manufacture of furniture, manufacturing n.e.c. (NACE 36), manufacture of chemicals and chemical products (NACE 24), and retail trade, except motor vehicles and motor cycles (NACE 52) (Figure 5.13).

Reports 2009/14 Estimating emissions of NMVOC from solvent and other product use
Statistisk sentralbyrå 37
Figur 5.12. Industrial sectors contributing most to NMVOC emissions, 2007. Tonnes
0 2 000 4 000 6 000 8 000 10 000
Other
Construction (NACE 45)
Private and public use (no NACE)
Sale, maintenance and repair of motor vehicles,retail sale of automotive fuel (NACE 50)
Manufacture of chemicals and chemicalproducts (NACE 24)
Manufacture of ships, aircrafts, motor cyclesand train engines (NACE 35)
Manufature of furniture etc (NACE 36)
Manufacture of food products and beverages(NACE 15)
Agriculture, hunting and related serviceactivities (NACE 1)
Retail trade, except of motor vehicles and motorcycles (NACE 52)
Extraction of crude petroleum and natural gas(NACE 11)
Tonnes
Figur 5.13. Emissons of NMVOC by industrial sector, 2005-2007. Tonnes
0
2 000
4 000
6 000
8 000
10 000
12 000
14 000
2005 2006 2007
Tonnes
Private households and public use (no NACE)
Construction (NACE 45)
Sale, maintenance and repair of motor vehicles,retail sale of automotive fuel (NACE 50)Manufacture of furniture etc (NACE 36)
Manufacture of chemicals and chemicalproducts (NACE 24)Retail trade, except for motor vehicles andmotor cycles (NACE 52)

Estimating emissions of NMVOC from solvent and other product use Reports 2009/14
38 Statistisk sentralbyrå
5.4. Uncertainty The uncertainty in level in the total NMVOC emissions are given in Table 5.2, and the uncertainty in trend is given in Table 5.3. The uncertainty in absolute numbers is similar for both level and trend. The uncertainty for level is calculated to be percentually low, between 2.5 and 4.6 per cent. The 95 per cent confidence intervals for the trend do not include the value zero for any years, and all between-year changes in emissions are thus significant. The uncertainty analysis is performed only for the new data source, and thus the time series is quite short. The uncertainty in trend is thus not an estimate of the uncertainty in the long-term trend in NMVOC emissions.
Table 5.2. Uncertainty estimates for level in NMVOC emissions, 2005-2007. Tonnes and per cent
Uncertainty in level Negative (n) (tonnes)
Negative (n) (per cent of total emissions)
Positive (p) (tonnes)
Positive (p) (per cent of total emissions)
2005 ......................... 2 288 4.58 1 437 2.882006 ......................... 1 651 3.70 1 103 2.472007 ......................... 1 299 2.79 1 168 2.51
Table 5.3. Uncertainty estimates for trend in NMVOC emissions, 2005-2007. Tonnes and per cent
Uncertainty in trend Negative (n) (tonnes)
Negative (n) (per cent of
cange in emissions)
Positive (p) (tonnes)
Postive (p) (per cent of
change in emissions)
95 per cent confidence interval
for change(tonnes)
2005-2006 .............. 2 135 40.8 1 067 20.4 (-7 366, -4 164)2006-2007 .............. 1 420 77.7 947 51.8 (407, 2 774)2005-2007 .............. 1 882 55.3 1 076 31.6 (-5 286, -2 328)
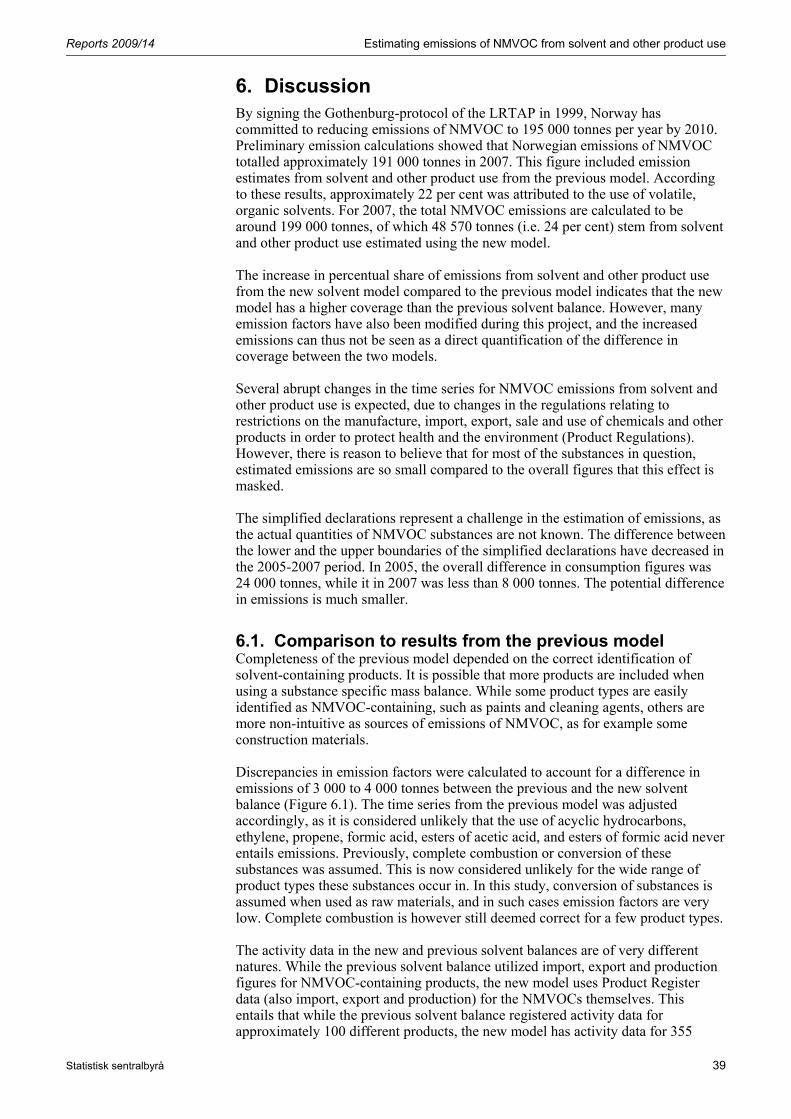
Reports 2009/14 Estimating emissions of NMVOC from solvent and other product use
Statistisk sentralbyrå 39
6. Discussion By signing the Gothenburg-protocol of the LRTAP in 1999, Norway has committed to reducing emissions of NMVOC to 195 000 tonnes per year by 2010. Preliminary emission calculations showed that Norwegian emissions of NMVOC totalled approximately 191 000 tonnes in 2007. This figure included emission estimates from solvent and other product use from the previous model. According to these results, approximately 22 per cent was attributed to the use of volatile, organic solvents. For 2007, the total NMVOC emissions are calculated to be around 199 000 tonnes, of which 48 570 tonnes (i.e. 24 per cent) stem from solvent and other product use estimated using the new model. The increase in percentual share of emissions from solvent and other product use from the new solvent model compared to the previous model indicates that the new model has a higher coverage than the previous solvent balance. However, many emission factors have also been modified during this project, and the increased emissions can thus not be seen as a direct quantification of the difference in coverage between the two models. Several abrupt changes in the time series for NMVOC emissions from solvent and other product use is expected, due to changes in the regulations relating to restrictions on the manufacture, import, export, sale and use of chemicals and other products in order to protect health and the environment (Product Regulations). However, there is reason to believe that for most of the substances in question, estimated emissions are so small compared to the overall figures that this effect is masked. The simplified declarations represent a challenge in the estimation of emissions, as the actual quantities of NMVOC substances are not known. The difference between the lower and the upper boundaries of the simplified declarations have decreased in the 2005-2007 period. In 2005, the overall difference in consumption figures was 24 000 tonnes, while it in 2007 was less than 8 000 tonnes. The potential difference in emissions is much smaller.
6.1. Comparison to results from the previous model Completeness of the previous model depended on the correct identification of solvent-containing products. It is possible that more products are included when using a substance specific mass balance. While some product types are easily identified as NMVOC-containing, such as paints and cleaning agents, others are more non-intuitive as sources of emissions of NMVOC, as for example some construction materials. Discrepancies in emission factors were calculated to account for a difference in emissions of 3 000 to 4 000 tonnes between the previous and the new solvent balance (Figure 6.1). The time series from the previous model was adjusted accordingly, as it is considered unlikely that the use of acyclic hydrocarbons, ethylene, propene, formic acid, esters of acetic acid, and esters of formic acid never entails emissions. Previously, complete combustion or conversion of these substances was assumed. This is now considered unlikely for the wide range of product types these substances occur in. In this study, conversion of substances is assumed when used as raw materials, and in such cases emission factors are very low. Complete combustion is however still deemed correct for a few product types. The activity data in the new and previous solvent balances are of very different natures. While the previous solvent balance utilized import, export and production figures for NMVOC-containing products, the new model uses Product Register data (also import, export and production) for the NMVOCs themselves. This entails that while the previous solvent balance registered activity data for approximately 100 different products, the new model has activity data for 355

Estimating emissions of NMVOC from solvent and other product use Reports 2009/14
40 Statistisk sentralbyrå
substances. The comparison between these two methods is thus not straightforward, and a thorough assessment of discrepancies in emission factors between the two models has not been performed.
Figur 6.1. NMVOC emissons from solvent and other product use in the new and the previous model and adjustments made to the previous model, 1989-2007. Tonnes
0
10 000
20 000
30 000
40 000
50 000
60 000
1989 1991 1993 1995 1997 1999 2001 2003 2005 2007
Tonnes
New modelPrevious modelAdjustments
One of the substances for which the emission factor was erroneously set to zero in the previous model is formic acid. In the old model, it was assumed that all formic acid was converted into other non-volatile compounds. However, for formic acid used for ensilaging this is not the case, and this usage makes a substantial contribution to emissions in source category 3D. The calculated emissions from formic acid were 3 600 tonnes in 2005, 2 500 tonnes in 2006 and 3 600 tonnes in 2007. Removing these emissions from the solvent balance would bring us to a level similar to the emissions from the previous solvent balance. Emissions of formic acid used for ensilage was added to the previous model, based on production numbers and the relationship between emissions from new model and production numbers from production statistics. In the previous model, emissions from production of chemicals and chemical products (NFR/CRF 3C) were considerable, while this source is insignificant in the new model. On the other hand, the emissions from CRF category 3D - Other, is much higher in the new than in the previous model. The allocation of biocides used in the chemical industry may account for much of this difference. In the present model, it is deemed that these products are not used in the production process itself, but as biocides for disinfecting the machinery etc.
6.2. Comparison to the results in other countries The emissions in Norway, estimated in kilos per inhabitant, is somewhat higher than in countries for which the estimation method is comparable, namely Sweden and the United Kingdom. The SPIN database (Nordic Product Registers 2008) can be used to compare amounts declared to different industries in Sweden, Denmark, Finland and Norway. This database contains information about declared amounts of substances in the Nordic countries, and does not have information about NMVOC substances in particular. The total amount for a particular industrial sector can however give an indication as to the activity level within this industry in Sweden and Norway. Calculated NMVOC emissions per inhabitant for Norway, Sweden and the United Kingdom in 2005 are given in Table 6.1. For Norway, the estimates are based on emissions calculated in the new model, and for Sweden and the United Kingdom the emission estimates reported to the Centre on Emission

Reports 2009/14 Estimating emissions of NMVOC from solvent and other product use
Statistisk sentralbyrå 41
Inventories and and Projections (CEIP) are used (CEIP 2008). The population numbers are gathered from the United Nations demography Yearbook (United Nations 2008). Denmark and Finland uses different approaches than Norway for calculating emissions of NMVOC from solvent and other product use, and the Norwegian emissions are thus not compared to the emissions from these countries in the following.
Table 6.1. NMVOC emissions in Norway, Sweden, and United Kingdom by NFR/CRF source category, 2005. Kilos per inhabitant
NFR/CRF source category Norway Sweden UnitedKingdom
TOTAL PER INHABITANT .......................................................... 11.220 7.762 6.7293 A PAINT APPLICATION .......................................................... 2.471 1.846 1.9483 B DEGREASING AND DRY CLEANING ...................................... 0.125 0.014 0.5123 C CHEMICAL PRODUCTS, MANUFACTURE AND PROCESSING ... 0.195 0.085 0.2463 D OTHER including products containing HMs and POPs ................ 8.429 5.817 4.024
6.2.1. Paint application (3A) The emissions per inhabitant in this group are similar to the emissions per inhabitant in Sweden and the UK, though in the high end of the range. Approximately 2.5 kilos per inhabitant were emitted from this source in Norway in 2005. Renovation of private households is widespread in Norway, and this may account for the relatively high emissions from the use of paint and varnish.
6.2.2. Degreasing and dry cleaning (3B) The Norwegian model includes degreasing as well as dry cleaning, while Sweden only includes dry cleaning, and this can account for the higher emissions in this NFR/CRF sector in Norway. The United Kingdom has higher estimates in this source than both Sweden and Norway. The reason for this discrepancy is not known.
6.2.3. Chemical products, manufacture and processing (3C) The emissions from this sector were higher in Norway than in Sweden in 2005 and lower in Norway than in the UK in the same year. The emissions were quite low; approximately 0.1 kilos per inhabitant in Norway. The reason why emissions are higher per inhabitant in Norway than in Sweden may be due to more exclusions in this source in the Swedish than in the Norwegian inventory. The Norwegian Product Register used the NACE codes at a more detailed level than the Swedish Product Register. On the other hand, the Swedish Product Register does not have the downwards 100 kilo limit for declaration that the Norwegian Product Register has. The consumption of substances in manufacture of chemicals and chemical products (NACE 24) was, per inhabitant, in the same order of magnitude in Sweden and Norway in 2005, according to the SPIN database (Nordic Product Registers 2008).
6.2.4. Other (3D) It is especially in this source category that the NMVOC emissions are estimated to be much higher for Norway than the other two countries in this comparison. One major reason for this is the use of formic acid. The consumption of formic acid is far higher in Norway than in Denmark and Sweden, and at similar levels as in Finland. The declared amount of formic acid was 50 440 tonnes in Norway and 20 403 tonnes in Sweden in 2005, according to the SPIN database (Nordic Product Registers 2008). The high consumption of ensilage means in Norway is due to the partiality towards acidified grass as winter forage. In Norway, almost 100 per cent of grass preserved as winter forage is silage (acified grass), while this fodder type constitutes only one third of the winter forage in Denmark. The sugar content is considerably lower in the grass types used in Norway, which calls for a higher use of ensilage means, and at the same time the conditions for drying of forage are more unpredictable in Norway than in Sweden and Denmark (Selmer-Olsen 2006). In Sweden, wilting prior to ensiling is more

Estimating emissions of NMVOC from solvent and other product use Reports 2009/14
42 Statistisk sentralbyrå
common than in Norway, and this reduces the necessary amount of silage additives. Thus, more ensilage means is required in order to preserve the grass properly in Norway. The consumption of concentrated cattle feed is also traditionally lower in Norway, and thus the demand for good ensilage has been higher. In addition to this, the wet and cold climate makes the season for outdoor grazing shorter, and the need for preserved food increases (Å. T. Randby, Norwegian University of Life Sciences, pers. comm. 2008).
6.3. Conclusions The new calculation method for emissions of NMVOC from solvents and other product use covers a wide range of substances and a wide range of industrial sectors and product types, and it is possible to study the emissions at a much more detailed level than the previous solvent balance. This facilitates a possible assessment of where to focus the attention when efforts to reduce the emissions take place. The coverage is deemed to be better for the new than for the previous model, and sufficient for reporting requirements. The emission factors have been evaluated and revised through a cooperation project between the Nordic countries. I addition, the new model makes no assumptions about solvent content in products, and is thus more accurate than the previous model.

Reports 2009/14 Estimating emissions of NMVOC from solvent and other product use
Statistisk sentralbyrå 43
7. Areas of methodological improvement While the new model has included most of the improvements deemed necessary for producing sufficient emission estimates of NMVOC from solvent and other product use, some potential further improvements have been identified. Some of these improvements are of such a character that they may be performed continuously as small projects and as part of the yearly update of the model. Main areas of improvement are given in prioritised order below. The priority-setting is based on the current assessment of the importance of the improvements as well as the expected resource need for each task.
7.1. Solvent balance
7.1.1. New NACE standard A new NACE standard (SIC2007) has been introduced (Statistics Norway 2007), and this new standard will entail revision of the emission factor matrix and the source allocation matrix. The new standard will need to be incorporated in this model when the model is updated with activity data for 2008 and onwards.
7.1.2. Emission factors Further efforts to identify and adopt emission factors from sources other than the ones currently in use, are recommended. The assumptions of similarity between Swedish and Norwegian conditions as well as the assumptions of similarities among industries need to be investigated, and if they prove not to be acceptable, new factors values have to be estimated. Reports from the Norwegian Pollution Control Authority and the Technical Guidance Document on Risk Assessment (European Chemicals Bureau 2003) can provide valuable information. In 2008, a joint project among the Nordic countries (Fauser et al. In prep) aimed at improving the emissions factors used in the calculations of emissions from solvent and other product use. Further cooperation between the Nordic countries in improving and assessing emission factors would be beneficial.
7.1.3. Activity data At present, the statistics on NMVOC only cover the emission of such substances as generated by use of products declared to the Norwegian Product Register in accordance with the duty of declaration. The emission estimates would undoubtedly benefit from increased quality and completeness of the Product Register data. The quality of the Product Register data could be improved by reducing the use of quantity intervals.
7.1.4. Hold up and accumulated amounts Some of the products declared to the Product Register a given year are probably stored and used (or exported) in subsequent years. The extent of this should be evaluated and possibly taken into account in the emission model, e.g. by using a moving average. Such an evaluation would entail contact with declarants, and would require involvement from the Product Register. Furthermore, when a product containing NMVOCs is used over several years, e.g. construction materials, the emissions will probably take place during the whole lifetime of the product. Such product-specific delay in emissions can be included in the current model, but a considerable amount of additional information is required. Some of this additional information may be available in the Norwegian Pollution Control Authority’s monitoring of dangerous substances in products (Norwegian Pollution Control Authority 2007).
7.1.5. Identifying raw materials Currently, some substances declared to the Product Register as raw materials are assumed to not be used as raw materials, while other substances not reported as
Estimating emissions of NMVOC from solvent and other product use Reports 2009/14
44 Statistisk sentralbyrå
such are assumed to be raw materials for other products (cf. section 3.2). To evaluate whether a substance is correctly identified as a raw material one could e.g. compare reported point sources to declared quantities of raw material used.
7.1.6. Treatment of hazardous waste A fraction of the solvent-containing products is handled as hazardous waste. This can be specified as a part of the emission factor in the new model (see section 3.1). Currently, no such waste management factors have been included in the model. In 2007, the solvent-containing products received for approved treatment amounted to approximately 100 tonnes for halogen-containing solvents, 6 160 tonnes for solvents not containing halogens, ten tonnes for trichloroethylene (TRI), and 12 600 tonnes paint and varnish (including two-component paint, solvent- and water based paint) (Statistics Norway 2009b). These amounts may seem considerable, but the declared amounts are the total weight delivered, including non-NMVOC substances in the products and packaging. There may also be some evaporation of NMVOCs during handling and repackaging of the waste. For waste handling to be included in our model, the industrial sector and product type of the amounts delivered for approved handling need to be recognized in order to identify where in the emission factor matrix the reduction factors should be incorporated.
7.1.7. Conversion to CO2 emissions Currently, an average carbon content of 82 per cent is used when converting the NMVOC emissions to CO2 emissions (cf. section 3.7). This will not give an accurate figure of the amount of CO2 being produced by the emissions of NMVOC, as the NMVOC substances reported here have varying carbon content. By using the carbon content in each individual chemical, the estimate of CO2 emissions would be more accurate. Not all NMVOC included in the current model are of fossil origin. The substances of non-fossil origin should ideally not be included in the conversion to CO2 emissions, as the reporting according to the UNFCCC Reporting Guidelines should only include emissions of fossil origin. Thus, identifying substances of non-fossil origin and excluding these when converting to CO2 emissions would improve the accuracy of the reporting under the Kyoto protocol.
7.2. Other aspects
7.2.1. Point source specification The point sources referred to in this report (i.e. point sources reported to CRF/NFR 3C) are currently given as total NMVOC emissions, and are not given at the substance level (see section 4.7.1). These emissions can thus not be included in analyses on a refined level. The evaluation of the emissions from production of chemicals and chemical products (NFR/CRF category 3C) would benefit from more detailed information about the substances in question. Including point sources in a more refined conversion to CO2 emissions (cf. section 3.7) would also require emissions on a substance level. Such a specification of point sources would need to be undertaken by the Norwegian Pollution Control Authority, as point sources are reported directly to this authority.
7.2.2. Photochemical ozone creation potential Not all NMVOC have the same potential for ground level ozone production. The photochemical ozone creation potential (POCP) can be used to assess the potential ozone production as a result of emissions of NMVOCs, and is given as a value relative to the potential reference substance. Finding a POCP values for each VOC demands considerable effort, and the POCP values will depend on external factors as well as the chemical characteristics of the substance. However, much
Reports 2009/14 Estimating emissions of NMVOC from solvent and other product use
Statistisk sentralbyrå 45
information regarding POCP values relevant for European conditions have already been gathered (Altenstedt & Pleijel 1998). Because the model estimates emissions at the substance level, we have the opportunity to assess the ozone formation potential of the NMVOC emissions using POCP values. This elaboration would not be a response to reporting requirements, but a means of evaluating more explicitly the risk of ground level ozone production as a result of emissions of NMVOC. By calculating the POCP, it would also be possible to evaluate effects of substituting one NMVOC with another.
Estimating emissions of NMVOC from solvent and other product use Reports 2009/14
46 Statistisk sentralbyrå
References AEA Energy and Environment (2007): UK's National Atmospheric inventory http://www.naei.org.uk/ Altenstedt J. & Pleijel K. (1998): POCP for individual VOC under European conditions. IVL Swedish Environmental Research Institute Report B-1305 http://www.ivl.se/ American Chemical Society (2007): Chemical Abstract Services (CAS) http://www.cas.org Arbeids- og inkluderingsdepartementet (2005): Lov om arbeidsmiljø, arbeidstid og stillingsvern mv. (arbeidsmiljøloven) (Working environment act) LOV-2005-06-17-62 CEIP (2008): Centre on Emission Inventories and Projections http://www.ceip.at/ceip/ Economic Commission for Europe (2007): Guidance on implementation of the protocol on pollutant release and transfer registers http://www.unece.org/env/pp/prtr/guidance/PRTR_guidance_web_version.pdf European Chemicals Bureau (2003): Technical Guidance Document (TGD) for risk assessment on Risk Assessment of Chemical Substances following European Regulations and Directives - 2nd edition http://ecb.jrc.it/tgdoc European Environment Agency (2006): Emission Inventory Guidebook - 2006 (Internet version). Group 6: Solvent and other product use http://www.eea.europa.eu/publications/EMEPCORINAIR4/page015.html European Environment Agency (2007): Emission Inventory Guidebook - 2007 (Internet version) http://reports.eea.europa.eu/EMEPCORINAIR5/en/page002.html Fauser P., Saarinen K., Harðardóttir K., Kittilsen M.O., Holmengen N. & Skårman T. (In prep): Improvement of Nordic Emission Models for Solvent Use in Selected Sectors. Report Finansdepartementet (1989): The Statistics Act of 1989- Act No. 54 of June 16 1989, http://www.ssb.no/english/about_ssb/ Fischer S., Almkvist Å., Karlsson E. & Åkerblom M. (2005): Slutrapport från prosjektet: Framtagande av produktregisterbaserat ExponeringsIndex. Kemikalieinspektionen IPCC (2006a): 2006 IPCC Guidelines for National Greenhouse Gas Inventories http://www.ipcc-nggip.iges.or.jp/public/2006gl/index.html IPCC (2006b): 2006 IPCC Guidelines for National Greenhouse Gas Inventories- Chapter 7 Precursors and indirect emissions http://www.ipcc-nggip.iges.or.jp/public/2006gl/pdf/1_Volume1/V1_7_Ch7_Precursors_Indirect.pdf IVAM (2005): VOC emissions from cosmetics and cleaning agents. IVAM research and consultancy on sustainability, Amsterdam. ISO Doc. nr. 0526 Justis- og politidepartementet (2002): Lov om vern mot brann, eksplosjon og ulykker med farlig stoff og om brannvesenets redningsoppgaver (brann- og eksplosjonsvernloven) (Fire prevention act) LOV-2002-06-14-20

Reports 2009/14 Estimating emissions of NMVOC from solvent and other product use
Statistisk sentralbyrå 47
Kittilsen M.O. & Hansen K.L. (2008): Use and emissions of hazardous substances in Norway, 2002-2006. Based on data from the Norwegian Product Register. Rapporter 2008/24 Klimont Z., Amann M. & Cofala J. (2000): Estimating costs for controlling emissions of volatile organic compounds (VOC) from stationary sources in Europe. In. International institute for applied systems analysis (IIASA). Kraft J. & Follestad M. (2007): Farlige produkter. Fakta i tall og figurer. Rapport 2000-2006. Produktregisteret Miljøverndepartementet (1976): Lov om kontroll med produkter og forbrukertjenester (produktkontrolloven) (Product control act) LOV 1976-06-11 nr 79 Miljøverndepartementet (1998): Forskrift om deklarering og merking av mikrobiologiske produkter med et bruksområde som medfører tilføring til det ytre miljø. (Act on declaration and labelling of microbiological products) FOR-1998-01-22-93 Miljøverndepartementet (2004): Forskrift om begrensing av helse- og miljøfarlige kjemikalier og andre produkter (Produktforskriften) (Regulation on the restriction of use of hazardous chemicals and other products) For 2004-06-01-922 http://www.lovdata.no/cgi-wift/ldles?doc=/sf/sf/sf-20040601-0922.html Nordic Product Registers (2008): Substances in preparations in Nordic countries (SPIN) www.spin2000.net Norwegian Association of Cosmetics Toiletries and Fragrance Suppliers (KLF) (2008): Kosmetikkmarkedet i Norge 2003-2007 (The cosmetics market in Norway 2003-2007) http://www.klf.no/maindesign.asp?aid=282&gid=156 Norwegian Pollution Control Authority (2005): Kartlegging av omsetning av enkelte miljøskadelige stoffer i legemidler og kosmetikk. Report http://www.sft.no/miljoreferanse____35392.aspx Norwegian Pollution Control Authority (2007): Miljøgifter i produkter- data for 2005 (Environmental poisons in products - data for 2005) TA-2296/2007 Product Register (2007): Guidelines for declaration of chemical products. Appendix 6: NACE Codes and Appendix 7: Codes for product use (UCN) Rypdal K. (1995): Løsemiddelbalanse for Norge. Utslipp, forbruk og metode. Statens forurensningstilsyn, Oslo, Norge. Statens forurensningstilsyn, Rapport 95:02 Rypdal K. & Zhang l.-C. (2000): Uncertainties in the Norwegian greenhouse gas inventory. Statistics Norway. Report 2000/13 SAS Institue Inc. (1999a): The SAS system for Unix. SAS Institute Inc., Cary, NC SAS Institue Inc. (1999b): The SAS System for Windows. SAS Insitute Inc., Cary, NC Selmer-Olsen I. (2006): Bruk av ensileringsmiddel til å styre surfôrgjæringa i både retning og omfang (Use of ensilage means to control the forage fermentation both in direction and in extent). In: Plantemøtet Østlandet 2006- Plantevern, jord og miljø, økologisk jordbruk, korn, potet, grovfôr, kulturlandskap, grønnsaker (ed. Kristoffersen AØ). Bioforsk, pp. 174-175.

Estimating emissions of NMVOC from solvent and other product use Reports 2009/14
48 Statistisk sentralbyrå
Skårman T., Danielsson H., Henningsson E. & Östmann M. (2006): Revised method for estimating emissions of NMVOC from solvent and other product use i Sweden Statistics Norway (2002): Standard Industrial Classification (SIC2002) http://www3.ssb.no/stabas/ItemsFrames.asp?ID=3152101&Language=nb&VersionLevel=ClassVersion Statistics Norway (2007): Standard Industrial Classification (SIC2007) http://www3.ssb.no/stabas/ItemsFrames.asp?ID=5552001&Language=en Statistics Norway (2009a): Emissions of nitrogen oxides, NMVOC, sulphur dioxide and ammonia. 1990-2007*: Increase in NOX emissions http://www.ssb.no/english/subjects/01/04/10/agassn_en/ Statistics Norway (2009b): Hazardous waste http://www.ssb.no/english/subjects/01/05/30/ Thorud S., Rudfoss M. & Smoland G. (1997): Løsemiddeleksponering i norske renserier i perioden 1992-1996 (Solvent exposure in Norwegian dry cleaners from 1992-1996). Statens arbeidsmiljøinstitutt, Arbeidstilsynet. HD 1081/97 FOU

Reports 2009/14 Estimating emissions of NMVOC from solvent and other product use
Statistisk sentralbyrå 49
Appendix A
Substance- and code lists
A1: Substances included in this study Substances included in this study, supplied with CAS-numbers. Years present in the activity data is indicated with X.
Cas number Substance name 2005 2006 2007
50-00-0 Formaldehyde X X X
50-21-5 Propanoic acid, 2-hydroxy- X X X
50-32-8 Benzo(a)pyrene X X X
56-23-5 Carbon tetrachloride X X X
56-81-5 Glycerol X X X
57-13-6 Urea X X X
57-55-6 1,2-Propanediol X X X
60-29-7 Diethyl ether X X X
62-53-3 Aniline X X X
64-17-5 Ethanol X X X
64-18-6 Formic acid X X X
64-19-7 Acetic acid X X X
64-67-5 Diethyl sulphate X X X
66-25-1 1-hexanal X X X
67-56-1 Methanol X X X
67-63-0 2-propanol X X X
67-64-1 2-propanone (acetone) X X X
67-66-3 Chloroform X X X
67-68-5 Methane, sulfinylbis- X X X
68-12-2 N,N-Dimethylformamide X X X
69-72-7 Salicylic acid X X X
71-23-8 1-propanol X X X
71-36-3 1-butanol X X X
71-41-0 1-pentanol X X X
71-43-2 Benzene X X X
74-84-0 Ethane X X X
74-85-1 Ethylene X X X
74-86-2 Ethyne (acetylene) X X X
74-89-5 Methylamine X X X
74-98-6 Propane X X X
74-99-7 Propyne X X X
75-01-4 Vinyl chloride X X X
75-05-8 Acetonitrile X X X
75-07-0 Acetaldehyde X X X
75-08-1 Ethanethiol X
75-09-2 Dichloromethane X X X
75-21-8 Ethylene oxide X X X
75-28-5 Isobutane X X X
75-35-4 1,1-dichloroethene X
75-37-6 1,1-difluorothane X X X
75-45-6 Chlorodifluoromethane X X X
75-52-5 Nitromethane X
75-56-9 Methyloxirane X X X
75-64-9 Tert-butylamine X X X
75-65-0 2-propanol, 2-methyl- X X X
75-69-4 Trichlorofluoro-methane X X X
75-71-8 Dichlorodifluoro-methane X
75-83-2 2,2-dimethylbutane X X X
77-78-1 Dimethyl sulphate X
77-99-6 1,3-propanediol, 2-ethyl-2-(hydroxymethyl)- X X X
78-00-2 Tetraethyllead X X
78-59-1 2-cyclohexen-1-one, 3,5,5-trimethyl- X X X
78-78-4 2-methylbutane X X X
78-83-1 2-methyl-1-propanol X X X

Estimating emissions of NMVOC from solvent and other product use Reports 2009/14
50 Statistisk sentralbyrå
Cas number Substance name 2005 2006 2007
78-87-5 1,2-dichloropropane X X X
78-92-2 2-butanol X X X
78-93-3 2-butanone X X X
79-01-6 Trichloroethylene (TRI) X X X
79-06-1 Acrylamide X X X
79-09-4 Propanoic acid X X X
79-10-7 Acrylic acid X X X
79-20-9 Methyl acetate X X X
79-29-8 2,3-dimethylbutane X X X
79-33-4 Propanoic acid, 2-hydroxy-, (S)- X X X
79-41-4 Methacrylic acid X X X
80-43-3 Bis(alpha,alpha-dimethylbenzyl) peroxide X X X
80-56-8 Bicyclo[3.1.1]hept-2-ene, 2,6,6-trimethyl- X X X
80-62-6 Methyl methacrylate X X X
84-66-2 1,2-benzenedicarboxylic acid, diethyl ester X X X
85-44-9 Phthalic anhydride X X X
87-69-4 Butanedioic acid, 2,3-dihydroxy- [R-(R*,R*)]- X X X
90-12-0 Naphthalene, 1-methyl- X
91-17-8 Naphthalene, decahydro- X X X
91-20-3 Naphthalene X X X
91-57-6 Naphthalene, 2-methyl- X
91-66-7 N,N-diethylaniline X X X
92-52-4 Biphenyl X
94-36-0 Dibenzoyl peroxide X X X
95-47-6 Benzene, 1,2-dimethyl- X X X
95-48-7 o-cresol X X X
95-50-1 1,2-dichlorobenzene X X X
95-63-6 1,2,4-trimethylbenzene X X X
96-14-0 3-methylpentane X X X
96-29-7 2-butanone oxime X X X
96-33-3 Methyl acrylate X X X
96-48-0 2(3H)-furanone, dihydro- X X X
96-49-1 1,3-dioxolan-2-one X X X
97-64-3 Propanoic acid, 2-hydroxy-, ethyl ester X X X
97-88-1 Butyl methacrylate X X X
98-00-0 2-furanmethanol X X X
98-01-1 2-furaldehyde X X X
98-82-8 Cumene X X X
98-83-9 2-phenylpropene X X X
99-87-6 1-methyl-4-isopropylbenzene X X X
100-37-8 Ethanol, 2-(diethylamino)- X X X
100-41-4 Ethylbenzene X X X
100-42-5 Benzene, ethenyl- X X X
100-44-7 Alpha-chlorotoluene X X X
100-51-6 Benzenemethanol X X X
100-52-7 Benzaldehyde X X X
100-74-3 4-ethyl morpholine X X X
100-97-0 Methenamine X X X
101-68-8 4,4’-methylenediphenyl diisocyanate X X X
101-77-9 4,4’-methylenedianiline X X X
101-84-8 Benzene, 1,1’-oxybis- X X X
102-71-6 Triethanolamine X X X
102-76-1 1,2,3-propanetriol, triacetate X X X
103-11-7 2-ethylhexyl acrylate X X X
103-76-4 1-piperazineethanol X X
103-82-2 Phenylacetic acid X X X
103-83-3 Benzyldimethylamine X X X
104-68-7 Ethanol, 2-(2-phenoxyethoxy)- X X X
104-76-7 2-ethyl hexanol X X X
105-37-3 Ethyl propionate X
105-54-4 Ethyl butanoate X X X
105-59-9 Ethanol, 2,2’-(methylimino)bis- X X X
105-60-2 2H-azepin-2-one, hexahydro- X X X

Reports 2009/14 Estimating emissions of NMVOC from solvent and other product use
Statistisk sentralbyrå 51
Cas number Substance name 2005 2006 2007
106-42-3 Benzene, 1,1’-methylenebis [4-isocyanato-] X X X
106-44-5 ¤-kresol X X
106-46-7 1,4-dichlorobenzene X X X
106-51-4 p-benzoquinone X X X
106-65-0 Dimethyl succinate X X X
106-89-8 1-chloro-2,3-epoxypropane X X X
106-97-8 Butane X X X
106-99-0 Buta-1,3-diene X X X
107-06-2 1,2-dichloroethane X X X
107-12-0 Propionitrile X X X
107-13-1 Acrylonitrile X X X
107-15-3 1,2-ethanediamine X X X
107-18-6 2-propen-1-ol X X X
107-21-1 Ethylene glycol X X X
107-22-2 Glyoxal X X X
107-41-5 2-methyl-2,4-pentanediol X X X
107-46-0 Hexamethyldisiloxane X X X
107-83-5 2-methylpentane X X X
107-98-2 1-methoxy-2-propanol X X X
108-01-0 Ethanol, 2-(dimethylamino)- X X X
108-05-4 Acetic acid ethenyl ester X X X
108-08-7 2,4-dimethylpentane X X X
108-10-1 4-methyl-2-pentanone X X X
108-11-2 4-methyl-2-pentanol X X X
108-21-4 Acetic acid, 1-methylethyl ester X X X
108-24-7 Acetic anhydride X X X
108-31-6 Maleic anhydride X X X
108-32-7 1,3-dioxolan-2-one, 4-methyl- X X X
108-38-3 Benzene, 1,3-dimethyl- X X X
108-39-4 Phenol, 3-methyl- X X
108-46-3 1,3-benzenediol X X X
108-65-6 1-methoxy-2-propyl acetate X X X
108-67-8 Mesitylene X X X
108-78-1 1,3,5-triazine-2,4,6-triamine X X X
108-83-8 4-heptanone, 2,6-dimethyl- X X X
108-87-2 Methylcyclohexane X X X
108-88-3 Toluene X X X
108-90-7 Chlorobenzene X X X
108-91-8 Cyclohexanamine X X X
108-93-0 Cyclohexanol X X X
108-94-1 Cyclohexanone X X X
108-95-2 Phenol X X X
109-52-4 Valeric acid X
109-59-1 2-isopropoxyethanol X X X
109-60-4 Propyl acetate X X X
109-66-0 Pentane X X X
109-83-1 Ethanol, 2-(methylamino)- X X X
109-86-4 Ethanol, 2-methoxy- X X X
109-87-5 Dimethoxymethane X X X
109-99-9 Tetrahydrofuran X X X
110-12-3 5-methyl-2-hexanone X X X
110-15-6 Butanedioic acid X X X
110-17-8 Fumaric acid X X X
110-19-0 2-methylpropyl acetate X X X
110-43-0 2-heptanone X X X
110-54-3 N-hexane X X X
110-63-4 1,4-butanediol X X X
110-80-5 2-ethoxyethanol X X X
110-82-7 Cyclohexane X X X
110-85-0 Piperazine X X X
110-86-1 Pyridine X X
110-91-8 Morpholine X X X
110-94-1 Pentanedioic acid X X X

Estimating emissions of NMVOC from solvent and other product use Reports 2009/14
52 Statistisk sentralbyrå
Cas number Substance name 2005 2006 2007
110-98-5 2-propanol, 1,1’-oxybis- X X X
111-15-9 2-ethoxyethyl acetate X X X
111-27-3 1-hexanol X X X
111-30-8 Glutaral X X X
111-40-0 2,2’-iminodi(ethylamine) X X X
111-41-1 2-(2-aminoethylamino)ethanol X X X
111-42-2 Ethanol, 2,2’-iminobis- X X X
111-46-6 Ethanol, 2,2’-oxybis- X X X
111-65-9 Octane X X X
111-66-0 1-octene X X X
111-76-2 2-butoxyethanol X X X
111-77-3 2-(2-methoxyethoxy)-ethanol X X X
111-87-5 1-octanol X X X
111-90-0 2-(2-ethoxyethoxy)ethanol X X X
111-96-6 Bis(2-methoxyethyl) ether X X X
112-05-0 Nonanoic acid X X X
112-07-2 2-butoxyethyl acetate X X X
112-15-2 2-(2-ethoxyethoxy)ethyl acetate X X X
112-24-3 Trientine X X X
112-27-6 Ethanol, 2,2’-[1,2-ethanediylbis(oxy)]bis- X X X
112-34-5 2-(2-butoxyethoxy)ethanol X X X
112-35-6 Ethanol, 2-[2-(2-methoxyethoxy)ethoxy]- X X
115-07-1 Propylene X X X
115-10-6 Dimethyl ether X X X
115-11-7 2-metylpropen X X X
115-77-5 1,3-propanediol, 2,2-bis(hydroxymethyl)- X X X
116-14-3 Tetrafluoroethylene X X X
119-61-9 Benzophenone X X X
119-64-2 1,2,3,4-tetrahydronaphthalene X X X
120-12-7 Anthracene X
120-82-1 1,2,4-trichlorobenzene X X
121-44-8 Triethylamine X X X
121-69-7 N,N-dimethylaniline X X X
121-75-5 Malathion X X
123-31-9 Hydroquinone X X X
123-35-3 Myrcene X X X
123-42-2 4-methyl-4-hydroxy-2-pentanone X X X
123-51-3 3-methylbutanol X X X
123-54-6 2,4-pentanedione X X X
123-72-8 1-butanal X X X
123-86-4 Butyl acetate X X X
123-91-1 1,4-dioxane X X X
124-09-4 Hexamethylenediamine X X
124-17-4 2-(2-butoxyethoxy)ethyl acetate X X X
124-40-3 Dimethylamine X X X
124-68-5 2-amino-2-methylpropanol X X X
126-30-7 1,3-propanediol, 2,2-dimethyl- X X X
127-09-3 Sodium acetate X X X
127-18-4 Tetrachloroethene (PER) X X X
127-19-5 N,N-dimethylacetamide X X X
127-91-3 Bicyclo[3.1.1]heptane, 6,6-dimethyl-2-methylene- X X X
135-98-8 Sec-butylbenzene X X X
137-32-6 1-butanol, 2-methyl- X X X
138-86-3 Dipentene X X X
140-31-8 2-piperazin-1-ylethylamine X X X
140-88-5 Ethyl acrylate X X X
141-32-2 Butyl acrylate X X X
141-43-5 2-aminoethanol X X X
141-78-6 Ethyl acetate X X X
142-82-5 Heptane X X X
149-57-5 2-ethylhexanoic acid X X X
280-57-9 1,4-diazabicyclo[2.2.2]octane X X X
287-92-3 Cyclopentane X X X

Reports 2009/14 Estimating emissions of NMVOC from solvent and other product use
Statistisk sentralbyrå 53
Cas number Substance name 2005 2006 2007
298-12-4 Acetic acid, oxo- X X X
333-41-5 Diazinon X X X
354-33-6 Ethane, pentafluoro- X X X
463-82-1 Neopentane X X X
526-73-8 1,2,3-trimethylbenzene X X X
540-84-1 2,2,4-trimethylpentane X X X
541-05-9 Hexamethylcyclotrisiloxane X X
552-30-7 1,2,4-tricarboxylic acid 1,2-anhydride benzene X
556-67-2 Octamethylcyclotetrasiloxane (D4) X X X
584-84-9 4-methyl-m-phenylene diisocyanate X X X
592-41-6 1-hexene X X
622-96-8 4-ethyltoluene X X X
623-84-7 1,2-propanediol, diacetate X X X
624-92-0 Dimethyl disulphide X X X
627-93-0 Hexanedioic acid, dimethyl ester X X X
646-06-0 1,3-dioxolane X X X
682-11-1 1,3-propanediol, 2-ethyl-2-[(2-propenyloxy)methyl]- X
687-47-8 Etyl-(S)-2-hydroksypropionat X X X
763-69-9 Propanoic acid, 3-ethoxy-, ethyl ester X X X
770-35-4 2-propanol, 1-phenoxy- X X X
811-97-2 Ethane, 1,1,1,2-tetrafluo X X X
872-50-4 N-methyl pyrrolidone X X X
919-30-2 Aminopropyltrietoxysilan X X X
924-42-5 N-(hydroxymethyl) acrylamide X X
1119-40-0 Pentanedioic acid, dimethyl ester X X X
1120-21-4 Undecane X X X
1120-36-1 Tetradecane X
1300-71-6 Xylenol X X X
1319-77-3 Phenol, methyl- X X X
1320-67-8 Propanol, methoxy- X X X
1330-20-7 Ethyldimethylbenzene X X X
1338-23-4 2-butanone, peroxide X X X
1569-01-3 2-propanol, 1-propoxy- X X X
1569-02-4 1-ethoxy-2-propanol X X X
1589-47-5 2-methoxypropanol X X X
1634-04-4 2-methoxy-2-methylpropane X X X
1965-29-3 Ethanol, 2-[[2-[(2-aminoethyl)amino]ethyl]amino]- X X X
2768-02-7 Trimethoxyvinylsilane X X X
2807-30-9 Ethanol, 2-propoxy- X X X
2855-13-2 3-aminomethyl-3,5,5-trimethylcyclohexylamine X X X
3006-82-4 Hexaneperoxoic acid, 2-ethyl-, 1,1-dimethylethyl ester X X X
4767-03-7 2,2-bis(hydroxymethyl)propionic acid X X X
5131-66-8 2-propanol, 1-butoxy- X X X
5187-23-5 1,3-dioxane-5-methanol, 5-ethyl- X X X
5625-90-1 Morpholine, 4,4’-methylenebis- X X X
5989-27-5 (R)-p-mentha-1,8-diene X X X
5989-54-8 (S)-p-mentha-1,8-diene X X X
6876-12-6 Trans-1-methyl-4-(1-methylvinyl)cyclohexene X X X
7376-31-0 Bis[tris(hydroxyethyl)ammonium] sulphate X X X
7397-62-8 Acetic acid, hydroxy-, butyl ester X X X
7473-98-5 1-propanone, 2-hydroxy-2-methyl-1-phenyl- X X X
7705-14-8 (±)-1-methyl-4-(1-methylvinyl)cyclohexene X
8006-64-2 Turpentine, oil X X X
8008-20-6 Kerosine X X X
9002-86-2 Polyvinyl chloride X X X
9004-70-0 Cellulose, nitrate X X X
9005-90-7 Turpentine X X X
13466-78-9 Bicyclo[4.1.0]hept-3-ene, 3,7,7-trimethyl- X X X
13475-82-6 2,2,4,6,6-pentamethylheptane X X X
15821-83-7 1-propanol, 2-butoxy- X
19089-47-5 1-propanol, 2-ethoxy- X X X
19766-89-3 Sodium 2-ethylhexanoate X X X
25155-25-3 Peroxide, [phenylenebis(1-methylethylidene)]bis[(1,1- X X X

Estimating emissions of NMVOC from solvent and other product use Reports 2009/14
54 Statistisk sentralbyrå
Cas number Substance name 2005 2006 2007
dimethylethyl)]
25167-67-3 Butene X X X
25265-71-8 Propanol, oxybis- X X X
25265-77-4 2,2,4-trimethyl-1,3-pentanediol monoisobutyrate X X X
25339-17-7 Isodecanol X X X
25340-17-4 Diethylbenzene X X X
25498-49-1 Propanol, [2-(2-methoxymethylethoxy)methylethoxy]- X X X
26447-40-5 Methylenediphenyl diisocyanate X X X
26471-62-5 M-tolylidene diisocyanate X X X
29387-86-8 Propanol, butoxy- X X X
29911-27-1 2-propanol, 1-(1-methyl-2-propoxyethoxy)- X X X
29911-28-2 2-propanol, 1-(2-butoxy-1-methylethoxy)- X X X
30525-89-4 Paraformaldehyde X X X
34590-94-8 Methoxy-2-propoxy-2-propanol X X X
37187-22-7 2,4-pentanedione, peroxide X X X
51200-87-4 Oxazolidine, 4,4-dimethyl- X X X
51774-11-9 Isoheptanol X X X
52645-53-1 M-phenoxybenzyl 3-(2,2-dichlorovinyl)-2,2-dimethylcyclopropanecarboxylate
X X X
54839-24-6 1-ethoxy-2-propyl acetate X X X
55934-93-5 Propanol, [(butoxymethylethoxy)methylethoxy]- X X X
57350-24-0 1-propanol, 2-ethoxy-, acetate X X X
63231-51-6 Aromatic hydrocarbons X X X
64741-44-2 Distillates (petroleum), straight-run middle X X X
64742-47-8 Distillates (petroleum), hydrotreated light X X X
64742-48-9 Naphtha (petroleum), hydrotreated heavy X X X
64742-49-0 Naphtha (petroleum), hydrotreated light X X X
64742-81-0 Kerosine (petroleum), hydrodesulfurized X X X
64742-82-1 Naphtha (petroleum), hydrodesulfurized heavy X X X
64742-88-7 Solvent naphtha (petroleum), medium aliph. X X X
64742-89-8 Solvent naphtha (petroleum), light aliph. X X X
64742-94-5 Solvent naphtha (petroleum), heavy arom. X X X
64742-95-6 Solvent naphtha (petroleum), light arom. X X X
64742-96-7 Solvent naphtha (petroleum), heavy aliph. X X X
64771-72-8 Paraffins (petroleum), normal C5-2-0 X X X
67762-38-3 Fatty acids, C16-18 and C18-unsatd., Me esters X X X
68334-30-5 Fuels, diesel X X
68478-07-9 Naphtha (petroleum), light steam-cracked arom., piperylene conc., polymd.
X X X
68511-50-2 1-propene, 2-methyl-, sulfurized X X X
68551-07-5 Alcohols, C8-18 X X
70657-70-4 2-methoxypropyl acetate X X X
84540-57-8 Propanol, methoxy-, acetat X X X
85586-25-0 Fatty acids, rape-oil, Me esters X X X
90622-56-3 Alkanes, C7-10-iso- X X X
90622-57-4 Alkanes, C9-12-iso- X X X
90622-58-5 Alkanes, C11-15-iso- X X X
90669-79-7 Paraffins (petroleum), normal C5-20, acid- and clay-treated X X
91722-33-7 Tar, wood X X X
91770-15-9 Kerosine (petroleum), sweetened X X X
92045-36-8 Kerosine (petroleum), solvent-refined sweetened X X X
111109-77-4 Propane, oxybis[methoxy]- X X X

Reports 2009/14 Estimating emissions of NMVOC from solvent and other product use
Statistisk sentralbyrå 55
A2: Standard Industrial Classification (SIC2002/NACE) The standard for industrial classification (NACE) used in this model (Statistics Norway 2002b). NACE Title
1 Agriculture, hunting and related service activities
2 Forestry, logging and related service activities
5 Fishing, fish farming and related service activities
10 Mining of coal and lignite, extraction of peat
11 Extraction of crude petroleum and natural gas, service activities incidental to oil and gas extraction excluding surveying
12 Mining of uranium and thorium ores
13 Mining of metal ores
14 Other mining and quarrying
15 Manufacture of food products and beverages
16 Manufacture of tobacco products
17 Manufacture of textiles
18 Manufacture of wearing apparel, dressing and dyeing of fur
19 Tanning and dressing of leather, manufacture of luggage, handbags, saddlery, harness and footwear
20 Manufacture of wood and of products of wood and cork, except furniture, manufacture of articles of straw and plaiting materials
21 Manufacture of pulp, paper and paper products
22 Publishing, printing and reproduction of recorded media
23 Manufacture of coke, refined petroleum products and nuclear fuel
24 Manufacture of chemicals and chemical products
25 Manufacture of rubber and plastic products
26 Manufacture of other non-metallic mineral products
27 Manufacture of basic metals
28 Manufacture of fabricated metal products, except machinery and equipment
29 Manufacture of machinery and equipment n.e.c.
30 Manufacture of office machinery and computers
31 Manufacture of electrical machinery and apparatus n.e.c.
32 Manufacture of radio, television and communication equipment and apparatus
33 Manufacture of medical, precision and optical instruments, watches and clocks
34 Manufacture of motor vehicles, trailers and semi-trailers
35 Manufacture of other transport equipment
36 Manufacture of furniture, manufacturing n.e.c.
37 Recycling
40 Electricity, gas, steam and hot water supply
41 Collection, purification and distribution of water
45 Construction
50 Sale, maintenance and repair of motor vehicles and motorcycles, retail sale of automotive fuel
51 Wholesale trade and commission trade, except of motor vehicles and motorcycles
52 Retail trade, except of motor vehicles and motorcycles. Repair of personal and household goods
55 Hotels and restaurants
60 Land transport. transport via pipelines
61 Water transport
62 Air transport
63 Supporting and auxiliary transport activities, activities of travel agencies
64 Post and telecommunications
65 Financial intermediation, except insurance and pension funding
66 Insurance and pension funding, except compulsory social security
67 Activities auxiliary to financial intermediation
70 Real estate activities

Estimating emissions of NMVOC from solvent and other product use Reports 2009/14
56 Statistisk sentralbyrå
NACE Title
71 Renting of machinery and equipment without operator and of personal and household goods
72 Computers and related activities
73 Research and development
74 Other business activities
75 Public administration and defence, compulsory social security
80 Education
85 Health and social work
90 Sewage and refuse disposal, sanitation and similar activities
91 Activities of membership organizations n.e.c.
92 Recreational, cultural and sporting activities
93 Other service activities
95 Activities of households with employed persons
99 Extra-territorial organizations and bodies

Reports 2009/14 Estimating emissions of NMVOC from solvent and other product use
Statistisk sentralbyrå 57
A3: Use Code Nordic (UCN) UCN are product types developed by the Nordic Product Register Group – a subgroup under the Nordic Chemical Group – Nordic Council of Ministers (Product Register 2007)
Product code Product type
A05100 Filtration materials A05200 Filtration media A05250 Ion exchanger A05300 Air cleaners and anti-odour agents (not filters) A05400 Other absorbents and adsorbents A20100 Anti-scaling agents A25100 Anti-set-off agents A40100 De-icing agents A40200 Cooling agents A40300 Other anti-freezing agents A45100 Anti-clotting agents A50100 Anti-tack agents A55100 Anti-static agents A60100 Dressing agents (glazing agents, polishing agents) B15110 Human hygiene biocidal products (PT1) B15120 Private area and public health area disinfectants and other biocidal products (PT2) B15130 Veterinary hygiene biocidal products (PT3) B15140 Food and feed area disinfectants (PT4) B15142 Sanitation agents for toilets B15150 Drinking water disinfectants (PT5) B15310 In-can preservatives (PT6) B15315 Wood preservatives (PT8) B15320 Film preservatives (PT7) B15330 Fibre, leather, rubber and polymerised materials preservatives (PT9) B15340 Masonry preservatives (PT10) B15350 Preservatives for liquid-cooling and processing systems (PT11) B15360 Slimicides (PT12) B15370 Metalworking-fluid preservatives (PT13) B15510 Rodenticides (PT14) B15520 Avicides (PT15) B15530 Molluscicides (PT16) B15540 Piscicides (PT17) B15550 Insecticides, acaricides and products to control other arthropods (PT18) B15560 Repellents and attractants (PT19) B15710 Preservatives for food or feedstock (PT20) B15720 Antifouling (PT21) B15730 Embalming and taxidermist fluids (PT22) B15740 Control of other vertebrates (PT23) B16110 Insecticides B16120 Fungicides B16130 Herbicides (weed killers) B16140 Growth inhibitors B16150 Soil disinfection agents B16190 Other plant protection products B18100 Car care products B20100 Binding agents for paints, adhesives etc B20200 Binding agents for moulding sand B20300 Other binding agents B25200 Bleaching agents for textiles B25300 Other bleaching agents B30100 Blasting agents (sandblasting agents) B35100 Softeners for plastic, rubber, paint and adhesive B35200 Softeners - Softeners not included in B35100 B45100 Flame retardants B50100 Fire extinguishing agents B55100 Motor fuels B55150 Ignition gas B55200 Heating fuels B55300 Other fuels B60100 Anti-knocking agents B60200 Other fuel additives B65100 Deposit inhibitors D05100 Denaturing agents D15100 Propellants D20100 Industry perfumes - (odorants)
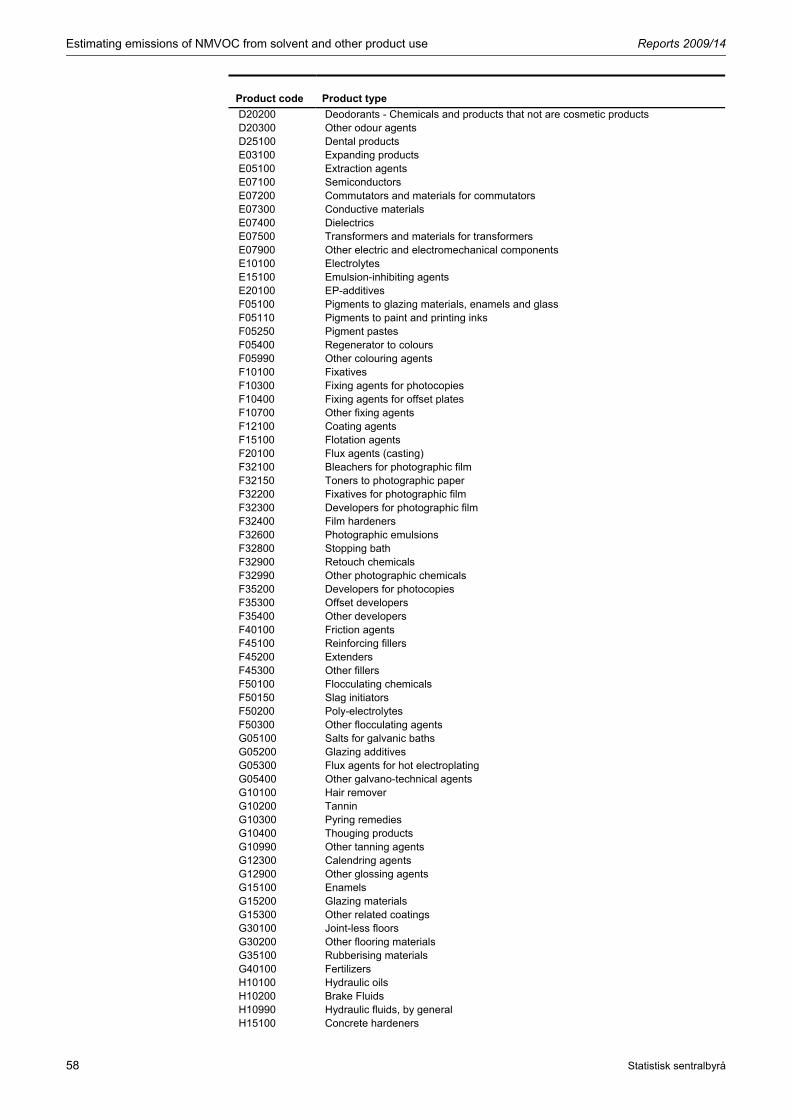
Estimating emissions of NMVOC from solvent and other product use Reports 2009/14
58 Statistisk sentralbyrå
Product code Product type
D20200 Deodorants - Chemicals and products that not are cosmetic products D20300 Other odour agents D25100 Dental products E03100 Expanding products E05100 Extraction agents E07100 Semiconductors E07200 Commutators and materials for commutators E07300 Conductive materials E07400 Dielectrics E07500 Transformers and materials for transformers E07900 Other electric and electromechanical components E10100 Electrolytes E15100 Emulsion-inhibiting agents E20100 EP-additives F05100 Pigments to glazing materials, enamels and glass F05110 Pigments to paint and printing inks F05250 Pigment pastes F05400 Regenerator to colours F05990 Other colouring agents F10100 Fixatives F10300 Fixing agents for photocopies F10400 Fixing agents for offset plates F10700 Other fixing agents F12100 Coating agents F15100 Flotation agents F20100 Flux agents (casting) F32100 Bleachers for photographic film F32150 Toners to photographic paper F32200 Fixatives for photographic film F32300 Developers for photographic film F32400 Film hardeners F32600 Photographic emulsions F32800 Stopping bath F32900 Retouch chemicals F32990 Other photographic chemicals F35200 Developers for photocopies F35300 Offset developers F35400 Other developers F40100 Friction agents F45100 Reinforcing fillers F45200 Extenders F45300 Other fillers F50100 Flocculating chemicals F50150 Slag initiators F50200 Poly-electrolytes F50300 Other flocculating agents G05100 Salts for galvanic baths G05200 Glazing additives G05300 Flux agents for hot electroplating G05400 Other galvano-technical agents G10100 Hair remover G10200 Tannin G10300 Pyring remedies G10400 Thouging products G10990 Other tanning agents G12300 Calendring agents G12900 Other glossing agents G15100 Enamels G15200 Glazing materials G15300 Other related coatings G30100 Joint-less floors G30200 Other flooring materials G35100 Rubberising materials G40100 Fertilizers H10100 Hydraulic oils H10200 Brake Fluids H10990 Hydraulic fluids, by general H15100 Concrete hardeners

Reports 2009/14 Estimating emissions of NMVOC from solvent and other product use
Statistisk sentralbyrå 59
Product code Product type
H15400 Plastic hardeners H15500 Other hardeners I05100 Leather impregnation agents I05200 Paper impregnation agents I05300 Textile impregnation agents I05400 Wood impregnation agents , wood preserving agents I05450 Closing net proofing I05500 Other impregnation agents I15100 Fire prevention materials I15200 Other thermic insulating materials I15300 Electric current insulation materials I15400 Sound insulating materials I15500 Light insulating materials I15600 Other insulation materials K15100 Coagulating agents K20100 Sequestering agents K25100 Anti-mist agents K25200 Condensation removers K25300 Other anti-condensation agents K35100 Cement/concrete/mortar K35120 Fireproof cement K35200 Plastic construction materials K35300 Steel construction materials K35500 Road construction materials K35900 Other construction materials K40100 Contactors (electrical) K45100 Correction lacquers (offices) K45200 Correction lacquers (printing plates) K45400 Erasing fluid K45500 Eraser (rubber) K45600 Other correction materials K52110 Shaving foams K52120 Shaving creams and lotions K52190 Other shaving products K52210 Body lotions K52220 Face creams K52230 Eye creams K52240 Hands creams K52250 Leg creams K52260 Foot creams K52270 Exfoliating creme K52280 Depilatories K52290 Sunbathing creams K52300 After sun preparations K52310 Skin cleaning products and soap (toilet soaps, deodorant soaps, bath foams,
shower gels) K52320 Eye make-up removers K52330 Make-up removers K52350 Skin tonic K52360 Bath salts and oils K52370 Skin protection preparations K52380 Face masks K52390 Face steam bath K52400 Anti-wrinkle products K52410 Massage oils K52420 Body powders K52430 Products for external intimate hygiene K52440 Skin-whitening products K52450 Corn remedies K52460 Deodorants K52470 Antiperspirants K52480 Skin care preparations for babies K52490 Other skin care preparations K52510 Hair bleaches K52520 Hair dye permanent K52530 Hair dye, semi-permanent K52540 Hair dye, temporary K52550 Hair cosmetics K52560 Hair cleansing products (shampoos, powders etc)
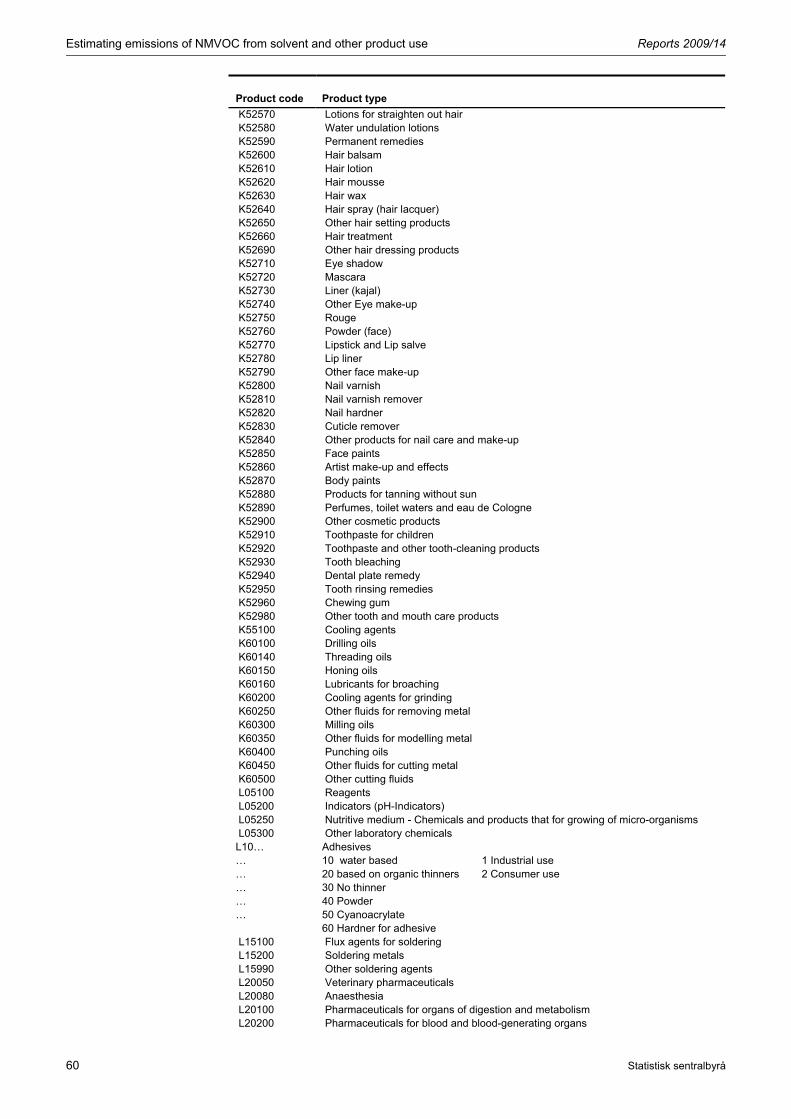
Estimating emissions of NMVOC from solvent and other product use Reports 2009/14
60 Statistisk sentralbyrå
Product code Product type
K52570 Lotions for straighten out hair K52580 Water undulation lotions K52590 Permanent remedies K52600 Hair balsam K52610 Hair lotion K52620 Hair mousse K52630 Hair wax K52640 Hair spray (hair lacquer) K52650 Other hair setting products K52660 Hair treatment K52690 Other hair dressing products K52710 Eye shadow K52720 Mascara K52730 Liner (kajal) K52740 Other Eye make-up K52750 Rouge K52760 Powder (face) K52770 Lipstick and Lip salve K52780 Lip liner K52790 Other face make-up K52800 Nail varnish K52810 Nail varnish remover K52820 Nail hardner K52830 Cuticle remover K52840 Other products for nail care and make-up K52850 Face paints K52860 Artist make-up and effects K52870 Body paints K52880 Products for tanning without sun K52890 Perfumes, toilet waters and eau de Cologne K52900 Other cosmetic products K52910 Toothpaste for children K52920 Toothpaste and other tooth-cleaning products K52930 Tooth bleaching K52940 Dental plate remedy K52950 Tooth rinsing remedies K52960 Chewing gum K52980 Other tooth and mouth care products K55100 Cooling agents K60100 Drilling oils K60140 Threading oils K60150 Honing oils K60160 Lubricants for broaching K60200 Cooling agents for grinding K60250 Other fluids for removing metal K60300 Milling oils K60350 Other fluids for modelling metal K60400 Punching oils K60450 Other fluids for cutting metal K60500 Other cutting fluids L05100 Reagents L05200 Indicators (pH-Indicators) L05250 Nutritive medium - Chemicals and products that for growing of micro-organisms L05300 Other laboratory chemicals L10… Adhesives … 10 water based 1 Industrial use … 20 based on organic thinners 2 Consumer use … 30 No thinner … 40 Powder … 50 Cyanoacrylate 60 Hardner for adhesive L15100 Flux agents for soldering L15200 Soldering metals L15990 Other soldering agents L20050 Veterinary pharmaceuticals L20080 Anaesthesia L20100 Pharmaceuticals for organs of digestion and metabolism L20200 Pharmaceuticals for blood and blood-generating organs

Reports 2009/14 Estimating emissions of NMVOC from solvent and other product use
Statistisk sentralbyrå 61
Product code Product type
L20250 Pharmaceuticals for heart- and circulation L20300 Pharmaceuticals for skin treatment (dermatological agents) L20400 Pharmaceuticals for the urinary system (not sexual hormones) L20430 Sexual hormones (incl contraceptive (P-) pills) L20450 Hormones for systemic use L20500 Pharmaceuticals for infectious diseases, systemic preparations L20600 Pharmaceuticals for muscles, joints and bones L20700 Pharmaceuticals for the central nervous system L20800 Pharmaceuticals for respiration organs L20850 Pharmaceuticals for sense organs L20910 Al preparations L20920 Cytostatica and immune-suppressive preparations L20930 Other therapeutic preparations L20940 Diagnostic preparations L20960 Diet preparations L20990 Other pharmaceuticals M05… Paint and varnish … 1 Water based 1 Active biolgical/biocide
function (not antifouling) 1 Interior
… 2 Volatile organic thinner
2 Fire prevention 2 Exterior
… 3 Non volatile organic thinner eg Linseed oil
3 Active corrosion inhibitor
3 Industrial use
… 4 No thinner 4 Decorative/protection 4 Base colour for boats and ships
… 5 Powder based 9 Other (including road-, art-, furniture-, autopaint)
5 Powder based
… 6 Hardeners to paint and varnish
M08100 Additives for paint and varnishes not mentioned elsewhere in the table Pigments is not to be classified in this code
M10100 Remover for printing ink M10200 Graffiti removers M10300 Paint and varnish removers M15100 Metal staining agents M15200 Non-galvanic metal surface coatings (chromatisising agents) M15300 Hardening agents (metal, tarnishing agents) M15400 Rust removers M15500 Other surface treatment of metal O15100 Solvents O25100 Moisturizers O25200 Dispersion agents (carriers) O25300 Emulsifiers O25400 Anti foaming agents, foamreducing agents O25500 Other surface active agents O27100 Surface treatment for paper and cardboard O27200 Corroding agent for electronics O27300 Corroding agent for glass O27900 Other surface treatment for other non-metals O30100 Stove black polish O40100 Burnishing (bronzing) agents O40200 Other oxidation agents P01200 Bearing linings P01300 Gaskets, unspecified P01400 Gaskets for fuel engines P01600 Gaskets for pumps,machines, boilers etc P01900 Other gaskets P05100 PH-regulating agents P10050 Polishing agents for rubber materials P10100 Polishing agents for lacquers (car wax) P10150 Polishing agents for leather (incl shoe polish) P10200 Polishing agents for metal P10400 Polishing agents for furniture P10450 Polishing agents for plastic materials P10500 Wax and other polishing preparations for floors P10990 Other polishing agents P15100 Accelerators P15200 Activators P15300 Retarders P15400 Other inhibitors

Estimating emissions of NMVOC from solvent and other product use Reports 2009/14
62 Statistisk sentralbyrå
Product code Product type
P15500 Catalysts P15900 Process regulators R03100 Radioactive materials R05100 Reduction agents R10100 Degreasers (cold degreasing, de-waxing, de-polishing) R10130 Drain cleaners R10150 General cleaning/washing agents (floor wash, basic cleaning) R10160 Auto shampoo R10250 Glass- and window cleaner (window polish) R10330 High pressure cleaning/washing agents R10340 Anti-incrustators R10350 Lime deposit (calcium) remover R10370 Cleaning/washing agents for washing machines R10400 Cleaning/washing agents for dish washing (machines) R10450 Stove- and grill cleaning agents R10500 Spot (stain) removers R10600 Foam cleaning/washing agents R10700 Windscreen washing agents R10800 Carpet detergents R10970 Washing agents for textile (detergents) R10980 Optical whiteners R10990 Other cleaning/washing agents R15100 Cracking indicators R20100 Underseal materials, incl cavity seals R20200 Corrosion inhibitors R20900 Other anti-corrosion materials R30100 Raw materials for synthesis and intermediate products R30200 Raw materials for production of glass and ceramics R30300 Raw materials for production of rubber products R30400 Raw materials for production of semi-conductors R30500 Raw materials for production of cosmetics etc R30600 Raw materials for production of medicament/medicine R30700 Raw materials for production of metals R30800 Raw materials for production of plastics R30900 Raw materials for production of paper R30990 Other raw materials S05150 Oil sanitation agents S05200 Other sanitation agents S07100 Sensitisers for photocopies S07200 Sensitisers for serigraphy S07900 Other sensitisers S10100 Writing ink S10200 Ribbons S10300 Carbon paper S10400 Self-copying paper S10500 Spirit markers S10600 Other writing materials S15100 Foaming agents for solid materials, plastic, rubber etc S15200 Foaming agents for liquids S25100 Rinsing agents (for dish washing machines) S25500 Rinsing agents (textiles) S25990 Other rinsing agents S30100 Sludge treatment preparations S35100 Abrasives S40100 Oils and waxes for laths and shutters S40200 Casting slips for plastic etc S40300 Slip agents for modelling metal S40400 Slip agents for sand moulding S40500 Other anti-setoff agents S42100 Aroma boosters S42200 Ensilage means S42300 Nutrient - (included vitamins) S42500 Sweetening agents S42600 Food colours S42900 Other food and fodder additives S45110 Base Oils S45120 Brake grease S45150 Gear oils
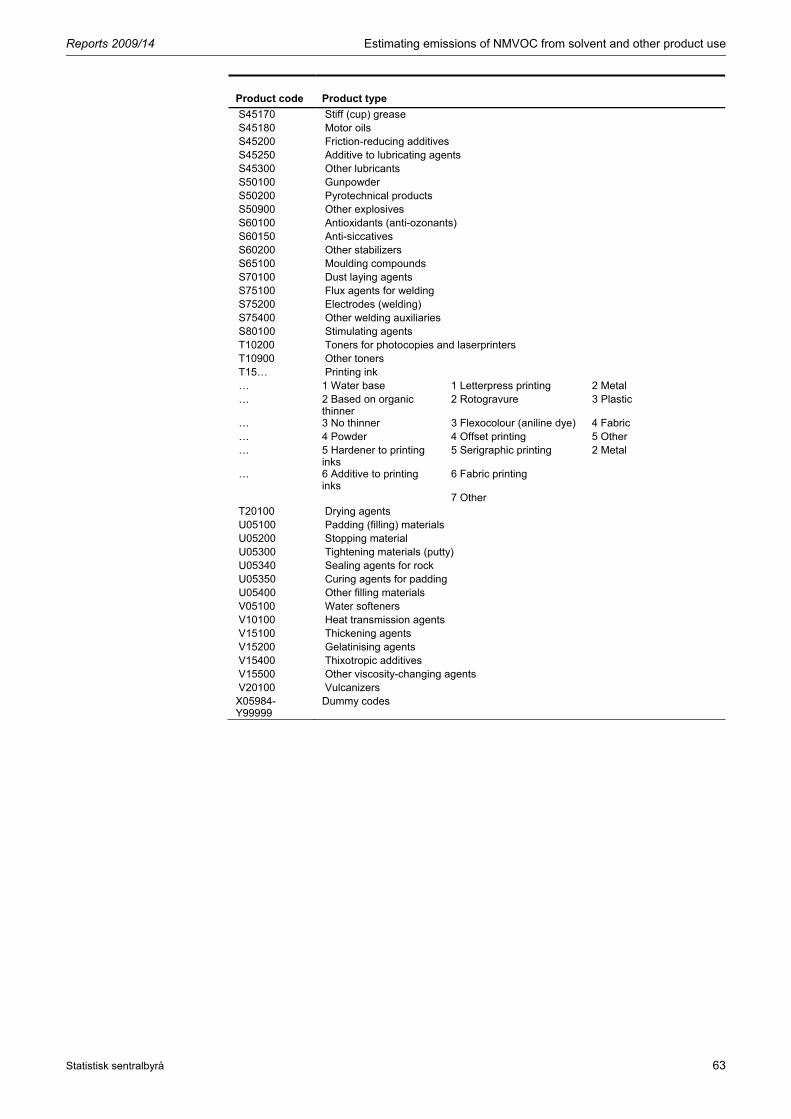
Reports 2009/14 Estimating emissions of NMVOC from solvent and other product use
Statistisk sentralbyrå 63
Product code Product type
S45170 Stiff (cup) grease S45180 Motor oils S45200 Friction-reducing additives S45250 Additive to lubricating agents S45300 Other lubricants S50100 Gunpowder S50200 Pyrotechnical products S50900 Other explosives S60100 Antioxidants (anti-ozonants) S60150 Anti-siccatives S60200 Other stabilizers S65100 Moulding compounds S70100 Dust laying agents S75100 Flux agents for welding S75200 Electrodes (welding) S75400 Other welding auxiliaries S80100 Stimulating agents T10200 Toners for photocopies and laserprinters T10900 Other toners T15… Printing ink … 1 Water base 1 Letterpress printing 2 Metal … 2 Based on organic
thinner 2 Rotogravure 3 Plastic
… 3 No thinner 3 Flexocolour (aniline dye) 4 Fabric … 4 Powder 4 Offset printing 5 Other … 5 Hardener to printing
inks 5 Serigraphic printing 2 Metal
… 6 Additive to printing inks
6 Fabric printing
7 Other T20100 Drying agents U05100 Padding (filling) materials U05200 Stopping material U05300 Tightening materials (putty) U05340 Sealing agents for rock U05350 Curing agents for padding U05400 Other filling materials V05100 Water softeners V10100 Heat transmission agents V15100 Thickening agents V15200 Gelatinising agents V15400 Thixotropic additives V15500 Other viscosity-changing agents V20100 Vulcanizers X05984-Y99999
Dummy codes
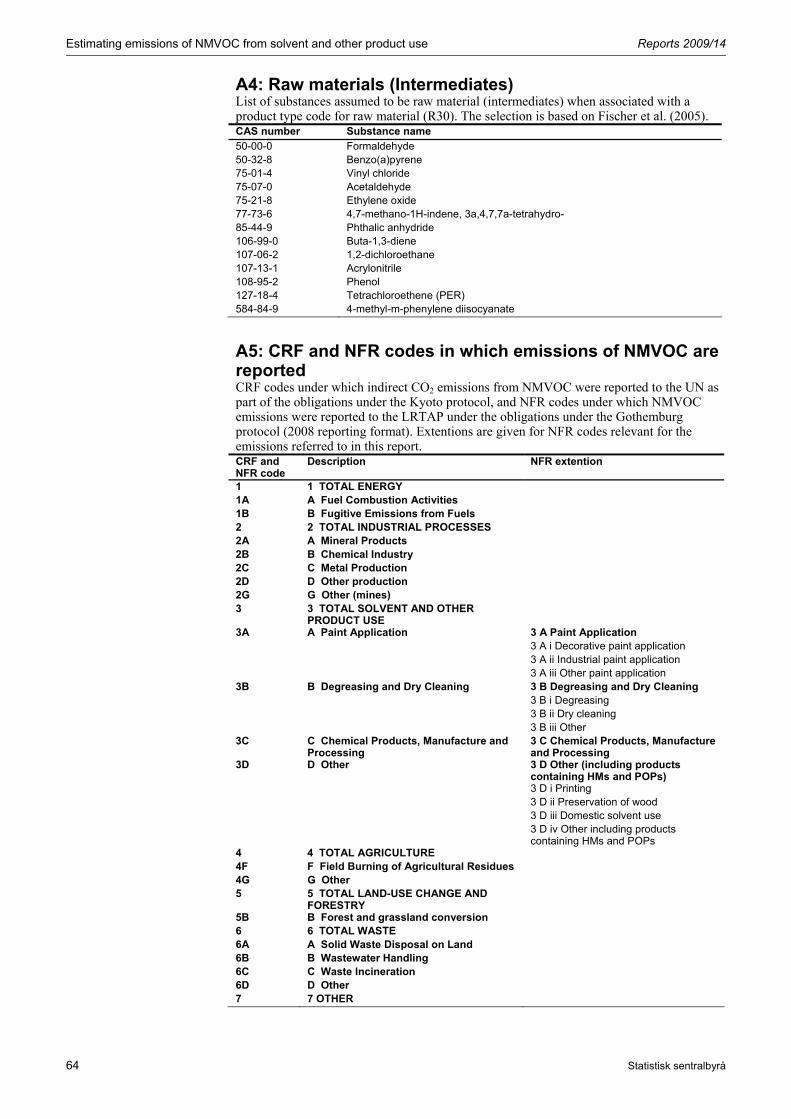
Estimating emissions of NMVOC from solvent and other product use Reports 2009/14
64 Statistisk sentralbyrå
A4: Raw materials (Intermediates) List of substances assumed to be raw material (intermediates) when associated with a product type code for raw material (R30). The selection is based on Fischer et al. (2005). CAS number Substance name
50-00-0 Formaldehyde 50-32-8 Benzo(a)pyrene 75-01-4 Vinyl chloride 75-07-0 Acetaldehyde 75-21-8 Ethylene oxide 77-73-6 4,7-methano-1H-indene, 3a,4,7,7a-tetrahydro- 85-44-9 Phthalic anhydride 106-99-0 Buta-1,3-diene 107-06-2 1,2-dichloroethane 107-13-1 Acrylonitrile 108-95-2 Phenol 127-18-4 Tetrachloroethene (PER) 584-84-9 4-methyl-m-phenylene diisocyanate
A5: CRF and NFR codes in which emissions of NMVOC are reported CRF codes under which indirect CO2 emissions from NMVOC were reported to the UN as part of the obligations under the Kyoto protocol, and NFR codes under which NMVOC emissions were reported to the LRTAP under the obligations under the Gothemburg protocol (2008 reporting format). Extentions are given for NFR codes relevant for the emissions referred to in this report. CRF and NFR code
Description NFR extention
1 1 TOTAL ENERGY 1A A Fuel Combustion Activities 1B B Fugitive Emissions from Fuels 2 2 TOTAL INDUSTRIAL PROCESSES 2A A Mineral Products 2B B Chemical Industry 2C C Metal Production 2D D Other production 2G G Other (mines) 3 3 TOTAL SOLVENT AND OTHER
PRODUCT USE
3A A Paint Application 3 A Paint Application 3 A i Decorative paint application 3 A ii Industrial paint application 3 A iii Other paint application 3B B Degreasing and Dry Cleaning 3 B Degreasing and Dry Cleaning 3 B i Degreasing 3 B ii Dry cleaning 3 B iii Other 3C C Chemical Products, Manufacture and
Processing 3 C Chemical Products, Manufacture and Processing
3D D Other 3 D Other (including products containing HMs and POPs)
3 D i Printing 3 D ii Preservation of wood 3 D iii Domestic solvent use 3 D iv Other including products
containing HMs and POPs 4 4 TOTAL AGRICULTURE 4F F Field Burning of Agricultural Residues 4G G Other 5 5 TOTAL LAND-USE CHANGE AND
FORESTRY
5B B Forest and grassland conversion 6 6 TOTAL WASTE 6A A Solid Waste Disposal on Land 6B B Wastewater Handling 6C C Waste Incineration 6D D Other 7 7 OTHER

Reports 2009/14 Estimating emissions of NMVOC from solvent and other product use
Statistisk sentralbyrå 65
A6: NFR source allocation Source allocation of CAS number, product type and NACE, based on the NFR sources with extentions. The product type codes (from and to) refer to Appendix A3 (chronologically) and the NACE codes (from and to) refer to Appendix A2 (chronologically). The CRF categories include the first number and letter in the NFR codes. CAS number Product type
(from) Product type (to)
NACE (from) NACE (to) NFR with extentions
All M05000 M08100 Private households Public use 3A i
All M05000 M08100 45.000 45.999 3A i
All M05000 M08100 51.000 52.999 3A i
All M05000 M08100 34.000 34.999 3A ii
All M05000 M08100 50.000 50.999 3A ii
All M05000 M08100 01.000 24.299 3A ii
All M05000 M08100 24.400 33.999 3A ii
All M05000 M08100 35.000 37.999 3A ii
All M05000 M08100 40.000 44.999 3A iii
All M05000 M08100 46.000 49.999 3A iii
All M05000 M08100 53.000 99.998 3A iii
All M05000 M08100 Ureg Ureg 3A iii
All R10100 R10100 27.000 35.999 3B i
All R10100 R10100 37.100 37.100 3B i
All A55100 A60100 93.000 93.019 3B ii
All B15120 B15120 93.000 93.019 3B ii
All B15140 B15140 93.000 93.019 3B ii
All B15330 B15330 93.000 93.019 3B ii
All B25200 B25200 93.000 93.019 3B ii
All B35200 B35200 93.000 93.019 3B ii
All D20300 D20300 93.000 93.019 3B ii
All F05990 F05990 93.000 93.019 3B ii
All G10400 G10400 93.000 93.019 3B ii
All I05100 I05100 93.000 93.019 3B ii
All I05300 I05300 93.000 93.019 3B ii
All I05500 I05500 93.000 93.019 3B ii
All K20100 K20100 93.000 93.019 3B ii
All M10300 M10300 93.000 93.019 3B ii
All O15100 O15100 93.000 93.019 3B ii
All O25100 O25500 93.000 93.019 3B ii
All P05100 P05100 93.000 93.019 3B ii
All R10100 R10100 93.000 93.019 3B ii
All R10150 R10150 93.000 93.019 3B ii
All R10350 R10350 93.000 93.019 3B ii
All R10400 R10400 93.000 93.019 3B ii
All R10500 R10600 93.000 93.019 3B ii
All R10800 R10990 93.000 93.019 3B ii
All R20200 R20200 93.000 93.019 3B ii
All R30000 R30999 93.000 93.019 3B ii
All S25100 S25500 93.000 93.019 3B ii
All R10000 R10999 01.000 26.999 3B iii
All R10000 R10999 36.000 37.000 3B iii
All R10000 R10999 37.200 37.999 3B iii
All R10110 R10999 27.000 35.999 3B iii
All A40200 A40300 24.000 25.999 3C
All B20300 B20300 24.000 24.099 3C
All B20300 B20300 24.200 25.999 3C
All B25300 B25300 24.000 25.999 3C
All E03100 E03100 24.000 25.999 3C
All H15400 H15400 24.000 25.999 3C
All K35200 K35200 24.000 24.099 3C
All K35200 K35200 24.200 25.999 3C
All M05000 M08100 24.300 24.399 3C
All O15100 O15100 24.000 24.099 3C
All O15100 O15100 24.200 25.999 3C
100-42-5 O15100 O15100 Public use Public use 3C
All P15900 P15900 24.000 25.999 3C

Estimating emissions of NMVOC from solvent and other product use Reports 2009/14
66 Statistisk sentralbyrå
CAS number Product type (from)
Product type (to)
NACE (from) NACE (to) NFR with extentions
All R30000 R30999 17.000 19.999 3C
All R30000 R30999 24.000 24.099 3C
All R30000 R30999 24.200 25.999 3C
All S42200 S42200 24.000 24.099 3C
All S42200 S42200 24.200 25.999 3C
All X99998 X99998 24.000 25.999 3C
All A05000 B54999 22.000 22.999 3D i
All B61000 L09000 22.000 22.999 3D i
All L11000 M04999 22.000 22.999 3D i
All M10000 O04999 22.000 22.999 3D i
All O05020 R09000 22.000 22.999 3D i
All R11000 Y99999 22.000 22.999 3D i
All B15000 B16999 20.000 20.999 3D ii
All I05000 I05999 20.000 20.999 3D ii
All R30000 R30999 20.000 20.999 3D ii
All V15400 V15499 20.000 20.999 3D ii
All A05000 B54999 Private households Public use 3D iii
All A05000 B54999 52.000 52.999 3D iii
All A05000 B54999 50.500 50.599 3D iii
All A05000 B54999 92.600 92.799 3D iii
All A05000 B54999 93.020 93.029 3D iii
All A05000 B54999 93.050 93.059 3D iii
64771-72-89 B55300 B55300 Private households Public use 3D iii
64771-72-89 B55300 B55300 52.000 52.999 3D iii
64771-72-89 B55300 B55300 50.500 50.599 3D iii
64742-47-89 B55300 B55300 Private households Public use 3D iii
64742-47-89 B55300 B55300 52.000 52.999 3D iii
64742-47-89 B55300 B55300 50.500 50.599 3D iii
64742-48-99 B55300 B55300 Private households Public use 3D iii
64742-48-99 B55300 B55300 52.000 52.999 3D iii
64742-48-99 B55300 B55300 50.500 50.599 3D iii
64-17-59 B55300 B55300 Private households Public use 3D iii
64-17-59 B55300 B55300 52.000 52.999 3D iii
64-17-59 B55300 B55300 50.500 50.599 3D iii
78-93-39 B55300 B55300 Private households Public use 3D iii
78-93-39 B55300 B55300 52.000 52.999 3D iii
78-93-39 B55300 B55300 50.500 50.599 3D iii
108-10-19 B55300 B55300 Private households Public use 3D iii
108-10-19 B55300 B55300 52.000 52.999 3D iii
108-10-19 B55300 B55300 50.500 50.599 3D iii
141-78-69 B55300 B55300 Private households Public use 3D iii
141-78-69 B55300 B55300 52.000 52.999 3D iii
141-78-69 B55300 B55300 50.500 50.599 3D iii
67-63-09 B55300 B55300 Private households Public use 3D iii
67-63-09 B55300 B55300 52.000 52.999 3D iii
67-63-09 B55300 B55300 50.500 50.599 3D iii
67-64-19 B55300 B55300 Private households Public use 3D iii
67-64-19 B55300 B55300 52.000 52.999 3D iii
67-64-19 B55300 B55300 50.500 50.599 3D iii
All B61000 L19000 Private households Public use 3D iii
All B61000 L19000 52.000 52.999 3D iii
All B61000 L19000 50.500 50.599 3D iii
All B61000 L19000 92.600 92.799 3D iii
All B61000 L19000 93.020 93.029 3D iii
All B61000 L19000 93.050 93.059 3D iii
All M10000 O04999 Private households Public use 3D iii
All M10000 O04999 52.000 52.999 3D iii
All M10000 O04999 50.500 50.599 3D iii
All M10000 O04999 92.600 92.799 3D iii
All M10000 O04999 93.020 93.029 3D iii
9 Typical component in lighter fuel

Reports 2009/14 Estimating emissions of NMVOC from solvent and other product use
Statistisk sentralbyrå 67
CAS number Product type (from)
Product type (to)
NACE (from) NACE (to) NFR with extentions
All M10000 O04999 93.050 93.059 3D iii
All O05020 Y99999 Private households Public use 3D iii
All O05020 Y99999 52.000 52.999 3D iii
All O05020 R10000 50.500 50.599 3D iii
All O05020 Y99999 92.600 92.799 3D iii
All O05020 Y99999 93.020 93.029 3D iii
All O05020 Y99999 93.050 93.059 3D iii
All R10130 R19000 50.500 50.599 3D iii
All R21000 Y99999 50.500 50.599 3D iii
All A05000 B54999 01.000 19.999 3D iv
All A05000 B14999 20.000 20.999 3D iv
All A05000 B54999 21.000 21.999 3D iv
All A05000 B54999 23.000 23.999 3D iv
All A05000 B54999 26.000 37.999 3D iv
All A05000 A40199 24.000 25.999 3D iv
All A05000 L20999 Ureg Ureg 3D iv
All A05000 B54999 38.000 49.999 3D iv
All A05000 B54999 50.000 50.499 3D iv
All A05000 B54999 53.000 92.599 3D iv
All A05000 A55000 93.000 93.019 3D iv
All A05000 B54999 94.000 99.998 3D iv
All A05000 A55000 93.030 93.049 3D iv
All A05000 B54999 51.000 51.999 3D iv
All A05000 M04999 45.320 45.320 3D iv
All A40400 B20299 24.000 25.999 3D iv
All A60200 B15110 93.000 93.019 3D iv
All A60200 B15110 93.030 93.049 3D iv
All B15130 B15130 93.000 93.019 3D iv
All B15130 B15130 93.030 93.049 3D iv
All B15142 B15320 93.000 93.019 3D iv
All B15150 B15320 93.030 93.049 3D iv
All B15340 B25100 93.000 93.019 3D iv
All B15340 B25100 93.030 93.049 3D iv
All B17000 B54999 20.000 20.999 3D iv
All B20400 B25299 24.000 25.999 3D iv
All B25300 B35100 93.000 93.019 3D iv
All B25300 B35100 93.030 93.049 3D iv
All B25400 B54999 24.000 25.999 3D iv
All B35300 B54999 93.000 93.019 3D iv
All B35300 B54999 93.030 93.049 3D iv
All B61000 L09000 01.000 14.999 3D iv
All B61000 E05000 15.400 15.499 3D iv
All B61000 L09000 17.000 19.999 3D iv
All B61000 I04999 20.000 20.999 3D iv
All B61000 L09000 21.000 21.999 3D iv
All B61000 L09000 23.000 23.999 3D iv
All B61000 L09000 26.000 37.999 3D iv
All B61000 E03099 24.000 25.999 3D iv
All B61000 M04999 38.000 49.999 3D iv
All B61000 M04999 50.000 50.499 3D iv
All B61000 L20050 53.000 92.599 3D iv
All B61000 D20200 93.000 93.019 3D iv
All B61000 M04999 94.000 99.998 3D iv
All B61000 D20200 93.030 93.049 3D iv
All B61000 M04999 51.000 51.999 3D iv
All B61000 L09000 15.000 15.399 3D iv
All B61000 L09000 15.500 16.999 3D iv
All D20400 F05400 93.000 93.019 3D iv
All D20400 F05400 93.030 93.049 3D iv
All E03200 H15399 24.000 25.999 3D iv
All E05100 E05100 15.400 15.499 3D iv
All E06000 L09000 15.400 15.499 3D iv

Estimating emissions of NMVOC from solvent and other product use Reports 2009/14
68 Statistisk sentralbyrå
CAS number Product type (from)
Product type (to)
NACE (from) NACE (to) NFR with extentions
All F10100 G10300 93.000 93.019 3D iv
All F10100 G10300 93.030 93.049 3D iv
All G10500 I05000 93.000 93.019 3D iv
All G10500 I05000 93.030 93.049 3D iv
All H15500 K35199 24.000 25.999 3D iv
All I05200 I05200 93.000 93.019 3D iv
All I05200 I05200 93.030 93.049 3D iv
All I05400 I05450 93.000 93.019 3D iv
All I05400 I05450 93.030 93.049 3D iv
All I05600 K20000 93.000 93.019 3D iv
All I05600 K20000 93.030 93.049 3D iv
All I06000 L09000 20.000 20.999 3D iv
All K20200 L20050 93.000 93.019 3D iv
All K20200 L20050 93.030 93.049 3D iv
All K35300 L09000 24.000 25.999 3D iv
All L10000 L10999 01.000 37.999 3D iv
All L11000 M04999 01.000 21.999 3D iv
All L11000 M04999 23.000 23.999 3D iv
All L11000 M04999 26.000 37.999 3D iv
All L15000 L20999 24.000 25.999 3D iv
All L20000 L20999 Private households Public use 3D iv
All L20000 L20999 50.000 50.999 3D iv
All L20000 L20999 52.000 52.999 3D iv
All L20080 L20080 53.000 84.999 3D iv
All L20080 L20080 86.000 92.599 3D iv
All L20080 L20080 85.000 85.999 3D iv
All L20100 M04999 53.000 92.599 3D iv
All L20100 M04999 93.000 93.019 3D iv
All L20100 M04999 93.030 93.049 3D iv
All M10000 O04999 01.000 10.999 3D iv
All M10000 O04999 11.000 11.999 3D iv
All M10000 O04999 12.000 21.999 3D iv
All M10000 O04999 23.000 23.999 3D iv
All M10000 O04999 26.000 37.999 3D iv
All M10000 O04999 24.000 25.999 3D iv
All M10000 Y99999 Ureg Ureg 3D iv
All M10000 O04999 38.000 49.999 3D iv
All M10000 O04999 50.000 50.499 3D iv
All M10000 O04999 53.000 92.599 3D iv
All M10000 M10200 93.000 93.019 3D iv
All M10000 O04999 94.000 99.998 3D iv
All M10000 M10200 93.030 93.049 3D iv
All M10000 O04999 51.000 51.999 3D iv
All M10000 Y99999 45.320 45.320 3D iv
All M10990 O04999 93.000 93.019 3D iv
All M10990 O04999 93.030 93.049 3D iv
All O05020 R09000 01.000 10.999 3D iv
All O05020 R09000 11.000 11.999 3D iv
All O05020 R09000 12.000 21.999 3D iv
All O05020 R09000 23.000 23.999 3D iv
All O05020 R09000 26.000 37.999 3D iv
All O05020 O15099 24.000 25.999 3D iv
All O05020 R29999 38.000 49.999 3D iv
All O05020 R10000 50.000 50.499 3D iv
All O05020 Y99999 53.000 92.599 3D iv
All O05020 O15000 93.000 93.019 3D iv
All O05020 Y99999 94.000 99.998 3D iv
All O05020 O15000 93.030 93.049 3D iv
All O05020 Y99999 51.000 51.999 3D iv
All O15200 P15899 24.000 25.999 3D iv
All O15200 O25000 93.000 93.019 3D iv
All O15200 O25000 93.030 93.049 3D iv

Reports 2009/14 Estimating emissions of NMVOC from solvent and other product use
Statistisk sentralbyrå 69
CAS number Product type (from)
Product type (to)
NACE (from) NACE (to) NFR with extentions
All O25600 P05000 93.000 93.019 3D iv
All O25600 P05000 93.030 93.049 3D iv
All P05200 R10000 93.000 93.019 3D iv
All P05200 R10000 93.030 93.049 3D iv
All P16000 R10000 24.000 25.999 3D iv
All R10100 R10100 50.000 50.999 3D iv
All R10130 R19000 50.000 50.499 3D iv
All R10130 R10130 93.000 93.019 3D iv
All R10130 R10130 93.030 93.049 3D iv
All R10160 R10340 93.000 93.019 3D iv
All R10160 R10340 93.030 93.049 3D iv
All R10360 R10370 93.000 93.019 3D iv
All R10360 R10370 93.030 93.049 3D iv
All R10450 R10450 93.000 93.019 3D iv
All R10450 R10450 93.030 93.049 3D iv
All R10700 R10700 93.000 93.019 3D iv
All R10700 R10700 93.030 93.049 3D iv
All R11000 Y99999 01.000 10.999 3D iv
All R11000 R29999 11.000 11.999 3D iv
All R11000 R29999 12.000 19.999 3D iv
All R11000 R29999 20.000 20.999 3D iv
All R11000 Y99999 21.000 21.999 3D iv
All R11000 R29999 23.000 23.999 3D iv
All R11000 Y99999 26.000 37.999 3D iv
All R11000 R29999 24.000 25.999 3D iv
All R11000 R20100 93.000 93.019 3D iv
All R11000 R20100 93.030 93.049 3D iv
All R20000 R20999 50.000 50.999 3D iv
All R20300 R29999 93.000 93.019 3D iv
All R20300 R29999 93.030 93.049 3D iv
All R21000 Y99999 50.000 50.499 3D iv
All R30000 R30999 12.000 16.999 3D iv
All R30000 R30999 40.300 49.999 3D iv
All R30000 R30999 38.000 40.199 3D iv
All R31000 Y99999 11.000 11.999 3D iv
All R31000 Y99999 12.000 19.999 3D iv
All R31000 V15399 20.000 20.999 3D iv
All R31000 X99997 23.000 23.999 3D iv
All R31000 S42199 24.000 25.999 3D iv
All R31000 Y99999 38.000 49.999 3D iv
All R31000 S25000 93.000 93.019 3D iv
All R31000 S25000 93.030 93.049 3D iv
All S25600 Y99999 93.000 93.019 3D iv
All S25600 Y99999 93.030 93.049 3D iv
All S42300 X99997 24.000 25.999 3D iv
All V15500 Y99999 20.000 20.999 3D iv
All X99999 Y99999 23.000 23.999 3D iv
All X99999 Y99999 24.000 25.999 3D iv
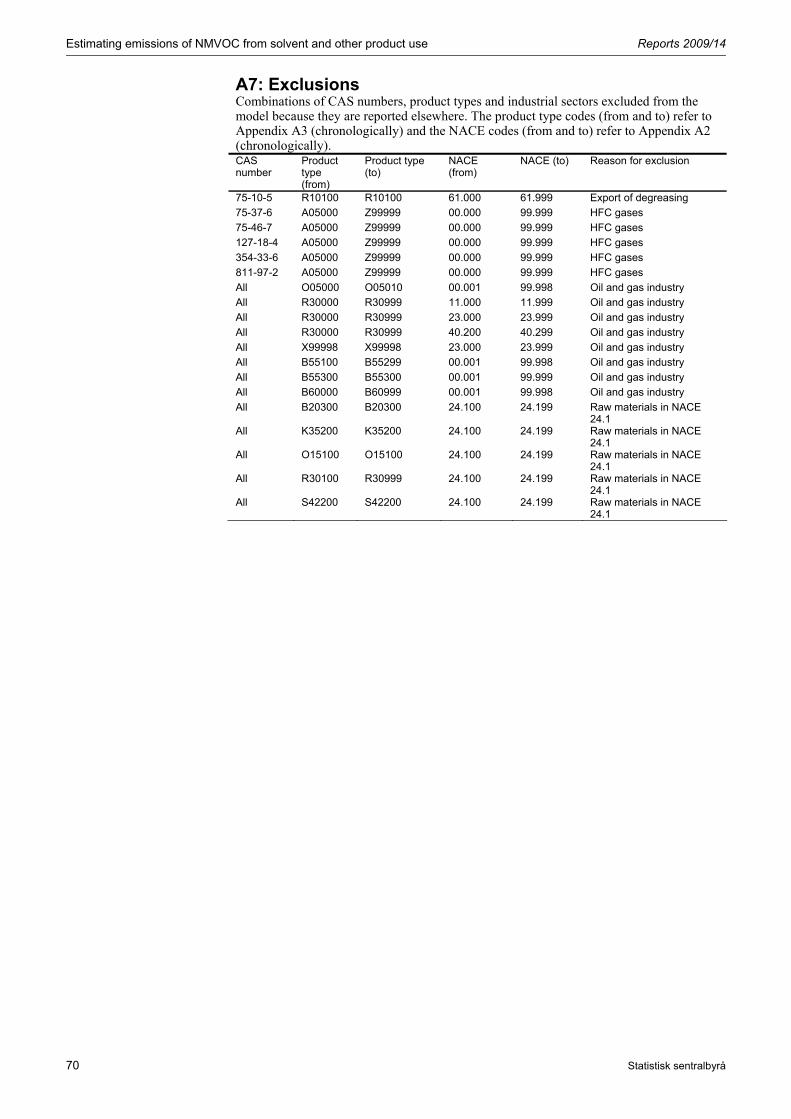
Estimating emissions of NMVOC from solvent and other product use Reports 2009/14
70 Statistisk sentralbyrå
A7: Exclusions Combinations of CAS numbers, product types and industrial sectors excluded from the model because they are reported elsewhere. The product type codes (from and to) refer to Appendix A3 (chronologically) and the NACE codes (from and to) refer to Appendix A2 (chronologically). CAS number
Product type (from)
Product type (to)
NACE (from)
NACE (to) Reason for exclusion
75-10-5 R10100 R10100 61.000 61.999 Export of degreasing
75-37-6 A05000 Z99999 00.000 99.999 HFC gases
75-46-7 A05000 Z99999 00.000 99.999 HFC gases
127-18-4 A05000 Z99999 00.000 99.999 HFC gases
354-33-6 A05000 Z99999 00.000 99.999 HFC gases
811-97-2 A05000 Z99999 00.000 99.999 HFC gases
All O05000 O05010 00.001 99.998 Oil and gas industry
All R30000 R30999 11.000 11.999 Oil and gas industry
All R30000 R30999 23.000 23.999 Oil and gas industry
All R30000 R30999 40.200 40.299 Oil and gas industry
All X99998 X99998 23.000 23.999 Oil and gas industry
All B55100 B55299 00.001 99.998 Oil and gas industry
All B55300 B55300 00.001 99.999 Oil and gas industry
All B60000 B60999 00.001 99.998 Oil and gas industry
All B20300 B20300 24.100 24.199 Raw materials in NACE 24.1
All K35200 K35200 24.100 24.199 Raw materials in NACE 24.1
All O15100 O15100 24.100 24.199 Raw materials in NACE 24.1
All R30100 R30999 24.100 24.199 Raw materials in NACE 24.1
All S42200 S42200 24.100 24.199 Raw materials in NACE 24.1

Reports 2009/14 Estimating emissions of NMVOC from solvent and other product use
Statistisk sentralbyrå 71
A8: Emission factors List of emission factors, given for combinations of specific substances (CAS), groups of substances, product types, industrial sectors and whether the substances are considered to be used as raw materials or not. The product type codes refer to Appendix A3 (chronologically) and the NACE codes refer to Appendix A2 (chronologically). CAS number Group Raw
material Product code NACE Emission
factor Not specified VOC No A05000 - Z99999 Private, 01 - 99 1 Not specified VOC No A05000 - A40199 24 - 24 0.0025 Not specified VOC No A05000 - B14999 20 - 20 0.25 Not specified VOC No A05000 - B15700 15 - 16 0.25 Not specified VOC No A05000 - B15700 11 - 11 0.0025 Not specified VOC No A05000 - B15710 35 - 36 0.25 Not specified VOC No A05000 - B15710 34 - 34 0.2 Not specified VOC No A05000 - B15710 26 - 33 0.25 Not specified VOC No A05000 - B15710 25 - 25 0.25 Not specified VOC No A05000 - B15710 23 - 23 0.0025 Not specified VOC No A05000 - B15710 22 - 22 0.55 Not specified VOC No A05000 - B15710 21 - 21 0.25 Not specified VOC No A05000 - B15710 18 - 19 0.1 Not specified VOC No A05000 - B15710 17 - 17 0.1 Not specified VOC No A40000 - A40999 60 - 62 0.1 Not specified VOC No A40200 - A40300 24 - 24 0.001 Not specified VOC No A40400 - B15710 24 - 24 0.0025 Not specified VOC No A55100 - A60100 93 - 93 0.57 Not specified VOC No B15000 - B15999 20 - 20 0.15 Not specified VOC No B15120 - B15120 93 - 93 0.57 Not specified VOC No B15140 - B15140 93 - 93 0.57 Not specified VOC No B15330 - B15330 93 - 93 0.57 Not specified VOC No B15710 - B15710 Private, 01 - 16 0.1 Not specified VOC No B15720 - B15720 21 - 37 0.3 Not specified VOC No B15720 - B15720 15 - 19 0.3 Not specified VOC No B15720 - B15720 11 - 11 0.3 Not specified VOC No B15730 - B20299 25 - 25 0.25 Not specified VOC No B15730 - B20299 24 - 24 0.0025 Not specified VOC No B15730 - B54999 35 - 36 0.25 Not specified VOC No B15730 - B54999 34 - 34 0.2 Not specified VOC No B15730 - B54999 26 - 33 0.25 Not specified VOC No B15730 - B54999 23 - 23 0.0025 Not specified VOC No B15730 - B54999 22 - 22 0.55 Not specified VOC No B15730 - B54999 21 - 21 0.25 Not specified VOC No B15730 - B54999 18 - 19 0.1 Not specified VOC No B15730 - B54999 17 - 17 0.1 Not specified VOC No B15730 - B54999 15 - 16 0.25 Not specified VOC No B15730 - B54999 11 - 11 0.0025 Not specified VOC No B16000 - B16999 20 - 20 0.15 Not specified VOC No B17000 - B54999 20 - 20 0.25 Not specified VOC No B20300 - B20300 24 - 25 0.001 Not specified VOC No B20400 - B25299 25 - 25 0.25 Not specified VOC No B20400 - B25299 24 - 24 0.0025 Not specified VOC No B25200 - B25200 93 - 93 0.57 Not specified VOC No B25300 - B25300 24 - 25 0.001 Not specified VOC No B25400 - B54999 25 - 25 0.25 Not specified VOC No B25400 - B54999 24 - 24 0.0025 Not specified VOC No B35200 - B35200 93 - 93 0.57 Not specified VOC No B55100 - B55100 Private, 01 - 99 0.0025 Not specified VOC No B55200 - B55200 Private, 01 - 99 0.000005 Not specified VOC No B55300 - B55300 Private, 01 - 99 0.00125 Not specified VOC No B60100 - B60299 Private, 01 - 22 0.0025 Not specified VOC No B60100 - B60299 24 - 99 0.0025 Not specified VOC No B60100 - B60299 23 - 23 0.00005 Not specified VOC No B61000 - E03099 25 - 25 0.25 Not specified VOC No B61000 - E03099 24 - 24 0.0025 Not specified VOC No B61000 - H19999 20 - 20 0.25 Not specified VOC No B61000 - L20999 35 - 36 0.25 Not specified VOC No B61000 - L20999 34 - 34 0.2 Not specified VOC No B61000 - L20999 26 - 33 0.25 Not specified VOC No B61000 - L20999 23 - 23 0.0025 Not specified VOC No B61000 - L20999 22 - 22 0.55 Not specified VOC No B61000 - L20999 21 - 21 0.25

Estimating emissions of NMVOC from solvent and other product use Reports 2009/14
72 Statistisk sentralbyrå
CAS number Group Raw material
Product code NACE Emission factor
Not specified VOC No B61000 - L20999 18 - 19 0.1 Not specified VOC No B61000 - L20999 17 - 17 0.1 Not specified VOC No B61000 - L20999 15 - 16 0.25 Not specified VOC No B61000 - L20999 11 - 11 0.0025 Not specified VOC No D20300 - D20300 93 - 93 0.57 Not specified VOC No E03100 - E03100 24 - 25 0.001 Not specified VOC No E03200 - H15399 25 - 25 0.25 Not specified VOC No E03200 - H15399 24 - 24 0.0025 Not specified VOC No E20000 - E20999 Private, 01 - 99 0 Not specified VOC No F05990 - F05990 93 - 93 0.57 Not specified VOC No G10400 - G10400 93 - 93 0.57 Not specified VOC No H15400 - H15400 24 - 25 0.001 Not specified VOC No H15500 - K35199 25 - 25 0.25 Not specified VOC No H15500 - K35199 24 - 24 0.0025 Not specified VOC No I05000 - I05999 20 - 20 0.15 Not specified VOC No I05100 - I05100 93 - 93 0.57 Not specified VOC No I05300 - I05300 93 - 93 0.57 Not specified VOC No I05500 - I05500 93 - 93 0.57 Not specified VOC No I06000 - L20999 20 - 20 0.25 Not specified VOC No K20100 - K20100 93 - 93 0.57 Not specified VOC No K35200 - K35200 24 - 25 0.001 Not specified VOC No K35300 - L20999 25 - 25 0.25 Not specified VOC No K35300 - L20999 24 - 24 0.0025 Not specified VOC No L15000 - L15999 Private, 01 - 99 0 Not specified VOC No M05000 - M05999 25 - 37 0.3 Not specified VOC No M05000 - M05999 24.4 - 24.7 0.3 Not specified VOC No M05000 - M05999 24.3 - 24.3 0.001 Not specified VOC No M05000 - M05999 24 - 24.2 0.3 Not specified VOC No M05000 - M05999 15 - 23 0.3 Not specified VOC No M05000 - M05999 11 - 11 0.3 Not specified VOC No M08000 - O04999 35 - 36 0.25 Not specified VOC No M08000 - O04999 34 - 34 0.2 Not specified VOC No M08000 - O04999 26 - 33 0.25 Not specified VOC No M08000 - O04999 25 - 25 0.25 Not specified VOC No M08000 - O04999 24 - 24 0.0025 Not specified VOC No M08000 - O04999 23 - 23 0.0025 Not specified VOC No M08000 - O04999 22 - 22 0.55 Not specified VOC No M08000 - O04999 21 - 21 0.25 Not specified VOC No M08000 - O04999 20 - 20 0.25 Not specified VOC No M08000 - O04999 18 - 19 0.1 Not specified VOC No M08000 - O04999 17 - 17 0.1 Not specified VOC No M08000 - O04999 15 - 16 0.25 Not specified VOC No M08000 - O04999 11 - 11 0.0025 Not specified VOC No M10300 - M10300 93 - 93 0.57 Not specified VOC No O05010 - O05010 Private, 01 - 10 1 Not specified VOC No O05010 - O05010 24 - 99 1 Not specified VOC No O05010 - O05010 23 - 23 0.001 Not specified VOC No O05010 - O05010 12 - 22 1 Not specified VOC No O05010 - O05010 11 - 11 0.001 Not specified VOC No O05020 - O15099 25 - 25 0.25 Not specified VOC No O05020 - O15099 24 - 24 0.0025 Not specified VOC No O05020 - R29999 20 - 20 0.25 Not specified VOC No O05020 - S42100 15 - 16 0.25 Not specified VOC No O05020 - S42100 11 - 11 0.0025 Not specified VOC No O05020 - Y99999 35 - 36 0.25 Not specified VOC No O05020 - Y99999 34 - 34 0.2 Not specified VOC No O05020 - Y99999 26 - 33 0.25 Not specified VOC No O05020 - Y99999 23 - 23 0.0025 Not specified VOC No O05020 - Y99999 22 - 22 0.55 Not specified VOC No O05020 - Y99999 21 - 21 0.25 Not specified VOC No O05020 - Y99999 18 - 19 0.1 Not specified VOC No O05020 - Y99999 17 - 17 0.1 Not specified VOC No O15100 - O15100 93 - 93 0.57 Not specified VOC No O15100 - O15100 24 25 0.001 Not specified VOC No O15100 - O15100 35.3 - 35.3 0.001 Not specified VOC No O15200 - P15899 25 - 25 0.25 Not specified VOC No O15200 - P15899 24 - 24 0.0025 Not specified VOC No O25100 - O25500 93 - 93 0.57 Not specified VOC No P05100 - P05100 93 - 93 0.57

Reports 2009/14 Estimating emissions of NMVOC from solvent and other product use
Statistisk sentralbyrå 73
CAS number Group Raw material
Product code NACE Emission factor
Not specified VOC No P15900 - P15900 24 - 25 0.001 Not specified VOC No P16000 - R29999 25 - 25 0.25 Not specified VOC No P16000 - R29999 24 - 24 0.0025 Not specified VOC No R10100 - R10100 93 - 93 0.57 Not specified VOC No R10150 - R10150 93 - 93 0.57 Not specified VOC No R10350 - R10350 93 - 93 0.57 Not specified VOC No R10400 - R10400 93 - 93 0.57 Not specified VOC No R10500 - R10600 93 - 93 0.57 Not specified VOC No R10800 - R10990 93 - 93 0.57 Not specified VOC No R20200 - R20200 93 - 93 0.57 Not specified VOC No R30000 - R30999 93 - 93 0.57 Not specified VOC Yes R30000 - R30999 26 - 28 0.001 Not specified VOC No R30000 - R30999 24 - 25 0.001 Not specified VOC Yes R30000 - R30999 21 - 23 0.001 Not specified VOC No R30000 - R30999 20 - 20 0.15 Not specified VOC Yes R30000 - R30999 15 - 19 0.1 Not specified VOC Yes R30000 - R30999 11 - 11 0.001 Not specified VOC No R31000 - S42199 25 - 25 0.25 Not specified VOC No R31000 - S42199 24 - 24 0.0025 Not specified VOC No R31000 - V14999 20 - 20 0.25 Not specified VOC No S25100 - S25500 93 - 93 0.57 Not specified VOC No S42200 - S42200 Private, 01 - 16 0.1 Not specified VOC No S42200 - S42200 24 - 25 0.001 Not specified VOC No S42300 - X99997 25 - 25 0.25 Not specified VOC No S42300 - X99997 24 - 24 0.0025 Not specified VOC No S42300 - Y99999 15 - 16 0.25 Not specified VOC No S42300 - Y99999 11 - 11 0.0025 Not specified VOC No S50000 - S50999 Private, 01 - 99 0 Not specified VOC No S75000 - S75999 Private, 01 - 99 0 Not specified VOC No V15400 - V15400 20 - 20 0.15 Not specified VOC No V16000 - Y99999 20 - 20 0.25 Not specified VOC No X99998 - X99998 24 - 25 0.001 Not specified VOC No Y00000 - Y99999 25 - 25 0.25 Not specified VOC No Y00000 - Y99999 24 - 24 0.0025

Res
ult
att
ach
men
ts
B1:
Tim
e se
ries
of
emis
sio
ns
of
NM
VO
C f
rom
so
lven
t an
d o
ther
pro
du
ct u
se, 1
989-
2007
N
FR
sou
rce
cate
gory
19
8919
90
1991
19
9219
9319
9419
9519
9619
9719
98
1999
2000
2001
2002
2003
2004
2005
2006
20
07
Tot
al
48 2
0851
883
45
611
46
937
47 0
7850
599
49 2
6452
020
50 1
9950
448
49
465
47 3
3548
211
49 1
2750
014
51 0
9651
868
46 6
83
48 5
70
Dec
orat
ive
pain
t ap
plic
atio
n (3
A i)
8 37
57
075
5 05
9 In
dust
rial p
aint
ap
plic
atio
n (3
A ii
)
2 95
71
637
1 89
8 O
ther
pai
nt a
pplic
atio
n (3
A ii
i) 12
867
13 0
03
11 0
02
10 9
3410
921
1260
99
551
9 95
397
978
190
9348
8 57
991
439
713
10 2
8310
853
9133
39
D
egre
asin
g (3
B i)
949
7 D
ry c
lean
ing
(3B
ii)
24
765
1 15
8 O
ther
(in
dust
rial
clea
ning
) (3
B ii
i) 2
551
2 75
6 2
324
1 88
435
827
820
734
431
037
2 36
841
144
247
651
154
524
022
6 22
7 C
hem
ical
pro
duct
s,
man
ufac
t. &
pro
c. (
3C)
2 88
02
802
4 13
9 4
146
7 65
567
318
414
7 68
264
696
529
6274
5 66
446
683
711
2 72
61
936
900
540
510
Prin
ting
(3D
i)
72
644
7 55
1 W
ood
pres
erva
tion
(3
D ii
)
232
240
254
Dom
estic
sol
vent
use
(3
D ii
i)
10
521
9 06
3 9
973
Oth
er (
3D iv
) 29
911
33 3
22
28 1
45
29 9
7228
145
30 9
8131
092
3404
133
623
35 3
57
3347
532
682
3395
935
227
36 4
9437
761
27 4
8626
762
29
895
7 Statistisk sentralbyrå4
Appendix A
Estimating emissions of NMVOC from solvent and other product use Reports 2009/14
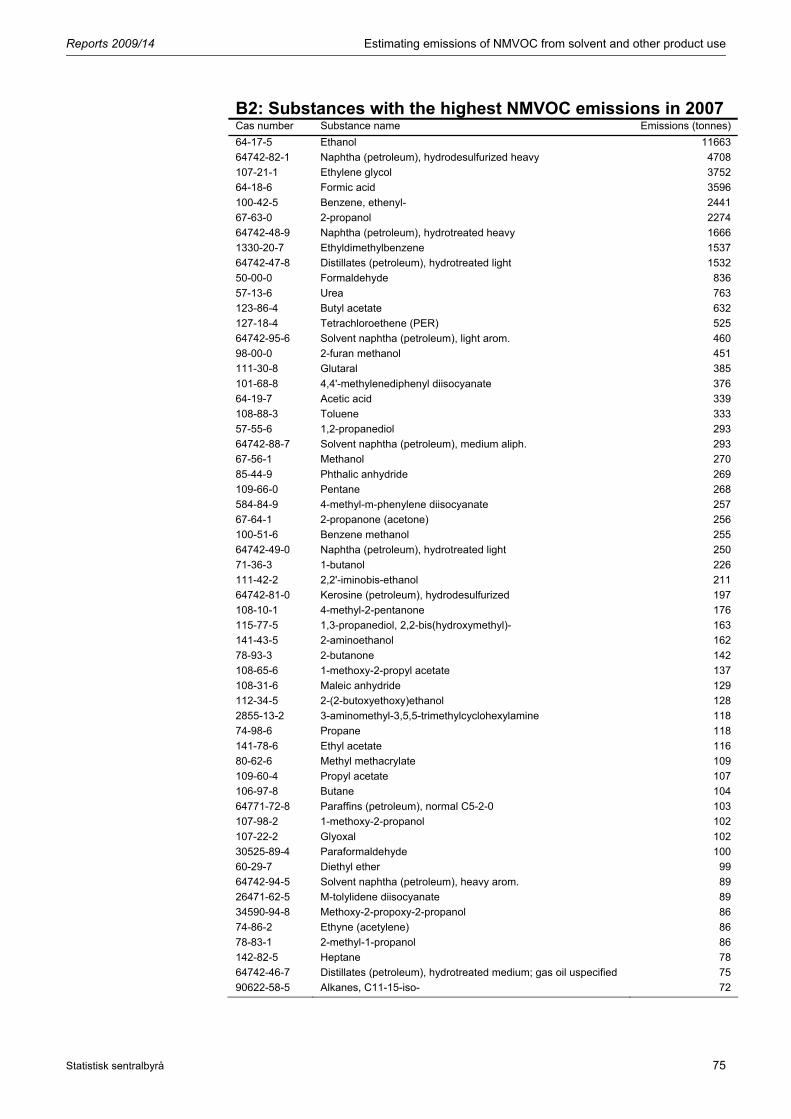
Reports 2009/14 Estimating emissions of NMVOC from solvent and other product use
Statistisk sentralbyrå 75
B2: Substances with the highest NMVOC emissions in 2007 Cas number Substance name Emissions (tonnes)
64-17-5 Ethanol 11663
64742-82-1 Naphtha (petroleum), hydrodesulfurized heavy 4708
107-21-1 Ethylene glycol 3752
64-18-6 Formic acid 3596
100-42-5 Benzene, ethenyl- 2441
67-63-0 2-propanol 2274
64742-48-9 Naphtha (petroleum), hydrotreated heavy 1666
1330-20-7 Ethyldimethylbenzene 1537
64742-47-8 Distillates (petroleum), hydrotreated light 1532
50-00-0 Formaldehyde 836
57-13-6 Urea 763
123-86-4 Butyl acetate 632
127-18-4 Tetrachloroethene (PER) 525
64742-95-6 Solvent naphtha (petroleum), light arom. 460
98-00-0 2-furan methanol 451
111-30-8 Glutaral 385
101-68-8 4,4'-methylenediphenyl diisocyanate 376
64-19-7 Acetic acid 339
108-88-3 Toluene 333
57-55-6 1,2-propanediol 293
64742-88-7 Solvent naphtha (petroleum), medium aliph. 293
67-56-1 Methanol 270
85-44-9 Phthalic anhydride 269
109-66-0 Pentane 268
584-84-9 4-methyl-m-phenylene diisocyanate 257
67-64-1 2-propanone (acetone) 256
100-51-6 Benzene methanol 255
64742-49-0 Naphtha (petroleum), hydrotreated light 250
71-36-3 1-butanol 226
111-42-2 2,2'-iminobis-ethanol 211
64742-81-0 Kerosine (petroleum), hydrodesulfurized 197
108-10-1 4-methyl-2-pentanone 176
115-77-5 1,3-propanediol, 2,2-bis(hydroxymethyl)- 163
141-43-5 2-aminoethanol 162
78-93-3 2-butanone 142
108-65-6 1-methoxy-2-propyl acetate 137
108-31-6 Maleic anhydride 129
112-34-5 2-(2-butoxyethoxy)ethanol 128
2855-13-2 3-aminomethyl-3,5,5-trimethylcyclohexylamine 118
74-98-6 Propane 118
141-78-6 Ethyl acetate 116
80-62-6 Methyl methacrylate 109
109-60-4 Propyl acetate 107
106-97-8 Butane 104
64771-72-8 Paraffins (petroleum), normal C5-2-0 103
107-98-2 1-methoxy-2-propanol 102
107-22-2 Glyoxal 102
30525-89-4 Paraformaldehyde 100
60-29-7 Diethyl ether 99
64742-94-5 Solvent naphtha (petroleum), heavy arom. 89
26471-62-5 M-tolylidene diisocyanate 89
34590-94-8 Methoxy-2-propoxy-2-propanol 86
74-86-2 Ethyne (acetylene) 86
78-83-1 2-methyl-1-propanol 86
142-82-5 Heptane 78
64742-46-7 Distillates (petroleum), hydrotreated medium; gas oil uspecified 75
90622-58-5 Alkanes, C11-15-iso- 72

Estimating emissions of NMVOC from solvent and other product use Reports 2009/14
76 Statistisk sentralbyrå
B3: Product type groups with the highest NMVOC emissions in 2007 Product type group
Name Emissions (tonnes)
B15 Biocides 9526
R10 Cleaning agents 8103
M05 Paint and varnish 6988
O15 Solvents 5221
A40 Anti freeze agents 4243
S42 Food and fodder additives 2405
K521 Cosmetics1 1800
B20 Binding agents 1719
R30 Raw materials and intermediates 733
K35 Construction materials 700
I15 Isolation materials 521
L10 Adhesives 466
P10 Polishing agents 440
V10 Heat transmission agents 402
P05 PH-regulating agents 358
F05 Pigments 344
U05 Filling materials 330
P15 Process regulators 311
G30 Flooring materials 247
M15 Metal surface treatment agents 246
G15 Enamel and glazing materials 243
S45 Lubricants 233
H15 Hardeners 232
K55 Cooling agents 231 1 From cosmetics side model
B4: Industrial sectors with the highest NMVOC emissions in 2007 NACE Name Emissions
(tonnes) 45 Construction 6943
No NACE Private and public use 6571
50 Sale, maintenance and repair of motor vehicles and motor cycles, retail sale of automotive fuel
6340
24 Manufacture of chemicals and chemical products 4425
35 Manufacture of other transport equipment 3293
36 Manufacture of furniture, manufacturing n.e.c. 2807
15 Manufacture of food products and beverages 2243
1 Agriculture, hunting and related service activities 2156
52 Retail trade, except of motor vehicles and motor cycles. Repair of personal and household goods
2051
11 Extraction of crude petroleum and natural gas, service activities incidental to oil and gas extraction excluding surveying
1009
28 Manufacture of fabricated metal products, except machinery and equipment 695
25 Manufacture of rubber and plastic products 659
93 Other service activities 659
22 Publishing, printing and reproduction of recorded media 650
27 Manufacture of basic metals 611
61 Water transport 609
20 Manufacture of wood and products of wood and cork 608
60 Land transport, transport via pipelines 580
85 Health and social work 405
40 Electricity, gas, steam and hot water supply 395
26 Manufacture of other non-metallic mineral products 360
51 Wholesale trade and commision trade, except for motor vehicles and motorcycles
311
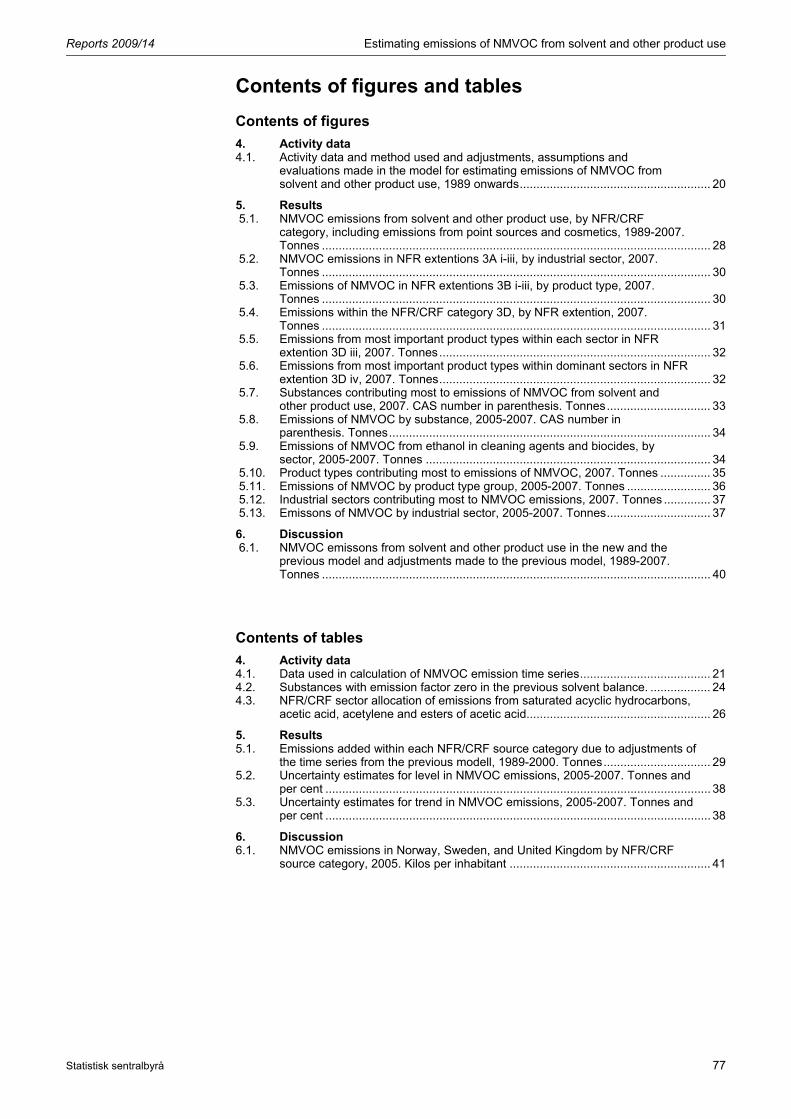
Reports 2009/14 Estimating emissions of NMVOC from solvent and other product use
Statistisk sentralbyrå 77
Contents of figures and tables
Contents of figures
4. Activity data 4.1. Activity data and method used and adjustments, assumptions and
evaluations made in the model for estimating emissions of NMVOC from solvent and other product use, 1989 onwards......................................................... 20
5. Results 5.1. NMVOC emissions from solvent and other product use, by NFR/CRF
category, including emissions from point sources and cosmetics, 1989-2007. Tonnes .................................................................................................................... 28
5.2. NMVOC emissions in NFR extentions 3A i-iii, by industrial sector, 2007. Tonnes .................................................................................................................... 30
5.3. Emissions of NMVOC in NFR extentions 3B i-iii, by product type, 2007. Tonnes .................................................................................................................... 30
5.4. Emissions within the NFR/CRF category 3D, by NFR extention, 2007. Tonnes .................................................................................................................... 31
5.5. Emissions from most important product types within each sector in NFR extention 3D iii, 2007. Tonnes................................................................................. 32
5.6. Emissions from most important product types within dominant sectors in NFR extention 3D iv, 2007. Tonnes................................................................................. 32
5.7. Substances contributing most to emissions of NMVOC from solvent and other product use, 2007. CAS number in parenthesis. Tonnes............................... 33
5.8. Emissions of NMVOC by substance, 2005-2007. CAS number in parenthesis. Tonnes................................................................................................ 34
5.9. Emissions of NMVOC from ethanol in cleaning agents and biocides, by sector, 2005-2007. Tonnes ..................................................................................... 34
5.10. Product types contributing most to emissions of NMVOC, 2007. Tonnes ............... 35 5.11. Emissions of NMVOC by product type group, 2005-2007. Tonnes ......................... 36 5.12. Industrial sectors contributing most to NMVOC emissions, 2007. Tonnes .............. 37 5.13. Emissons of NMVOC by industrial sector, 2005-2007. Tonnes............................... 37 6. Discussion 6.1. NMVOC emissons from solvent and other product use in the new and the
previous model and adjustments made to the previous model, 1989-2007. Tonnes .................................................................................................................... 40
Contents of tables
4. Activity data 4.1. Data used in calculation of NMVOC emission time series....................................... 21 4.2. Substances with emission factor zero in the previous solvent balance. .................. 24 4.3. NFR/CRF sector allocation of emissions from saturated acyclic hydrocarbons,
acetic acid, acetylene and esters of acetic acid....................................................... 26 5. Results 5.1. Emissions added within each NFR/CRF source category due to adjustments of
the time series from the previous modell, 1989-2000. Tonnes................................ 29 5.2. Uncertainty estimates for level in NMVOC emissions, 2005-2007. Tonnes and
per cent ................................................................................................................... 38 5.3. Uncertainty estimates for trend in NMVOC emissions, 2005-2007. Tonnes and
per cent ................................................................................................................... 38 6. Discussion 6.1. NMVOC emissions in Norway, Sweden, and United Kingdom by NFR/CRF
source category, 2005. Kilos per inhabitant ............................................................ 41