nike stock pitch: analysis and valuation
TRANSCRIPT


57%27%
6.5%2%
6.5%
1%
Revenue in million USD
Footwear Apparel Equipment Global Brand Divisions Converse Corporate

North America
47%
Western Europe
19%
Central & Eastern Europe
6%
Greater China
10%
Japan
3%
Emerging Market
15%
SALES IN DIFFERENT REGION

Analysis
Fundamental Analysis
SWOT Analysis
PORTER’S Five Forces
Analysis
PEST Analysis
RATIO Analysis

Strengths
Brand reputation
Runs offices in 45 countries worldwide
Strong financial position
Sponsorships
Weaknesses
Heavily depend upon footwear market
Labour law violations and child labour
Price sensitive retail stores
Opportunities
Develop variety of products –sunglasses, casual wears
Growth in emerging markets like –India, China
Global brand recognition
Global marketing events
Threats
Aggressive competition
Negative image due to “sweatshops”
Financial crisis
Consumer price sensitivity

Threat of New Entrants
Medium
• Significant capital resources are required for creating a new brand as large investments are needed for marketing and procuring floor space; hence, this restricts the entry of newer players.
• Nike enjoys a great degree of brand recognition and loyalty, and it will be a difficult for a new player to match its level.
Bargaining Power of Customers
Medium
• Nike caters to its customers through both the wholesale and direct-to-consumer channels, which accounted for 80.6% and 18.9% of total Nike brand’s sales respectively, in fiscal 2013.
• Bargaining power of end-customers is low as Nike has a very strong brand image and holds an innovative product portfolio.
Competitive Rivalry within the industry
Medium
• Nike faces rising competition from local players in emerging markets, who are increasingly improving their product quality.
• Rising competition from emerging players such as Under Armour and Lululemon Athletica, which focus on niche market segments such as performance apparel and yoga-focused apparel, also pose a threat to Nike’s share of selected markets.
Threat of Substitute Products
Low
• The worldwide demand for athletic footwear, apparel and equipment is expected to grow in the future as customers cannot substitute these products.
Bargaining Power of Suppliers
Low
• No single footwear factory or apparel factory accounted for more than 6% of total Nike brand footwear production and Nike brand apparel production respectively in fiscal 2013; hence, due to a large base of suppliers, we believe their bargaining power is limited.
• The switching costs in changing suppliers is significant.
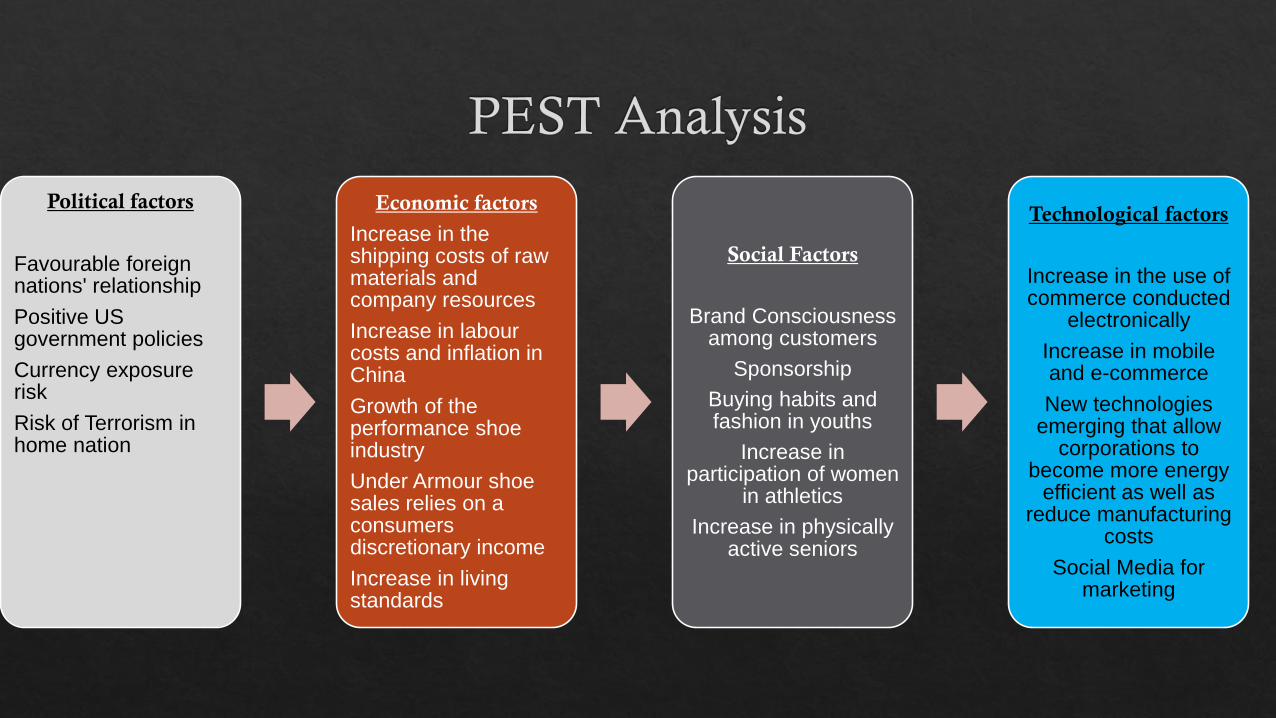
Political factors
Favourable foreign nations' relationship
Positive US government policies
Currency exposure risk
Risk of Terrorism in home nation
Economic factors
Increase in the shipping costs of raw materials and company resources
Increase in labour costs and inflation in China
Growth of the performance shoe industry
Under Armour shoe sales relies on a consumers discretionary income
Increase in living standards
Social Factors
Brand Consciousness among customers
Sponsorship
Buying habits and fashion in youths
Increase in participation of women
in athletics
Increase in physically active seniors
Technological factors
Increase in the use of commerce conducted
electronically
Increase in mobile and e-commerce
New technologies emerging that allow
corporations to become more energy
efficient as well as reduce manufacturing
costs
Social Media for marketing


Ratios Nike Adidas Puma
EBITDA Margin 12.75% 8.03% 12.93%
Return on Assets 14.48% 7.30% 31.62%
Return on Equity 24.88% 21.06% 55.80%
Asset Turnover 2.03 1.5 1.86
Current Ratio 1.76 1.8 2.22
Debt to Equity .12 0.53 1.72
P/E 28.85 18.97 16.8


