nike, inc - d18rn0p25nwr6d.cloudfront.netd18rn0p25nwr6d.cloudfront.net/cik-0000320187/3489b... ·...
TRANSCRIPT

Table of Contents
UNITED STATESSECURITIES AND EXCHANGE COMMISSION
Washington, D.C. 20549
FORM 10-K(Mark One)
þþANNUAL REPORT PURSUANT TO SECTION 13 OR 15(D) OF THE SECURITIES EXCHANGE ACT OF 1934FOR THE FISCAL YEAR ENDED May 31, 2018
OR¨¨TRANSITION REPORT PURSUANT TO SECTION 13 OR 15(D) OF THE SECURITIES EXCHANGE ACT OF 1934
FOR THE TRANSITION PERIOD FROM TO .Commission File No. 1-10635
NIKE, Inc .(Exact name of Registrant as specified in its charter)
OREGON 93-0584541(State or other jurisdiction of incorporation) (IRS Employer Identification No.)
One Bowerman Drive, Beaverton, Oregon 97005-6453(Address of principal executive offices) (Zip Code)
(503) 671-6453(Registrant’s telephone number, including area code)
SECURITIES REGISTERED PURSUANT TO SECTION 12(B) OF THE ACT:Class B Common Stock New York Stock Exchange
(Title of each class) (Name of each exchange on which registered)
SECURITIES REGISTERED PURSUANT TO SECTION 12(G) OF THE ACT:NONE
Indicate by check mark: YES NO• if the registrant is a well-known seasoned issuer, as defined in Rule 405 of the Securities Act. þ ¨
• if the registrant is not required to file reports pursuant to Section 13 or Section 15(d) of the Act. ¨ þ
• whether the registrant (1) has filed all reports required to be filed by Section 13 or 15(d) of the Securities Exchange Act of 1934 during the preceding 12 months (orfor such shorter period that the registrant was required to file such reports), and (2) has been subject to such filing requirements for the past 90 days. þ ¨
• whether the registrant has submitted electronically and posted on its corporate Website, if any, every Interactive Data File required to be submitted and postedpursuant to Rule 405 of Regulation S-T (§232.405 of this chapter) during the preceding 12 months (or for such shorter period that the registrant was required tosubmit and post such files). þ ¨
• if disclosure of delinquent filers pursuant to Item 405 of Regulation S-K (§229.405 of this chapter) is not contained herein, and will not be contained, to the best ofregistrant ’ s knowledge, in definitive proxy or information statements incorporated by reference in Part III of this Form 10-K or any amendment to this Form 10-K. þ
• whether the registrant is a large accelerated filer, an accelerated filer, a non-accelerated filer, smaller reporting company or an emerging growth company. See the definitions of “large accelerated filer,”“accelerated filer,” “smaller reporting company” and “emerging growth company” in Rule 12b-2 of the Exchange Act.
Large accelerated filer þ Accelerated filer ¨ Non-accelerated filer ¨ Smaller reporting company ¨ Emerging growth company ¨• if an emerging growth company, if the registrant has elected not to use the extended transition period for complying with any new or revised financial accounting
standards provided pursuant to Section 13(a) of the Exchange Act. ¨
• whether the registrant is a shell company (as defined in Rule 12b-2 of the Act). ¨ þ
As of November 30, 2017, the aggregate market values of the Registrant ’ s Common Stock held by non-affiliates were:
Class A $ 4,475,052,736
Class B 78,093,099,655
$ 82,568,152,391
As of July 20, 2018, the number of shares of the Registrant ’ s Common Stock outstanding were:
Class A 320,065,752
Class B 1,280,488,786
1,600,554,538
DOCUMENTS INCORPORATED BY REFERENCE:Parts of Registrant ’ s Proxy Statement for the Annual Meeting of Shareholders to be held on September 20, 2018 are incorporated by reference into Part III of this Report .

Table of Contents
NIKE, INC.ANNUAL REPORT ON FORM 10-KTable of Contents PagePART I 1ITEM 1. Business 1 General 1 Products 1 Sales and Marketing 2 United States Market 2 International Markets 2 Significant Customer 3 Product Research, Design and Development 3 Manufacturing 3 International Operations and Trade 3 Competition 4 Trademarks and Patents 4 Employees 5 Executive Officers of the Registrant 5ITEM 1A. Risk Factors 6ITEM 1B. Unresolved Staff Comments 15ITEM 2. Properties 15ITEM 3. Legal Proceedings 15ITEM 4. Mine Safety Disclosures 15 PART II 16ITEM 5. Market for Registrant’s Common Equity, Related Stockholder Matters and Issuer Purchases of Equity Securities 16ITEM 6. Selected Financial Data 18ITEM 7. Management’s Discussion and Analysis of Financial Condition and Results of Operations 20ITEM 7A. Quantitative and Qualitative Disclosures about Market Risk 40ITEM 8. Financial Statements and Supplementary Data 41ITEM 9. Changes in and Disagreements with Accountants on Accounting and Financial Disclosure 73ITEM 9A. Controls and Procedures 73ITEM 9B. Other Information 73 PART III 74
(Except for the information set forth under “Executive Officers of the Registrant” in Item 1 above, Part III is incorporated byreference from the Proxy Statement for the NIKE, Inc. 2018 Annual Meeting of Shareholders.)
ITEM 10. Directors, Executive Officers and Corporate Governance 74ITEM 11. Executive Compensation 74ITEM 12. Security Ownership of Certain Beneficial Owners and Management and Related Stockholder Matters 74ITEM 13. Certain Relationships and Related Transactions and Director Independence 74ITEM 14. Principal Accountant Fees and Services 74 PART IV 75ITEM 15. Exhibits and Financial Statement Schedules 75ITEM 16. Form 10-K Summary 78 Signatures 80

Table of Contents
PART IITEM 1. Business
General
NIKE, Inc. was incorporated in 1967 under the laws of the State of Oregon. As used in this report, the terms “we,” “us,” “NIKE” and the “Company” refer to NIKE, Inc. and itspredecessors, subsidiaries and affiliates, collectively, unless the context indicates otherwise. Our NIKE digital commerce website is located at www.nike.com. On our NIKEcorporate website, located at investors.nike.com, we post the following filings as soon as reasonably practicable after they are electronically filed with, or furnished to, theUnited States Securities and Exchange Commission (the “SEC”): our annual report on Form 10-K, our quarterly reports on Form 10-Q, our current reports on Form 8-K and anyamendments to those reports filed or furnished pursuant to Section 13(a) or 15(d) of the Securities and Exchange Act of 1934, as amended. Our definitive Proxy Statementsare also posted on our corporate website. All such filings on our corporate website are available free of charge. Copies of these filings may also be obtained by visiting thePublic Reference Room of the SEC at 100 F Street, NE, Washington, D.C. 20549, or by calling the SEC at 1-800-SEC-0330 and are available on the SEC’s website (www.sec.gov ). Also available on our corporate website are the charters of the committees of our Board of Directors, as well as our corporate governance guidelines and codeof ethics; copies of any of these documents will be provided in print to any shareholder who submits a request in writing to NIKE Investor Relations, One Bowerman Drive,Beaverton, Oregon 97005-6453.
Our principal business activity is the design, development and worldwide marketing and selling of athletic footwear, apparel, equipment, accessories and services. NIKE is thelargest seller of athletic footwear and apparel in the world. We sell our products through NIKE-owned retail stores and through digital platforms (which we refer to collectively asour “NIKE Direct” operations), to retail accounts and a mix of independent distributors, licensees and sales representatives in virtually all countries around the world. Virtually allof our products are manufactured by independent contractors. Nearly all footwear and apparel products are produced outside the United States, while equipment products areproduced both in the United States and abroad.
Products
We focus our NIKE Brand product offerings in six key categories: Running, NIKE Basketball, the Jordan Brand, Football (Soccer), Training and Sportswear (our sports-inspiredlifestyle products). We also market products designed for kids, as well as for other athletic and recreational uses such as American football, baseball, cricket, lacrosse,skateboarding, tennis, volleyball, wrestling, walking and outdoor activities.
NIKE’s athletic footwear products are designed primarily for specific athletic use, although a large percentage of the products are worn for casual or leisure purposes. We placeconsiderable emphasis on innovation and high-quality construction in the development and manufacturing of our products. Sportswear, Running and the Jordan Brand arecurrently our top-selling footwear categories and we expect them to continue to lead in footwear sales.
We also sell sports apparel covering the above-mentioned categories, which feature the same trademarks and are sold predominantly through the same marketing anddistribution channels as athletic footwear. Our sports apparel, similar to our athletic footwear products, is designed primarily for athletic use and exemplifies our commitment toinnovation and high-quality construction. Sportswear, Training and Running are currently our top-selling apparel categories and we expect them to continue to lead in apparelsales. We often market footwear, apparel and accessories in “collections” of similar use or by category. We also market apparel with licensed college and professional teamand league logos.
We sell a line of performance equipment and accessories under the NIKE Brand name, including bags, socks, sport balls, eyewear, timepieces, digital devices, bats, gloves,protective equipment and other equipment designed for sports activities. We also sell small amounts of various plastic products to other manufacturers through our wholly-owned subsidiary, NIKE IHM, Inc., doing business as Air Manufacturing Innovation.
Our Jordan Brand designs, distributes and licenses athletic and casual footwear, apparel and accessories predominantly focused on basketball using the Jumpman trademark.Sales and operating results for Jordan Brand products are reported within the respective NIKE Brand geographic operating segments.
One of our wholly-owned subsidiary brands, Converse, headquartered in Boston, Massachusetts, designs, distributes and licenses casual sneakers, apparel and accessoriesunder the Converse, Chuck Taylor, All Star, One Star, Star Chevron and Jack Purcell trademarks. Operating results of the Converse brand are reported on a stand-alonebasis.
Another of our wholly-owned subsidiary brands, Hurley, headquartered in Costa Mesa, California, designs and distributes a line of action sports and youth lifestyle apparel andaccessories under the Hurley trademark. Sales and operating results for Hurley products are included within the NIKE Brand’s North America geographic operating segment.
In addition to the products we sell to our wholesale customers and directly to consumers through our NIKE Direct operations, we have also entered into license agreementsthat permit unaffiliated parties to manufacture and sell, using NIKE-owned trademarks, certain apparel, digital devices and applications and other equipment designed forsports activities.
1

Table of Contents
Sales and Marketing
Financial information about geographic and segment operations appears in Note 17 — Operating Segments and Related Information of the accompanying Notes to theConsolidated Financial Statements.
We experience moderate fluctuations in aggregate sales volume during the year. Historically, revenues in the first and fourth fiscal quarters have slightly exceeded those in thesecond and third quarters. However, the mix of product sales may vary considerably as a result of changes in seasonal and geographic demand for particular types offootwear, apparel and equipment, as well as other macroeconomic, operating and logistics-related factors.
Because NIKE is a consumer products company, the relative popularity of various sports and fitness activities and changing design trends affect the demand for our products.We must, therefore, respond to trends and shifts in consumer preferences by adjusting the mix of existing product offerings, developing new products, styles and categoriesand influencing sports and fitness preferences through extensive marketing. Failure to respond in a timely and adequate manner could have a material adverse effect on oursales and profitability. This is a continuing risk. Refer to Item 1A. Risk Factors.
We report our NIKE Brand operations based on our internal geographic organization. Each NIKE Brand geographic segment operates predominantly in one industry: thedesign, development, marketing and selling of athletic footwear, apparel and equipment. In June 2017, we announced a new company alignment designed to allow NIKE tobetter serve the consumer personally, at scale. As a result of this organizational realignment, the Company’s reportable operating segments for the NIKE Brand are: NorthAmerica; Europe, Middle East & Africa (EMEA); Greater China; and Asia Pacific & Latin America (APLA), and include results for the NIKE, Jordan and Hurley brands. Salesthrough our NIKE Direct operations are managed within each geographic operating segment.
Converse is also a reportable segment and operates in one industry: the design, marketing, licensing and selling of casual sneakers, apparel and accessories. Converse directto consumer operations, including digital commerce, are reported within the Converse operating segment results.
United States MarketFor fiscal 2018 , NIKE Brand and Converse sales in the United States accounted for approximately 42% of total revenues, compared to 46% and 47% for fiscal 2017 and fiscal2016 , respectively. We sell our NIKE Brand, Jordan Brand, Hurley and Converse products to thousands of retail accounts in the United States, including a mix of footwearstores, sporting goods stores, athletic specialty stores, department stores, skate, tennis and golf shops and other retail accounts. In the United States, we utilize NIKE salesoffices to solicit such sales. During fiscal 2018 , our three largest customers accounted for approximately 21% of sales in the United States.
Our NIKE Direct and Converse direct to consumer operations sell NIKE Brand, Jordan Brand, Hurley and Converse products to consumers through various digital platforms. Inaddition, our NIKE Direct and Converse direct to consumer operations sell through the following number of retail stores in the United States:
U.S. Retail Stores NumberNIKE Brand factory stores 220NIKE Brand in-line stores (including employee-only stores) 31Converse stores (including factory stores) 112Hurley stores (including factory and employee stores) 29TOTAL 392
In the United States, NIKE has seven significant distribution centers. Five are located in Memphis, Tennessee, two of which are owned and three of which are leased. Twoother distribution centers, one located in Indianapolis, Indiana, and one located in Dayton, Tennessee, are leased and operated by third-party logistics providers. NIKE Brandapparel and equipment are also shipped from our Foothill Ranch, California distribution center, which we lease. Smaller leased, and third-party leased and operated,distribution facilities are located in various parts of the United States.
International MarketsFor fiscal 2018 , non-U.S. NIKE Brand and Converse sales accounted for approximately 58% of total revenues, compared to 54% and 53% for fiscal 2017 and fiscal 2016 ,respectively. We sell our products to retail accounts, through our own NIKE Direct operations and through a mix of independent distributors, licensees and salesrepresentatives around the world. We sell to thousands of retail accounts and ship products from 62 distribution centers outside of the United States. During fiscal 2018 ,NIKE’s three largest customers outside of the United States accounted for approximately 13% of total non-U.S. sales.
In addition to NIKE and Converse owned digital commerce platforms in over 45 countries, our NIKE Direct and Converse direct to consumer businesses operate the followingnumber of retail stores outside the United States:
Non-U.S. Retail Stores NumberNIKE Brand factory stores 664NIKE Brand in-line stores (including employee-only stores) 65Converse stores (including factory stores) 61TOTAL 790
2

Table of Contents
International branch offices and subsidiaries of NIKE are located in Argentina, Australia, Austria, Belgium, Bermuda, Brazil, Canada, Chile, China, Croatia, the Czech Republic,Denmark, Finland, France, Germany, Greece, Hong Kong, Hungary, India, Indonesia, Ireland, Israel, Italy, Japan, Korea, Macau, Malaysia, Mexico, the Netherlands,New Zealand, Norway, Panama, the Philippines, Poland, Portugal, Russia, Singapore, Slovakia, Slovenia, South Africa, Spain, Sri Lanka, Sweden, Switzerland, Taiwan,Thailand, Turkey, the United Arab Emirates, the United Kingdom, Uruguay and Vietnam.
Significant CustomerNo customer accounted for 10% or more of our worldwide net revenues during fiscal 2018 .
Product Research, Design and DevelopmentWe believe our research, design and development efforts are key factors in our success. Technical innovation in the design and manufacturing process of footwear, appareland athletic equipment receives continued emphasis as we strive to produce products that help to enhance athletic performance, reduce injury and maximize comfort, whilereducing waste.
In addition to our own staff of specialists in the areas of biomechanics, chemistry, exercise physiology, engineering, industrial design, sustainability and related fields, we alsoutilize research committees and advisory boards made up of athletes, coaches, trainers, equipment managers, orthopedists, podiatrists and other experts who consult with usand review designs, materials, concepts for product and manufacturing process improvements and compliance with product safety regulations around the world. Employeeathletes, athletes engaged under sports marketing contracts and other athletes wear-test and evaluate products during the design and development process.
As we continue to develop new technologies, we are simultaneously focused on the design of innovative products incorporating such technologies throughout our productcategories. Using market intelligence and research, our various design teams identify opportunities to leverage new technologies in existing categories responding to consumerpreferences. The proliferation of NIKE Air, Lunar, Zoom, Free, Flywire, Dri-Fit, Flyknit, Flyweave, ZoomX, React and NIKE+ technologies throughout our Running, NIKEBasketball, Jordan Brand, Football (Soccer), Training and Sportswear categories, among others, typifies our dedication to designing innovative products.
ManufacturingWe are supplied by 124 footwear factories located in 13 countries. The largest single footwear factory accounted for approximately 9% of total fiscal 2018 NIKE Brand footwearproduction. Virtually all of our footwear is manufactured outside of the United States by independent contract manufacturers which often operate multiple factories. For fiscal2018 , contract factories in Vietnam, China and Indonesia manufactured approximately 47%, 26% and 21% of total NIKE Brand footwear, respectively. We also havemanufacturing agreements with independent contract manufacturers in Argentina, India, Brazil, Mexico and Italy to manufacture footwear for sale primarily within thosecountries. For fiscal 2018 , five footwear contract manufacturers each accounted for greater than 10% of footwear production and in the aggregate accounted for approximately69% of NIKE Brand footwear production.
We are supplied by 328 apparel factories located in 37 countries. The largest single apparel factory accounted for approximately 13% of total fiscal 2018 NIKE Brand apparelproduction. Virtually all of our apparel is manufactured outside of the United States by independent contract manufacturers which often operate multiple factories. For fiscal2018 , contract factories in China, Vietnam and Thailand produced approximately 26%, 18% and 10% of total NIKE Brand apparel, respectively. For fiscal 2018 , one apparelcontract manufacturer accounted for more than 10% of apparel production, and the top five contract manufacturers in the aggregate accounted for approximately 47% of NIKEBrand apparel production.
The principal materials used in our footwear products are natural and synthetic rubber, plastic compounds, foam cushioning materials, natural and synthetic leather, nylon,polyester and canvas, as well as polyurethane films used to make NIKE Air-Sole cushioning components. During fiscal 2018 , Air Manufacturing Innovation, with facilities nearBeaverton, Oregon and in St. Charles, Missouri, as well as independent contractors in China and Vietnam, were our suppliers of the Air-Sole cushioning components used infootwear. The principal materials used in our apparel products are natural and synthetic fabrics and threads (both virgin and recycled); specialized performance fabricsdesigned to efficiently wick moisture away from the body, retain heat and repel rain and/or snow; and plastic and metal hardware. NIKE’s independent contractors andsuppliers buy raw materials for the manufacturing of our footwear, apparel and equipment products. Most raw materials are available and purchased by those independentcontractors and suppliers in the countries where manufacturing takes place. NIKE’s independent contract manufacturers and suppliers have thus far experienced little difficultyin satisfying raw material requirements for the production of our products.
Since 1972, Sojitz Corporation of America (“Sojitz America”), a large Japanese trading company and the sole owner of our redeemable preferred stock, has performedsignificant import-export financing services for us. During fiscal 2018 , Sojitz America provided financing and purchasing services for NIKE Brand products sold in certain NIKEmarkets including Argentina, Brazil, Canada, India, South Africa and Uruguay, excluding products produced and sold in the same country. Approximately 6% of NIKE Brandsales occurred in those countries. Any failure of Sojitz America to provide these services or any failure of Sojitz America’s banks could disrupt our ability to acquire productsfrom our suppliers and to deliver products to our customers in those markets. Such a disruption could result in canceled orders that would adversely affect sales andprofitability. However, we believe that any such disruption would be short-term in duration due to the ready availability of alternative sources of financing at competitive rates.Our current agreements with Sojitz America expire on May 31, 2019.
International Operations and TradeOur international operations and sources of supply are subject to the usual risks of doing business abroad, such as the implementation of, or potential changes in, foreign anddomestic trade policies, increases in import duties, anti-dumping measures, quotas, safeguard measures, trade restrictions, restrictions on the transfer of funds and, in certainparts of the world, political instability and terrorism. We have not, to date, been materially affected by any such risk, but cannot predict the likelihood of such material effectsoccurring in the future.
3

Table of Contents
In recent years, uncertain global and regional economic and political conditions have affected international trade and increased protectionist actions around the world. Thesetrends are affecting many global manufacturing and service sectors, and the footwear and apparel industries, as a whole, are not immune. Companies in our industry are facingtrade protectionism in many different regions, and in nearly all cases we are working together with industry groups to address trade issues and reduce the impact to theindustry, while observing applicable competition laws. Notwithstanding our efforts, protectionist measures have resulted in increases in the cost of our products, and additionalmeasures, if implemented, could adversely affect sales and/or profitability for NIKE, as well as the imported footwear and apparel industry as a whole.
We monitor protectionist trends and developments throughout the world that may materially impact our industry, and we engage in administrative and judicial processes tomitigate trade restrictions. We are actively monitoring actions that may result in additional anti-dumping measures and could affect our industry. We are also monitoring for andadvocating against other impediments that may limit or delay customs clearance for imports of footwear, apparel and equipment. Changes in U.S. trade policies, including newand potential tariffs or penalties on imported goods, may negatively affect U.S. corporations with production activities outside the U.S., including NIKE. There have also beendiscussions and commentary regarding retaliatory actions by countries affected by the new tariffs and other changes in U.S. trade policy, and certain foreign governments haveinstituted or are considering imposing trade sanctions on certain U.S. goods, which could negatively affect U.S. corporations with business operations and/or consumermarkets in those countries. Depending on the extent that certain new or proposed reforms are implemented by the U.S. government and the manner in which foreigngovernments respond to such reforms, it may become necessary for us to change the way we conduct business, which may adversely affect our results of operations. Inaddition , with respect to proposed trade restrictions targeting China, which represents an important sourcing country and consumer market for us, we are working with a broadcoalition of global businesses and trade associations representing a wide variety of sectors to help ensure that any legislation enacted and implemented (i) addresseslegitimate and core concerns, (ii) is consistent with international trade rules and (iii) reflects and considers China ’ s domestic economy and the important role it has in theglobal economic community.
Where trade protection measures are implemented, we believe that we have the ability to develop, over a period of time, adequate alternative sources of supply for theproducts obtained from our present suppliers. If events prevented us from acquiring products from our suppliers in a particular country, our operations could be temporarilydisrupted and we could experience an adverse financial impact. However, we believe we could abate any such disruption, and that much of the adverse impact on supplywould, therefore, be of a short-term nature, although alternate sources of supply might not be as cost-effective and could have an ongoing adverse impact on profitability.
NIKE advocates for trade liberalization for footwear and apparel in a number of regional and bilateral free trade agreements.
Our international operations are also subject to compliance with the U.S. Foreign Corrupt Practices Act, or FCPA, and other anti-bribery laws applicable to our operations. Wesource a significant portion of our products from, and have important consumer markets, outside of the United States, and we have policies and procedures to addresscompliance with the FCPA and similar laws by us, our employees, agents, suppliers and other partners.
CompetitionThe athletic footwear, apparel and equipment industry is highly competitive on a worldwide basis. We compete internationally with a significant number of athletic and leisurefootwear companies, athletic and leisure apparel companies, sports equipment companies and large companies having diversified lines of athletic and leisure footwear, appareland equipment, including adidas, Anta, ASICS, Li Ning, lululemon athletica, Puma, Under Armour and V.F. Corporation, among others. The intense competition and the rapidchanges in technology and consumer preferences in the markets for athletic and leisure footwear and apparel and athletic equipment, constitute significant risk factors in ouroperations.
NIKE is the largest seller of athletic footwear and apparel in the world. Important aspects of competition in this industry are:
• Product attributes such as quality; performance and reliability; new product innovation and development and consumer price/value.
• Consumer connection and affinity for brands and products, developed through marketing and promotion; social media interaction; customer support and service;identification with prominent and influential athletes, public figures, coaches, teams, colleges and sports leagues who endorse our brands and use our products andactive engagement through sponsored sporting events and clinics.
• Effective sourcing and distribution of products, with attractive merchandising and presentation at retail, both in-store and online.
We believe that we are competitive in all of these areas.
Trademarks and PatentsWe believe that our intellectual property rights are important to our brand, our success and our competitive position. We pursue available protections of these rights andvigorously protect them against third-party theft and infringement.
We utilize trademarks on nearly all of our products and believe having distinctive marks that are readily identifiable is an important factor in creating a market for our goods, inidentifying our brands and the Company, and in distinguishing our goods from the goods of others. We consider our NIKE and Swoosh trademarks to be among our mostvaluable assets and we have registered these trademarks in almost 170 jurisdictions worldwide. In addition, we own many other trademarks that we utilize in marketing ourproducts. We own common law rights in the trade dress of several significant shoe designs and elements. For certain trade dress, we have sought and obtained trademarkregistrations.
We have copyright protection in our design, graphics and other original works. In some instances, we also obtain registered copyrights.
We own patents and have a license under other patents, which facilitate our use of “Air” technologies.
We file for, own and maintain many U.S. and foreign utility patents, as well as many U.S. and foreign design patents protecting components, technologies, materials,manufacturing techniques, features, functionality, and industrial and aesthetic designs used in and for the manufacture of various athletic and leisure footwear and apparel,athletic equipment and digital devices and related software applications. These patents expire at various times.
4
Table of Contents
We believe our success depends upon our capabilities in areas such as design, research and development, production and marketing rather than exclusively upon our patentand trade secret positions.
However, we have followed a policy of filing patent applications in the United States and select foreign countries on inventions, designs and improvements that we deemvaluable. We also continue to vigorously protect our trademarks and patents against third-party infringement.
EmployeesAs of May 31, 2018 , we had approximately 73,100 employees worldwide, including retail and part-time employees. Management is committed to maintaining an environmentwhere all NIKE employees have the opportunity to reach their full potential. None of our employees are represented by a union, except for certain employees in the Asia Pacific& Latin America geography, where local law requires those employees to be represented by a trade union. Also, in some countries outside of the United States, local lawsrequire employee representation by works councils (which may be entitled to information and consultation on certain Company decisions) or by organizations similar to a union.In certain European countries, we are required by local law to enter into and/or comply with industry-wide or national collective bargaining agreements. NIKE has neverexperienced a material interruption of operations due to labor disagreements.
Executive Officers of the RegistrantThe executive officers of NIKE, Inc. as of July 24, 2018 are as follows:
Mark G. Parker, Chairman, President and Chief Executive Officer — Mr. Parker, 62, was appointed President and Chief Executive Officer in January 2006 and namedChairman of the Board in June 2016. He has been employed by NIKE since 1979 with primary responsibilities in product research, design and development, marketing andbrand management. Mr. Parker was appointed divisional Vice President in charge of product development in 1987, corporate Vice President in 1989, General Manager in1993, Vice President of Global Footwear in 1998 and President of the NIKE Brand in 2001.
Chris L. Abston, Vice President and Corporate Controller — Mr. Abston, 55, joined NIKE in 2015 from Wal-Mart Stores, Inc., where he served as Vice President, GlobalControls and Governance since February 2015. Prior to that he was Vice President and Controller of Walmart International from February 2013 to January 2015, responsiblefor the oversight of international accounting and reporting, and Vice President and Assistant Controller of Wal-Mart Stores, Inc. from May 2011 to January 2013. Before joiningWal-Mart, Mr. Abston spent 25 years in public accounting with Ernst & Young LLP, most recently leading its Strategic Growth Markets practice as a Partner in the Dallas office.
Andrew Campion, Executive Vice President and Chief Financial Officer — Mr. Campion, 46, joined NIKE in 2007 as Vice President of Global Planning and Development,leading strategic and financial planning. He was appointed Chief Financial Officer of the NIKE Brand in 2010, responsible for leading all aspects of financial management forthe Company’s flagship brand. In 2014, he was appointed Senior Vice President, Strategy, Finance and Investor Relations in addition to his role as Chief Financial Officer ofNIKE Brand. Mr. Campion assumed the role of Executive Vice President and Chief Financial Officer in August 2015. Prior to joining NIKE, he held leadership roles in strategicplanning, mergers and acquisitions, financial planning and analysis, operations and planning, investor relations and tax at The Walt Disney Company from 1996 to 2007.
Elliott Hill, President, Consumer and Marketplace — Mr. Hill, 54, joined NIKE in 1988, with primary responsibilities in sales and retail. He has served as Apparel Sales Directorin Europe, Retail Development Director in Europe, Vice President of Sales and Retail in EMEA, General Manager of US Retail, Vice President of US Sales, Retail andNIKE.com, and Vice President of Global Retail. M ost recently, Mr. Hill served as President of Geographies and Sales and Vice President and General Manager of NorthAmerica. Mr. Hill was appointed President, Consumer and Marketplace in March 2018.
Hilary K. Krane, Executive Vice President, Chief Administrative Officer and General Counsel — Ms. Krane, 54, joined NIKE as Vice President and General Counsel in April2010. In 2011, her responsibilities expanded, and she became Vice President, General Counsel and Corporate Affairs. Ms. Krane was appointed Executive Vice President,Chief Administrative Officer and General Counsel in 2013. Prior to joining NIKE, Ms. Krane was General Counsel and Senior Vice President for Corporate Affairs at LeviStrauss & Co. from 2006 to 2010. From 1996 to 2006, she was a Partner and Assistant General Counsel at PricewaterhouseCoopers LLP.
Monique S. Matheson, Executive Vice President, Global Human Resources — Ms. Matheson, 51, joined NIKE in 1998, with primary responsibilities in the human resourcesfunction. She was appointed as Vice President and Senior Business Partner in 2011 and Vice President, Chief Talent and Diversity Officer in 2012. Ms. Matheson wasappointed Executive Vice President, Global Human Resources in July 2017 .
John F. Slusher, Executive Vice President, Global Sports Marketing — Mr. Slusher, 49, joined NIKE in 1998, with primary responsibilities in global sports marketing.Mr. Slusher was appointed Director of Sports Marketing for Asia Pacific and Americas in 2006, divisional Vice President of Asia Pacific & Americas Sports Marketing inSeptember 2007 and Vice President, Global Sports Marketing in November 2007. Prior to joining NIKE, Mr. Slusher was an attorney at the law firm of O’Melveny & Myers from1995 to 1998.
Eric D. Sprunk, Chief Operating Officer — Mr. Sprunk, 54, joined NIKE in 1993. He was appointed Finance Director and General Manager of the Americas in 1994, FinanceDirector for NIKE Europe in 1995, Regional General Manager of NIKE Europe Footwear in 1998 and Vice President & General Manager of the Americas in 2000. Mr. Sprunkwas appointed Vice President of Global Footwear in 2001, Vice President of Merchandising and Product in 2009 and Chief Operating Officer in 2013. Prior to joining NIKE,Mr. Sprunk was a certified public accountant with Price Waterhouse from 1987 to 1993.
5

Table of Contents
ITEM 1A. Risk FactorsSpecial Note Regarding Forward-Looking Statements and Analyst ReportsCertain written and oral statements, other than purely historic information, including estimates, projections, statements relating to NIKE’s business plans, objectives andexpected operating results and the assumptions upon which those statements are based, made or incorporated by reference from time to time by NIKE or its representatives inthis report, other reports, filings with the SEC, press releases, conferences or otherwise, are “forward-looking statements” within the meaning of the Private Securities LitigationReform Act of 1995 and Section 21E of the Securities Exchange Act of 1934, as amended. Forward-looking statements include, without limitation, any statement that maypredict, forecast, indicate or imply future results, performance or achievements, and may contain the words “believe,” “anticipate,” “expect,” “estimate,” “project,” “will be,” “willcontinue,” “will likely result” or words or phrases of similar meaning. Forward-looking statements involve risks and uncertainties which may cause actual results to differmaterially from the forward-looking statements. The risks and uncertainties are detailed from time to time in reports filed by NIKE with the SEC, including reports filed on Forms8-K, 10-Q and 10-K, and include, among others, the following: international, national and local general economic and market conditions; the size and growth of the overallathletic footwear, apparel and equipment markets; intense competition among designers, marketers, distributors and sellers of athletic footwear, apparel and equipment forconsumers and endorsers; demographic changes; changes in consumer preferences; popularity of particular designs, categories of products and sports; seasonal andgeographic demand for NIKE products; difficulties in anticipating or forecasting changes in consumer preferences, consumer demand for NIKE products and the various marketfactors described above; difficulties in implementing, operating and maintaining NIKE’s increasingly complex information technology systems and controls, including, withoutlimitation, the systems related to demand and supply planning and inventory control; interruptions in data and information technology systems; consumer data security;fluctuations and difficulty in forecasting operating results, including, without limitation, the fact that advance orders may not be indicative of future revenues due to changes inshipment timing, the changing mix of orders with shorter lead times, and discounts, order cancellations and returns; the ability of NIKE to sustain, manage or forecast its growthand inventories; the size, timing and mix of purchases of NIKE’s products; increases in the cost of materials, labor and energy used to manufacture products; new productdevelopment and introduction; the ability to secure and protect trademarks, patents and other intellectual property; product performance and quality; customer service; adversepublicity, including without limitation, through social media or in connection with brand damaging events; the loss of significant customers or suppliers; dependence ondistributors and licensees; business disruptions; increased costs of freight and transportation to meet delivery deadlines; increases in borrowing costs due to any decline inNIKE’s debt ratings; changes in business strategy or development plans; general risks associated with doing business outside of the United States, including, without limitation,exchange rate fluctuations, inflation, import duties, tariffs, quotas, political and economic instability and terrorism; the impact of recent U.S. tax reform legislation on our resultsof operations; the potential impact of new laws, regulations or policy, including, without limitation, tariffs, import/export, trade and immigration regulations or policies; changes ingovernment regulations; the impact of, including business and legal developments relating to, climate change and natural disasters; litigation, regulatory proceedings and otherclaims asserted against NIKE; the ability to attract and retain qualified employees, and any negative public perception with respect to key personnel; the effects of NIKE’sdecision to invest in or divest of businesses and other factors referenced or incorporated by reference in this report and other reports.
The risks included here are not exhaustive. Other sections of this report may include additional factors which could adversely affect NIKE’s business and financial performance.Moreover, NIKE operates in a very competitive and rapidly changing environment. New risks emerge from time to time and it is not possible for management to predict all suchrisks, nor can it assess the impact of all such risks on NIKE’s business or the extent to which any risk, or combination of risks, may cause actual results to differ materially fromthose contained in any forward-looking statements. Given these risks and uncertainties, investors should not place undue reliance on forward-looking statements as aprediction of actual results.
Investors should also be aware that while NIKE does, from time to time, communicate with securities analysts, it is against NIKE’s policy to disclose to them any material non-public information or other confidential commercial information. Accordingly, shareholders should not assume that NIKE agrees with any statement or report issued by anyanalyst irrespective of the content of the statement or report. Furthermore, NIKE has a policy against issuing or confirming financial forecasts or projections issued by others.Thus, to the extent that reports issued by securities analysts contain any projections, forecasts or opinions, such reports are not the responsibility of NIKE.
Our products face intense competition.NIKE is a consumer products company and the relative popularity of various sports and fitness activities and changing design trends affect the demand for our products. Theathletic footwear, apparel and equipment industry is highly competitive both in the United States and worldwide. We compete internationally with a significant number of athleticand leisure footwear companies, athletic and leisure apparel companies, sports equipment companies and large companies having diversified lines of athletic and leisurefootwear, apparel and equipment. We also compete with other companies for the production capacity of independent manufacturers that produce our products. Our NIKEDirect operations, both through our digital commerce operations and retail stores, also compete with multi-brand retailers selling our products.
Product offerings, technologies, marketing expenditures (including expenditures for advertising and endorsements), pricing, costs of production, customer service, digitalcommerce platforms and social media presence are areas of intense competition. This, in addition to rapid changes in technology and consumer preferences in the markets forathletic and leisure footwear and apparel and athletic equipment, constitute significant risk factors in our operations. In addition, the competitive nature of retail including shiftsin the ways in which consumers are shopping, and the rising trend of digital commerce, constitutes a risk factor implicating our NIKE Direct and wholesale operations. If we donot adequately and timely anticipate and respond to our competitors, our costs may increase or the consumer demand for our products may decline significantly.
Failure to maintain our reputation and brand image could negatively impact our business.Our iconic brands have worldwide recognition, and our success depends on our ability to maintain and enhance our brand image and reputation. Maintaining, promoting andgrowing our brands will depend on our design and marketing efforts, including advertising and consumer campaigns, product innovation and product quality. Our commitmentto product innovation and quality and our continuing investment in design (including materials) and marketing may not have the desired impact on our brand image andreputation. In addition, our success in maintaining, extending and expanding our brand image depends on our ability to adapt to a rapidly changing media environment,including our increasing reliance on social media and digital dissemination of advertising campaigns. We could be adversely impacted if we fail to achieve any of theseobjectives.
6

Table of Contents
Our brand value also depends on our ability to maintain a positive consumer perception of our corporate integrity and brand culture. Negative claims or publicity involving us,our products or any of our key employees, endorsers, sponsors or suppliers could seriously damage our reputation and brand image, regardless of whether such claims areaccurate. Social media, which accelerates and potentially amplifies the scope of negative publicity, can increase the challenges of responding to negative claims. Adversepublicity about regulatory or legal action against us, or by us, could also damage our reputation and brand image, undermine consumer confidence in us and reduce long-termdemand for our products, even if the regulatory or legal action is unfounded or not material to our operations. If the reputation or image of any of our brands is tarnished or if wereceive negative publicity, then our product sales, financial condition and results of operations could be materially and adversely affected.
If we are unable to anticipate consumer preferences and develop new products, we may not be able to maintain or increase our revenuesand profits.Our success depends on our ability to identify, originate and define product trends as well as to anticipate, gauge and react to changing consumer demands in a timely manner.However, lead times for many of our products may make it more difficult for us to respond rapidly to new or changing product trends or consumer preferences. All of ourproducts are subject to changing consumer preferences that cannot be predicted with certainty. Our new products may not receive consumer acceptance as consumerpreferences could shift rapidly to different types of performance products or away from these types of products altogether, and our future success depends in part on our abilityto anticipate and respond to these changes. If we fail to anticipate accurately and respond to trends and shifts in consumer preferences by adjusting the mix of existing productofferings, developing new products, designs, styles and categories, and influencing sports and fitness preferences through extensive marketing, we could experience lowersales, excess inventories or lower profit margins, any of which could have an adverse effect on our results of operations and financial condition. In addition, we market ourproducts globally through a diverse spectrum of advertising and promotional programs and campaigns, including social media, mobile applications and online advertising. If wedo not successfully market our products or if advertising and promotional costs increase, these factors could have an adverse effect on our business, financial condition andresults of operations.
We rely on technical innovation and high-quality products to compete in the market for our products.Technical innovation and quality control in the design and manufacturing process of footwear, apparel and athletic equipment is essential to the commercial success of ourproducts. Research and development play a key role in technical innovation. We rely upon specialists in the fields of biomechanics, chemistry, exercise physiology,engineering, industrial design, sustainability and related fields, as well as research committees and advisory boards made up of athletes, coaches, trainers, equipmentmanagers, orthopedists, podiatrists and other experts to develop and test cutting-edge performance products. While we strive to produce products that help to enhance athleticperformance, reduce injury and maximize comfort, if we fail to introduce technical innovation in our products, consumer demand for our products could decline, and if weexperience problems with the quality of our products, we may incur substantial expense to remedy the problems.
Failure to continue to obtain or maintain high-quality endorsers of our products could harm our business.We establish relationships with professional athletes, sports teams and leagues, as well as other public figures, to develop, evaluate and promote our products, as well asestablish product authenticity with consumers. However, as competition in our industry has increased, the costs associated with establishing and retaining such sponsorshipsand other relationships have increased. If we are unable to maintain our current associations with professional athletes, sports teams and leagues, or other public figures, or todo so at a reasonable cost, we could lose the high visibility or on-field authenticity associated with our products, and we may be required to modify and substantially increaseour marketing investments. As a result, our brands, net revenues, expenses and profitability could be harmed.
Furthermore, if certain endorsers were to stop using our products contrary to their endorsement agreements, our business could be adversely affected. In addition, actionstaken by athletes, teams or leagues, or other endorsers, associated with our products that harm the reputations of those athletes, teams or leagues, or endorsers, could alsoseriously harm our brand image with consumers and, as a result, could have an adverse effect on our sales and financial condition. In addition, poor performance by ourendorsers, a failure to continue to correctly identify promising athletes, or public figures, to use and endorse our products or a failure to enter into cost-effective endorsementarrangements with prominent athletes, public figures, and sports organizations could adversely affect our brand, sales and profitability.
General economic factors beyond our control, and changes in the global economic environment, including fluctuations in inflation andcurrency exchange rates, could result in lower revenues, higher costs and decreased margins and earnings.A majority of our products are manufactured and sold outside of the United States, and we conduct purchase and sale transactions in various currencies, which increases ourexposure to the volatility of global economic conditions, including fluctuations in inflation and foreign currency exchange rates. Additionally, there has been, and may continueto be, volatility in currency exchange rates as a result of the United Kingdom’s impending exit from the European Union, commonly referred to as “Brexit” and new or proposedU.S. policy changes. Our international revenues and expenses generally are derived from sales and operations in foreign currencies, and these revenues and expenses couldbe affected by currency fluctuations, specifically amounts recorded in foreign currencies and translated into U.S. Dollars for consolidated financial reporting, as weakening offoreign currencies relative to the U.S. Dollar adversely affects the U.S. Dollar value of the Company’s foreign currency-denominated sales and earnings. Currency exchangerate fluctuations could also disrupt the business of the independent manufacturers that produce our products by making their purchases of raw materials more expensive andmore difficult to finance. Foreign currency fluctuations have adversely affected and could continue to have an adverse effect on our results of operations and financial condition.
We may hedge certain foreign currency exposures to lessen and delay, but not to completely eliminate, the effects of foreign currency fluctuations on our financial results.Since the hedging activities are designed to lessen volatility, they not only reduce the negative impact of a stronger U.S. Dollar or other trading currency, but they also reducethe positive impact of a weaker U.S. Dollar or other trading currency. Our future financial results could be significantly affected by the value of the U.S. Dollar in relation to theforeign currencies in which we conduct business. The degree to which our financial results are affected for any given time period will depend in part upon our hedging activities.
7

Table of Contents
Global economic conditions could have a material adverse effect on our business, operating results and financial condition.The uncertain state of the global economy continues to impact businesses around the world, most acutely in emerging markets and developing economies. If global economicand financial market conditions do not improve or deteriorate, the following factors could have a material adverse effect on our business, operating results and financialcondition:
• Slower consumer spending may result in reduced demand for our products, reduced orders from retailers for our products, order cancellations, lower revenues, higherdiscounts, increased inventories and lower gross margins.
• In the future, we may be unable to access financing in the credit and capital markets at reasonable rates in the event we find it desirable to do so.
• We conduct transactions in various currencies, which increases our exposure to fluctuations in foreign currency exchange rates relative to the U.S. Dollar. Continuedvolatility in the markets and exchange rates for foreign currencies and contracts in foreign currencies, including in response to certain policies advocated or implemented bythe U.S. presidential administration, could have a significant impact on our reported operating results and financial condition.
• Continued volatility in the availability and prices for commodities and raw materials we use in our products and in our supply chain (such as cotton or petroleum derivatives)could have a material adverse effect on our costs, gross margins and profitability.
• If retailers of our products experience declining revenues or experience difficulty obtaining financing in the capital and credit markets to purchase our products, this couldresult in reduced orders for our products, order cancellations, late retailer payments, extended payment terms, higher accounts receivable, reduced cash flows, greaterexpense associated with collection efforts and increased bad debt expense.
• If retailers of our products experience severe financial difficulty, some may become insolvent and cease business operations, which could negatively impact the sale of ourproducts to consumers.
• If contract manufacturers of our products or other participants in our supply chain experience difficulty obtaining financing in the capital and credit markets to purchase rawmaterials or to finance capital equipment and other general working capital needs, it may result in delays or non-delivery of shipments of our products.
Our business is affected by seasonality, which could result in fluctuations in our operating results.We experience moderate fluctuations in aggregate sales volume during the year. Historically, revenues in the first and fourth fiscal quarters have slightly exceeded those in thesecond and third fiscal quarters. However, the mix of product sales may vary considerably from time to time as a result of changes in seasonal and geographic demand forparticular types of footwear, apparel and equipment and in connection with the timing of significant sporting events, such as the NBA Finals, Olympics or the World Cup, amongothers. In addition, our customers may cancel orders, change delivery schedules or change the mix of products ordered with minimal notice. As a result, we may not be able toaccurately predict our quarterly sales. Accordingly, our results of operations are likely to fluctuate significantly from period to period. This seasonality, along with other factorsthat are beyond our control, including general economic conditions, changes in consumer preferences, weather conditions, availability of import quotas, transportationdisruptions and currency exchange rate fluctuations, could adversely affect our business and cause our results of operations to fluctuate. Our operating margins are alsosensitive to a number of additional factors that are beyond our control, including manufacturing and transportation costs, shifts in product sales mix and geographic salestrends, all of which we expect to continue. Results of operations in any period should not be considered indicative of the results to be expected for any future period.
We may be adversely affected by the financial health of our customers.We extend credit to our customers based on an assessment of a customer’s financial condition, generally without requiring collateral. To assist in the scheduling of productionand the shipping of our products, we offer certain customers the opportunity to place orders five to six months ahead of delivery under our futures ordering program. Theseadvance orders may be canceled under certain conditions, and the risk of cancellation may increase when dealing with financially unstable retailers or retailers struggling witheconomic uncertainty. In the past, some customers have experienced financial difficulties up to and including bankruptcies, which have had an adverse effect on our sales, ourability to collect on receivables and our financial condition. When the retail economy weakens or as consumer behavior shifts, retailers may be more cautious with orders. Aslowing or changing economy in our key markets could adversely affect the financial health of our customers, which in turn could have an adverse effect on our results ofoperations and financial condition. In addition, product sales are dependent in part on high quality merchandising and an appealing retail environment to attract consumers,which requires continuing investments by retailers. Retailers that experience financial difficulties may fail to make such investments or delay them, resulting in lower sales andorders for our products.
Failure to accurately forecast consumer demand could lead to excess inventories or inventory shortages, which could result in decreasedoperating margins, reduced cash flows and harm to our business.To meet anticipated demand for our products, we purchase products from manufacturers outside of our futures ordering program and in advance of customer orders, which wehold in inventory and resell to customers. There is a risk we may be unable to sell excess products ordered from manufacturers. Inventory levels in excess of customer demandmay result in inventory write-downs, and the sale of excess inventory at discounted prices could significantly impair our brand image and have an adverse effect on ouroperating results, financial condition and cash flows. Conversely, if we underestimate consumer demand for our products or if our manufacturers fail to supply products werequire at the time we need them, we may experience inventory shortages. Inventory shortages might delay shipments to customers, negatively impact retailer, distributor andconsumer relationships and diminish brand loyalty. The difficulty in forecasting demand also makes it difficult to estimate our future results of operations, financial condition andcash flows from period to period. A failure to accurately predict the level of demand for our products could adversely affect our net revenues and net income, and we areunlikely to forecast such effects with any certainty in advance.
8

Table of Contents
Consolidation of retailers or concentration of retail market share among a few retailers may increase and concentrate our credit risk andimpair our ability to sell products.The athletic footwear, apparel and equipment retail markets in some countries are dominated by a few large athletic footwear, apparel and equipment retailers with manystores. These retailers have in the past increased their market share by expanding through acquisitions and construction of additional stores. These situations concentrate ourcredit risk with a relatively small number of retailers, and, if any of these retailers were to experience a shortage of liquidity or consumer behavior shifts away from traditionalretail, it would increase the risk that their outstanding payables to us may not be paid. In addition, increasing market share concentration among one or a few retailers in aparticular country or region increases the risk that if any one of them substantially reduces their purchases of our products, we may be unable to find a sufficient number ofother retail outlets for our products to sustain the same level of sales and revenues.
Our NIKE Direct operations have required and will continue to require a substantial investment and commitment of resources and aresubject to numerous risks and uncertainties.Our NIKE Direct stores have required substantial fixed investment in equipment and leasehold improvements, information systems and personnel. We have entered intosubstantial operating lease commitments for retail space. Certain stores have been designed and built to serve as high-profile venues to promote brand awareness andmarketing activities. Because of their unique design elements, locations and size, these stores require substantially more investment than other stores. Due to the high fixed-cost structure associated with our NIKE Direct operations, a decline in sales, a shift in consumer behavior away from brick-and-mortar retail, or the closure or poor performanceof individual or multiple stores could result in significant lease termination costs, write-offs of equipment and leasehold improvements and employee-related costs.
Many factors unique to retail operations, some of which are beyond the Company’s control, pose risks and uncertainties. Risks include, but are not limited to: credit card fraud;mismanagement of existing retail channel partners; and inability to manage costs associated with store construction and operation. In addition, extreme weather conditions inthe areas in which our stores are located could adversely affect our business.
If the technology-based systems that give our customers the ability to shop with us online do not function effectively, our operatingresults, as well as our ability to grow our digital commerce business globally, could be materially adversely affected.Many of our customers shop with us through our digital platforms. Increasingly, customers are using mobile-based devices and applications to shop online with us and with ourcompetitors, and to do comparison shopping. We are increasingly using social media and proprietary mobile applications to interact with our customers and as a means toenhance their shopping experience. Any failure on our part to provide attractive, effective, reliable, user-friendly digital commerce platforms that offer a wide assortment ofmerchandise with rapid delivery options and that continually meet the changing expectations of online shoppers could place us at a competitive disadvantage, result in the lossof digital commerce and other sales, harm our reputation with customers, have a material adverse impact on the growth of our digital commerce business globally and couldhave a material adverse impact on our business and results of operations.
Risks specific to our digital commerce business also include diversion of sales from our and our retailers’ brick and mortar stores, difficulty in recreating the in-store experiencethrough direct channels and liability for online content. Our failure to successfully respond to these risks might adversely affect sales in our digital commerce business, as wellas damage our reputation and brands.
Failure to adequately protect or enforce our intellectual property rights could adversely affect our business.We periodically discover counterfeit reproductions of our products or products that otherwise infringe our intellectual property rights. If we are unsuccessful in enforcing ourintellectual property rights, continued sales of these products could adversely affect our sales and our brand and could result in a shift of consumer preference away from ourproducts.
The actions we take to establish and protect our intellectual property rights may not be adequate to prevent imitation of our products by others. We also may be unable toprevent others from seeking to block sales of our products as violations of proprietary rights.
We may be subject to liability if third parties successfully claim we infringe on their intellectual property rights. Defending infringement claims could be expensive and time-consuming and might result in our entering into costly license agreements. We also may be subject to significant damages or injunctions against development, use, importationand/or sale of certain products.
We take various actions to prevent the unauthorized use and/or disclosure of our confidential information and intellectual property rights. These actions include contractualmeasures such as entering into non-disclosure and non-compete agreements and agreements relating to our collaborations with third parties and providing confidentialinformation awareness training. Our controls and efforts to prevent unauthorized use and/or disclosure of confidential information and intellectual property rights might notalways be effective. For example, confidential information related to business strategy, new technologies, mergers and acquisitions, unpublished financial results or personaldata could be prematurely or inadvertently used and/or disclosed, resulting in a loss of reputation, a decline in our stock price and/or a negative impact on our market position,and could lead to damages, fines, penalties or injunctions.
In addition, the laws of certain countries may not protect or allow enforcement of intellectual property rights to the same extent as the laws of the United States. We may facesignificant expenses and liability in connection with the protection of our intellectual property rights, including outside the United States, and if we are unable to successfullyprotect our rights or resolve intellectual property conflicts with others, our business or financial condition may be adversely affected.
We are subject to the risk our licensees may not generate expected sales or maintain the value of our brands.We currently license, and expect to continue licensing, certain of our proprietary rights, such as trademarks or copyrighted material, to third parties. If our licensees fail tosuccessfully market and sell licensed products, or fail to obtain sufficient capital or effectively manage their business operations, customer relationships, labor relationships,supplier relationships or credit risks, it could adversely affect our revenues, both directly from reduced royalties received and indirectly from reduced sales of our otherproducts.
9

Table of Contents
We also rely on our licensees to help preserve the value of our brands. Although we attempt to protect our brands through approval rights over the design, productionprocesses, quality, packaging, merchandising, distribution, advertising and promotion of our licensed products, we cannot completely control the use of our licensed brands byour licensees. The misuse of a brand by or negative publicity involving a licensee could have a material adverse effect on that brand and on us.
We are subject to data security and privacy risks that could negatively affect our results, operations or reputation.In addition to our own sensitive and proprietary business information, we collect transactional and personal information about our customers and users of our digitalexperiences, which include online distribution channels and product engagement and personal fitness applications. Hackers and data thieves are increasingly sophisticatedand operate large-scale and complex automated attacks. Any breach of our or our service providers’ network, or other vendor systems, may result in the loss of confidentialbusiness and financial data, misappropriation of our consumers’, users’ or employees’ personal information or a disruption of our business. Any of these outcomes could havea material adverse effect on our business, including unwanted media attention, impairment of our consumer and customer relationships, damage to our reputation; resulting inlost sales and consumers, fines, lawsuits, or significant legal and remediation expenses. We also may need to expend significant resources to protect against, respond toand/or redress problems caused by any breach.
In addition, we must comply with increasingly complex and rigorous regulatory standards enacted to protect business and personal data in the U.S., Europe and elsewhere. Forexample, the European Union adopted the General Data Protection Regulation (the “GDPR”), which became effective on May 25, 2018. The GDPR imposes additionalobligations on companies regarding the handling of personal data and provides certain individual privacy rights to persons whose data is stored. Compliance with existing,proposed and recently enacted laws (including implementation of the privacy and process enhancements called for under GDPR) and regulations can be costly; any failure tocomply with these regulatory standards could subject us to legal and reputational risks. Misuse of or failure to secure personal information could also result in violation of dataprivacy laws and regulations, proceedings against the Company by governmental entities or others, damage to our reputation and credibility and could have a negative impacton revenues and profits.
Failure of our contractors or our licensees’ contractors to comply with our code of conduct, local laws and other standards could harmour business.We work with hundreds of contractors outside of the United States to manufacture our products, and we also have license agreements that permit unaffiliated parties tomanufacture or contract for the manufacture of products using our intellectual property. We require the contractors that directly manufacture our products and our licensees thatmake products using our intellectual property (including, indirectly, their contract manufacturers) to comply with a code of conduct and other environmental, health and safetystandards for the benefit of workers. We also require these contractors to comply with applicable standards for product safety. Notwithstanding their contractual obligations,from time to time contractors may not comply with such standards or applicable local law or our licensees may fail to enforce such standards or applicable local law on theircontractors. Significant or continuing noncompliance with such standards and laws by one or more contractors could harm our reputation or result in a product recall and, as aresult, could have an adverse effect on our sales and financial condition. Negative publicity regarding production methods, alleged practices or workplace or related conditionsof any of our suppliers, manufacturers or licensees could adversely affect our brand image and sales and force us to locate alternative suppliers, manufacturers or licenses.
Our international operations involve inherent risks which could result in harm to our business.Virtually all of our athletic footwear and apparel is manufactured outside of the United States, and the majority of our products are sold outside of the United States.Accordingly, we are subject to the risks generally associated with global trade and doing business abroad, which include foreign laws and regulations, varying consumerpreferences across geographic regions, political unrest, disruptions or delays in cross-border shipments and changes in economic conditions in countries in which our productsare manufactured or where we sell products. This includes, for example, the uncertainty surrounding the effect of Brexit, including changes to the legal and regulatoryframework that apply to the United Kingdom and its relationship with the European Union, as well as new and proposed changes affecting tax laws and trade policy in the U.S.and elsewhere as further described below under “ We could be subject to changes in tax rates, adoption of new tax laws, additional tax liabilities or increased volatility in oureffective tax rate ” and “ Changes to U.S. trade policy, tariff and import/export regulations may have a material adverse effect on our business, financial condition and results ofoperations . ” The U.S. presidential administration has indicated a focus on policy reforms that discourage U.S. corporations from outsourcing manufacturing and productionactivities to foreign jurisdictions, including through tariffs or penalties on goods manufactured outside the U.S., which may require us to change the way we conduct businessand adversely affect our results of operations. The administration has also targeted the specific practices of certain U.S. multinational corporations in public statements which, ifdirected at us, could harm our reputation or otherwise negatively impact our business.
In addition, disease outbreaks, terrorist acts and military conflict have increased the risks of doing business abroad. These factors, among others, could affect our ability tomanufacture products or procure materials, our ability to import products, our ability to sell products in international markets and our cost of doing business. If any of these orother factors make the conduct of business in a particular country undesirable or impractical, our business could be adversely affected. In addition, many of our importedproducts are subject to duties, tariffs or quotas that affect the cost and quantity of various types of goods imported into the United States and other countries. Any country inwhich our products are produced or sold may eliminate, adjust or impose new quotas, duties, tariffs, safeguard measures, anti-dumping duties, cargo restrictions to preventterrorism, restrictions on the transfer of currency, climate change legislation, product safety regulations or other charges or restrictions, any of which could have an adverseeffect on our results of operations and financial condition.
We could be subject to changes in tax rates, adoption of new tax laws, additional tax liabilities or increased volatility in our effective taxrate.We are subject to the tax laws in the United States and numerous foreign jurisdictions. Current economic and political conditions make tax laws and regulations, or theirinterpretation and application, in any jurisdiction subject to significant change. On December 22, 2017, the U.S. enacted the Tax Cuts and Jobs Act (the “Tax Act”), whichincludes a number of significant changes to previous U.S. tax laws that impact us, including provisions for a one-time transition tax on deemed repatriation of undistributedforeign earnings, and a reduction in the corporate tax rate from 35% to 21% for tax years beginning after December 31, 2017, among other changes. The Tax Act alsotransitions U.S. international taxation from a worldwide system to a modified territorial system and includes base erosion prevention measures on non-U.S. earnings, which hasthe effect of subjecting certain earnings of our foreign subsidiaries to U.S. taxation.
10

Table of Contents
Implementation of the Tax Act required us to record incremental provisional tax expense in fiscal 2018, which increased our effective tax rate in fiscal 2018. Adjustments to theincremental provisional tax expense may be made in future periods as actual amounts may differ due to, among other factors, a change in interpretation of the applicablerevisions to the U.S. tax code and related tax accounting guidance, changes in assumptions made in developing these estimates, regulatory guidance that may be issued withrespect to the applicable revisions to the U.S. tax code, and state tax implications. As we complete our analysis of the Tax Act, we may make adjustments to provisionalamounts we have recorded, which could negatively impact our business, results of operations or financial condition. Changes or challenges to or the repeal of the Tax Actcannot be predicted with certainty and could have a material impact on our future tax expense.
We earn a substantial portion of our income in foreign countries and are subject to the tax laws of those jurisdictions. There have been proposals to reform foreign tax laws thatcould significantly impact how U.S. multinational corporations are taxed on foreign earnings. Although we cannot predict whether or in what form these proposals will pass,several of the proposals considered, if enacted into law, could have an adverse impact on our income tax expense and cash flows.
Portions of our operations are subject to a reduced tax rate or are free of tax under various tax holidays and rulings that expire in whole or in part from time to time. These taxholidays and rulings may be extended when certain conditions are met, or terminated if certain conditions are not met. If the tax holidays and rulings are not extended, or if wefail to satisfy the conditions of the reduced tax rate, our effective income tax rate would increase in the future.
We are also subject to the examination of our tax returns by the United States Internal Revenue Service (“IRS”) and other tax authorities. We regularly assess the likelihood ofan adverse outcome resulting from these examinations to determine the adequacy of its provision for income taxes. Although we believe our tax provisions are adequate, thefinal determination of tax audits and any related disputes could be materially different from our historical income tax provisions and accruals, particularly in light of theenactment of the Tax Act. The results of audits or related disputes could have an adverse effect on our financial statements for the period or periods for which the applicablefinal determinations are made. For example, we and our subsidiaries are engaged in a number of intercompany transactions across multiple tax jurisdictions. Although webelieve we have clearly reflected the economics of these transactions and the proper local transfer pricing documentation is in place, tax authorities may propose and sustainadjustments that could result in changes that may impact our mix of earnings in countries with differing statutory tax rates.
Changes to U.S. trade policy, tariff and import/export regulations may have a material adverse effect on our business, financial conditionand results of operations.Changes in U.S. or international social, political, regulatory and economic conditions or in laws and policies governing foreign trade, manufacturing, development andinvestment in the territories or countries where we currently sell our products or conduct our business, as well as any negative sentiment toward the U.S. as a result of suchchanges, could adversely affect our business. The U.S. presidential administration has instituted or proposed changes in trade policies that include the negotiation ortermination of trade agreements, the imposition of higher tariffs on imports into the U.S., economic sanctions on individuals, corporations or countries, and other governmentregulations affecting trade between the U.S. and other countries where we conduct our business. It may be time-consuming and expensive for us to alter our businessoperations in order to adapt to or comply with any such changes.
As a result of recent policy changes of the U.S. presidential administration and recent U.S. government proposals, there may be greater restrictions and economic disincentiveson international trade. The new tariffs and other changes in U.S. trade policy could trigger retaliatory actions by affected countries, and certain foreign governments haveinstituted or are considering imposing trade sanctions on certain U.S. goods. The Company, similar to many other multinational corporations, does a significant amount ofbusiness that would be impacted by changes to the trade policies of the U.S. and foreign countries (including governmental action related to tariffs, international tradeagreements, or economic sanctions). Such changes have the potential to adversely impact the U.S. economy or certain sectors thereof, our industry and the global demand forour products, and as a result, could have a material adverse effect on our business, financial condition and results of operations.
If one or more of our counterparty financial institutions default on their obligations to us or fail, we may incur significant losses.As part of our hedging activities, we enter into transactions involving derivative financial instruments, which may include forward contracts, commodity futures contracts, optioncontracts, collars and swaps with various financial institutions. In addition, we have significant amounts of cash, cash equivalents and other investments on deposit or inaccounts with banks or other financial institutions in the United States and abroad. As a result, we are exposed to the risk of default by or failure of counterparty financialinstitutions. The risk of counterparty default or failure may be heightened during economic downturns and periods of uncertainty in the financial markets. If one of ourcounterparties were to become insolvent or file for bankruptcy, our ability to recover losses incurred as a result of default, or our assets deposited or held in accounts with suchcounterparty, may be limited by the counterparty’s liquidity or the applicable laws governing the insolvency or bankruptcy proceedings. In the event of default or failure of one ormore of our counterparties, we could incur significant losses, which could negatively impact our results of operations and financial condition.
We rely on a concentrated source base of contract manufacturers to supply a significant portion of our footwear products.NIKE is supplied by 124 footwear factories located in 13 countries. We do not own or operate any of the footwear manufacturing facilities and depend upon independentcontract manufacturers to manufacture all of the footwear products we sell. In fiscal 2018 , five footwear contract manufacturers each accounted for greater than 10% of fiscal2018 footwear production and in aggregate accounted for approximately 69% of NIKE Brand footwear production in fiscal 2018 . Our ability to meet our customers’ needsdepends on our ability to maintain a steady supply of products from our independent contract manufacturers. If one or more of our significant suppliers were to sever theirrelationship with us or significantly alter the terms of our relationship, including due to changes in applicable trade policies, we may not be able to obtain replacement productsin a timely manner, which could have a material adverse effect on our sales, financial condition or results of operations. Additionally, if any of our primary contractmanufacturers fail to make timely shipments, do not meet our quality standards or otherwise fail to deliver us product in accordance with our plans, there could be a materialadverse effect on our results of operations.
11

Table of Contents
Our products are subject to risks associated with overseas sourcing, manufacturing and financing.The principal materials used in our apparel products — natural and synthetic fabrics and threads, specialized performance fabrics designed to efficiently wick moisture awayfrom the body, retain heat or repel rain and/or snow as well as plastic and metal hardware — are available in countries where our manufacturing takes place. The principalmaterials used in our footwear products — natural and synthetic rubber, plastic compounds, foam cushioning materials, natural and synthetic leather, natural and syntheticfabrics and threads, nylon, canvas and polyurethane films — are also locally available to manufacturers. Both our apparel and footwear products are dependent upon the abilityof our unaffiliated contract manufacturers to locate, train, employ and retain adequate personnel. NIKE contractors and suppliers buy raw materials and are subject to wagerates that are oftentimes regulated by the governments of the countries in which our products are manufactured.
There could be a significant disruption in the supply of fabrics or raw materials from current sources or, in the event of a disruption, our contract manufacturers might not beable to locate alternative suppliers of materials of comparable quality at an acceptable price or at all. Further, our unaffiliated contract manufacturers have experienced andmay continue to experience in the future, unexpected increases in work wages, whether government mandated or otherwise and increases in compliance costs due togovernmental regulation concerning certain metals used in the manufacturing of our products. In addition, we cannot be certain that our unaffiliated manufacturers will be ableto fill our orders in a timely manner. If we experience significant increases in demand, or reductions in the availability of materials, or need to replace an existing manufacturer,there can be no assurance additional supplies of fabrics or raw materials or additional manufacturing capacity will be available when required on terms acceptable to us, or atall, or that any supplier or manufacturer would allocate sufficient capacity to us in order to meet our requirements. In addition, even if we are able to expand existing or find newmanufacturing or sources of materials, we may encounter delays in production and added costs as a result of the time it takes to train suppliers and manufacturers in ourmethods, products, quality control standards and labor, health and safety standards. Any delays, interruption or increased costs in labor or wages, or the supply of materials ormanufacture of our products could have an adverse effect on our ability to meet retail customer and consumer demand for our products and result in lower revenues and netincome both in the short- and long-term.
Because independent manufacturers make a majority of our products outside of our principal sales markets, our products must be transported by third parties over largegeographic distances. Delays in the shipment or delivery of our products due to the availability of transportation, work stoppages, port strikes, infrastructure congestion or otherfactors, and costs and delays associated with consolidating or transitioning between manufacturers, could adversely impact our financial performance. In addition,manufacturing delays or unexpected demand for our products may require us to use faster, but more expensive, transportation methods such as air freight, which couldadversely affect our profit margins. The cost of oil is a significant component in manufacturing and transportation costs, so increases in the price of petroleum products canadversely affect our profit margins. Changes in U.S. trade policies, including new and potential changes to import tariffs and existing trade policies and agreements, could alsohave a significant impact on our activities in foreign jurisdictions, and could adversely affect our results of operations.
In addition, Sojitz America performs significant import-export financing services for the Company. During fiscal 2018, Sojitz America provided financing and purchasing servicesfor NIKE Brand products sold in certain NIKE markets including Argentina, Brazil, Canada, India, South Africa and Uruguay (collectively the “Sojitz Markets”), excludingproducts produced and sold in the same country. Any failure of Sojitz America to provide these services or any failure of Sojitz America’s banks could disrupt our ability toacquire products from our suppliers and to deliver products to our customers in the Sojitz Markets. Such a disruption could result in canceled orders that would adversely affectsales and profitability.
Our success depends on our global distribution facilities.We distribute our products to customers directly from the factory and through distribution centers located throughout the world. Our ability to meet customer expectations,manage inventory, complete sales and achieve objectives for operating efficiencies and growth, particularly in emerging markets, depends on the proper operation of ourdistribution facilities, the development or expansion of additional distribution capabilities and the timely performance of services by third parties (including those involved inshipping product to and from our distribution facilities). Our distribution facilities could be interrupted by information technology problems and disasters such as earthquakes orfires. Any significant failure in our distribution facilities could result in an adverse effect on our business. We maintain business interruption insurance, but it may not adequatelyprotect us from adverse effects caused by significant disruptions in our distribution facilities.
We rely significantly on information technology to operate our business, including our supply chain and retail operations, and any failure,inadequacy or interruption of that technology could harm our ability to effectively operate our business.We are heavily dependent on information technology systems and networks, including the Internet and third-party services (“Information Technology Systems”), across oursupply chain, including product design, production, forecasting, ordering, manufacturing, transportation, sales and distribution, as well as for processing financial information forexternal and internal reporting purposes, retail operations and other business activities. Information Technology Systems are critical to many of our operating activities and ourbusiness processes and may be negatively impacted by any service interruption or shutdown. For example, our ability to effectively manage and maintain our inventory and toship products to customers on a timely basis depends significantly on the reliability of these Information Technology Systems. Over a number of years, we have implementedInformation Technology Systems in all of the geographical regions in which we operate. Our work to integrate, secure and enhance these systems and related processes in ourglobal operations is ongoing and NIKE will continue to invest in these efforts. The failure of these systems to operate effectively, including as a result of security breaches,viruses, hackers, malware, natural disasters, vendor business interruptions or other causes, or failure to properly maintain, protect, repair or upgrade systems, or problems withtransitioning to upgraded or replacement systems could cause delays in product fulfillment and reduced efficiency of our operations, could require significant capitalinvestments to remediate the problem, and may have an adverse effect on our reputation, results of operations and financial condition.
We also use Information Technology Systems to process financial information and results of operations for internal reporting purposes and to comply with regulatory financialreporting, legal and tax requirements. If Information Technology Systems suffer severe damage, disruption or shutdown and our business continuity plans, or those of ourvendors, do not effectively resolve the issues in a timely manner, we could experience delays in reporting our financial results, which could result in lost revenues and profits,as well as reputational damage. Furthermore, we depend on Information Technology Systems and personal data collection for digital marketing, digital commerce, consumerengagement and the marketing and use of our digital products and services. We also rely on our ability to engage in electronic communications throughout the world betweenand among our employees as well as with other third parties, including customers, suppliers, vendors and consumers. Any interruption in Information Technology Systems mayimpede our ability to engage in the digital space and result in lost revenues, damage to our reputation, and loss of users.
12

Table of Contents
The market for prime real estate is competitive.Our ability to effectively obtain real estate to open new retail stores and otherwise conduct our operations, both domestically and internationally, depends on the availability ofreal estate that meets our criteria for traffic, square footage, co-tenancies, lease economics, demographics and other factors. We also must be able to effectively renew ourexisting real estate leases. In addition, from time to time, we seek to downsize, consolidate, reposition or close some of our real estate locations, which may requiremodification of an existing lease. Failure to secure adequate new locations or successfully modify leases for existing locations, or failure to effectively manage the profitability ofour existing fleet of retail stores, could have an adverse effect on our operating results and financial condition.
Additionally, the economic environment may make it difficult to determine the fair market rent of real estate properties domestically and internationally. This could impact thequality of our decisions to exercise lease options at previously negotiated rents and to renew expiring leases at negotiated rents. Any adverse effect on the quality of thesedecisions could impact our ability to retain real estate locations adequate to meet our targets or efficiently manage the profitability of our existing fleet of stores, which couldhave an adverse effect on our operating results and financial condition.
Extreme weather conditions and natural disasters could negatively impact our operating results and financial condition.Extreme weather conditions in the areas in which our retail stores, suppliers, customers, distribution centers and vendors are located could adversely affect our operatingresults and financial condition. Moreover, natural disasters such as earthquakes, hurricanes and tsunamis, whether occurring in the United States or abroad, and their relatedconsequences and effects, including energy shortages and public health issues, could disrupt our operations, the operations of our vendors and other suppliers or result ineconomic instability that may negatively impact our operating results and financial condition.
Our financial results may be adversely affected if substantial investments in businesses and operations fail to produce expected returns.From time to time, we may invest in technology, business infrastructure, new businesses, product offering and manufacturing innovation and expansion of existing businesses,such as our digital commerce operations, which require substantial cash investments and management attention. We believe cost-effective investments are essential tobusiness growth and profitability; however, significant investments are subject to typical risks and uncertainties inherent in developing a new business or expanding an existingbusiness. The failure of any significant investment to provide expected returns or profitability could have a material adverse effect on our financial results and divertmanagement attention from more profitable business operations.
We are subject to litigation and other legal and regulatory proceedings, which could have an adverse effect on our business, financialcondition and results of operations.As a multinational corporation with operations and distribution channels throughout the world, we are subject to extensive laws and regulations in the U.S. and otherjurisdictions in which we have operations and distribution channels. We are involved in various types of claims, lawsuits, regulatory proceedings and government investigationsrelating to our business, our products and the actions of our employees and representatives, including contractual and employment relationships, product liability, antitrust,trademark rights and a variety of other matters. It is not possible to predict with certainty the outcome of any such legal or regulatory proceedings or investigations, and wecould in the future incur judgments, fines or penalties, or enter into settlements of lawsuits and claims that could have a material adverse effect on our business, financialcondition and results of operations and negatively impact our reputation. The global nature of our business means legal and compliance risks will continue to exist andadditional legal proceedings and other contingencies will arise from time to time, which could adversely affect us. In addition, the adoption of new laws or regulations, orchanges in the interpretation of existing laws or regulations, may result in significant unanticipated legal and reputational risks. Any current or future legal or regulatoryproceedings could divert management’s attention from our operations and result in substantial legal fees.
The success of our business depends, in part, on high-quality employees, including key personnel.Our success depends in part on the continued service of high-quality employees, including key executive officers and personnel. The loss of the services of key individuals, orany negative perception with respect to these individuals, could harm our business. Our success also depends on our ability to recruit, retain and engage our personnelsufficiently, both to maintain our current business and to execute our strategic initiatives. Competition for employees in our industry is intense and we may not be successful inattracting and retaining such personnel. In addition, shifts in U.S. immigration policy could negatively impact our ability to attract, hire and retain highly skilled employees whoare from outside the U.S.
The sale of a large number of shares of common stock by our principal stockholder could depress the market price of our common stock.As of June 30, 2018, Swoosh, LLC beneficially owned more than 77% of our Class A Common Stock. If, on June 30, 2018, all of these shares were converted into Class BCommon Stock, the commensurate ownership percentage of our Class B Common Stock would be approximately 17%. The shares are available for resale, subject to therequirements of the U.S. securities laws and the terms of the limited liability company agreement governing Swoosh, LLC. The sale or prospect of a sale of a substantialnumber of these shares could have an adverse effect on the market price of our common stock. Swoosh, LLC was formed by Philip H. Knight, our Chairman Emeritus, to holdthe majority of his shares of Class A Common Stock. Swoosh, LLC is controlled by Mr. Knight's son and NIKE director, Travis Knight.
Changes in our credit ratings or macroeconomic conditions may affect our liquidity, increasing borrowing costs and limiting ourfinancing options.Our long-term debt is currently rated Investment Grade by Standard & Poor’s and Moody’s Investors Service. If our credit ratings are lowered, borrowing costs for future long-term debt or short-term credit facilities may increase and our financing options, including our access to the unsecured credit market, could be limited. We may also be subjectto restrictive covenants that would reduce our flexibility to, among other things, incur additional indebtedness, make restricted payments, pledge assets as security, makeinvestments, loans, advances, guarantees and acquisitions, undergo fundamental changes and enter into transactions with affiliates. Failure to comply with such covenantscould result in a default, and as a result, the commitments of our lenders under our credit agreements may be terminated and the maturity of amounts owed may beaccelerated. In addition, macroeconomic conditions, such as increased volatility or disruption in the credit markets, could adversely affect our ability to refinance existing debt.
13

Table of Contents
If our internal controls are ineffective, our operating results could be adversely affected.Our internal control over financial reporting may not prevent or detect misstatements because of its inherent limitations, including the possibility of human error, thecircumvention or overriding of controls or fraud. Even effective internal controls can provide only reasonable assurance with respect to the preparation and fair presentation offinancial statements. If we fail to maintain the adequacy of our internal controls, including any failure to implement required new or improved controls, or if we experiencedifficulties in their implementation, our business and operating results could be harmed and we could fail to meet our financial reporting obligations.
If our estimates or judgments relating to our critical accounting policies prove to be incorrect, our operating results could be adverselyaffected.The preparation of financial statements in conformity with accounting principles generally accepted in the United States of America requires management to make estimatesand assumptions that affect the amounts reported in the consolidated financial statements and accompanying notes. We base our estimates on historical experience and onvarious other assumptions we believe to be reasonable under the circumstances, as provided in “Management’s Discussion and Analysis of Financial Condition and Results ofOperations.” The results of these estimates form the basis for making judgments about the carrying values of assets, liabilities and equity, and the amount of revenue andexpenses that are not readily apparent from other sources. Significant assumptions and estimates used in preparing our consolidated financial statements include those relatedto revenue recognition, allowance for uncollectible accounts receivable, inventory reserves, contingent payments under endorsement contracts, accounting for property, plantand equipment and definite-lived assets, hedge accounting for derivatives, stock-based compensation, income taxes and other contingencies. Our operating results may beadversely affected if our assumptions change or if actual circumstances differ from those in our assumptions, which could cause our operating results to fall below theexpectations of securities analysts and investors, resulting in a decline in the price of our Class B Common Stock.
Anti-takeover provisions may impair an acquisition of the Company or reduce the price of our common stock.There are provisions within our articles of incorporation and Oregon law intended to protect shareholder interests by providing the Board of Directors a means to attempt todeny coercive takeover attempts or to negotiate with a potential acquirer in order to obtain more favorable terms. Such provisions include a control share acquisition statute, afreeze-out statute, two classes of stock that vote separately on certain issues, and the fact that holders of Class A Common Stock elect three-quarters of the Board of Directorsrounded down to the next whole number. However, such provisions could discourage, delay or prevent an unsolicited merger, acquisition or other change in control of ourcompany that some shareholders might believe to be in their best interests or in which shareholders might receive a premium for their common stock over the prevailing marketprice. These provisions could also discourage proxy contests for control of the Company.
We may fail to meet market expectations, which could cause the price of our stock to decline.Our Class B Common Stock is traded publicly, and at any given time various securities analysts follow our financial results and issue reports on us. These reports includeinformation about our historical financial results as well as analysts’ estimates of our future performance. Analysts’ estimates are based upon their own opinions and are oftendifferent from our estimates or expectations. If our operating results are below the estimates or expectations of public market analysts and investors, our stock price coulddecline. In the past, securities class action litigation has been brought against NIKE and other companies following a decline in the market price of their securities. If our stockprice is volatile for any reason, we may become involved in this type of litigation in the future. Any litigation could result in reputational damage, substantial costs and adiversion of management’s attention and resources needed to successfully run our business.
14

Table of Contents
ITEM 1B. Unresolved Staff CommentsNone.
ITEM 2. PropertiesThe following is a summary of principal properties owned or leased by NIKE:
The NIKE World Campus, owned by NIKE and located near Beaverton, Oregon, USA, is an approximately 400-acre site consisting of over 40 buildings which, together withadjacent leased properties, functions as our world headquarters and is occupied by approximately 11,200 employees engaged in management, research, design, development,marketing, finance and other administrative functions serving nearly all of our divisions. We also lease various office facilities in the surrounding metropolitan area. We lease asimilar, but smaller, administrative facility in Hilversum, the Netherlands, which serves as the headquarters for the Europe, Middle East & Africa geography and management ofcertain brand functions for our non-U.S. operations. We also lease an office complex in Shanghai, China, our headquarters for Greater China, occupied by employees focusedon implementing our wholesale, NIKE Direct and merchandising strategies in the region, among other functions.
In the United States, NIKE has seven significant distribution centers. Five are located in Memphis, Tennessee, two of which are owned and three of which are leased. Twoother distribution centers, one located in Indianapolis, Indiana, and one located in Dayton, Tennessee, are leased and operated by third-party logistics providers. NIKE Brandapparel and equipment are also shipped from our Foothill Ranch, California distribution center, which we lease. Smaller leased, and third-party leased and operated,distribution facilities are located in various parts of the United States. NIKE has several distribution facilities outside the United States, some of which are leased and operatedby third-party logistics providers. The most significant distribution facilities outside the United States are located in Laakdal, Belgium; Taicang, China; Tomisato, Japan andIncheon, Korea, all of which we own.
Air Manufacturing Innovation manufactures Air-Sole cushioning components at NIKE-owned facilities and one leased facility located near Beaverton, Oregon and in St.Charles, Missouri. Air Manufacturing Innovation also manufactures and sells small amounts of various other plastic products to other manufacturers.
Aside from the principal properties described above, we lease many offices worldwide for sales and administrative purposes. We lease 1,181 retail stores worldwide, whichprimarily consist of factory stores. See “United States Market” and “International Markets” in Part I of this Report. Our leases expire at various dates through the year 2035.
ITEM 3. Legal ProceedingsThere are no material pending legal proceedings, other than ordinary routine litigation incidental to our business, to which we are a party or of which any of our property is thesubject.
ITEM 4. Mine Safety DisclosuresNot applicable.
15

Table of Contents
PART IIITEM 5. Market for Registrant’s Common Equity,Related Stockholder Matters and Issuer Purchases of Equity SecuritiesNIKE’s Class B Common Stock is listed on the New York Stock Exchange and trades under the symbol NKE. At July 20, 2018, there were 22,271 holders of record of ourClass B Common Stock and 15 holders of record of our Class A Common Stock. These figures do not include beneficial owners who hold shares in nominee name. TheClass A Common Stock is not publicly traded, but each share is convertible upon request of the holder into one share of Class B Common Stock. Refer to Selected QuarterlyFinancial Data in Part II, Item 6 of this Report for information regarding quarterly high and low sales prices for the Class B Common Stock as reported on the New York StockExchange Composite Tape, and for dividends declared on the Class A and Class B Common Stock.
In November 2015, the Board of Directors approved a four-year, $12 billion share repurchase program. As of May 31, 2018 , the Company had repurchased 149.4 millionshares at an average price of $58.25 per share for a total approximate cost of $8.7 billion under this program. The Company intends to use excess cash, future cash fromoperations and/or proceeds from debt to fund repurchases.
The following table presents a summary of share repurchases made by NIKE under this program during the quarter ended May 31, 2018 :
Period Total Number of
Shares Purchased Average PricePaid per Share
Total Number of SharesPurchased as Part of Publicly Announced Plans or Programs
Maximum Number(or Approximate Dollar Value)
of Shares that May Yet Be Purchased Under the
Plans or Programs(In millions)
March 1 — March 31, 2018 8,602,814 $ 65.94 8,602,814 $ 4,282
April 1 — April 30, 2018 7,823,991 $ 67.08 7,823,991 $ 3,757
May 1 — May 31, 2018 6,625,000 $ 69.63 6,625,000 $ 3,296 23,051,805 $ 67.39 23,051,805
16

Table of Contents
Performance GraphThe following graph demonstrates a five-year comparison of cumulative total returns for NIKE’s Class B Common Stock; the Standard & Poor’s 500 Stock Index; theStandard & Poor’s Apparel, Accessories & Luxury Goods Index; and the Dow Jones U.S. Footwear Index. The graph assumes an investment of $100 on May 31, 2013 in eachof our Class B Common Stock and the stocks comprising the Standard & Poor’s 500 Stock Index; the Standard & Poor’s Apparel, Accessories & Luxury Goods Index; and theDow Jones U.S. Footwear Index. Each of the indices assumes that all dividends were reinvested on the day of issuance.
COMPARISON OF 5-YEAR CUMULATIVE TOTAL RETURN AMONG NIKE, INC.; S&P 500 INDEX; S&P APPAREL, ACCESSORIES & LUXURY GOODS INDEX; ANDTHE DOW JONES U.S. FOOTWEAR INDEX
The Dow Jones U.S. Footwear Index consists of NIKE, Deckers Outdoor Corporation, Skechers U.S.A., Inc., Steven Madden, Ltd. and Wolverine World Wide, Inc. BecauseNIKE is part of the Dow Jones U.S. Footwear Index, the price and returns of NIKE stock have a substantial effect on this index. The Standard & Poor’s Apparel, Accessories &Luxury Goods Index consists of Michael Kors Holdings Limited, Ralph Lauren Corporation, Tapestry, Inc., Under Armour, Inc. and V.F. Corporation, among other companies.The Dow Jones U.S. Footwear Index and the Standard & Poor’s Apparel, Accessories & Luxury Goods Index include companies in two major lines of business in which theCompany competes. The indices do not encompass all of the Company’s competitors, nor all product categories and lines of business in which the Company is engaged.
The stock performance shown on the performance graph above is not necessarily indicative of future performance. The Company will not make or endorse any predictions asto future stock performance.
The performance graph above is being furnished solely to accompany this Report pursuant to Item 201(e) of Regulation S-K, is not being filed for purposes of Section 18 of theSecurities Exchange Act of 1934, as amended, and is not to be incorporated by reference into any filing of the Company, whether made before or after the date hereof,regardless of any general incorporation language in such filing.
17

Table of Contents
ITEM 6. Selected Financial DataAll share and per share amounts are reflective of the two-for-one stock split that began trading at the split-adjusted price on December 24, 2015.
(In millions, except per share data and financial ratios)
Financial History
2018 2017 2016 2015 2014
Year Ended May 31,
Revenues $ 36,397 $ 34,350 $ 32,376 $ 30,601 $ 27,799
Gross profit 15,956 15,312 14,971 14,067 12,446
Gross margin 43.8% 44.6% 46.2% 46.0% 44.8%
Net income 1,933 4,240 3,760 3,273 2,693
Earnings per common share:
Basic 1.19 2.56 2.21 1.90 1.52
Diluted 1.17 2.51 2.16 1.85 1.49
Weighted average common shares outstanding 1,623.8 1,657.8 1,697.9 1,723.5 1,766.7
Diluted weighted average common shares outstanding 1,659.1 1,692.0 1,742.5 1,768.8 1,811.6
Cash dividends declared per common share 0.78 0.70 0.62 0.54 0.47
Cash flow from operations (1) 4,955 3,846 3,399 4,906 3,158
Price range of common stock:
High 73.49 60.33 68.19 52.75 40.13
Low 50.35 49.01 47.25 36.57 29.56
At May 31,
Cash and equivalents $ 4,249 $ 3,808 $ 3,138 $ 3,852 $ 2,220
Short-term investments 996 2,371 2,319 2,072 2,922
Inventories 5,261 5,055 4,838 4,337 3,947
Working capital 9,094 10,587 9,667 9,225 8,319
Total assets 22,536 23,259 21,379 21,590 18,579
Long-term debt 3,468 3,471 1,993 1,072 1,191
Capital lease obligations 75 27 15 5 74
Redeemable preferred stock 0.3 0.3 0.3 0.3 0.3
Shareholders’ equity 9,812 12,407 12,258 12,707 10,824
Year-end stock price 71.80 52.99 55.22 50.84 38.46
Market capitalization 114,983 87,084 92,867 87,044 66,921
Financial Ratios:
Return on equity (2) 17.4% 34.4% 30.1% 27.8% 24.6%
Return on assets (2) 8.4% 19.0% 17.5% 16.3% 14.9%
Inventory turns 4.0 3.8 3.8 4.0 4.1
Current ratio at May 31 2.5 2.9 2.8 2.5 2.7
Price/Earnings ratio at May 31 (2) 61.4 21.1 25.6 27.5 25.9
(1) Prior year amounts have been updated to reflect the adoption of Accounting Standards Update No. 2016-09, Compensation — Stock Compensation (Topic 718):Improvements to Employee Share-Based Payment Accounting. As a result of adoption, the Company reclassified cash inflows of $177 million, $281 million, $218 millionand $132 million for the years ended May 31, 2017, 2016, 2015 and 2014, respectively, related to excess tax benefits from share-based payment awards, from Cash usedby financing activities to Cash provided by operations. Additionally, the Company reclassified cash outflows of $29 million, $22 million, $8 million and $13 million for theyears ended May 31, 2017, 2016, 2015 and 2014, respectively, related to tax payments for the net settlement of share-based payment awards, from Cash provided byoperations to Cash used by financing activities within the Consolidated Statements of Cash Flows. Refer to Note 1 — Summary of Significant Accounting Policies foradditional information.
(2) Certain fiscal 2018 financial ratios reflect the impact of the Tax Cuts and Jobs Act. Refer to Note 9 — Income Taxes for additional information.
18

Table of Contents
Selected Quarterly Financial Data
(Unaudited)(In millions, except per share data)
1st Quarter 2nd Quarter 3rd Quarter 4th Quarter
2018 2017 2018 2017 2018 (1) 2017 2018 2017
Revenues $ 9,070 $ 9,061 $ 8,554 $ 8,180 $ 8,984 $ 8,432 $ 9,789 $ 8,677
Gross profit 3,962 4,123 3,678 3,616 3,938 3,750 4,378 3,823
Gross margin 43.7% 45.5% 43.0% 44.2% 43.8% 44.5% 44.7% 44.1%
Net income (loss) 950 1,249 767 842 (921) 1,141 1,137 1,008
Earnings (loss) per common share:
Basic 0.58 0.75 0.47 0.51 (0.57) 0.69 0.71 0.61
Diluted 0.57 0.73 0.46 0.50 (0.57) 0.68 0.69 0.60Weighted average common sharesoutstanding 1,639.1 1,672.0 1,627.0 1,659.1 1,623.5 1,653.1 1,605.7 1,646.9Diluted weighted average common sharesoutstanding 1,676.9 1,708.9 1,660.9 1,693.2 1,623.5 1,686.3 1,641.2 1,678.6
Cash dividends declared per common share 0.18 0.16 0.20 0.18 0.20 0.18 0.20 0.18
Price range of common stock:
High 60.53 60.33 61.21 59.18 70.25 58.42 73.49 59.00
Low 50.79 51.48 50.35 49.01 59.24 50.06 63.21 50.81
(1) The third quarter of fiscal 2018 reflects the impact from the enactment of the Tax Cuts and Jobs Act. Refer to Note 9 — Income Taxes for additional information.
19

Table of Contents
ITEM 7. Management’s Discussion and Analysis of Financial Conditionand Results of OperationsNIKE designs, develops, markets and sells athletic footwear, apparel, equipment, accessories and services worldwide. We are the largest seller of athletic footwear andapparel in the world. We sell our products through NIKE-owned retail stores and through digital platforms (which we refer to collectively as our “NIKE Direct” operations), toretail accounts and a mix of independent distributors, licensees and sales representatives in virtually all countries around the world. Our goal is to deliver value to ourshareholders by building a profitable global portfolio of branded footwear, apparel, equipment and accessories businesses. Our strategy is to achieve long-term revenue growthby creating innovative, “must have” products, building deep personal consumer connections with our brands and delivering compelling consumer experiences through digitalplatforms and at retail.
In June 2017, we announced the Consumer Direct Offense, a new company alignment designed to allow NIKE to better serve the consumer personally, at scale. Leveragingthe power of digital, NIKE plans to drive growth — by accelerating innovation and product creation, moving even closer to the consumer through key cities, and deepening one-to-one connections. As a result of this organizational realignment, beginning in fiscal 2018, the Company’s reportable operating segments for the NIKE Brand are: NorthAmerica; Europe, Middle East & Africa (EMEA); Greater China; and Asia Pacific & Latin America (APLA).
Through the Consumer Direct Offense, we are focusing on our Triple Double strategy, with the objective of doubling the impact of innovation, increasing our speed to marketand growing our direct connections with consumers. As a result of the execution of this strategy, our long-term financial goals through fiscal 2023, on average, per year, are asfollows:
• High single-digit revenue growth;
• Gross margin expansion of as much as 50 basis points ;
• Slight selling and administrative expense leverage;
• Mid-teens earnings per share growth; and
• Low-thirties percentage rate of return on invested capital.
Over the past ten years, we have achieved strong growth in many of these metrics. During this time, revenues for NIKE, Inc. have grown 7% on an annual compounded basis,annual gross margin has ranged from 43.5% to 46.4%, diluted earnings per common share has grown steadily and our return on invested capital has been as high as 34.7%.
Our fiscal 2018 results demonstrated the power of the NIKE, Inc. portfolio to generate revenue growth, while investing in capabilities in support of our Triple Double strategy tofuel our next phase of long-term growth and profitability. We achieved record revenues for fiscal 2018, growing 6% to $36.4 billion. The NIKE Brand, which represents over90% of NIKE, Inc. Revenues , delivered 7% revenue growth. On a currency-neutral basis, NIKE Brand revenues grew 5%, driven by strong revenue growth across allinternational geographies and NIKE Direct, as well as growth in footwear, apparel and most key categories. Revenues for Converse decreased 8% and 11% on a reported andcurrency-neutral basis, respectively, primarily driven by lower revenues in North America.
Income before income taxes decreased 11% for fiscal 2018, in part reflecting the negative impact of weakening foreign currency exchange rates. Revenue growth was morethan offset by higher selling and administrative expense, gross margin contraction, and a shift to other expense, net from other income, net for fiscal 2017. NIKE, Inc. grossmargin decreased 80 basis points primarily due to foreign currency exchange rate headwinds. Selling and administrative expense was higher as a percent of revenues,reflecting investments in digital capabilities, consumer experiences and product and brand marketing to drive long-term growth under the Consumer Direct Offense.
Diluted earnings per common share reflects a 2% decline in the weighted average diluted common shares outstanding, driven by our share repurchase program.
While foreign currency markets remain volatile, we continue to see opportunities to drive future growth and profitability, and remain committed to effectively managing ourbusiness to achieve our financial goals over the long-term by executing against the operational strategies outlined above.
Use of Non-GAAP Financial MeasuresThroughout this Annual Report on Form 10-K, we discuss non-GAAP financial measures, including references to wholesale equivalent revenues and currency-neutralrevenues, which should be considered in addition to, and not in lieu of, the financial measures calculated and presented in accordance with accounting principles generallyaccepted in the United States of America (“U.S. GAAP”). References to wholesale equivalent revenues are intended to provide context as to the total size of our NIKE Brandmarket footprint if we had no NIKE Direct operations. NIKE Brand wholesale equivalent revenues consist of (1) sales to external wholesale customers and (2) internal salesfrom our wholesale operations to our NIKE Direct operations, which are charged at prices comparable to those charged to external wholesale customers. Additionally,currency-neutral revenues are calculated using actual exchange rates in use during the comparative prior year period to enhance the visibility of the underlying business trendsexcluding the impact of translation arising from foreign currency exchange rate fluctuations.
Management uses these non-GAAP financial measures when evaluating the Company ’ s performance, including when making financial and operating decisions. Additionally,management believes these non-GAAP financial measures provide investors with additional financial information that should be considered when assessing our underlyingbusiness performance and trends. However, references to wholesale equivalent revenues and currency-neutral revenues should not be considered in isolation or as asubstitute for other financial measures calculated and presented in accordance with U.S. GAAP and may not be comparable to similarly titled non-GAAP measures used byother companies.
20
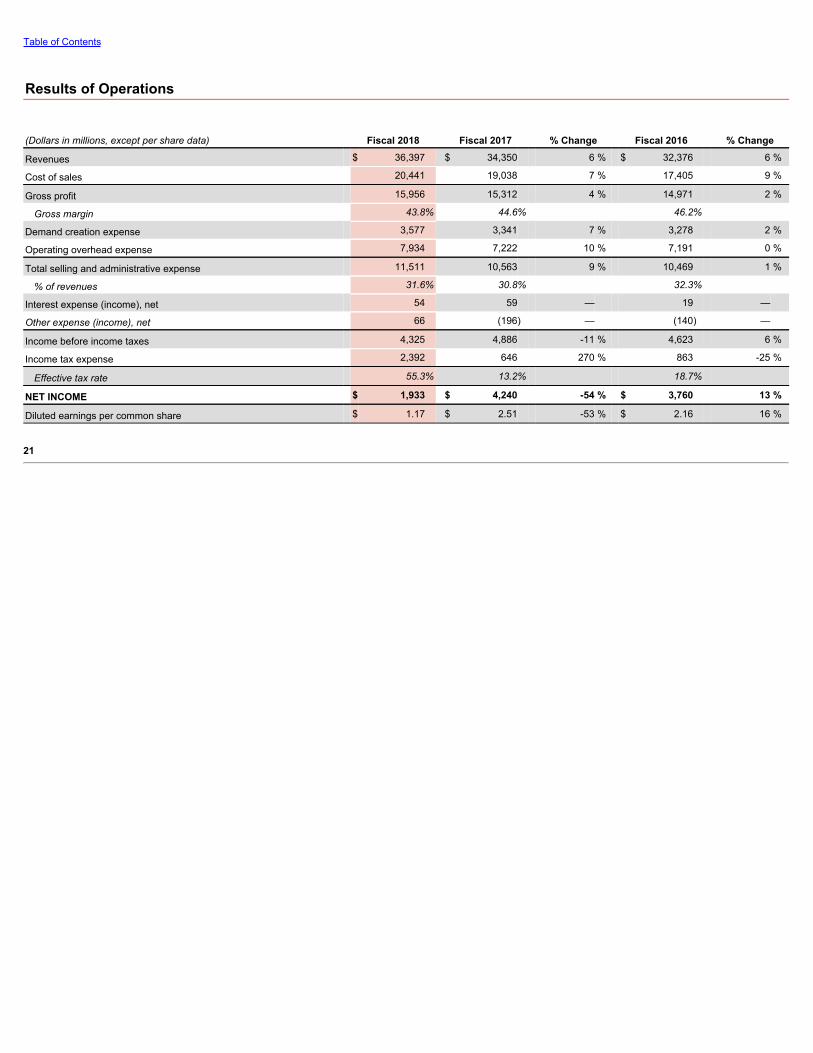
Table of Contents
Results of Operations
(Dollars in millions, except per share data) Fiscal 2018 Fiscal 2017 % Change Fiscal 2016 % Change
Revenues $ 36,397 $ 34,350 6 % $ 32,376 6 %
Cost of sales 20,441 19,038 7 % 17,405 9 %
Gross profit 15,956 15,312 4 % 14,971 2 %
Gross margin 43.8% 44.6% 46.2%
Demand creation expense 3,577 3,341 7 % 3,278 2 %
Operating overhead expense 7,934 7,222 10 % 7,191 0 %
Total selling and administrative expense 11,511 10,563 9 % 10,469 1 %
% of revenues 31.6% 30.8% 32.3%
Interest expense (income), net 54 59 — 19 —
Other expense (income), net 66 (196) — (140) —
Income before income taxes 4,325 4,886 -11 % 4,623 6 %
Income tax expense 2,392 646 270 % 863 -25 %
Effective tax rate 55.3% 13.2% 18.7%
NET INCOME $ 1,933 $ 4,240 -54 % $ 3,760 13 %
Diluted earnings per common share $ 1.17 $ 2.51 -53 % $ 2.16 16 %
21

Table of Contents
Consolidated Operating Results
Revenues
(Dollars in millions) Fiscal 2018 Fiscal 2017 (1) % Change
% ChangeExcluding Currency
Changes (2) Fiscal 2016 (1) % Change% Change ExcludingCurrency Changes (2)
NIKE, Inc. Revenues:
NIKE Brand Revenues by: Footwear $ 22,268 $ 21,081 6 % 4 % $ 19,871 6 % 8 %Apparel 10,733 9,654 11 % 9 % 9,067 6 % 9 %Equipment 1,396 1,425 -2 % -4 % 1,496 -5 % -3 %Global Brand Divisions (3) 88 73 21 % 12 % 73 0 % 2 %
Total NIKE Brand Revenues 34,485 32,233 7 % 5 % 30,507 6 % 8 %Converse 1,886 2,042 -8 % -11 % 1,955 4 % 6 %Corporate (4) 26 75 — — (86) — —
TOTAL NIKE, INC. REVENUES $ 36,397 $ 34,350 6 % 4 % $ 32,376 6 % 8 %Supplemental NIKE Brand RevenuesDetails:
NIKE Brand Revenues by: Sales to Wholesale Customers $ 23,969 $ 23,078 4 % 2 % $ 22,577 2 % 5 %Sales through NIKE Direct 10,428 9,082 15 % 12 % 7,857 16 % 18 %Global Brand Divisions (3) 88 73 21 % 12 % 73 0 % 2 %
TOTAL NIKE BRAND REVENUES $ 34,485 $ 32,233 7 % 5 % $ 30,507 6 % 8 %NIKE Brand Revenues on aWholesale Equivalent Basis: (5)
Sales to Wholesale Customers $ 23,969 $ 23,078 4 % 2 % $ 22,577 2 % 5 %Sales from our Wholesale Operationsto NIKE Direct Operations 6,332 5,616 13 % 10 % 4,672 20 % 22 %
TOTAL NIKE BRAND WHOLESALEEQUIVALENT REVENUES $ 30,301 $ 28,694 6 % 4 % $ 27,249 5 % 8 %NIKE Brand Wholesale EquivalentRevenues by: (5)
Men’s $ 17,114 $ 16,041 7 % 5 % $ 15,410 4 % 6 %Women’s 6,915 6,644 4 % 2 % 6,296 6 % 8 %Young Athletes’ 4,906 4,838 1 % -1 % 4,560 6 % 8 %Others (6) 1,366 1,171 17 % 13 % 983 19 % 21 %
TOTAL NIKE BRAND WHOLESALEEQUIVALENT REVENUES $ 30,301 $ 28,694 6 % 4 % $ 27,249 5 % 8 %NIKE Brand Wholesale EquivalentRevenues by: (5)
Running $ 5,198 $ 4,860 7 % 5 % $ 4,401 10 % 13 %NIKE Basketball 1,494 1,292 16 % 14 % 1,378 -6 % -5 %Jordan Brand 2,856 3,098 -8 % -9 % 2,753 13 % 13 %Football (Soccer) 2,146 1,984 8 % 5 % 2,143 -7 % -4 %Training 3,126 3,080 1 % 0 % 3,150 -2 % -1 %Sportswear 10,018 8,988 11 % 8 % 8,129 11 % 14 %Others (7) 5,463 5,392 1 % 0 % 5,295 2 % 3 %
TOTAL NIKE BRAND WHOLESALEEQUIVALENT REVENUES $ 30,301 $ 28,694 6 % 4 % $ 27,249 5 % 8 %
22

Table of Contents
(1) Certain prior year amounts have been reclassified to conform to fiscal 2018 presentation. These changes had no impact on previously reported consolidated results ofoperations or shareholders’ equity.
(2) The percent change has been calculated using actual exchange rates in use during the comparative prior year period to enhance the visibility of the underlying businesstrends by excluding the impact of translation arising from foreign currency exchange rate fluctuations, which is considered a non-GAAP financial measure.
(3) Global Brand Divisions revenues are primarily attributable to NIKE Brand licensing businesses that are not part of a geographic operating segment.(4) Corporate revenues primarily consist of foreign currency hedge gains and losses related to revenues generated by entities within the NIKE Brand geographic operating
segments and Converse, but managed through our central foreign exchange risk management program.(5) References to NIKE Brand wholesale equivalent revenues, which are considered non-GAAP financial measures, are intended to provide context as to the total size of our
NIKE Brand market footprint if we had no NIKE Direct operations. NIKE Brand wholesale equivalent revenues consist of (1) sales to external wholesale customers and (2)internal sales from our wholesale operations to our NIKE Direct operations, which are charged at prices comparable to those charged to external wholesale customers.
(6) Others include all unisex products, equipment and other products not allocated to Men’s, Women’s and Young Athletes’, as well as certain adjustments that are notallocated to products designated by gender or age.
(7) Others include all other categories and certain adjustments that are not allocated at the category level.
Fiscal 2018 Compared to Fiscal 2017On a currency-neutral basis, NIKE, Inc. Revenues grew 4% for fiscal 2018, driven by growth in the NIKE Brand. All international NIKE Brand geographies delivered higherrevenues for fiscal 2018 as our Consumer Direct Offense delivered innovative products, deep brand connections and compelling retail experiences to consumers throughdigital platforms and at NIKE-owned and retail partner stores, driving demand for NIKE Brand products. Revenue growth was broad-based, as Greater China, EMEA and APLAeach contributed approximately 2 percentage points of the increase in NIKE, Inc. Revenues . For fiscal 2018, lower revenues from North America and Converse each reducedNIKE, Inc. Revenues by approximately 1 percentage point.
On a currency-neutral basis, NIKE Brand footwear and apparel revenues increased 4% and 9%, respectively, for fiscal 2018, while NIKE Brand equipment revenues decreased4%. On a category basis, the increase in NIKE Brand footwear revenues was due to strong growth in Sportswear and Running, which was partially offset by lower revenues inseveral other categories, most notably the Jordan Brand. Footwear unit sales for fiscal 2018 increased 2% and higher average selling price (ASP) per pair contributedapproximately 2 percentage points of footwear revenue growth, primarily due to the favorable impact of growth in our NIKE Direct business.
The currency-neutral increase in NIKE Brand apparel revenues for fiscal 2018 was fueled by growth in nearly all key categories, most notably Sportswear, NIKE Basketball andFootball (Soccer). Unit sales of apparel increased 4% and higher ASP per unit contributed approximately 5 percentage points of apparel revenue growth, primarily due tohigher ASPs from full-price, off-price and NIKE Direct sales.
For fiscal 2018, NIKE Direct revenues represented approximately 30% of our total NIKE Brand revenues compared to 28% for fiscal 2017. On a currency-neutral basis, NIKEDirect revenues increased 12% for fiscal 2018, driven by strong digital commerce sales growth of 25%, the addition of new stores and 4% comparable store sales growth.Comparable store sales include revenues from NIKE-owned in-line and factory stores for which all three of the following requirements have been met: (1) the store has beenopen at least one year, (2) square footage has not changed by more than 15% within the past year and (3) the store has not been permanently repositioned within the pastyear. On a reported basis, digital commerce sales, which are not included in comparable store sales, were $2.8 billion for fiscal 2018 compared to $2.2 billion for fiscal 2017,and represented approximately 27% of our total NIKE Brand NIKE Direct revenues for fiscal 2018 compared to 24% for fiscal 2017.
On a wholesale equivalent and currency-neutral basis, fiscal 2018 NIKE Brand Men’s revenues increased 5%, as growth in Sportswear, Running and NIKE Basketball morethan offset lower Football (Soccer) and Jordan Brand revenues. Women’s revenues increased 2%, led by growth in Sportswear, partially offset by a decline in Training.Revenues for our Young Athletes’ business decreased 1%, as growth in Football (Soccer), was more than offset by lower revenues in the Jordan Brand.
Fiscal 2017 Compared to Fiscal 2016On a currency-neutral basis, NIKE, Inc. Revenues grew 8% for fiscal 2017, driven by higher revenues for all NIKE Brand geographies and Converse. Revenue growth wasbroad-based, as EMEA, Greater China, APLA and North America each contributed approximately 2 percentage points of the increase in NIKE, Inc. Revenues .
On a currency-neutral basis, NIKE Brand footwear and apparel revenues increased 8% and 9%, respectively, for fiscal 2017, while NIKE Brand equipment revenues decreased3%. On a category basis, the increase in NIKE Brand footwear revenues was driven by strong growth in Sportswear, Running and the Jordan Brand. Footwear unit sales forfiscal 2017 increased 7%, with higher ASP per pair contributing approximately 1 percentage point of footwear revenue growth, primarily driven by higher full-price and off-priceASPs, partially offset by the impact of higher off-price sales.
The currency-neutral increase in NIKE Brand apparel revenues for fiscal 2017 was fueled by growth in all key categories, led by Sportswear, Running and Training. Unit salesof apparel increased 6%, while higher ASP per unit contributed approximately 3 percentage points of apparel revenue growth, primarily due to higher full-price ASP and, to alesser extent, growth in our higher-priced NIKE Direct business.
For fiscal 2017, NIKE Direct revenues represented approximately 28% of our total NIKE Brand revenues compared to 26% for fiscal 2016. On a currency-neutral basis, NIKEDirect revenues increased 18% for fiscal 2017, driven by strong digital commerce sales growth of 30%, the addition of new stores and 7% comparable store sales growth. On areported basis, digital commerce sales, which are not included in comparable store sales, were $2.2 billion for fiscal 2017 compared to $1.7 billion for fiscal 2016 andrepresented approximately 24% of our total NIKE Direct revenues for fiscal 2017 compared to 22% for fiscal 2016.
On a wholesale equivalent and currency-neutral basis, fiscal 2017 NIKE Brand Men’s revenues increased 6%, driven by significant growth in Sportswear, Running and theJordan Brand, while Women ’ s revenues increased 8%, led by growth in Sportswear and Running. Revenues for our Young Athletes ’ business increased 8%, with growthacross multiple categories, most notably the Jordan Brand.
23

Table of Contents
Gross Margin
(Dollars in millions) Fiscal 2018 Fiscal 2017 % Change Fiscal 2016 % Change
Gross profit $ 15,956 $ 15,312 4% $ 14,971 2%
Gross margin 43.8% 44.6% (80) bps 46.2% (160)bps
Fiscal 2018 Compared to Fiscal 2017For fiscal 2018, our consolidated gross margin was 80 basis points lower than fiscal 2017, primarily reflecting the following factors:
• Unfavorable changes in net foreign currency exchange rates, including hedges (decreasing gross margin approximately 90 basis points);
• Lower NIKE Direct margin (decreasing gross margin approximately 10 basis points) reflecting higher mix of off-price sales in the first half of fiscal 2018, which waspartially offset by margin expansion in the second half of fiscal 2018;
• NIKE Brand full-price ASP, net of discounts, on a wholesale equivalent basis, which was flat for fiscal 2018 as higher discounts in the first half of fiscal 2018 wereoffset by higher full-price ASP in the second half of the year; and
• NIKE Brand product costs, on a wholesale equivalent basis, which were flat.
Fiscal 2017 Compared to Fiscal 2016For fiscal 2017, our consolidated gross margin was 160 basis points lower than fiscal 2016, primarily driven by the following factors:
• Higher NIKE Brand full-price ASP, net of discounts, on a wholesale equivalent basis (increasing gross margin approximately 70 basis points) aligned with our strategyto deliver innovative, premium products to the consumer;
• Higher NIKE Brand product costs (decreasing gross margin approximately 100 basis points) as an increase in the mix of higher cost products and labor input costinflation more than offset lower material input costs;
• Unfavorable changes in net foreign currency exchange rates, including hedges (decreasing gross margin approximately 90 basis points); and
• Lower NIKE Direct margins (decreasing gross margin approximately 20 basis points) reflecting the impact of higher off-price sales.
Total Selling and Administrative Expense
(Dollars in millions) Fiscal 2018 Fiscal 2017 % Change Fiscal 2016 % Change
Demand creation expense (1) $ 3,577 $ 3,341 7% $ 3,278 2%
Operating overhead expense 7,934 7,222 10% 7,191 0%
Total selling and administrative expense $ 11,511 $ 10,563 9% $ 10,469 1%
% of revenues 31.6% 30.8% 80 bps 32.3% (150)bps
(1) Demand creation expense consists of advertising and promotion costs, including costs of endorsement contracts, complimentary product, television, digital and printadvertising and media costs, brand events and retail brand presentation.
Fiscal 2018 Compared to Fiscal 2017Demand creation expense increased 7% for fiscal 2018 compared to fiscal 2017, driven by higher sports marketing costs. Changes in foreign currency exchange ratesincreased Demand creation expense by approximately 3 percentage points for fiscal 2018.
Operating overhead expense increased 10% compared to fiscal 2017, due to higher administrative costs, continued investments in our growing NIKE Direct business and one-time wage-related costs associated with the Consumer Direct Offense organizational realignment. Changes in foreign currency exchange rates increased Operating overheadexpense by approximately 2 percentage points for fiscal 2018.
Fiscal 2017 Compared to Fiscal 2016Demand creation expense increased 2% for fiscal 2017 compared to fiscal 2016, driven by higher sports marketing costs, as well as higher marketing and advertising costs,primarily to support key sporting events including the Rio Olympics and European Football Championship. These increases were partially offset by lower retail brandpresentation costs. Changes in foreign currency exchange rates reduced Demand creation expense by approximately 1 percentage point.
Operating overhead expense was flat compared to fiscal 2016 as continued investments in our growing NIKE Direct business were offset by administrative cost efficiencies andlower variable compensation. Changes in foreign currency exchange rates reduced Operating overhead expense by approximately 1 percentage point for fiscal 2017.
Other Expense (Income), Net
(In millions) Fiscal 2018 Fiscal 2017 Fiscal 2016
Other expense (income), net $ 66 $ (196) $ (140)
Other expense (income), net comprises foreign currency conversion gains and losses from the re-measurement of monetary assets and liabilities denominated in non-functional currencies, and the impact of certain foreign currency derivative instruments, as well as unusual or non-operating transactions outside the normal course of business.
24

Table of Contents
Fiscal 2018 Compared to Fiscal 2017Other expense (income), net changed from $196 million of other income, net for fiscal 2017 to $66 million of other expense, net for fiscal 2018, primarily due to a $287 millionnet detrimental change in foreign currency conversion gains and losses, including hedges.
We estimate the combination of the translation of foreign currency-denominated profits from our international businesses and the year-over-year change in foreign currency-related gains and losses included in Other expense (income), net had an unfavorable impact on our Income before income taxes of $110 million for fiscal 2018.
Fiscal 2017 Compared to Fiscal 2016Other expense (income), net increased from $140 million of other income, net for fiscal 2016 to $196 million of other income, net for fiscal 2017, primarily due to a $56 millionnet beneficial change in foreign currency conversion gains and losses.
We estimate the combination of the translation of foreign currency-denominated profits from our international businesses and the year-over-year change in foreign currency-related gains and losses included in Other expense (income), net had an unfavorable impact on our Income before income taxes of $59 million for fiscal 2017.
Income Taxes
Fiscal 2018 Fiscal 2017 % Change Fiscal 2016 % ChangeEffective tax rate
55.3%
13.2%
4,210 bps
18.7%
(550)
bps
Fiscal 2018 Compared to Fiscal 2017Our effective tax rate was 55.3% for fiscal 2018, reflecting the impact of the Tax Cuts and Jobs Act (the “Tax Act”). The impact of the Tax Act primarily reflects provisionalexpense of $1,875 million for the one-time transition tax on the deemed repatriation of undistributed foreign earnings and $158 million resulting from the remeasurement ofdeferred tax assets and liabilities. The remaining provisions of the Tax Act, which were a net benefit to the effective tax rate, did not have a material impact on our ConsolidatedFinancial Statements during fiscal 2018. The increase in the effective tax rate resulting from the Tax Act was partially offset by the tax benefit from stock-based compensationin the current period as a result of the adoption of Accounting Standards Update (ASU) 2016-09 in the first quarter of fiscal 2018.
Refer to Note 1 — Summary of Significant Accounting Policies in the accompanying Notes to the Consolidated Financial Statements for additional information on the impact ofASU 2016-09, and Note 9 — Income Taxes for additional information on the impact of the Tax Act.
Fiscal 2017 Compared to Fiscal 2016The 550 basis point decrease in our effective tax rate for the fiscal year was primarily due to a one-time benefit in the first quarter of the fiscal year related to the resolution withthe IRS of a foreign tax credit matter and a decrease in foreign earnings taxed in the United States.
Operating SegmentsOur operating segments are evidence of the structure of the Company’s internal organization. The NIKE Brand segments are defined by geographic regions for operationsparticipating in NIKE Brand sales activity.
Each NIKE Brand geographic segment operates predominantly in one industry: the design, development, marketing and selling of athletic footwear, apparel and equipment.The Company’s reportable operating segments for the NIKE Brand are: North America; Europe, Middle East & Africa; Greater China; and Asia Pacific & Latin America, andinclude results for the NIKE, Jordan and Hurley brands.
The Company’s NIKE Direct operations are managed within each geographic operating segment. Converse is also a reportable segment for the Company and operates in oneindustry: the design, marketing, licensing and selling of casual sneakers, apparel and accessories.
As part of our centrally managed foreign exchange risk management program, standard foreign currency rates are assigned twice per year to each NIKE Brand entity in ourgeographic operating segments and Converse. These rates are set approximately nine and twelve months in advance of the future selling seasons to which they relate(specifically, for each currency, one standard rate applies to the fall and holiday selling seasons and one standard rate applies to the spring and summer selling seasons)based on average market spot rates in the calendar month preceding the date they are established. Inventories and Cost of sales for geographic operating segments andConverse reflect the use of these standard rates to record non-functional currency product purchases into the entity’s functional currency. Differences between assignedstandard foreign currency rates and actual market rates are included in Corporate, together with foreign currency hedge gains and losses generated from our centrallymanaged foreign exchange risk management program and other conversion gains and losses.
25

Table of Contents
The breakdown of revenues is as follows:
(Dollars in millions) Fiscal 2018 Fiscal 2017 (1) % Change
% ChangeExcludingCurrency
Changes (2) Fiscal 2016 (1) % Change
% ChangeExcludingCurrency
Changes (2)
North America $ 14,855 $ 15,216 -2 % -2 % $ 14,764 3% 3%
Europe, Middle East & Africa 9,242 7,970 16 % 9 % 7,568 5% 10%
Greater China 5,134 4,237 21 % 18 % 3,785 12% 17%
Asia Pacific & Latin America 5,166 4,737 9 % 10 % 4,317 10% 13%
Global Brand Divisions (3) 88 73 21 % 12 % 73 0% 2%
TOTAL NIKE BRAND 34,485 32,233 7 % 5 % 30,507 6% 8%
Converse 1,886 2,042 -8 % -11 % 1,955 4% 6%
Corporate (4) 26 75 — — (86) — —
TOTAL NIKE, INC. REVENUES $ 36,397 $ 34,350 6 % 4 % $ 32,376 6% 8%(1) Certain prior year amounts have been reclassified to conform to fiscal 2018 presentation. This includes reclassified operating segment data to reflect the changes in the
Company ’ s operating structure, which became effective June 1, 2017. These changes had no impact on previously reported consolidated results of operations orshareholders’ equity.
(2) The percent change has been calculated using actual exchange rates in use during the comparative prior year period to enhance the visibility of the underlying businesstrends excluding the impact of translation arising from foreign currency exchange rate fluctuations, which is considered a non-GAAP financial measure.
(3) Global Brand Divisions revenues are primarily attributable to NIKE Brand licensing businesses that are not part of a geographic operating segment.(4) Corporate revenues primarily consist of foreign currency hedge gains and losses related to revenues generated by entities within the NIKE Brand geographic operating
segments and Converse, but managed through our central foreign exchange risk management program.
The primary financial measure used by the Company to evaluate performance of individual operating segments is earnings before interest and taxes (commonly referred to as“EBIT”), which represents Net income before Interest expense (income), net and Income tax expense in the Consolidated Statements of Income. As discussed in Note 17 —Operating Segments and Related Information in the accompanying Notes to the Consolidated Financial Statements, certain corporate costs are not included in EBIT of ouroperating segments.
The breakdown of earnings before interest and taxes is as follows:
(Dollars in millions) Fiscal 2018 Fiscal 2017 (1) % Change Fiscal 2016 (1) % Change
North America $ 3,600 $ 3,875 -7 % $ 3,763 3 %
Europe, Middle East & Africa 1,587 1,507 5 % 1,787 -16 %
Greater China 1,807 1,507 20 % 1,372 10 %
Asia Pacific & Latin America 1,189 980 21 % 1,002 -2 %
Global Brand Divisions (2,658) (2,677) 1 % (2,596) -3 %
TOTAL NIKE BRAND 5,525 5,192 6 % 5,328 -3 %
Converse 310 477 -35 % 487 -2 %
Corporate (1,456) (724) -101 % (1,173) 38 %TOTAL NIKE, INC. EARNINGS BEFORE INTEREST ANDTAXES 4,379 4,945 -11 % 4,642 7 %
Interest expense (income), net 54 59 — 19 —
TOTAL NIKE, INC. INCOME BEFORE INCOME TAXES $ 4,325 $ 4,886 -11 % $ 4,623 6 %(1) Certain prior year amounts have been reclassified to conform to fiscal 2018 presentation. This includes reclassified operating segment data to reflect the changes in the
Company ’ s operating structure, which became effective June 1, 2017. These changes had no impact on previously reported consolidated results of operations orshareholders’ equity.
26

Table of Contents
North America
(Dollars in millions) Fiscal 2018 Fiscal 2017 % Change
% ChangeExcludingCurrencyChanges Fiscal 2016 % Change
% ChangeExcludingCurrencyChanges
Revenues by:
Footwear $ 9,322 $ 9,684 -4 % -4 % $ 9,299 4 % 4 %
Apparel 4,938 4,886 1 % 1 % 4,746 3 % 3 %
Equipment 595 646 -8 % -8 % 719 -10 % -10 %
TOTAL REVENUES $ 14,855 $ 15,216 -2 % -2 % $ 14,764 3 % 3 %
Revenues by:
Sales to Wholesale Customers $ 10,159 $ 10,756 -6 % -6 % $ 10,674 1 % 1 %
Sales through NIKE Direct 4,696 4,460 5 % 5 % 4,090 9 % 9 %
TOTAL REVENUES $ 14,855 $ 15,216 -2 % -2 % $ 14,764 3 % 3 %EARNINGS BEFORE INTEREST AND TAXES $ 3,600 $ 3,875 -7 % $ 3,763 3 %
In the current marketplace environment, we believe there has been a meaningful shift in the way consumers shop for product and make purchasing decisions. Consumers aredemanding a constant flow of fresh and innovative product, and have an expectation for superior service and real-time delivery, all fueled by the shift toward digital.Specifically, in North America we anticipate continued evolution within the retail landscape, driven by shifting consumer traffic patterns across digital and physical channels.The evolution of the North America marketplace has resulted in third-party retail store closures; however, we are currently seeing stabilization and momentum building in ourbusiness, fueled by innovative product and NIKE Brand consumer experiences, leveraging digital.
Fiscal 2018 Compared to Fiscal 2017North America revenues decreased 2%, as growth in our Sportswear and NIKE Basketball categories was more than offset by declines in all other categories, most notably theJordan Brand and Running. NIKE Direct revenues increased 5% for fiscal 2018 due to digital commerce sales growth and the addition of new stores.
Footwear revenues declined 4% for fiscal 2018, as lower revenues in nearly all categories, most notably the Jordan Brand, more than offset higher revenues in Sportswear.Unit sales of footwear decreased 5%, while ASP per pair contributed approximately 1 percentage point of footwear growth, driven by the favorable impact of growth in our NIKEDirect business.
Apparel revenue growth of 1% for fiscal 2018 was attributable to higher revenues in our Sportswear and NIKE Basketball categories, which was only partially offset by declinesin nearly all other categories. Unit sales of apparel decreased 4%, while higher ASP per unit contributed approximately 5 percentage points of apparel revenue growth,primarily due to the favorable impact of growth in our NIKE Direct business and, to a lesser extent, higher full-price ASP and favorable changes in off-price sales.
EBIT declined 7% for fiscal 2018, primarily reflecting lower revenues and higher selling and administrative expense. Gross margin declined 10 basis points as lower full-priceASP more than offset the favorable impact of growth in our NIKE Direct business. Selling and administrative expense grew due to higher operating overhead expense resultingfrom continued investments in our growing NIKE Direct business. Demand creation expense also increased, as higher sports marketing costs were only partially offset by lowerretail brand presentation costs.
Fiscal 2017 Compared to Fiscal 2016North America revenues increased 3%, driven by growth in our Sportswear and Jordan Brand categories, partially offset by declines in other categories, including NIKEBasketball. NIKE Direct revenues increased 9% for fiscal 2017 due to digital commerce sales growth, the addition of new stores and comparable store sales growth of 3%.
Footwear revenue growth for fiscal 2017 was attributable to higher revenues in our Sportswear and Jordan Brand categories, partially offset by declines in other categories.Unit sales of footwear increased 4%, while ASP per pair was flat as higher off-price ASP was offset by unfavorable off-price mix.
The increase in apparel revenues for fiscal 2017 was due to growth concentrated in Sportswear, partially offset by declines in other categories. Unit sales of apparel grew 2%and higher ASP per unit contributed approximately 1 percentage point of apparel revenue growth, primarily due to higher full-price ASP.
EBIT grew 3% for fiscal 2017 as revenue growth and gross margin expansion were partially offset by higher selling and administrative expense as a percent of revenues.Gross margin increased 10 basis points as higher full-price ASP and favorable off-price margin more than offset higher product costs and increased off-price mix as a result ofclearing excess inventories through off-price channels, including through our NIKE Direct business. Selling and administrative expense grew due to higher operating overheadas continued investments in our growing NIKE Direct business were partially offset by lower bad debt expense. Demand creation was flat as higher sports marketing and retailbrand presentation costs offset lower marketing and advertising costs.
27

Table of Contents
Europe, Middle East & Africa
(Dollars in millions) Fiscal 2018 Fiscal 2017 % Change
% ChangeExcludingCurrencyChanges Fiscal 2016 % Change
% ChangeExcludingCurrencyChanges
Revenues by:
Footwear $ 5,875 $ 5,192 13% 6% $ 5,043 3 % 8%
Apparel 2,940 2,395 23% 16% 2,149 11 % 17%
Equipment 427 383 11% 6% 376 2 % 7%
TOTAL REVENUES $ 9,242 $ 7,970 16% 9% $ 7,568 5 % 10%
Revenues by:
Sales to Wholesale Customers $ 6,765 $ 5,917 14% 8% $ 5,869 1 % 5%
Sales through NIKE Direct 2,477 2,053 21% 13% 1,699 21 % 27%
TOTAL REVENUES $ 9,242 $ 7,970 16% 9% $ 7,568 5 % 10%EARNINGS BEFORE INTERESTAND TAXES $ 1,587 $ 1,507 5% $ 1,787 -16 %
Fiscal 2018 Compared to Fiscal 2017On a currency-neutral basis, EMEA revenues for fiscal 2018 increased 9%, driven by higher revenues in every territory, most notably our UK & Ireland territory, which grew21%. Revenues increased in nearly all key categories, led by Sportswear and Football (Soccer). NIKE Direct revenues grew 13% for fiscal 2018 due to strong digital commercesales growth, comparable store sales growth of 6% and the addition of new stores.
The 6% increase in currency-neutral footwear revenues for fiscal 2018 was due to growth in most key categories, led by Sportswear. For fiscal 2018, unit sales of footwearincreased 6% while ASP per pair was flat, as higher off-price ASP was offset by lower full-price ASP.
Currency-neutral apparel revenues grew 16% for fiscal 2018, driven by higher revenues in all key categories, most notably Sportswear and Football (Soccer). Unit sales ofapparel increased 12% and higher ASP per unit contributed approximately 4 percentage points of apparel revenue growth. The increase in ASP per unit was primarilyattributable to higher full-price ASP.
Reported EBIT increased 5% for fiscal 2018 due to revenue growth and slight selling and administrative expense leverage, which was partially offset by gross margincontraction. Gross margin declined 180 basis points as lower product costs were more than offset by unfavorable standard foreign currency exchange rates, lower full-priceASP due to product mix, and lower NIKE Direct margin. Selling and administrative expense increased due to higher demand creation expense driven by sports marketing andadvertising costs. Operating overhead also increased primarily due to continued investments in our growing NIKE Direct business and, to a lesser extent, higher administrativecosts.
Fiscal 2017 Compared to Fiscal 2016On a currency-neutral basis, EMEA revenues for fiscal 2017 increased 10%. Revenue growth was broad-based across all territories, led by the UK & Ireland, which grew 11%.On a category basis, revenues increased for nearly all key categories, led by Sportswear and, to a lesser extent, Running and the Jordan Brand. NIKE Direct revenues grew27% for fiscal 2017 due to comparable store sales growth of 15%, strong digital commerce sales growth and the addition of new stores.
The currency-neutral increase in footwear revenues was led by Sportswear, Running and the Jordan Brand, partially offset by declines in Football (Soccer) and Training. Forfiscal 2017, unit sales of footwear increased 5% and higher ASP per pair contributed approximately 3 percentage points of footwear revenue growth. Higher ASP per pair wasprimarily due to the favorable impact of growth in our NIKE Direct business.
Currency-neutral apparel revenue growth was driven by higher revenues in all key categories, most notably Sportswear and, to a lesser extent, Training and Football (Soccer).Unit sales of apparel for fiscal 2017 increased 12%, while higher ASP per unit contributed approximately 5 percentage points of apparel revenue growth. The increase in ASPper unit was primarily attributable to the favorable impact of growth in our NIKE Direct business and higher full-price ASP.
Reported EBIT decreased 16% for fiscal 2017, in part reflecting the negative impact of weakening foreign currency exchange rates. Higher revenues and selling andadministrative expense leverage were more than offset by significant gross margin contraction. Gross margin declined 530 basis points primarily driven by the effects ofsignificant unfavorable standard foreign currency exchange rates. Selling and administrative expense increased due to higher demand creation expense, as increased sportsmarketing and advertising expenses more than offset lower marketing costs. Operating overhead also increased due to continued investments in our growing NIKE Directbusiness, partially offset by administrative cost efficiencies and lower variable compensation costs.
28

Table of Contents
Greater China
(Dollars in millions) Fiscal 2018 Fiscal 2017 % Change
% ChangeExcludingCurrencyChanges Fiscal 2016 % Change
% ChangeExcludingCurrencyChanges
Revenues by:
Footwear $ 3,496 $ 2,920 20% 16 % $ 2,599 12 % 18%
Apparel 1,508 1,188 27% 23 % 1,055 13 % 18%
Equipment 130 129 1% -1 % 131 -2 % 3%
TOTAL REVENUES $ 5,134 $ 4,237 21% 18 % $ 3,785 12 % 17%
Revenues by:
Sales to Wholesale Customers $ 3,216 $ 2,774 16% 13 % $ 2,623 6 % 11%
Sales through NIKE Direct 1,918 1,463 31% 27 % 1,162 26 % 32%
TOTAL REVENUES $ 5,134 $ 4,237 21% 18 % $ 3,785 12 % 17%EARNINGS BEFORE INTERESTAND TAXES $ 1,807 $ 1,507 20% $ 1,372 10 %
Fiscal 2018 Compared to Fiscal 2017On a currency-neutral basis, Greater China revenues for fiscal 2018 increased 18%, driven by higher revenues in all key categories, led by Running, Sportswear and theJordan Brand. NIKE Direct revenues increased 27%, driven by strong digital commerce sales growth, the addition of new stores and comparable store sales growth of 10%.
Currency-neutral footwear revenues increased 16% for fiscal 2018, driven by growth in nearly all key categories, most notably Running and the Jordan Brand. Unit sales offootwear increased 19%, while lower ASP per pair reduced footwear revenue growth by approximately 3 percentage points, driven by lower full-price ASP resulting fromproduct mix, as well as unfavorable off-price mix.
The currency-neutral apparel revenue growth of 23% for fiscal 2018 was fueled by higher revenues in all key categories, most notably Sportswear and, to a lesser extent, NIKEBasketball, the Jordan Brand and Running. Unit sales of apparel increased 20% and higher ASP per unit increased apparel revenue growth by approximately 3 percentagepoints. The increase in ASP per unit was attributable to higher full-price, off-price and NIKE Direct ASPs.
Reported EBIT increased 20% for fiscal 2018, driven by higher revenues and selling and administrative expense leverage, partially offset by lower gross margin. Gross margincontracted 210 basis points primarily due to unfavorable standard foreign currency exchange rates and lower off-price margin, including through our NIKE Direct business.Selling and administrative expense increased due to growth in operating overhead expense, primarily reflecting ongoing investments in our NIKE Direct business. Demandcreation expense also grew, primarily driven by higher retail brand presentation costs.
Fiscal 2017 Compared to Fiscal 2016On a currency-neutral basis, Greater China revenues for fiscal 2017 increased 17%, driven by higher revenues in nearly all key categories, led by Running, Sportswear and theJordan Brand. NIKE Direct revenues increased 32%, driven by strong digital commerce sales growth, the addition of new stores and comparable store sales growth of 9%.
The currency-neutral increase in footwear revenue for fiscal 2017 was driven by growth in nearly all key categories, most notably Running, Sportswear and the Jordan Brand.Unit sales of footwear increased 21%, while lower ASP per pair reduced footwear revenue growth by approximately 3 percentage points as higher off-price ASP was more thanoffset by lower NIKE Direct ASP and unfavorable off-price mix.
The currency-neutral apparel revenue growth for fiscal 2017 was due to higher revenues in nearly all key categories, led by Sportswear and Running. Unit sales of apparelincreased 15% and higher ASP per unit increased apparel revenue growth by approximately 3 percentage points. The increase in ASP per unit was attributable to higher full-price ASP, partially offset by lower ASP in our NIKE Direct business and unfavorable off-price mix.
Despite the negative impact of translation, reported EBIT increased 10% for fiscal 2017 driven by higher revenues and selling and administrative expense leverage, partiallyoffset by lower gross margin. Gross margin contracted 240 basis points primarily due to unfavorable standard foreign currency exchange rates and higher product costs.Selling and administrative expense increased due to higher operating overhead to support NIKE Direct growth. Demand creation expense also increased as higher marketingcosts more than offset lower retail brand presentation and sports marketing expenses.
29

Table of Contents
Asia Pacific & Latin America
(Dollars in millions) Fiscal 2018 Fiscal 2017 % Change
% ChangeExcludingCurrencyChanges Fiscal 2016 % Change
% ChangeExcludingCurrencyChanges
Revenues by:
Footwear $ 3,575 $ 3,285 9 % 9 % $ 2,930 12 % 16 %
Apparel 1,347 1,185 14 % 15 % 1,117 6 % 9 %
Equipment 244 267 -9 % -8 % 270 -1 % -1 %
TOTAL REVENUES $ 5,166 $ 4,737 9 % 10 % $ 4,317 10 % 13 %
Revenues by:
Sales to Wholesale Customers $ 3,829 $ 3,631 5 % 6 % $ 3,411 6 % 10 %
Sales through NIKE Direct 1,337 1,106 21 % 21 % 906 22 % 21 %
TOTAL REVENUES $ 5,166 $ 4,737 9 % 10 % $ 4,317 10 % 13 %EARNINGS BEFORE INTERESTAND TAXES $ 1,189 $ 980 21 % $ 1,002 -2 %
Fiscal 2018 Compared to Fiscal 2017On a currency-neutral basis, APLA revenues increased 10%, driven by higher revenues in every territory. Territory revenue growth was broad-based, led by SOCO (whichcomprises Argentina, Uruguay and Chile), which grew 19%. Revenues increased in all key categories, led by Sportswear and Running. NIKE Direct revenues increased 21%,fueled by comparable store sales growth of 11%, strong digital commerce sales growth and the addition of new stores.
The 9% increase in currency-neutral footwear revenues for fiscal 2018 was attributable to growth in every key category, led by Sportswear and Running. Unit sales of footwearincreased 5% and higher ASP per pair contributed approximately 4 percentage points of footwear revenue growth, driven by higher full-price, off-price and NIKE Direct ASPs.
Currency-neutral apparel revenues grew 15% for fiscal 2018, driven by higher revenues in every key category, most notably Sportswear and, to a lesser extent, Football(Soccer), Training and NIKE Basketball. Unit sales of apparel increased 11% and higher ASP per unit contributed approximately 4 percentage points of apparel revenuegrowth. The increase in ASP per unit was primarily driven by higher full-price ASP and, to a lesser extent, favorable off-price mix and higher off-price ASP.
Reported EBIT increased 21% due to revenue growth, strong selling and administrative expense leverage and gross margin expansion. Gross margin increased 90 basispoints as higher full-price ASP and favorable standard foreign currency exchange rates more than offset higher product costs. Selling and administrative expense increased ashigher operating overhead costs resulting from continued investments in our growing NIKE Direct business more than offset lower demand creation expense. The decrease indemand creation expense was primarily attributable to lower marketing costs as a result of prior year investments to support the Rio Olympics.
Fiscal 2017 Compared to Fiscal 2016On a currency-neutral basis, APLA revenues for fiscal 2017 increased 13%. Revenue growth was broad-based across all territories, led by SOCO, Korea and Mexico, whichgrew 34%, 14% and 18%, respectively. Additionally, revenues increased in all key categories, led by Running and Sportswear. NIKE Direct revenues increased 21%, fueled bythe addition of new stores, comparable store sales growth of 11% and higher digital commerce sales.
The increase in currency-neutral footwear revenue for fiscal 2017 was attributable to growth in all key categories, most notably Running and Sportswear. Unit sales of footwearincreased 9%. Higher ASP per pair contributed approximately 7 percentage points of footwear revenue growth, primarily attributable to higher full-price ASP, in part reflectinginflationary conditions in certain territories.
Currency-neutral growth in apparel revenue was fueled by increases in all key categories, led by Sportswear and Running. For fiscal 2017, unit sales of apparel increased 3%and higher ASP per unit contributed approximately 6 percentage points of apparel revenue growth. The increase in ASP per unit was primarily driven by higher full-price ASP,in part reflecting inflationary conditions in certain territories.
Reported EBIT decreased 2%, in part reflecting the negative impact of changes in foreign currency exchange rates, primarily the Argentine Peso and Mexican Peso. Reportedrevenue growth and selling and administrative expense leverage were more than offset by lower gross margin. Gross margin decreased 370 basis points as higher full-priceASP was more than offset by unfavorable standard foreign currency exchange rates and higher product costs. Selling and administrative expense increased due to higheroperating overhead costs primarily resulting from ongoing investments in our growing NIKE Direct business, partially offset by administrative cost efficiencies. Demand creationexpense also increased as lower advertising costs were more than offset by increased marketing support for the Rio Olympics in the first quarter, as well as higher sportsmarketing costs.
30
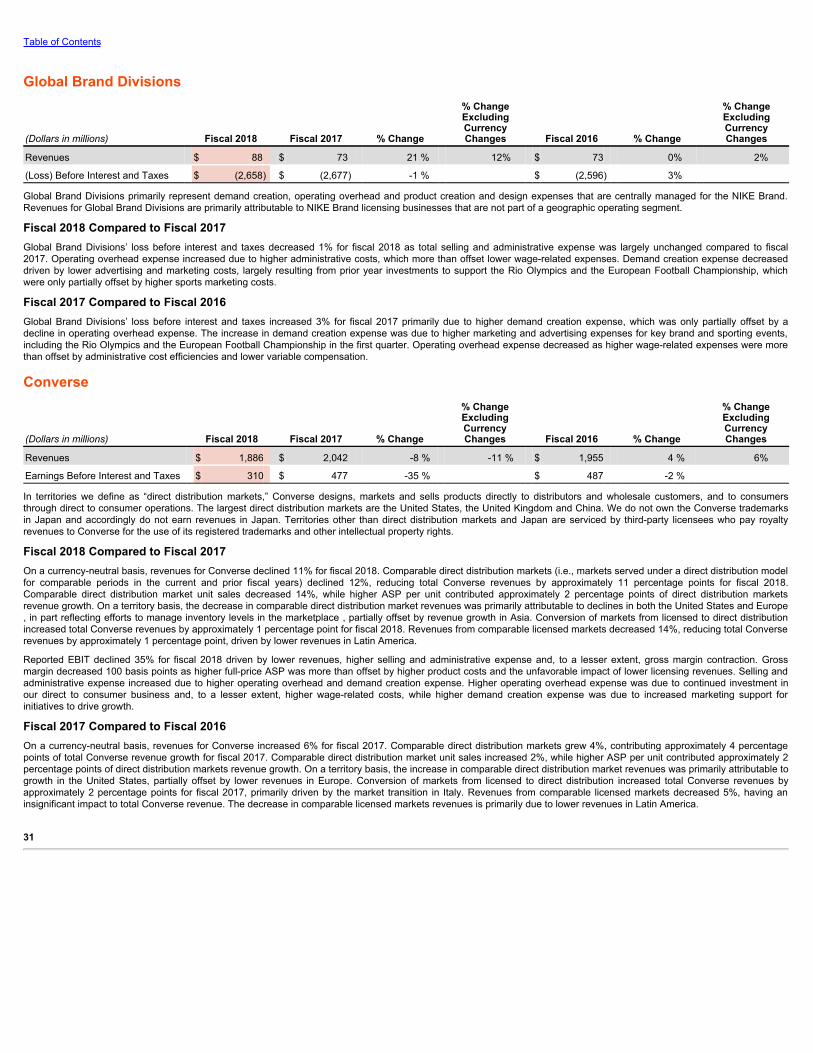
Table of Contents
Global Brand Divisions
(Dollars in millions) Fiscal 2018 Fiscal 2017 % Change
% ChangeExcludingCurrencyChanges Fiscal 2016 % Change
% ChangeExcludingCurrencyChanges
Revenues $ 88 $ 73 21 % 12% $ 73 0% 2%
(Loss) Before Interest and Taxes $ (2,658) $ (2,677) -1 % $ (2,596) 3%
Global Brand Divisions primarily represent demand creation, operating overhead and product creation and design expenses that are centrally managed for the NIKE Brand.Revenues for Global Brand Divisions are primarily attributable to NIKE Brand licensing businesses that are not part of a geographic operating segment.
Fiscal 2018 Compared to Fiscal 2017Global Brand Divisions’ loss before interest and taxes decreased 1% for fiscal 2018 as total selling and administrative expense was largely unchanged compared to fiscal2017. Operating overhead expense increased due to higher administrative costs, which more than offset lower wage-related expenses. Demand creation expense decreaseddriven by lower advertising and marketing costs, largely resulting from prior year investments to support the Rio Olympics and the European Football Championship, whichwere only partially offset by higher sports marketing costs.
Fiscal 2017 Compared to Fiscal 2016Global Brand Divisions’ loss before interest and taxes increased 3% for fiscal 2017 primarily due to higher demand creation expense, which was only partially offset by adecline in operating overhead expense. The increase in demand creation expense was due to higher marketing and advertising expenses for key brand and sporting events,including the Rio Olympics and the European Football Championship in the first quarter. Operating overhead expense decreased as higher wage-related expenses were morethan offset by administrative cost efficiencies and lower variable compensation.
Converse
(Dollars in millions) Fiscal 2018 Fiscal 2017 % Change
% ChangeExcludingCurrencyChanges Fiscal 2016 % Change
% ChangeExcludingCurrencyChanges
Revenues $ 1,886 $ 2,042 -8 % -11 % $ 1,955 4 % 6%
Earnings Before Interest and Taxes $ 310 $ 477 -35 % $ 487 -2 %
In territories we define as “direct distribution markets,” Converse designs, markets and sells products directly to distributors and wholesale customers, and to consumersthrough direct to consumer operations. The largest direct distribution markets are the United States, the United Kingdom and China. We do not own the Converse trademarksin Japan and accordingly do not earn revenues in Japan. Territories other than direct distribution markets and Japan are serviced by third-party licensees who pay royaltyrevenues to Converse for the use of its registered trademarks and other intellectual property rights.
Fiscal 2018 Compared to Fiscal 2017On a currency-neutral basis, revenues for Converse declined 11% for fiscal 2018. Comparable direct distribution markets (i.e., markets served under a direct distribution modelfor comparable periods in the current and prior fiscal years) declined 12%, reducing total Converse revenues by approximately 11 percentage points for fiscal 2018.Comparable direct distribution market unit sales decreased 14%, while higher ASP per unit contributed approximately 2 percentage points of direct distribution marketsrevenue growth. On a territory basis, the decrease in comparable direct distribution market revenues was primarily attributable to declines in both the United States and Europe, in part reflecting efforts to manage inventory levels in the marketplace , partially offset by revenue growth in Asia. Conversion of markets from licensed to direct distributionincreased total Converse revenues by approximately 1 percentage point for fiscal 2018. Revenues from comparable licensed markets decreased 14%, reducing total Converserevenues by approximately 1 percentage point, driven by lower revenues in Latin America.
Reported EBIT declined 35% for fiscal 2018 driven by lower revenues, higher selling and administrative expense and, to a lesser extent, gross margin contraction. Grossmargin decreased 100 basis points as higher full-price ASP was more than offset by higher product costs and the unfavorable impact of lower licensing revenues. Selling andadministrative expense increased due to higher operating overhead and demand creation expense. Higher operating overhead expense was due to continued investment inour direct to consumer business and, to a lesser extent, higher wage-related costs, while higher demand creation expense was due to increased marketing support forinitiatives to drive growth.
Fiscal 2017 Compared to Fiscal 2016On a currency-neutral basis, revenues for Converse increased 6% for fiscal 2017. Comparable direct distribution markets grew 4%, contributing approximately 4 percentagepoints of total Converse revenue growth for fiscal 2017. Comparable direct distribution market unit sales increased 2%, while higher ASP per unit contributed approximately 2percentage points of direct distribution markets revenue growth. On a territory basis, the increase in comparable direct distribution market revenues was primarily attributable togrowth in the United States, partially offset by lower revenues in Europe. Conversion of markets from licensed to direct distribution increased total Converse revenues byapproximately 2 percentage points for fiscal 2017, primarily driven by the market transition in Italy. Revenues from comparable licensed markets decreased 5%, having aninsignificant impact to total Converse revenue. The decrease in comparable licensed markets revenues is primarily due to lower revenues in Latin America.
31

Table of Contents
Reported EBIT declined 2% for fiscal 2017 as revenue growth and lower selling and administrative expense were more than offset by gross margin contraction. Gross margindecreased 300 basis points as higher full-price ASP was more than offset by unfavorable standard foreign currency exchange rates and higher product costs, primarily due to ashift in mix to lower margin products. Gross margin also contracted due to the unfavorable impact of lower licensing revenues, primarily due to market transitions. Selling andadministrative expense decreased due to lower demand creation expense, primarily as a result of lower retail brand presentation costs, partially offset by higher advertisingexpense. Operating overhead increased as higher wage-related expenses were only partially offset by lower administrative costs.
Corporate
(Dollars in millions) Fiscal 2018 Fiscal 2017 % Change Fiscal 2016 % Change
Revenues $ 26 $ 75 — $ (86) —
(Loss) Before Interest and Taxes $ (1,456) $ (724) 101% $ (1,173) -38 %
Corporate revenues primarily consist of foreign currency hedge gains and losses related to revenues generated by entities within the NIKE Brand geographic operatingsegments and Converse, but managed through our central foreign exchange risk management program.
The Corporate loss before interest and taxes largely consists of unallocated general and administrative expenses, including expenses associated with centrally manageddepartments; depreciation and amortization related to our corporate headquarters; unallocated insurance, benefit and compensation programs, including stock-basedcompensation; and certain foreign currency gains and losses.
In addition to the foreign currency gains and losses recognized in Corporate revenues, foreign currency results in Corporate include gains and losses resulting from thedifference between actual foreign currency rates and standard rates used to record non-functional currency denominated product purchases within the NIKE Brand geographicoperating segments and Converse; related foreign currency hedge results; conversion gains and losses arising from re-measurement of monetary assets and liabilities in non-functional currencies; and certain other foreign currency derivative instruments.
Fiscal 2018 Compared to Fiscal 2017For fiscal 2018, Corporate’s loss before interest and taxes increased $732 million primarily due to the following:
• a detrimental change in net foreign currency gains and losses of $281 million related to the re-measurement of monetary assets and liabilities denominated in non-functional currencies and the impact of certain foreign currency derivative instruments, reported as a component of consolidated Other expense (income), net ;
• an unfavorable change of $255 million, primarily due to higher operating overhead expense driven by higher wage-related costs, in part reflecting one-time costsassociated with our organizational realignment in the first half of fiscal 2018, as well as higher administrative costs; and
• a detrimental change of $196 million related to the difference between actual foreign currency exchange rates and standard foreign currency exchange ratesassigned to the NIKE Brand geographic operating segments and Converse, net of hedge gains and losses; these results are reported as a component ofconsolidated gross margin.
Fiscal 2017 Compared to Fiscal 2016For fiscal 2017, Corporate’s loss before interest and taxes decreased $449 million primarily due to the following:
• a beneficial change of $280 million related to the difference between actual foreign currency exchange rates and standard foreign currency exchange rates assignedto the NIKE Brand geographic operating segments and Converse, net of hedge gains and losses; these results are reported as a component of consolidated grossmargin;
• a beneficial change of $115 million, primarily driven by lower variable compensation and administrative costs in operating overhead expense; and
• an increase in net foreign currency gains of $54 million related to the re-measurement of monetary assets and liabilities denominated in non-functional currencies andthe impact of certain foreign currency derivative instruments, reported as a component of consolidated Other expense (income), net.
Foreign Currency Exposures and Hedging Practices
OverviewAs a global company with significant operations outside the United States, in the normal course of business we are exposed to risk arising from changes in currency exchangerates. Our primary foreign currency exposures arise from the recording of transactions denominated in non-functional currencies and the translation of foreign currencydenominated results of operations, financial position and cash flows into U.S. Dollars.
Our foreign exchange risk management program is intended to lessen both the positive and negative effects of currency fluctuations on our consolidated results of operations,financial position and cash flows. We manage global foreign exchange risk centrally on a portfolio basis to address those risks material to NIKE, Inc. We manage theseexposures by taking advantage of natural offsets and currency correlations existing within the portfolio and, where practical and material, by hedging a portion of the remainingexposures using derivative instruments such as forward contracts and options. As described below, the implementation of the NIKE Trading Company (“NTC”) and our foreigncurrency adjustment program enhanced our ability to manage our foreign exchange risk by increasing the natural offsets and currency correlation benefits existing within ourportfolio of foreign exchange exposures. Our hedging policy is designed to partially or entirely offset the impact of exchange rate changes on the underlying net exposuresbeing hedged. Where exposures are hedged, our program has the effect of delaying the impact of exchange rate movements on our Consolidated Financial Statements; thelength of the delay is dependent upon hedge horizons. We do not hold or issue derivative instruments for trading or speculative purposes.
32

Table of Contents
Refer to Note 6 — Fair Value Measurements and Note 16 — Risk Management and Derivatives in the accompanying Notes to the Consolidated Financial Statements foradditional description of how the above financial instruments are valued and recorded, as well as the fair value of outstanding derivatives at each reported period end.
Transactional ExposuresWe conduct business in various currencies and have transactions which subject us to foreign currency risk. Our most significant transactional foreign currency exposures are:
• Product Costs — NIKE’s product costs are exposed to fluctuations in foreign currencies in the following ways:
1. Product purchases denominated in currencies other than the functional currency of the transacting entity:
a. Certain NIKE entities purchase product from the NTC, a wholly-owned sourcing hub that buys NIKE branded products from third-party factories,predominantly in U.S. Dollars. The NTC, whose functional currency is the U.S. Dollar, then sells the products to NIKE entities in their respective functionalcurrencies. NTC sales to a NIKE entity with a different functional currency result in a foreign currency exposure for the NTC.
b. Other NIKE entities purchase product directly from third-party factories in U.S. Dollars. These purchases generate a foreign currency exposure for thoseNIKE entities with a functional currency other than the U.S. Dollar.
In both purchasing scenarios, a weaker U.S. Dollar decreases inventory costs incurred by NIKE whereas a stronger U.S. Dollar increases its cost.
2. Factory input costs: NIKE operates a foreign currency adjustment program with certain factories. The program is designed to more effectively manage foreigncurrency risk by assuming certain of the factories’ foreign currency exposures, some of which are natural offsets to our existing foreign currency exposures.Under this program, our payments to these factories are adjusted for rate fluctuations in the basket of currencies (“factory currency exposure index”) in which thelabor, materials and overhead costs incurred by the factories in the production of NIKE branded products (“factory input costs”) are denominated.
For the currency within the factory currency exposure indices that is the local or functional currency of the factory, the currency rate fluctuation affecting theproduct cost is recorded within Inventories and is recognized in Cost of sales when the related product is sold to a third-party. All currencies within the indices,excluding the U.S. Dollar and the local or functional currency of the factory, are recognized as embedded derivative contracts and are recorded at fair valuethrough Other expense (income), net . Refer to Note 16 — Risk Management and Derivatives in the accompanying Notes to the Consolidated FinancialStatements for additional detail.
As an offset to the impacts of the fluctuating U.S. Dollar on our non-functional currency denominated product purchases described above, a strengthe ningU.S. Dollar against the foreign currencies within the factory currency exposure indices decreases NIKE’s U.S. Dollar inventory cost. Conversely, a weakeningU.S. Dollar against the indexed foreign currencies increases our inventory cost.
• Non-Functional Currency Denominated External Sales — A portion of our EMEA geography revenues, as well as a portion of our Converse European operationsrevenues, are earned in currencies other than the Euro (e.g., the British Pound) but are recognized at a subsidiary that uses the Euro as its functional currency.These sales generate a foreign currency exposure.
• Other Costs — Non-functional currency denominated costs, such as endorsement contracts, also generate foreign currency risk, though to a lesser extent. In certaincases, the Company has entered into contractual agreements which have payments indexed to foreign currencies that create embedded derivative contractsrecorded at fair value through Other expense (income), net . Refer to Note 16 — Risk Management and Derivatives in the accompanying Notes to the ConsolidatedFinancial Statements for additional detail.
• Non-Functional Currency Denominated Monetary Assets and Liabilities — Our global subsidiaries have various assets and liabilities, primarily receivables andpayables, including intercompany receivables and payables, denominated in currencies other than their functional currencies. These balance sheet items are subjectto re-measurement which may create fluctuations in Other expense (income), net within our consolidated results of operations.
Managing Transactional ExposuresTransactional exposures are managed on a portfolio basis within our foreign currency risk management program. We manage these exposures by taking advantage of naturaloffsets and currency correlations that exist within the portfolio and may also elect to use currency forward and option contracts to hedge the remaining effect of exchange ratefluctuations on probable forecasted future cash flows, including certain product cost exposures, non-functional currency denominated external sales and other costs describedabove. Generally, these are accounted for as cash flow hedges in accordance with U.S. GAAP, except for hedges of the embedded derivatives components of the product costexposures and other contractual agreements as discussed above.
Certain currency forward contracts used to manage the foreign exchange exposure of non-functional currency denominated monetary assets and liabilities subject to re-measurement and embedded derivative contracts are not formally designated as hedging instruments under U.S. GAAP. Accordingly, changes in fair value of theseinstruments are immediately recognized in Other expense (income), net and are intended to offset the foreign currency impact of the re-measurement of the related non-functional currency denominated asset or liability or the embedded derivative contract being hedged.
33

Table of Contents
Translational ExposuresMany of our foreign subsidiaries operate in functional currencies other than the U.S. Dollar. Fluctuations in currency exchange rates create volatility in our reported results aswe are required to translate the balance sheets, operational results and cash flows of these subsidiaries into U.S. Dollars for consolidated reporting. The translation of foreignsubsidiaries’ non-U.S. Dollar denominated balance sheets into U.S. Dollars for consolidated reporting results in a cumulative translation adjustment to Accumulated othercomprehensive income within the Consolidated Statements of Shareholders’ Equity. In the translation of our Consolidated Statements of Income, a weaker U.S. Dollar inrelation to foreign functional currencies benefits our consolidated earnings whereas a stronger U.S. Dollar reduces our consolidated earnings. The impact of foreign exchangerate fluctuations on the translation of our consolidated Revenues was a benefit of approximately $832 million and a detriment of approximately $542 million for the years endedMay 31, 2018 and 2017, respectively. The impact of foreign exchange rate fluctuations on the translation of our Income before income taxes was a benefit of approximately$177 million and a detriment of approximately $115 million for the years ended May 31, 2018 and 2017, respectively.
Management generally identifies hyper-inflationary markets as those markets whose cumulative inflation rate over a three-year period exceeds 100%. Beginning in fiscal 2019,we anticipate the functional currency of our Argentina subsidiary within our APLA operating segment will change from the local currency to U.S. Dollars as the subsidiary will beoperating in a hyper-inflationary market. As a result, its non-U.S. Dollar denominated monetary assets and liabilities will now be subject to re-measurement and recorded inOther expense (income), net , within the Consolidated Statements of Income beginning in fiscal 2019. Although we continue to evaluate the impact, at current rates, we do notanticipate the re-measurement to have a material impact on our results of operations or financial condition.
Managing Translational ExposuresTo minimize the impact of translating foreign currency denominated revenues and expenses into U.S. Dollars for consolidated reporting, certain foreign subsidiaries use excesscash to purchase U.S. Dollar denominated available-for-sale investments. The variable future cash flows associated with the purchase and subsequent sale of theseU.S. Dollar denominated securities at non-U.S. Dollar functional currency subsidiaries creates a foreign currency exposure that qualifies for hedge accounting under theaccounting standards for derivatives and hedging. We utilize forward contracts and/or options to mitigate the variability of the forecasted future purchases and sales of theseU.S. Dollar investments. The combination of the purchase and sale of the U.S. Dollar investment and the hedging instrument has the effect of partially offsetting the year-over-year foreign currency translation impact on net earnings in the period the investments are sold. Hedges of available-for-sale investments are accounted for as cash flowhedges.
We estimate the combination of translation of foreign currency-denominated profits from our international businesses and the year-over-year change in foreign currency relatedgains and losses included in Other expense (income), net had an unfavorable impact of approximately $110 million and $59 million on our Income before income taxes for theyears ended May 31, 2018 and 2017, respectively.
Net Investments in Foreign SubsidiariesWe are also exposed to the impact of foreign exchange fluctuations on our investments in wholly-owned foreign subsidiaries denominated in a currency other than theU.S. Dollar, which could adversely impact the U.S. Dollar value of these investments and therefore the value of future repatriated earnings. We have, in the past, hedged andmay, in the future, hedge net investment positions in certain foreign subsidiaries to mitigate the effects of foreign exchange fluctuations on these net investments. Thesehedges are accounted for in accordance with U.S. GAAP. There were no outstanding net investment hedges as of May 31, 2018 and 2017. There were no cash flows from netinvestment hedge settlements for the years ended May 31, 2018 and 2017.
Liquidity and Capital Resources
Cash Flow ActivityCash provided by operations was $4,955 million for fiscal 2018 compared to $3,846 million for fiscal 2017 . Net income, adjusted for non-cash items, generated $3,473 millionof operating cash flow for fiscal 2018 compared to $4,781 million for fiscal 2017 . The net change in working capital and other assets and liabilities resulted in an increase of$1,482 million for fiscal 2018, compared to a decrease of $935 million for fiscal 2017. Impacting the change in working capital during fiscal 2018 was the accrual of $1,172million for the transition tax under the Tax Act, which will be paid in cash over an eight-year period. Refer to Note 9 — Income Taxes for additional information on the Tax Act. Cash provided by operations was also impacted by the change in Accounts Receivable, net , which decreased $187 million , primarily due to improved collection timing,compared to an increase of $426 million in fiscal 2017.
Cash provided (used) by investing activities was an inflow of $276 million for fiscal 2018 , compared to an outflow of $1,008 million for fiscal 2017 , driven primarily by the netchange in short-term investments. During fiscal 2018 , the net change in investments (including sales, maturities and purchases) resulted in a cash inflow of $1,326 millioncompared to an inflow of $118 million in fiscal 2017 .
In fiscal 2019, we plan to continue investing in our infrastructure to support future growth, including corporate facilities, expanding our digital capabilities and new NIKE Directstores. We continue to expect such investments to approximate 3% to 4% of revenues, on average.
Cash used by financing activities was $4,835 million for fiscal 2018 compared to $2,148 million for fiscal 2017 . The increase in Cash used by financing activities was primarilydriven by $1,482 million of net proceeds from the issuance of long-term debt in fiscal 2017, which did not recur in fiscal 2018. The increase in Cash used by financing activitieswas also impacted by increased repurchases of common stock, which resulted in a cash outflow of $4,254 million for fiscal 2018 compared to an outflow of $3,223 million forfiscal 2017 .
In fiscal 2018 , we purchased 69.7 million shares of NIKE’s Class B Common Stock for $4,267 million (an average price of $ 61.25 per share) under the four-year, $12 billionprogram approved by the Board of Directors in November 2015. As of May 31, 2018, we had repurchased 149.4 million shares at a cost of $8,704 million (an average price of$58.25 per share) under this program. Although the timing and number of shares purchased will be dictated by our capital needs and stock market conditions, we currentlyanticipate completing this program during fiscal 2019. In June 2018, our Board of Directors approved a new four-year, $15 billion program to repurchase shares of NIKE’sClass B Common Stock, which we anticipate will commence at the completion of our current program. We continue to expect funding of share repurchases will come fromoperating cash flows, excess cash and/or proceeds from debt.
34

Table of Contents
Capital ResourcesOn July 21, 2016, we filed a shelf registration statement (the “Shelf”) with the SEC which permits us to issue an unlimited amount of debt securities from time to time. The Shelfexpires on July 21, 2019. For additional detail refer to Note 8 — Long-Term Debt in the accompanying Notes to the Consolidated Financial Statements.
On August 28, 2015, we entered into a committed credit facility agreement with a syndicate of banks, which provides for up to $2 billion of borrowings. The facility maturesAugust 28, 2020, with a one-year extension option prior to any anniversary of the closing date, provided that in no event shall it extend beyond August 28, 2022. As of and forthe periods ended May 31, 2018 and 2017 , we had no amounts outstanding under the committed credit facility.
We currently have long-term debt ratings of AA- and A1 from Standard and Poor’s Corporation and Moody’s Investor Services, respectively. If our long-term debt ratings wereto decline, the facility fee and interest rate under our committed credit facility would increase. Conversely, if our long-term debt ratings were to improve, the facility fee andinterest rate would decrease. Changes in our long-term debt ratings would not trigger acceleration of maturity of any then-outstanding borrowings or any future borrowingsunder the committed credit facility. Under this facility, we have agreed to various covenants. These covenants include limits on our disposal of fixed assets and the amount ofdebt secured by liens we may incur as well as limits on the indebtedness we can incur relative to our net worth. In the event we were to have any borrowings outstanding underthis facility and failed to meet any covenant, and were unable to obtain a waiver from a majority of the banks in the syndicate, any borrowings would become immediately dueand payable. As of May 31, 2018 , we were in full compliance with each of these covenants and believe it is unlikely we will fail to meet any of these covenants in theforeseeable future.
Liquidity is also provided by our $2 billion commercial paper program. During the year ended May 31, 2018 , the maximum amount of commercial paper borrowingsoutstanding at any point was $1.4 billion. As of May 31, 2018 , there were $325 million of outstanding borrowings under this program. We may continue to issue commercialpaper or other debt securities during fiscal 2019 depending on general corporate needs. We currently have short-term debt ratings of A1+ and P1 from Standard and Poor’sCorporation and Moody’s Investor Services, respectively.
To date, in fiscal 2018, we have not experienced difficulty accessing the credit markets or incurred higher interest costs; however, future volatility in the capital markets mayincrease costs associated with issuing commercial paper or other debt instruments or affect our ability to access those markets.
As of May 31, 2018 , we had cash, cash equivalents and short-term investments totaling $5.2 billion , primarily consisting of deposits held at major banks, money market funds,commercial paper, corporate notes, U.S. Treasury obligations, U.S. government sponsored enterprise obligations and other investment grade fixed-income securities. Ourfixed-income investments are exposed to both credit and interest rate risk. All of our investments are investment grade to minimize our credit risk. While individual securitieshave varying durations, as of May 31, 2018 , the weighted-average days to maturity of our cash equivalents and short-term investments portfolio was 33 days.
We believe that existing cash, cash equivalents, short-term investments and cash generated by operations, together with access to external sources of funds as describedabove, will be sufficient to meet our domestic and foreign capital needs in the foreseeable future.
Off-Balance Sheet ArrangementsIn connection with various contracts and agreements, we routinely provide indemnification relating to the enforceability of intellectual property rights, coverage for legal issuesthat arise and other items where we are acting as the guarantor. Currently, we have several such agreements in place. Based on our historical experience and the estimatedprobability of future loss, we have determined that the fair value of such indemnification is not material to our financial position or results of operations.
35

Table of Contents
Contractual ObligationsOur significant long-term contractual obligations as of May 31, 2018 , and significant endorsement contracts, including related marketing commitments, entered into through thedate of this report are as follows:
Description of Commitment Cash Payments Due During the Year Ending May 31,
(In millions) 2019 2020 2021 2022 2023 Thereafter Total
Operating Leases $ 589 $ 523 $ 472 $ 412 $ 361 $ 1,608 $ 3,965
Capital Leases and Other Financing Obligations (1) 44 37 40 38 36 229 424
Long-Term Debt (2) 115 115 112 109 609 4,713 5,773
Endorsement Contracts (3) 1,391 1,306 1,158 1,266 942 4,438 10,501
Product Purchase Obligations (4) 4,566 — — — — — 4,566
Other Purchase Obligations (5) 1,437 512 281 92 70 254 2,646
Transition Tax Related to the Tax Act (6) 94 94 94 94 94 702 1,172
TOTAL $ 8,236 $ 2,587 $ 2,157 $ 2,011 $ 2,112 $ 11,944 $ 29,047(1) Capital leases and other financing obligations include payments related to build-to-suit lease arrangements.(2) The cash payments due for long-term debt include estimated interest payments. Estimates of interest payments are based on outstanding principal amounts, applicable
fixed interest rates or currently effective interest rates as of May 31, 2018 (if variable), timing of scheduled payments and the term of the debt obligations.(3) The amounts listed for endorsement contracts represent approximate amounts of base compensation and minimum guaranteed royalty fees we are obligated to pay
athlete, public figure, sport team and league endorsers of our products. Actual payments under some contracts may be higher than the amounts listed as these contractsprovide for bonuses to be paid to the endorsers based upon athletic achievements and/or royalties on product sales in future periods. Actual payments under somecontracts may also be lower as these contracts include provisions for reduced payments if athletic performance declines in future periods.In addition to the cash payments, we are obligated to furnish our endorsers with NIKE product for their use. It is not possible to determine how much we will spend on thisproduct on an annual basis as the contracts generally do not stipulate a specific amount of cash to be spent on the product. The amount of product provided to theendorsers will depend on many factors, including general playing conditions, the number of sporting events in which they participate and our own decisions regardingproduct and marketing initiatives. In addition, the costs to design, develop, source and purchase the products furnished to the endorsers are incurred over a period of timeand are not necessarily tracked separately from similar costs incurred for products sold to customers.
(4) We generally order product at least four to five months in advance of sale based primarily on advanced orders received from external wholesale customers and internalorders from our NIKE Direct in-line stores and digital commerce operations. The amounts listed for product purchase obligations represent agreements (including openpurchase orders) to purchase products in the ordinary course of business that are enforceable and legally binding and specify all significant terms. In some cases, pricesare subject to change throughout the production process.
(5) Other purchase obligations primarily include construction, service and marketing commitments, including marketing commitments associated with endorsement contracts,made in the ordinary course of business. The amounts represent the minimum payments required by legally binding contracts and agreements that specify all significantterms, including open purchase orders for non-product purchases.
(6) Represents a provisional estimate of the future cash payments due as part of the transition tax on deemed repatriation of undistributed earnings of foreign subsidiaries,which is reflected net of foreign tax credits we expect to utilize. Actual amounts could vary as we complete our analysis of the Tax Act. Refer to Note 9 — Income Taxes inthe accompanying Notes to the Financial Statements for additional information.
In addition to the above, we have long-term obligations for uncertain tax positions and various post-retirement benefits for which we are not able to reasonably estimate whencash payments will occur. Refer to Note 9 — Income Taxes and Note 13 — Benefit Plans in the accompanying Notes to the Consolidated Financial Statements for furtherinformation related to uncertain tax positions and post-retirement benefits, respectively.
We also have the following outstanding short-term debt obligations as of May 31, 2018 . Refer to Note 7 — Short-Term Borrowings and Credit Lines in the accompanyingNotes to the Consolidated Financial Statements for further description and interest rates related to the short-term debt obligations listed below.
Outstanding asof May 31, 2018(In millions)
Notes payable, due at mutually agreed-upon dates within one year of issuance or on demand $ 336Payable to Sojitz America for the purchase of inventories, generally due 60 days after shipment of goods from a foreign port 61
As of May 31, 2018 , the Company had letters of credit outstanding totaling $165 million . These letters of credit were issued primarily for the purchase of inventory and asguarantees of the Company’s performance under certain self-insurance and other programs.
New Accounting PronouncementsRefer to Note 1 — Summary of Significant Accounting Policies in the accompanying Notes to the Consolidated Financial Statements for recently adopted and recently issuedaccounting standards.
36

Table of Contents
Critical Accounting PoliciesOur previous discussion and analysis of our financial condition and results of operations are based upon our Consolidated Financial Statements, which have been prepared inaccordance with accounting principles generally accepted in the United States of America. The preparation of these financial statements requires us to make estimates andjudgments that affect the reported amounts of assets, liabilities, revenues and expenses and related disclosure of contingent assets and liabilities. Note 1 — Summary ofSignificant Accounting Policies in the accompanying Notes to the Consolidated Financial Statements describes the significant accounting policies and methods used in thepreparation of our Consolidated Financial Statements.
We believe the estimates, assumptions and judgments involved in the accounting policies described below have the greatest potential impact on our financial statements, sowe consider these to be our critical accounting policies and estimates. Management has reviewed and discussed these critical accounting policies with the Audit & FinanceCommittee of the Board of Directors.
These policies require we make estimates in the preparation of our financial statements as of a given date. Because of the uncertainty inherent in these matters, actual resultscould differ from the estimates we use in applying the critical accounting policies. Within the context of these critical accounting policies, we are not currently aware of anyreasonably likely events or circumstances that would result in materially different amounts being reported.
Revenue RecognitionWe record wholesale revenues when title passes and the risks and rewards of ownership have passed to the customer, based on the terms of sale. Title passes generally uponshipment or upon receipt by the customer depending on the country of the sale and the agreement with the customer. Retail store revenues are recorded at the time of saleand digital commerce revenues are recorded upon delivery to the customer.
In some instances, we ship product directly from our supplier to the customer and recognize revenue when the product is delivered to and accepted by the customer. Ourrevenues may fluctuate in cases when our customers delay accepting shipment of product for periods of up to several weeks.
In certain countries, precise information regarding the date of receipt by the customer is not readily available. In these cases, we estimate the date of receipt by the customerbased upon historical delivery times by geographic location. On the basis of our tests of actual transactions, we have no indication these estimates have been materiallyinaccurate historically.
As part of our revenue recognition policy, we record estimated sales returns, discounts and miscellaneous claims from customers as reductions to revenues at the timerevenues are recorded. Our post invoice sales discounts consist of contractual programs with certain customers or discretionary discounts expected to be granted to certaincustomers at a later date. We base our estimates on (1) historical rates of product returns, discounts and claims, (2) specific identification of outstanding claims andoutstanding returns not yet received from customers and (3) estimated returns, discounts and claims expected but not yet finalized with our customers. Actual returns,discounts and claims in any future period are inherently uncertain and thus may differ from our estimates. If actual or expected future returns, discounts and claims aresignificantly greater or lower than established reserves, we record a reduction or increase to net revenues in the period in which we make such determination.
Allowance for Uncollectible Accounts ReceivableWe make ongoing estimates relating to the ability to collect our accounts receivable and maintain an allowance for estimated losses resulting from the inability of our customersto make required payments. In determining the amount of the allowance, we consider our historical level of credit losses and make judgments about the creditworthiness ofsignificant customers based on ongoing credit evaluations. Since we cannot predict future changes in the financial stability of our customers, actual future losses fromuncollectible accounts may differ from our estimates. If the financial condition of our customers were to deteriorate, resulting in their inability to make payments, a largerallowance might be required. In the event we determine a smaller or larger allowance is appropriate, we would record a credit or a charge to Operating overhead expense inthe period in which such a determination is made.
Inventory ReservesWe also make ongoing estimates relating to the net realizable value of inventories based upon our assumptions about future demand and market conditions. If we estimate thenet realizable value of our inventory is less than the cost of the inventory recorded on our books, we record a reserve equal to the difference between the cost of the inventoryand the estimated net realizable value. This reserve is recorded as a charge to Cost of sales . If changes in market conditions result in reductions in the estimated netrealizable value of our inventory below our previous estimate, we would increase our reserve in the period in which we made such a determination.
Contingent Payments under Endorsement ContractsA significant amount of our Demand creation expense relates to payments under endorsement contracts. In general, endorsement payments are expensed on a straight-linebasis over the term of the contract. However, certain contract elements may be accounted for differently based upon the facts and circumstances of each individual contract.
Certain contracts provide for contingent payments to endorsers based upon specific achievements in their sports (e.g., winning a championship). We record demand creationexpense for these amounts when the endorser achieves the specific goal.
Certain contracts provide for variable payments based upon endorsers maintaining a level of performance in their sport over an extended period of time (e.g., maintaining aspecified ranking in a sport for a year). When we determine payments are probable, the amounts are reported in Demand creation expense ratably over the contract periodbased on our best estimate of the endorser’s performance. In these instances, to the extent actual payments to the endorser differ from our estimate due to changes in theendorser’s performance, adjustments to Demand creation expense may be recorded in a future period.
37

Table of Contents
Certain contracts provide for royalty payments to endorsers based upon a predetermined percent of sales of particular products. We expense these payments in Cost of salesas the related sales occur. In certain contracts, we offer minimum guaranteed royalty payments. For contracts for which we estimate we will not meet the minimum guaranteedamount of royalty fees through sales of product, we record the amount of the guaranteed payment in excess of that earned through sales of product in Demand creationexpense uniformly over the contract term.
Property, Plant and Equipment and Definite-Lived AssetsWe review the carrying value of long-lived assets or asset groups to be used in operations whenever events or changes in circumstances indicate the carrying amount of theassets might not be recoverable. Factors that would necessitate an impairment assessment include a significant adverse change in the extent or manner in which an asset isused, a significant adverse change in legal factors or the business climate that could affect the value of the asset or a significant decline in the observable market value of anasset, among others. If such facts indicate a potential impairment, we would assess the recoverability of an asset group by determining if the carrying value of the asset groupexceeds the sum of the projected undiscounted cash flows expected to result from the use and eventual disposition of the assets over the remaining economic life of theprimary asset in the asset group. If the recoverability test indicates the carrying value of the asset group is not recoverable, we will estimate the fair value of the asset groupusing appropriate valuation methodologies that would typically include an estimate of discounted cash flows. Any impairment would be measured as the difference between theasset group’s carrying amount and its estimated fair value.
Hedge Accounting for DerivativesWe use derivative contracts to hedge certain anticipated foreign currency and interest rate transactions as well as certain non-functional currency monetary assets andliabilities. When the specific criteria to qualify for hedge accounting has been met, changes in the fair value of contracts hedging probable forecasted future cash flows arerecorded in Accumulated other comprehensive income , rather than Net income , until the underlying hedged transaction affects Net income . In most cases, this results ingains and losses on hedge derivatives being released from Other comprehensive income into Net income sometime after the maturity of the derivative. One of the criteria forthis accounting treatment is that the notional value of these derivative contracts should not be in excess of specifically identified anticipated transactions. By their very nature,our estimates of anticipated transactions may fluctuate over time and may ultimately vary from actual transactions. When anticipated transaction estimates or actual transactionamounts decline below hedged levels, or if it is no longer probable a forecasted transaction will occur by the end of the originally specified time period or within an additionaltwo-month period of time thereafter, we are required to reclassify the cumulative change in fair value of the over-hedged portion of the related hedge contract from Othercomprehensive income to Other expense (income), net during the quarter in which the decrease occurs.
Stock-based CompensationWe account for stock-based compensation by estimating the fair value of stock-based compensation on the date of grant using the Black-Scholes option pricing model. TheBlack-Scholes option pricing model requires the input of highly subjective assumptions including volatility. Expected volatility is estimated based on implied volatility in markettraded options on our common stock with a term greater than one year, along with other factors. Our decision to use implied volatility was based on the availability of activelytraded options on our common stock and our assessment that implied volatility is more representative of future stock price trends than historical volatility. If factors change andwe use different assumptions for estimating stock-based compensation expense in future periods, stock-based compensation expense may differ materially in the future fromthat recorded in the current period.
Income TaxesWe are subject to taxation in the United States, as well as various state and foreign jurisdictions. The determination of our provision for income taxes requires significantjudgment, the use of estimates and the interpretation and application of complex tax laws. On an interim basis, we estimate what our effective tax rate will be for the full fiscalyear. This estimated annual effective tax rate is then applied to the year-to-date Income before income taxes excluding infrequently occurring or unusual items, to determinethe year-to-date Income tax expense . The income tax effects of infrequent or unusual items are recognized in the interim period in which they occur. As the fiscal yearprogresses, we continually refine our estimate based upon actual events and earnings by jurisdiction during the year. This continual estimation process periodically results in achange to our expected effective tax rate for the fiscal year. When this occurs, we adjust the income tax provision during the quarter in which the change in estimate occurs.
We record valuation allowances against our deferred tax assets, when necessary. Realization of deferred tax assets (such as net operating loss carry-forwards) is dependenton future taxable earnings and is therefore uncertain. At least quarterly, we assess the likelihood that our deferred tax asset balance will be recovered from future taxableincome. To the extent we believe that recovery is not likely, we establish a valuation allowance against our net deferred tax asset, which increases our Income tax expense inthe period when such determination is made.
On a quarterly basis, we evaluate the probability a tax position will be effectively sustained and the appropriateness of the amount recognized for uncertain tax positions basedon factors including changes in facts or circumstances, changes in tax law, settled audit issues and new audit activity. Changes in our assessment may result in the recognitionof a tax benefit or an additional charge to the tax provision in the period our assessment changes. We recognize interest and penalties related to income tax matters in Incometax expense .
On December 22, 2017, the United States enacted the Tax Act, which significantly changes previous U.S. tax laws, including provisions for a one-time transition tax on deemedrepatriation of undistributed foreign earnings, a reduction in the corporate tax rate from 35% to 21%, as well as other changes. In accordance with U.S. Securities andExchange Commission Staff Accounting Bulletin No. 118 (“SAB 118”), we recorded provisional amounts, which represent reasonable estimates of the effects of the Tax Act forwhich the analysis is not yet complete. As the Company completes its analysis of the Tax Act, including collecting, preparing and analyzing necessary information, performingand refining calculations and obtaining additional guidance from the U.S. Internal Revenue Services (IRS), U.S. Treasury Department, Financial Accounting Standards Board(FASB) or other standard setting and regulatory bodies on the Tax Act, it may record adjustments to the provisional amounts, which may be material. In accordance with SAB118, the Company’s accounting for the tax effects of the Tax Act will be completed during the measurement period, which should not extend beyond one year from theenactment date.
Refer to Note 9 — Income Taxes in the accompanying Notes to the Consolidated Financial Statements for additional information.
38

Table of Contents
Other ContingenciesIn the ordinary course of business, we are involved in legal proceedings regarding contractual and employment relationships, product liability claims, trademark rights and avariety of other matters. We record contingent liabilities resulting from claims against us when a loss is assessed to be probable and the amount of the loss is reasonablyestimable. Assessing probability of loss and estimating probable losses requires analysis of multiple factors, including in some cases judgments about the potential actions ofthird-party claimants and courts. Recorded contingent liabilities are based on the best information available and actual losses in any future period are inherently uncertain. Iffuture adjustments to estimated probable future losses or actual losses exceed our recorded liability for such claims, we would record additional charges during the period inwhich the actual loss or change in estimate occurred. In addition to contingent liabilities recorded for probable losses, we disclose contingent liabilities when there is areasonable possibility the ultimate loss will materially exceed the recorded liability. While we cannot predict the outcome of pending legal matters with certainty, we do notbelieve any currently identified claim, proceeding or litigation, either individually or in aggregate, will have a material impact on our results of operations, financial position orcash flows.
39

Table of Contents
ITEM 7A. Quantitative and Qualitative Disclosures about Market RiskIn the normal course of business and consistent with established policies and procedures, we employ a variety of financial instruments to manage exposure to fluctuations inthe value of foreign currencies and interest rates. It is our policy to utilize these financial instruments only where necessary to finance our business and manage suchexposures; we do not enter into these transactions for trading or speculative purposes.
We are exposed to foreign currency fluctuations, primarily as a result of our international sales, product sourcing and funding activities. Our foreign exchange risk managementprogram is intended to lessen both the positive and negative effects of currency fluctuations on our consolidated results of operations, financial position and cash flows. We useforward and option contracts to hedge certain anticipated, but not yet firmly committed, transactions as well as certain firm commitments and the related receivables andpayables, including third-party and intercompany transactions. We have, in the past, and may in the future, also use forward or options contracts to hedge our investment in thenet assets of certain international subsidiaries to offset foreign currency translation adjustments related to our net investment in those subsidiaries. Where exposures arehedged, our program has the effect of delaying the impact of exchange rate movements on our Consolidated Financial Statements.
The timing for hedging exposures, as well as the type and duration of the hedge instruments employed, are guided by our hedging policies and determined based upon thenature of the exposure and prevailing market conditions. Typically, the Company may enter into hedge contracts starting up to 12 to 24 months in advance of the forecastedtransaction and may place incremental hedges up to 100% of the exposure by the time the forecasted transaction occurs. The majority of derivatives outstanding as of May 31,2018 are designated as foreign currency cash flow hedges, primarily for Euro/U.S. Dollar, British Pound/Euro and Japanese Yen/U.S. Dollar currency pairs. Refer to Note 16 —Risk Management and Derivatives in the accompanying Notes to the Consolidated Financial Statements for additional information.
Our earnings are also exposed to movements in short- and long-term market interest rates. Our objective in managing this interest rate exposure is to limit the impact ofinterest rate changes on earnings and cash flows and to reduce overall borrowing costs. To achieve these objectives, we maintain a mix of commercial paper, bank loans, andfixed-rate debt of varying maturities.
Market Risk MeasurementWe monitor foreign exchange risk, interest rate risk and related derivatives using a variety of techniques including a review of market value, sensitivity analysis and Value-at-Risk (“VaR”). Our market-sensitive derivative and other financial instruments are foreign currency forward contracts, foreign currency option contracts, interest rate swaps,intercompany loans denominated in non-functional currencies, fixed interest rate U.S. Dollar denominated debt and fixed interest rate Japanese Yen denominated debt.
We use VaR to monitor the foreign exchange risk of our foreign currency forward and foreign currency option derivative instruments only. The VaR determines the maximumpotential one-day loss in the fair value of these foreign exchange rate-sensitive financial instruments. The VaR model estimates assume normal market conditions and a 95%confidence level. There are various modeling techniques that can be used in the VaR computation. Our computations are based on interrelationships between currencies andinterest rates (a “variance/co-variance” technique). These interrelationships are a function of foreign exchange currency market changes and interest rate changes over thepreceding one-year period. The value of foreign currency options does not change on a one-to-one basis with changes in the underlying currency rate. We adjust the potentialloss in option value for the estimated sensitivity (the “delta” and “gamma”) to changes in the underlying currency rate. This calculation reflects the impact of foreign currencyrate fluctuations on the derivative instruments only and does not include the impact of such rate fluctuations on non-functional currency transactions (such as anticipatedtransactions, firm commitments, cash balances and accounts and loans receivable and payable), including those which are hedged by these instruments.
The VaR model is a risk analysis tool and does not purport to represent actual losses in fair value we will incur nor does it consider the potential effect of favorable changes inmarket rates. It also does not represent the full extent of the possible loss that may occur. Actual future gains and losses will differ from those estimated because of changes ordifferences in market rates and interrelationships, hedging instruments and hedge percentages, timing and other factors.
The estimated maximum one-day loss in fair value on our foreign currency sensitive derivative financial instruments, derived using the VaR model, was $93 million and $97million at May 31, 2018 and 2017, respectively. The VAR decreased year-over-year as a result of a decrease in foreign currency volatilities at May 31, 2018. Such ahypothetical loss in the fair value of our derivatives would be offset by increases in the value of the underlying transactions being hedged. The average monthly change in thefair values of foreign currency forward and foreign currency option derivative instruments was $260 million and $161 million during fiscal 2018 and fiscal 2017, respectively.
The instruments not included in the VaR are intercompany loans denominated in non-functional currencies, fixed interest rate Japanese Yen denominated debt, fixed interestrate U.S. Dollar denominated debt and interest rate swaps. Intercompany loans and related interest amounts are eliminated in consolidation. Furthermore, our non-functionalcurrency intercompany loans are substantially hedged against foreign exchange risk through the use of forward contracts, which are included in the VaR calculation above.Therefore, we consider the interest rate and foreign currency market risks associated with our non-functional currency intercompany loans to be immaterial to our consolidatedfinancial position, results from operations and cash flows.
Details of third-party debt are provided in the table below. The table presents principal cash flows and related weighted average interest rates by expected maturity dates.
40

Table of Contents
Expected Maturity Date
Year Ending May 31,
(Dollars in millions) 2019 2020 2021 2022 2023 Thereafter Total Fair
Value
Foreign Exchange Risk
Japanese Yen Functional Currency Long-term Japanese Yen debt — Fixedrate
Principal payments $ 6 $ 6 $ 3 $ — $ — $ — $ 15 $ 16
Average interest rate 2.4% 2.4% 2.4% 0.0% 0.0% 0.0% 2.4%
Interest Rate Risk
Japanese Yen Functional Currency Long-term Japanese Yen debt — Fixedrate
Principal payments $ 6 $ 6 $ 3 $ — $ — $ — $ 15 $ 16
Average interest rate 2.4% 2.4% 2.4% 0.0% 0.0% 0.0% 2.4%
U.S. Dollar Functional Currency
Long-term U.S. Dollar debt — Fixed rate
Principal payments $ — $ — $ — $ — $ 500 $ 3,000 $ 3,500 $ 3,279
Average interest rate 0.0% 0.0% 0.0% 0.0% 2.3% 3.3% 3.1%
The fixed interest rate Japanese Yen denominated debt instruments were issued by and are accounted for by one of our Japanese subsidiaries. Accordingly, the monthlytranslation of these instruments, which varies due to changes in foreign exchange rates, is recognized in Accumulated other comprehensive income upon consolidation of thissubsidiary.
ITEM 8. Financial Statements and Supplementary DataManagement of NIKE, Inc. is responsible for the information and representations contained in this report. The financial statements have been prepared in conformity withaccounting principles generally accepted in the United States of America (“U.S. GAAP”) and include certain amounts based on our best estimates and judgments. Otherfinancial information in this report is consistent with these financial statements.
Our accounting systems include controls designed to reasonably assure assets are safeguarded from unauthorized use or disposition and provide for the preparation offinancial statements in conformity with U.S. GAAP. These systems are supplemented by the selection and training of qualified financial personnel and an organizationalstructure providing for appropriate segregation of duties.
An internal corporate audit department reviews the results of its work with the Audit & Finance Committee of the Board of Directors, presently comprised of three outside,independent directors. The Audit & Finance Committee is responsible for the appointment of the independent registered public accounting firm and reviews, with theindependent registered public accounting firm, management and the internal corporate audit staff, the scope and the results of the annual audit, the effectiveness of theaccounting control system and other matters relating to the financial affairs of NIKE as the Audit & Finance Committee deems appropriate. The independent registered publicaccounting firm and the internal corporate auditors have full access to the Audit & Finance Committee, with and without the presence of management, to discuss anyappropriate matters.
41

Table of Contents
Management’s Annual Report on Internal Control Over Financial ReportingManagement is responsible for establishing and maintaining adequate internal control over financial reporting, as such term is defined in Rule 13(a) - 15(f) and Rule 15(d) -15(f) of the Securities Exchange Act of 1934, as amended. Internal control over financial reporting is a process designed to provide reasonable assurance regarding thereliability of financial reporting and the preparation of the financial statements for external purposes in accordance with generally accepted accounting principles in the UnitedStates of America. Internal control over financial reporting includes those policies and procedures that: (i) pertain to the maintenance of records that, in reasonable detail,accurately and fairly reflect the transactions and dispositions of assets of the Company; (ii) provide reasonable assurance that transactions are recorded as necessary to permitpreparation of financial statements in accordance with generally accepted accounting principles, and that receipts and expenditures of the Company are being made only inaccordance with authorizations of our management and directors; and (iii) provide reasonable assurance regarding prevention or timely detection of unauthorized acquisition,use or disposition of assets of the Company that could have a material effect on the financial statements.
While “reasonable assurance” is a high level of assurance, it does not mean absolute assurance. Because of its inherent limitations, internal control over financial reportingmay not prevent or detect every misstatement and instance of fraud. Controls are susceptible to manipulation, especially in instances of fraud caused by the collusion of two ormore people, including our senior management. Also, projections of any evaluation of effectiveness to future periods are subject to the risk that controls may becomeinadequate because of changes in conditions, or that the degree of compliance with the policies or procedures may deteriorate.
Under the supervision and with the participation of our Chief Executive Officer and Chief Financial Officer, our management conducted an evaluation of the effectiveness of ourinternal control over financial reporting based upon the framework in Internal Control — Integrated Framework (2013) issued by the Committee of Sponsoring Organizations ofthe Treadway Commission (COSO). Based on the results of our evaluation, our management concluded that our internal control over financial reporting was effective as ofMay 31, 2018 .
PricewaterhouseCoopers LLP, an independent registered public accounting firm, has audited (1) the Consolidated Financial Statements and (2) the effectiveness of ourinternal control over financial reporting as of May 31, 2018 , as stated in their report herein.
Mark G. Parker Andrew CampionChairman, President and Chief Executive Officer Chief Financial Officer
42

Table of Contents
Report of Independent Registered Public Accounting FirmTo the Board of Directors and Shareholders of NIKE, Inc.
Opinions on the Financial Statements and Internal Control over Financial Reporting
We have audited the accompanying consolidated balance sheets of NIKE, Inc. and its subsidiaries as of May 31, 2018 and 2017, and the related consolidated statements ofincome, comprehensive income, shareholders’ equity and cash flows for each of the three years in the period ended May 31, 2018, including the related notes and financialstatement schedule listed in the index appearing under Item 15(a)(2) (collectively referred to as the “consolidated financial statements”). We also have audited the Company ’ sinternal control over financial reporting as of May 31, 2018, based on criteria established in Internal Control - Integrated Framework (2013) issued by the Committee ofSponsoring Organizations of the Treadway Commission (COSO).
In our opinion, the consolidated financial statements referred to above present fairly, in all material respects, the financial position of the Company as of May 31, 2018 and2017 , and the results of their operations and their cash flows for each of the three years in the period ended May 31, 2018 in conformity with accounting principles generallyaccepted in the United States of America. Also in our opinion, the Company maintained, in all material respects, effective internal control over financial reporting as of May 31,2018, based on criteria established in Internal Control - Integrated Framework (2013) issued by the COSO.
Change in Accounting Principle
As discussed in Note 1 to the consolidated financial statements, the Company changed the manner in which it accounts for share-based payment awards to employees as ofJune 1, 2017.
Basis for Opinions
The Company ’ s management is responsible for these consolidated financial statements, for maintaining effective internal control over financial reporting, and for itsassessment of the effectiveness of internal control over financial reporting, included in Management’s Annual Report on Internal Control over Financial Reporting appearingunder Item 8. Our responsibility is to express opinions on the Company’s consolidated financial statements and on the Company ’ s internal control over financial reportingbased on our audits. We are a public accounting firm registered with the Public Company Accounting Oversight Board (United States) (“PCAOB”) and are required to beindependent with respect to the Company in accordance with the U.S. federal securities laws and the applicable rules and regulations of the Securities and ExchangeCommission and the PCAOB.
We conducted our audits in accordance with the standards of the PCAOB. Those standards require that we plan and perform the audits to obtain reasonable assurance aboutwhether the consolidated financial statements are free of material misstatement, whether due to error or fraud, and whether effective internal control over financial reportingwas maintained in all material respects.
Our audits of the consolidated financial statements included performing procedures to assess the risks of material misstatement of the consolidated financial statements,whether due to error or fraud, and performing procedures that respond to those risks. Such procedures included examining, on a test basis, evidence regarding the amountsand disclosures in the consolidated financial statements. Our audits also included evaluating the accounting principles used and significant estimates made by management,as well as evaluating the overall presentation of the consolidated financial statements. Our audit of internal control over financial reporting included obtaining an understandingof internal control over financial reporting, assessing the risk that a material weakness exists, and testing and evaluating the design and operating effectiveness of internalcontrol based on the assessed risk. Our audits also included performing such other procedures as we considered necessary in the circumstances. We believe that our auditsprovide a reasonable basis for our opinions.
Definition and Limitations of Internal Control over Financial Reporting
A company’s internal control over financial reporting is a process designed to provide reasonable assurance regarding the reliability of financial reporting and the preparation offinancial statements for external purposes in accordance with generally accepted accounting principles. A company’s internal control over financial reporting includes thosepolicies and procedures that (i) pertain to the maintenance of records that, in reasonable detail, accurately and fairly reflect the transactions and dispositions of the assets ofthe company; (ii) provide reasonable assurance that transactions are recorded as necessary to permit preparation of financial statements in accordance with generallyaccepted accounting principles, and that receipts and expenditures of the company are being made only in accordance with authorizations of management and directors of thecompany; and (iii) provide reasonable assurance regarding prevention or timely detection of unauthorized acquisition, use, or disposition of the company’s assets that couldhave a material effect on the financial statements.
Because of its inherent limitations, internal control over financial reporting may not prevent or detect misstatements. Also, projections of any evaluation of effectiveness tofuture periods are subject to the risk that controls may become inadequate because of changes in conditions, or that the degree of compliance with the policies or proceduresmay deteriorate.
/S/ PricewaterhouseCoopers LLP
Portland, Oregon
July 24, 2018
We have served as the Company’s auditor since 1974.
43

Table of Contents
NIKE, Inc. Consolidated Statements of Income
Year Ended May 31,
(In millions, except per share data) 2018 2017 2016
Revenues $ 36,397 $ 34,350 $ 32,376
Cost of sales 20,441 19,038 17,405
Gross profit 15,956 15,312 14,971
Demand creation expense 3,577 3,341 3,278
Operating overhead expense 7,934 7,222 7,191
Total selling and administrative expense 11,511 10,563 10,469
Interest expense (income), net 54 59 19
Other expense (income), net 66 (196) (140)
Income before income taxes 4,325 4,886 4,623
Income tax expense 2,392 646 863
NET INCOME $ 1,933 $ 4,240 $ 3,760
Earnings per common share:
Basic $ 1.19 $ 2.56 $ 2.21
Diluted $ 1.17 $ 2.51 $ 2.16
Dividends declared per common share $ 0.78 $ 0.70 $ 0.62
The accompanying Notes to the Consolidated Financial Statements are an integral part of this statement.
44

Table of Contents
NIKE, Inc. Consolidated Statements of Comprehensive Income Year Ended May 31,
(In millions) 2018 2017 2016
Net income $ 1,933 $ 4,240 $ 3,760
Other comprehensive income (loss), net of tax:
Change in net foreign currency translation adjustment (6) 16 (176)
Change in net gains (losses) on cash flow hedges 76 (515) (757)
Change in net gains (losses) on other 34 (32) 5
Total other comprehensive income (loss), net of tax 104 (531) (928)
TOTAL COMPREHENSIVE INCOME $ 2,037 $ 3,709 $ 2,832
The accompanying Notes to the Consolidated Financial Statements are an integral part of this statement.
45

Table of Contents
NIKE, Inc. Consolidated Balance Sheets May 31,
(In millions) 2018 2017
ASSETS
Current assets:
Cash and equivalents $ 4,249 $ 3,808
Short-term investments 996 2,371
Accounts receivable, net 3,498 3,677
Inventories 5,261 5,055
Prepaid expenses and other current assets 1,130 1,150
Total current assets 15,134 16,061
Property, plant and equipment, net 4,454 3,989
Identifiable intangible assets, net 285 283
Goodwill 154 139
Deferred income taxes and other assets 2,509 2,787
TOTAL ASSETS $ 22,536 $ 23,259
LIABILITIES AND SHAREHOLDERS’ EQUITY
Current liabilities:
Current portion of long-term debt $ 6 $ 6
Notes payable 336 325
Accounts payable 2,279 2,048
Accrued liabilities 3,269 3,011
Income taxes payable 150 84
Total current liabilities 6,040 5,474
Long-term debt 3,468 3,471
Deferred income taxes and other liabilities 3,216 1,907
Commitments and contingencies (Note 15)
Redeemable preferred stock — —
Shareholders’ equity:
Common stock at stated value:
Class A convertible — 329 and 329 shares outstanding — —
Class B — 1,272 and 1,314 shares outstanding 3 3
Capital in excess of stated value 6,384 5,710
Accumulated other comprehensive loss (92) (213)
Retained earnings 3,517 6,907
Total shareholders’ equity 9,812 12,407
TOTAL LIABILITIES AND SHAREHOLDERS’ EQUITY $ 22,536 $ 23,259
The accompanying Notes to the Consolidated Financial Statements are an integral part of this statement.
46

Table of Contents
NIKE, Inc. Consolidated Statements of Cash Flows
Year Ended May 31,
(In millions) 2018 2017 2016
Cash provided by operations:
Net income $ 1,933 $ 4,240 $ 3,760
Adjustments to reconcile net income to net cash provided by operations:
Depreciation 747 706 649
Deferred income taxes 647 (273) (80)
Stock-based compensation 218 215 236
Amortization and other 27 10 13
Net foreign currency adjustments (99) (117) 98
Changes in certain working capital components and other assets and liabilities:
Decrease (increase) in accounts receivable 187 (426) 60
(Increase) in inventories (255) (231) (590)
Decrease (increase) in prepaid expenses and other current and non-current assets 35 (120) (161)
Increase (decrease) in accounts payable, accrued liabilities and other current and non-current liabilities 1,515 (158) (586)
Cash provided by operations 4,955 3,846 3,399
Cash provided (used) by investing activities:
Purchases of short-term investments (4,783) (5,928) (5,367)
Maturities of short-term investments 3,613 3,623 2,924
Sales of short-term investments 2,496 2,423 2,386
Investments in reverse repurchase agreements — — 150
Additions to property, plant and equipment (1,028) (1,105) (1,143)
Disposals of property, plant and equipment 3 13 10
Other investing activities (25) (34) 6
Cash provided (used) by investing activities 276 (1,008) (1,034)
Cash used by financing activities:
Net proceeds from long-term debt issuance — 1,482 981
Long-term debt payments, including current portion (6) (44) (106)
Increase (decrease) in notes payable 13 327 (67)
Payments on capital lease and other financing obligations (23) (17) (7)
Proceeds from exercise of stock options and other stock issuances 733 489 507
Repurchase of common stock (4,254) (3,223) (3,238)
Dividends — common and preferred (1,243) (1,133) (1,022)
Tax payments for net share settlement of equity awards (55) (29) (22)
Cash used by financing activities (4,835) (2,148) (2,974)
Effect of exchange rate changes on cash and equivalents 45 (20) (105)
Net increase (decrease) in cash and equivalents 441 670 (714)
Cash and equivalents, beginning of year 3,808 3,138 3,852
CASH AND EQUIVALENTS, END OF YEAR $ 4,249 $ 3,808 $ 3,138
Supplemental disclosure of cash flow information:
Cash paid during the year for:
Interest, net of capitalized interest $ 125 $ 98 $ 70
Income taxes 529 703 748
Non-cash additions to property, plant and equipment 294 266 252
Dividends declared and not paid 320 300 271
The accompanying Notes to the Consolidated Financial Statements are an integral part of this statement.
47

Table of Contents
NIKE, Inc. Consolidated Statements of Shareholders’ Equity
Common Stock Capital inExcess
of StatedValue
AccumulatedOther
ComprehensiveIncome
RetainedEarnings Total
Class A Class B
(In millions, except per share data) Shares Amount Shares Amount
Balance at May 31, 2015 355 $ — 1,357 $ 3 $ 4,165 $ 1,246 $ 7,293 $ 12,707
Stock options exercised 22 680 680
Conversion to Class B Common Stock (2) — 2 — —
Repurchase of Class B Common Stock (55) (148) (3,090) (3,238)Dividends on common stock ($0.62 pershare) and preferred stock ($0.10 pershare) (1,053) (1,053)Issuance of shares to employees, net ofshares withheld for employee taxes 3 105 (11) 94
Stock-based compensation 236 236
Net income 3,760 3,760
Other comprehensive income (loss) (928) (928)
Balance at May 31, 2016 353 $ — 1,329 $ 3 $ 5,038 $ 318 $ 6,899 $ 12,258
Stock options exercised 17 525 525
Conversion to Class B Common Stock (24) — 24 — —
Repurchase of Class B Common Stock (60) (189) (3,060) (3,249)Dividends on common stock ($0.70 pershare) and preferred stock ($0.10 pershare) (1,159) (1,159)Issuance of shares to employees, net ofshares withheld for employee taxes 4 121 (13) 108
Stock-based compensation 215 215
Net income 4,240 4,240
Other comprehensive income (loss) (531) (531)
Balance at May 31, 2017 329 $ — 1,314 $ 3 $ 5,710 $ (213) $ 6,907 $ 12,407
Stock options exercised 24 600 600
Conversion to Class B Common Stock — — — — —
Repurchase of Class B Common Stock (70) (254) (4,013) (4,267)Dividends on common stock ($0.78 pershare) and preferred stock ($0.10 pershare) (1,265) (1,265)Issuance of shares to employees, net ofshares withheld for employee taxes 4 110 (28) 82
Stock-based compensation 218 218
Net income 1,933 1,933
Other comprehensive income (loss) 104 104Reclassifications to retained earnings inaccordance with ASU 2018-02 17 (17) —
Balance at May 31, 2018 329 $ — 1,272 $ 3 $ 6,384 $ (92) $ 3,517 $ 9,812
The accompanying Notes to the Consolidated Financial Statements are an integral part of this statement.
48

Table of Contents
Notes to Consolidated Financial Statements
Note 1 Summary of Significant Accounting Policies 50Note 2 Inventories 55Note 3 Property, Plant and Equipment 55Note 4 Identifiable Intangible Assets and Goodwill 55Note 5 Accrued Liabilities 56Note 6 Fair Value Measurements 56Note 7 Short-Term Borrowings and Credit Lines 58Note 8 Long-Term Debt 59Note 9 Income Taxes 59Note 10 Redeemable Preferred Stock 62Note 11 Common Stock and Stock-Based Compensation 62Note 12 Earnings Per Share 64Note 13 Benefit Plans 64Note 14 Accumulated Other Comprehensive Income 65Note 15 Commitments and Contingencies 66Note 16 Risk Management and Derivatives 66Note 17 Operating Segments and Related Information 69
49

Table of Contents
NOTE 1 — Summary of Significant Accounting Policies
Description of BusinessNIKE, Inc. is a worldwide leader in the design, development and worldwide marketing and selling of athletic footwear, apparel, equipment, accessories and services. NIKE, Inc.portfolio brands include the NIKE Brand, Jordan Brand, Hurley and Converse. The NIKE Brand is focused on performance athletic footwear, apparel, equipment, accessoriesand services across a wide range of sport categories, amplified with sport-inspired sportswear products carrying the Swoosh trademark, as well as other NIKE Brandtrademarks. The Jordan Brand is focused on athletic and casual footwear, apparel and accessories using the Jumpman trademark. Sales and operating results of JordanBrand products are reported within the respective NIKE Brand geographic operating segments. The Hurley brand is focused on surf and action sports and youth lifestylefootwear, apparel and accessories, using the Hurley trademark. Sales and operating results of Hurley brand products are reported within the NIKE Brand’s North Americageographic operating segment. Converse designs, distributes, markets and sells casual sneakers, apparel and accessories under the Converse, Chuck Taylor, All Star, OneStar, Star Chevron and Jack Purcell trademarks. In some markets outside the U.S., these trademarks are licensed to third parties who design, distribute, market and sell similarproducts. Operating results of the Converse brand are reported on a stand-alone basis.
Basis of ConsolidationThe Consolidated Financial Statements include the accounts of NIKE, Inc. and its subsidiaries (the “Company”). All significant intercompany transactions and balances havebeen eliminated.
On November 19, 2015, the Company announced a two -for-one split of both NIKE Class A and Class B Common Stock. The stock split was in the form of a 100 percent stockdividend payable on December 23, 2015 to shareholders of record at the close of business on December 9, 2015. Common stock began trading at the split-adjusted price onDecember 24, 2015. All share and per share amounts presented reflect the stock split.
ReclassificationsCertain prior year amounts have been reclassified to conform to fiscal 2018 presentation, including reclassified geographic operating segment data to reflect the changes in theCompany’s operating structure, which became effective on June 1, 2017. Refer to Note 17 — Operating Segments and Related Information for additional information.
During the fourth quarter of fiscal 2018, management identified a misstatement related to the historical allocation of repurchases of Class B Common stock between Capital inexcess of stated value and Retained earnings . The Company assessed the materiality of these misstatements on prior period financial statements in accordance with U.S.Securities and Exchange Commission Staff Accounting Bulletin No. 99, Materiality, codified in ASC 250, Presentation of Financial Statements, and concluded that thesemisstatements were not material to any prior annual or interim period. As such, the Company has revised the Consolidated Balance Sheets as of May 31, 2017 , and hasreduced Capital in excess of stated value by $2.9 billion and increased Retained earnings by the same amount. Within the Consolidated Statements of Shareholders’ Equity,the Company has made corresponding revisions of $2.6 billion , $0.1 billion and $0.2 billion for the periods ended May 31, 2015, 2016 and, 2017, respectively.
Revenue RecognitionWholesale revenues are recognized when title and the risks and rewards of ownership have passed to the customer, based on the terms of sale. This occurs upon shipment orupon receipt by the customer depending on the country of the sale and the agreement with the customer. Retail store revenues are recorded at the time of sale and digitalcommerce revenues are recorded upon delivery to the customer. Amounts collected from customers for sales or value added tax are recorded on a net basis. Provisions forpost-invoice sales discounts, returns and miscellaneous claims from customers are estimated and recorded as a reduction to revenue at the time of sale. Post-invoice salesdiscounts consist of contractual programs with certain customers or discretionary discounts expected to be granted to certain customers at a later date. Estimates ofdiscretionary discounts, returns and claims are based on (1) historical rates, (2) specific identification of outstanding claims and outstanding returns not yet received fromcustomers and (3) estimated discounts, returns and claims expected, but not yet finalized with customers. As of May 31, 2018 and 2017 , the Company’s reserve balances forpost-invoice sales discounts, returns and miscellaneous claims were $675 million and $643 million , respectively.
Cost of SalesCost of sales consists primarily of inventory costs, as well as warehousing costs (including the cost of warehouse labor), third-party royalties, certain foreign currency hedgegains and losses and product design costs. Outbound shipping and handling costs are expensed as incurred and included in Cost of sales .
Demand Creation ExpenseDemand creation expense consists of advertising and promotion costs, including costs of endorsement contracts, complimentary product, television, digital and printadvertising and media costs, brand events and retail brand presentation. Advertising production costs are expensed the first time an advertisement is run. Advertising mediacosts are expensed when the advertisement appears. Costs related to brand events are expensed when the event occurs. Costs related to retail brand presentation areexpensed when the presentation is complete and delivered.
A significant amount of the Company’s promotional expenses result from payments under endorsement contracts. In general, endorsement payments are expensed on astraight-line basis over the term of the contract. However, certain contract elements may be accounted for differently based upon the facts and circumstances of each individualcontract. Prepayments made under contracts are included in Prepaid expenses and other current assets or Deferred income taxes and other assets depending on the period towhich the prepayment applies.
Certain contracts provide for contingent payments to endorsers based upon specific achievements in their sports (e.g., winning a championship). The Company recordsDemand creation expense for these amounts when the endorser achieves the specific goal.
50

Table of Contents
Certain contracts provide for variable payments based upon endorsers maintaining a level of performance in their sport over an extended period of time (e.g., maintaining aspecified ranking in a sport for a year). When the Company determines payments are probable, the amounts are reported in Demand creation expense ratably over thecontract period based on the Company’s best estimate of the endorser’s performance. In these instances, to the extent actual payments to the endorser differ from theCompany’s estimate due to changes in the endorser’s performance, adjustments to Demand creation expense may be recorded in a future period.
Certain contracts provide for royalty payments to endorsers based upon a predetermined percent of sales of particular products. The Company expenses these payments inCost of sales as the related sales occur. In certain contracts, the Company offers minimum guaranteed royalty payments. For contracts the Company estimates will not meetthe minimum guaranteed amount of royalty fees through sales of product, the Company records the amount of the guaranteed payment in excess of that earned through salesof product in Demand creation expense uniformly over the contract period.
Through cooperative advertising programs, the Company reimburses customers for certain costs of advertising the Company’s products. The Company records these costs inDemand creation expense at the point in time when it is obligated to its customers for the costs. This obligation may arise prior to the related advertisement being run.
Total advertising and promotion expenses, which the Company refers to as Demand creation expense, were $3,577 million , $3,341 million and $3,278 million for the yearsended May 31, 2018 , 2017 and 2016 , respectively. Prepaid advertising and promotion expenses totaled $730 million and $558 million at May 31, 2018 and 2017 ,respectively, of which $359 million and $311 million , respectively, was recorded in Prepaid expenses and other current assets , and $371 million and $247 million ,respectively, was recorded in Deferred income taxes and other assets, depending on the period to which the prepayment applies.
Operating Overhead ExpenseOperating overhead expense consists primarily of wage and benefit-related expenses, research and development costs, as well as other administrative expenses, such asrent, depreciation and amortization, professional services, meetings and travel.
Cash and EquivalentsCash and equivalents represent cash and short-term, highly liquid investments, that are both readily convertible to known amounts of cash, and so near their maturity theypresent insignificant risk of changes in value because of changes in interest rates, including commercial paper, U.S. Treasury, U.S. Agency, money market funds, time depositsand corporate debt securities with maturities of 90 days or less at the date of purchase.
Short-Term InvestmentsShort-term investments consist of highly liquid investments, including commercial paper, U.S. Treasury, U.S. Agency, time deposits and corporate debt securities, withmaturities over 90 days at the date of purchase. Debt securities the Company has the ability and positive intent to hold to maturity are carried at amortized cost. At May 31,2018 and 2017 , the Company did not hold any short-term investments classified as trading or held-to-maturity.
At May 31, 2018 and 2017 , Short-term investments consisted of available-for-sale securities. Available-for-sale securities are recorded at fair value with unrealized gains andlosses reported, net of tax, in Accumulated other comprehensive income , unless unrealized losses are determined to be other than temporary. Realized gains and losses onthe sale of securities are determined by specific identification. The Company considers all available-for-sale securities, including those with maturity dates beyond 12 months,as available to support current operational liquidity needs and, therefore, classifies all securities with maturity dates beyond 90 days at the date of purchase as current assetswithin Short-term investments on the Consolidated Balance Sheets.
Refer to Note 6 — Fair Value Measurements for more information on the Company’s short-term investments.
Allowance for Uncollectible Accounts ReceivableAccounts receivable, net consist primarily of amounts receivable from customers. The Company makes ongoing estimates relating to the collectability of its accounts receivableand maintains an allowance for estimated losses resulting from the inability of its customers to make required payments. In determining the amount of the allowance, theCompany considers historical levels of credit losses and makes judgments about the creditworthiness of significant customers based on ongoing credit evaluations. Accountsreceivable with anticipated collection dates greater than 12 months from the balance sheet date and related allowances are considered non-current and recorded in Deferredincome taxes and other assets . The allowance for uncollectible accounts receivable was $30 million and $19 million at May 31, 2018 and 2017 , respectively.
Inventory ValuationInventories are stated at lower of cost and net realizable value, and valued on either an average or a specific identification cost basis. In some instances, we ship productdirectly from our supplier to the customer, with the related inventory and cost of sales recognized on a specific identification basis. Inventory costs primarily consist of productcost from the Company’s suppliers, as well as inbound freight, import duties, taxes, insurance and logistics and other handling fees.
Property, Plant and Equipment and DepreciationProperty, plant and equipment are recorded at cost. Depreciation is determined on a straight-line basis for land improvements, buildings and leasehold improvements over 2 to40 years and for machinery and equipment over 2 to 15 years.
Depreciation and amortization of assets used in manufacturing, warehousing and product distribution are recorded in Cost of sales . Depreciation and amortization of all otherassets are recorded in Operating overhead expense .
51

Table of Contents
Software Development CostsInternal Use Software : Expenditures for major software purchases and software developed for internal use are capitalized and amortized over a 2 to 12 -year period on astraight-line basis. The Company’s policy provides for the capitalization of external direct costs of materials and services associated with developing or obtaining internal usecomputer software. In addition, the Company also capitalizes certain payroll and payroll-related costs for employees who are directly associated with internal use computersoftware projects. The amount of capitalizable payroll costs with respect to these employees is limited to the time directly spent on such projects. Costs associated withpreliminary project stage activities, training, maintenance and all other post-implementation stage activities are expensed as incurred.
Computer Software to be Sold, Leased or Otherwise Marketed : Development costs of computer software to be sold, leased or otherwise marketed as an integral part of aproduct are subject to capitalization beginning when a product’s technological feasibility has been established and ending when a product is available for general release tocustomers. In most instances, the Company’s products are released soon after technological feasibility has been established. Therefore, software development costs incurredsubsequent to achievement of technological feasibility are usually not significant, and generally most software development costs have been expensed as incurred.
Impairment of Long-Lived AssetsThe Company reviews the carrying value of long-lived assets or asset groups to be used in operations whenever events or changes in circumstances indicate the carryingamount of the assets might not be recoverable. Factors that would necessitate an impairment assessment include a significant adverse change in the extent or manner inwhich an asset is used, a significant adverse change in legal factors or the business climate that could affect the value of the asset or a significant decline in the observablemarket value of an asset, among others. If such facts indicate a potential impairment, the Company would assess the recoverability of an asset group by determining if thecarrying value of the asset group exceeds the sum of the projected undiscounted cash flows expected to result from the use and eventual disposition of the assets over theremaining economic life of the primary asset in the asset group. If the recoverability test indicates that the carrying value of the asset group is not recoverable, the Companywill estimate the fair value of the asset group using appropriate valuation methodologies, which would typically include an estimate of discounted cash flows. Any impairmentwould be measured as the difference between the asset group’s carrying amount and its estimated fair value.
Goodwill and Indefinite-Lived Intangible AssetsThe Company performs annual impairment tests on goodwill and intangible assets with indefinite lives in the fourth quarter of each fiscal year or when events occur orcircumstances change that would, more likely than not, reduce the fair value of a reporting unit or an intangible asset with an indefinite life below its carrying value. Events orchanges in circumstances that may trigger interim impairment reviews include significant changes in business climate, operating results, planned investments in the reportingunit, planned divestitures or an expectation the carrying amount may not be recoverable, among other factors. The Company may first assess qualitative factors to determinewhether it is more likely than not the fair value of a reporting unit is less than its carrying amount. If, after assessing the totality of events and circumstances, the Companydetermines it is more likely than not the fair value of the reporting unit is greater than its carrying amount, the two-step impairment test is unnecessary. The two-stepimpairment test first requires the Company to estimate the fair value of its reporting units. If the carrying value of a reporting unit exceeds its fair value, the goodwill of thatreporting unit is potentially impaired and the Company proceeds to step two of the impairment analysis. In step two of the analysis, the Company measures and records animpairment loss equal to the excess of the carrying value of the reporting unit’s goodwill over its implied fair value, if any.
Indefinite-lived intangible assets primarily consist of acquired trade names and trademarks. The Company may first perform a qualitative assessment to determine whether it ismore likely than not an indefinite-lived intangible asset is impaired. If, after assessing the totality of events and circumstances, the C ompany determines it is more likely thannot that the indefinite-lived intangible asset is not impaired, no quantitative fair value measurement is necessary. If a quantitative fair value measurement calculation is requiredfor these intangible assets, the Company utilizes the relief-from-royalty method. This method assumes trade names and trademarks have value to the extent their owner isrelieved of the obligation to pay royalties for the benefits received from them. This method requires the Company to estimate the future revenue for the related brands, theappropriate royalty rate and the weighted average cost of capital.
Operating LeasesThe Company leases retail store space, certain distribution and warehouse facilities, office space, equipment and other non-real estate assets under operating leases.Operating lease agreements may contain rent escalation clauses, renewal options, rent holidays or certain landlord incentives, including tenant improvement allowances. Rentexpense for non-cancelable operating leases with scheduled rent increases or landlord incentives are recognized on a straight-line basis over the lease term, beginning withthe effective lease commencement date, which is generally the date in which the Company takes possession of or controls the physical use of the property. Certain leases alsoprovide for contingent rent, which is generally determined as a percent of sales in excess of specified levels. A contingent rent liability is recognized together with thecorresponding rent expense when specified levels have been achieved or when the Company determines that achieving the specified levels during the period is probable.
Fair Value MeasurementsThe Company measures certain financial assets and liabilities at fair value on a recurring basis, including derivatives and available-for-sale securities. Fair value is the price theCompany would receive to sell an asset or pay to transfer a liability in an orderly transaction with a market participant at the measurement date. The Company uses a three-level hierarchy established by the Financial Accounting Standards Board (FASB) that prioritizes fair value measurements based on the types of inputs used for the variousvaluation techniques (market approach, income approach and cost approach).
52

Table of Contents
The levels of the fair value hierarchy are described below:
• Level 1: Quoted prices in active markets for identical assets or liabilities.
• Level 2: Inputs other than observable quoted prices for the asset or liability, either directly or indirectly; these include quoted prices for similar assets or liabilities inactive markets and quoted prices for identical or similar assets or liabilities in markets that are not active.
• Level 3: Unobservable inputs with little or no market data available, which require the reporting entity to develop its own assumptions.
The Company’s assessment of the significance of a particular input to the fair value measurement in its entirety requires judgment and considers factors specific to the asset orliability. Financial assets and liabilities are classified in their entirety based on the most conservative level of input that is significant to the fair value measurement.
Pricing vendors are utilized for a majority of Level 1 and Level 2 investments. These vendors either provide a quoted market price in an active market or use observable inputswithout applying significant adjustments in their pricing. Observable inputs include broker quotes, interest rates and yield curves observable at commonly quoted intervals,volatilities and credit risks. The fair value of derivative contracts is determined using observable market inputs such as the daily market foreign currency rates, forward pricingcurves, currency volatilities, currency correlations and interest rates and considers nonperformance risk of the Company and its counterparties.
Level 1 investments include U.S. Treasury securities. Assets and liabilities included within Level 2 include commercial paper, U.S. Agency securities, money market funds, timedeposits, corporate debt securities and derivative contracts. Level 3 investments are valued using internally developed models with unobservable inputs and are an immaterialportion of our portfolio.
The Company’s fair value measurement process includes comparing fair values to another independent pricing vendor to ensure appropriate fair values are recorded.
Refer to Note 6 — Fair Value Measurements for additional information.
Foreign Currency Translation and Foreign Currency TransactionsAdjustments resulting from translating foreign functional currency financial statements into U.S. Dollars are included in the foreign currency translation adjustment, acomponent of Accumulated other comprehensive income in Total shareholders’ equity .
The Company’s global subsidiaries have various assets and liabilities, primarily receivables and payables, which are denominated in currencies other than their functionalcurrency. These balance sheet items are subject to re-measurement, the impact of which is recorded in Other expense (income), net , within the Consolidated Statements ofIncome.
Accounting for Derivatives and Hedging ActivitiesThe Company uses derivative financial instruments to reduce its exposure to changes in foreign currency exchange rates and interest rates. All derivatives are recorded at fairvalue on the Consolidated Balance Sheets and changes in the fair value of derivative financial instruments are either recognized in Accumulated other comprehensive income(a component of Total shareholders’ equity ), Long-term debt or Net income depending on the nature of the underlying exposure, whether the derivative is formally designatedas a hedge and, if designated, the extent to which the hedge is effective. The Company classifies the cash flows at settlement from derivatives in the same category as thecash flows from the related hedged items. For undesignated hedges and designated cash flow hedges, this is primarily within the Cash provided by operations component ofthe Consolidated Statements of Cash Flows. For designated net investment hedges, this is within the Cash used by investing activities component of the ConsolidatedStatements of Cash Flows. For the Company’s fair value hedges, which are interest rate swaps used to mitigate the change in fair value of its fixed-rate debt attributable tochanges in interest rates, the related cash flows from periodic interest payments are reflected within the Cash provided by operations component of the ConsolidatedStatements of Cash Flows. Refer to Note 16 — Risk Management and Derivatives for additional information on the Company’s risk management program and derivatives.
Stock-Based CompensationThe Company accounts for stock-based compensation by estimating the fair value of options and stock appreciation rights granted under the NIKE, Inc. Stock Incentive Planand employees’ purchase rights under the employee stock purchase plans (ESPPs) using the Black-Scholes option pricing model. The Company recognizes this fair value asCost of sales or Operating overhead expense , as applicable, in the Consolidated Statements of Income over the vesting period using the straight-line method.
Refer to Note 11 — Common Stock and Stock-Based Compensation for additional information on the Company’s stock-based compensation programs.
Income TaxesThe Company accounts for income taxes using the asset and liability method. This approach requires the recognition of deferred tax assets and liabilities for the expectedfuture tax consequences of temporary differences between the carrying amounts and the tax basis of assets and liabilities. The Company records a valuation allowance toreduce deferred tax assets to the amount management believes is more likely than not to be realized.
The Company recognizes a tax benefit from uncertain tax positions in the financial statements only when it is more likely than not the position will be sustained uponexamination by relevant tax authorities. The Company recognizes interest and penalties related to income tax matters in Income tax expense .
Refer to Note 9 — Income Taxes for further discussion.
53

Table of Contents
Earnings Per ShareBasic earnings per common share is calculated by dividing Net income by the weighted average number of common shares outstanding during the year. Diluted earnings percommon share is calculated by adjusting weighted average outstanding shares, assuming conversion of all potentially dilutive stock options and awards.
Refer to Note 12 — Earnings Per Share for further discussion.
Management EstimatesThe preparation of financial statements in conformity with generally accepted accounting principles requires management to make estimates, including estimates relating toassumptions that affect the reported amounts of assets and liabilities and disclosure of contingent assets and liabilities at the date of financial statements and the reportedamounts of revenues and expenses during the reporting period. Actual results could differ from these estimates.
Recently Adopted Accounting StandardsIn February 2018, the FASB issued Accounting Standards Update (ASU) No. 2018-02, Income Statement — Reporting Comprehensive Income (Topic 220): Reclassificationof Certain Tax Effects from Accumulated Other Comprehensive Income . The standard allows for reclassification of stranded tax effects on items resulting from the Tax Cutsand Jobs Act (the “Tax Act”) from Accumulated other comprehensive income to Retained earnings . Tax effects unrelated to the Tax Act are released from Accumulatedother comprehensive income using either the specific identification approach or the portfolio approach based on the nature of the underlying item.
The Company early adopted the ASU in the third quarter of fiscal 2018. As a result of the adoption, Retained earnings decreased by $17 million , with a correspondingincrease to Accumulated other comprehensive income due to the reduction in the corporate tax rate from 35% to 21%. Refer to Note 9 — Income Taxes for additionalinformation on the impact of the Tax Act.
In March 2016, the FASB issued ASU No. 2016-09, Compensation — Stock Compensation (Topic 718): Improvements to Employee Share-Based Payment Accounting ,which changes how companies account for certain aspects of share-based payment awards to employees. The Company adopted the ASU in the first quarter of fiscal 2018.The updated guidance requires excess tax benefits and deficiencies from share-based payment awards to be recorded in income tax expense in the income statement.Previously, excess tax benefits and deficiencies were recognized in shareholders’ equity on the balance sheet. This change is required to be applied prospectively. As a resultof the adoption, during fiscal 2018, the Company recognized $230 million of excess tax benefits related to share-based payment awards in Income tax expense in theConsolidated Statements of Income.
Additionally, ASU 2016-09 modified the classification of certain share-based payment activities within the statement of cash flows, which the Company applied retrospectively.As a result, for fiscal 2017 and fiscal 2016, the Company reclassified cash inflows of $177 million and $281 million , respectively, related to excess tax benefits from share-based payment awards, from Cash used by financing activities to Cash provided by operations , and reclassified cash outflows of $29 million and $22 million , for therespective periods, related to tax payments for the net settlement of share-based payment awards, from Cash provided by operations to Cash used by financing activities within the Consolidated Statements of Cash Flows.
Recently Issued Accounting StandardsIn August 2017, the FASB issued ASU No. 2017-12, Derivatives and Hedging (Topic 815): Targeted Improvements to Accounting for Hedging Activities , which expands andrefines hedge accounting for both financial and non-financial risk components, aligns the recognition and presentation of the effects of hedging instruments and hedge items inthe financial statements, and includes certain targeted improvements to ease the application of current guidance related to the assessment of hedge effectiveness. The updateto the standard is effective for the Company on June 1, 2019, with early adoption permitted in any interim period. The Company is currently evaluating the updated guidance,but does not expect the adoption to have a material impact on the Consolidated Financial Statements.
In October 2016, the FASB issued ASU No. 2016-16, Income Taxes (Topic 740): Intra-Entity Transfers of Assets Other Than Inventory . The updated guidance requirescompanies to recognize the income tax consequences of an intra-entity transfer of an asset other than inventory when the transfer occurs. Income tax effects of intra-entitytransfers of inventory will continue to be deferred until the inventory has been sold to a third party. The Company will adopt the standard on June 1, 2018, using a modifiedretrospective approach, with the cumulative effect of applying the new standard recognized in retained earnings at the date of adoption. Upon adoption, the Company willrecord a cumulative effect adjustment reducing Retained earnings , Deferred income taxes and other assets , and Prepaid expenses and other current assets by $507 million ,$422 million and $45 million , respectively, and increasing Deferred income taxes and other liabilities by $40 million .
In February 2016, the FASB issued ASU No. 2016-02, Leases (Topic 842) , which replaces existing lease accounting guidance. The new standard is intended to provideenhanced transparency and comparability by requiring lessees to record right-of-use assets and corresponding lease liabilities on the balance sheet. The new guidance willrequire the Company to continue to classify leases as either operating or financing, with classification affecting the pattern of expense recognition in the income statement. TheCompany will adopt the standard on June 1, 2019. The ASU is required to be applied using a modified retrospective approach at the beginning of the earliest period presented,with optional practical expedients. The Company continues to assess the effect the guidance will have on its existing accounting policies and the Consolidated FinancialStatements and expects there will be an increase in assets and liabilities on the Consolidated Balance Sheets at adoption due to the recording of right-of-use assets andcorresponding lease liabilities, which may be material. Refer to Note 15 — Commitments and Contingencies for information about the Company’s lease obligations.
In January 2016, the FASB issued ASU No. 2016-01, Financial Instruments — Overall (Subtopic 825-10): Recognition and Measurement of Financial Assets and FinancialLiabilities . The updated guidance enhances the reporting model for financial instruments, which includes amendments to address aspects of recognition, measurement,presentation and disclosure. The update to the standard is effective for the Company beginning June 1, 2018. The Company does not expect the adoption to have a materialimpact on the Consolidated Financial Statements.
54

Table of Contents
In May 2014, the FASB issued ASU No. 2014-09, Revenue from Contracts with Customers (Topic 606) , which replaces existing revenue recognition guidance. The updatedguidance requires companies to recognize revenue in a way that depicts the transfer of promised goods or services to customers in an amount that reflects the consideration towhich the entity expects to be entitled in exchange for those goods or services. In addition, the new standard requires reporting companies to disclose the nature, amount,timing and uncertainty of revenue and cash flows arising from contracts with customers. The Company will adopt the standard on June 1, 2018 using a modified retrospectiveapproach with the cumulative effect of initially applying the new standard recognized in retained earnings at the date of adoption.
While the Company does not expect the adoption of this standard to have a material impact on the Company’s net Revenues in the Consolidated Statements of Income,revenues for certain wholesale transactions and substantially all digital commerce sales will be recognized upon shipment rather than upon delivery to the customer.Accordingly, the Company will record a cumulative effect adjustment increasing Retained earnings by approximately $23 million on June 1, 2018.
Additionally, provisions for post-invoice sales discounts, returns and miscellaneous claims will be recognized as accrued liabilities rather than as reductions to Accountsreceivable, net ; and the estimated cost of inventory associated with the provision for sales returns will be recorded within Prepaid expenses and other current assets on theConsolidated Balance Sheets. The remaining provisions of the standard are not expected to have a material impact on the Company’s Consolidated Financial Statements.
NOTE 2 — InventoriesInventory balances of $5,261 million and $5,055 million at May 31, 2018 and 2017 , respectively, were substantially all finished goods.
NOTE 3 — Property, Plant and EquipmentProperty, plant and equipment, net included the following:
As of May 31,
(In millions) 2018 2017
Land and improvements $ 331 $ 285
Buildings 2,195 1,564
Machinery, equipment and internal-use software 4,230 3,867
Leasehold improvements 1,494 1,484
Construction in process 641 758
Total property, plant and equipment, gross 8,891 7,958
Less accumulated depreciation 4,437 3,969
TOTAL PROPERTY, PLANT AND EQUIPMENT, NET $ 4,454 $ 3,989
Capitalized interest was not material for the years ended May 31, 2018 , 2017 and 2016 .
NOTE 4 — Identifiable Intangible Assets and GoodwillIdentifiable intangible assets, net consist of indefinite-lived trademarks, which are not subject to amortization, and acquired trademarks and other intangible assets, which aresubject to amortization.
The following table summarizes the Company’s Identifiable intangible assets, net balances as of May 31, 2018 and 2017 :
As of May 31,
2018 2017
(In millions) Gross Carrying
Amount AccumulatedAmortization
Net CarryingAmount
Gross CarryingAmount
AccumulatedAmortization
Net CarryingAmount
Acquired trademarks and other $ 22 $ 18 $ 4 $ 19 $ 17 $ 2
Indefinite-lived trademarks 281 — 281 281 — 281INDENTIFIABLEINTANGIBLE ASSETS, NET $ 303 $ 18 $ 285 $ 300 $ 17 $ 283
Goodwill was $154 million and $139 million at May 31, 2018 and 2017 , respectively, of which $65 million was included in the Converse segment for both periods. Theremaining amounts were included in Global Brand Divisions for segment reporting purposes. There were no accumulated impairment balances for goodwill as of either periodend.
55

Table of Contents
NOTE 5 — Accrued LiabilitiesAccrued liabilities included the following:
As of May 31,
(In millions) 2018 2017
Compensation and benefits, excluding taxes $ 897 $ 871
Endorsement compensation 425 396
Dividends payable 320 300
Import and logistics costs 268 257
Taxes other than income taxes payable 224 196
Fair value of derivatives 184 168
Advertising and marketing 140 125
Collateral received from counterparties to hedging instruments 23 —
Other (1) 788 698
TOTAL ACCRUED LIABILITIES $ 3,269 $ 3,011(1) Other consists of various accrued expenses with no individual item accounting for more than 5% of the total Accrued liabilities balance at May 31, 2018 and 2017 .
NOTE 6 — Fair Value MeasurementsThe following tables present information about the Company’s financial assets and liabilities measured at fair value on a recurring basis as of May 31, 2018 and 2017 , andindicate the fair value hierarchy of the valuation techniques utilized by the Company to determine such fair value. Refer to Note 1 — Summary of Significant AccountingPolicies for additional detail regarding the Company’s fair value measurement methodology.
As of May 31, 2018
(In millions) Assets at Fair
Value Cash Equivalents Short-term
Investments Other Long-term
Assets
Cash $ 415 $ 415 $ — $ —
Level 1:
U.S. Treasury securities 1,178 500 678 —
Level 2:
Time deposits 925 907 18 —
U.S. Agency securities 102 100 2 —
Commercial paper and bonds 451 153 298 —
Money market funds 2,174 2,174 — —
Total level 2 3,652 3,334 318 —
Level 3:
Non-marketable preferred stock 11 — — 11
TOTAL $ 5,256 $ 4,249 $ 996 $ 11
56

Table of Contents
As of May 31, 2017
(In millions) Assets at Fair Value Cash Equivalents Short-term
Investments Other Long-term
Assets
Cash $ 505 $ 505 $ — $ —
Level 1:
U.S. Treasury securities 1,545 159 1,386 —
Level 2:
Time deposits 813 769 44 —
U.S. Agency securities 522 150 372 —
Commercial paper and bonds 820 251 569 —
Money market funds 1,974 1,974 — —
Total level 2 4,129 3,144 985 —
Level 3:
Non-marketable preferred stock 10 — — 10
TOTAL $ 6,189 $ 3,808 $ 2,371 $ 10
The Company elects to record the gross assets and liabilities of its derivative financial instruments on the Consolidated Balance Sheets. The Company’s derivative financialinstruments are subject to master netting arrangements that allow for the offset of assets and liabilities in the event of default or early termination of the contract. Any amountsof cash collateral received related to these instruments associated with the Company ’ s credit-related contingent features are recorded in Cash and equivalents and Accruedliabilities , the latter of which would further offset against the Company’s derivative asset balance (refer to Note 16 — Risk Management and Derivatives ). Any amounts ofcash collateral posted related to these instruments associated with the Company ’ s credit-related contingent features are recorded in Prepaid expenses and other currentassets , which would further offset against the Company ’ s derivative liability balance (refer to Note 16 — Risk Management and Derivatives ). Cash collateral received orposted related to the Company ’ s credit related contingent features is presented in the Cash provided by operations component of the Consolidated Statements of CashFlows. Any amounts of non-cash collateral received, such as securities, are not recorded on the Consolidated Balance Sheets pursuant to U.S. GAAP.
The following tables present information about the Company’s derivative assets and liabilities measured at fair value on a recurring basis as of May 31, 2018 and 2017 , andindicate the level in the fair value hierarchy in which the Company classifies the fair value measurement.
As of May 31, 2018 Derivative Assets Derivative Liabilities
(In millions) Assets at Fair
Value Other Current
Assets Other Long-term Assets
Liabilities atFair Value
AccruedLiabilities
Other Long-term Liabilities
Level 2:
Foreign exchange forwards and options (1) $ 389 $ 237 $ 152 $ 182 $ 182 $ —
Embedded derivatives 11 3 8 8 2 6
TOTAL $ 400 $ 240 $ 160 $ 190 $ 184 $ 6(1) If the foreign exchange derivative instruments had been netted in the Consolidated Balance Sheets, the asset and liability positions each would have been reduced by
$182 million as of May 31, 2018 . As of that date, the Company had received $23 million of cash collateral from various counterparties related to these foreign exchangederivative instruments. No amount of collateral was posted on the Company ’ s derivative liability balance as of May 31, 2018.
As of May 31, 2017 Derivative Assets Derivative Liabilities
(In millions) Assets at Fair
Value Other Current
Assets Other Long-term Assets
Liabilities atFair Value
AccruedLiabilities
Other Long-term Liabilities
Level 2:
Foreign exchange forwards and options (1) $ 231 $ 216 $ 15 $ 246 $ 166 $ 80
Embedded derivatives 10 1 9 8 2 6
TOTAL $ 241 $ 217 $ 24 $ 254 $ 168 $ 86(1) If the foreign exchange derivative instruments had been netted in the Consolidated Balance Sheets, the asset and liability positions each would have been reduced by
$187 million as of May 31, 2017 . As of that date, no amount of cash collateral had been received or posted on the derivative asset and liability balance related to theseforeign exchange derivative instruments.
57
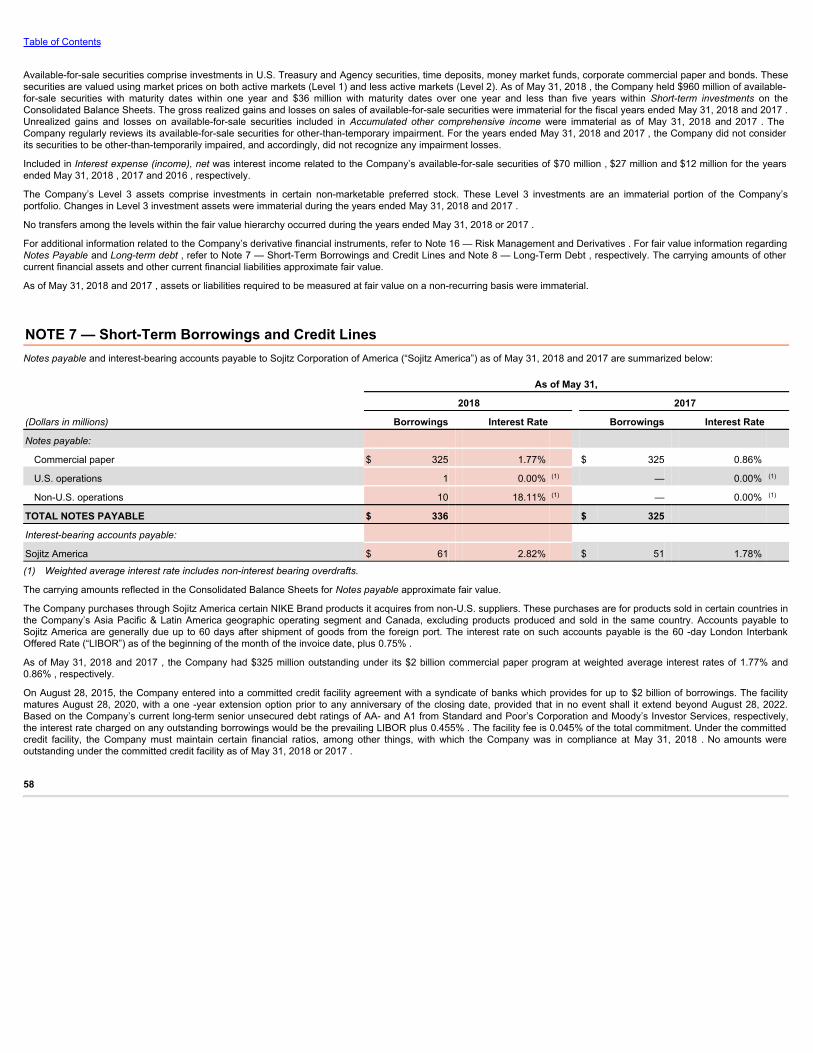
Table of Contents
Available-for-sale securities comprise investments in U.S. Treasury and Agency securities, time deposits, money market funds, corporate commercial paper and bonds. Thesesecurities are valued using market prices on both active markets (Level 1) and less active markets (Level 2). As of May 31, 2018 , the Company held $960 million of available-for-sale securities with maturity dates within one year and $36 million with maturity dates over one year and less than five years within Short-term investments on theConsolidated Balance Sheets. The gross realized gains and losses on sales of available-for-sale securities were immaterial for the fiscal years ended May 31, 2018 and 2017 .Unrealized gains and losses on available-for-sale securities included in Accumulated other comprehensive income were immaterial as of May 31, 2018 and 2017 . TheCompany regularly reviews its available-for-sale securities for other-than-temporary impairment. For the years ended May 31, 2018 and 2017 , the Company did not considerits securities to be other-than-temporarily impaired, and accordingly, did not recognize any impairment losses.
Included in Interest expense (income), net was interest income related to the Company’s available-for-sale securities of $70 million , $27 million and $12 million for the yearsended May 31, 2018 , 2017 and 2016 , respectively.
The Company’s Level 3 assets comprise investments in certain non-marketable preferred stock. These Level 3 investments are an immaterial portion of the Company’sportfolio. Changes in Level 3 investment assets were immaterial during the years ended May 31, 2018 and 2017 .
No transfers among the levels within the fair value hierarchy occurred during the years ended May 31, 2018 or 2017 .
For additional information related to the Company’s derivative financial instruments, refer to Note 16 — Risk Management and Derivatives . For fair value information regardingNotes Payable and Long-term debt , refer to Note 7 — Short-Term Borrowings and Credit Lines and Note 8 — Long-Term Debt , respectively. The carrying amounts of othercurrent financial assets and other current financial liabilities approximate fair value.
As of May 31, 2018 and 2017 , assets or liabilities required to be measured at fair value on a non-recurring basis were immaterial.
NOTE 7 — Short-Term Borrowings and Credit LinesNotes payable and interest-bearing accounts payable to Sojitz Corporation of America (“Sojitz America”) as of May 31, 2018 and 2017 are summarized below:
As of May 31,
2018 2017
(Dollars in millions) Borrowings Interest Rate Borrowings Interest Rate
Notes payable:
Commercial paper $ 325 1.77% $ 325 0.86%
U.S. operations 1 0.00% (1) — 0.00% (1)
Non-U.S. operations 10 18.11% (1) — 0.00% (1)
TOTAL NOTES PAYABLE $ 336 $ 325
Interest-bearing accounts payable:
Sojitz America $ 61 2.82% $ 51 1.78% (1) Weighted average interest rate includes non-interest bearing overdrafts.
The carrying amounts reflected in the Consolidated Balance Sheets for Notes payable approximate fair value.
The Company purchases through Sojitz America certain NIKE Brand products it acquires from non-U.S. suppliers. These purchases are for products sold in certain countries inthe Company’s Asia Pacific & Latin America geographic operating segment and Canada, excluding products produced and sold in the same country. Accounts payable toSojitz America are generally due up to 60 days after shipment of goods from the foreign port. The interest rate on such accounts payable is the 60 -day London InterbankOffered Rate (“LIBOR”) as of the beginning of the month of the invoice date, plus 0.75% .
As of May 31, 2018 and 2017 , the Company had $325 million outstanding under its $2 billion commercial paper program at weighted average interest rates of 1.77% and0.86% , respectively.
On August 28, 2015, the Company entered into a committed credit facility agreement with a syndicate of banks which provides for up to $2 billion of borrowings. The facilitymatures August 28, 2020, with a one -year extension option prior to any anniversary of the closing date, provided that in no event shall it extend beyond August 28, 2022.Based on the Company’s current long-term senior unsecured debt ratings of AA- and A1 from Standard and Poor’s Corporation and Moody’s Investor Services, respectively,the interest rate charged on any outstanding borrowings would be the prevailing LIBOR plus 0.455% . The facility fee is 0.045% of the total commitment. Under the committedcredit facility, the Company must maintain certain financial ratios, among other things, with which the Company was in compliance at May 31, 2018 . No amounts wereoutstanding under the committed credit facility as of May 31, 2018 or 2017 .
58

Table of Contents
NOTE 8 — Long-Term DebtLong-term debt , net of unamortized premiums, discounts and debt issuance costs, comprises the following :
Book Value Outstanding
as of May 31,
Scheduled Maturity (Dollars and Yen in millions) OriginalPrincipal
InterestRate
InterestPayments 2018 2017
Corporate Bond Payables: (1)(2)
May 1, 2023 $ 500 2.25% Semi-Annually $ 498 $ 497
November 1, 2026 $ 1,000 2.38% Semi-Annually 994 993
May 1, 2043 $ 500 3.63% Semi-Annually 495 495
November 1, 2045 $ 1,000 3.88% Semi-Annually 982 981
November 1, 2046 $ 500 3.38% Semi-Annually 490 490
Japanese Yen Notes: (3)
August 20, 2001 through November 20, 2020 ¥ 9,000 2.60% Quarterly 10 14
August 20, 2001 through November 20, 2020 ¥ 4,000 2.00% Quarterly 5 7
Total 3,474 3,477
Less current maturities 6 6
TOTAL LONG-TERM DEBT $ 3,468 $ 3,471(1) These senior unsecured obligations rank equally with the Company’s other unsecured and unsubordinated indebtedness.
(2) The bonds are redeemable at the Company’s option up to three months prior to the scheduled maturity date for the bonds maturing in 2023 and 2026, and up to sixmonths prior to the scheduled maturity date for the bonds maturing in 2043, 2045 and 2046, at a price equal to the greater of (i) 100% of the aggregate principal amount ofthe notes to be redeemed or (ii) the sum of the present values of the remaining scheduled payments, plus in each case, accrued and unpaid interest. Within three and sixmonths to scheduled maturity, respectively, the bonds also feature a par call provision, which allows for the bonds to be redeemed at a price equal to 100% of theaggregate principal amount of the notes being redeemed, plus accrued and unpaid interest.
(3) NIKE Logistics YK assumed a total of ¥13.0 billion in loans as part of its agreement to purchase a distribution center in Japan, which serves as collateral for the loans.These loans mature in equal quarterly installments during the period August 20, 2001 through November 20, 2020.
The scheduled maturity of Long-term debt in each of the years ending May 31, 2019 through 2023 are $6 million , $6 million , $3 million , $0 million and $500 million ,respectively, at face value.
The Company’s Long-term debt is recorded at adjusted cost, net of unamortized premiums, discounts and debt issuance costs. The fair value of Long-term debt is estimatedbased upon quoted prices for similar instruments or quoted prices for identical instruments in inactive markets (Level 2). The fair value of the Company’s Long-term debt ,including the current portion, was approximately $3,294 million at May 31, 2018 and $3,401 million at May 31, 2017 .
NOTE 9 — Income TaxesIncome before income taxes is as follows:
Year Ended May 31,
(In millions) 2018 2017 2016
Income before income taxes:
United States $ 744 $ 1,240 $ 956
Foreign 3,581 3,646 3,667
TOTAL INCOME BEFORE INCOME TAXES $ 4,325 $ 4,886 $ 4,623
59

Table of Contents
The provision for income taxes is as follows:
Year Ended May 31,
(In millions) 2018 2017 2016
Current:
United States
Federal $ 1,167 $ 398 $ 304
State 45 82 71
Foreign 533 439 568
Total 1,745 919 943
Deferred:
United States
Federal 595 (279) (57)
State 25 (9) (16)
Foreign 27 15 (7)
Total 647 (273) (80)
TOTAL INCOME TAX EXPENSE $ 2,392 $ 646 $ 863
On December 22, 2017, the United States enacted the Tax Act, which significantly changes previous U.S. tax laws, including provisions for a one-time transition tax on deemedrepatriation of undistributed foreign earnings, a reduction in the corporate tax rate from 35% to 21%, as well as other changes. Under U.S. GAAP, accounting for the effect oftax legislation is required in the period of enactment. For fiscal 2018, the change in the corporate tax rate, effective January 1, 2018, results in a blended U.S. federal statutoryrate for the Company of approximately 29% . The Tax Act also includes provisions not yet effective for the Company, including a provision to tax global intangible low-taxedincome (GILTI) of foreign subsidiaries, which will be effective for the Company beginning June 1, 2018. In accordance with U.S. GAAP, the Company has made an accountingpolicy election to treat taxes due under the GILTI provision as a current period expense.
A reconciliation from the U.S. statutory federal income tax rate to the effective income tax rate is as follows:
Year Ended May 31, 2018 2017 2016
Federal income tax rate 29.2 % 35.0 % 35.0 %
State taxes, net of federal benefit 1.2 % 1.1 % 1.1 %
Foreign earnings -18.4 % -20.7 % -18.2 %
Transition tax related to the Tax Act 43.3 % — % — %
Remeasurement of deferred tax assets and liabilities related to the Tax Act 3.7 % — % — %
Excess tax benefits from share-based compensation -5.3 % — % — %
Resolution of a U.S. tax matter — % -3.2 % — %
Other, net 1.6 % 1.0 % 0.8 %
EFFECTIVE INCOME TAX RATE 55.3 % 13.2 % 18.7 %
The effective tax rate for the year ended May 31, 2018 was higher than the effective tax rate for the year ended May 31, 2017 primarily due to the enactment of the Tax Act,which included provisional expense of $1,875 million for the one-time transition tax on the deemed repatriation of undistributed foreign earnings, and $158 million due to theremeasurement of deferred tax assets and liabilities. The remaining provisions of the Tax Act, which were a net benefit to the effective tax rate, did not have a material impacton the Company’s Consolidated Financial Statements during fiscal 2018. Additionally, the increase in the effective tax rate was partially offset by the tax benefit from share-based compensation in the current period as a result of the adoption of ASU 2016-09 in the first quarter of fiscal 2018. During the years ended May 31, 2017 and 2016, incometax benefits of $177 million and $281 million , respectively, attributable to employee share-based compensation were allocated to Total shareholders’ equity. As a result of theadoption of ASU 2016-09, beginning in fiscal 2018, income tax benefits from share-based compensation are reported in the Consolidated Statements of Income.
The effective tax rate for the year ended May 31, 2017 was 550 basis points lower than the effective tax rate for the year ended May 31, 2016 primarily due to a one-timebenefit in the first quarter of the fiscal year related to the resolution with the U.S. Internal Revenue Service (IRS) of a foreign tax credit matter and a decrease in foreignearnings taxed in the United States.
In accordance with U.S. Securities and Exchange Commission Staff Accounting Bulletin No. 118 (“SAB 118”), the provisional amounts recorded represent reasonableestimates of the effects of the Tax Act for which the analysis is not yet complete. As the Company completes its analysis of the Tax Act, including collecting, preparing andanalyzing necessary information, performing and refining calculations and obtaining additional guidance from the IRS, U.S. Treasury Department, FASB or other standardsetting and regulatory bodies on the Tax Act, it may record adjustments to the provisional amounts, which may be material. In accordance with SAB 118, the Company’saccounting for the tax effects of the Tax Act will be completed during the measurement period, which should not extend beyond one year from the enactment date. At May 31,2018, there were no provisions for which the Company was unable to record a reasonable estimate of the impact.
60

Table of Contents
Transition Tax
During the third quarter of fiscal 2018, the Company recorded a provisional expense of $2,010 million related to the one-time transition tax on the deemed repatriation ofundistributed foreign earnings. During the fourth quarter of fiscal 2018, as a result of further analysis of the provisions of the Tax Act and additional guidance, this provisionaltax expense decreased by $135 million . The transition tax is based on the Company’s estimated total post-1986 undistributed foreign earnings at a tax rate of 15.5% forforeign cash and certain other specified assets, and 8% on the remaining earnings. The Company expects to pay the transition tax in installments over an eight -year period.Accordingly, the non-current portion of the provisional expense for the transition tax of $1,078 million , net of applicable foreign tax credits the Company expects to utilize, hasbeen recorded in Deferred income taxes and other liabilities on the Consolidated Balance Sheets.
Impact of Changes in the Tax Rate
As a result of the reduction in the corporate tax rate from 35% to 21%, the Company remeasured certain deferred tax assets and liabilities based on the rates at which they areexpected to be realized. The total provisional expense recorded during the period for the remeasurement of deferred tax assets and liabilities was $158 million .
Deferred tax assets and liabilities comprise the following:
As of May 31,
(In millions) 2018 2017
Deferred tax assets:
Inventories $ 73 $ 90
Sales return reserves 104 130
Deferred compensation 250 348
Stock-based compensation 135 225
Reserves and accrued liabilities 102 88
Net operating loss carry-forwards 88 84
Foreign tax credit carry-forwards — 208
Undistributed earnings of foreign subsidiaries — 173
Other 106 106
Total deferred tax assets 858 1,452
Valuation allowance (95) (82)
Total deferred tax assets after valuation allowance 763 1,370
Deferred tax liabilities:
Foreign withholding tax on undistributed earnings of foreign subsidiaries (155) —
Property, plant and equipment (167) (254)
Intangibles (77) (90)
Other (26) (2)
Total deferred tax liabilities (425) (346)
NET DEFERRED TAX ASSET $ 338 $ 1,024
The following is a reconciliation of the changes in the gross balance of unrecognized tax benefits:
As of May 31,
(In millions) 2018 2017 2016
Unrecognized tax benefits, beginning of the period $ 461 $ 506 $ 438
Gross increases related to prior period tax positions 19 31 49
Gross decreases related to prior period tax positions (12) (163) (20)
Gross increases related to current period tax positions 249 115 81
Settlements — (12) (13)
Lapse of statute of limitations (20) (21) (17)
Changes due to currency translation 1 5 (12)
UNRECOGNIZED TAX BENEFITS, END OF THE PERIOD $ 698 $ 461 $ 506
As of May 31, 2018 , total gross unrecognized tax benefits, excluding related interest and penalties, were $698 million , $478 million of which would affect the Company’seffective tax rate if recognized in future periods.
The Company recognizes interest and penalties related to income tax matters in Income tax expense . The liability for payment of interest and penalties decreased by $14million during the year ended May 31, 2018 , decreased by $38 million during the year ended May 31, 2017 and increased by $45 million during the year ended May 31, 2016 .As of May 31, 2018 and 2017 , accrued interest and penalties related to uncertain tax positions were $157 million and $171 million , respectively (excluding federal benefit).
The Company is subject to taxation in the United States, as well as various state and foreign jurisdictions. The Company has closed all U.S. federal income tax matters throughfiscal 2014, with the exception of certain transfer pricing adjustments. The Company is currently under audit by the IRS for fiscal years 2015 and 2016.
61

Table of Contents
The Company’s major foreign jurisdictions, China and the Netherlands, have concluded substantially all income tax matters through calendar 2007 and fiscal 2012,respectively. Although the timing of resolution of audits is not certain, the Company evaluates all domestic and foreign audit issues in the aggregate, along with the expiration ofapplicable statutes of limitations, and estimates that it is reasonably possible the total gross unrecognized tax benefits could decrease by up to $163 million within the next 12months.
The Company historically provided for U.S. income taxes on the undistributed earnings of foreign subsidiaries unless they were considered indefinitely reinvested outside theUnited States. At May 31, 2017, the indefinitely reinvested earnings in foreign subsidiaries upon which United States income taxes had not been provided were approximately$12.2 billion . These undistributed foreign earnings were subject to the U.S. one-time mandatory transition tax and are eligible to be repatriated to the U.S. without additionalU.S. tax under the Tax Act. The Company has reevaluated its historic indefinite reinvestment assertion as a result of the enactment of the Tax Act and determined that anyhistorical or future undistributed earnings of foreign subsidiaries are no longer considered to be indefinitely reinvested .
A portion of the Company’s foreign operations are benefiting from a tax holiday, which is set to expire in 2021 . This tax holiday may be extended when certain conditions aremet or may be terminated early if certain conditions are not met. The tax benefit attributable to this tax holiday was $126 million , $187 million and $173 million for the fiscalyears ended May 31, 2018 , 2017 and 2016 , respectively. The benefit of the tax holiday on diluted earnings per common share was $0.08 , $0.11 and $0.10 for the fiscal yearsended May 31, 2018 , 2017 and 2016 , respectively.
Deferred tax assets at May 31, 2018 and 2017 were reduced by a valuation allowance primarily relating to tax benefits of certain entities with operating losses. There was a$13 million net increase in the valuation allowance for the year ended May 31, 2018 , compared to a $30 million net increase for the year ended May 31, 2017 and $43 millionnet increase for the year ended May 31, 2016 .
The Company no longer has recorded deferred tax assets for foreign tax credit carry-forwards; the $208 million recorded at May 31, 2017 was fully utilized to offset the impactsof transition tax.
The Company has available domestic and foreign loss carry-forwards of $289 million at May 31, 2018 . Such losses will expire as follows:
Year Ending May 31,
(In millions) 2019 2020 2021 2022 2023-2039 Indefinite Total
Net operating losses $ 1 $ 5 $ 2 $ 1 $ 91 $ 189 $ 289
NOTE 10 — Redeemable Preferred StockSojitz America is the sole owner of the Company’s authorized redeemable preferred stock, $1 par value, which is redeemable at the option of Sojitz America or the Company atpar value aggregating $0.3 million . A cumulative dividend of $0.10 per share is payable annually on May 31 and no dividends may be declared or paid on the common stock ofthe Company unless dividends on the redeemable preferred stock have been declared and paid in full. There have been no changes in the redeemable preferred stock in thethree years ended May 31, 2018 , 2017 and 2016 . As the holder of the redeemable preferred stock, Sojitz America does not have general voting rights, but does have the rightto vote as a separate class on the sale of all or substantially all of the assets of the Company and its subsidiaries, on merger, consolidation, liquidation or dissolution of theCompany, or on the sale or assignment of the NIKE trademark for athletic footwear sold in the United States. The redeemable preferred stock has been fully issued to SojitzAmerica and is not blank check preferred stock. The Company’s articles of incorporation do not permit the issuance of additional preferred stock.
NOTE 11 — Common Stock and Stock-Based CompensationThe authorized number of shares of Class A Common Stock, no par value, and Class B Common Stock, no par value, are 400 million and 2,400 million , respectively. Eachshare of Class A Common Stock is convertible into one share of Class B Common Stock. Voting rights of Class B Common Stock are limited in certain circumstances withrespect to the election of directors. There are no differences in the dividend and liquidation preferences or participation rights of the holders of Class A and Class B CommonStock. From time to time, the Company’s Board of Directors authorizes share repurchase programs for the repurchase of Class B Common Stock. The value of repurchasedshares is deducted from Total shareholders‘ equity through allocation to Capital in excess of stated value and Retained earnings .
The NIKE, Inc. Stock Incentive Plan (the “Stock Incentive Plan”) provides for the issuance of up to 718 million previously unissued shares of Class B Common Stock inconnection with equity awards granted under the Stock Incentive Plan. The Stock Incentive Plan authorizes the grant of non-statutory stock options, incentive stock options,stock appreciation rights, restricted stock, restricted stock units and performance-based awards. The exercise price for stock options and stock appreciation rights may not beless than the fair market value of the underlying shares on the date of grant. A committee of the Board of Directors administers the Stock Incentive Plan. The committee hasthe authority to determine the employees to whom awards will be made, the amount of the awards and the other terms and conditions of the awards. Substantially all stockoption grants outstanding under the Stock Incentive Plan are granted in the first quarter of each fiscal year, vest ratably over four years and expire ten years from the date ofgrant.
62

Table of Contents
The following table summarizes the Company’s total stock-based compensation expense recognized in Cost of sales or Operating overhead expense , as applicable:
Year Ended May 31,
(In millions) 2018 2017 2016
Stock options (1) $ 149 $ 145 $ 171
ESPPs 34 36 31
Restricted stock 35 34 34
TOTAL STOCK-BASED COMPENSATION EXPENSE $ 218 $ 215 $ 236(1) Expense for stock options includes the expense associated with stock appreciation rights. Accelerated stock option expense is recorded for employees eligible for
accelerated stock option vesting upon retirement. Accelerated stock option expense was $18 million , $14 million and $30 million for the years ended May 31, 2018 , 2017and 2016 , respectively.
As of May 31, 2018 , the Company had $195 million of unrecognized compensation costs from stock options, net of estimated forfeitures, to be recognized in Cost of sales orOperating overhead expense , as applicable, over a weighted average remaining period of 2.0 years.
The weighted average fair value per share of the options granted during the years ended May 31, 2018 , 2017 and 2016 , computed as of the grant date using the Black-Scholes pricing model, was $9.82 , $9.38 and $12.66 , respectively. The weighted average assumptions used to estimate these fair values are as follows:
Year Ended May 31, 2018 2017 2016
Dividend yield 1.2% 1.1% 1.0%
Expected volatility 16.4% 17.4% 23.6%
Weighted average expected life (in years) 6.0 6.0 5.8
Risk-free interest rate 2.0% 1.3% 1.7%
The Company estimates the expected volatility based on the implied volatility in market traded options on the Company’s common stock with a term greater than one year,along with other factors. The weighted average expected life of options is based on an analysis of historical and expected future exercise patterns. The interest rate is based onthe U.S. Treasury (constant maturity) risk-free rate in effect at the date of grant for periods corresponding with the expected term of the options.
The following summarizes the stock option transactions under the plan discussed above:
Shares (1) Weighted Average
Option Price (In millions)
Options outstanding May 31, 2015 116.2 $ 23.50
Exercised (22.5) 17.75
Forfeited (2.3) 39.96
Granted 20.6 56.41
Options outstanding May 31, 2016 112.0 30.38
Exercised (17.1) 20.42
Forfeited (2.3) 49.47
Granted 12.2 57.81
Options outstanding May 31, 2017 104.8 34.79
Exercised (24.1) 25.07
Forfeited (4.3) 55.31
Granted 16.8 59.08
Options outstanding May 31, 2018 93.2 $ 40.73
Options exercisable at May 31,
2016 66.5 $ 21.48
2017 67.9 26.03
2018 58.5 31.60
(1) Includes stock appreciation rights transactions.
The weighted average contractual life remaining for options outstanding and options exercisable at May 31, 2018 was 5.7 years and 4.4 years, respectively. The aggregateintrinsic value for options outstanding and exercisable at May 31, 2018 was $2,896 million and $2,352 million , respectively. The aggregate intrinsic value was the amount bywhich the market value of the underlying stock exceeded the exercise price of the options. The total intrinsic value of the options exercised during the years ended May 31,2018 , 2017 and 2016 was $889 million , $594 million and $946 million , respectively.
63
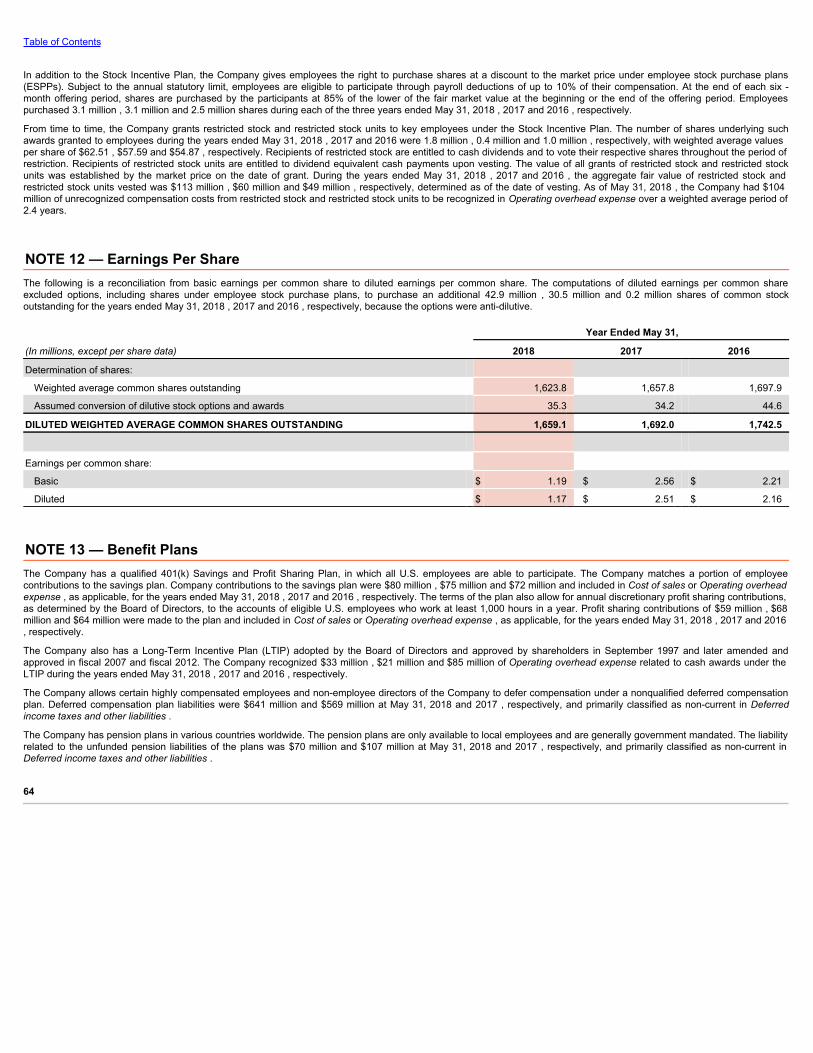
Table of Contents
In addition to the Stock Incentive Plan, the Company gives employees the right to purchase shares at a discount to the market price under employee stock purchase plans(ESPPs). Subject to the annual statutory limit, employees are eligible to participate through payroll deductions of up to 10% of their compensation. At the end of each six -month offering period, shares are purchased by the participants at 85% of the lower of the fair market value at the beginning or the end of the offering period. Employeespurchased 3.1 million , 3.1 million and 2.5 million shares during each of the three years ended May 31, 2018 , 2017 and 2016 , respectively.
From time to time, the Company grants restricted stock and restricted stock units to key employees under the Stock Incentive Plan. The number of shares underlying suchawards granted to employees during the years ended May 31, 2018 , 2017 and 2016 were 1.8 million , 0.4 million and 1.0 million , respectively, with weighted average valuesper share of $62.51 , $57.59 and $54.87 , respectively. Recipients of restricted stock are entitled to cash dividends and to vote their respective shares throughout the period ofrestriction. Recipients of restricted stock units are entitled to dividend equivalent cash payments upon vesting. The value of all grants of restricted stock and restricted stockunits was established by the market price on the date of grant. During the years ended May 31, 2018 , 2017 and 2016 , the aggregate fair value of restricted stock andrestricted stock units vested was $113 million , $60 million and $49 million , respectively, determined as of the date of vesting. As of May 31, 2018 , the Company had $104million of unrecognized compensation costs from restricted stock and restricted stock units to be recognized in Operating overhead expense over a weighted average period of2.4 years.
NOTE 12 — Earnings Per ShareThe following is a reconciliation from basic earnings per common share to diluted earnings per common share. The computations of diluted earnings per common shareexcluded options, including shares under employee stock purchase plans, to purchase an additional 42.9 million , 30.5 million and 0.2 million shares of common stockoutstanding for the years ended May 31, 2018 , 2017 and 2016 , respectively, because the options were anti-dilutive.
Year Ended May 31,
(In millions, except per share data) 2018 2017 2016
Determination of shares:
Weighted average common shares outstanding 1,623.8 1,657.8 1,697.9
Assumed conversion of dilutive stock options and awards 35.3 34.2 44.6
DILUTED WEIGHTED AVERAGE COMMON SHARES OUTSTANDING 1,659.1 1,692.0 1,742.5
Earnings per common share:
Basic $ 1.19 $ 2.56 $ 2.21
Diluted $ 1.17 $ 2.51 $ 2.16
NOTE 13 — Benefit PlansThe Company has a qualified 401(k) Savings and Profit Sharing Plan, in which all U.S. employees are able to participate. The Company matches a portion of employeecontributions to the savings plan. Company contributions to the savings plan were $80 million , $75 million and $72 million and included in Cost of sales or Operating overheadexpense , as applicable, for the years ended May 31, 2018 , 2017 and 2016 , respectively. The terms of the plan also allow for annual discretionary profit sharing contributions,as determined by the Board of Directors, to the accounts of eligible U.S. employees who work at least 1,000 hours in a year. Profit sharing contributions of $59 million , $68million and $64 million were made to the plan and included in Cost of sales or Operating overhead expense , as applicable, for the years ended May 31, 2018 , 2017 and 2016, respectively.
The Company also has a Long-Term Incentive Plan (LTIP) adopted by the Board of Directors and approved by shareholders in September 1997 and later amended andapproved in fiscal 2007 and fiscal 2012. The Company recognized $33 million , $21 million and $85 million of Operating overhead expense related to cash awards under theLTIP during the years ended May 31, 2018 , 2017 and 2016 , respectively.
The Company allows certain highly compensated employees and non-employee directors of the Company to defer compensation under a nonqualified deferred compensationplan. Deferred compensation plan liabilities were $641 million and $569 million at May 31, 2018 and 2017 , respectively, and primarily classified as non-current in Deferredincome taxes and other liabilities .
The Company has pension plans in various countries worldwide. The pension plans are only available to local employees and are generally government mandated. The liabilityrelated to the unfunded pension liabilities of the plans was $70 million and $107 million at May 31, 2018 and 2017 , respectively, and primarily classified as non-current inDeferred income taxes and other liabilities .
64
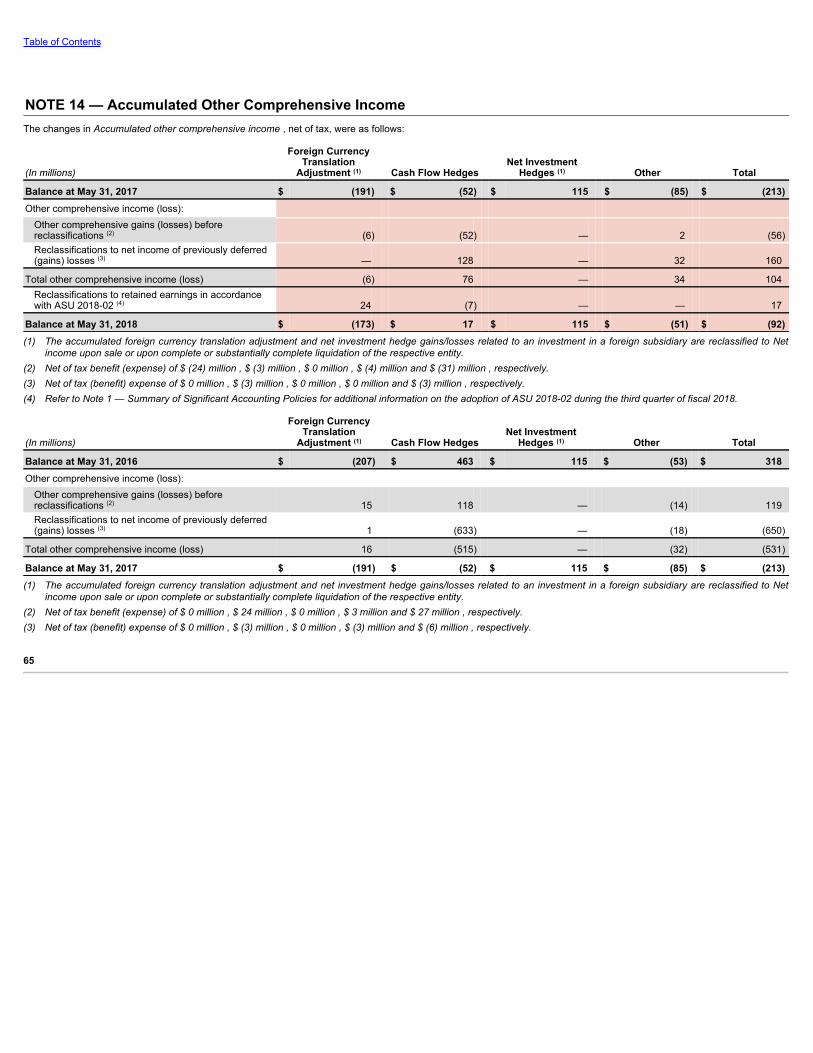
Table of Contents
NOTE 14 — Accumulated Other Comprehensive IncomeThe changes in Accumulated other comprehensive income , net of tax, were as follows:
(In millions)
Foreign CurrencyTranslation
Adjustment (1) Cash Flow Hedges Net Investment
Hedges (1) Other Total
Balance at May 31, 2017 $ (191) $ (52) $ 115 $ (85) $ (213)Other comprehensive income (loss):
Other comprehensive gains (losses) beforereclassifications (2) (6) (52) — 2 (56)Reclassifications to net income of previously deferred(gains) losses (3) — 128 — 32 160
Total other comprehensive income (loss) (6) 76 — 34 104Reclassifications to retained earnings in accordancewith ASU 2018-02 (4) 24 (7) — — 17
Balance at May 31, 2018 $ (173) $ 17 $ 115 $ (51) $ (92)(1) The accumulated foreign currency translation adjustment and net investment hedge gains/losses related to an investment in a foreign subsidiary are reclassified to Net
income upon sale or upon complete or substantially complete liquidation of the respective entity.(2) Net of tax benefit (expense) of $ (24) million , $ (3) million , $ 0 million , $ (4) million and $ (31) million , respectively.(3) Net of tax (benefit) expense of $ 0 million , $ (3) million , $ 0 million , $ 0 million and $ (3) million , respectively.(4) Refer to Note 1 — Summary of Significant Accounting Policies for additional information on the adoption of ASU 2018-02 during the third quarter of fiscal 2018.
(In millions)
Foreign CurrencyTranslation
Adjustment (1) Cash Flow Hedges Net Investment
Hedges (1) Other Total
Balance at May 31, 2016 $ (207) $ 463 $ 115 $ (53) $ 318Other comprehensive income (loss):
Other comprehensive gains (losses) beforereclassifications (2) 15 118 — (14) 119Reclassifications to net income of previously deferred(gains) losses (3) 1 (633) — (18) (650)
Total other comprehensive income (loss) 16 (515) — (32) (531)
Balance at May 31, 2017 $ (191) $ (52) $ 115 $ (85) $ (213)(1) The accumulated foreign currency translation adjustment and net investment hedge gains/losses related to an investment in a foreign subsidiary are reclassified to Net
income upon sale or upon complete or substantially complete liquidation of the respective entity.(2) Net of tax benefit (expense) of $ 0 million , $ 24 million , $ 0 million , $ 3 million and $ 27 million , respectively.(3) Net of tax (benefit) expense of $ 0 million , $ (3) million , $ 0 million , $ (3) million and $ (6) million , respectively.
65

Table of Contents
The following table summarizes the reclassifications from Accumulated other comprehensive income to the Consolidated Statements of Income:
Amount of Gain (Loss) Reclassified from Accumulated Other
Comprehensive Income into IncomeLocation of Gain (Loss) Reclassified
from Accumulated OtherComprehensive Income into Income
Year Ended May 31,
(In millions) 2018 2017Gains (losses) on foreign currency translationadjustment $ — $ (1) Other expense (income), net
Total before tax — (1)
Tax (expense) benefit — —
Gain (loss) net of tax — (1)
Gains (losses) on cash flow hedges:
Foreign exchange forwards and options 34 96 Revenues
Foreign exchange forwards and options (90) 339 Cost of sales
Foreign exchange forwards and options 1 —Total selling and administrative
expense
Foreign exchange forwards and options (69) 199 Other expense (income), net
Interest rate swaps (7) (4) Interest expense (income), net
Total before tax (131) 630
Tax (expense) benefit 3 3
Gain (loss) net of tax (128) 633
Gains (losses) on other (32) 15 Other expense (income), net
Total before tax (32) 15
Tax (expense) benefit — 3
Gain (loss) net of tax (32) 18
Total net gain (loss) reclassified for the period $ (160) $ 650
Refer to Note 16 — Risk Management and Derivatives for more information on the Company’s risk management program and derivatives.
NOTE 15 — Commitments and ContingenciesThe Company leases retail store space, certain distribution and warehouse facilities, office space, equipment and other non-real estate assets under operating leases expiringfrom 1 to 17 years after May 31, 2018 . Rent expense, excluding executory costs, was $820 million , $731 million and $661 million for the years ended May 31, 2018 , 2017and 2016 , respectively. Amounts of minimum future annual commitments under non-cancelable operating and capital leases are as follows (in millions):
2019 2020 2021 2022 2023 Thereafter Total
Operating leases $ 589 $ 523 $ 472 $ 412 $ 361 $ 1,608 $ 3,965
Capital leases and other financing obligations (1) $ 44 $ 37 $ 40 $ 38 $ 36 $ 229 $ 424
(1) Capital leases and other financing obligations include payments related to build-to-suit lease arrangements.
As of May 31, 2018 and 2017 , the Company had letters of credit outstanding totaling $165 million and $152 million , respectively. These letters of credit were generally issuedfor the purchase of inventory and guarantees of the Company’s performance under certain self-insurance and other programs.
In connection with various contracts and agreements, the Company provides routine indemnification relating to the enforceability of intellectual property rights, coverage forlegal issues that arise and other items where the Company is acting as the guarantor. Currently, the Company has several such agreements in place. However, based on theCompany’s historical experience and the estimated probability of future loss, the Company has determined the fair value of such indemnification is not material to theCompany’s financial position or results of operations.
In the ordinary course of its business, the Company is involved in various legal proceedings involving contractual and employment relationships, product liability claims,trademark rights and a variety of other matters. While the Company cannot predict the outcome of its pending legal matters with certainty, the Company does not believe anycurrently identified claim, proceeding or litigation, either individually or in aggregate, will have a material impact on the Company’s results of operations, financial position orcash flows.
NOTE 16 — Risk Management and DerivativesThe Company is exposed to global market risks, including the effect of changes in foreign currency exchange rates and interest rates, and uses derivatives to manage financialexposures that occur in the normal course of business. The Company does not hold or issue derivatives for trading or speculative purposes.
The Company may elect to designate certain derivatives as hedging instruments under the accounting standards for derivatives and hedging. The Company formallydocuments all relationships between designated hedging instruments and hedged items as well as its risk management objectives and strategies for undertaking hedgetransactions. This process includes linking all derivatives designated as hedges to either recognized assets or liabilities or forecasted transactions.
66

Table of Contents
The majority of derivatives outstanding as of May 31, 2018 are designated as foreign currency cash flow hedges, primarily for Euro/U.S. Dollar, British Pound/Euro andJapanese Yen/U.S. Dollar currency pairs . All derivatives are recognized on the Consolidated Balance Sheets at fair value and classified based on the instrument’s maturitydate.
The following table presents the fair values of derivative instruments included within the Consolidated Balance Sheets as of May 31, 2018 and 2017 :
Derivative Assets Derivative Liabilities
(In millions) Balance Sheet
Location 2018 2017 Balance Sheet
Location 2018 2017Derivatives formally designated ashedging instruments:
Foreign exchange forwards andoptions
Prepaid expenses and othercurrent assets $ 118 $ 113 Accrued liabilities $ 156 $ 59
Foreign exchange forwards andoptions
Deferred income taxes and otherassets 152 13
Deferred income taxes and otherliabilities — 73
Total derivatives formally designatedas hedging instruments 270 126 156 132Derivatives not designated ashedging instruments:
Foreign exchange forwards andoptions
Prepaid expenses and othercurrent assets 119 103 Accrued liabilities 26 107
Embedded derivatives Prepaid expenses and other
current assets 3 1 Accrued liabilities 2 2Foreign exchange forwards andoptions
Deferred income taxes and otherassets — 2
Deferred income taxes and otherliabilities — 7
Embedded derivatives Deferred income taxes and other
assets 8 9 Deferred income taxes and other
liabilities 6 6Total derivatives not designated ashedging instruments 130 115 34 122
TOTAL DERIVATIVES $ 400 $ 241 $ 190 $ 254
The following tables present the amounts affecting the Consolidated Statements of Income for the years ended May 31, 2018 , 2017 and 2016 :
(In millions)
Amount of Gain (Loss)Recognized in Other
Comprehensive Incomeon Derivatives (1)
Amount of Gain (Loss)Reclassified from Accumulated
Other Comprehensive Income into Income (1)
Year Ended May 31, Location of Gain (Loss) Reclassified From Accumulated Other Comprehensive Income
into Income
Year Ended May 31,
2018 2017 2016 2018 2017 2016
Derivatives designated as cash flow hedges:
Foreign exchange forwards and options $ 19 $ 72 $ 90 Revenues $ 34 $ 96 $ (88)
Foreign exchange forwards and options (50) 43 (57) Cost of sales (90) 339 586Foreign exchange forwards and options 1 (4) — Total selling and administrative expense 1 — —
Foreign exchange forwards and options (19) 37 (25) Other expense (income), net (69) 199 219
Interest rate swaps (2) — (54) (83) Interest expense (income), net (7) (4) —
Total designated cash flow hedges $ (49) $ 94 $ (75) $ (131) $ 630 $ 717
(1) For the years ended May 31, 2018 , 2017 and 2016 , the amounts recorded in Other expense (income), net as a result of hedge ineffectiveness and the discontinuance ofcash flow hedges because the forecasted transactions were no longer probable of occurring were immaterial.
(2) Gains and losses associated with terminated interest rate swaps, which were previously designated as cash flow hedges and recorded in Accumulated othercomprehensive income, will be released through Interest expense (income), net over the term of the issued debt.
67
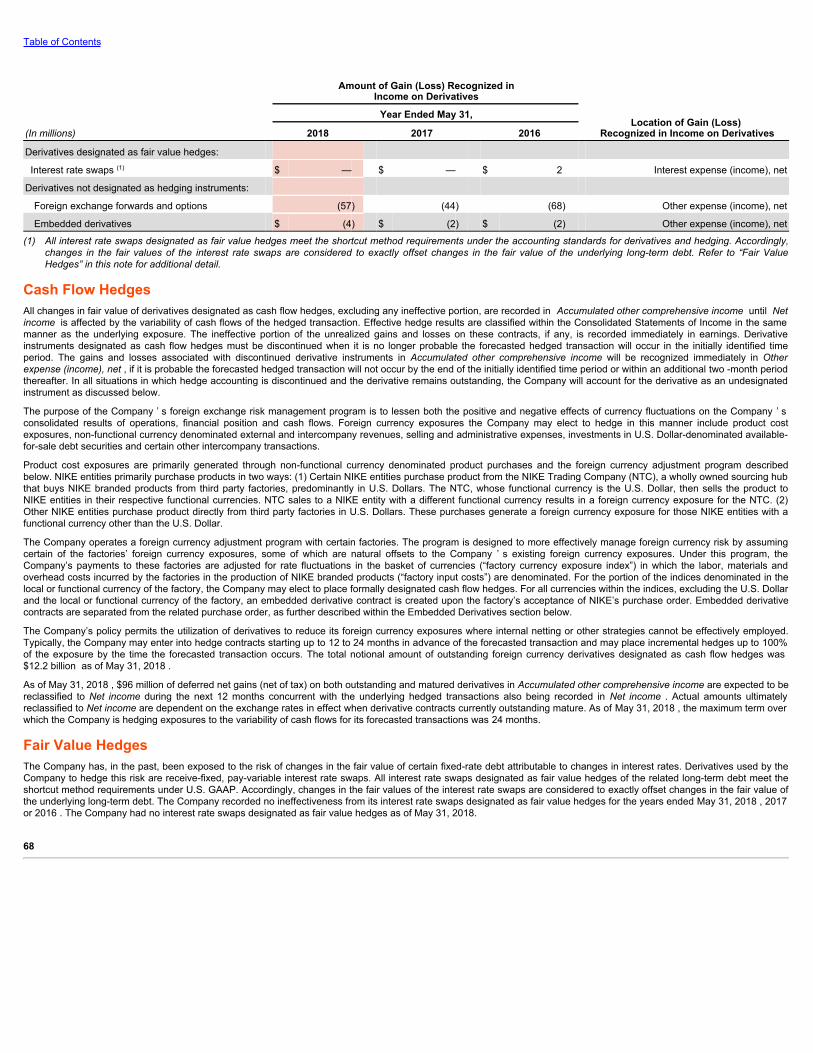
Table of Contents
Amount of Gain (Loss) Recognized in
Income on Derivatives
Location of Gain (Loss) Recognized in Income on Derivatives
Year Ended May 31,
(In millions) 2018 2017 2016
Derivatives designated as fair value hedges:
Interest rate swaps (1) $ — $ — $ 2 Interest expense (income), net
Derivatives not designated as hedging instruments:
Foreign exchange forwards and options (57) (44) (68) Other expense (income), net
Embedded derivatives $ (4) $ (2) $ (2) Other expense (income), net
(1) All interest rate swaps designated as fair value hedges meet the shortcut method requirements under the accounting standards for derivatives and hedging. Accordingly,changes in the fair values of the interest rate swaps are considered to exactly offset changes in the fair value of the underlying long-term debt. Refer to “Fair ValueHedges” in this note for additional detail.
Cash Flow HedgesAll changes in fair value of derivatives designated as cash flow hedges, excluding any ineffective portion, are recorded in Accumulated other comprehensive income until Netincome is affected by the variability of cash flows of the hedged transaction. Effective hedge results are classified within the Consolidated Statements of Income in the samemanner as the underlying exposure. The ineffective portion of the unrealized gains and losses on these contracts, if any, is recorded immediately in earnings. Derivativeinstruments designated as cash flow hedges must be discontinued when it is no longer probable the forecasted hedged transaction will occur in the initially identified timeperiod. The gains and losses associated with discontinued derivative instruments in Accumulated other comprehensive income will be recognized immediately in Otherexpense (income), net , if it is probable the forecasted hedged transaction will not occur by the end of the initially identified time period or within an additional two -month periodthereafter. In all situations in which hedge accounting is discontinued and the derivative remains outstanding, the Company will account for the derivative as an undesignatedinstrument as discussed below.
The purpose of the Company ’ s foreign exchange risk management program is to lessen both the positive and negative effects of currency fluctuations on the Company ’ sconsolidated results of operations, financial position and cash flows. Foreign currency exposures the Company may elect to hedge in this manner include product costexposures, non-functional currency denominated external and intercompany revenues, selling and administrative expenses, investments in U.S. Dollar-denominated available-for-sale debt securities and certain other intercompany transactions.
Product cost exposures are primarily generated through non-functional currency denominated product purchases and the foreign currency adjustment program describedbelow. NIKE entities primarily purchase products in two ways: (1) Certain NIKE entities purchase product from the NIKE Trading Company (NTC), a wholly owned sourcing hubthat buys NIKE branded products from third party factories, predominantly in U.S. Dollars. The NTC, whose functional currency is the U.S. Dollar, then sells the product toNIKE entities in their respective functional currencies. NTC sales to a NIKE entity with a different functional currency results in a foreign currency exposure for the NTC. (2)Other NIKE entities purchase product directly from third party factories in U.S. Dollars. These purchases generate a foreign currency exposure for those NIKE entities with afunctional currency other than the U.S. Dollar.
The Company operates a foreign currency adjustment program with certain factories. The program is designed to more effectively manage foreign currency risk by assumingcertain of the factories’ foreign currency exposures, some of which are natural offsets to the Company ’ s existing foreign currency exposures. Under this program, theCompany’s payments to these factories are adjusted for rate fluctuations in the basket of currencies (“factory currency exposure index”) in which the labor, materials andoverhead costs incurred by the factories in the production of NIKE branded products (“factory input costs”) are denominated. For the portion of the indices denominated in thelocal or functional currency of the factory, the Company may elect to place formally designated cash flow hedges. For all currencies within the indices, excluding the U.S. Dollarand the local or functional currency of the factory, an embedded derivative contract is created upon the factory’s acceptance of NIKE’s purchase order. Embedded derivativecontracts are separated from the related purchase order, as further described within the Embedded Derivatives section below.
The Company’s policy permits the utilization of derivatives to reduce its foreign currency exposures where internal netting or other strategies cannot be effectively employed.Typically, the Company may enter into hedge contracts starting up to 12 to 24 months in advance of the forecasted transaction and may place incremental hedges up to 100%of the exposure by the time the forecasted transaction occurs. The total notional amount of outstanding foreign currency derivatives designated as cash flow hedges was $12.2 billion as of May 31, 2018 .
As of May 31, 2018 , $96 million of deferred net gains (net of tax) on both outstanding and matured derivatives in Accumulated other comprehensive income are expected to bereclassified to Net income during the next 12 months concurrent with the underlying hedged transactions also being recorded in Net income . Actual amounts ultimatelyreclassified to Net income are dependent on the exchange rates in effect when derivative contracts currently outstanding mature. As of May 31, 2018 , the maximum term overwhich the Company is hedging exposures to the variability of cash flows for its forecasted transactions was 24 months.
Fair Value HedgesThe Company has, in the past, been exposed to the risk of changes in the fair value of certain fixed-rate debt attributable to changes in interest rates. Derivatives used by theCompany to hedge this risk are receive-fixed, pay-variable interest rate swaps. All interest rate swaps designated as fair value hedges of the related long-term debt meet theshortcut method requirements under U.S. GAAP. Accordingly, changes in the fair values of the interest rate swaps are considered to exactly offset changes in the fair value ofthe underlying long-term debt. The Company recorded no ineffectiveness from its interest rate swaps designated as fair value hedges for the years ended May 31, 2018 , 2017or 2016 . The Company had no interest rate swaps designated as fair value hedges as of May 31, 2018.
68

Table of Contents
Net Investment HedgesThe Company has, in the past, hedged and may, in the future, hedge the risk of variability in foreign currency-denominated net investments in wholly-owned internationaloperations. All changes in fair value of the derivatives designated as net investment hedges, except ineffective portions, are reported in Accumulated other comprehensiveincome along with the foreign currency translation adjustments on those investments. The ineffective portion of the unrealized gains and losses on these contracts, if any, arerecorded immediately in earnings. The Company recorded no ineffectiveness from net investment hedges for the years ended May 31, 2018 , 2017 or 2016 . The Companyhad no outstanding net investment hedges as of May 31, 2018 .
Undesignated Derivative InstrumentsThe Company may elect to enter into foreign exchange forwards to mitigate the change in fair value of specific assets and liabilities on the Consolidated Balance Sheets and/orthe embedded derivative contracts. These undesignated instruments are recorded at fair value as a derivative asset or liability on the Consolidated Balance Sheets with theircorresponding change in fair value recognized in Other expense (income), net , together with the re-measurement gain or loss from the hedged balance sheet position and/orembedded derivative contract. The total notional amount of outstanding undesignated derivative instruments was $6.1 billion as of May 31, 2018 .
Embedded DerivativesAs part of the foreign currency adjustment program described above, an embedded derivative contract is created upon the factory’s acceptance of NIKE’s purchase order forcurrencies within the factory currency exposure indices that are neither the U.S. Dollar nor the local or functional currency of the factory. In addition, embedded derivativecontracts are created when the Company enters into certain other contractual agreements which have payments that are indexed to currencies that are not the functionalcurrency of either substantial party to the contracts. Embedded derivative contracts are treated as foreign currency forward contracts that are bifurcated from the relatedpurchase order and recorded at fair value as a derivative asset or liability on the Consolidated Balance Sheets with their corresponding change in fair value recognized in Other expense (income), net , through the date the foreign currency fluctuations cease to exist.
At May 31, 2018 , the total notional amount of all embedded derivatives outstanding was approximately $260 million .
Credit RiskThe Company is exposed to credit-related losses in the event of nonperformance by counterparties to hedging instruments. The counterparties to all derivative transactions aremajor financial institutions with investment grade credit ratings; however, this does not eliminate the Company’s exposure to credit risk with these institutions. This credit risk islimited to the unrealized gains in such contracts should any of these counterparties fail to perform as contracted. To manage this risk, the Company has established strictcounterparty credit guidelines that are continually monitored.
The Company’s derivative contracts contain credit risk-related contingent features designed to protect against significant deterioration in counterparties’ creditworthiness andtheir ultimate ability to settle outstanding derivative contracts in the normal course of business. The Company’s bilateral credit-related contingent features generally require theowing entity, either the Company or the derivative counterparty, to post collateral for the portion of the fair value in excess of $50 million should the fair value of outstandingderivatives per counterparty be greater than $50 million . Additionally, a certain level of decline in credit rating of either the Company or the counterparty could also triggercollateral requirements. As of May 31, 2018 , the Company was in compliance with all credit risk-related contingent features and had no derivative instruments with credit risk-related contingent features in a net liability position. Accordingly, the Company was not required to post any collateral as a result of these contingent features. Further, as of May 31, 2018 , the Company had received $23 million of cash collateral from various counterparties to its derivative contracts (refer to Note 6 — Fair Value Measurements ).The Company considers the impact of the risk of counterparty default to be immaterial .
NOTE 17 — Operating Segments and Related InformationThe Company’s operating segments are evidence of the structure of the Company’s internal organization. The NIKE Brand segments are defined by geographic regions foroperations participating in NIKE Brand sales activity.
Each NIKE Brand geographic segment operates predominantly in one industry: the design, development, marketing and selling of athletic footwear, apparel and equipment. InJune 2017, NIKE, Inc. announced a new company alignment designed to allow NIKE to better serve the consumer personally, at scale. As a result of this organizationalrealignment, the Company’s reportable operating segments for the NIKE Brand are: North America; Europe, Middle East & Africa; Greater China; and Asia Pacific & LatinAmerica, and include results for the NIKE, Jordan and Hurley brands. Certain prior year amounts have been reclassified to conform to fiscal 2018 presentation. This includesreclassified operating segment data to reflect the changes in the Company’s operating structure, which became effective June 1, 2017. These changes had no impact onpreviously reported consolidated statements of income, balance sheets, statements of cash flows or statements of shareholders’ equity.
The Company’s NIKE Direct operations are managed within each NIKE Brand geographic operating segment. Converse is also a reportable segment for the Company, andoperates in one industry: the design, marketing, licensing and selling of casual sneakers, apparel and accessories.
Global Brand Divisions is included within the NIKE Brand for presentation purposes to align with the way management views the Company. Global Brand Divisions primarilyrepresents NIKE Brand licensing businesses that are not part of a geographic operating segment, and demand creation, operating overhead and product creation and designexpenses that are centrally managed for the NIKE Brand.
Corporate consists largely of unallocated general and administrative expenses, including expenses associated with centrally managed departments; depreciation andamortization related to the Company’s headquarters; unallocated insurance, benefit and compensation programs, including stock-based compensation; and certain foreigncurrency gains and losses, including certain hedge gains and losses.
69

Table of Contents
The primary financial measure used by the Company to evaluate performance of individual operating segments is earnings before interest and taxes (commonly referred to as“EBIT”), which represents Net income before Interest expense (income), net and Income tax expense in the Consolidated Statements of Income.
As part of the Company’s centrally managed foreign exchange risk management program, standard foreign currency rates are assigned twice per year to each NIKE Brandentity in the Company’s geographic operating segments and to Converse. These rates are set approximately nine and twelve months in advance of the future selling seasonsto which they relate (specifically, for each currency, one standard rate applies to the fall and holiday selling seasons and one standard rate applies to the spring and summerselling seasons) based on average market spot rates in the calendar month preceding the date they are established. Inventories and Cost of sales for geographic operatingsegments and Converse reflect the use of these standard rates to record non-functional currency product purchases in the entity’s functional currency. Differences betweenassigned standard foreign currency rates and actual market rates are included in Corporate, together with foreign currency hedge gains and losses generated from theCompany’s centrally managed foreign exchange risk management program and other conversion gains and losses.
Accounts receivable, net , Inventories and Property, plant and equipment, net for operating segments are regularly reviewed by management and, therefore, are providedbelow. Additions to long-lived assets as presented in the following table represent capital expenditures.
70

Table of Contents
Year Ended May 31,
(In millions) 2018 2017 2016
REVENUES
North America $ 14,855 $ 15,216 $ 14,764
Europe, Middle East & Africa 9,242 7,970 7,568
Greater China 5,134 4,237 3,785
Asia Pacific & Latin America 5,166 4,737 4,317
Global Brand Divisions 88 73 73
Total NIKE Brand 34,485 32,233 30,507
Converse 1,886 2,042 1,955
Corporate 26 75 (86)
TOTAL NIKE, INC. REVENUES $ 36,397 $ 34,350 $ 32,376
EARNINGS BEFORE INTEREST AND TAXES
North America $ 3,600 $ 3,875 $ 3,763
Europe, Middle East & Africa 1,587 1,507 1,787
Greater China 1,807 1,507 1,372
Asia Pacific & Latin America 1,189 980 1,002
Global Brand Divisions (2,658) (2,677) (2,596)
Total NIKE Brand 5,525 5,192 5,328
Converse 310 477 487
Corporate (1,456) (724) (1,173)
Total NIKE, Inc. Earnings Before Interest and Taxes 4,379 4,945 4,642
Interest expense (income), net 54 59 19
TOTAL NIKE, INC. INCOME BEFORE INCOME TAXES $ 4,325 $ 4,886 $ 4,623
ADDITIONS TO LONG-LIVED ASSETS
North America $ 196 $ 223 $ 242
Europe, Middle East & Africa 240 173 234
Greater China 76 51 44
Asia Pacific & Latin America 49 59 62
Global Brand Divisions 286 278 258
Total NIKE Brand 847 784 840
Converse 22 30 39
Corporate 325 387 312
TOTAL ADDITIONS TO LONG-LIVED ASSETS $ 1,194 $ 1,201 $ 1,191
DEPRECIATION
North America $ 160 $ 140 $ 133
Europe, Middle East & Africa 116 106 85
Greater China 56 54 48
Asia Pacific & Latin America 55 54 42
Global Brand Divisions 217 233 230
Total NIKE Brand 604 587 538
Converse 33 28 27
Corporate 110 91 84
TOTAL DEPRECIATION $ 747 $ 706 $ 649
71

Table of Contents
As of May 31,
(In millions) 2018 2017
ACCOUNTS RECEIVABLE, NET
North America $ 1,443 $ 1,798
Europe, Middle East & Africa 870 690
Greater China 101 102
Asia Pacific & Latin America 720 693
Global Brand Divisions 102 86
Total NIKE Brand 3,236 3,369
Converse 240 297
Corporate 22 11
TOTAL ACCOUNTS RECEIVABLE, NET $ 3,498 $ 3,677
INVENTORIES
North America $ 2,270 $ 2,218
Europe, Middle East & Africa 1,433 1,327
Greater China 580 463
Asia Pacific & Latin America 687 694
Global Brand Divisions 91 68
Total NIKE Brand 5,061 4,770
Converse 268 286
Corporate (68) (1)
TOTAL INVENTORIES $ 5,261 $ 5,055
PROPERTY, PLANT AND EQUIPMENT, NET
North America $ 848 $ 819
Europe, Middle East & Africa 849 709
Greater China 256 225
Asia Pacific & Latin America 339 340
Global Brand Divisions 597 533
Total NIKE Brand 2,889 2,626
Converse 115 125
Corporate 1,450 1,238
TOTAL PROPERTY, PLANT AND EQUIPMENT, NET $ 4,454 $ 3,989
Revenues by Major Product Lines Revenues from external customers for NIKE Brand products are attributable to sales of footwear, apparel and equipment. Other revenues from external customers consistprimarily of sales by Converse.
Year Ended May 31,
(In millions) 2018 2017 2016
Footwear $ 22,268 $ 21,081 $ 19,871
Apparel 10,733 9,654 9,067
Equipment 1,396 1,425 1,496
Other 2,000 2,190 1,942
TOTAL NIKE, INC. REVENUES $ 36,397 $ 34,350 $ 32,376
Revenues and Long-Lived Assets by Geographic AreaAfter allocation of revenues for Global Brand Divisions, Converse and Corporate to geographical areas based on the location where the sales originated, revenues bygeographical area are essentially the same as reported above for the NIKE Brand operating segments with the exception of the United States. Revenues derived in the UnitedStates were $15,314 million , $15,778 million and $15,304 million for the years ended May 31, 2018 , 2017 and 2016 , respectively. The Company’s largest concentrations oflong-lived assets primarily consist of the Company’s world headquarters and distribution facilities in the United States and distribution facilities in Belgium, China and Japan.Long-lived assets attributable to operations in the United States, which are primarily composed of net property, plant & equipment, were $2,930 million and $2,629 million atMay 31, 2018 and 2017 , respectively. Long-lived assets attributable to operations in Belgium were $534 million and $390 million at May 31, 2018 and 2017 , respectively.Long-lived assets attributable to operations in China were $262 million and $232 million at May 31, 2018 and 2017 , respectively. Long-lived assets attributable to operations inJapan were $237 million and $223 million at May 31, 2018 and 2017 , respectively.
72

Table of Contents
Major CustomersNo customer accounted for 10% or more of the Company’s net revenues during the years ended May 31, 2018 , 2017 and 2016 .
ITEM 9. Changes in and Disagreements with Accountants on Accountingand Financial DisclosureThere has been no change of accountants nor any disagreements with accountants on any matter of accounting principles or practices or financial statement disclosurerequired to be reported under this Item.
ITEM 9A. Controls and ProceduresWe maintain disclosure controls and procedures designed to ensure information required to be disclosed in our Exchange Act reports is recorded, processed, summarized andreported within the time periods specified in the SEC’s rules and forms and such information is accumulated and communicated to our management, including our ChiefExecutive Officer and Chief Financial Officer, as appropriate, to allow for timely decisions regarding required disclosure. In designing and evaluating the disclosure controls andprocedures, management recognizes any controls and procedures, no matter how well designed and operated, can provide only reasonable assurance of achieving thedesired control objectives, and management is required to apply its judgment in evaluating the cost-benefit relationship of possible controls and procedures.
We carry out a variety of ongoing procedures, under the supervision and with the participation of our management, including our Chief Executive Officer and Chief FinancialOfficer, to evaluate the effectiveness of the design and operation of our disclosure controls and procedures. Based on the foregoing, our Chief Executive Officer and ChiefFinancial Officer concluded that our disclosure controls and procedures were effective at the reasonable assurance level as of May 31, 2018 .
“Management’s Annual Report on Internal Control Over Financial Reporting” is included in Item 8 of this Report.
We have continued several transformation initiatives to centralize and simplify our business processes and systems. These are long-term initiatives, which we believe willenhance our internal control over financial reporting due to increased automation and further integration of related processes. We will continue to monitor our internal controlover financial reporting for effectiveness throughout the transformation.
There have not been any other changes in our internal control over financial reporting during our most recent fiscal quarter that have materially affected, or are reasonablylikely to materially affect, our internal control over financial reporting.
ITEM 9B. Other InformationOn July 20, 2018, the Compensation Committee (the “Committee”) of the Board of Directors of NIKE, Inc. (the “Company”), approved a form of discretionary performanceaward agreement (the “DPA”) to enable the Company to award cash incentives to employees in recognition of Company and individual performance. The form of DPA isintended to enhance the Company’s ability to pay for performance on a case-by-case basis by supplementing the Company’s existing performance-based compensation plans,including the Amended and Restated Long-Term Incentive Plan (“LTIP”) and the Executive Performance Sharing Plan. The foregoing is qualified in its entirety by reference tothe form of DPA, which is filed as Exhibit 10.22 hereto and incorporated by reference herein.
Additionally, on July 20, 2018, the Committee approved awards under the form of DPA to the Company’s continuing named executive officers (collectively, the “Officers”) asfollows: Mark G. Parker, $1,295,000; Andrew Campion, $277,500; Eric D. Sprunk, $277,500; Hilary K. Krane, $185,000; and John F. Slusher, $185,000. As further described inthe Company’s 2018 Proxy Statement, the Committee adjusted the payouts for LTIP awards covering the fiscal 2016-2018 performance period to primarily account for theimpact of the Tax Cuts and Jobs Act. Because the terms of the LTIP awards, as applicable to the Company's named executive officers, did not contemplate the Tax Cuts andJobs Act, the Committee determined to award these one-time DPA grants so as to put the Officers in the same position as the non-executive officer LTIP participants.
73
Table of Contents
PART IIIITEM 10. Directors, Executive Officers and Corporate GovernanceThe information required by Item 401 of Regulation S-K regarding directors is included under “Election of Directors” in the definitive Proxy Statement for our 2018 AnnualMeeting of Shareholders and is incorporated herein by reference. The information required by Item 401 of Regulation S-K regarding executive officers is included under“Executive Officers of the Registrant” in Item 1 of this Report. The information required by Item 405 of Regulation S-K is included under “Election of Directors — Section 16(a)Beneficial Ownership Reporting Compliance” in the definitive Proxy Statement for our 2018 Annual Meeting of Shareholders and is incorporated herein by reference. Theinformation required by Item 406 of Regulation S-K is included under “Corporate Governance — Code of Business Conduct and Ethics” in the definitive Proxy Statement forour 2018 Annual Meeting of Shareholders and is incorporated herein by reference. The information required by Items 407(d)(4) and (d)(5) of Regulation S-K regarding theAudit & Finance Committee of the Board of Directors is included under “Corporate Governance — Board Committees” in the definitive Proxy Statement for our 2018 AnnualMeeting of Shareholders and is incorporated herein by reference.
ITEM 11. Executive CompensationThe information required by Items 402, 407(e)(4) and 407(e)(5) of Regulation S-K regarding executive compensation is included under “Election of Directors — DirectorCompensation for Fiscal 2018 ,” “Compensation Discussion and Analysis,” “Executive Compensation,” “Election of Directors — Compensation Committee Interlocks andInsider Participation,” and “Compensation Committee Report” in the definitive Proxy Statement for our 2018 Annual Meeting of Shareholders and is incorporated herein byreference.
ITEM 12. Security Ownership of Certain Beneficial Owners andManagement and Related Stockholder MattersThe information required by Item 201(d) of Regulation S-K is included under “Executive Compensation — Equity Compensation Plans” in the definitive Proxy Statement for our2018 Annual Meeting of Shareholders and is incorporated herein by reference. The information required by Item 403 of Regulation S-K is included under “Election of Directors— Stock Holdings of Certain Owners and Management” in the definitive Proxy Statement for our 2018 Annual Meeting of Shareholders and is incorporated herein by reference.
ITEM 13. Certain Relationships and Related Transactions and DirectorIndependenceThe information required by Items 404 and 407(a) of Regulation S-K is included under “Election of Directors — Transactions with Related Persons” and “CorporateGovernance — Director Independence” in the definitive Proxy Statement for our 2018 Annual Meeting of Shareholders and is incorporated herein by reference.
ITEM 14. Principal Accountant Fees and ServicesThe information required by Item 9(e) of Schedule 14A is included under “Ratification of Independent Registered Public Accounting Firm” in the definitive Proxy Statement forour 2018 Annual Meeting of Shareholders and is incorporated herein by reference.
74

Table of Contents
PART IVITEM 15. Exhibits and Financial Statement Schedules(a) The following documents are filed as part of this report:
Form 10-KPage No.
1. Financial Statements: Report of Independent Registered Public Accounting Firm 43
Consolidated Statements of Income for each of the three years ended May 31, 2018, May 31, 2017 andMay 31, 2016 44
Consolidated Statements of Comprehensive Income for each of the three years ended May 31, 2018,May 31, 2017 and May 31, 2016 45
Consolidated Balance Sheets at May 31, 2018 and May 31, 2017 46
Consolidated Statements of Cash Flows for each of the three years ended May 31, 2018, May 31, 2017and May 31, 2016 47
Consolidated Statements of Shareholders’ Equity for each of the three years ended May 31, 2018, May31, 2017 and May 31, 2016 48
Notes to Consolidated Financial Statements 49 2. Financial Statement Schedule: II — Valuation and Qualifying Accounts for the years ended May 31, 2018, 2017 and 2016 77
All other schedules are omitted because they are not applicable or the required information is shownin the financial statements or notes thereto.
3. Exhibits:
3.1 Restated Articles of Incorporation, as amended (incorporated by reference to Exhibit 3.1 to the Company’s Quarterly Report on Form 10-Q for the fiscal
quarter ended November 30, 2015).3.2 Fifth Restated Bylaws, as amended (incorporated by reference to Exhibit 3.2 to the Company’s Current Report on Form 8-K filed November 17, 2017).4.1 Restated Articles of Incorporation, as amended (see Exhibit 3.1).4.2 Fifth Restated Bylaws, as amended (see Exhibit 3.2).
4.3 Indenture dated as of April 26, 2013, by and between NIKE, Inc. and Deutsche Bank Trust Company Americas, as trustee (incorporated by reference toExhibit 4.1 to the Company’s Form 8-K filed April 26, 2013).
4.4 Second Supplemental Indenture, dated as of October 29, 2015, by and between NIKE, Inc. and Deutsche Bank Trust Company Americas, as trustee,including the form of 3.875% Notes due 2045 (incorporated by reference to Exhibit 4.2 to the Company’s Form 8-K filed October 29, 2015).
4.5Third Supplemental Indenture, dated as of October 21, 2016, by and between NIKE, Inc. and Deutsche Bank Trust Company Americas, as trustee, includingthe form of 2.375% Notes due 2026 and form of 3.375% Notes due 2046 (incorporated by reference to Exhibit 4.2 to the Company’s Form 8-K filed October21, 2016).
10.1 Form of Non-Statutory Stock Option Agreement for options granted to non-employee directors prior to May 31, 2010 under the 1990 Stock Incentive Plan(incorporated by reference to Exhibit 10.3 to the Company’s Current Report on Form 8-K filed June 21, 2005).*
10.2 Form of Non-Statutory Stock Option Agreement for options granted to non-employee directors after May 31, 2010 under the 1990 Stock Incentive Plan(incorporated by reference to Exhibit 10.2 to the Company’s Annual Report on Form 10-K for the fiscal year ended May 31, 2010).*
10.3 Form of Non-Statutory Stock Option Agreement for options granted to executives prior to May 31, 2010 under the 1990 Stock Incentive Plan (incorporated byreference to Exhibit 10.1 to the Company’s Annual Report on Form 10-K for the fiscal year ended May 31, 2009).*
10.4 Form of Restricted Stock Agreement for non-employee directors under the 1990 Stock Incentive Plan (incorporated by reference to Exhibit 10.4 to theCompany’s Annual Report on Form 10-K for the fiscal year ended May 31, 2014).*
10.5 Form of Non-Statutory Stock Option Agreement for options granted to executives after May 31, 2010 under the Stock Incentive Plan (incorporated byreference to Exhibit 10.1 to the Company’s Quarterly Report on Form 10-Q for the fiscal quarter ended February 28, 2018).*
75

Table of Contents
10.6 Form of Indemnity Agreement entered into between the Company and each of its officers and directors (incorporated by reference to Exhibit 10.2 to theCompany’s Annual Report on Form 10-K for the fiscal year ended May 31, 2008).*
10.7 NIKE, Inc. 1990 Stock Incentive Plan (incorporated by reference to Exhibit 10.7 to the Company’s Annual Report on Form 10-K for the fiscal year ended May31, 2014).*
10.8 NIKE, Inc. Executive Performance Sharing Plan (incorporated by reference to Exhibit 10.7 to the Company’s Annual Report on Form 10-K for the fiscal yearended May 31, 2012).*
10.9 NIKE, Inc. Long-Term Incentive Plan (incorporated by reference to Exhibit 10.9 to the Company’s Annual Report on Form 10-K for the fiscal year ended May31, 2015).*
10.10 NIKE, Inc. Deferred Compensation Plan (Amended and Restated effective April 1, 2013) (incorporated by reference to Exhibit 10.9 to the Company's AnnualReport on Form 10-K for the fiscal year ended May 31, 2013).*
10.11 NIKE, Inc. Deferred Compensation Plan (Amended and Restated effective June 1, 2004) (applicable to amounts deferred before January 1, 2005)(incorporated by reference to Exhibit 10.6 to the Company’s Annual Report on Form 10-K for the fiscal year ended May 31, 2004).*
10.12 Amendment No. 1 effective January 1, 2008 to the NIKE, Inc. Deferred Compensation Plan (June 1, 2004 Restatement) (incorporated by reference to Exhibit10.9 to the Company’s Annual Report on Form 10-K for the fiscal year ended May 31, 2009).*
10.13 NIKE, Inc. Foreign Subsidiary Employee Stock Purchase Plan (incorporated by reference to Exhibit 10.1 to the Company’s Quarterly Report on Form 10-Qfor the fiscal quarter ended November 30, 2008).*
10.14 Amended and Restated Covenant Not to Compete and Non-Disclosure Agreement between NIKE, Inc. and Mark G. Parker dated July 24, 2008(incorporated by reference to Exhibit 10.1 to the Company’s Current Report on Form 8-K filed July 24, 2008).*
10.15 Form of Restricted Stock Agreement under the Stock Incentive Plan for awards after May 31, 2010 (incorporated by reference to Exhibit 10.15 to theCompany’s Annual Report on Form 10-K for the fiscal year ended May 31, 2015).*
10.16 Form of Restricted Stock Unit Agreement under the Stock Incentive Plan (incorporated by reference to Exhibit 10.2 to the Company’s Quarterly Report onForm 10-Q for the fiscal quarter ended February 28, 2018).*
10.17 Form of Covenant Not to Compete and Non-Disclosure Agreement between NIKE, Inc. and its executive officers (other than Mark G. Parker).*
10.18 Policy for Recoupment of Incentive Compensation (incorporated by reference to Exhibit 10.3 to the Company’s Current Report on Form 8-K filed July 20,2010).*
10.19Credit Agreement dated as of August 28, 2015 among NIKE, Inc., Bank of America, N.A., as Administrative Agent, Citibank N.A., as Syndication Agent,Deutsche Bank A.G. New York Branch and HSBC Bank USA, National Association, as Co-Documentation Agents, and the other Banks named therein(incorporated by reference to Exhibit 10.1 to the Company’s Current Report on Form 8-K filed September 2, 2015).
10.20 Executive Performance Sharing Plan (incorporated by reference to Exhibit 10.1 to the Company’s Current Report on Form 8-K filed September 23, 2015).*10.21 Stock Incentive Plan, as amended (incorporated by reference to Exhibit 10.2 to the Company’s Current Report on Form 8-K filed September 23, 2015).*10.22 Form of Discretionary Performance Award Agreement.*12.1 Computation of Ratio of Earnings to Fixed Charges.21 Subsidiaries of the Registrant.23 Consent of PricewaterhouseCoopers LLP, Independent Registered Public Accounting Firm (included within this Annual Report on Form 10-K).31.1 Rule 13a-14(a)/15d-14(a) Certification of Chief Executive Officer.31.2 Rule 13a-14(a)/15d-14(a) Certification of Chief Financial Officer.32 Section 1350 Certifications.101.INS XBRL Instance Document101.SCH XBRL Taxonomy Extension Schema101.CAL XBRL Taxonomy Extension Calculation Linkbase101.DEF XBRL Taxonomy Extension Definition Document101.LAB XBRL Taxonomy Extension Label Linkbase101.PRE XBRL Taxonomy Extension Presentation Linkbase
* Management contract or compensatory plan or arrangement.
The Exhibits filed herewith do not include certain instruments with respect to long-term debt of NIKE and its subsidiaries, inasmuch as the total amount of debt authorizedunder any such instrument does not exceed 10 percent of the total assets of NIKE and its subsidiaries on a consolidated basis. NIKE agrees, pursuant to Item 601(b)(4)(iii) ofRegulation S-K, that it will furnish a copy of any such instrument to the SEC upon request.
Upon written request to Investor Relations, NIKE, Inc., One Bowerman Drive, Beaverton, Oregon 97005-6453, NIKE will furnish shareholders with a copy of any Exhibit uponpayment of $0.10 per page, which represents our reasonable expenses in furnishing Exhibits.
76

Table of Contents
SCHEDULE II — Valuation and Qualifying Accounts
(In millions) Balance at
Beginning of Period Charged to Costs
and Expenses Charged to
Other Accounts (1) Write-Offs, Net Balance at End
of Period
Sales returns reserve
For the year ended May 31, 2016 $ 379 $ 788 $ (15) $ (708) $ 444
For the year ended May 31, 2017 444 696 3 (800) 343
For the year ended May 31, 2018 343 640 5 (658) 330
Allowance for doubtful accounts (2)
For the year ended May 31, 2016 $ 78 $ 52 $ (2) $ (85) $ 43
For the year ended May 31, 2017 43 16 — (40) 19
For the year ended May 31, 2018 19 19 — (8) 30
(1) Amounts included in this column primarily relate to foreign currency translation.(2) Includes both current and non-current portions of the allowance for doubtful accounts. The non-current portion is included in Deferred income taxes and other assets on
the Consolidated Balance Sheets.
77

Table of Contents
ITEM 16. Form 10-K SummaryNone.
78

Table of Contents
Consent of Independent Registered Public Accounting Firm
We hereby consent to the incorporation by reference in the Registration Statements on Form S-3 (No. 333-212617) and Form S-8 (Nos. 033-63995, 333-63581, 333-63583,333-68864, 333-68886, 333-71660, 333-104822, 333-117059, 333-133360, 333-164248, 333-171647, 333-173727, 333-208900 and 333-215439) of NIKE, Inc. of our reportdated July 24, 2018 relating to the financial statements, financial statement schedule and the effectiveness of internal control over financial reporting, which appears in thisForm 10-K.
/s/ PricewaterhouseCoopers LLP
Portland, Oregon
July 24, 2018
79

Table of Contents
Signatures
Pursuant to the requirements of Section 13 or 15(d) of the Securities Exchange Act of 1934, the registrant has duly caused this report to be signed on its behalf by theundersigned, thereunto duly authorized.
NIKE, INC.By: /s/ MARK G. PARKER Mark G. Parker Chairman, President and Chief Executive OfficerDate: July 24, 2018
Pursuant to the requirements of the Securities Exchange Act of 1934, as amended, this report has been signed below by the following persons on behalf of the registrant andin the capacities and on the dates indicated.
Signature Title Date
PRINCIPAL EXECUTIVE OFFICER AND DIRECTOR: /s/ MARK G. PARKERMark G. Parker Chairman, President and Chief Executive Officer July 24, 2018
PRINCIPAL FINANCIAL OFFICER: /s/ ANDREW CAMPIONAndrew Campion Chief Financial Officer July 24, 2018
PRINCIPAL ACCOUNTING OFFICER: /s/ CHRIS L. ABSTONChris L. Abston Corporate Controller July 24, 2018
DIRECTORS: /s/ CATHLEEN A. BENKOCathleen A. Benko Director July 24, 2018/s/ ELIZABETH J. COMSTOCKElizabeth J. Comstock Director July 24, 2018/s/ JOHN G. CONNORSJohn G. Connors Director July 24, 2018/s/ TIMOTHY D. COOKTimothy D. Cook Director July 24, 2018/s/ JOHN J. DONAHOE IIJohn J. Donahoe II Director July 24, 2018/s/ ALAN B. GRAF, JR.Alan B. Graf, Jr. Director July 24, 2018/s/ PETER B. HENRYPeter B. Henry Director July 24, 2018/s/ TRAVIS A. KNIGHTTravis A. Knight Director July 24, 2018/s/ JOHN C. LECHLEITERJohn C. Lechleiter Director July 24, 2018/s/ MICHELLE A. PELUSOMichelle A. Peluso Director July 24, 2018/s/ JOHNATHAN A. RODGERSJohnathan A. Rodgers Director July 24, 2018/s/ JOHN R. THOMPSON, JR.John R. Thompson, Jr. Director July 24, 2018
80
EXHIBIT 10.17
Employee ID: _________________Start Date: ___________________Hiring Manager: _______________
COVENANT NOT TO COMPETEAND NON-DISCLOSURE AGREEMENT
PARTIES:
________________ (“EMPLOYEE”)
and
NIKE, Inc., and its parent, divisions, subsidiaries, affiliates, successors and assigns (“NIKE”):
RECITALS:
A. This Covenant Not to Compete and Non-Disclosure Agreement is executed upon EMPLOYEE's bona fideadvancement with NIKE and is a condition of such advancement. Employee acknowledges that he/she was informedin a written job offer at least two weeks before starting work in his/her new position that this Covenant Not to Competeand Non-Disclosure Agreement is required and is a condition of advancement.
B. Over the course of EMPLOYEE's employment with NIKE, EMPLOYEE will be or has been exposed to and/or is in aposition to develop confidential information peculiar to NIKE's business and not generally known to the public asdefined below ("Protected Information"). It is anticipated that EMPLOYEE will continue to be exposed to ProtectedInformation of greater sensitivity as EMPLOYEE advances in the company, and this Agreement will remain in effect inthe event EMPLOYEE advances and until EMPLOYEE leaves the company or it is superseded by a new writtenagreement executed by the parties.
C. The nature of NIKE's business is highly competitive, and disclosure of any Protected Information would result insevere damage to NIKE and be difficult to measure.
D. NIKE makes use of its Protected Information throughout the world. Protected information of NIKE can be used toNIKE’s detriment anywhere in the world.
AGREEMENT:
In consideration of the foregoing, and the terms and conditions set forth below, the parties agree as follows:
1. Covenant Not to Compete
(a) Competition Restriction. During EMPLOYEE’s employment at NIKE, under the terms of any employment contract orotherwise, and for one (1) year thereafter (the "Restriction Period"), EMPLOYEE will not directly or indirectly own,manage, control or participate in the ownership, management or control of, or be employed by, consult for or beconnected in any manner

with, any business engaged anywhere in the world in the athletic footwear, athletic apparel or sports equipment,sports electronics/technology and sports accessories business, or any other business that directly competes withNIKE or any of its parent, subsidiaries or affiliated corporations (a "Competitor"). This provision is subject to NIKE'soption to waive all or any portion of the Restriction Period as more specifically provided below.
(b) Extension of Time. In the event EMPLOYEE breaches this covenant not to compete, the Restriction Period shallautomatically toll from the date of the first breach, and all subsequent breaches, until the resolution of the breachthrough private settlement, judicial or other action, including all appeals. The Restriction Period shall continue uponthe effective date of any such settlement, judicial or other resolution. NIKE shall not be obligated to pay EMPLOYEEthe additional compensation described in paragraph 1.1 below during any period of time in which this Agreement istolled due to EMPLOYEE's breach. In the event EMPLOYEE receives such additional compensation after any suchbreach, EMPLOYEE must immediately reimburse NIKE in the amount of all such compensation upon the receipt of awritten request by NIKE.
(c) Waiver of Non-Compete. NIKE has the option, in its sole discretion, to elect to waive all or a portion of theRestriction Period or to limit the definition of Competitor by giving EMPLOYEE seven (7) days' prior notice of suchelection. In the event all or a portion of the Restriction Period is waived or the definition of Competitor is limited, NIKEshall not be obligated to pay EMPLOYEE for any period of time as to which the covenant not to compete has beenwaived.
(d) Additional Consideration. As additional consideration for the covenant not to compete described above, shouldNIKE terminate EMPLOYEE's employment without cause and elect to enforce the non-competition agreement, whilethe Restriction Period is in effect, NIKE shall pay EMPLOYEE a monthly payment equal to one hundred percent(100%) of EMPLOYEE's last monthly base salary. Except where prohibited by law, if NIKE terminates EMPLOYEE for"cause," no additional consideration will be owed to EMPLOYEE under this Agreement, and the covenant not tocompete will remain enforceable. For purposes of this Agreement only, "cause" shall mean (i) insubordination, (ii) actsof dishonesty, (iii) involvement in illegal activities where such involvement in illegal activities violates NIKE policies,places NIKE at risk or has or could damage NIKE's reputation in the community or any of its related or subsidiarycompanies, (iv) violation of NIKE's anti-harassment or anti-discrimination policy or (v) gross neglect of EMPLOYEE'Sduties or willful misconduct that, in either case, results in economic harm to NIKE or harm to NIKE's reputation.Nothing in this paragraph or Agreement alters the employment-at-will relationship between NIKE and EMPLOYEE.
If EMPLOYEE voluntarily terminates employment and NIKE elects to enforce the non-competition agreement, whilethe Restriction Period is in effect, NIKE shall pay EMPLOYEE a monthly payment equal to the greater of fifty percent(50%) of EMPLOYEE's last monthly base salary or the equivalent of one-twelfth (1/12) of fifty percent of the medianfamily income for a four-person family in the state where EMPLOYEE resides, as determined by the U.S. CensusBureau for the most recent year available at the time of EMPLOYEE's termination. The first payment to EMPLOYEEof additional consideration shall follow on the last business day of the month after NIKE's election to enforce the non-competition agreement. Subsequent payments during the Restriction Period shall be payable monthly on the lastbusiness day of the month in accordance with NIKE's payroll practices.
(e) Withholding and Offset. NIKE reserves the right to withhold from Additional Consideration payable to EMPLOYEEall federal, state and local taxes as shall be required, as well as any other amounts authorized or required by NIKEpolicy. NIKE reserves the right, exercisable in its sole discretion, to reduce the amount of Additional Consideration byamounts that EMPLOYEE owes NIKE, including but not limited to any payments due to NIKE in accordance

with the NIKE Tax Equalization Policy if EMPLOYEE is employed as a transferee during his or her employment withNIKE. Employee agrees that notwithstanding the amount of any withholding and/or offset, even in an amount thatreduces payments of Additional Consideration to zero dollars ($0.00), the covenant not to compete will remainenforceable. To the extent withholding or offset does not extinguish amounts that EMPLOYEE owes to NIKE,EMPLOYEE remains obligated for the balance of the amounts owed.
2. Subsequent Employer. EMPLOYEE agrees to notify NIKE at the time of separation of employment of the name ofEMPLOYEE's new employer, if known. EMPLOYEE further agrees to disclose to NIKE the name of any subsequentemployer during the Restriction Period, wherever located and regardless of whether such employer is a competitor ofNIKE.
3. Non-Disclosure Agreement
(a) Protected Information Defined. "Protected Information" shall mean all proprietary information, in whatever form andformat, of NIKE and all information provided to NIKE by third parties that NIKE is obligated to keep confidential.EMPLOYEE agrees that any and all information to which EMPLOYEE has access concerning NIKE projects andinternal NIKE information is Protected Information, whether in verbal form, machine-readable form, written or othertangible form, and whether designated as confidential or unmarked. Without limiting the foregoing, ProtectedInformation includes trade secrets and competitively sensitive business or professional information (regardless ofwhether such information constitutes a trade secret) relating to NIKE's research and development activities, itsintellectual property and the filing or pendency of patent applications, confidential techniques, methods, styles,designs, design concepts and ideas, customer and vendor lists, contract factory lists, pricing information,manufacturing plans, business and marketing plans or strategy, product development plans, product launch plans,financial information, sales information, methods of operation, manufacturing processes and methods, products andpersonnel information.
(b) Excluded Information. Notwithstanding paragraph 3(a), Protected Information excludes any information that is orbecomes part of the public domain through no act or failure to act on the part of EMPLOYEE. Specifically,EMPLOYEE shall be permitted to retain as part of his or her personal portfolio copies of EMPLOYEE's originalartwork and designs, provided EMPLOYEE presents those personal portfolio copies to his or her supervisor for reviewand approval and provided the artwork or designs have become part of the public domain. In any dispute between theparties with respect to this exclusion, the burden of proof will be on EMPLOYEE, and such proof will be by clear andconvincing evidence.
(c) Employee's Obligations. During the period of employment by NIKE and for a period of two (2) years thereafter,EMPLOYEE will hold in confidence and protect all Protected Information and will not, at any time, directly or indirectly,use any Protected Information for any purpose outside the scope of EMPLOYEE's employment with NIKE or discloseany Protected Information to any third person or organization without the prior written consent of NIKE. Specifically,but not by way of limitation, EMPLOYEE will not ever copy, transmit, reproduce, summarize, quote, publish or makeany commercial or other use whatsoever of any Protected Information without the prior written consent of NIKE.EMPLOYEE will also take reasonable security precautions and such other actions as may be necessary to ensurethat there is no use or disclosure, intentional or inadvertent, of Protected Information in violation of this Agreement.
4. Return of Protected Information. At the request of NIKE at any time, and in any event, upon termination ofemployment, EMPLOYEE shall immediately return to NIKE all Protected

Information in whatever form, including tapes, notebooks, drawings, digital files or other media containing ProtectedInformation, and all copies thereof, then in EMPLOYEE's possession or under EMPLOYEE's control.
5. Unauthorized Use. During the period of employment with NIKE and thereafter, EMPLOYEE will notify NIKE immediatelyif EMPLOYEE becomes aware of the unauthorized possession, use or knowledge of any Protected Information by anyperson employed or not employed by NIKE at the time of such possession, use or knowledge. EMPLOYEE will cooperatewith NIKE in the investigation of any such incident and will cooperate with NIKE in any litigation with third parties deemednecessary by NIKE to protect the Protected Information. NIKE shall provide reasonable reimbursement to EMPLOYEEfor each hour so engaged, and that amount shall not be diminished by operation of any payment under paragraph 1(d) ofthis Agreement.
6. Non-Solicitation/Non-Recruitment. During the term of this Agreement and for a period of one (1) year thereafter,EMPLOYEE will not directly or indirectly solicit, divert or hire away (or attempt to solicit, divert or hire away) to or forhimself or any other company or business organization any NIKE employee, whether or not such employee is a full-timeemployee or temporary employee and whether or not such employment is pursuant to a written agreement or is at will orany independent contractor working for NIKE.
7. Accounting of Profits. EMPLOYEE agrees that, if EMPLOYEE should violate any term of this Agreement, NIKE shall beentitled to an accounting and repayment of all profits, compensation, commissions, remuneration or benefits thatEMPLOYEE directly or indirectly has realized and/or may realize as a result of or in connection with any such violation(including the return of any additional consideration paid by NIKE pursuant to paragraph 1(d) above). Such remedy shallbe in addition to and not in limitation of any injunctive relief or other rights or remedies to which NIKE may be entitled atlaw or in equity.
8. General Provisions.
(a) Survival. This Agreement shall continue in effect after the termination of EMPLOYEE's employment, regardless ofthe reason for termination.
(b) Waiver. No waiver, amendment, modification or cancellation of any term or condition of this Agreement will beeffective unless executed in writing by both parties. No written waiver will excuse the performance of any act otherthan the act or acts specifically referred to therein.
(c) Severability. Each provision herein will be treated as a separate and independent clause, and unenforceability of anyone clause will in no way impact the enforceability of any other clause. Should any of the provisions in this Agreementbe found to be unreasonable or invalid by a court of competent jurisdiction, such provision will be enforceable to themaximum extent enforceable by the law of that jurisdiction.
(d) Applicable Law/Jurisdiction. This Agreement, and EMPLOYEE's employment hereunder, shall be construedaccording to the laws of the state of Oregon. EMPLOYEE further hereby submits to the jurisdiction of, and agrees thatexclusive jurisdiction over and venue for, any action or proceeding arising out of or relating to this Agreement shall liein the state and federal courts located in Oregon.
NIKE, Inc.
__________________________ _____________________________Signature Signature

___________________________ _____________________________Name Name
_________________ _____________________________Date Title
_____________________________Date

EXHIBIT 10.22
[DATE]
[NAME][ADDRESS]
Re: Performance Award
Dear [NAME],
This letter (the “ Letter”) sets forth the amount and terms of a discretionary performance award that you are receiving in recognitionof the performance of NIKE, Inc. (the “ Company”) for the period [DATE] - [DATE] and your role in delivering such performance.Effective as of the date hereof, the Company agrees as follows:
1. Performance Award . Subject to the terms and conditions set forth in this Letter, you are hereby awarded a discretionary cash award(the “ Award”) of $[AMOUNT]. Your Award will be paid (less applicable taxes required to be withheld with respect to suchpayment) in [a lump sum] [installments] on [date(s)], subject to your continued employment with the Company through the paymentdate.
2. Clawback . The Award is subject to the NIKE, Inc. Policy for Recoupment of Incentive Compensation and any applicable securities,tax and stock exchange laws, rules, regulations and requirements relating to the recoupment or clawback of incentive compensation.
3. No Right to Employment . For the avoidance of doubt, this Letter does not give you the right to be retained in the employment of theCompany or any of its subsidiaries. The Company reserves the right to terminate you at any time for any reason, notwithstanding theexistence of this Letter.
4. No Assignment . Except as otherwise required by applicable law, none of your interests, benefits, payments, claims or rights underthis Letter Agreement shall be subject in any manner to any claims of any of your creditors or beneficiaries, nor to alienation byanticipation, sale, transfer, assignment, bankruptcy, pledge, attachment, charge or encumbrance of any kind, and any attempt to takeany such action shall be null and void.
5. Applicable Law . This Letter and all rights thereunder shall be governed by and construed in accordance with the laws of the State ofOregon, without giving effect to the conflict of laws principles thereof.
Sincerely,
NIKE, Inc.
By
Name: Title:

EXHIBIT 12.1 NIKE, Inc. Computation of Ratio of Earnings to Fixed ChargesThe following disclosure reflects the Company's continuing operations:
Year Ended May 31,
(In millions) 2018 2017 2016 2015 2014
Income before income taxes $ 4,325 $ 4,886 $ 4,623 $ 4,205 $ 3,544
Capitalized interest, net of amortization (10) (8) (3) — —
Adjusted income before income taxes 4,315 4,878 4,620 4,205 3,544
Add fixed charges:
Interest expense (1)(2) 149 121 74 60 58
Interest component of leases (3) 125 102 66 59 53
Total fixed charges 274 223 140 119 111
Earnings before income taxes and fixed charges $ 4,589 $ 5,101 $ 4,760 $ 4,324 $ 3,655
Ratio of earnings to total fixed charges 16.7 22.9 34.0 36.3 32.9(1) Interest expense includes interest both expensed and capitalized and amortization of premiums, discounts and capitalized expenses related to indebtedness.(2) Interest expense does not include interest related to uncertain tax positions.(3) Represents the portion of rental expense which management believes approximates the interest component of operating leases.

SUBSIDIARIES OF THE REGISTRANT
Entity Name Jurisdiction of FormationAccelerator Studio LLC DelawareAir Manufacturing Innovation Vietnam LLC VietnamAll Star C.V. NetherlandsAmerican Converse S.L.U. SpainAmerican NIKE S.L.U. SpainA.S. Roma Merchandising S.R.L. ItalyBRS NIKE Taiwan Inc. TaiwanConverse (Asia Pacific) Limited Hong KongConverse Canada Corp. CanadaConverse Canada Holding B.V. NetherlandsConverse Deutschland GmbH GermanyConverse do Brasil Ltda. BrazilConverse Europe Limited United KingdomConverse Footwear Technical Service (Zhongshan) Co., Ltd. People’s Republic of ChinaConverse France S.A.S. FranceConverse Hong Kong Holding Company Limited Hong KongConverse Hong Kong Limited Hong KongConverse Inc. DelawareConverse Korea LLC South KoreaConverse Netherlands B.V. NetherlandsConverse Retail B.V. NetherlandsConverse Retail GmbH AustriaConverse Retail Italy S.r.l. ItalyConverse Retail (UK) Limited United KingdomConverse Sporting Goods (China) Co., Ltd. People’s Republic of ChinaConverse Trading Company B.V. NetherlandsF.C. Internazionale Merchandising s.r.l. ItalyFrench Football Merchandising S.A.S. FranceHurley 999, S.L.U. SpainHurley Australia Pty. Ltd. AustraliaHurley International LLC OregonHurley Phantom C.V. NetherlandsLATAM Comercio de Productos Esportivos Ltda. BrazilNIKE 360 Holding B.V. NetherlandsNIKE 360 Jordan with Limited Liability JordanNIKE Air Ace B.V. NetherlandsNIKE Amplify LLC DelawareNIKE Argentina S.R.L. ArgentinaNIKE Asia Holding B.V. NetherlandsNIKE Australia Pty. Ltd. AustraliaNIKE Barcelona Merchandising S.L.U SpainNIKE Blazer LLC DelawareNIKE Canada Corp. CanadaNIKE Canada Holding B.V. NetherlandsNIKE Chelsea Merchandising Limited United KingdomNIKE Chile B.V. NetherlandsNIKE China Holding HK Limited Hong KongNIKE Codrus Coöperatief U.A. Netherlands

Entity Name Jurisdiction of FormationNIKE Commercial (China) Co., Ltd. People’s Republic of ChinaNIKE CR d.o.o CroatiaNIKE Czech s.r.o. Czech RepublicNIKE de Chile Ltda. ChileNIKE de Mexico, S. de R.L. de C.V. MexicoNIKE Denmark ApS DenmarkNIKE Deutschland GmbH GermanyNIKE do Brasil Comercio e Participacoes Ltda. BrazilNIKE Europe Holding B.V. NetherlandsNIKE European Operations Netherlands B.V. NetherlandsNIKE Finance Ltd. BermudaNIKE Finland OY FinlandNIKE France S.A.S. FranceNIKE Fuel B.V. NetherlandsNIKE Fundamentals C.V. NetherlandsNIKE Galaxy Holding B.V. NetherlandsNIKE Gesellschaft m.b.H. AustriaNIKE Glide C.V. NetherlandsNIKE Global Holding B.V. NetherlandsNIKE GLOBAL SERVICES PTE. LTD. SingaporeNIKE Global Trading B.V. NetherlandsNIKE GLOBAL TRADING PTE. LTD. SingaporeNIKE Group Holding B.V. NetherlandsNIKE Hellas EPE GreeceNIKE Holding, LLC DelawareNIKE Hong Kong Limited Hong KongNIKE Hungary LLC HungaryNIKE IHM, Inc. MissouriNIKE India Holding B.V. NetherlandsNIKE India Private Limited IndiaNIKE Innovate C.V. NetherlandsNIKE International Holding B.V. NetherlandsNIKE International Holding, Inc. DelawareNIKE International LLC DelawareNIKE International Ltd. BermudaNIKE Israel Ltd. IsraelNIKE Italy S.R.L. ItalyNIKE Japan Corp. JapanNIKE Japan Group LLC JapanNIKE Korea LLC South KoreaNIKE Laser Holding B.V. NetherlandsNIKE Licenciamentos Ltda. BrazilNIKE Logistics Yugen Kaisha JapanNIKE Magista, Inc. DelawareNIKE Mercurial Corp. DelawareNIKE Mercurial Hong Kong Limited Hong KongNIKE Mercurial I Limited United KingdomNIKE Mexico Holdings, LLC DelawareNIKE New Zealand Company New ZealandNIKE Norway AS Norway

Entity Name Jurisdiction of FormationNIKE NZ Holding B.V. NetherlandsNIKE Offshore Holding B.V. NetherlandsNIKE Quantum Force C.V. NetherlandsNIKE Panama S. de R.L. PanamaNIKE Philippines, Inc. PhilippinesNIKE Poland Sp. z o.o. PolandNIKE Retail B.V. NetherlandsNIKE Retail Hellas Ltd. GreeceNIKE Retail Israel Ltd. IsraelNIKE Retail LLC RussiaNIKE Retail Poland Sp. z o.o. PolandNIKE Retail Services, Inc. OregonNIKE Retail Turkey TurkeyNIKE Roshe, Inc. DelawareNIKE Russia LLC RussiaNIKE SALES (MALAYSIA) SDN. BHD. MalaysiaNIKE Shox Ltd. IsraelNIKE SINGAPORE PTE. LTD. SingaporeNIKE Slovakia s.r.o. SlovakiaNIKE Sourcing India Private Limited IndiaNIKE Sourcing (Guangzhou) Co., Ltd. People’s Republic of ChinaNIKE South Africa (Proprietary) Limited South AfricaNIKE South Africa Holdings LLC DelawareNIKE Sphere C.V. NetherlandsNIKE Spiridon, Inc. DelawareNIKE Sports (China) Company, Ltd. People’s Republic of ChinaNIKE Sweden AB SwedenNIKE Swift B.V. NetherlandsNIKE (Switzerland) GmbH SwitzerlandNIKE Taiwan Limited TaiwanNIKE (Thailand) Limited ThailandNIKE TN, Inc. OregonNIKE Trading Company B.V. NetherlandsNIKE UK Holding B.V. NetherlandsNIKE (UK) Limited United KingdomNIKE Uptempo C.V. NetherlandsNIKE USA, Inc. OregonNIKE Vapor Jet LLC DelawareNIKE Vapor Ltd. United KingdomNIKE Victory Cooperatief U.A. NetherlandsNIKE Vietnam Limited Liability Company VietnamNIKE Vision, Timing and Techlab, LP TexasNIKE Vomero Cooperatief U.A. NetherlandsNIKE Wholesale LLC SloveniaNorth West Merchandising Limited United KingdomPT Hurley Indonesia IndonesiaPT NIKE Indonesia IndonesiaTriax Insurance, Inc. HawaiiTwin Dragons Global Limited Hong KongTwin Dragons Holding B.V. Netherlands

Entity Name Jurisdiction of FormationYugen Kaisha Hurley Japan Japan

Exhibit 31.1
Certification of Chief Executive OfficerPursuant to Section 302 of the Sarbanes-Oxley Act of 2002
I, Mark G. Parker, certify that:
1. I have reviewed this annual report on Form 10-K of NIKE, Inc.;
2. Based on my knowledge, this report does not contain any untrue statement of a material fact or omit to state a material fact necessary to make thestatements made, in light of the circumstances under which such statements were made, not misleading with respect to the period covered by this report;
3. Based on my knowledge, the financial statements, and other financial information included in this report, fairly present in all material respects thefinancial condition, results of operations and cash flows of the registrant as of, and for, the periods presented in this report;
4. The registrant’s other certifying officer and I are responsible for establishing and maintaining disclosure controls and procedures (as defined inExchange Act Rules 13a-15(e) and 15d-15(e)) and internal control over financial reporting (as defined in Exchange Act Rules 13a-15(f) and 15d-15(f)) for theregistrant and have:
a) designed such disclosure controls and procedures, or caused such disclosure controls and procedures to be designed under our supervision, toensure that material information relating to the registrant, including its consolidated subsidiaries, is made known to us by others within those entities, particularlyduring the period in which this report is being prepared;
b) designed such internal control over financial reporting, or caused such internal control over financial reporting to be designed under oursupervision, to provide reasonable assurance regarding the reliability of financial reporting and the preparation of financial statements for external purposes inaccordance with generally accepted accounting principles;
c) evaluated the effectiveness of the registrant’s disclosure controls and procedures and presented in this report our conclusions about theeffectiveness of the disclosure controls and procedures, as of the end of the period covered by this report based on such evaluation; and
d) disclosed in this report any change in the registrant’s internal control over financial reporting that occurred during the registrant’s most recentfiscal quarter (the registrant’s fourth fiscal quarter in the case of an annual report) that has materially affected, or is reasonably likely to materially affect, theregistrant’s internal control over financial reporting; and
5. The registrant’s other certifying officer and I have disclosed, based on our most recent evaluation of internal control over financial reporting, to theregistrant’s auditors and the audit committee of the registrant’s board of directors (or persons performing the equivalent functions):
a) all significant deficiencies and material weaknesses in the design or operation of internal control over financial reporting which are reasonablylikely to adversely affect the registrant’s ability to record, process, summarize and report financial information; and
b) any fraud, whether or not material, that involves management or other employees who have a significant role in the registrant’s internalcontrol over financial reporting.
Dated: July 24, 2018 /s/ Mark G. Parker Mark G. Parker Chief Executive Officer

Exhibit 31.2
Certification of Chief Financial OfficerPursuant to Section 302 of the Sarbanes-Oxley Act of 2002
I, Andrew Campion, certify that:
1. I have reviewed this annual report on Form 10-K of NIKE, Inc.;
2. Based on my knowledge, this report does not contain any untrue statement of a material fact or omit to state a material fact necessary to make thestatements made, in light of the circumstances under which such statements were made, not misleading with respect to the period covered by this report;
3. Based on my knowledge, the financial statements, and other financial information included in this report, fairly present in all material respects thefinancial condition, results of operations and cash flows of the registrant as of, and for, the periods presented in this report;
4. The registrant’s other certifying officer and I are responsible for establishing and maintaining disclosure controls and procedures (as defined inExchange Act Rules 13a-15(e) and 15d-15(e)) and internal control over financial reporting (as defined in Exchange Act Rules 13a-15(f) and 15d-15(f)) for theregistrant and have:
a) designed such disclosure controls and procedures, or caused such disclosure controls and procedures to be designed under our supervision, toensure that material information relating to the registrant, including its consolidated subsidiaries, is made known to us by others within those entities, particularlyduring the period in which this report is being prepared;
b) designed such internal control over financial reporting, or caused such internal control over financial reporting to be designed under oursupervision, to provide reasonable assurance regarding the reliability of financial reporting and the preparation of financial statements for external purposes inaccordance with generally accepted accounting principles;
c) evaluated the effectiveness of the registrant’s disclosure controls and procedures and presented in this report our conclusions about theeffectiveness of the disclosure controls and procedures, as of the end of the period covered by this report based on such evaluation; and
d) disclosed in this report any change in the registrant’s internal control over financial reporting that occurred during the registrant’s most recentfiscal quarter (the registrant’s fourth fiscal quarter in the case of an annual report) that has materially affected, or is reasonably likely to materially affect, theregistrant’s internal control over financial reporting; and
5. The registrant’s other certifying officer and I have disclosed, based on our most recent evaluation of internal control over financial reporting, to theregistrant’s auditors and the audit committee of the registrant’s board of directors (or persons performing the equivalent functions):
a) all significant deficiencies and material weaknesses in the design or operation of internal control over financial reporting which are reasonablylikely to adversely affect the registrant’s ability to record, process, summarize and report financial information; and
b) any fraud, whether or not material, that involves management or other employees who have a significant role in the registrant’s internalcontrol over financial reporting.
Dated: July 24, 2018 /s/ Andrew Campion
Andrew CampionChief Financial Officer

Exhibit 32
Pursuant to 18 U.S.C. Section 1350, as created by Section 906 of the Sarbanes-Oxley Act of 2002, the following certifications are being made to accompanythe Registrant’s annual report on Form 10-K for the fiscal year ended May 31, 2018 .
Certification of Chief Executive Officer
Pursuant to 18 U.S.C. Section 1350, as created by Section 906 of the Sarbanes-Oxley Act of 2002, the undersigned officer of NIKE, Inc. (the “Company”)hereby certifies, to such officer’s knowledge, that:
(i) the Annual Report on Form 10-K of the Company for the fiscal year ended May 31, 2018 (the “Report”) fully complies with the requirements ofSection 13(a) or Section 15(d), as applicable, of the Securities Exchange Act of 1934, as amended; and
(ii) the information contained in the Report fairly presents, in all material respects, the financial condition and results of operations of the Company.
Dated: July 24, 2018 /s/ Mark G. Parker Mark G. Parker Chief Executive Officer

Pursuant to 18 U.S.C. Section 1350, as created by Section 906 of the Sarbanes-Oxley Act of 2002, the following certifications are being made to accompanythe Registrant’s annual report on Form 10-K for the fiscal year ended May 31, 2018 .
Certification of Chief Financial Officer
Pursuant to 18 U.S.C. Section 1350, as created by Section 906 of the Sarbanes-Oxley Act of 2002, the undersigned officer of NIKE, Inc. (the “Company”)hereby certifies, to such officer’s knowledge, that:
(i) the Annual Report on Form 10-K of the Company for the fiscal year ended May 31, 2018 (the “Report”) fully complies with the requirements ofSection 13(a) or Section 15(d), as applicable, of the Securities Exchange Act of 1934, as amended; and
(ii) the information contained in the Report fairly presents, in all material respects, the financial condition and results of operations of the Company.
Dated: July 24, 2018 /s/ Andrew Campion
Andrew CampionChief Financial Officer