nike, inc. table of contents - university of notre...
TRANSCRIPT


NIKE, INC.ANNUAL REPORT ON FORM 10-KTable of Contents
Page
PART I 49
ITEM 1. Business . . . . . . . . . . . . . . . . . . . . . . . . . . . . . . . . . . . . . . . . . . . . . . . . . . . . . . . . . . . . . . . . . . . . . . . . . . . . . . . . . . . . . . . . . . . . . . . . . . . . . . . . . . . . . . . . . . . . . . . . . . . . 49General . . . . . . . . . . . . . . . . . . . . . . . . . . . . . . . . . . . . . . . . . . . . . . . . . . . . . . . . . . . . . . . . . . . . . . . . . . . . . . . . . . . . . . . . . . . . . . . . . . . . . . . . . . . . . . . . . . . . . . . . . . . . . . 49Products . . . . . . . . . . . . . . . . . . . . . . . . . . . . . . . . . . . . . . . . . . . . . . . . . . . . . . . . . . . . . . . . . . . . . . . . . . . . . . . . . . . . . . . . . . . . . . . . . . . . . . . . . . . . . . . . . . . . . . . . . . . . 49Sales and Marketing . . . . . . . . . . . . . . . . . . . . . . . . . . . . . . . . . . . . . . . . . . . . . . . . . . . . . . . . . . . . . . . . . . . . . . . . . . . . . . . . . . . . . . . . . . . . . . . . . . . . . . . . . . . 50United States Market . . . . . . . . . . . . . . . . . . . . . . . . . . . . . . . . . . . . . . . . . . . . . . . . . . . . . . . . . . . . . . . . . . . . . . . . . . . . . . . . . . . . . . . . . . . . . . . . . . . . . . . . . . 50International Markets . . . . . . . . . . . . . . . . . . . . . . . . . . . . . . . . . . . . . . . . . . . . . . . . . . . . . . . . . . . . . . . . . . . . . . . . . . . . . . . . . . . . . . . . . . . . . . . . . . . . . . . . . . 50Significant Customer . . . . . . . . . . . . . . . . . . . . . . . . . . . . . . . . . . . . . . . . . . . . . . . . . . . . . . . . . . . . . . . . . . . . . . . . . . . . . . . . . . . . . . . . . . . . . . . . . . . . . . . . . . 51Orders . . . . . . . . . . . . . . . . . . . . . . . . . . . . . . . . . . . . . . . . . . . . . . . . . . . . . . . . . . . . . . . . . . . . . . . . . . . . . . . . . . . . . . . . . . . . . . . . . . . . . . . . . . . . . . . . . . . . . . . . . . . . . . . 51Product Research and Development . . . . . . . . . . . . . . . . . . . . . . . . . . . . . . . . . . . . . . . . . . . . . . . . . . . . . . . . . . . . . . . . . . . . . . . . . . . . . . . . . . . 51Manufacturing . . . . . . . . . . . . . . . . . . . . . . . . . . . . . . . . . . . . . . . . . . . . . . . . . . . . . . . . . . . . . . . . . . . . . . . . . . . . . . . . . . . . . . . . . . . . . . . . . . . . . . . . . . . . . . . . . . . . 51International Operations and Trade . . . . . . . . . . . . . . . . . . . . . . . . . . . . . . . . . . . . . . . . . . . . . . . . . . . . . . . . . . . . . . . . . . . . . . . . . . . . . . . . . . . . . 52Competition . . . . . . . . . . . . . . . . . . . . . . . . . . . . . . . . . . . . . . . . . . . . . . . . . . . . . . . . . . . . . . . . . . . . . . . . . . . . . . . . . . . . . . . . . . . . . . . . . . . . . . . . . . . . . . . . . . . . . . . 52Trademarks and Patents . . . . . . . . . . . . . . . . . . . . . . . . . . . . . . . . . . . . . . . . . . . . . . . . . . . . . . . . . . . . . . . . . . . . . . . . . . . . . . . . . . . . . . . . . . . . . . . . . . . . . 52Employees . . . . . . . . . . . . . . . . . . . . . . . . . . . . . . . . . . . . . . . . . . . . . . . . . . . . . . . . . . . . . . . . . . . . . . . . . . . . . . . . . . . . . . . . . . . . . . . . . . . . . . . . . . . . . . . . . . . . . . . . . 53Executive Officers of the Registrant . . . . . . . . . . . . . . . . . . . . . . . . . . . . . . . . . . . . . . . . . . . . . . . . . . . . . . . . . . . . . . . . . . . . . . . . . . . . . . . . . . . . . 53
ITEM 1A. Risk Factors . . . . . . . . . . . . . . . . . . . . . . . . . . . . . . . . . . . . . . . . . . . . . . . . . . . . . . . . . . . . . . . . . . . . . . . . . . . . . . . . . . . . . . . . . . . . . . . . . . . . . . . . . . . . . . . . . . . . . . . 54ITEM 1B. Unresolved Staff Comments . . . . . . . . . . . . . . . . . . . . . . . . . . . . . . . . . . . . . . . . . . . . . . . . . . . . . . . . . . . . . . . . . . . . . . . . . . . . . . . . . . . . . . . . . . . . . . . 60ITEM 2. Properties . . . . . . . . . . . . . . . . . . . . . . . . . . . . . . . . . . . . . . . . . . . . . . . . . . . . . . . . . . . . . . . . . . . . . . . . . . . . . . . . . . . . . . . . . . . . . . . . . . . . . . . . . . . . . . . . . . . . . . . . . . 60ITEM 3. Legal Proceedings . . . . . . . . . . . . . . . . . . . . . . . . . . . . . . . . . . . . . . . . . . . . . . . . . . . . . . . . . . . . . . . . . . . . . . . . . . . . . . . . . . . . . . . . . . . . . . . . . . . . . . . . . . . . . . 60ITEM 4. Mine Safety Disclosures . . . . . . . . . . . . . . . . . . . . . . . . . . . . . . . . . . . . . . . . . . . . . . . . . . . . . . . . . . . . . . . . . . . . . . . . . . . . . . . . . . . . . . . . . . . . . . . . . . . . . 60
PART II 61
ITEM 5. Market for Registrant’s Common Equity, Related Stockholder Matters and Issuer Purchasesof Equity Securities . . . . . . . . . . . . . . . . . . . . . . . . . . . . . . . . . . . . . . . . . . . . . . . . . . . . . . . . . . . . . . . . . . . . . . . . . . . . . . . . . . . . . . . . . . . . . . . . . . . . . . . . . . . . . 61
ITEM 6. Selected Financial Data . . . . . . . . . . . . . . . . . . . . . . . . . . . . . . . . . . . . . . . . . . . . . . . . . . . . . . . . . . . . . . . . . . . . . . . . . . . . . . . . . . . . . . . . . . . . . . . . . . . . . . 63ITEM 7. Management’s Discussion and Analysis of Financial Condition and Results of Operations . . . . . 65ITEM 7A. Quantitative and Qualitative Disclosures about Market Risk . . . . . . . . . . . . . . . . . . . . . . . . . . . . . . . . . . . . . . . . . . . . . . . . . . 85ITEM 8. Financial Statements and Supplemental Data . . . . . . . . . . . . . . . . . . . . . . . . . . . . . . . . . . . . . . . . . . . . . . . . . . . . . . . . . . . . . . . . . . . . . . 86ITEM 9. Changes in and Disagreements with Accountants on Accounting and Financial Disclosure . . .114ITEM 9A. Controls and Procedures . . . . . . . . . . . . . . . . . . . . . . . . . . . . . . . . . . . . . . . . . . . . . . . . . . . . . . . . . . . . . . . . . . . . . . . . . . . . . . . . . . . . . . . . . . . . . . . . . . . .114ITEM 9B. Other Information . . . . . . . . . . . . . . . . . . . . . . . . . . . . . . . . . . . . . . . . . . . . . . . . . . . . . . . . . . . . . . . . . . . . . . . . . . . . . . . . . . . . . . . . . . . . . . . . . . . . . . . . . . . . . . .114
PART III 115
(Except for the information set forth under “Executive Officers of the Registrant” in Item 1above, Part III is incorporated by reference from the Proxy Statement for the NIKE, Inc. 2013Annual Meeting of Shareholders.) . . . . . . . . . . . . . . . . . . . . . . . . . . . . . . . . . . . . . . . . . . . . . . . . . . . . . . . . . . . . . . . . . . . . . . . . . . . . . . . . . . . . . . . .
ITEM 10. Directors, Executive Officers and Corporate Governance . . . . . . . . . . . . . . . . . . . . . . . . . . . . . . . . . . . . . . . . . . . . . . . . . . . . .115ITEM 11. Executive Compensation . . . . . . . . . . . . . . . . . . . . . . . . . . . . . . . . . . . . . . . . . . . . . . . . . . . . . . . . . . . . . . . . . . . . . . . . . . . . . . . . . . . . . . . . . . . . . . . . . . . .115ITEM 12. Security Ownership of Certain Beneficial Owners and Management and Related
Stockholder Matters . . . . . . . . . . . . . . . . . . . . . . . . . . . . . . . . . . . . . . . . . . . . . . . . . . . . . . . . . . . . . . . . . . . . . . . . . . . . . . . . . . . . . . . . . . . . . . . . . . . . . . . . . . .115ITEM 13. Certain Relationships and Related Transactions, and Director Independence . . . . . . . . . . . . . . . . . . . . . . . .115ITEM 14. Principal Accountant Fees and Services . . . . . . . . . . . . . . . . . . . . . . . . . . . . . . . . . . . . . . . . . . . . . . . . . . . . . . . . . . . . . . . . . . . . . . . . . . . . . .115
PART IV 116
ITEM 15. Exhibits and Financial Statement Schedules . . . . . . . . . . . . . . . . . . . . . . . . . . . . . . . . . . . . . . . . . . . . . . . . . . . . . . . . . . . . . . . . . . . . . . . .116Signatures . . . . . . . . . . . . . . . . . . . . . . . . . . . . . . . . . . . . . . . . . . . . . . . . . . . . . . . . . . . . . . . . . . . . . . . . . . . . . . . . . . . . . . . . . . . . . . . . . . . . . . . . . . . . . . . . . . . . . . . . .121

UNITED STATESSECURITIES AND EXCHANGE COMMISSION
Washington, D.C. 20549
FORM 10-K(Mark One)
Í ANNUAL REPORT PURSUANT TO SECTION 13 OR 15(d) OF THE SECURITIES EXCHANGE ACT OF 1934FOR THE FISCAL YEAR ENDED MAY 31, 2013
OR‘ TRANSITION REPORT PURSUANT TO SECTION 13 OR 15(D) OF THE SECURITIES EXCHANGE ACT OF 1934
FOR THE TRANSITION PERIOD FROM TO .
Commission File No. 1-10635
NIKE, INC.(Exact name of Registrant as specified in its charter)
OREGON 93-0584541(State or other jurisdiction of incorporation) (IRS Employer Identification No.)
One Bowerman Drive Beaverton, Oregon 97005-6453(Address of principal executive offices) (Zip Code)
(503) 671-6453
(Registrant’s Telephone Number, Including Area Code)SECURITIES REGISTERED PURSUANT TO SECTION 12(B) OF THE ACT:
Class B Common Stock New York Stock Exchange(Title of Each Class) (Name of Each Exchange on Which Registered)
SECURITIES REGISTERED PURSUANT TO SECTION 12(G) OF THE ACT:NONE
Indicate by check mark YES NO• if the registrant is a well-known seasoned issuer, as defined in Rule 405 of the
Securities Act. Í ‘• if the registrant is not required to file reports pursuant to Section 13 or Section 15(d) of the
Act. ‘ Í• whether the Registrant (1) has filed all reports required to be filed by Section 13 or 15(d)
of the Securities Exchange Act of 1934 during the preceding 12 months (or for suchshorter period that the Registrant was required to file such reports), and (2) has beensubject to such filing requirements for the past 90 days. Í ‘
• whether the registrant has submitted electronically and posted on its corporateWebsite, if any, every Interactive Data File required to be submitted and postedpursuant to Rule 405 of Regulation S-T (§229.405 of this chapter) during the preceding12 months (or for such shorter period that the registrant was required to submit andpost such files). Í ‘
• if disclosure of delinquent filers pursuant to Item 405 of Regulation S-K (§229.405 of thischapter) is not contained herein, and will not be contained, to the best of Registrant’sknowledge, in definitive proxy or information statements incorporated by reference inPart III of this Form 10-K or any amendment to this Form 10-K. ‘ Í
• whether the Registrant is a large accelerated filer, an accelerated filer, a non-accelerated filer, or a smaller reporting company. See thedefinitions of “large accelerated filer,” “accelerated filer” and “smaller reporting company” in Rule 12b-2 of the Exchange Act.
Large accelerated filer Í Accelerated filer ‘ Non-accelerated file ‘ Smaller Reporting Company ‘
• whether the registrant is a shell company (as defined in Rule 12b-2 of the Act). ‘ ÍAs of November 30, 2012, the aggregate market values of the Registrant’s Common Stock held by non-affiliates were:
Class A $ 2,206,464,966Class B $34,773,165,371
$36,979,630,337As of July 19, 2013, the number of shares of the Registrant’s Common Stock outstanding were:
Class A 177,957,876Class B 712,394,590
890,352,466
DOCUMENTS INCORPORATED BY REFERENCE:Parts of Registrant’s Proxy Statement for the Annual Meeting of Shareholders to be held on September 19, 2013 are incorporated byreference into Part III of this Report.
47

PART I
PART I
ITEM 1. Business
General
NIKE, Inc. was incorporated in 1968 under the laws of the state of Oregon. Asused in this report, the terms “we,” “us,” “NIKE” and the “Company” refer toNIKE, Inc. and its predecessors, subsidiaries and affiliates, collectively, unlessthe context indicates otherwise. Our internet address is www.nike.com. Onour NIKE Corporate website, located at www.nikeinc.com, we post thefollowing filings as soon as reasonably practicable after they are electronicallyfiled with or furnished to the Securities and Exchange Commission: our annualreport on Form 10-K, our quarterly reports on Form 10-Q, our current reportson Form 8-K and any amendments to those reports filed or furnishedpursuant to Section 13(a) or 15(d) of the Securities and Exchange Act of1934, as amended. All such filings on our NIKE Corporate website areavailable free of charge. Also available on the NIKE Corporate website are thecharters of the committees of our board of directors, as well as our corporategovernance guidelines and code of ethics; copies of any of these documents
will be provided in print to any shareholder who submits a request in writing toNIKE Investor Relations, One Bowerman Drive, Beaverton, Oregon 97005-6453.
Our principal business activity is the design, development and worldwidemarketing and selling of athletic footwear, apparel, equipment, accessoriesand services. NIKE is the largest seller of athletic footwear and athletic apparelin the world. We sell our products to retail accounts, through NIKE-ownedretail stores and internet websites (which we refer to as our “Direct toConsumer” operations) and through a mix of independent distributors andlicensees, in virtually all countries around the world. Virtually all of our productsare manufactured by independent contractors. Virtually all footwear andapparel products are produced outside the United States, while equipmentproducts are produced both in the United States and abroad.
Products
We focus our NIKE Brand and Brand Jordan product offerings in seven keycategories: Running, Basketball, Football (Soccer), Men’s Training, Women’sTraining, NIKE Sportswear (our sports-inspired lifestyle products), and ActionSports. We also market products designed for kids, as well as for otherathletic and recreational uses such as baseball, cricket, golf, lacrosse,outdoor activities, football, tennis, volleyball, walking, and wrestling.
NIKE’s athletic footwear products are designed primarily for specific athleticuse, although a large percentage of the products are worn for casual or leisurepurposes. We place considerable emphasis on high quality construction andinnovation in our products. NIKE Sportswear, Running, Basketball, Football(Soccer), and kids’ shoes are currently our top-selling footwear categoriesand we expect them to continue to lead in product sales in the near future.
We sell sports apparel and accessories covering most of the above-mentioned categories, which feature the same trademarks and are soldpredominantly through the same marketing and distribution channels asathletic footwear. We often market footwear, apparel and accessories in“collections” of similar use or by category. We also market apparel withlicensed college and professional team and league logos.
We sell a line of performance equipment under the NIKE Brand name,including bags, socks, sport balls, eyewear, timepieces, digital devices, bats,gloves, protective equipment, golf clubs, and other equipment designed forsports activities. We also sell small amounts of various plastic products toother manufacturers through our wholly-owned subsidiary, NIKE IHM, Inc.
Our wholly-owned subsidiary, Converse Inc. (“Converse”), headquartered inNorth Andover, Massachusetts, designs, distributes and licenses athletic andcasual footwear, apparel and accessories under the Converse®, ChuckTaylor®, All Star®, One Star®, Star Chevron® and Jack Purcell® trademarks.
Our wholly-owned subsidiary, Hurley International LLC (“Hurley”),headquartered in Costa Mesa, California, designs and distributes a line ofaction sports and youth lifestyle apparel and accessories under the Hurley®
trademark.
In addition to the products we sell to our wholesale customers and directly toconsumers through our Direct to Consumer operations, we have also enteredinto license agreements that permit unaffiliated parties to manufacture and sellcertain apparel, digital devices and applications and other equipmentdesigned for sports activities.
As part of our long-term growth strategy, we continually evaluate our portfolioof businesses to ensure we are investing in those businesses that areaccretive to the NIKE Brand with the largest growth potential and highestreturns. On February 1, 2013, and November 30, 2012, we completed thedivestitures of the Cole Haan and Umbro businesses, respectively, allowingus to better focus our resources on driving growth in the NIKE, Jordan,Converse and Hurley brands.
NIKE, INC. 2013 Annual Report and Notice of Annual Meeting 49
FOR
M10
-K

PART I
Sales and Marketing
Financial information about geographic and segment operations appears inNote 18 — Operating Segments and Related Information of theaccompanying Notes to the Consolidated Financial Statements.
We experience moderate fluctuations in aggregate sales volume during theyear. Historically, revenues in the first and fourth fiscal quarters have slightlyexceeded those in the second and third quarters. However, the mix ofproduct sales may vary considerably as a result of changes in seasonal andgeographic demand for particular types of footwear, apparel, and equipment.
Because NIKE is a consumer products company, the relative popularity ofvarious sports and fitness activities and changing design trends affect thedemand for our products. We must, therefore, respond to trends and shifts inconsumer preferences by adjusting the mix of existing product offerings,
developing new products, styles and categories, and influencing sports andfitness preferences through extensive marketing. Failure to respond in a timelyand adequate manner could have a material adverse effect on our sales andprofitability. This is a continuing risk.
We report our NIKE Brand operations based on our internal geographicorganization. Each NIKE Brand geography operates predominantly in oneindustry: the design, development, marketing and selling of athletic footwear,apparel, equipment, accessories, and services. Our reportable operatingsegments for the NIKE Brand are: North America, Western Europe, Central &Eastern Europe, Greater China, Japan, and Emerging Markets. Our NIKEBrand Direct to Consumer operations are managed within each geographicsegment.
United States Market
In fiscal 2013, sales in the United States, including U.S. sales of our OtherBusinesses, accounted for approximately 45% of total revenues, comparedto 42% in both fiscal 2012 and fiscal 2011. Converse and Hurley, our affiliatebrands, and NIKE Golf comprise our Other Businesses. We sell to thousandsof retail accounts in the United States, including a mix of footwear stores,sporting goods stores, athletic specialty stores, department stores, skate,tennis and golf shops, and other retail accounts. During fiscal 2013, our threelargest customers accounted for approximately 25% of sales in the UnitedStates.
We make substantial use of our futures ordering program, which allowsretailers to order five to six months in advance of delivery with the commitmentthat their orders will be delivered within a set time period at a fixed price. Infiscal 2013, 87% of our U.S. wholesale footwear shipments (excluding ourOther Businesses) were made under the futures program, compared to 86%in fiscal 2012 and 87% in fiscal 2011. In fiscal 2013, 67% of our U.S.wholesale apparel shipments (excluding our Other Businesses) were madeunder the futures program, compared to 64% in fiscal 2012 and 60% in fiscal2011.
We utilize NIKE sales offices to solicit sales in the United States as well asindependent sales representatives to sell specialty products for golf,skateboarding, and snowboarding. In addition, our Direct to Consumeroperations sell NIKE Brand products to consumers through our internetwebsite, www.nike.com, and through the following number of retail stores inthe United States:
U.S. Retail Stores NumberNIKE Brand factory stores 171NIKE Brand in-line stores, including NIKETOWNs and employee-only stores 33Converse stores (including factory stores) 72Hurley stores (including factory and employee stores) 27TOTAL 303
NIKE has five primary distribution centers in the United States located inMemphis, Tennessee, three of which are leased. NIKE Brand apparel andequipment products are also shipped from our Foothill Ranch, California
distribution center. Converse and Hurley products are shipped primarily fromOntario, California.
International Markets
In fiscal 2013, non-U.S. sales including non-U.S. sales of our OtherBusinesses accounted for 55% of total revenues, compared to 58% in bothfiscal 2012 and fiscal 2011. We sell our products to retail accounts, throughour own Direct to Consumer operations, and through a mix of independentdistributors, licensees, and sales representatives around the world. We sell tothousands of retail accounts and operate 16 distribution centers outside of
the United States. In many countries and regions, including Canada, Asia,some Latin American countries, and Europe, we have a futures orderingprogram for retailers similar to the United States futures ordering programdescribed above. During fiscal 2013, NIKE’s three largest customers outsideof the U.S. accounted for approximately 6% of total non-U.S. sales.
Our Direct to Consumer business operates the following number of retail stores outside the United States:
Non-U.S. Retail Stores NumberNIKE Brand factory stores 388NIKE Brand in-line stores, including NIKETOWNs and employee-only stores 59Converse stores (including factory stores) 3TOTAL 450
50

PART I
International branch offices and subsidiaries of NIKE are located in Argentina,Australia, Austria, Belgium, Bermuda, Brazil, Canada, Chile, China, CostaRica, Croatia, Cyprus, the Czech Republic, Denmark, Finland, France,Germany, Greece, Hong Kong, Hungary, India, Indonesia, Ireland, Israel, Italy,Japan, Korea, Malaysia, Mexico, New Zealand, the Netherlands, Norway,
the Philippines, Poland, Portugal, Russia, Singapore, Slovakia, Slovenia,South Africa, Spain, Sri Lanka, Sweden, Switzerland, Taiwan, Thailand,Turkey, the United Arab Emirates, the United Kingdom, Uruguay andVietnam.
Significant Customer
No customer accounted for 10% or more of our worldwide net sales during fiscal 2013.
Orders
Worldwide futures orders for NIKE Brand athletic footwear and apparel,scheduled for delivery from June through November 2013, were $12.1 billioncompared to $11.2 billion for the same period last year. This futures ordersamount is calculated based upon our forecast of the actual exchange ratesunder which our revenues will be translated during this period. Reportedfutures orders are not necessarily indicative of our expectation of revenues forthis period. This is because the mix of orders can shift between futures and at-once orders and the fulfillment of certain of these futures orders may fall
outside of the scheduled time period noted above. In addition, foreigncurrency exchange rate fluctuations as well as differing levels of discounts,order cancellations and returns can cause differences in the comparisonsbetween futures orders and actual revenues. Moreover, a significant portionof our revenue is not derived from futures orders, including at-once and close-out sales of NIKE Brand footwear and apparel, sales of NIKE Brandequipment, sales from our Direct to Consumer operations, and sales from ourOther Businesses.
Product Research and Development
We believe our research and development efforts are a key factor in oursuccess. Technical innovation in the design and manufacturing process offootwear, apparel, and athletic equipment receive continued emphasis asNIKE strives to produce products that help to reduce injury, enhance athleticperformance and maximize comfort.
In addition to NIKE’s own staff of specialists in the areas of biomechanics,chemistry, exercise physiology, engineering, industrial design, sustainability,and related fields, we also utilize research committees and advisory boardsmade up of athletes, coaches, trainers, equipment managers, orthopedists,podiatrists, and other experts who consult with us and review designs,materials, concepts for product and manufacturing process improvementsand compliance with product safety regulations around the world. Employeeathletes, athletes engaged under sports marketing contracts and otherathletes wear-test and evaluate products during the design and developmentprocess.
Manufacturing
Virtually all of our footwear is manufactured outside of the United States byindependent contract manufacturers. In fiscal 2013, contract factories inVietnam, China and Indonesia manufactured approximately 42%, 30%, and26% of total NIKE Brand footwear, respectively. We also have manufacturingagreements with independent factories in Argentina, Brazil, India, and Mexicoto manufacture footwear for sale primarily within those countries. The largestsingle footwear factory with which we have contracted accounted forapproximately 6% of total fiscal 2013 NIKE Brand footwear production.Almost all of NIKE Brand apparel is manufactured outside of the United Statesby independent contract manufacturers located in 28 countries. Most of thisapparel production occurred in China, Vietnam, Thailand, Indonesia, SriLanka, Pakistan, Malaysia, Turkey, Mexico, and Cambodia. The largest singleapparel factory that we have contracted with accounted for approximately6% of total fiscal 2013 apparel production.
The principal materials used in our footwear products are natural andsynthetic rubber, plastic compounds, foam cushioning materials, nylon,leather, canvas, and polyurethane films used to make Air-Sole cushioningcomponents. During fiscal 2013, NIKE IHM, Inc., a wholly-owned subsidiaryof NIKE, Inc., with facilities in Beaverton, Oregon and St. Louis, Missouri, aswell as independent contractors in China and Vietnam, were our largestsuppliers of the Air-Sole cushioning components used in footwear. Theprincipal materials used in our apparel products are natural and syntheticfabrics and threads, plastic and metal hardware, and specialized performance
fabrics designed to repel rain and snow, retain heat, or efficiently wickmoisture away from the body. NIKE’s independent contractors and suppliersbuy raw materials in bulk for the manufacturing of our footwear, apparel andequipment products. Most raw materials are available and purchased bythose independent contractors and suppliers in the countries wheremanufacturing takes place. We have thus far experienced little difficulty insatisfying our raw material requirements.
Since 1972, Sojitz Corporation of America (“Sojitz America”), a largeJapanese trading company and the sole owner of our redeemable preferredstock, has performed significant import-export financing services for us.During fiscal 2013, Sojitz America provided financing and purchasing servicesfor NIKE Brand products sold in Argentina, Uruguay, Canada, Brazil, India,Indonesia, the Philippines, Malaysia, South Africa, Korea, and Thailand,excluding products produced and sold in the same country. Approximately13% of NIKE Brand sales occurred in those countries. Any failure of SojitzAmerica to provide these services or any failure of Sojitz America’s bankscould disrupt our ability to acquire products from our suppliers and to deliverproducts to our customers in those markets. Such a disruption could result incanceled orders that would adversely affect sales and profitability. However,we believe that any such disruption would be short-term in duration due to theready availability of alternative sources of financing at competitive rates. Ourcurrent agreements with Sojitz America expire on May 31, 2014.
NIKE, INC. 2013 Annual Report and Notice of Annual Meeting 51
FOR
M10
-K

PART I
International Operations and Trade
Our international operations and sources of supply are subject to the usualrisks of doing business abroad, such as possible revaluation of currencies,export and import duties, anti-dumping measures, quotas, safeguardmeasures, trade restrictions, restrictions on the transfer of funds and, incertain parts of the world, political instability and terrorism. We have not, todate, been materially affected by any such risk, but cannot predict thelikelihood of such material effects occurring in the future.
In recent years, uncertain global and regional economic conditions haveaffected international trade and caused a rise in protectionist actions aroundthe world. These trends are affecting many global manufacturing and servicesectors, and the footwear and apparel industries, as a whole, are not immune.Companies in our industry are facing trade protectionism in many differentregions, and in nearly all cases we are working together with industry groupsto address trade issues and reduce the impact to the industry, whileobserving applicable competition laws. Notwithstanding our efforts, suchprotectionist measures, if implemented, could result in increases in the cost ofour products, which may in turn adversely affect our sales or profitability aswell as the imported footwear and apparel industry as a whole.
We monitor protectionist trends and developments throughout the world thatmay materially impact our industry and engage in administrative and judicialprocesses to mitigate trade restrictions. In Brazil, we are actively monitoring
for dumping investigations against products from China and other countriesthat may result in additional anti-dumping measures and could affect ourindustry. We are also monitoring for and advocating against otherimpediments that may increase customs clearance times for imports offootwear, apparel and equipment. Moreover, with respect to trade restrictionstargeting China, which represents an important sourcing and consumermarketing country for us, we are working with a broad coalition of globalbusinesses and trade associations representing a wide variety of sectors tohelp ensure that any legislation enacted and implemented (i) addresseslegitimate and core concerns, (ii) is consistent with international trade rules,and (iii) reflects and considers China’s domestic economy and the importantrole it has in the global economic community.
Where trade protection measures are implemented, we believe that we havethe ability to develop, over a period of time, adequate alternative sources ofsupply for the products obtained from our present suppliers. If eventsprevented us from acquiring products from our suppliers in a particularcountry, our operations could be temporarily disrupted and we couldexperience an adverse financial impact. However, we believe we could abateany such disruption, and that much of the adverse impact on supply would,therefore, be of a short-term nature, although alternate sources of supplymight not be as cost effective and could have an ongoing adverse impact onprofitability.
Competition
The athletic footwear, apparel, and equipment industry is highly competitive inthe United States and on a worldwide basis. We compete internationally witha significant number of athletic and leisure footwear companies, athletic andleisure apparel companies, sports equipment companies, and largecompanies having diversified lines of athletic and leisure footwear, apparel,and equipment, including adidas, V.F. Corp., Puma, Li Ning and UnderArmour, among others. We also compete with a number of vertical retailerssuch as Lululemon and Uniqlo. The intense competition and the rapidchanges in technology and consumer preferences in the markets for athleticand leisure footwear and apparel, and athletic equipment, constitutesignificant risk factors in our operations.
NIKE is the largest seller of athletic footwear, apparel, and equipment in theworld. Important aspects of competition in this industry are:
• Product quality; performance and reliability; new product innovation anddevelopment; and consumer price/value;
• Consumer connection and affinity for brands and products, developedthrough marketing and promotion; customer support and service;identification with prominent and influential athletes, coaches, teams,colleges and sports leagues who endorse our brands and use ourproducts; and active engagement through sponsored sporting events andclinics; and
• Effective distribution of products, with attractive merchandising andpresentation at retail, in store and online.
We believe that we are competitive in all of these areas.
Trademarks and Patents
We utilize trademarks on nearly all of our products and believe havingdistinctive marks that are readily identifiable is an important factor in creating amarket for our goods, in identifying our brands and the Company, and indistinguishing our goods from the goods of others. We consider our NIKE®
and Swoosh Design® trademarks to be among our most valuable assets andwe have registered these trademarks in almost 170 jurisdictions. In addition,we own many other trademarks that we utilize in marketing our products. Wecontinue to vigorously protect our trademarks against infringement.
NIKE has an exclusive, worldwide license to make and sell footwear usingpatented “Air” technology. The process utilizes pressurized gas encapsulatedin polyurethane. Some of the early NIKE AIR® patents have expired, whichmay enable competitors to use certain types of similar technology.Subsequent NIKE AIR® patents will not expire for several years.
We also file and maintain many U.S. and foreign utility patents, as well asmany U.S. and foreign design patents covering components, manufacturingtechniques and features used in various athletic and leisure footwear, apparel,athletic equipment, digital devices and golf products. These patents expire atvarious times, and patents issued for applications filed this year in the U.S. willlast until 2027 for design patents and until 2033 for utility patents.
We believe our success depends primarily upon our capabilities in design,research and development, production, and marketing rather than exclusivelyupon our patent position. However, we have followed a policy of filing patentapplications for the United States and foreign patents on inventions, designs,and improvements that we deem valuable.
52

PART I
Employees
As of May 31, 2013, we had approximately 48,000 employees worldwide,including retail and part-time employees. Management considers itsrelationship with employees to be excellent. None of our employees arerepresented by a union, except for certain employees in the EmergingMarkets geography, where local law requires those employees to berepresented by a trade union. Also, in some countries outside of the United
States, local laws require employee representation by works councils (whichmay be entitled to information and consultation on certain Companydecisions) or by organizations similar to a union. In certain Europeancountries, we are required by local law to enter into and/or comply withindustry-wide or national collective bargaining agreements. NIKE has neverexperienced a material interruption of operations due to labor disagreements.
Executive Officers of the Registrant
The executive officers of NIKE, Inc. as of July 19, 2013 are as follows:
Philip H. Knight, Chairman of the Board of Directors — Mr. Knight, 75, adirector since 1968, is a co-founder of NIKE and, except for the period fromJune 1983 through September 1984, served as its President from 1968 to1990 and from June 2000 to December 2004. Prior to 1968, Mr. Knight wasa certified public accountant with Price Waterhouse and Coopers & Lybrandand was an Assistant Professor of Business Administration at Portland StateUniversity.
Mark G. Parker, President and Chief Executive Officer — Mr. Parker, 57,was appointed President and Chief Executive Officer in January 2006. He hasbeen employed by NIKE since 1979 with primary responsibilities in productresearch, design and development, marketing, and brand management.Mr. Parker was appointed divisional Vice President in charge of productdevelopment in 1987, corporate Vice President in 1989, General Manager in1993, Vice President of Global Footwear in 1998, and President of the NIKEBrand in 2001.
David J. Ayre, Executive Vice President, Global Human Resources —Mr. Ayre, 53, joined NIKE as Vice President, Global Human Resources in2007. Prior to joining NIKE, he held a number of senior human resourcepositions with PepsiCo, Inc. since 1990, most recently as head of Talent andPerformance Rewards.
Donald W. Blair, Executive Vice President and Chief Financial Officer —Mr. Blair, 55, joined NIKE in November 1999. Prior to joining NIKE, he held anumber of financial management positions with PepsiCo, Inc., including VicePresident, Finance of Pepsi-Cola Asia, Vice President, Planning of PepsiCo’sPizza Hut Division, and Senior Vice President, Finance of The Pepsi BottlingGroup, Inc. Prior to joining PepsiCo, Mr. Blair was a certified publicaccountant with Deloitte, Haskins, and Sells.
Trevor A. Edwards, President, NIKE Brand — Mr. Edwards, 50, joinedNIKE in 1992. He was appointed Marketing Manager, Strategic Accounts forFoot Locker in 1993, Director of Marketing for the Americas Region in 1995,Director of Marketing for Europe in 1997, Vice President, Marketing for theEurope, Middle East and Africa Region in 1999, and Vice President, U.S.Brand Marketing in 2000. Mr. Edwards was appointed corporate VicePresident, Global Brand Management in 2002, Vice President, Global Brandand Category Management in 2006 and President, NIKE Brand in 2013. Priorto NIKE, Mr. Edwards was with the Colgate-Palmolive Company.
Jeanne P. Jackson, President, Product and Merchandising —Ms. Jackson, 61, joined NIKE in 2009. She was appointed President, Directto Consumer in 2009 and President, Product and Merchandising in 2013.
Ms. Jackson also served as a member of the NIKE, Inc. Board of Directorsfrom 2001 through 2009. She founded and served as Chief Executive Officerof MSP Capital, a private investment company, from 2002 to 2009.Ms. Jackson was Chief Executive Officer of Walmart.com from March 2000 toJanuary 2002. She was with Gap, Inc., as President and Chief ExecutiveOfficer of Banana Republic from 1995 to 2000, also serving as ChiefExecutive Officer of Gap, Inc. Direct from 1998 to 2000. Since 1978, she hasheld various retail management positions with Victoria’s Secret, The WaltDisney Company, Saks Fifth Avenue, and Federated Department Stores.
Hilary K. Krane, Executive Vice President, Chief Administrative Officer andGeneral Counsel — Ms. Krane, 49, joined NIKE as Vice President andGeneral Counsel in April 2010. In 2011, her responsibilities expanded and shebecame Vice President, General Counsel and Corporate Affairs. Ms. Kranewas appointed to Executive Vice President, Chief Administrative Officer andGeneral Counsel in 2013. Prior to joining NIKE, Ms. Krane was GeneralCounsel and Senior Vice President for Corporate Affairs at Levi Strauss & Co.from 2006 to 2010. From 1996 to 2006, she was a partner and assistantgeneral counsel at PricewaterhouseCoopers LLP.
Bernard F. Pliska, Vice President, Corporate Controller — Mr. Pliska, 51,joined NIKE as Corporate Controller in 1995. He was appointed VicePresident, Corporate Controller in 2003. Prior to NIKE, Mr. Pliska was withPrice Waterhouse from 1984 to 1995. Mr. Pliska is a certified publicaccountant.
John F. Slusher, Executive Vice President, Global Sports Marketing —Mr. Slusher, 44, has been employed by NIKE since 1998 with primaryresponsibilities in global sports marketing. Mr. Slusher was appointed Directorof Sports Marketing for the Asia Pacific and Americas Regions in 2006,divisional Vice President of Asia Pacific & Americas Sports Marketing inSeptember 2007 and Vice President, Global Sports Marketing in November2007. Prior to joining NIKE, Mr. Slusher was an attorney at the law firm ofO’Melveny & Myers from 1995 to 1998.
Eric D. Sprunk, Chief Operating Officer — Mr. Sprunk, 49, joined NIKE in1993. He was appointed Finance Director and General Manager of theAmericas Region in 1994, Finance Director for NIKE Europe in 1995, RegionalGeneral Manager of NIKE Europe Footwear in 1998, and Vice President &General Manager of the Americas Region in 2000. Mr. Sprunk was appointedcorporate Vice President of Global Footwear in 2001, Vice President ofMerchandising and Product in 2009 and Chief Operating Officer in 2013. Priorto joining NIKE, Mr. Sprunk was a certified public accountant with PriceWaterhouse from 1987 to 1993.
NIKE, INC. 2013 Annual Report and Notice of Annual Meeting 53
FOR
M10
-K

PART I
ITEM 1A. Risk FactorsSpecial Note Regarding Forward-Looking Statements andAnalyst Reports
Certain written and oral statements, other than purely historical information,including estimates, projections, statements relating to NIKE’s businessplans, objectives and expected operating results, and the assumptions uponwhich those statements are based, made or incorporated by reference fromtime to time by NIKE or its representatives in this report, other reports, filingswith the Securities and Exchange Commission, press releases, conferences,or otherwise, are “forward-looking statements” within the meaning of thePrivate Securities Litigation Reform Act of 1995 and Section 21E of theSecurities Exchange Act of 1934, as amended. Forward-looking statementsinclude, without limitation, any statement that may predict, forecast, indicate,or imply future results, performance, or achievements, and may contain thewords “believe,” “anticipate,” “expect,” “estimate,” “project,” “will be,” “willcontinue,” “will likely result,” or words or phrases of similar meaning. Forward-looking statements involve risks and uncertainties which may cause actualresults to differ materially from the forward-looking statements. The risks anduncertainties are detailed from time to time in reports filed by NIKE with theSecurities and Exchange Commission, including Forms 8-K, 10-Q, and 10-K,and include, among others, the following: international, national and localgeneral economic and market conditions; the size and growth of the overallathletic footwear, apparel, and equipment markets; intense competitionamong designers, marketers, distributors and sellers of athletic footwear,apparel, and equipment for consumers and endorsers; demographicchanges; changes in consumer preferences; popularity of particular designs,categories of products, and sports; seasonal and geographic demand forNIKE products; difficulties in anticipating or forecasting changes in consumerpreferences, consumer demand for NIKE products, and the various marketfactors described above; difficulties in implementing, operating, andmaintaining NIKE’s increasingly complex information systems and controls,including, without limitation, the systems related to demand and supplyplanning, and inventory control; interruptions in data and informationtechnology systems; data security; fluctuations and difficulty in forecastingoperating results, including, without limitation, the fact that advance futuresorders may not be indicative of future revenues due to changes in shipmenttiming, the changing mix of futures and at-once orders, and discounts, ordercancellations and returns; the ability of NIKE to sustain, manage or forecast itsgrowth and inventories; the size, timing and mix of purchases of NIKE’sproducts; increases in the cost of materials, labor and energy used tomanufacture products, new product development and introduction; the abilityto secure and protect trademarks, patents, and other intellectual property;product performance and quality; customer service; adverse publicity; theloss of significant customers or suppliers; dependence on distributors andlicensees; business disruptions; increased costs of freight and transportationto meet delivery deadlines; increases in borrowing costs due to any decline inour debt ratings; changes in business strategy or development plans; generalrisks associated with doing business outside the United States, including,without limitation, exchange rate fluctuations, import duties, tariffs, quotas,political and economic instability, and terrorism; changes in governmentregulations; the impact of, including business and legal developments relatingto, climate change; natural disasters; liability and other claims assertedagainst NIKE; the ability to attract and retain qualified personnel; the effects ofour decision to invest in or divest of businesses; and other factors referencedor incorporated by reference in this report and other reports.
The risks included here are not exhaustive. Other sections of this report mayinclude additional factors which could adversely affect NIKE’s business andfinancial performance. Moreover, NIKE operates in a very competitive andrapidly changing environment. New risk factors emerge from time to time andit is not possible for management to predict all such risk factors, nor can itassess the impact of all such risk factors on NIKE’s business or the extent towhich any factor, or combination of factors, may cause actual results to differmaterially from those contained in any forward-looking statements. Giventhese risks and uncertainties, investors should not place undue reliance onforward-looking statements as a prediction of actual results.
Investors should also be aware that while NIKE does, from time to time,communicate with securities analysts, it is against NIKE’s policy to disclose tothem any material non-public information or other confidential commercialinformation. Accordingly, shareholders should not assume that NIKE agreeswith any statement or report issued by any analyst irrespective of the contentof the statement or report. Furthermore, NIKE has a policy against issuing orconfirming financial forecasts or projections issued by others. Thus, to theextent that reports issued by securities analysts contain any projections,forecasts or opinions, such reports are not the responsibility of NIKE.
Our products face intense competition.
NIKE is a consumer products company and the relative popularity of varioussports and fitness activities and changing design trends affect the demand forour products. The athletic footwear, apparel, and equipment industry is highlycompetitive in the United States and on a worldwide basis. We competeinternationally with a significant number of athletic and leisure footwearcompanies, athletic and leisure apparel companies, sports equipmentcompanies, and large companies having diversified lines of athletic and leisurefootwear, apparel, and equipment. We also compete with other companiesfor the production capacity of independent manufacturers that produce ourproducts and for import quota capacity.
Our competitors’ product offerings, technologies, marketing expenditures(including expenditures for advertising and endorsements), pricing, costs ofproduction, and customer service are areas of intense competition. This, inaddition to rapid changes in technology and consumer preferences in themarkets for athletic and leisure footwear and apparel, and athletic equipment,constitute significant risk factors in our operations. If we do not adequatelyand timely anticipate and respond to our competitors, our costs may increaseor the consumer demand for our products may decline significantly.
Failure to maintain our reputation and brand image couldnegatively impact our business.
Our iconic brands have worldwide recognition, and our success depends onour ability to maintain and enhance our brand image and reputation.Maintaining, promoting and growing our brands will depend on our designand marketing efforts, including advertising and consumer campaigns,product innovation and product quality. Our commitment to productinnovation and quality and our continuing investment in design (includingmaterials) and marketing may not have the desired impact on our brandimage and reputation. We could be adversely impacted if we fail to achieveany of these objectives or if the reputation or image of any of our brands istarnished or receives negative publicity. In addition, adverse publicity aboutregulatory or legal action against us could damage our reputation and brandimage, undermine consumer confidence in us and reduce long-term demandfor our products, even if the regulatory or legal action is unfounded or notmaterial to our operations.
In addition, our success in maintaining, extending and expanding our brandimage depends on our ability to adapt to a rapidly changing mediaenvironment, including our increasing reliance on social media and onlinedissemination of advertising campaigns. Negative posts or comments aboutus on social networking websites could seriously damage our reputation andbrand image. If we do not maintain, extend and expand our brand image,then our product sales, financial condition and results of operations could bematerially and adversely affected.
If we are unable to anticipate consumer preferences anddevelop new products, we may not be able to maintain orincrease our net revenues and profits.
Our success depends on our ability to identify, originate and define producttrends as well as to anticipate, gauge and react to changing consumerdemands in a timely manner. However, long lead times for many of ourproducts may make it more difficult for us to respond rapidly to new orchanging product trends or consumer preferences. All of our products are
54

PART I
subject to changing consumer preferences that cannot be predicted withcertainty. Our new products may not receive consumer acceptance asconsumer preferences could shift rapidly to different types of performanceproducts or away from these types of products altogether, and our futuresuccess depends in part on our ability to anticipate and respond to thesechanges. If we fail to anticipate accurately and respond to trends and shifts inconsumer preferences by adjusting the mix of existing product offerings,developing new products, designs, styles and categories, and influencingsports and fitness preferences through aggressive marketing, we couldexperience lower sales, excess inventories and lower profit margins, any ofwhich could have an adverse effect on our results of operations and financialcondition. In addition, we market our products globally through a diversespectrum of advertising and promotional programs and campaigns, includingsocial media and online advertising. If we do not successfully market ourproducts or if advertising and promotional costs increase, these factors couldhave an adverse effect on our business, financial condition and results ofoperation.
We rely on technical innovation and high quality productsto compete in the market for our products.
Technical innovation and quality control in the design and manufacturingprocess of footwear, apparel, and athletic equipment is essential to thecommercial success of our products. Research and development plays a keyrole in technical innovation. We rely upon specialists in the fields ofbiomechanics, exercise physiology, engineering, industrial design and relatedfields, as well as research committees and advisory boards made up ofathletes, coaches, trainers, equipment managers, orthopedists, podiatrists,and other experts to develop and test cutting edge performance products.While we strive to produce products that help to reduce injury, enhanceathletic performance and maximize comfort, if we fail to introduce technicalinnovation in our products, consumer demand for our products could decline,and if we experience problems with the quality of our products, we may incursubstantial expense to remedy the problems.
Failure to continue to obtain high quality endorsers of ourproducts could harm our business.
We establish relationships with professional athletes, sports teams andleagues to evaluate, promote, and establish product authenticity withconsumers. If certain endorsers were to stop using our products contrary totheir endorsement agreements, our business could be adversely affected. Inaddition, actions taken by athletes, teams or leagues associated with ourproducts that harm the reputations of those athletes, teams or leagues, ornegative posts or comments about our sports marketing endorsements onsocial networking websites, could also seriously harm our brand image withconsumers and, as a result, could have an adverse effect on our sales andfinancial condition. In addition, poor performance by our endorsers, a failure tocontinue to correctly identify promising athletes to use and endorse ourproducts, or a failure to enter into cost effective endorsement arrangementswith prominent athletes and sports organizations could adversely affect ourbrand and result in decreased sales of our products.
Global capital and credit market conditions, and resultingdeclines in consumer confidence and spending, couldhave a material adverse effect on our business, operatingresults, and financial condition.
The uncertain state of the global economy continues to impact businessesaround the world. Continuing volatility and disruption in the global capital andcredit markets have led to fluctuations in the availability of business credit andcapital liquidity, a contraction of consumer credit, business failures, higherunemployment, and declines in consumer confidence and spending in manyparts of the world. If global economic and financial market conditionsdeteriorate or remain weak for an extended period of time, the followingfactors could have a material adverse effect on our business, operatingresults, and financial condition:
• Slower consumer spending may result in reduced demand for ourproducts, reduced orders from retailers for our products, ordercancellations, lower revenues, higher discounts, increased inventories, andlower gross margins.
• We may be unable to find suitable investments that are safe, liquid, andprovide a reasonable return. This could result in lower interest income orlonger investment horizons. Disruptions to capital markets or the bankingsystem may also impair the value of investments or bank deposits wecurrently consider safe or liquid.
• In the future, we may be unable to access financing in the credit and capitalmarkets at reasonable rates in the event we find it desirable to do so.
• The failure of financial institution counterparties to honor their obligations tous under credit and derivative instruments could jeopardize our ability to relyon and benefit from those instruments. Our ability to replace thoseinstruments on the same or similar terms may be limited under poor marketconditions.
• We conduct transactions in various currencies, which increase ourexposure to fluctuations in foreign currency exchange rates relative to theU.S. Dollar. Continued volatility in the markets and exchange rates forforeign currencies and contracts in foreign currencies could have asignificant impact on our reported financial results and condition.
• Continued volatility and availability in the markets and prices forcommodities and raw materials we use in our products and in our supplychain (such as cotton or petroleum derivatives) could have a materialadverse effect on our costs, gross margins, and profitability.
• If retailers of our products experience declining revenues, or retailersexperience difficulty obtaining financing in the capital and credit markets topurchase our products, this could result in reduced orders for our products,order cancellations, inability of retailers to timely meet their paymentobligations to us, extended payment terms, higher accounts receivable,reduced cash flows, greater expense associated with collection efforts, andincreased bad debt expense.
• If retailers of our products experience severe financial difficulty, some maybecome insolvent and cease business operations, which could reduce theavailability of our products to consumers.
• If contract manufacturers of our products or other participants in our supplychain experience difficulty obtaining financing in the capital and creditmarkets to purchase raw materials or to finance general working capitalneeds, it may result in delays or non-delivery of shipments of our products.
Our business is affected by seasonality, which could resultin fluctuations in our operating results and stock price.
We experience moderate fluctuations in aggregate sales volume during theyear. Historically, revenues in the first and fourth fiscal quarters have slightlyexceeded those in the second and third fiscal quarters. However, the mix ofproduct sales may vary considerably from time to time as a result of changesin seasonal and geographic demand for particular types of footwear, appareland equipment. In addition, our customers may cancel orders, changedelivery schedules or change the mix of products ordered with minimal notice.As a result, we may not be able to accurately predict our quarterly sales.Accordingly, our results of operations are likely to fluctuate significantly fromperiod to period. This seasonality, along with other factors that are beyond ourcontrol, including general economic conditions, changes in consumerpreferences, weather conditions, availability of import quotas and currencyexchange rate fluctuations, could adversely affect our business and cause ourresults of operations to fluctuate. Our operating margins are also sensitive to anumber of factors that are beyond our control, including manufacturing andtransportation costs, shifts in product sales mix, geographic sales trends, andcurrency exchange rate fluctuations, all of which we expect to continue.Results of operations in any period should not be considered indicative of theresults to be expected for any future period.
Futures orders may not be an accurate indication of ourfuture revenues.
We make substantial use of our futures ordering program, which allowsretailers to order five to six months in advance of delivery with the commitmentthat their orders will be delivered within a set period of time at a fixed price.Our futures ordering program allows us to minimize the amount of productswe hold in inventory, purchasing costs, the time necessary to fill customer
NIKE, INC. 2013 Annual Report and Notice of Annual Meeting 55
FOR
M10
-K

PART I
orders, and the risk of non-delivery. We report changes in futures orders in ourperiodic financial reports. Although we believe futures orders are an importantindicator of our future revenues, reported futures orders are not necessarilyindicative of our expectation of changes in revenues for any future period. Thisis because the mix of orders can shift between futures and at-once orders. Inaddition, foreign currency exchange rate fluctuations, order cancellations,shipping timing, returns, and discounts can cause differences in thecomparisons between futures orders and actual revenues. Moreover, asignificant portion of our revenue is not derived from futures orders, includingat-once and close-out sales of NIKE Brand footwear and apparel, sales ofNIKE brand equipment, sales from our Direct to Consumer operations, andsales from our Other Businesses.
Our futures ordering program does not prevent excessinventories or inventory shortages, which could result indecreased operating margins and harm to our business.
We purchase products from manufacturers outside of our futures orderingprogram and in advance of customer orders, which we hold in inventory andresell to customers. There is a risk we may be unable to sell excess productsordered from manufacturers. Inventory levels in excess of customer demandmay result in inventory write-downs, and the sale of excess inventory atdiscounted prices could significantly impair our brand image and have anadverse effect on our operating results and financial condition. Conversely, ifwe underestimate consumer demand for our products or if our manufacturersfail to supply products we require at the time we need them, we mayexperience inventory shortages. Inventory shortages might delay shipmentsto customers, negatively impact retailer and distributor relationships, anddiminish brand loyalty.
The difficulty in forecasting demand also makes it difficult to estimate ourfuture results of operations and financial condition from period to period. Afailure to accurately predict the level of demand for our products couldadversely affect our net revenues and net income, and we are unlikely toforecast such effects with any certainty in advance.
We may be adversely affected by the financial health of ourretailers.
We extend credit to our customers based on an assessment of a customer’sfinancial condition, generally without requiring collateral. To assist in thescheduling of production and the shipping of seasonal products, we offercustomers the ability to place orders five to six months ahead of deliveryunder our futures ordering program. These advance orders may be canceled,and the risk of cancellation may increase when dealing with financially ailingretailers or retailers struggling with economic uncertainty. In the past, somecustomers have experienced financial difficulties, which have had an adverseeffect on our business. When the retail economy weakens, retailers may bemore cautious with orders. A slowing economy in our key markets couldadversely affect the financial health of our customers, which in turn could havean adverse effect on our results of operations and financial condition. Inaddition, product sales are dependent in part on high quality merchandisingand an appealing store environment to attract consumers, which requirescontinuing investments by retailers. Retailers who experience financialdifficulties may fail to make such investments or delay them, resulting in lowersales and orders for our products.
Consolidation of retailers or concentration of retail marketshare among a few retailers may increase and concentrateour credit risk, and impair our ability to sell our products.
The athletic footwear, apparel, and equipment retail markets in somecountries are dominated by a few large athletic footwear, apparel, andequipment retailers with many stores. These retailers have in the pastincreased their market share and may continue to do so in the future byexpanding through acquisitions and construction of additional stores. Thesesituations concentrate our credit risk with a relatively small number of retailers,and, if any of these retailers were to experience a shortage of liquidity, it wouldincrease the risk that their outstanding payables to us may not be paid. Inaddition, increasing market share concentration among one or a few retailersin a particular country or region increases the risk that if any one of them
substantially reduces their purchases of our products, we may be unable tofind a sufficient number of other retail outlets for our products to sustain thesame level of sales and revenues.
Our Direct to Consumer operations have required and willcontinue to require a substantial investment andcommitment of resources and are subject to numerousrisks and uncertainties.
Our Direct to Consumer locations have required substantial fixed investmentin equipment and leasehold improvements, information systems, inventoryand personnel. We have entered into substantial operating leasecommitments for retail space. Certain stores have been designed and built toserve as high-profile venues to promote brand awareness and marketingactivities. Because of their unique design elements, locations and size, thesestores require substantially more investment than certain of our other stores.Due to the high fixed-cost structure associated with our Direct to Consumeroperations, a decline in sales or the closure or poor performance of individualor multiple stores could result in significant lease termination costs, write-offsof equipment and leasehold improvements, and employee-related costs.
Many factors unique to retail operations, some of which are beyond theCompany’s control, pose risks and uncertainties. Risks include, but are notlimited to: credit card fraud; mismanagement of existing retail channelpartners; and inability to manage costs associated with store constructionand operation. Risks specific to our e-commerce business also includediversion of sales from our brick and mortar stores, difficulty in recreating thein-store experience through direct channels and liability for online content. Ourfailure to successfully respond to these risks might adversely affect sales inour e-commerce business, as well as damage our reputation and brands.
Failure to adequately protect or enforce our intellectualproperty rights could adversely affect our business.
We utilize trademarks on nearly all of our products and believe that havingdistinctive marks that are readily identifiable is an important factor in creating amarket for our goods, in identifying us, and in distinguishing our goods fromthe goods of others. We consider our NIKE® and Swoosh Design®
trademarks to be among our most valuable assets and we have registeredthese trademarks in almost 170 jurisdictions. In addition, we own many othertrademarks that we utilize in marketing our products. In addition, we ownmany other trademarks that we utilize on or in the marketing of our products.
We believe that our trademarks, patents, trade secrets and other intellectualproperty rights are important to our brand, our success, and our competitiveposition. We periodically discover products that are counterfeit reproductionsof our products or that otherwise infringe on our intellectual property rights. Ifwe are unsuccessful in challenging a party’s products on the basis of tradesecret misappropriation or trademark, copyright, design patent, utility patent,or other intellectual property infringement, continued sales of these productscould adversely affect our sales and our brand and result in the shift ofconsumer preference away from our products.
The actions we take to establish and protect trademarks, copyrights, tradesecrets, patents, and other intellectual property rights may not be adequate toprevent imitation of our products by others or to prevent others from seekingto block sales of our products as violations of proprietary rights.
We may be subject to liability if third parties successfully claim that we infringeon their trademarks, copyrights, patents, or other intellectual property rights.Defending infringement claims could be expensive and time-consuming andmight result in our entering into costly license agreements. We also may besubject to significant damages or injunctions against development, use,importation and/or sale of certain products.
We take various actions to prevent confidential information from unauthorizeduse and/or disclosure. Such actions include contractual measures such asentering into non-disclosure agreements and providing confidentialinformation awareness training. Our controls and efforts to preventunauthorized use and/or disclosure of confidential information might notalways be effective. Confidential information that is related to businessstrategy, new technologies, mergers and acquisitions, unpublished financial
56
PART I
results or personal data could be prematurely or inadvertently used and/ordisclosed resulting in a loss of reputation, a decline in our stock price, anegative impact on our market position, and could lead to damages, fines,penalties, or injunctions.
In addition, the laws of certain foreign countries may not protect or allowenforcement of intellectual property rights to the same extent as the laws ofthe United States. We may face significant expenses and liability in connectionwith the protection of our intellectual property rights outside the United States,and if we are unable to successfully protect our rights or resolve intellectualproperty conflicts with others, our business or financial condition may beadversely affected.
We are subject to periodic litigation and other regulatoryproceedings, which could result in unexpected expense oftime and resources.
From time to time we are called upon to defend ourselves against lawsuitsand regulatory actions relating to our business. Due to the inherentuncertainties of litigation and regulatory proceedings, we cannot accuratelypredict the ultimate outcome of any such proceedings. An unfavorableoutcome could have an adverse impact on our business, financial conditionand results of operations. In addition, any significant litigation in the future,regardless of its merits, could divert management’s attention from ouroperations and result in substantial legal fees.
Failure of our contractors or our licensees’ contractors tocomply with our code of conduct, local laws, and otherstandards could harm our business.
We work with hundreds of contractors outside of the United States tomanufacture our products, and we also have license agreements that permitunaffiliated parties to manufacture or contract for the manufacture of productsusing our trademarks. We impose, and require the contractors that directlymanufacture our products and our licensees the contract with manufacturersto make products bearing our trademarks, a code of conduct and otherenvironmental, health, and safety standards for the benefit of workers. Wealso require these contractors to comply with applicable standards forproduct safety. Notwithstanding their contractual obligations, from time totime contractors may not comply with such standards or applicable local lawor our licensees may fail to enforce such standards or applicable local law ontheir contractors. Significant or continuing noncompliance with suchstandards and laws by one or more contractors could harm our reputation orresult in a product recall and, as a result, could have an adverse effect on oursales and financial condition.
Our international operations involve inherent risks whichcould result in harm to our business.
Virtually all of our athletic footwear and apparel is manufactured outside of theUnited States, and the majority of our products are sold outside of the UnitedStates. Accordingly, we are subject to the risks generally associated withglobal trade and doing business abroad, which include foreign laws andregulations, varying consumer preferences across geographic regions,political unrest, disruptions or delays in cross-border shipments, and changesin economic conditions in countries in which we manufacture or sell products.In addition, disease outbreaks, terrorist acts and military conflict haveincreased the risks of doing business abroad. These factors, among others,could affect our ability to manufacture products or procure materials, ourability to import products, our ability to sell products in international markets,and our cost of doing business. If any of these or other factors make theconduct of business in a particular country undesirable or impractical, ourbusiness could be adversely affected. In addition, many of our importedproducts are subject to duties, tariffs, or quotas that affect the cost andquantity of various types of goods imported into the United States and othercountries. Any country in which our products are produced or sold mayeliminate, adjust or impose new quotas, duties, tariffs, safeguard measures,anti-dumping duties, cargo restrictions to prevent terrorism, restrictions onthe transfer of currency, climate change legislation, product safety regulationsor other charges or restrictions, any of which could have an adverse effect onour results of operations and financial condition.
Changes in tax laws and unanticipated tax liabilities couldadversely affect our effective income tax rate andprofitability.
We are subject to income taxes in the United States and numerous foreignjurisdictions. Increases in income tax rates could reduce our after-tax incomefrom affected jurisdictions. We earn a substantial portion of our income inforeign countries. If our capital or financing needs in the United States requireus to repatriate earnings from foreign jurisdictions above our current levels,our effective income tax rates for the affected periods could be negativelyimpacted. Current economic and political conditions make tax rules in anyjurisdiction, including the United States, subject to significant change. Therehave been proposals to reform U.S. tax laws that could significantly impacthow U.S. multinational corporations are taxed on foreign earnings. Althoughwe cannot predict whether or in what form these proposals will pass, severalof the proposals being considered, if enacted into law, could have an adverseimpact on our income tax expense and cash flows.
Our effective income tax rate in the future could be adversely affected by anumber of factors, including changes in the mix of earnings in countries withdiffering statutory tax rates, changes in the valuation of deferred tax assetsand liabilities, changes in tax laws, the outcome of income tax audits invarious jurisdictions around the world, and any repatriation of non-U.S.earnings for which we have not previously provided for U.S. taxes. TheCompany is also subject to the examination of its tax returns by the InternalRevenue Service and other tax authorities. We regularly assess all of thesematters to determine the adequacy of our tax provision, which is subject tosignificant discretion. Although we believe our tax provisions are adequate,the final determination of tax audits and any related disputes could bematerially different from our historical income tax provisions and accruals. Theresults of audits or related disputes could have an adverse effect on ourfinancial statements for the period or periods for which the applicable finaldeterminations are made.
Currency exchange rate fluctuations could result in lowerrevenues, higher costs and decreased margins andearnings.
A majority of our products are sold outside of the United States. As a result,we conduct transactions in various currencies, which increase our exposureto fluctuations in foreign currency exchange rates relative to the U.S. Dollar.Our international revenues and expenses generally are derived from sales andoperations in foreign currencies, and these revenues and expenses could beaffected by currency fluctuations, including amounts recorded in foreigncurrencies and translated into U.S. Dollars for consolidated financial reporting.Currency exchange rate fluctuations could also disrupt the business of theindependent manufacturers that produce our products by making theirpurchases of raw materials more expensive and more difficult to finance.Foreign currency fluctuations could have an adverse effect on our results ofoperations and financial condition.
We may hedge certain foreign currency exposures to lessen and delay, butnot to completely eliminate, the effects of foreign currency fluctuations on ourfinancial results. Since the hedging activities are designed to lessen volatility,they not only reduce the negative impact of a stronger U.S. Dollar, but theyalso reduce the positive impact of a weaker U.S. Dollar. Our future financialresults could be significantly affected by the value of the U.S. Dollar in relationto the foreign currencies in which we conduct business. The degree to whichour financial results are affected for any given time period will depend in partupon our hedging activities.
If one or more of our counterparty financial institutionsdefault on their obligations to us or fail, we may incursignificant losses.
As part of our hedging activities, we enter into transactions involving derivativefinancial instruments, which may include forward contracts, commodityfutures contracts, option contracts, collars and swaps, with various financialinstitutions. In addition, we have significant amounts of cash, cash equivalentsand other investments on deposit or in accounts with banks or other financialinstitutions in the United States and abroad. As a result, we are exposed to
NIKE, INC. 2013 Annual Report and Notice of Annual Meeting 57
FOR
M10
-K

PART I
the risk of default by or failure of counterparty financial institutions. The risk ofcounterparty default or failure may be heightened during economicdownturns and periods of uncertainty in the financial markets. If one of ourcounterparties were to become insolvent or file for bankruptcy, our ability torecover losses incurred as a result of default or our assets that are depositedor held in accounts with such counterparty may be limited by thecounterparty’s liquidity or the applicable laws governing the insolvency orbankruptcy proceedings. In the event of default or failure of one or more of ourcounterparties, we could incur significant losses, which could negativelyimpact our results of operations and financial condition.
Our products are subject to risks associated with overseassourcing, manufacturing, and financing.
The principal materials used in our apparel products — natural and syntheticfabrics and threads, plastic and metal hardware, and specialized performancefabrics designed to repel rain or snow, retain heat, or efficiently wick moistureaway from the body — are available in countries where our manufacturingtakes place. The principal materials used in our footwear products — naturaland synthetic rubber, plastic compounds, foam cushioning materials, nylon,leather, canvas and polyurethane films — are also locally available tomanufacturers. Both our apparel and footwear products are dependent uponthe ability of our unaffiliated contract manufacturers’ to locate, train andemploy adequate personnel. NIKE contractors and suppliers buy rawmaterials in bulk and are subject to wage rates that are oftentimes regulatedby the governments of the countries in which our products are manufactured.
There could be a significant disruption in the supply of fabrics or raw materialsfrom current sources or, in the event of a disruption, we might not be able tolocate alternative suppliers of materials of comparable quality at anacceptable price, or at all. Further, there may be wage increases, whethergovernment mandated or otherwise, that affect our unaffiliated contractmanufacturers. In addition, we cannot be certain that our unaffiliatedmanufacturers will be able to fill our orders in a timely manner. If weexperience significant increases in demand, or reductions in the availability ofmaterials, or need to replace an existing manufacturer, there can be noassurance that additional supplies of fabrics or raw materials or additionalmanufacturing capacity will be available when required on terms that areacceptable to us, or at all, or that any supplier or manufacturer would allocatesufficient capacity to us in order to meet our requirements. In addition, even ifwe are able to expand existing or find new manufacturing or sources ofmaterials, we may encounter delays in production and added costs as aresult of the time it takes to train suppliers and manufacturers in our methods,products, quality control standards, and labor, health and safety standards.Any delays, interruption or increased costs in labor or wages, or the supply ofmaterials or manufacture of our products could have an adverse effect on ourability to meet retail customer and consumer demand for our products andresult in lower revenues and net income both in the short and long-term.
Because independent manufacturers manufacture a majority of our productsoutside of our principal sales markets, our products must be transported bythird parties over large geographic distances. Delays in the shipment ordelivery of our products due to the availability of transportation, workstoppages, port strikes, infrastructure congestion, or other factors, and costsand delays associated with consolidating or transitioning betweenmanufacturers, could adversely impact our financial performance. In addition,manufacturing delays or unexpected demand for our products may require usto use faster, but more expensive, transportation methods such as air freight,which could adversely affect our profit margins. The cost of oil is a significantcomponent in manufacturing and transportation costs, so increases in theprice of petroleum products can adversely affect our profit margins.
In addition, Sojitz America performs significant import-export financingservices for most of the NIKE Brand products sold outside of the UnitedStates, Europe, Middle East, Africa, and Japan, excluding products producedand sold in the same country. Any failure of Sojitz America to provide theseservices or any failure of Sojitz America’s banks could disrupt our ability toacquire products from our suppliers and to deliver products to our customersoutside of the United States, Europe, Middle East, Africa, and Japan. Such adisruption could result in canceled orders that would adversely affect salesand profitability.
Our success depends on our global distribution facilities.
We distribute our products to customers directly from the factory and throughdistribution centers located throughout the world. Our ability to meetcustomer expectations, manage inventory, complete sales and achieveobjectives for operating efficiencies and growth, particularly in emergingmarkets, depends on the proper operation of our distribution facilities, thedevelopment or expansion of additional distribution capabilities, and thetimely performance of services by third parties (including those involved inshipping product to and from our distribution facilities). Our distributionfacilities could be interrupted by information technology problems anddisasters such as earthquakes or fires. Any significant failure in our distributionfacilities could result in an adverse effect on our business. We maintainbusiness interruption insurance, but it may not adequately protect us fromadverse effects that could be caused by significant disruptions in ourdistribution facilities.
We rely significantly on information technology to operateour business, including our supply chain and retailoperations, and any failure, inadequacy, breach,interruption or security failure of that technology or anymisappropriation of any data could harm our reputation orour ability to effectively operate our business.
We are heavily dependent on information technology systems and networks,including the Internet and third-party hosted services (“information technologysystems”), across our supply chain, including product design, production,forecasting, ordering, manufacturing, transportation, sales, and distribution,as well as for processing financial information for external and internalreporting purposes, retail operations and other business activities. Our abilityto effectively manage and maintain our inventory and to ship products tocustomers on a timely basis depends significantly on the reliability of theseinformation technology systems. Over a number of years, we haveimplemented information technology systems in all of the geographicalregions in which we operate. Our work to integrate and enhance thesesystems and related processes in our global operations is ongoing. The failureof these systems to operate effectively, problems with transitioning toupgraded or replacement systems, or a breach in security of these systemscould cause delays in product fulfillment and reduced efficiency of ouroperations, could require significant capital investments to remediate theproblem, and may have an adverse effect on our results of operations andfinancial condition.
We also use information technology systems to process financial informationand results of operations for internal reporting purposes and to comply withregulatory financial reporting, legal and tax requirements. If our informationtechnology systems suffer severe damage, disruption or shutdown and ourbusiness continuity plans do not effectively resolve the issues in a timelymanner, we could experience delays in reporting our financial results, whichcould result in lost revenues and profits, as well as reputational damage.
In addition, hackers and data thieves are increasingly sophisticated andoperate large scale and complex automated attacks. Any breach of ournetwork may result in the loss of valuable business data, our customers’ oremployees’ personal information or a disruption of our business, which couldgive rise to unwanted media attention, damage our customer relationshipsand reputation and result in lost sales, fines or lawsuits. In addition, we mustcomply with increasingly complex regulatory standards enacted to protectthis business and personal data. An inability to maintain compliance withthese regulatory standards could subject us to legal risks.
Furthermore, we depend on information technology systems and personaldata collection and use for digital marketing, digital commerce and themarketing and use of our Digital Sport products. We also engage in electroniccommunications throughout the world between and among our employeesas well as with other third parties, including customers, suppliers, vendors andconsumers. Our information technology systems are critical to many of ouroperating activities and our business processes and may be negativelyimpacted by any service interruption or shutdown. Misuse or leakage ofpersonal information could result in a violation of data privacy laws andregulations and damage our reputation and credibility and have a negativeimpact on revenues and profits.
58

PART I
The market for prime real estate is competitive.
Our ability to effectively obtain real estate to open new retail stores andotherwise conduct our operations, both domestically and internationally,depends on the availability of real estate that meets our criteria for traffic,square footage, co-tenancies, lease economics, demographics, and otherfactors. We also must be able to effectively renew our existing real estateleases. In addition, from time to time, we seek to downsize, consolidate,reposition, or close some of our real estate locations, which may requiremodification of an existing lease. Failure to secure adequate new locations orsuccessfully modify leases for existing locations, or failure to effectivelymanage the profitability of our existing fleet of retail stores, could have anadverse effect on our operating results and financial condition.
Additionally, the economic environment may at times make it difficult todetermine the fair market rent of real estate properties domestically andinternationally. This could impact the quality of our decisions to exercise leaseoptions at previously negotiated rents and the quality of our decisions torenew expiring leases at negotiated rents. Any adverse effect on the quality ofthese decisions could impact our ability to retain real estate locationsadequate to meet our targets or efficiently manage the profitability of ourexisting fleet of stores and could have an adverse effect on our operatingresults and financial condition.
Natural disasters could negatively impact our operatingresults and financial condition.
Natural disasters such as earthquakes, hurricanes, tsunamis or other adverseweather and climate conditions, whether occurring in the U.S. or abroad, andthe consequences and effects thereof, including energy shortages and publichealth issues, could disrupt our operations, or the operations of our vendorsand other suppliers, or result in economic instability that may negativelyimpact our operating results and financial condition.
Our financial results may be adversely affected ifsubstantial investments in businesses and operations failto produce expected returns.
From time to time, we may invest in business infrastructure, acquisitions ofnew businesses, product offering and manufacturing innovation, andexpansion of existing businesses, such as our retail operations, which requiresubstantial cash investments and management attention. We believe costeffective investments are essential to business growth and profitability.However, significant investments are subject to typical risks and uncertaintiesinherent in acquiring or expanding a business. The failure of any significantinvestment to provide their expected returns or profitability could have amaterial adverse effect on our financial results and divert managementattention from more profitable business operations.
We depend on key personnel, the loss of whom wouldharm our business.
Our future success will depend in part on the continued service of keyexecutive officers and personnel. The loss of the services of any key individualcould harm our business. Our future success also depends on our ability torecruit, retain and motivate our personnel sufficiently, both to maintain ourcurrent business and to execute our strategic initiatives. Competition foremployees in our industry is intense and we may not be successful inattracting and retaining such personnel.
The sale of a large number of shares held by our Chairmancould depress the market price of our common stock.
Philip H. Knight, Co-founder and Chairman of our Board of Directors,beneficially owns over 75.6% of our Class A Common Stock. If all of hisClass A Common Stock were converted into Class B Common Stock,Mr. Knight would own over 15.8% of our Class B Common Stock. Theseshares are available for resale, subject to the requirements of theU.S. securities laws. The sale or prospect of the sale of a substantial numberof these shares could have an adverse effect on the market price of ourcommon stock.
Changes in our credit ratings or macroeconomicconditions may affect our liquidity, increasing borrowingcosts and limiting our financing options.
Our long-term debt is currently rated investment grade by Standard & Poor’sand Moody’s Investors Service. If our credit ratings are lowered, borrowingcosts for future long-term debt or short-term credit facilities may increase andour financing options, including our access to the unsecured credit market,could be limited. We may also be subject to restrictive covenants that wouldreduce our flexibility. In addition, macroeconomic conditions, such asincreased volatility or disruption in the credit markets, could adversely affectour ability to refinance existing debt or obtain additional financing to supportoperations or to fund new initiatives.
Anti-takeover provisions may impair an acquisition of theCompany or reduce the price of our common stock.
There are provisions of our articles of incorporation and Oregon law that areintended to protect shareholder interests by providing the Board of Directorsa means to attempt to deny coercive takeover attempts or to negotiate with apotential acquirer in order to obtain more favorable terms. Such provisionsinclude a control share acquisition statute, a freeze-out statute, two classes ofstock that vote separately on certain issues, and the fact that holders ofClass A Common Stock elect three-quarters of the Board of Directorsrounded down to the next whole number. However, such provisions coulddiscourage, delay or prevent an unsolicited merger, acquisition or otherchange in control of our company that some shareholders might believe to bein their best interests or in which shareholders might receive a premium fortheir common stock over the prevailing market price. These provisions couldalso discourage proxy contests for control of the Company.
We may fail to meet market expectations, which couldcause the price of our stock to decline.
Our Class B Common Stock is traded publicly, and at any given time varioussecurities analysts follow our financial results and issue reports on us. Thesereports include information about our historical financial results as well asanalysts’ estimates of our future performance. Analysts’ estimates are basedupon their own opinions and are often different from our estimates orexpectations. If our operating results are below the estimates or expectationsof public market analysts and investors, our stock price could decline. In thepast, securities class action litigation has been brought against NIKE andother companies following a decline in the market price of their securities. Ifour stock price is volatile, we may become involved in this type of litigation inthe future. Any litigation could result in substantial costs and a diversion ofmanagement’s attention and resources that are needed to successfully runour business.
NIKE, INC. 2013 Annual Report and Notice of Annual Meeting 59
FOR
M10
-K

PART I
ITEM 1B. Unresolved Staff CommentsNot applicable.
ITEM 2. PropertiesThe following is a summary of principal properties owned or leased by NIKE.
The NIKE World Campus, owned by NIKE and located near Beaverton,Oregon, USA, is a 250-acre facility of 35 buildings which functions as ourworld headquarters and is occupied by almost 8,000 employees engaged inmanagement, research, design, development, marketing, finance, and otheradministrative functions serving nearly all of our divisions. We also leasevarious office facilities in the surrounding metropolitan area. We lease a similar,but smaller, administrative facility in Hilversum, the Netherlands, which servesas the headquarters for the Western Europe and Central & Eastern Europegeographies. In the United States, there are five significant distribution centersin Memphis, Tennessee; two are owned and three are leased. NIKE Brandapparel and equipment are also shipped from our Foothill Ranch, Californiadistribution center, which we lease. Smaller leased distribution facilities fornon-NIKE Brand businesses are located in various parts of the United States.We also own or lease distribution and customer service facilities outside the
United States. The most significant are the distribution facilities located inTomisato, Japan; Laakdal, Belgium; and Taicang, China; all of these facilitiesare owned.
We manufacture Air-Sole cushioning materials and components at NIKE IHM,Inc. manufacturing facilities located in Beaverton, Oregon and St. Charles,Missouri; these facilities are owned. We also manufacture and sell smallamounts of various other plastic products to other manufacturers throughNIKE IHM, Inc.
Aside from the principal properties described above, we lease over 110 salesoffices and approximately 90 administrative offices worldwide. We lease morethan 750 retail stores worldwide, which consist primarily of factory outletstores. See “United States Market” and “International Markets” in Part 1 of thisReport. Our leases expire at various dates through the year 2033.
ITEM 3. Legal ProceedingsThere are no material pending legal proceedings, other than ordinary routine litigation incidental to our business, to which we are a party or of which any of ourproperty is the subject.
ITEM 4. Mine Safety DisclosuresNot applicable.
60

PART II
PART II
ITEM 5. Market for Registrant’s Common Equity,Related Stockholder Matters and IssuerPurchases of Equity Securities
NIKE’s Class B Common Stock is listed on the New York Stock Exchangeand trades under the symbol NKE. At July 19, 2013, there were 30,586holders of record of our Class B Common Stock and 19 holders of record ofour Class A Common Stock. These figures do not include beneficial ownerswho hold shares in nominee name. The Class A Common Stock is notpublicly traded but each share is convertible upon request of the holder intoone share of Class B Common Stock. The following tables set forth, for each
of the quarterly periods indicated, the high and low sales prices for the Class BCommon Stock as reported on the New York Stock Exchange CompositeTape and dividends declared on the Class A and Class B Common Stock. Allshare and per share amounts presented are reflective of the two-for-onestock split that began trading at the split adjusted price on December 26,2012.
Fiscal 2013 (June 1, 2012 — May 31, 2013) High LowDividendsDeclared
First Quarter $ 54.32 $ 43.89 $ 0.18Second Quarter 50.42 45.30 0.21Third Quarter 55.55 48.46 0.21Fourth Quarter 65.91 53.49 0.21
Fiscal 2012 (June 1, 2011 — May 31, 2012) High LowDividendsDeclared
First Quarter $ 46.83 $ 39.29 $ 0.16Second Quarter 48.38 41.25 0.18Third Quarter 53.96 46.69 0.18Fourth Quarter 57.20 52.17 0.18
The following table presents a summary of share repurchases made by NIKE during the quarter ended May 31, 2013. During the second quarter of fiscal 2013,the Company completed the previous four-year, $5 billion share repurchase program approved by our Board of Directors in September 2008. During the priorprogram, the Company purchased a total of 118.8 million shares at an average price of $42.08 per share. Following the completion of this program, the Companybegan repurchases under the four-year, $8 billion share repurchase program approved by the Board in September 2012.
PeriodTotal Number of
Shares PurchasedAverage Price
Paid per Share
Total Number of SharesPurchased as Part of Publicly
Announced Plans or Programs
Maximum Dollar Value of Sharesthat May Yet Be Purchased
Under the Plans or Programs(In millions)
March 1 — March 31, 2013 2,198,417 $ 54.51 2,198,417 $ 7,333April 1 — April 30, 2013 1,573,111 $ 59.30 1,573,111 $ 7,239May 1 — May 31, 2013 450,000 $ 63.18 450,000 $ 7,211
4,221,528 $ 57.22 4,221,528
NIKE, INC. 2013 Annual Report and Notice of Annual Meeting 61
FOR
M10
-K
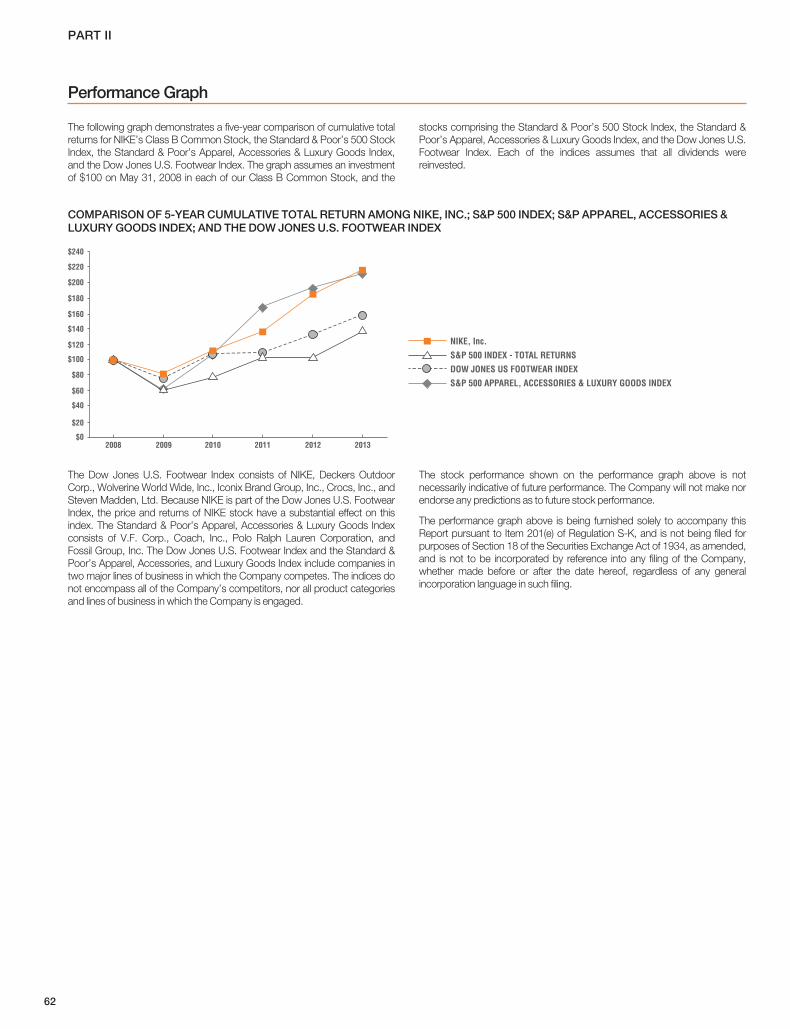
PART II
Performance Graph
The following graph demonstrates a five-year comparison of cumulative totalreturns for NIKE’s Class B Common Stock, the Standard & Poor’s 500 StockIndex, the Standard & Poor’s Apparel, Accessories & Luxury Goods Index,and the Dow Jones U.S. Footwear Index. The graph assumes an investmentof $100 on May 31, 2008 in each of our Class B Common Stock, and the
stocks comprising the Standard & Poor’s 500 Stock Index, the Standard &Poor’s Apparel, Accessories & Luxury Goods Index, and the Dow Jones U.S.Footwear Index. Each of the indices assumes that all dividends werereinvested.
COMPARISON OF 5-YEAR CUMULATIVE TOTAL RETURN AMONG NIKE, INC.; S&P 500 INDEX; S&P APPAREL, ACCESSORIES &LUXURY GOODS INDEX; AND THE DOW JONES U.S. FOOTWEAR INDEX
$240
$220
$200
$180
$160
$140
$120
$100
$80
$60
$40
$20
$02008 2009 2010 2011 2012 2013
NIKE, Inc.
S&P 500 INDEX - TOTAL RETURNS
DOW JONES US FOOTWEAR INDEX
S&P 500 APPAREL, ACCESSORIES & LUXURY GOODS INDEX
The Dow Jones U.S. Footwear Index consists of NIKE, Deckers OutdoorCorp., Wolverine World Wide, Inc., Iconix Brand Group, Inc., Crocs, Inc., andSteven Madden, Ltd. Because NIKE is part of the Dow Jones U.S. FootwearIndex, the price and returns of NIKE stock have a substantial effect on thisindex. The Standard & Poor’s Apparel, Accessories & Luxury Goods Indexconsists of V.F. Corp., Coach, Inc., Polo Ralph Lauren Corporation, andFossil Group, Inc. The Dow Jones U.S. Footwear Index and the Standard &Poor’s Apparel, Accessories, and Luxury Goods Index include companies intwo major lines of business in which the Company competes. The indices donot encompass all of the Company’s competitors, nor all product categoriesand lines of business in which the Company is engaged.
The stock performance shown on the performance graph above is notnecessarily indicative of future performance. The Company will not make norendorse any predictions as to future stock performance.
The performance graph above is being furnished solely to accompany thisReport pursuant to Item 201(e) of Regulation S-K, and is not being filed forpurposes of Section 18 of the Securities Exchange Act of 1934, as amended,and is not to be incorporated by reference into any filing of the Company,whether made before or after the date hereof, regardless of any generalincorporation language in such filing.
62

PART II
ITEM 6. Selected Financial DataUnless otherwise indicated, the following disclosures reflect the Company’s continuing operations; refer to Note 15 — Discontinued Operations for additionalinformation regarding discontinued operations. All per share amounts are reflective of the two-for-one stock split that began trading at the split-adjusted price onDecember 26, 2012.
(Dollars in millions, except per share data and financial ratios)
Financial History2013 2012 2011 2010 2009
Year Ended May 31,Revenues $ 25,313 $ 23,331 $ 20,117 $ 18,324 $ 18,528Gross profit 11,034 10,148 9,202 8,498 8,324Gross margin % 43.6% 43.5% 45.7% 46.4% 44.9%Restructuring charges — — — — 195Net income from continuing operations 2,464 2,269 2,172 1,923 1,754Net income (loss) from discontinued operations 21 (46) (39) (16) (267)Net income 2,485 2,223 2,133 1,907 1,487Earnings per share from continuing operations:
Basic earnings per common share 2.75 2.47 2.28 1.98 1.81Diluted earnings per common share 2.69 2.42 2.24 1.95 1.79
Earnings per share from discontinued operations:Basic earnings per common share 0.02 (0.05) (0.04) (0.02) (0.28)Diluted earnings per common share 0.02 (0.05) (0.04) (0.02) (0.27)
Weighted average common shares outstanding 897.3 920.0 951.1 971.0 969.8Diluted weighted average common sharesoutstanding 916.4 939.6 971.3 987.8 981.4Cash dividends declared per common share 0.81 0.70 0.60 0.53 0.49Cash flow from operations, inclusive ofdiscontinued operations 3,027 1,899 1,812 3,164 1,736Price range of common stock:
High 65.91 57.20 46.15 39.28 35.14Low 43.89 39.29 33.61 25.08 19.12
At May 31,Cash and equivalents $ 3,337 $ 2,317 $ 1,955 $ 3,079 $ 2,291Short-term investments 2,628 1,440 2,583 2,067 1,164Inventories 3,434 3,222 2,611 1,942 2,254Working capital, excluding assets and liabilities ofdiscontinued operations(1)(2) 9,718 7,518 7,266 7,511 6,390Total assets, excluding assets of discontinuedoperations(1) 17,584 14,850 14,438 13,889 12,716Long-term debt 1,210 228 276 446 437Capital Lease Obligations 81 — — — —Redeemable Preferred Stock 0.3 0.3 0.3 0.3 0.3Shareholders’ equity 11,156 10,381 9,843 9,754 8,693Year-end stock price 61.66 54.09 42.23 36.19 28.53Market capitalization 55,124 49,546 39,523 35,032 27,698Financial Ratios:Return on equity 22.9% 22.4% 22.2% 20.8% 21.2%Return on assets 15.2% 15.5% 15.3% 14.5% 14.6%Inventory turns 4.3 4.5 4.8 4.7 4.5Current ratio at May 31 3.5 3.0 2.9 3.3 3.0Price/Earnings ratio at May 31 22.9 22.4 18.9 18.6 15.9
(1) Assets of discontinued operations were $0 million, $615 million, $560 million, $530 million, and $534 million for the years ended May 31, 2013, 2012, 2011, 2010, and 2009, respectively.
(2) Liabilities of discontinued operations were $18 million, $170 million, $184 million, $182 million, and $176 million for the years ended May 31, 2013, 2012, 2011, 2010, and 2009,respectively.
NIKE, INC. 2013 Annual Report and Notice of Annual Meeting 63
FOR
M10
-K

PART II
Selected Quarterly Financial Data
(Unaudited)(Dollars in millions, except per share data)
1st Quarter(1) 2nd Quarter 3rd Quarter 4th Quarter2013 2012 2013 2012 2013 2012 2013 2012
Revenues $ 6,474 $ 5,893 $ 5,955 $ 5,546 $ 6,187 $ 5,656 $ 6,697 $ 6,236Gross profit 2,828 2,618 2,530 2,376 2,736 2,485 2,940 2,669Gross margin % 43.7% 44.4% 42.5% 42.8% 44.2% 43.9% 43.9% 42.8%Net income from continuing operations 585 661 521 480 662 569 696 559Net income (loss) from discontinuedoperations (18) (16) (137) (11) 204 (9) (28) (10)Net income 567 645 384 469 866 560 668 549Earnings per share from continuingoperations:Basic earnings per common share 0.65 0.72 0.58 0.52 0.74 0.62 0.78 0.61Diluted earnings per common share 0.63 0.70 0.57 0.51 0.73 0.61 0.76 0.60Earnings per share from discontinuedoperations:Basic earnings per common share (0.03) (0.02) (0.15) (0.01) 0.23 (0.01) (0.03) (0.01)Diluted earnings per common share (0.02) (0.02) (0.15) (0.01) 0.22 (0.01) (0.03) (0.01)Weighted average common sharesoutstanding 905.6 930.0 897.0 918.5 893.9 915.1 892.6 916.3Diluted weighted average commonshares outstanding 922.8 948.6 913.1 936.9 911.7 934.6 913.4 936.3Cash dividends declared per commonshare 0.18 0.16 0.21 0.18 0.21 0.18 0.21 0.18Price range of common stock
High 54.32 46.83 50.42 48.38 55.55 53.96 65.91 57.20Low 43.89 39.29 45.30 41.25 48.46 46.69 53.49 52.17
(1) Amounts presented have been adjusted from what was previously filed in our Form 10-Q to exclude the results of discontinued operations.
64

PART II
ITEM 7. Management’s Discussion and Analysis ofFinancial Condition and Results of Operations
NIKE designs, develops, markets and sells athletic footwear, apparel,equipment, accessories and services worldwide. We are the largest seller ofathletic footwear and apparel in the world. We sell our products to retailaccounts, through NIKE-owned retail stores and internet websites, which werefer to as our “Direct to Consumer” operations, and through a mix ofindependent distributors, licensees and sales representatives in virtually allcountries around the world. Our goal is to deliver value to our shareholders bybuilding a profitable global portfolio of branded footwear, apparel, equipment,accessories and service businesses. Our strategy is to achieve long-termrevenue growth by creating innovative, “must have” products, building deeppersonal consumer connections with our brands, and delivering compellingconsumer experiences at retail and online.
In addition to achieving long-term, sustainable revenue growth, we continueto strive to deliver shareholder value by driving operational excellence inseveral key areas:
• Expanding gross margin by:
– Making our supply chain a competitive advantage;
– Reducing product costs through a continued focus on manufacturingefficiency, product design and innovation; and
– Delivering innovative, premium products that command higher priceswhile maintaining a strong consumer price-to-value proposition.
• Improving selling and administrative expense productivity by focusing oninvestments that drive economic returns in the form of incremental revenueand gross profit, and leveraging existing infrastructure across our portfolio ofbusinesses to eliminate duplicative costs;
• Improving working capital efficiency; and
• Deploying capital effectively.
Through execution of this strategy, our long-term financial goals continue tobe:
• High single-digit revenue growth,
• Mid-teens earnings per share growth,
• Increased return on invested capital and accelerated cash flows, and
• Consistent results through effective management of our diversified portfolioof businesses.
Over the past ten years, we have achieved or exceeded all of these financialgoals. During this time, revenues and earnings per share for NIKE, Inc.,inclusive of both continuing and discontinued operations, have grown 9% and15%, respectively, on an annual compounded basis. Our return on investedcapital has increased from 18% to 24% and we expanded gross margins byapproximately 260 basis points.
On November 15, 2012, we announced a two-for-one stock split of bothClass A and Class B Common shares. The stock split was in the form of a 100percent stock dividend payable on December 24, 2012 to shareholders ofrecord at the close of business December 10, 2012. Common stock begantrading at the split-adjusted price on December 26, 2012. All share numbersand per share amounts presented reflect the stock split.
Our fiscal 2013 results from continuing operations demonstrated the power ofthe NIKE, Inc. portfolio to deliver consistent growth in revenues, earnings, andcash returns to shareholders, while investing for long-term growth. Despitethe ongoing challenges in the global economy, we delivered record revenuesand earnings per share in fiscal 2013. Our revenues grew 8% to $25.3 billion,net income from continuing operations increased 9% to $2.5 billion, and wedelivered diluted earnings per share of $2.69, an 11% increase from fiscal2012.
Earnings before interest and income taxes for continuing operationsincreased 8% for fiscal 2013, driven by revenue growth and improved grossmargin, which more than offset higher selling and administrative expense as apercentage of revenue. The increase in revenues was driven by growthacross most NIKE Brand geographies, key categories and product types.This growth was primarily fueled by:
• Innovative performance and sportswear products, incorporating proprietarytechnology platforms such as NIKE Air, Lunar, Shox, FREE, Flywire, Dri-F.I.T, FlyKnit, NIKE +, and NIKE Fuel;
• Deep brand connections to consumers through a category lens, reinforcedby investments in endorsements by high profile athletes and teams (such asthe NFL, FC Barcelona, Michael Jordan), high impact marketing aroundglobal sporting events (such as the Olympics, European FootballChampionships and NBA Finals) and digital marketing; and
• Strong category retail presentation online and at NIKE owned and retailpartner stores.
Revenues also improved for each of our Other Businesses (Converse, NIKEGolf and Hurley).
Our gross margins improved largely due to the positive impact of higheraverage selling prices, partially offset by higher product input costs, primarilylabor cost inflation, and foreign currency headwinds.
For fiscal 2013, the growth of our net income from continuing operations waspositively affected by a year-over-year decrease in our effective tax rate. Inaddition, diluted earnings per share grew at a higher rate than net income dueto a 2% decrease in the weighted average number of diluted common sharesoutstanding, as a result of share repurchases during fiscal 2013.
On May 31, 2012, we announced our intention to divest of the Cole Haan andUmbro businesses, which would allow us to better focus our resources ondriving growth in the NIKE, Jordan, Converse and Hurley brands. During thesecond quarter of fiscal 2013 we completed the sale of certain assets of theUmbro brand and recorded a loss on the sale of these assets of $107 million,net of tax. During the third quarter of fiscal 2013 we completed the sale ofCole Haan and recorded a gain on sale of $231 million, net of tax. As ofMay 31, 2013 the Company had substantially completed all transitionservices related to the sale of both businesses. Unless otherwise indicated,the following disclosures reflect the Company’s continuing operations; refer toour “Discontinued Operations” section for additional information regarding ourdiscontinued operations.
While we expect to face continued macroeconomic uncertainties in the globaleconomy, we continue to see opportunities to drive future growth and remaincommitted to effectively managing our business to achieve our financial goalsover the long-term, by executing against the operational strategies outlinedabove.
NIKE, INC. 2013 Annual Report and Notice of Annual Meeting 65
FOR
M10
-K

PART II
Results of OperationsUnless otherwise indicated, the following disclosures reflect the Company’s continuing operations.
(Dollars in millions, except per share data) Fiscal 2013 Fiscal 2012FY13 vs. FY12
% Change Fiscal 2011FY12 vs. FY11
% ChangeRevenues $ 25,313 $ 23,331 8% $ 20,117 16%Cost of sales 14,279 13,183 8% 10,915 21%
Gross profit 11,034 10,148 9% 9,202 10%Gross margin % 43.6% 43.5% 45.7%
Demand creation expense 2,745 2,607 5% 2,344 11%Operating overhead expense 5,035 4,458 13% 4,017 11%
Total selling and administrative expense 7,780 7,065 10% 6,361 11%% of Revenues 30.7% 30.3% 31.6%
Interest (income) expense, net (3) 4 — 4 —Other (income) expense, net (15) 54 — (25) —Income before income taxes 3,272 3,025 8% 2,862 6%Income tax expense 808 756 7% 690 10%
Effective tax rate 24.7% 25.0% 24.1%Net income from continuing operations 2,464 2,269 9% 2,172 4%Net income (loss) from discontinued operations 21 (46) — (39) —
Net income $ 2,485 $ 2,223 12% $ 2,133 4%Diluted earnings per share — ContinuingOperations $ 2.69 $ 2.42 11% $ 2.24 8%Diluted earnings per share — DiscontinuedOperations $ 0.02 $ (0.05) — $ (0.04) —
66

PART II
Consolidated Operating Results
Revenues
(Dollars in millions) Fiscal 2013 Fiscal 2012FY13 vs. FY12
% Change
FY13 vs. FY12% ChangeExcludingCurrency
Changes(2) Fiscal 2011FY12 vs. FY11
% Change
FY12 vs. FY11% ChangeExcludingCurrency
Changes(2)
NIKE, Inc. Revenues (1):NIKE Brand Revenues by:
Footwear $ 14,539 $ 13,428 8% 11% $ 11,519 17% 15%Apparel 6,820 6,336 8% 10% 5,516 15% 13%Equipment 1,405 1,204 17% 20% 1,022 18% 16%Global Brand Divisions 117 111 5% 8% 96 16% 13%
Total NIKE Brand 22,881 21,079 9% 11% 18,153 16% 15%Other Businesses 2,500 2,298 9% 9% 2,041 13% 12%Corporate(3) (68) (46) — — (77) — —TOTAL NIKE, INC. REVENUES $ 25,313 $ 23,331 8% 11% $ 20,117 16% 15%Supplemental NIKE BrandRevenues Details:NIKE Brand Revenues by:Sales to Wholesale Customers $ 18,438 $ 17,438 6% 8% $ 15,181 15% 14%Sales Direct to Consumer 4,326 3,530 23% 24% 2,876 23% 21%Global Brand Divisions 117 111 5% 8% 96 16% 13%TOTAL NIKE BRAND REVENUES $ 22,881 $ 21,079 9% 11% $ 18,153 16% 15%NIKE Brand Revenues on aWholesale Equivalent Basis:(4)
Sales to Wholesale Customers $ 18,438 $ 17,438 6% 8% $ 15,181 15% 14%Sales from our WholesaleOperations to Direct to ConsumerOperations 2,450 1,986 23% 25% 1,603 24% 22%NIKE BRAND WHOLESALEEQUIVALENT REVENUES $ 20,888 $ 19,424 8% 10% $ 16,784 16% 14%NIKE Brand WholesaleEquivalent Revenues byCategory:(4)
Running $ 4,274 $ 3,696 16% 18% $ 2,789 33% 31%Basketball 2,627 2,169 21% 22% 1,863 16% 16%Football (Soccer) 1,931 1,862 4% 9% 1,667 12% 10%Men’s Training 2,380 2,064 15% 17% 1,752 18% 17%Women’s Training 1,067 1,011 6% 8% 840 20% 19%Action Sports 495 497 0% 2% 446 11% 2%Sportswear 5,637 5,741 -2% 1% 5,293 8% 7%Others(5) 2,477 2,384 4% 6% 2,134 12% 11%TOTAL NIKE BRANDWHOLESALE EQUIVALENTREVENUES $ 20,888 $ 19,424 8% 10% $ 16,784 16% 14%
(1) Certain prior year amounts have been reclassified to conform to fiscal 2013 presentation.
(2) Results have been restated using actual exchange rates in use during the comparative period to enhance the visibility of the underlying business trends by excluding the impact oftranslation arising from foreign currency exchange rate fluctuations.
(3) Corporate revenues primarily consist of intercompany revenue eliminations and foreign currency revenue-related hedge gains and losses generated by entities within the NIKE Brandgeographic operating segments and certain Other Businesses through our centrally managed foreign exchange risk management program.
(4) References to NIKE Brand wholesale equivalent revenues are intended to provide context as to the total size of our NIKE Brand market footprint if we had no Direct to Consumeroperations. NIKE Brand wholesale equivalent revenues consist of (1) sales to external wholesale customers and (2) internal sales from our wholesale operations to our Direct to Consumeroperations which are charged at prices that are comparable to prices charged to external wholesale customers.
(5) Others include all other categories and certain adjustments that are not allocated at the category level.
NIKE, INC. 2013 Annual Report and Notice of Annual Meeting 67
FOR
M10
-K

PART II
Fiscal 2013 Compared to Fiscal 2012
On a currency neutral basis, revenues from our NIKE, Inc. continuingoperations grew 11% for fiscal 2013, driven by increases in revenues for boththe NIKE Brand and our Other Businesses. Every NIKE Brand geographyexcept Greater China delivered higher revenues for fiscal 2013. NorthAmerica contributed 7 percentage points of the increase in NIKE, Inc.revenues, while Emerging Markets contributed 2 percentage points andWestern and Central and Eastern Europe each contributed 1 percentagepoint. Greater China’s results reduced NIKE, Inc. revenue growth by 1percentage point. Revenues for our Other Businesses contributed 1percentage point to our consolidated revenue growth.
Excluding the effects of changes in currency exchange rates, NIKE Brandfootwear and apparel revenue increased 11% and 10%, respectively, whileNIKE Brand equipment revenues increased 20% during fiscal 2013. Theincrease in NIKE Brand footwear revenue for fiscal 2013 was attributable togrowth across our Running, Basketball, Football (Soccer), and Sportswearcategories. The growth of NIKE footwear revenues continued to be fueled byincreased demand for performance products, including Running models withNIKE FREE and Lunar technologies, NIKE and Brand Jordan Basketballstyles, and performance Football (soccer) products. In fiscal 2013, unit salesof footwear increased approximately 7% and the average selling price per pairincreased approximately 4%, driven equally by price increases and a shift inmix to higher priced products.
For NIKE Brand apparel, the increase in revenue for fiscal 2013 was driven byour Men’s Training category (which includes the NFL licensed business), inaddition to strong demand for Running and Basketball products. Apparel unitsales in fiscal 2013 increased approximately 7% and the average selling priceper unit increased approximately 3%, reflecting a favorable mix of higherpriced products, such as performance Running, Basketball, and NFL licensedapparel, and to a lesser extent, higher selling prices.
While wholesale revenues remain the largest component of overall NIKEBrand revenues, we continue to expand Direct to Consumer revenues. OurNIKE Brand Direct to Consumer operations include NIKE owned in-line andfactory stores, as well as online sales through NIKE owned websites. For fiscal2013, Direct to Consumer revenues represented approximately 19% of ourtotal NIKE Brand revenues compared to 17% in fiscal 2012. On a currencyneutral basis, Direct to Consumer revenues grew 24% for fiscal 2013, ascomparable store sales grew 14% and we continue to expand our storenetwork and e-commerce business. Comparable store sales includerevenues from NIKE owned in-line and factory stores for which all three of thefollowing requirements have been met: (1) the store has been open at leastone year, (2) square footage has not changed by more than 15% within thepast year, and (3) the store has not been permanently repositioned within thepast year.
Revenues for our Other Businesses are comprised of results from Converse,Hurley and NIKE Golf. Excluding the impact of currency changes, revenuesfor these businesses increased 9% in fiscal 2013, reflecting growth across allbusinesses.
Fiscal 2012 Compared to Fiscal 2011
On a currency neutral basis, revenues for NIKE, Inc.’s continuing operationsgrew 15% for fiscal 2012, driven by increases in revenues for both the NIKEBrand and our Other Businesses. Excluding the effects of changes incurrency exchange rates, revenues for the NIKE Brand increased 15%, asevery NIKE Brand geography delivered higher revenues for fiscal 2012. NorthAmerica contributed approximately 7 percentage points to the NIKE Brandrevenue increase, while the Emerging Markets and Greater Chinageographies contributed approximately 4 and 2 percentage points to theNIKE Brand revenue growth, respectively. Revenues for our OtherBusinesses grew 12% during fiscal 2012, contributing 1 percentage point ofour consolidated revenue growth.
Excluding the effects of changes in currency exchange rates, NIKE Brandfootwear and apparel revenue increased 15% and 13%, respectively, whileNIKE Brand equipment revenues increased 16% during fiscal 2012.Continuing to fuel the growth of our NIKE Brand footwear business was theincreased demand for performance products, including the NIKE Lunar andFREE technologies. The increase in NIKE Brand footwear revenue for fiscal2012 was attributable to double-digit percentage growth in unit sales alongwith a low-single-digit percentage increase in average selling price per pair,primarily reflecting the favorable impact from product price increases, partiallyoffset by higher discounts on close-out sales. The overall increase in footwearsales was driven by growth across all key categories, notably Running,Sportswear and Basketball. For NIKE Brand apparel, the increase in revenuefor fiscal 2012 was driven by mid-single-digit percentage increases in bothunit sales and average selling prices. The increase in average selling priceswas primarily driven by product price increases, partially offset by a higher mixof close-out sales. The overall increase in apparel sales was reflective ofincreased demand across most key categories.
For fiscal 2012, Direct to Consumer channels represented approximately17% of our total NIKE Brand revenues compared to 16% in fiscal 2011. On acurrency neutral basis, Direct to Consumer revenues grew 21% for fiscal2012, as comparable store sales grew 13% and we continue to expand ourstore network and e-commerce business.
Revenues for our Other Businesses consisted of results from our affiliatebrands; Converse, Hurley and NIKE Golf. Excluding the impact of currencychanges, revenues for these businesses increased by 12% in fiscal 2012,reflecting growth across all businesses except Hurley, which was downslightly for the fiscal year.
Futures Orders
Futures orders for NIKE Brand footwear and apparel scheduled for deliveryfrom June through November 2013 were 8% higher than the orders reportedfor the comparable prior year period. The U.S. Dollar futures order amount iscalculated based upon our internal forecast of the currency exchange ratesunder which our revenues will be translated during this period. Excluding theimpact of currency changes, futures orders also increased 8%, as unit orderscontributed approximately 5 percentage points of growth and average sellingprice per unit contributed approximately 3 percentage points of growth.
By geography, futures orders growth was as follows:
Reported FuturesOrders Growth
Futures Orders ExcludingCurrency Changes(1)
North America 12% 12%Western Europe 2% 0%Central & Eastern Europe 14% 12%Greater China 3% 0%Japan -17% 6%Emerging Markets 12% 12%Total NIKE Brand Futures Orders 8% 8%
(1) Growth rates have been restated using constant exchange rates for the comparative period to enhance the visibility of the underlying business trends excluding the impact of foreigncurrency exchange rate fluctuations.
68

PART II
The reported futures orders growth is not necessarily indicative of ourexpectation of revenue growth during this period. This is due to year-over-year changes in shipment timing, because the mix of orders can shift betweenfutures and at-once orders, and the fulfillment of certain orders may falloutside of the schedule noted above. In addition, exchange rate fluctuationsas well as differing levels of order cancellations and discounts can cause
differences in the comparisons between futures orders and actual revenues.Moreover, a significant portion of our revenue is not derived from futuresorders, including at-once and close-out sales of NIKE Brand footwear andapparel, sales of NIKE Brand equipment, sales from our Direct to Consumeroperations, and sales from our Other Businesses.
Gross Margin
(Dollars in millions) Fiscal 2013 Fiscal 2012FY13 vs. FY12
% Change Fiscal 2011FY12 vs. FY11
% ChangeGross Profit $ 11,034 $ 10,148 9% $ 9,202 10%Gross Margin % 43.6% 43.5% 10 bps 45.7% (220) bps
Fiscal 2013 Compared to Fiscal 2012
For fiscal 2013, our consolidated gross margin was 10 basis points higherthan fiscal 2012, primarily driven by higher net average selling prices(approximately 160 basis points) that were attributable to higher prices and afavorable sales mix. The positive benefit of higher net average selling priceswas largely offset by higher product costs (approximately 110 basis points),primarily due to higher factory labor costs, and unfavorable foreign currencyexchange rate movements (approximately 40 basis points).
In addition, we have seen significant shifts in the mix of revenues from higherto lower margin segments of our business. While growth in these lower grossmargin segments delivers incremental revenue and profits, it has a negativeeffect on our consolidated gross margin.
Fiscal 2012 Compared to Fiscal 2011
For fiscal 2012, our consolidated gross margin was 220 basis points lowerthan the prior year period, primarily driven by higher product input costs,including materials and labor, across most businesses. Also contributing tothe decrease in gross margin were higher customs duty charges, discountson close-out sales and an increase in investments in our digital business andinfrastructure. Together, these factors decreased consolidated gross marginby approximately 390 basis points. Partially offsetting this decrease werepositive impacts from product price increases, lower air freight costs, thegrowth of our NIKE Brand Direct to Consumer business, and benefits fromour ongoing product cost reduction initiatives.
Selling and Administrative Expense
(Dollars in millions) Fiscal 2013 Fiscal 2012FY13 vs. FY12
% Change Fiscal 2011FY12 vs. FY11
% ChangeDemand creation expense(1) $ 2,745 $ 2,607 5% $ 2,344 11%Operating overhead expense 5,035 4,458 13% 4,017 11%
Selling and administrativeexpense $ 7,780 $ 7,065 10% $ 6,361 11%
% of Revenues 30.7% 30.3% 40 bps 31.6% (130) bps
(1) Demand creation consists of advertising and promotion expenses, including costs of endorsement contracts.
Fiscal 2013 Compared to Fiscal 2012
Demand creation expense increased 5% compared to the prior year, mainlydriven by an increase in sports marketing expense, marketing support for keyproduct initiatives, including the NIKE Fuelband and NFL launch, as well as anincreased level of marketing spending around global sporting events such asthe European Football Championships and London Summer Olympics.Excluding the effects of changes in foreign currency exchange rates, demandcreation expense increased 8%.
Compared to the prior year, operating overhead expense increased 13%,primarily attributable to increased investments in our Direct to Consumeroperations, higher personnel costs, and corporate initiatives to support thegrowth of our overall business. Excluding the effects of changes in foreigncurrency exchange rates, the growth in operating overhead expense was15%.
Fiscal 2012 Compared to Fiscal 2011
Overall, selling and administrative expense grew at a slower rate thanrevenues for fiscal 2012.
Demand creation expense increased 11% compared to the prior year, mainlydriven by an increase in sports marketing expense, marketing support for keyproduct initiatives, including the NIKE Fuelband and NFL launch, as well as anincreased level of brand event spending in advance of the European FootballChampionships and London Summer Olympics. For fiscal 2012, changes incurrency exchange rates increased the growth of demand creation expenseby 1 percentage point.
Compared to the prior year, operating overhead expense increased 11%,primarily attributable to increased investments in our Direct to Consumeroperations, higher personnel costs as well as travel expenses to support thegrowth of our overall business. For fiscal 2012, changes in currency exchangerates increased the growth of operating overhead expense by 1 percentagepoint.
Other (Income) Expense, net(In millions) Fiscal 2013 Fiscal 2012 Fiscal 2011Other (income) expense, net $ (15) $ 54 $ (25)
NIKE, INC. 2013 Annual Report and Notice of Annual Meeting 69
FOR
M10
-K

PART II
Other (income) expense, net is comprised of foreign currency conversiongains and losses from the re-measurement of monetary assets and liabilitiesdenominated in non-functional currencies, the impact of certain foreigncurrency derivative instruments, as well as unusual or non-operatingtransactions that are outside the normal course of business.
Fiscal 2013 Compared to Fiscal 2012
For fiscal 2013, other (income), net increased $69 million compared to theprior year. This change was primarily driven by a $48 million decrease inforeign currency net losses in the current year as well as the recognition of a$24 million restructuring charge for NIKE Brand’s Western Europe operationsin the prior year. These positive impacts were partially offset by smaller netgains from non-operating items.
We estimate the combination of the translation of foreign currency-denominated profits from our international businesses and the year-over-yearchange in foreign currency related gains and losses included in other (income)
expense, net had an unfavorable impact on our income before income taxesof $56 million for fiscal 2013.
Fiscal 2012 Compared to Fiscal 2011
For fiscal 2012, other expense, net increased $79 million compared to theprior year. This change was primarily driven by a $77 million change in foreigncurrency net gains in the prior year to net losses in the current year. Theseimpacts, together with a $24 million charge recognized during the fourthquarter of fiscal 2012 for the restructuring of NIKE Brand’s Western Europeoperations, were partially offset by certain net gains related to non-operatingitems.
We estimate the combination of translation of foreign currency-denominatedprofits from our international businesses and the year-over-year change inforeign currency related gains and losses included in other expense, net didnot have a significant impact on our income before income taxes for fiscal2012.
Income Taxes
Fiscal 2013 Fiscal 2012FY13 vs. FY12
% Change Fiscal 2011FY12 vs. FY11
% ChangeEffective tax rate 24.7% 25.0% (30) bps 24.1% 90 bps
Fiscal 2013 Compared to Fiscal 2012
The 30 basis point decrease in our effective tax rate for the fiscal year wasprimarily driven by the U.S. legislative retroactive reinstatement of the researchand development tax credit and a reduction of tax reserves on foreignoperations, partially offset by an increase in the percentage of earnings inhigher tax jurisdictions.
Fiscal 2012 Compared to Fiscal 2011
Our effective tax rate for fiscal 2012 was 90 basis points higher than theeffective tax rate for fiscal 2011 primarily due to changes in estimates ofuncertain tax positions. This impact was partially offset by a reduction in theeffective tax rate on operations outside of the United States as a result ofchanges in geographical mix of foreign earnings.
Discontinued OperationsThe Company continually evaluates its existing portfolio of businesses toensure resources are invested in those businesses that are accretive to theNIKE Brand and represent the largest growth potential and highest returns.On May 31, 2012, the Company announced its intention to divest of Umbroand Cole Haan, allowing it to focus its resources on driving growth in theNIKE, Jordan, Converse and Hurley brands.
On February 1, 2013, the Company completed the sale of Cole Haan to ApaxPartners for an agreed upon purchase price of $570 million and received atclosing $561 million, net of $9 million of purchase price adjustments. Thetransaction resulted in a gain on sale of $231 million, net of $137 million in taxexpense; this gain is included in the net income (loss) from discontinuedoperations line item on the consolidated statements of income.
Beginning November 30, 2012, we classified the Cole Haan disposal groupas held-for-sale and presented the results of Cole Haan’s operations in thenet income (loss) from discontinued operations line item on the consolidatedstatements of income. From this date until the sale, the assets and liabilities ofCole Haan were recorded as assets and liabilities of discontinued operationson the consolidated balance sheets of NIKE, Inc. Previously, these amountswere reported in our segment presentation as “Other Businesses.”
Under the sale agreement, we agreed to provide certain transition services toCole Haan for an expected period of 3 to 9 months from the date of sale. Wewill also license NIKE proprietary Air and Lunar technologies to Cole Haan fora transition period. The continuing cash flows related to these items are notexpected to be significant to Cole Haan and we will have no significant
continuing involvement with Cole Haan beyond the transition services.Additionally, preexisting guarantees of certain Cole Haan lease paymentsremain in place after the sale; the maximum exposure under the guarantees is$44 million at May 31, 2013. The fair value of these guarantees is not material.
On November 30, 2012, we completed the sale of certain assets of Umbro toIconix Brand Group (“Iconix”) for $225 million. The results of Umbro’soperations and Umbro’s financial position are presented as discontinuedoperations on the consolidated statements of income and balance sheets,respectively. Previously, these amounts were reported in our segmentpresentation as “Other Businesses.” Upon meeting the held-for-sale criteria,we recorded a loss of $107 million, net of tax, on the sale of Umbro. The losson sale was calculated as the net sales price less the Umbro assets of $248million, including intangibles, goodwill, and fixed assets, other miscellaneouscharges of $22 million, and the release of the associated cumulativetranslation adjustment of $129 million, offset by a $67 million tax benefit on theloss.
Under the sale agreement, we provided transition services to Iconix whilecertain markets were transitioned to Iconix-designated licensees. Thesetransition services are substantially complete and we have wound down theremaining operations of Umbro.
For the year ended May 31, 2013, net income (loss) from discontinuedoperations included, for both businesses, the net gain or loss on sale, netoperating losses, tax expenses, and approximately $20 million in wind downcosts.
70

PART II
Operating Segments
The Company’s reportable operating segments are based on our internalgeographic organization. Each NIKE Brand geography operatespredominantly in one industry: the design, development, marketing andselling of athletic footwear, apparel, and equipment. Our reportable operatingsegments for the NIKE Brand are: North America, Western Europe, Central &Eastern Europe, Greater China, Japan, and Emerging Markets. Our NIKEBrand Direct to Consumer operations are managed within each geographicsegment.
As part of our centrally managed foreign exchange risk managementprogram, standard foreign currency rates are assigned twice per year to eachNIKE Brand entity in our geographic operating segments and certain Other
Businesses. These rates are set approximately nine months in advance of thefuture selling season based on average market spot rates in the calendarmonth preceding the date they are established. Inventories and cost of salesfor geographic operating segments and certain Other Businesses reflect useof these standard rates to record non-functional currency product purchasesinto the entity’s functional currency. Differences between assigned standardforeign currency rates and actual market rates are included in Corporatetogether with foreign currency hedge gains and losses generated from ourcentrally managed foreign exchange risk management program.
Certain prior year amounts have been reclassified to conform to fiscal 2013presentation.
The breakdown of revenues is as follows:
(Dollars in millions) Fiscal 2013 Fiscal 2012(1)FY13 vs. FY12
% Change
FY13 vs. FY12% ChangeExcludingCurrency
Changes(2) Fiscal 2011(1)FY12 vs. FY11
% Change
FY12 vs. FY11% ChangeExcludingCurrency
Changes(2)
North America $ 10,387 $ 8,839 18% 18% $ 7,579 17% 17%Western Europe 4,128 4,144 0% 5% 3,868 7% 4%Central & Eastern Europe 1,287 1,200 7% 12% 1,040 15% 17%Greater China 2,453 2,539 -3% -5% 2,060 23% 18%Japan 791 835 -5% 1% 773 8% 1%Emerging Markets 3,718 3,411 9% 16% 2,737 25% 26%Global Brand Divisions 117 111 5% 8% 96 16% 13%Total NIKE Brand Revenues 22,881 21,079 9% 11% 18,153 16% 15%Other Businesses 2,500 2,298 9% 9% 2,041 13% 12%Corporate(3) (68) (46) — — (77) — —TOTAL NIKE, INC. REVENUES $ 25,313 $ 23,331 8% 11% $ 20,117 16% 15%
(1) Certain prior year amounts have been reclassified to conform to fiscal 2013 presentation. These changes had no impact on previously reported results of operations or shareholders’equity.
(2) Results have been restated using actual exchange rates in use during the comparative period to enhance the visibility of the underlying business trends by excluding the impact oftranslation arising from foreign currency exchange rate fluctuations.
(3) Corporate revenues primarily consist of certain intercompany revenue eliminations and foreign currency hedge gains and losses related to revenues generated by entities within the NIKEBrand geographic operating segments and certain Other Businesses but managed through our central foreign exchange risk management program.
The primary financial measure used by the Company to evaluate performanceof individual operating segments is earnings before interest and taxes(commonly referred to as “EBIT”) which represents net income before interest(income) expense, net and income taxes in the consolidated statements of
income. As discussed in Note 18 — Operating Segments and RelatedInformation in the accompanying notes to the consolidated financialstatements, certain corporate costs are not included in EBIT of our operatingsegments.
The breakdown of earnings before interest and taxes is as follows:
(Dollars in millions) Fiscal 2013 Fiscal 2012(1)FY13 vs. FY12
% Change Fiscal 2011(1)FY12 vs. FY11
% Change
North America $ 2,534 $ 2,030 25% $ 1,736 17%Western Europe 640 597 7% 730 -18%Central & Eastern Europe 259 234 11% 244 -4%Greater China 809 911 -11% 777 17%Japan 133 136 -2% 114 19%Emerging Markets 1,011 853 19% 688 24%Global Brand Divisions (1,396) (1,200) -16% (971) -24%Total NIKE Brand 3,990 3,561 12% 3,318 7%Other Businesses 456 385 18% 353 9%Corporate (1,177) (917) -28% (805) -14%TOTAL CONSOLIDATED EARNINGSBEFORE INTEREST AND TAXES $ 3,269 $ 3,029 8% $ 2,866 6%Interest (income) expense, net (3) 4 — 4 —TOTAL CONSOLIDATED INCOMEBEFORE INCOME TAXES $ 3,272 $ 3,025 8% $ 2,862 6%
(1) Certain prior year amounts have been reclassified to conform to fiscal 2013 presentation. These changes had no impact on previously reported results of operations or shareholders’ equity.
NIKE, INC. 2013 Annual Report and Notice of Annual Meeting 71
FOR
M10
-K

PART II
North America
(Dollars in millions) Fiscal 2013 Fiscal 2012FY13 vs. FY12
% Change
FY13 vs. FY12% ChangeExcludingCurrencyChanges Fiscal 2011
FY12 vs. FY11% Change
FY12 vs. FY11% ChangeExcludingCurrencyChanges
Revenues by:Footwear $ 6,687 $ 5,887 14% 14% $ 5,111 15% 15%Apparel 3,028 2,482 22% 22% 2,103 18% 18%Equipment 672 470 43% 43% 365 29% 29%TOTAL REVENUES $ 10,387 $ 8,839 18% 18% $ 7,579 17% 17%Revenues by:Sales to Wholesale Customers $ 7,838 $ 6,720 17% 17% $ 5,801 16% 16%Sales Direct to Consumer 2,549 2,119 20% 20% 1,778 19% 19%TOTAL REVENUES $ 10,387 $ 8,839 18% 18% $ 7,579 17% 17%EARNINGS BEFORE INTERESTAND TAXES $ 2,534 $ 2,030 25% $ 1,736 17%
Fiscal 2013 Compared to Fiscal 2012
Our category offense continued to deliver innovative products, deep brandconnections, and compelling retail experiences to consumers in NorthAmerica, driving increased demand for NIKE Brand products across all keycategories except Action Sports. Our Basketball, Men’s Training, Running,and Sportswear categories drove the revenue growth in fiscal 2013. NorthAmerica’s Direct to Consumer revenue growth for fiscal 2013 was fueled by15% growth in comparable store sales as well as the addition of new storesand rapid growth in online sales.
North America footwear revenue growth was driven by higher demand in allseven key categories, most notably Basketball, Running, and Sportswear.Both unit sales and average selling price per pair increased 7% in fiscal 2013.The increase in average selling price per pair was driven approximately equallyby price increases and a favorable mix of higher priced products.
Apparel revenue growth in North America was driven by higher demand in ourMen’s Training category, reflecting the addition of the NFL licensed business,as well as Basketball, Women’s Training, and Running. Unit sales increased10% while average selling price per unit increased 12%, largely driven by afavorable mix of higher priced products.
North America EBIT increased faster than revenue due to gross marginexpansion and selling and administrative expense leverage. Gross marginincreased 50 basis points for fiscal 2013, reflecting the favorable impact ofselling price increases, partially offset by higher product costs, an unfavorablemix of lower margin products and royalties for the NFL business. Selling andadministrative expenses increased versus fiscal 2012, though at a rate slowerthan revenue; the growth was largely driven by higher demand creationexpense for the Olympics in the first quarter of fiscal 2013 as well as keyproduct initiatives, including the NFL launch, and higher operating overheadcosts to support the expansion of our Direct to Consumer business andoverall growth of the business.
Fiscal 2012 Compared to Fiscal 2011
Revenues for North America increased 17% for fiscal 2012, driven by growthin both wholesale and Direct to Consumer revenues. Our category offensecontinued to deliver innovative products, deep brand connections andcompelling retail experiences to consumers, driving demand for NIKE Brandproducts across all seven key categories. North America’s Direct toConsumer revenues grew 19% for fiscal 2012, driven by 15% growth incomparable store sales.
For fiscal 2012, footwear revenue in North America increased 15%, driven byan increase in both unit sales and average selling prices. Unit sales rose at adouble-digit rate while average selling price per pair grew at a mid-single-digitrate, reflective of product price increases, partially offset by higher discountson close-out sales. The overall increase in footwear sales was driven bygrowth in all key categories, most notably Running, Basketball, Women’sTraining and Sportswear.
Compared to the prior year, apparel revenue for North America increased18%, primarily driven by a low-double-digit percentage growth in averageselling price per unit and a mid-single-digit percentage growth in unit sales.The increase in average selling price per unit was reflective of product priceincreases and a greater mix of higher price point products. The overallincrease in apparel sales was driven by double-digit percentage growthacross most key categories, including Men’s Training, Running andBasketball.
For fiscal 2012, EBIT for North America increased 17% as revenue growthand improved selling and administrative expense leverage more than offset adecline in gross margin. Gross margin decreased 90 basis points during fiscal2012, primarily due to higher product input costs and lower gross margins onclose-out sales, which more than offset the favorable impact of selling priceincreases, lower air freight costs and the growth of our Direct to Consumerbusiness. Selling and administrative expense as a percentage of revenuedecreased by 70 basis points for fiscal 2012, as both demand creation andoperating overhead expense grew at a slower rate than revenues.
72

PART II
Western Europe
(Dollars in millions) Fiscal 2013 Fiscal 2012FY13 vs. FY12
% Change
FY13 vs. FY12% ChangeExcludingCurrencyChanges Fiscal 2011
FY12 vs. FY11% Change
FY12 vs. FY11% ChangeExcludingCurrencyChanges
Revenues by:Footwear $ 2,646 $ 2,526 5% 10% $ 2,345 8% 5%Apparel 1,261 1,377 -8% -4% 1,303 6% 2%Equipment 221 241 -8% -3% 220 10% 5%TOTAL REVENUES $ 4,128 $ 4,144 0% 5% $ 3,868 7% 4%Revenues by:Sales to Wholesale Customers $ 3,416 $ 3,556 -4% 1% $ 3,385 5% 2%Sales Direct to Consumer 712 588 21% 27% 483 22% 18%TOTAL REVENUES $ 4,128 $ 4,144 0% 5% $ 3,868 7% 4%EARNINGS BEFORE INTERESTAND TAXES $ 640 $ 597 7% $ 730 -18%
Fiscal 2013 Compared to Fiscal 2012
On a currency neutral basis, most territories in Western Europe reportedrevenue growth for fiscal 2013, which more than offset revenue declines of17% and 18% in Italy and Iberia, respectively, reflecting poor economicconditions in Southern Europe. Revenues for the U.K. & Ireland and AGS(Austria, Germany, and Switzerland) territories, the largest markets in WesternEurope, increased 8% and 12%, respectively. The growth in Direct toConsumer revenues reflected 17% growth in comparable store sales, theaddition of 19 net new factory stores and strong growth in online sales. On acategory basis, Western Europe’s revenue growth was largely driven bygrowth in our Running and Basketball categories.
Constant currency footwear revenue growth in Western Europe was primarilydriven by growth in Running, Sportswear, and Basketball. Unit salesincreased 7% and average selling price per pair increased 3%, the latterprimarily the result of price increases.
The constant currency decrease in Western Europe apparel revenues wasdue to a decline in Sportswear, partially offset by growth in Running, Men’sTraining, and Basketball. Unit sales in fiscal 2013 decreased 1% whileaverage selling price per unit decreased 3%, as higher discounts on close-outsales more than offset selling price increases.
The EBIT growth in fiscal 2013 was driven by a 200 basis point increase ingross margin, partially offset by higher selling and administrative expenses.The gross margin increase was primarily driven by favorable standard foreigncurrency exchange rates; higher net average selling prices were mostly offsetby higher product costs. The increase in selling and administrative expensewas mainly driven by an increased level of demand creation spending aroundthe European Football Championships and Olympics in the first quarter offiscal 2013, as well as higher sports marketing expense. Additionally,operating overhead costs increased to support the expansion of our Direct toConsumer business and overall growth of the business. Fiscal 2013 EBITgrowth for Western Europe was also increased by a $24 million, one-timerestructuring charge that was recorded in other (income) expense, net, in thefourth quarter of fiscal 2012.
Fiscal 2012 Compared to Fiscal 2011
On a currency neutral basis, revenues for Western Europe increased 4% forfiscal 2012, as most territories reported revenue growth, which more thanoffset revenue declines in the U.K. & Ireland and Italy. Revenues for the U.K. &Ireland, the largest market in Western Europe, declined 3% for the fiscal 2012period. Western Europe’s Direct to Consumer revenues grew 18% for fiscal2012, including 8% growth in comparable store sales.
Excluding changes in currency exchange rates, footwear revenue in WesternEurope increased 5% for fiscal 2012, primarily driven by a low-single-digitpercentage growth in both unit sales and average selling price per pair,primarily reflective of product price increases, partially offset by higherdiscounts on in-line and close-out sales. The overall increase in footwear saleswas driven by growth in Running, Basketball and Football (Soccer), whichmore than offset a decline in Action Sports.
Excluding changes in currency exchange rates, apparel revenue in WesternEurope increased 2% for fiscal 2012. The year-over-year change wasprimarily driven by a mid-single-digit percentage increase in average sellingprice per unit, reflective of higher product prices. Partially offsetting theincrease in average selling price per unit was a mid-single-digit percentagedecline in unit sales. The overall increase in apparel sales was driven bygrowth in Football (Soccer) and Running, which more than offset a decline inSportswear.
On a reported basis, revenues for Western Europe increased 7% for fiscal2012. However, EBIT fell 18%, primarily driven by a 350 basis point decline ingross margin and higher selling and administrative expense as a percentageof revenues. The decline in gross margin was driven by higher product inputcosts and the negative impact from changes in standard currency rates,which more than offset the favorable impact of product price increases andthe growth of our Direct to Consumer business. The increase in selling andadministrative expense as a percentage of revenues was mainly driven by anincreased level of demand creation spending around the European FootballChampionships and London Summer Olympics. Also reflected in WesternEurope’s fiscal 2012 results was a $24 million charge relating to therestructuring of its operations.
Central & Eastern Europe
(Dollars in millions) Fiscal 2013 Fiscal 2012FY13 vs. FY12
% Change
FY13 vs. FY12% ChangeExcludingCurrencyChanges Fiscal 2011
FY12 vs. FY11% Change
FY12 vs. FY11% ChangeExcludingCurrencyChanges
Revenues by:Footwear $ 714 $ 671 6% 11% $ 605 11% 13%Apparel 483 441 10% 14% 359 23% 24%Equipment 90 88 2% 9% 76 16% 17%TOTAL REVENUES $ 1,287 $ 1,200 7% 12% $ 1,040 15% 17%EARNINGS BEFORE INTERESTAND TAXES $ 259 $ 234 11% $ 244 -4%
NIKE, INC. 2013 Annual Report and Notice of Annual Meeting 73
FOR
M10
-K

PART II
Fiscal 2013 Compared to Fiscal 2012
On a currency neutral basis, Central & Eastern Europe revenues for fiscal2013 were driven by growth across most territories, particularly Russia andTurkey, which grew 28% and 19%, respectively. Revenue growth in Central &Eastern Europe was driven by growth in all key categories, most notablyRunning, Football (Soccer), and Sportswear.
Constant currency footwear revenue growth in fiscal 2013 was primarilydriven by growth in Running, Football (Soccer), and Basketball, partially offsetby lower revenues in Sportswear. Unit sales increased 6% while averageselling price per pair increased 5%, primarily driven by price increases.
Constant currency apparel revenue growth in fiscal 2013 was driven bygrowth in nearly all categories, most notably Sportswear, Football (Soccer),and Running. Unit sales increased 16%, while average selling price per unitdecreased 2%, as an unfavorable mix of lower priced products more than off-set higher selling prices.
EBIT for Central & Eastern Europe grew faster than revenue primarily due togross margin improvement and selling and administrative expense leverage.Gross margin increased 30 basis points, largely driven by price increases andthe favorable impact of our higher margin Direct to Consumer business, morethan offsetting higher product costs and unfavorable standard foreigncurrency exchange rates.
Fiscal 2012 Compared to Fiscal 2011
Excluding the changes in currency exchange rates, revenues for Central &Eastern Europe increased 17% for fiscal 2012, driven by growth across mostterritories, including double-digit growth in Russia and Turkey, which morethan offset lower revenues in Greece.
Excluding changes in currency exchange rates, Central & Eastern Europe’sfootwear revenue grew 13%, primarily driven by double-digit percentagegrowth in unit sales and a low-single-digit percentage increase in averageselling price per pair. The increase in average selling price per pair wasreflective of product price increases which more than offset the negativeimpact of higher discounts on in-line and close-out sales. The overall increasein footwear sales was driven by growth across all key categories, mostnotably Running, Sportswear and Football (Soccer).
Excluding changes in currency exchange rates, Central & Eastern Europe’sapparel revenues grew 24%, mainly driven by double-digit percentagegrowth in unit sales, offset by a slight decrease in average price per unit,mainly due to less favorable product mix and higher discounts on in-line sales,which more than offset the impact from product price increases. The overallincrease in apparel sales was primarily driven by growth in Football (Soccer),Sportswear and Running.
On a reported basis, revenues for Central & Eastern Europe increased 15%for fiscal 2012. However, EBIT fell 4%, primarily driven by a 420 basis pointdecline in gross margin. The decline in gross margin was primarily due tohigher product input costs as well as higher discounts on in-line and close-outproducts, which more than offset the favorable impact from product priceincreases. Selling and administrative expense as a percentage of revenuesremained relatively flat compared to the prior period.
Greater China
(Dollars in millions) Fiscal 2013 Fiscal 2012FY13 vs. FY12
% Change
FY13 vs. FY12% ChangeExcludingCurrencyChanges Fiscal 2011
FY12 vs. FY11% Change
FY12 vs. FY11% ChangeExcludingCurrencyChanges
Revenues by:Footwear $ 1,493 $ 1,518 -2% -3% $ 1,164 30% 25%Apparel 829 896 -7% -9% 789 14% 9%Equipment 131 125 5% 3% 107 17% 12%TOTAL REVENUES $ 2,453 $ 2,539 -3% -5% $ 2,060 23% 18%EARNINGS BEFORE INTERESTAND TAXES $ 809 $ 911 -11% $ 777 17%
Fiscal 2013 Compared to Fiscal 2012
On a currency neutral basis, Greater China revenue decreased in fiscal 2013,driven by lower futures orders as well as increased discounts, product returnsand proactive cancellation of orders to manage inventory levels at retail. Thesedownsides were partially offset by 33% growth in our Direct to Consumerbusiness driven by comparable store sales growth of 13% and the addition of29 net new factory stores. Fiscal 2013 revenues for most key categories werelower than in fiscal 2012.
For fiscal 2013, constant currency footwear revenue growth for Greater Chinadeclined, driven by lower sales across most key categories, most notablySportswear and Men’s and Women’s Training, and increased reserves forproduct discounts and returns. Unit sales decreased 1%, while averageselling price per pair decreased 2%, reflecting a higher mix of close-out salesand higher discounts.
The decrease in constant currency apparel revenue for fiscal 2013 was drivenby lower revenues in Sportswear and Men’s and Women’s Training, partiallyoffset by higher revenues in Basketball. Apparel unit sales in fiscal 2013 were3% lower than the prior year while average selling price per unit was down6%, reflecting a higher mix of close-out sales and higher discounts.
Fiscal 2013 EBIT for Greater China decreased at a faster rate than revenue,driven by lower gross margin and selling and administrative expensedeleverage. Fiscal 2013 gross margin decreased 50 basis points due to a
lower average selling price per unit driven by higher discounts and close-outmix partially offset by favorable standard foreign currency exchange rates.Selling and administrative expense increased as a percent of revenues, drivenprimarily by the increased investment in our Direct to Consumer business andthe decrease in revenues.
Our results in Greater China have been adversely impacted by sluggishmacroeconomic growth and slow product sell-through at retail, leading tohigh levels of inventory in the marketplace. Our strategy to return to sustained,profitable growth in Greater China focuses on extending our brand leadershipposition with consumers; expanding the offering of product styles and fitsdesigned for the Chinese consumer; and working with our retail partners tocreate more differentiated, productive, and profitable retail stores.
Despite the challenges we have seen in China, there are indications that ourstrategies are taking hold in the marketplace. Comparable store sales aregrowing in our NIKE-owned Direct to Consumer doors and our wholesalecustomers are reporting comparable store growth and declining inventorylevels. While we are making progress, we will continue to work with ourretailers to optimize inventory, accelerate sell-through, and improve retailproductivity. While China futures orders for the next six months are in line withlast year, we expect revenues for the first half of the fiscal year will be belowlast year as we continue to manage the amount of product we ship into themarket. We believe our revenue in China will stabilize around prior year levelsin the second half of this fiscal year.
74

PART II
Fiscal 2012 Compared to Fiscal 2011
Excluding changes in currency exchange rates, Greater China revenuesincreased 18% for fiscal 2012, driven by continued expansion in the numberof both NIKE mono-branded stores owned by our wholesale customers andNIKE owned stores, as well as higher comparable store sales.
Excluding changes in currency exchange rates, the growth in Greater China’sfootwear revenue for fiscal 2012 was primarily driven by double-digitpercentage growth in unit sales and a mid-single-digit growth in average unitprice per pair, reflective of product price increases. The overall increase infootwear sales was driven by double-digit percentage growth across mostkey categories, led by Running and Sportswear.
Excluding changes in currency exchange rates, the growth in Greater China’sapparel revenues for fiscal 2012 was mainly driven by a high-single-digit
growth in the average selling price per unit and a low-single-digit percentageincrease in unit sales. The increase in average selling price was reflective ofproduct price increases, partially offset by higher discounts on in-line andclose-out products to accelerate the sales of slower moving apparelinventories.
On a reported basis, revenues for Greater China increased 23% for fiscal2012, while EBIT grew 17%, as revenue growth was partially offset by adecline in gross margin and an increase in selling and administrative expenseas a percentage of revenues. Gross margin decreased 150 basis points forfiscal 2012, primarily attributable to higher product input costs and discountson close-out products, which more than offset the favorable impact ofproduct price increases. Selling and administrative expense as a percentageof revenues increased 50 basis points, driven by an increase in operatingoverhead expense.
Japan
(Dollars in millions) Fiscal 2013 Fiscal 2012FY13 vs. FY12
% Change
FY13 vs. FY12% ChangeExcludingCurrencyChanges Fiscal 2011
FY12 vs. FY11% Change
FY12 vs. FY11% ChangeExcludingCurrencyChanges
Revenues by:Footwear $ 429 $ 439 -2% 5% $ 397 11% 3%Apparel 301 325 -7% -1% 305 7% -1%Equipment 61 71 -14% -9% 71 0% -5%TOTAL REVENUES $ 791 $ 835 -5% 1% $ 773 8% 1%EARNINGS BEFORE INTERESTAND TAXES $ 133 $ 136 -2% $ 114 19%
Fiscal 2013 Compared to Fiscal 2012
Excluding changes in currency exchange rates, the revenue increase forJapan was driven by higher revenues in Running, Football (Soccer) andBasketball, partially offset by lower revenues in Sportswear and Men’s andWomen’s Training.
Fiscal 2013 EBIT for Japan decreased as a result of lower revenues, partiallyoffset by gross margin improvement and lower selling and administrativeexpense. The decrease in selling and administrative expense in fiscal 2013was attributable to lower operating overhead and demand creation spending.
Fiscal 2012 Compared to Fiscal 2011
During fiscal 2012, the macroeconomic environment in Japan remaineduncertain as the market continued to recover from the effects of the
earthquake and tsunami that occurred in March 2011. On a currency neutralbasis, footwear revenue in Japan increased 3% for fiscal 2012, as growth inRunning and Football (Soccer) more than offset a decline in Sportswear.
Excluding changes in currency exchange rates, apparel revenue decreased1% for fiscal 2012, as the decline in Sportswear more than offset the growthin Running and Football (Soccer).
On a reported basis, EBIT for Japan grew at a faster rate than revenue as aresult of improved gross margin and leverage of selling and administrativeexpenses. The increase in Japan’s gross margin was mainly driven by thefavorable impact from the year-over-year change in standard currency rates,a decrease in inventory obsolescence expense as well as a lower mix ofclose-out sales. These favorable impacts were partially offset by higherproduct input costs.
Emerging Markets
(Dollars in millions) Fiscal 2013 Fiscal 2012FY13 vs. FY12
% Change
FY13 vs. FY12% ChangeExcludingCurrencyChanges Fiscal 2011
FY12 vs. FY11% Change
FY12 vs. FY11% ChangeExcludingCurrencyChanges
Revenues by:Footwear $ 2,570 $ 2,387 8% 15% $ 1,897 26% 27%Apparel 918 815 13% 19% 657 24% 25%Equipment 230 209 10% 17% 183 14% 15%TOTAL REVENUES $ 3,718 $ 3,411 9% 16% $ 2,737 25% 26%EARNINGS BEFORE INTERESTAND TAXES $ 1,011 $ 853 19% $ 688 24%
NIKE, INC. 2013 Annual Report and Notice of Annual Meeting 75
FOR
M10
-K

PART II
Fiscal 2013 Compared to Fiscal 2012
For fiscal 2013, constant currency revenue growth for the Emerging Marketsgeography was driven by growth in every key category and every territory, ledby Argentina, Brazil, and Mexico.
Constant currency footwear revenue growth for fiscal 2013 was driven bygrowth in most key categories, most notably Running, Football (Soccer), andWomen’s Training. Unit sales increased approximately 9% and averageselling price per pair increased 6%, primarily driven by selling price increases.
Fiscal 2013 constant currency apparel revenue was driven by growth in everykey category, led by Football (Soccer), Running, Sportswear, and Men’sTraining. Unit sales increased approximately 10% and average selling priceper unit increased 9%, largely attributable to price increases.
Fiscal 2013 Emerging Markets EBIT grew faster than revenue primarily drivenby gross margin improvement, partially offset by higher selling andadministrative expense as a percent of revenue. Gross margin increased 260basis points due largely to the favorable impact of price increases, theanniversary of a one-time custom duty charge in fiscal 2012, and favorablestandard foreign currency exchange rates, which more than offset theunfavorable impact of higher product costs. As a percent of revenue, sellingand administrative expense was higher due to higher operating overheadcosts to support the expansion of our Direct to Consumer business andoverall growth of the business.
Fiscal 2012 Compared to Fiscal 2011
Excluding the changes in currency exchange rates, revenues for theEmerging Markets increased 26% for fiscal 2012 as all territories in thegeography reported double-digit revenue growth, led by Argentina, Brazil,Mexico and Korea.
For fiscal 2012, revenue growth for both footwear and apparel in theEmerging Markets was driven by double-digit percentage growth in unit salesand mid-single-digit percentage growth in average selling price per unit,primarily reflective of product price increases. The overall increase inEmerging Markets’ footwear and apparel sales was driven by strong demandin nearly all key categories, led by Running and Sportswear.
The increase in Emerging Markets’ EBIT for fiscal 2012 was primarily theresult of revenue growth and selling and administrative expense leverage,which more than offset a lower gross margin. Gross margin declined 150basis points for the fiscal year, primarily due to higher product input costs,customs duty charges and inventory obsolescence expense. These factorswere partially offset by the favorable impact of changes in standard currencyexchange rates and product price increases. Selling and administrativeexpense as a percentage of revenues decreased 140 basis points, as bothdemand creation expense and operating overhead grew at a slower rate thanrevenues.
Global Brand Divisions
(Dollars in millions) Fiscal 2013 Fiscal 2012FY13 vs. FY12
% Change
FY13 vs. FY12% ChangeExcludingCurrencyChanges Fiscal 2011
FY12 vs. FY11% Change
FY12 vs. FY11% ChangeExcludingCurrencyChanges
Revenues $ 117 $ 111 5% 8% $ 96 16% 13%(Loss) Before Interest and Taxes (1,396) (1,200) 16% (971) 24%
Global Brand Divisions primarily represent demand creation, operatingoverhead, and product creation and design expenses that are centrallymanaged for the NIKE Brand. Revenues for the Global Brand Divisions areprimarily attributable to NIKE Brand licensing businesses that are not part of ageographic operating segment.
Fiscal 2013 Compared to Fiscal 2012
For fiscal 2013, Global Brand Divisions’ loss before interest and taxesincreased $196 million, primarily driven by increased investments andmarketing support for our digital business, product creation and designinitiatives and higher demand creation spending in the first quarter of fiscal2013 around the Olympics and European Football Championships.
Fiscal 2012 Compared to Fiscal 2011
For fiscal 2012, Global Brand Divisions’ loss before interest and taxesincreased $229 million, primarily driven by increased investments in our digitalbusiness and infrastructure for our Direct to Consumer operations, highersports marketing expense as well as higher personnel costs to support ourglobal brand functions.
Other Businesses
(Dollars in millions) Fiscal 2013 Fiscal 2012FY13 vs. FY12
% Change
FY13 vs. FY12% ChangeExcludingCurrencyChanges Fiscal 2011
FY12 vs. FY11% Change
FY12 vs. FY11% ChangeExcludingCurrencyChanges
RevenuesConverse $ 1,449 $ 1,324 9% 9% $ 1,131 17% 17%NIKE Golf 791 726 9% 10% 658 10% 9%Hurley 260 248 5% 5% 252 -2% -1%
TOTAL REVENUES $ 2,500 $ 2,298 9% 9% $ 2,041 13% 12%EARNINGS BEFOREINTEREST AND TAXES $ 456 $ 385 18% $ 353 9%
Fiscal 2013 Compared to Fiscal 2012Our Other Businesses are comprised of Converse, NIKE Golf, and Hurley.
Other Businesses revenue growth in fiscal 2013 reflects growth in each of ourOther Businesses. Revenue growth at Converse was primarily driven byincreased sales in the UK as well as in China, as we transitioned that market to
direct distribution in the second half of fiscal 2012. The increase in fiscal 2013revenue for NIKE Golf was driven by double-digit growth in each of ourapparel, footwear, and club businesses.
The fiscal 2013 increase in EBIT for our Other Businesses was driven byimproved profits for all of our Other Businesses.
76

PART II
Fiscal 2012 Compared to Fiscal 2011
For fiscal 2012, revenues for our Other Businesses increased 12%, reflectinggrowth across most businesses, led by Converse. The revenue growth atConverse was primarily driven by increased sales in North America and China,as well as increased revenues in the U.K. as we transitioned that market todirect distribution in the second half of fiscal 2011. Excluding changes incurrency exchange rates, revenues for NIKE Golf increased 9% for fiscal
2012, driven by double-digit percentage growth in our apparel business,partially offset by a single-digit percentage decline in our club business.
On a reported basis, revenues for our Other Businesses increased 13% forfiscal 2012, while EBIT grew 9%, as earnings growth at Converse waspartially off-set by losses at Hurley. Higher selling and administrative expenseas a percentage of revenues negatively affected profitability and lower grossmargins contributed to the decline in Hurley’s earnings.
Corporate
(Dollars in millions) Fiscal 2013 Fiscal 2012FY13 vs. FY12
% Change Fiscal 2011FY12 vs. FY11
% ChangeRevenues $ (68) $ (46) — $ (77) —(Loss) Before Interest and Taxes (1,177) (917) 28% (805) 14%
Corporate revenues primarily consist of certain intercompany revenueeliminations and foreign currency hedge gains and losses related to revenuesgenerated by entities within the NIKE Brand geographic operating segmentsand certain Other Businesses but managed through our central foreignexchange risk management program.
Corporate loss before interest and taxes consists largely of unallocatedgeneral and administrative expenses, including expenses associated withcentrally managed departments; depreciation and amortization related to ourcorporate headquarters; unallocated insurance, benefit and compensationprograms, including stock-based compensation; certain foreign currencygains and losses, including certain hedge gains and losses; certainintercompany eliminations and other items.
In addition to the foreign currency gains and losses recognized in Corporaterevenues, foreign currency results included in gross margin are gains andlosses resulting from the difference between actual foreign currency rates andstandard rates used to record non-functional currency denominated productpurchases within the NIKE Brand geographic operating segments and certainOther Businesses and related foreign currency hedge results. All other foreigncurrency related results, including conversion gains and losses arising fromre-measurement of monetary assets and liabilities in non-functionalcurrencies and certain foreign currency derivative instruments, are included inother (income) expense, net.
Fiscal 2013 Compared to Fiscal 2012
For fiscal 2013, Corporate’s loss before interest and taxes increased by $260million primarily due to the following:
• A $165 million increase in foreign exchange losses related to the differencebetween actual foreign currency exchange rates and standard foreigncurrency exchange rates assigned to the NIKE Brand geographic operatingsegments and certain Other Businesses, net of hedge gains; these lossesare reported as a component of consolidated gross margin.
• A $48 million decrease in foreign currency net losses, reported as acomponent of consolidated other (income) expense, net.
• A $143 million increase in corporate overhead expense related to corporateinitiatives to support the growth of the business and performance-basedcompensation.
Fiscal 2012 Compared to Fiscal 2011
For fiscal 2012, Corporate’s loss before interest and taxes grew $112 million,mainly due to an increase of $49 million in performance-based compensationand a year-over-year net increase of $73 million from foreign currencyimpacts. These foreign currency impacts were driven by a year-over-yearincrease in foreign currency net losses, arising from certain Euro/U.S. Dollarforeign currency hedges and the re-measurement of monetary assets andliabilities in various non-functional currencies, net of related undesignatedforward instruments, as a variety of foreign currencies weakened against theU.S. Dollar year-over-year. The above impacts were partially offset by a slightdecrease in centrally managed operating overhead expenses.
Foreign Currency Exposures and Hedging Practices
OverviewAs a global company with significant operations outside the United States, inthe normal course of business we are exposed to risk arising from changes incurrency exchange rates. Our primary foreign currency exposures arise fromthe recording of transactions denominated in non-functional currencies andthe translation of foreign currency denominated results of operations, financialposition and cash flows into U.S. Dollars.
Our foreign exchange risk management program is intended to lessen boththe positive and negative effects of currency fluctuations on our consolidatedresults of operations, financial position and cash flows. We manage globalforeign exchange risk centrally on a portfolio basis to address those risks thatare material to NIKE, Inc. We manage these exposures by taking advantageof natural offsets and currency correlations that exist within the portfolio and
where practical and material, by hedging a portion of the remaining exposuresusing derivative instruments such as forward contracts and options. Asdescribed below, the implementation of the NIKE Trading Company (“NTC”)and our foreign currency adjustment program enhanced our ability to manageour foreign exchange risk by increasing the natural offsets and currencycorrelation benefits that exist within our portfolio of foreign exchangeexposures. Our hedging policy is designed to partially or entirely offset theimpact of exchange rate changes on the underlying net exposures beinghedged. Where exposures are hedged, our program has the effect ofdelaying the impact of exchange rate movements on our consolidatedfinancial statements; the length of the delay is dependent upon hedgehorizons. We do not hold or issue derivative instruments for trading orspeculative purposes.
NIKE, INC. 2013 Annual Report and Notice of Annual Meeting 77
FOR
M10
-K

PART II
Transactional exposuresWe conduct business in various currencies and have transactions whichsubject us to foreign currency risk. Our most significant transactional foreigncurrency exposures are:
• Product Costs — NIKE’s product costs are exposed to fluctuations inforeign currencies in the following ways:
1. Product purchases denominated in currencies other than thefunctional currency of the transacting entity:
a. Certain NIKE entities purchase product from the NTC, a wholly-owned sourcing hub that buys NIKE branded products from thirdparty factories, predominantly in U.S. Dollars. The NTC, whosefunctional currency is the U.S. Dollar, then sells the products toNIKE entities in their respective functional currencies. When theNTC sells to a NIKE entity with a different functional currency, theresult is a foreign currency exposure for the NTC.
b. Other NIKE entities purchase product directly from third-partyfactories in U.S. Dollars. These purchases generate a foreigncurrency exposure for those NIKE entities with a functionalcurrency other than the U.S. Dollar.
In both purchasing scenarios, a weaker U.S. Dollar reduces theinventory cost incurred by NIKE whereas a stronger U.S. Dollarincreases its cost.
2. Factory input costs: In January 2012, NIKE implemented a foreigncurrency adjustment program with certain factories. The program isdesigned to more effectively manage foreign currency risk byassuming certain of the factories’ foreign currency exposures, someof which are natural offsets to our existing foreign currency exposures.Under this program, our payments to these factories are adjusted forrate fluctuations in the basket of currencies (“factory currencyexposure index”) in which the labor, materials and overhead costsincurred by the factories in the production of NIKE branded products(“factory input costs”) are denominated.
For the currency within the factory currency exposure indices that isthe local or functional currency of the factory, the currency ratefluctuation affecting the product cost is recorded within inventoriesand is recognized in cost of sales when the related product is sold to athird-party. All currencies within the indices, excluding the U.S. Dollarand the local or functional currency of the factory, are recognized asembedded derivative contracts and are recorded at fair value throughother (income) expense, net. Refer to Note 17 — Risk Managementand Derivatives for additional detail.
As an offset to the impacts of the fluctuating U.S. Dollar on our non-functional currency denominated product purchases describedabove, a strengthening U.S. Dollar against the foreign currencieswithin the factory currency exposure indices decreases NIKE’sU.S. Dollar inventory cost. Conversely, a weakening U.S. Dollaragainst the indexed foreign currencies increases our inventory cost.
• Non-Functional Currency Denominated External Sales — A portion of ourWestern Europe and Central & Eastern Europe geography revenues areearned in currencies other than the Euro (e.g. British Pound) but arerecognized at a subsidiary that uses the Euro as its functional currency.These sales generate a foreign currency exposure.
• Other Costs — Non-functional currency denominated costs, such asendorsement contracts, intercompany royalties and other intercompanycharges, also generate foreign currency risk though to a lesser extent.
• Non-Functional Currency Denominated Monetary Assets and Liabilities —Our global subsidiaries have various assets and liabilities, primarilyreceivables and payables, denominated in currencies other than theirfunctional currencies. These balance sheet items are subject to re-measurement, which may create fluctuations in other (income) expense, netwithin our consolidated results of operations.
Managing transactional exposures
Transactional exposures are managed on a portfolio basis within our foreigncurrency risk management program. We manage these exposures by takingadvantage of natural offsets and currency correlations that exist within theportfolio and may also elect to use currency forward and option contracts tohedge the remaining effect of exchange rate fluctuations on probableforecasted future cash flows, including certain product cost exposures, non-functional currency denominated external sales and other costs describedabove. Generally, these are accounted for as cash flow hedges in accordancewith the accounting standards for derivatives and hedging, except for hedgesof the embedded derivatives component of the product cost exposures asdiscussed below.
Certain currency forward contracts used to manage the foreign exchangeexposure of non-functional currency denominated monetary assets andliabilities subject to re-measurement and the embedded derivative contractsdiscussed above are not formally designated as hedging instruments underthe accounting standards for derivatives and hedging. Accordingly, changesin fair value of these instruments are immediately recognized in other (income)expense, net and are intended to offset the foreign currency impact of the re-measurement of the related non-functional currency denominated asset orliability or the embedded derivative contract being hedged.
Refer to Note 6 — Fair Value Measurements and Note 17 — RiskManagement and Derivatives in the accompanying Notes to the ConsolidatedFinancial Statements for additional description of how the above financialinstruments are valued and recorded as well as the fair value of outstandingderivatives at period end.
Translational exposuresMany of our foreign subsidiaries operate in functional currencies other thanthe U.S. Dollar. Fluctuations in currency exchange rates create volatility in ourreported results as we are required to translate the balance sheets,operational results and cash flows of these subsidiaries into U.S. Dollars forconsolidated reporting. The translation of foreign subsidiaries’ non-U.S. Dollardenominated balance sheets into U.S. Dollars for consolidated reportingresults in a cumulative translation adjustment to OCI within shareholders’equity. In the translation of our consolidated statements of income, a weakerU.S. Dollar in relation to foreign functional currencies benefits our consolidatedearnings whereas a stronger U.S. Dollar reduces our consolidated earnings.The impact of foreign exchange rate fluctuations on the translation of ourconsolidated revenues was a benefit (detriment) of approximately $(605)million and $268 million for the years ended May 31, 2013 and 2012,respectively. The impact of foreign exchange rate fluctuations on thetranslation of our income before income taxes was a benefit (detriment) ofapproximately $(104) million and $74 million for the years ended May 31,2013 and 2012, respectively.
Managing translational exposures
To minimize the impact of translating foreign currency denominated revenuesand expenses into U.S. Dollars for consolidated reporting, certain foreignsubsidiaries use excess cash to purchase U.S. Dollar denominated available-for-sale investments. The variable future cash flows associated with thepurchase and subsequent sale of these U.S. Dollar denominated securities atnon-U.S. Dollar functional currency subsidiaries creates a foreign currencyexposure that qualifies for hedge accounting under the accounting standardsfor derivatives and hedging. We utilize forward contracts and/or options tomitigate the variability of the forecasted future purchases and sales of theseU.S. Dollar investments. The combination of the purchase and sale of theU.S. Dollar investment and the hedging instrument has the effect of partiallyoffsetting the year-over-year foreign currency translation impact on netearnings in the period the investments are sold. Hedges of available-for- saleinvestments are accounted for as cash flow hedges.
78

PART II
Refer to Note 6 — Fair Value Measurements and Note 17 — RiskManagement and Derivatives in the accompanying Notes to the ConsolidatedFinancial Statements for additional description of how the above financialinstruments are valued and recorded as well as the fair value of outstandingderivatives at period end.
We estimate the combination of translation of foreign currency-denominatedprofits from our international businesses and the year-over-year change inforeign currency related gains and losses included in other (income) expense,net had an unfavorable impact of approximately $56 million on our incomebefore income taxes for the year ended May 31, 2013 and had an insignificantimpact for the year ended May 31, 2012.
Net investments in foreign subsidiariesWe are also exposed to the impact of foreign exchange fluctuations on ourinvestments in wholly-owned foreign subsidiaries denominated in a currencyother than the U.S. Dollar, which could adversely impact the U.S. Dollar value
of these investments and therefore the value of future repatriated earnings.We have hedged and may, in the future, hedge net investment positions incertain foreign subsidiaries to mitigate the effects of foreign exchangefluctuations on these net investments. In accordance with the accountingstandards for derivatives and hedging, the effective portion of the change infair value of the forward contracts designated as net investment hedges isrecorded in the cumulative translation adjustment component of accumulatedother comprehensive income. Any ineffective portion is immediatelyrecognized in earnings as a component of other (income) expense, net. Theimpact of ineffective hedges was not material for any period presented. Tominimize credit risk, we have structured these net investment hedges to begenerally less than six months in duration. Upon maturity, the hedges aresettled based on the current fair value of the forward contracts with therealized gain or loss remaining in OCI. There were no outstanding netinvestment hedges as of May 31, 2013 and 2012. Cash flows from netinvestment hedge settlements totaled $22 million for the year ended May 31,2012.
Liquidity and Capital Resources
Cash Flow ActivityCash provided by operations was $3.0 billion for fiscal 2013 compared to$1.9 billion for fiscal 2012. Our primary source of operating cash flow for fiscal2013 was net income of $2.5 billion. Our fiscal 2013 change in working capitalwas a net cash outflow of $42 million, which is exclusive of working capitalamounts sold as part of the divestitures of Umbro and Cole Haan, ascompared to a net cash outflow of $799 million for fiscal 2012. Ourinvestments in working capital decreased due to slowing growth in inventoryand reductions in accounts receivable compared to the prior year. Duringfiscal 2013, inventory for continuing operations increased 7% compared to a23% increase for fiscal 2012; the slowing growth was driven by our continuedfocus on increasing inventory productivity. The reduction in accountsreceivable was primarily driven by the collection of receivables related todiscontinued operations.
Cash used by investing activities was $1,067 million during fiscal 2013,compared to a $514 million source of cash for fiscal 2012. A major driver ofthe change was the swing from net sales/maturities of short-term investmentsin fiscal 2012 to net purchases of short-term investments in fiscal 2013,reflective of the additional purchases of short-term investments made with theproceeds from the issuance of long term debt in April 2013. In fiscal 2012,there were $1,124 million of net sales/maturities of short-term investments(net of purchases), while in fiscal 2013 we made $1,203 million in netpurchases of short-term investments (net of sales/maturities). This impactwas partially offset by $786 million in proceeds from the sale of Umbro andCole Haan in fiscal 2013.
Cash used by financing activities was $1,040 million for fiscal 2013 comparedto $2,118 million for fiscal 2012. The decrease in cash used by financingactivities was primarily due to $986 million in proceeds from the issuance oflong-term debt in April 2013. Also contributing to the decrease were lowerpayments of long-term debt and notes payable and lower repurchases ofcommon stock, which were partially offset by a reduction in the proceedsfrom the exercise of stock options.
In fiscal 2013, we purchased 33.5 million shares of NIKE’s class B commonstock for $1.7 billion, an average price of $49.50. During the year, wecompleted the four-year, $5 billion share repurchase program approved byour Board of Directors in September 2008. Under that program, wepurchased a total of 118.8 million shares at an average price of $42.08.Subsequently, we began repurchases under a four-year, $8 billion programapproved by the Board in September 2012. As of the end of fiscal 2013, wehad repurchased 15.3 million shares at a cost of $789 million under thiscurrent program. We continue to expect funding of share repurchases willcome from operating cash flow, excess cash, and/or debt. The timing and theamount of shares purchased will be dictated by our capital needs and stockmarket conditions.
Capital ResourcesOn April 23, 2013, we filed a shelf registration statement (the “Shelf”) with theSEC which permits us to issue an unlimited amount of debt securities. TheShelf expires on April 23, 2017. On April 23, 2013, we issued $1.0 billion ofsenior notes with tranches maturing in 2023 and 2043. The 2023 senior noteswere issued in an initial aggregate principal amount of $500 million at a 2.25%fixed, annual interest rate and will mature on May 1, 2023. The 2043 seniornotes were issued in an initial aggregate principal amount of $500 million at a3.625% fixed, annual interest rate and will mature on May 1, 2043. Interest onthe senior notes is payable semi-annually on May 1 and November 1 of eachyear. The issuance resulted in gross proceeds before expenses of $998million. We will use the net proceeds for general corporate purposes, whichmay include, but are not limited to, discharging or refinancing debt, workingcapital, capital expenditures, share repurchases, as yet unplannedacquisitions of assets or businesses and investments in subsidiaries.
On November 1, 2011, we entered into a committed credit facility agreementwith a syndicate of banks which provides for up to $1 billion of borrowingswith the option to increase borrowings to $1.5 billion with lender approval. Thefacility matures November 1, 2016, with a one-year extension option prior toboth the second and third anniversary of the closing date, provided thatextensions shall not extend beyond November 1, 2018. As of and for the yearended May 31, 2013, we had no amounts outstanding under our committedcredit facility.
We currently have long-term debt ratings of A+ and A1 from Standard andPoor’s Corporation and Moody’s Investor Services, respectively. If our long-term debt rating were to decline, the facility fee and interest rate under ourcommitted credit facility would increase. Conversely, if our long-term debtrating were to improve, the facility fee and interest rate would decrease.Changes in our long-term debt rating would not trigger acceleration ofmaturity of any then-outstanding borrowings or any future borrowings underthe committed credit facility. Under this committed revolving credit facility, wehave agreed to various covenants. These covenants include limits on ourdisposal of fixed assets, the amount of debt secured by liens we may incur, aswell as a minimum capitalization ratio. In the event we were to have anyborrowings outstanding under this facility and failed to meet any covenant,and were unable to obtain a waiver from a majority of the banks in thesyndicate, any borrowings would become immediately due and payable. Asof May 31, 2013, we were in full compliance with each of these covenantsand believe it is unlikely we will fail to meet any of these covenants in theforeseeable future.
Liquidity is also provided by our $1 billion commercial paper program. Duringthe year ended May 31, 2013, we issued and subsequently repaidcommercial paper borrowings of $505 million. As of May 31, 2013, therewere no outstanding borrowings under this program. We may continue to
NIKE, INC. 2013 Annual Report and Notice of Annual Meeting 79
FOR
M10
-K

PART II
issue commercial paper or other debt securities during fiscal 2014 dependingon general corporate needs. We currently have short-term debt ratings of A1and P1 from Standard and Poor’s Corporation and Moody’s InvestorServices, respectively.
As of May 31, 2013, we had cash, cash equivalents and short-terminvestments totaling $6.0 billion, of which $3.5 billion was held by our foreignsubsidiaries. Cash equivalents and short-term investments consist primarily ofdeposits held at major banks, money market funds, Tier-1 commercial paper,corporate notes, U.S. Treasury obligations, U.S. government sponsoredenterprise obligations, and other investment grade fixed incomesecurities. Our fixed income investments are exposed to both credit andinterest rate risk. All of our investments are investment grade to minimize ourcredit risk. While individual securities have varying durations, as of May 31,2013 the average duration of our short-term investments and cashequivalents portfolio is 98 days.
Despite recent uncertainties in the financial markets, to date we have notexperienced difficulty accessing the credit markets or incurred higher interestcosts. Future volatility in the capital markets, however, may increase costsassociated with issuing commercial paper or other debt instruments or affectour ability to access those markets. We believe that existing cash, cashequivalents, short-term investments and cash generated by operations,together with access to external sources of funds as described above, will besufficient to meet our domestic and foreign capital needs in the foreseeablefuture.
We utilize a variety of tax planning and financing strategies to manage ourworldwide cash and deploy funds to locations where they are needed. Weroutinely repatriate a portion of our foreign earnings for which U.S. taxes havepreviously been provided. We also indefinitely reinvest a significant portion ofour foreign earnings, and our current plans do not demonstrate a need torepatriate these earnings. Should we require additional capital in the U.S., wemay elect to repatriate indefinitely reinvested foreign funds or raise capital inthe U.S. through debt. If we were to repatriate indefinitely reinvested foreignfunds, we would be required to accrue and pay additional U.S. taxes lessapplicable foreign tax credits. If we elect to raise capital in the U.S. throughdebt, we would incur additional interest expense.
Off-Balance Sheet ArrangementsIn connection with various contracts and agreements, we routinely provideindemnifications relating to the enforceability of intellectual property rights,coverage for legal issues that arise and other items where we are acting as theguarantor. Currently, we have several such agreements in place. However,based on our historical experience and the estimated probability of future loss,we have determined that the fair value of such indemnifications is not materialto our financial position or results of operations.
Contractual ObligationsOur significant long-term contractual obligations as of May 31, 2013 and significant endorsement contracts entered into through the date of this report are asfollows:
Description of Commitment Cash Payments Due During the Year Ending May 31,(In millions) 2014 2015 2016 2017 2018 Thereafter TotalOperating Leases $ 403 $ 340 $ 304 $ 272 $ 225 $ 816 $ 2,360Capital Leases 23 28 21 9 — — 81Long-term Debt 98 46 145 79 56 1,525 1,949Endorsement Contracts(1) 909 790 586 450 309 559 3,603Product Purchase Obligations(2) 3,273 — — — — — 3,273Other(3) 304 89 52 82 4 18 549TOTAL $ 5,010 $ 1,293 $ 1,108 $ 892 $ 594 $ 2,918 $ 11,815
(1) The amounts listed for endorsement contracts represent approximate amounts of base compensation and minimum guaranteed royalty fees we are obligated to pay athlete and sportteam endorsers of our products. Actual payments under some contracts may be higher than the amounts listed as these contracts provide for bonuses to be paid to the endorsers basedupon athletic achievements and/or royalties on product sales in future periods. Actual payments under some contracts may also be lower as these contracts include provisions for reducedpayments if athletic performance declines in future periods.
In addition to the cash payments, we are obligated to furnish our endorsers with NIKE product for their use. It is not possible to determine how much we will spend on this product on anannual basis as the contracts generally do not stipulate a specific amount of cash to be spent on the product. The amount of product provided to the endorsers will depend on manyfactors, including general playing conditions, the number of sporting events in which they participate, and our own decisions regarding product and marketing initiatives. In addition, thecosts to design, develop, source, and purchase the products furnished to the endorsers are incurred over a period of time and are not necessarily tracked separately from similar costsincurred for products sold to customers.
(2) We generally order product at least 4 to 5 months in advance of sale based primarily on futures orders received from customers. The amounts listed for product purchase obligationsrepresent agreements (including open purchase orders) to purchase products in the ordinary course of business that are enforceable and legally binding and that specify all significantterms. In some cases, prices are subject to change throughout the production process. The reported amounts exclude product purchase liabilities included in accounts payable on theconsolidated balance sheet as of May 31, 2013.
(3) Other amounts primarily include service and marketing commitments made in the ordinary course of business. The amounts represent the minimum payments required by legally bindingcontracts and agreements that specify all significant terms, including open purchase orders for non-product purchases. The reported amounts exclude those liabilities included in accountspayable or accrued liabilities on the consolidated balance sheet as of May 31, 2013.
The total liability for uncertain tax positions was $447 million, excluding related interest and penalties, at May 31, 2013. We are not able to reasonably estimatewhen or if cash payments of the long-term liability for uncertain tax positions will occur.
We also have the following outstanding short-term debt obligations as of May 31, 2013. Refer to Note 7 — Short-Term Borrowings and Credit Lines for furtherdescription and interest rates related to the short-term debt obligations listed below.
(In millions)Outstanding asof May 31, 2013
Notes payable, due at mutually agreed-upon dates within one year of issuance or on demand $ 121Payable to Sojitz America for the purchase of inventories, generally due 60 days after shipment of goods from a foreign port 55
As of May 31, 2013, letters of credit of $149 million were outstanding, which were generally issued for the purchase of inventory and as guarantees of theCompany’s performance under certain self-insurance and other programs.
80

PART II
Recently Adopted Accounting Standards
In July 2012, the Financial Accounting Standards Board (“FASB”) issued anaccounting standards update intended to simplify how an entity testsindefinite-lived intangible assets other than goodwill for impairment byproviding entities with an option to perform a qualitative assessment todetermine whether further impairment testing is necessary. This accountingstandard update will be effective for us beginning June 1, 2013, and earlyadoption is permitted. We early adopted this standard and the adoption didnot have a material impact on our consolidated financial position or results ofoperations.
In September 2011, the FASB issued updated guidance on the periodictesting of goodwill for impairment. This guidance will allow companies toassess qualitative factors to determine if it is more-likely-than-not that goodwillmight be impaired and whether it is necessary to perform the two-stepgoodwill impairment test required under current accounting standards. Thisnew guidance was effective for us beginning June 1, 2012. The adoption didnot have a material effect on our consolidated financial position or results ofoperations.
In June 2011, the FASB issued guidance on the presentation ofcomprehensive income. This new guidance eliminates the current option toreport other comprehensive income and its components in the statement ofshareholders’ equity. Companies are now required to present thecomponents of net income and other comprehensive income in either onecontinuous statement, referred to as the statement of comprehensiveincome, or in two separate, but consecutive statements. This requirementwas effective for us beginning June 1, 2012. As this guidance only amendedthe presentation of the components of comprehensive income, the adoptiondid not have an impact on our consolidated financial position or results ofoperations. Further, this guidance required companies to presentreclassification adjustments out of accumulated other comprehensive incomeby component in both the statement in which net income is presented andthe statement in which other comprehensive income is presented. Thisrequirement will be effective for us beginning June 1, 2013. As this guidanceonly amends the presentation of the components of comprehensive income,we do not anticipate the adoption will have an impact on our consolidatedfinancial position or results of operations.
Recently Issued Accounting Standards
In December 2011, the FASB issued guidance enhancing disclosurerequirements surrounding the nature of an entity’s right to offset and relatedarrangements associated with its financial instruments and derivativeinstruments. This new guidance requires companies to disclose both grossand net information about instruments and transactions eligible for offset in
the statement of financial position and instruments and transactions subjectto master netting arrangements. This new guidance is effective for usbeginning June 1, 2013. As this guidance only requires expandeddisclosures, we do not anticipate the adoption will have an impact on ourconsolidated financial position or results of operations.
Critical Accounting Policies
Our previous discussion and analysis of our financial condition and results ofoperations are based upon our consolidated financial statements, which havebeen prepared in accordance with accounting principles generally acceptedin the United States of America. The preparation of these financial statementsrequires us to make estimates and judgments that affect the reportedamounts of assets, liabilities, revenues and expenses, and related disclosureof contingent assets and liabilities.
We believe that the estimates, assumptions and judgments involved in theaccounting policies described below have the greatest potential impact onour financial statements, so we consider these to be our critical accountingpolicies. Because of the uncertainty inherent in these matters, actual resultscould differ from the estimates we use in applying the critical accountingpolicies. Certain of these critical accounting policies affect working capitalaccount balances, including the policies for revenue recognition, theallowance for uncollectible accounts receivable, inventory reserves, andcontingent payments under endorsement contracts. These policies requirethat we make estimates in the preparation of our financial statements as of agiven date. However, since our business cycle is relatively short, actual resultsrelated to these estimates are generally known within the six-month periodfollowing the financial statement date. Thus, these policies generally affectonly the timing of reported amounts across two to three fiscal quarters.
Within the context of these critical accounting policies, we are not currentlyaware of any reasonably likely events or circumstances that would result inmaterially different amounts being reported.
Revenue RecognitionWe record wholesale revenues when title passes and the risks and rewards ofownership have passed to the customer, based on the terms of sale. Titlepasses generally upon shipment or upon receipt by the customer dependingon the country of the sale and the agreement with the customer. Retail storerevenues are recorded at the time of sale.
In some instances, we ship product directly from our supplier to the customerand recognize revenue when the product is delivered to and accepted by the
customer. Our revenues may fluctuate in cases when our customers delayaccepting shipment of product for periods of up to several weeks.
In certain countries outside of the U.S., precise information regarding the dateof receipt by the customer is not readily available. In these cases, we estimatethe date of receipt by the customer based upon historical delivery times bygeographic location. On the basis of our tests of actual transactions, we haveno indication that these estimates have been materially inaccurate historically.
As part of our revenue recognition policy, we record estimated sales returns,discounts and miscellaneous claims from customers as reductions torevenues at the time revenues are recorded. Our post invoice sales discountsconsist of contractual programs with certain customers or discretionarydiscounts that are expected to be granted to certain customers at a later date.We base our estimates on historical rates of product returns, discounts andclaims, specific identification of outstanding claims and outstanding returnsnot yet received from customers, and estimated returns, discounts andclaims expected but not yet finalized with our customers. Actual returns,discounts and claims in any future period are inherently uncertain and thusmay differ from our estimates. If actual or expected future returns, discountsand claims were significantly greater or lower than the reserves we hadestablished, we would record a reduction or increase to net revenues in theperiod in which we made such determination.
Allowance for Uncollectible AccountsReceivableWe make ongoing estimates relating to the ability to collect our accountsreceivable and maintain an allowance for estimated losses resulting from theinability of our customers to make required payments. In determining theamount of the allowance, we consider our historical level of credit losses andmake judgments about the creditworthiness of significant customers basedon ongoing credit evaluations. Since we cannot predict future changes in thefinancial stability of our customers, actual future losses from uncollectibleaccounts may differ from our estimates. If the financial condition of ourcustomers were to deteriorate, resulting in their inability to make payments, a
NIKE, INC. 2013 Annual Report and Notice of Annual Meeting 81
FOR
M10
-K

PART II
larger allowance might be required. In the event we determine that a smalleror larger allowance is appropriate, we would record a credit or a charge toselling and administrative expense in the period in which such a determinationis made.
Inventory ReservesWe also make ongoing estimates relating to the net realizable value ofinventories based upon our assumptions about future demand and marketconditions. If we estimate that the net realizable value of our inventory is lessthan the cost of the inventory recorded on our books, we record a reserveequal to the difference between the cost of the inventory and the estimatednet realizable value. This reserve is recorded as a charge to cost of sales. Ifchanges in market conditions result in reductions in the estimated netrealizable value of our inventory below our previous estimate, we wouldincrease our reserve in the period in which we made such a determination andrecord a charge to cost of sales.
Contingent Payments under EndorsementContractsA significant portion of our demand creation expense relates to paymentsunder endorsement contracts. In general, endorsement payments areexpensed uniformly over the term of the contract. However, certain contractelements may be accounted for differently, based upon the facts andcircumstances of each individual contract.
Some of the contracts provide for contingent payments to endorsers basedupon specific achievements in their sports (e.g., winning a championship). Werecord selling and administrative expense for these amounts when theendorser achieves the specific goal.
Some of the contracts provide for payments based upon endorsersmaintaining a level of performance in their sport over an extended period oftime (e.g., maintaining a top ranking in a sport for a year). These amounts arereported in selling and administrative expense when we determine that it isprobable that the specified level of performance will be maintained throughoutthe period. In these instances, to the extent that actual payments to theendorser differ from our estimate due to changes in the endorser’s athleticperformance, increased or decreased selling and administrative expense maybe reported in a future period.
Some of the contracts provide for royalty payments to endorsers based upona predetermined percentage of sales of particular products. We expensethese payments in cost of sales as the related sales occur. In certaincontracts, we offer minimum guaranteed royalty payments. For contractualobligations for which we estimate we will not meet the minimum guaranteedamount of royalty fees through sales of product, we record the amount of theguaranteed payment in excess of that earned through sales of product inselling and administrative expense uniformly over the remaining guaranteeperiod.
Property, Plant and Equipment and Definite-Lived AssetsProperty, plant and equipment, including buildings, equipment, andcomputer hardware and software are recorded at cost (including, in somecases, the cost of internal labor) and are depreciated over the estimateduseful life. Changes in circumstances (such as technological advances orchanges to our business operations) can result in differences between theactual and estimated useful lives. In those cases where we determine that theuseful life of a long-lived asset should be shortened, we increase depreciationexpense over the remaining useful life to depreciate the asset’s net book valueto its salvage value.
We review the carrying value of long-lived assets or asset groups to be usedin operations whenever events or changes in circumstances indicate that thecarrying amount of the assets might not be recoverable. Factors that wouldnecessitate an impairment assessment include a significant adverse change
in the extent or manner in which an asset is used, a significant adversechange in legal factors or the business climate that could affect the value ofthe asset, or a significant decline in the observable market value of an asset,among others. If such facts indicate a potential impairment, we would assessthe recoverability of an asset group by determining if the carrying value of theasset group exceeds the sum of the projected undiscounted cash flowsexpected to result from the use and eventual disposition of the assets over theremaining economic life of the primary asset in the asset group. If therecoverability test indicates that the carrying value of the asset group is notrecoverable, we will estimate the fair value of the asset group usingappropriate valuation methodologies that would typically include an estimateof discounted cash flows. Any impairment would be measured as thedifference between the asset group’s carrying amount and its estimated fairvalue.
Goodwill and Indefinite-Lived Intangible AssetsWe perform annual impairment tests on goodwill and intangible assets withindefinite lives in the fourth quarter of each fiscal year, or when events occur orcircumstances change that would, more likely than not, reduce the fair valueof a reporting unit or an intangible asset with an indefinite life below its carryingvalue. Events or changes in circumstances that may trigger interimimpairment reviews include significant changes in business climate, operatingresults, planned investments in the reporting unit, planned divestitures or anexpectation that the carrying amount may not be recoverable, among otherfactors. We may first assess qualitative factors to determine whether it is morelikely than not that the fair value of a reporting unit is less than its carryingamount. If, after assessing the totality of events and circumstances, wedetermine that it is more likely than not that the fair value of the reporting unit isgreater than its carrying amount, the two-step impairment test isunnecessary. The two-step impairment test requires us to estimate the fairvalue of our reporting units. If the carrying value of a reporting unit exceeds itsfair value, the goodwill of that reporting unit is potentially impaired and weproceed to step two of the impairment analysis. In step two of the analysis, wemeasure and record an impairment loss equal to the excess of the carryingvalue of the reporting unit’s goodwill over its implied fair value, if any.
We generally base our measurement of the fair value of a reporting unit on ablended analysis of the present value of future discounted cash flows and themarket valuation approach. The discounted cash flows model indicates thefair value of the reporting unit based on the present value of the cash flowsthat we expect the reporting unit to generate in the future. Our significantestimates in the discounted cash flows model include: our weighted averagecost of capital; long-term rate of growth and profitability of the reporting unit’sbusiness; and working capital effects. The market valuation approachindicates the fair value of the business based on a comparison of the reportingunit to comparable publicly traded companies in similar lines of business.Significant estimates in the market valuation approach model includeidentifying similar companies with comparable business factors such as size,growth, profitability, risk and return on investment, and assessing comparablerevenue and operating income multiples in estimating the fair value of thereporting unit.
Indefinite-lived intangible assets primarily consist of acquired trade names andtrademarks. We may first perform a qualitative assessment to determinewhether it is more likely than not that an indefinite-lived intangible asset isimpaired. If, after assessing the totality of events and circumstances, wedetermine that it is more likely than not that the indefinite-lived intangible assetis not impaired, no quantitative fair value measurement is necessary. If aquantitative fair value measurement calculation is required for these intangibleassets, we utilize the relief-from-royalty method. This method assumes thattrade names and trademarks have value to the extent that their owner isrelieved of the obligation to pay royalties for the benefits received from them.This method requires us to estimate the future revenue for the related brands,the appropriate royalty rate and the weighted average cost of capital.
Fair Value MeasurementsFor financial assets and liabilities measured at fair value on a recurring basis,fair value is the price we would receive to sell an asset or pay to transfer a
82

PART II
liability in an orderly transaction with a market participant at the measurementdate. In general, and where applicable, we use quoted prices in activemarkets for identical assets or liabilities to determine the fair values of ourfinancial instruments. This pricing methodology applies to our Level 1investments, including U.S. Treasury securities.
In the absence of active markets for identical assets or liabilities, suchmeasurements involve developing assumptions based on market observabledata, including quoted prices for similar assets or liabilities in active marketsand quoted prices for identical or similar assets or liabilities in markets that arenot active. This pricing methodology applies to our Level 2 investments suchas commercial paper and bonds, U.S. agency securities and money marketfunds. Level 3 investments are valued using internally developed models withunobservable inputs. Assets and liabilities measured using unobservableinputs are an immaterial portion of our portfolio.
A majority of our available-for-sale securities are priced by pricing vendors andare generally Level 1 or Level 2 investments, as these vendors either provide aquoted market price in an active market or use observable inputs withoutapplying significant adjustments in their pricing. Observable inputs includebroker quotes, interest rates and yield curves observable at commonlyquoted intervals, volatilities and credit risks. Our fair value processes includecontrols that are designed to ensure appropriate fair values arerecorded. These controls include an analysis of period-over-periodfluctuations and comparison to another independent pricing vendor.
Hedge Accounting for DerivativesWe use forward and option contracts to hedge certain anticipated foreigncurrency exchange transactions as well as certain non-functional currencymonetary assets and liabilities. When the specific criteria to qualify for hedgeaccounting has been met, changes in the fair value of contracts hedgingprobable forecasted future cash flows are recorded in other comprehensiveincome, rather than net income, until the underlying hedged transactionaffects net income. In most cases, this results in gains and losses on hedgederivatives being released from other comprehensive income into net incomesome time after the maturity of the derivative. One of the criteria for thisaccounting treatment is that the forward and option contracts amount shouldnot be in excess of specifically identified anticipated transactions. By their verynature, our estimates of anticipated transactions may fluctuate over time andmay ultimately vary from actual transactions. When anticipated transactionestimates or actual transaction amounts decline below hedged levels, or if it isno longer probable that a forecasted transaction will occur by the end of theoriginally specified time period or within an additional two-month period oftime thereafter, we are required to reclassify the cumulative changes in fairvalues of the over-hedged portion of the related hedge contract from othercomprehensive income to other (income) expense, net during the quarter inwhich such changes occur.
We have used and may, in the future, use forward contracts to hedge ourinvestment in the net assets of certain international subsidiaries to offsetforeign currency translation related to our net investment in those subsidiaries.The change in fair value of the forward contracts hedging our net investmentsis reported in the cumulative translation adjustment component ofaccumulated other comprehensive income within shareholders’ equity, to theextent effective, to offset the foreign currency translation adjustments onthose investments. As the value of our underlying net investments in wholly-owned international subsidiaries is known at the time a hedge is placed, thedesignated hedge is matched to the portion of our net investment at risk.Accordingly, the variability involved in net investment hedges is substantiallyless than that of other types of hedge transactions and we do not expect anymaterial ineffectiveness. We consider, on a quarterly basis, the need toredesignate existing hedge relationships based on changes in the underlyingnet investment. Should the level of our net investment decrease belowhedged levels, the cumulative change in fair value of the over-hedged portionof the related hedge contract would be reported directly to earnings in theperiod in which changes occur.
Stock-based CompensationWe account for stock-based compensation by estimating the fair value ofstock-based compensation on the date of grant using the Black-Scholesoption pricing model. The Black-Scholes option pricing model requires theinput of highly subjective assumptions including volatility. Expected volatility isestimated based on implied volatility in market traded options on our commonstock with a term greater than one year, along with other factors. Our decisionto use implied volatility was based on the availability of actively traded optionson our common stock and our assessment that implied volatility is morerepresentative of future stock price trends than historical volatility. If factorschange and we use different assumptions for estimating stock-basedcompensation expense in future periods, stock-based compensationexpense may differ materially in the future from that recorded in the currentperiod.
TaxesWe record valuation allowances against our deferred tax assets, whennecessary. Realization of deferred tax assets (such as net operating losscarry-forwards) is dependent on future taxable earnings and is thereforeuncertain. At least quarterly, we assess the likelihood that our deferred taxasset balance will be recovered from future taxable income. To the extent webelieve that recovery is not likely, we establish a valuation allowance againstour net deferred tax asset, which increases our income tax expense in theperiod when such determination is made.
In addition, we have not recorded U.S. income tax expense for foreignearnings that we have determined to be indefinitely reinvested outside theU.S., thus reducing our overall income tax expense. The amount of earningsdesignated as indefinitely reinvested offshore is based upon the actualdeployment of such earnings in our offshore assets and our expectations ofthe future cash needs of our U.S. and foreign entities. Income taxconsiderations are also a factor in determining the amount of foreign earningsto be indefinitely reinvested offshore.
We carefully review all factors that drive the ultimate disposition of foreignearnings determined to be reinvested offshore and apply stringent standardsto overcome the presumption of repatriation. Despite this approach, becausethe determination involves our future plans and expectations of future events,the possibility exists that amounts declared as indefinitely reinvested offshoremay ultimately be repatriated. For instance, the actual cash needs of our U.S.entities may exceed our current expectations, or the actual cash needs of ourforeign entities may be less than our current expectations. This would result inadditional income tax expense in the year we determined that amounts wereno longer indefinitely reinvested offshore. Conversely, our approach may alsoresult in a determination that accumulated foreign earnings (for which U.S.income taxes have been provided) will be indefinitely reinvested offshore. Inthis case, our income tax expense would be reduced in the year of suchdetermination.
On an interim basis, we estimate what our effective tax rate will be for the fullfiscal year. This estimated annual effective tax rate is then applied to the year-to-date pre-tax income excluding infrequently occurring or unusual items, todetermine the year-to-date tax expense. The income tax effects of infrequentor unusual items are recognized in the interim period in which they occur. Asthe fiscal year progresses, we continually refine our estimate based uponactual events and earnings by jurisdiction during the year. This continualestimation process periodically results in a change to our expected effectivetax rate for the fiscal year. When this occurs, we adjust the income taxprovision during the quarter in which the change in estimate occurs.
On a quarterly basis, we reevaluate the probability that a tax position will beeffectively sustained and the appropriateness of the amount recognized foruncertain tax positions based on factors including changes in facts orcircumstances, changes in tax law, settled audit issues and new audit activity.Changes in our assessment may result in the recognition of a tax benefit or anadditional charge to the tax provision in the period our assessment changes.We recognize interest and penalties related to income tax matters in incometax expense.
NIKE, INC. 2013 Annual Report and Notice of Annual Meeting 83
FOR
M10
-K

PART II
Other ContingenciesIn the ordinary course of business, we are involved in legal proceedingsregarding contractual and employment relationships, product liability claims,trademark rights, and a variety of other matters. We record contingentliabilities resulting from claims against us, including related legal costs, when aloss is assessed to be probable and the amount of the loss is reasonablyestimable. Assessing probability of loss and estimating probable lossesrequires analysis of multiple factors, including in some cases judgments aboutthe potential actions of third-party claimants and courts. Recorded contingentliabilities are based on the best information available and actual losses in anyfuture period are inherently uncertain. If future adjustments to estimatedprobable future losses or actual losses exceed our recorded liability for such
claims, we would record additional charges as other (income) expense, netduring the period in which the actual loss or change in estimate occurred. Inaddition to contingent liabilities recorded for probable losses, we disclosecontingent liabilities when there is a reasonable possibility that the ultimateloss will materially exceed the recorded liability. While we cannot predict theoutcome of pending legal matters with certainty, we do not believe anycurrently identified claim, proceeding or litigation, either individually or inaggregate, will have a material impact on our results of operations, financialposition or cash flows.
84

PART II
ITEM 7A. Quantitative and Qualitative Disclosures aboutMarket Risk
In the normal course of business and consistent with established policies andprocedures, we employ a variety of financial instruments to manage exposureto fluctuations in the value of foreign currencies and interest rates. It is ourpolicy to utilize these financial instruments only where necessary to financeour business and manage such exposures; we do not enter into thesetransactions for trading or speculative purposes.
We are exposed to foreign currency fluctuations, primarily as a result of ourinternational sales, product sourcing and funding activities. Our foreignexchange risk management program is intended to lessen both the positiveand negative effects of currency fluctuations on our consolidated results ofoperations, financial position and cash flows. We use forward exchangecontracts and options to hedge certain anticipated but not yet firmlycommitted transactions as well as certain firm commitments and the relatedreceivables and payables, including third-party and intercompanytransactions. We have, and may in the future, also use forward contracts tohedge our investment in the net assets of certain international subsidiaries tooffset foreign currency translation adjustments related to our net investment inthose subsidiaries. Where exposures are hedged, our program has the effect
of delaying the impact of exchange rate movements on our consolidatedfinancial statements.
The timing for hedging exposures, as well as the type and duration of thehedge instruments employed, are guided by our hedging policies anddetermined based upon the nature of the exposure and prevailing marketconditions. Generally, hedged transactions are expected to be recognizedwithin 12 to 18 months. When intercompany loans are hedged, it is typicallyfor their expected duration. Hedged transactions are principally denominatedin Euros, British Pounds and Japanese Yen. See section “Foreign CurrencyExposures and Hedging Practices” under Item 7 for additional detail.
Our earnings are also exposed to movements in short- and long-term marketinterest rates. Our objective in managing this interest rate exposure is to limitthe impact of interest rate changes on earnings and cash flows and to reduceoverall borrowing costs. To achieve these objectives, we maintain a mix ofcommercial paper, bank loans and fixed rate debt of varying maturities andhave entered into receive-fixed, pay-variable interest rate swaps for a portionof our fixed rate debt.
Market Risk Measurement
We monitor foreign exchange risk, interest rate risk and related derivativesusing a variety of techniques including a review of market value, sensitivityanalysis, and Value-at-Risk (“VaR”). Our market-sensitive derivative and otherfinancial instruments are foreign currency forward contracts, foreign currencyoption contracts, interest rate swaps, intercompany loans denominated innon-functional currencies, fixed interest rate U.S. Dollar denominated debt,and fixed interest rate Japanese Yen denominated debt.
We use VaR to monitor the foreign exchange risk of our foreign currencyforward and foreign currency option derivative instruments only. The VaRdetermines the maximum potential one-day loss in the fair value of theseforeign exchange rate-sensitive financial instruments. The VaR modelestimates assume normal market conditions and a 95% confidence level.There are various modeling techniques that can be used in the VaRcomputation. Our computations are based on interrelationships betweencurrencies and interest rates (a “variance/co-variance” technique). Theseinterrelationships are a function of foreign exchange currency market changesand interest rate changes over the preceding one year period. The value offoreign currency options does not change on a one-to-one basis withchanges in the underlying currency rate. We adjust the potential loss in optionvalue for the estimated sensitivity (the “delta” and “gamma”) to changes in theunderlying currency rate. This calculation reflects the impact of foreigncurrency rate fluctuations on the derivative instruments only and does notinclude the impact of such rate fluctuations on non-functional currencytransactions (such as anticipated transactions, firm commitments, cashbalances, and accounts and loans receivable and payable), including thosewhich are hedged by these instruments.
The VaR model is a risk analysis tool and does not purport to represent actuallosses in fair value that we will incur nor does it consider the potential effect offavorable changes in market rates. It also does not represent the full extent ofthe possible loss that may occur. Actual future gains and losses will differ from
those estimated because of changes or differences in market rates andinterrelationships, hedging instruments and hedge percentages, timing andother factors.
The estimated maximum one-day loss in fair value on our foreign currencysensitive derivative financial instruments, derived using the VaR model, was$34 million and $21 million at May 31, 2013 and 2012, respectively. The VaRincreased year-over-year as a result of an increase in the total notional value ofour foreign currency derivative portfolio combined with a longer averageduration on our outstanding trades at May 31, 2013. Such a hypothetical lossin the fair value of our derivatives would be offset by increases in the value ofthe underlying transactions being hedged. The average monthly change in thefair values of foreign currency forward and foreign currency option derivativeinstruments was $49 million and $87 million during fiscal 2013 and fiscal2012, respectively.
The instruments not included in the VaR are intercompany loansdenominated in non-functional currencies, fixed interest rate Japanese Yendenominated debt, fixed interest rate U.S. Dollar denominated debt andinterest rate swaps. Intercompany loans and related interest amounts areeliminated in consolidation. Furthermore, our non-functional currencyintercompany loans are substantially hedged against foreign exchange riskthrough the use of forward contracts, which are included in the VaRcalculation above. Therefore, we consider the interest rate and foreigncurrency market risks associated with our non-functional currencyintercompany loans to be immaterial to our consolidated financial position,results from operations and cash flows.
Details of third-party debt and interest rate swaps are provided in the tablebelow. The table presents principal cash flows and related weighted averageinterest rates by expected maturity dates. Weighted average interest rates forthe fixed rate swapped to floating rate debt reflect the effective interest rates atMay 31, 2013.
NIKE, INC. 2013 Annual Report and Notice of Annual Meeting 85
FOR
M10
-K

PART II
Expected Maturity DateYear Ending May 31,
(Dollars in millions) 2014 2015 2016 2017 2018 Thereafter Total Fair ValueForeign Exchange RiskJapanese Yen Functional CurrencyLong-term Japanese Yen debt — Fixed ratePrincipal payments $ 7 $ 7 $ 7 $ 7 $ 7 $ 14 $ 49 $ 52Average interest rate 2.4% 2.4% 2.4% 2.4% 2.4% 2.4% 2.4%
Interest Rate RiskJapanese Yen Functional CurrencyLong-term Japanese Yen debt — Fixed ratePrincipal payments $ 7 $ 7 $ 7 $ 7 $ 7 $ 14 $ 49 $ 52Average interest rate 2.4% 2.4% 2.4% 2.4% 2.4% 2.4% 2.4%
U.S. Dollar Functional CurrencyLong-term U.S. Dollar debt — Fixed rateswapped to Floating ratePrincipal payments $ — $ — $ 100 $ — $ — $ — $ 100 $ 110Average interest rate 0.0% 0.0% 0.4% 0.0% 0.0% 0.0% 0.4%
Long-term U.S. Dollar debt — Fixed ratePrincipal payments $ 51 $ 1 $ 1 $ 38 $ 18 $ 1,000 $ 1,109 $ 1,057Average interest rate 4.7% 6.4% 6.4% 6.2% 6.8% 2.9% 3.2%
The fixed interest rate Japanese Yen denominated debt instruments were issued by and are accounted for by one of our Japanese subsidiaries. Accordingly, themonthly translation of these instruments, which varies due to changes in foreign exchange rates, is recognized in accumulated other comprehensive income uponthe consolidation of this subsidiary.
ITEM 8. Financial Statements and Supplemental DataManagement of NIKE, Inc. is responsible for the information andrepresentations contained in this report. The financial statements have beenprepared in conformity with the generally accepted accounting principles weconsidered appropriate in the circumstances and include some amountsbased on our best estimates and judgments. Other financial information in thisreport is consistent with these financial statements.
Our accounting systems include controls designed to reasonably assureassets are safeguarded from unauthorized use or disposition and provide forthe preparation of financial statements in conformity with generally acceptedaccounting principles. These systems are supplemented by the selection andtraining of qualified financial personnel and an organizational structureproviding for appropriate segregation of duties.
An Internal Audit department reviews the results of its work with the AuditCommittee of the Board of Directors, presently consisting of three outsidedirectors. The Audit Committee is responsible for the appointment of theindependent registered public accounting firm and reviews with theindependent registered public accounting firm, management and the internalaudit staff, the scope and the results of the annual examination, theeffectiveness of the accounting control system and other matters relating tothe financial affairs of NIKE as the Audit Committee deems appropriate. Theindependent registered public accounting firm and the internal auditors havefull access to the Committee, with and without the presence of management,to discuss any appropriate matters.
86

PART II
Management’s Annual Report on Internal Control Over Financial Reporting
Management is responsible for establishing and maintaining adequate internalcontrol over financial reporting, as such term is defined in Rule 13a-15(f) andRule 15d-15(f) of the Securities Exchange Act of 1934, as amended. Internalcontrol over financial reporting is a process designed to provide reasonableassurance regarding the reliability of financial reporting and the preparation ofthe financial statements for external purposes in accordance with generallyaccepted accounting principles in the United States of America. Internalcontrol over financial reporting includes those policies and procedures that:(i) pertain to the maintenance of records that, in reasonable detail, accuratelyand fairly reflect the transactions and dispositions of assets of the Company;(ii) provide reasonable assurance that transactions are recorded as necessaryto permit preparation of financial statements in accordance with generallyaccepted accounting principles, and that receipts and expenditures of theCompany are being made only in accordance with authorizations of ourmanagement and directors; and (iii) provide reasonable assurance regardingprevention or timely detection of unauthorized acquisition, use or dispositionof assets of the Company that could have a material effect on the financialstatements.
While “reasonable assurance” is a high level of assurance, it does not meanabsolute assurance. Because of its inherent limitations, internal control overfinancial reporting may not prevent or detect every misstatement and instance
of fraud. Controls are susceptible to manipulation, especially in instances offraud caused by the collusion of two or more people, including our seniormanagement. Also, projections of any evaluation of effectiveness to futureperiods are subject to the risk that controls may become inadequate becauseof changes in conditions, or that the degree of compliance with the policies orprocedures may deteriorate.
Under the supervision and with the participation of our Chief Executive Officerand Chief Financial Officer, our management conducted an evaluation of theeffectiveness of our internal control over financial reporting based upon theframework in Internal Control — Integrated Framework issued by theCommittee of Sponsoring Organizations of the Treadway Commission(COSO). Based on the results of our evaluation, our management concludedthat our internal control over financial reporting was effective as of May 31,2013.
PricewaterhouseCoopers LLP, an independent registered public accountingfirm, has audited (1) the consolidated financial statements and (2) theeffectiveness of our internal control over financial reporting as of May 31,2013, as stated in their report herein.
Mark G. Parker Donald W. Blair
President and Chief Executive Officer Chief Financial Officer
NIKE, INC. 2013 Annual Report and Notice of Annual Meeting 87
FOR
M10
-K

PART II
Report of Independent Registered Public Accounting Firm
To the Board of Directors and Shareholders of NIKE, Inc.:
In our opinion, the consolidated financial statements listed in the indexappearing under Item 15(a)(1) present fairly, in all material respects, thefinancial position of NIKE, Inc. and its subsidiaries at May 31, 2013 and 2012,and the results of their operations and their cash flows for each of the threeyears in the period ended May 31, 2013 in conformity with accountingprinciples generally accepted in the United States of America. In addition, inour opinion, the financial statement schedule listed in the appendix appearingunder Item 15(a)(2) presents fairly, in all material respects, the information setforth therein when read in conjunction with the related consolidated financialstatements. Also in our opinion, the Company maintained, in all materialrespects, effective internal control over financial reporting as of May 31, 2013,based on criteria established in Internal Control — Integrated Frameworkissued by the Committee of Sponsoring Organizations of the TreadwayCommission (COSO). The Company’s management is responsible for thesefinancial statements and financial statement schedule, for maintainingeffective internal control over financial reporting and for its assessment of theeffectiveness of internal control over financial reporting, included inManagement’s Annual Report on Internal Control Over Financial Reportingappearing under Item 8. Our responsibility is to express opinions on thesefinancial statements, on the financial statement schedule, and on theCompany’s internal control over financial reporting based on our integratedaudits. We conducted our audits in accordance with the standards of thePublic Company Accounting Oversight Board (United States). Thosestandards require that we plan and perform the audits to obtain reasonableassurance about whether the financial statements are free of materialmisstatement and whether effective internal control over financial reportingwas maintained in all material respects. Our audits of the financial statementsincluded examining, on a test basis, evidence supporting the amounts anddisclosures in the financial statements, assessing the accounting principlesused and significant estimates made by management, and evaluating theoverall financial statement presentation. Our audit of internal control over
financial reporting included obtaining an understanding of internal control overfinancial reporting, assessing the risk that a material weakness exists, andtesting and evaluating the design and operating effectiveness of internalcontrol based on the assessed risk. Our audits also included performing suchother procedures as we considered necessary in the circumstances. Webelieve that our audits provide a reasonable basis for our opinions.
A company’s internal control over financial reporting is a process designed toprovide reasonable assurance regarding the reliability of financial reportingand the preparation of financial statements for external purposes inaccordance with generally accepted accounting principles. A company’sinternal control over financial reporting includes those policies and proceduresthat (i) pertain to the maintenance of records that, in reasonable detail,accurately and fairly reflect the transactions and dispositions of the assets ofthe company; (ii) provide reasonable assurance that transactions arerecorded as necessary to permit preparation of financial statements inaccordance with generally accepted accounting principles, and that receiptsand expenditures of the company are being made only in accordance withauthorizations of management and directors of the company; and (iii) providereasonable assurance regarding prevention or timely detection ofunauthorized acquisition, use, or disposition of the company’s assets thatcould have a material effect on the financial statements.
Because of its inherent limitations, internal control over financial reporting maynot prevent or detect misstatements. Also, projections of any evaluation ofeffectiveness to future periods are subject to the risk that controls maybecome inadequate because of changes in conditions, or that the degree ofcompliance with the policies or procedures may deteriorate.
/S/ PRICEWATERHOUSECOOPERS LLP
Portland, OregonJuly 23, 2013
88

PART II
NIKE, Inc. Consolidated Statements Of Income
Year Ended May 31,(In millions, except per share data) 2013 2012 2011Income from continuing operations:Revenues $ 25,313 $ 23,331 $ 20,117Cost of sales 14,279 13,183 10,915Gross profit 11,034 10,148 9,202Demand creation expense 2,745 2,607 2,344Operating overhead expense 5,035 4,458 4,017Total selling and administrative expense 7,780 7,065 6,361Interest (income) expense, net (Notes 6, 7 and 8) (3) 4 4Other (income) expense, net (Note 17) (15) 54 (25)Income before income taxes 3,272 3,025 2,862Income tax expense (Note 9) 808 756 690
NET INCOME FROM CONTINUING OPERATIONS 2,464 2,269 2,172NET INCOME (LOSS) FROM DISCONTINUED OPERATIONS 21 (46) (39)
NET INCOME $ 2,485 $ 2,223 $ 2,133Earnings per share from continuing operations:Basic earnings per common share (Notes 1 and 12) $ 2.75 $ 2.47 $ 2.28Diluted earnings per common share (Notes 1 and 12) $ 2.69 $ 2.42 $ 2.24
Earnings per share from discontinued operations:Basic earnings per common share (Notes 1 and 12) $ 0.02 $ (0.05) $ (0.04)Diluted earnings per common share (Notes 1 and 12) $ 0.02 $ (0.05) $ (0.04)
Dividends declared per common share $ 0.81 $ 0.70 $ 0.60
The accompanying notes to consolidated financial statements are an integral part of this statement.
NIKE, INC. 2013 Annual Report and Notice of Annual Meeting 89
FOR
M10
-K
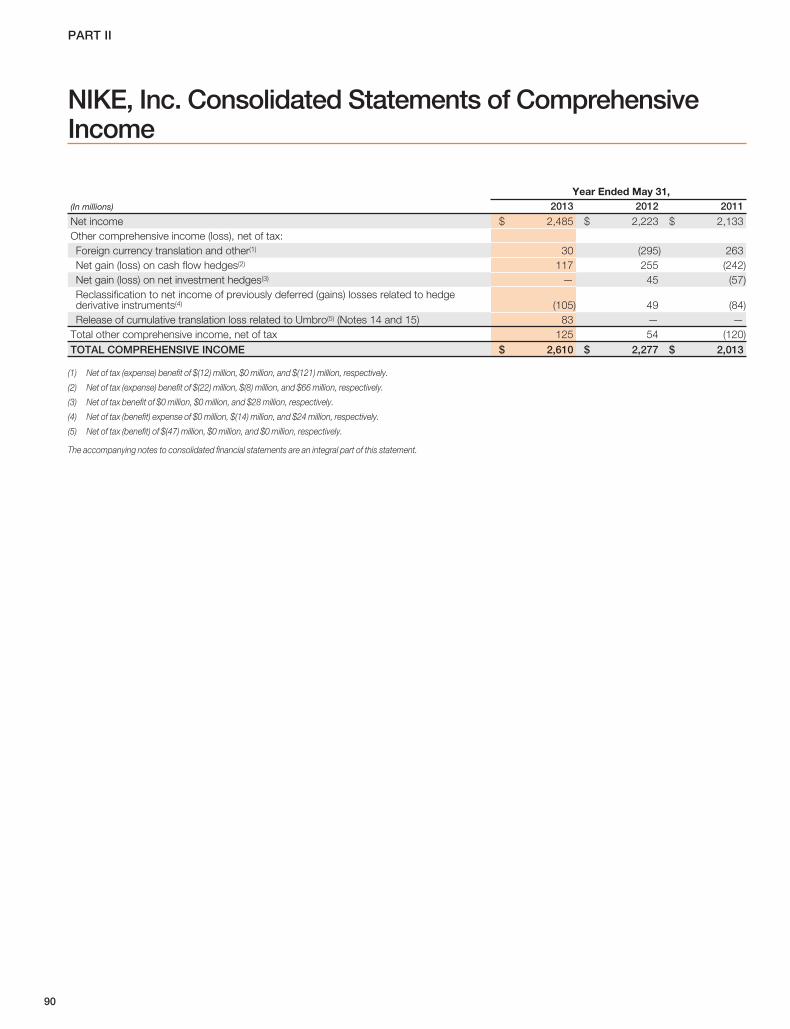
PART II
NIKE, Inc. Consolidated Statements of ComprehensiveIncome
Year Ended May 31,(In millions) 2013 2012 2011
Net income $ 2,485 $ 2,223 $ 2,133Other comprehensive income (loss), net of tax:Foreign currency translation and other(1) 30 (295) 263Net gain (loss) on cash flow hedges(2) 117 255 (242)Net gain (loss) on net investment hedges(3) — 45 (57)Reclassification to net income of previously deferred (gains) losses related to hedgederivative instruments(4) (105) 49 (84)Release of cumulative translation loss related to Umbro(5) (Notes 14 and 15) 83 — —
Total other comprehensive income, net of tax 125 54 (120)TOTAL COMPREHENSIVE INCOME $ 2,610 $ 2,277 $ 2,013
(1) Net of tax (expense) benefit of $(12) million, $0 million, and $(121) million, respectively.
(2) Net of tax (expense) benefit of $(22) million, $(8) million, and $66 million, respectively.
(3) Net of tax benefit of $0 million, $0 million, and $28 million, respectively.
(4) Net of tax (benefit) expense of $0 million, $(14) million, and $24 million, respectively.
(5) Net of tax (benefit) of $(47) million, $0 million, and $0 million, respectively.
The accompanying notes to consolidated financial statements are an integral part of this statement.
90

PART II
NIKE, Inc. Consolidated Balance Sheets
May 31,(In millions) 2013 2012
ASSETSCurrent assets:Cash and equivalents $ 3,337 $ 2,317Short-term investments (Note 6) 2,628 1,440Accounts receivable, net (Note 1) 3,117 3,132Inventories (Notes 1 and 2) 3,434 3,222Deferred income taxes (Note 9) 308 262Prepaid expenses and other current assets (Notes 6 and 17) 802 857Assets of discontinued operations (Note 15) — 615
Total current assets 13,626 11,845Property, plant and equipment, net (Note 3) 2,452 2,209Identifiable intangible assets, net (Note 4) 382 370Goodwill (Note 4) 131 131Deferred income taxes and other assets (Notes 6, 9 and 17) 993 910
TOTAL ASSETS $ 17,584 $ 15,465LIABILITIES AND SHAREHOLDERS’ EQUITYCurrent liabilities:Current portion of long-term debt (Note 8) $ 57 $ 49Notes payable (Note 7) 121 108Accounts payable (Note 7) 1,646 1,549Accrued liabilities (Notes 5, 6 and 17) 1,986 1,941Income taxes payable (Note 9) 98 65Liabilities of discontinued operations (Note 15) 18 170
Total current liabilities 3,926 3,882Long-term debt (Note 8) 1,210 228Deferred income taxes and other liabilities (Notes 6, 9 and 17) 1,292 974Commitments and contingencies (Note 16) — —Redeemable Preferred Stock (Note 10) — —Shareholders’ equity:Common stock at stated value (Note 11):Class A convertible — 178 and 180 shares outstanding — —Class B — 716 and 736 shares outstanding 3 3
Capital in excess of stated value 5,184 4,641Accumulated other comprehensive income (Note 14) 274 149Retained earnings 5,695 5,588
Total shareholders’ equity 11,156 10,381TOTAL LIABILITIES AND SHAREHOLDERS’ EQUITY $ 17,584 $ 15,465
The accompanying notes to consolidated financial statements are an integral part of this statement.
NIKE, INC. 2013 Annual Report and Notice of Annual Meeting 91
FOR
M10
-K

PART II
NIKE, Inc. Consolidated Statements of Cash Flows
Year Ended May 31,(In millions) 2013 2012 2011Cash provided by operations:Net income $ 2,485 $ 2,223 $ 2,133Income charges (credits) not affecting cash:Depreciation 438 373 335Deferred income taxes 21 (60) (76)Stock-based compensation (Note 11) 174 130 105Amortization and other 75 32 23Net gain on divestitures (124) — —Changes in certain working capital components and other assets and liabilities:Decrease (increase) in accounts receivable 142 (323) (273)(Increase) in inventories (197) (805) (551)(Increase) in prepaid expenses and other current assets (28) (141) (35)Increase in accounts payable, accrued liabilities and income taxes payable 41 470 151
Cash provided by operations 3,027 1,899 1,812Cash (used) provided by investing activities:Purchases of short-term investments (3,702) (2,705) (7,616)Maturities of short-term investments 1,501 2,585 4,313Sales of short-term investments 998 1,244 2,766Additions to property, plant and equipment (636) (597) (432)Disposals of property, plant and equipment 14 2 1Proceeds from divestitures 786 — —Increase in other assets, net of other liabilities (28) (37) (30)Settlement of net investment hedges — 22 (23)
Cash (used) provided by investing activities (1,067) 514 (1,021)Cash used by financing activities:Net proceeds from long-term debt issuance 986 — —Long-term debt payments, including current portion (49) (203) (8)Increase (decrease) in notes payable 15 (65) 41Proceeds from exercise of stock options and other stock issuances 313 468 345Excess tax benefits from share-based payment arrangements 72 115 64Repurchase of common stock (1,674) (1,814) (1,859)Dividends — common and preferred (703) (619) (555)
Cash used by financing activities (1,040) (2,118) (1,972)Effect of exchange rate changes 100 67 57Net increase (decrease) in cash and equivalents 1,020 362 (1,124)Cash and equivalents, beginning of year 2,317 1,955 3,079CASH AND EQUIVALENTS, END OF YEAR $ 3,337 $ 2,317 $ 1,955Supplemental disclosure of cash flow information:Cash paid during the year for:Interest, net of capitalized interest $ 20 $ 29 $ 32Income taxes 702 638 736
Dividends declared and not paid 188 165 145
The accompanying notes to consolidated financial statements are an integral part of this statement.
92

PART II
NIKE, Inc. Consolidated Statements of Shareholders’ Equity
Common Stock Capital inExcess
of StatedValue
AccumulatedOther
ComprehensiveIncome
RetainedEarnings Total
Class A Class B(In millions, except per share data) Shares Amount Shares AmountBalance at May 31, 2010 180 $ — 788 $ 3 $ 3,441 $ 215 $ 6,095 $ 9,754Stock options exercised 14 368 368Repurchase of Class BCommon Stock (48) (14) (1,857) (1,871)Dividends on Common stock($0.60 per share) (569) (569)Issuance of shares to employees 2 49 49Stock-based compensation (Note 11) 105 105Forfeiture of shares from employees — (5) (1) (6)Net income 2,133 2,133Other Comprehensive Income (120) (120)Balance at May 31, 2011 180 $ — 756 $ 3 $ 3,944 $ 95 $ 5,801 $ 9,843Stock options exercised 18 528 528Repurchase of Class B Common Stock (40) (12) (1,793) (1,805)Dividends on Common stock ($0.70 per share) (639) (639)Issuance of shares to employees 2 57 57Stock-based compensation (Note 11) 130 130Forfeiture of shares from employees — (6) (4) (10)Net income 2,223 2,223Other comprehensive income 54 54Balance at May 31, 2012 180 $ — 736 $ 3 $ 4,641 $ 149 $ 5,588 $ 10,381Stock options exercised 10 322 322Conversion to Class B Common Stock (2) 2 —Repurchase of Class B Common Stock (34) (10) (1,647) (1,657)Dividends on Common stock ($0.81 per share) (727) (727)Issuance of shares to employees 2 65 65Stock-based compensation (Note 11) 174 174Forfeiture of shares from employees — (8) (4) (12)Net income 2,485 2,485Other comprehensive income 125 125Balance at May 31, 2013 178 $ — 716 $ 3 $ 5,184 $ 274 $ 5,695 $ 11,156
The accompanying notes to consolidated financial statements are an integral part of this statement.
NIKE, INC. 2013 Annual Report and Notice of Annual Meeting 93
FOR
M10
-K

PART II
Notes to Consolidated Financial Statements
Note 1 Summary of Significant Accounting Policies . . . . . . . . . . . . . . . . . . . . . . . . . . . . . . . . . . . . . . . . . . . . . . . . . . . . . . . . . . . . . . . . . . . . . . . . . . . . . . 95
Note 2 Inventories . . . . . . . . . . . . . . . . . . . . . . . . . . . . . . . . . . . . . . . . . . . . . . . . . . . . . . . . . . . . . . . . . . . . . . . . . . . . . . . . . . . . . . . . . . . . . . . . . . . . . . . . . . . . . . . . . . . . . . . . . . . . 98
Note 3 Property, Plant and Equipment . . . . . . . . . . . . . . . . . . . . . . . . . . . . . . . . . . . . . . . . . . . . . . . . . . . . . . . . . . . . . . . . . . . . . . . . . . . . . . . . . . . . . . . . . . . . . . . . 98
Note 4 Identifiable Intangible Assets and Goodwill . . . . . . . . . . . . . . . . . . . . . . . . . . . . . . . . . . . . . . . . . . . . . . . . . . . . . . . . . . . . . . . . . . . . . . . . . . . . . . . . 99
Note 5 Accrued Liabilities . . . . . . . . . . . . . . . . . . . . . . . . . . . . . . . . . . . . . . . . . . . . . . . . . . . . . . . . . . . . . . . . . . . . . . . . . . . . . . . . . . . . . . . . . . . . . . . . . . . . . . . . . . . . . . . . . . 99
Note 6 Fair Value Measurements . . . . . . . . . . . . . . . . . . . . . . . . . . . . . . . . . . . . . . . . . . . . . . . . . . . . . . . . . . . . . . . . . . . . . . . . . . . . . . . . . . . . . . . . . . . . . . . . . . . . . . . .100
Note 7 Short-Term Borrowings and Credit Lines . . . . . . . . . . . . . . . . . . . . . . . . . . . . . . . . . . . . . . . . . . . . . . . . . . . . . . . . . . . . . . . . . . . . . . . . . . . . . . . . . . .101
Note 8 Long-Term Debt . . . . . . . . . . . . . . . . . . . . . . . . . . . . . . . . . . . . . . . . . . . . . . . . . . . . . . . . . . . . . . . . . . . . . . . . . . . . . . . . . . . . . . . . . . . . . . . . . . . . . . . . . . . . . . . . . . . .102
Note 9 Income Taxes . . . . . . . . . . . . . . . . . . . . . . . . . . . . . . . . . . . . . . . . . . . . . . . . . . . . . . . . . . . . . . . . . . . . . . . . . . . . . . . . . . . . . . . . . . . . . . . . . . . . . . . . . . . . . . . . . . . . . . . .102
Note 10 Redeemable Preferred Stock . . . . . . . . . . . . . . . . . . . . . . . . . . . . . . . . . . . . . . . . . . . . . . . . . . . . . . . . . . . . . . . . . . . . . . . . . . . . . . . . . . . . . . . . . . . . . . . . . . .104
Note 11 Common Stock and Stock-Based Compensation . . . . . . . . . . . . . . . . . . . . . . . . . . . . . . . . . . . . . . . . . . . . . . . . . . . . . . . . . . . . . . . . . . . . . . .105
Note 12 Earnings Per Share . . . . . . . . . . . . . . . . . . . . . . . . . . . . . . . . . . . . . . . . . . . . . . . . . . . . . . . . . . . . . . . . . . . . . . . . . . . . . . . . . . . . . . . . . . . . . . . . . . . . . . . . . . . . . . . .106
Note 13 Benefit Plans . . . . . . . . . . . . . . . . . . . . . . . . . . . . . . . . . . . . . . . . . . . . . . . . . . . . . . . . . . . . . . . . . . . . . . . . . . . . . . . . . . . . . . . . . . . . . . . . . . . . . . . . . . . . . . . . . . . . . . . . .106
Note 14 Accumulated Other Comprehensive Income . . . . . . . . . . . . . . . . . . . . . . . . . . . . . . . . . . . . . . . . . . . . . . . . . . . . . . . . . . . . . . . . . . . . . . . . . . . . . .107
Note 15 Discontinued Operations . . . . . . . . . . . . . . . . . . . . . . . . . . . . . . . . . . . . . . . . . . . . . . . . . . . . . . . . . . . . . . . . . . . . . . . . . . . . . . . . . . . . . . . . . . . . . . . . . . . . . . . . .107
Note 16 Commitments and Contingencies . . . . . . . . . . . . . . . . . . . . . . . . . . . . . . . . . . . . . . . . . . . . . . . . . . . . . . . . . . . . . . . . . . . . . . . . . . . . . . . . . . . . . . . . . . . . .108
Note 17 Risk Management and Derivatives . . . . . . . . . . . . . . . . . . . . . . . . . . . . . . . . . . . . . . . . . . . . . . . . . . . . . . . . . . . . . . . . . . . . . . . . . . . . . . . . . . . . . . . . . . . .108
Note 18 Operating Segments and Related Information . . . . . . . . . . . . . . . . . . . . . . . . . . . . . . . . . . . . . . . . . . . . . . . . . . . . . . . . . . . . . . . . . . . . . . . . . . . .111
94

PART II
NOTE 1 — Summary of Significant Accounting Policies
Description of BusinessNIKE, Inc. is a worldwide leader in the design, development and worldwidemarketing and selling of athletic footwear, apparel, equipment, accessoriesand services. Wholly-owned NIKE, Inc. subsidiaries include Converse Inc.,which designs, markets and distributes casual footwear, apparel andaccessories and Hurley International LLC, which designs, markets anddistributes action sports and youth lifestyle footwear, apparel andaccessories.
Basis of ConsolidationThe consolidated financial statements include the accounts of NIKE, Inc. andits subsidiaries (the “Company”). All significant intercompany transactions andbalances have been eliminated.
The Company completed the sale of Cole Haan during the third quarterended February 28, 2013 and completed the sale of Umbro during thesecond quarter ended November 30, 2012. As a result, the Company reportsthe operating results of Cole Haan and Umbro in the net income (loss) fromdiscontinued operations line in the consolidated statements of income for allperiods presented. In addition, the assets and liabilities associated with thesebusinesses are reported as assets of discontinued operations and liabilitiesof discontinued operations, as appropriate, in the consolidated balancesheets (refer to Note 15 — Discontinued Operations). Unless otherwiseindicated, the disclosures accompanying the consolidated financialstatements reflect the Company’s continuing operations.
On November 15, 2012, the Company announced a two-for-one split of bothNIKE Class A and Class B Common shares. The stock split was a 100percent stock dividend payable on December 24, 2012 to shareholders ofrecord at the close of business December 10, 2012. Common stock begantrading at the split-adjusted price on December 26, 2012. All share numbersand per share amounts presented reflect the stock split.
Recognition of RevenuesWholesale revenues are recognized when title and the risks and rewards ofownership have passed to the customer, based on the terms of sale. Thisoccurs upon shipment or upon receipt by the customer depending on thecountry of the sale and the agreement with the customer. Retail storerevenues are recorded at the time of sale. Provisions for post-invoice salesdiscounts, returns and miscellaneous claims from customers are estimatedand recorded as a reduction to revenue at the time of sale. Post-invoice salesdiscounts consist of contractual programs with certain customers ordiscretionary discounts that are expected to be granted to certain customersat a later date. Estimates of discretionary discounts, returns and claims arebased on historical rates, specific identification of outstanding claims andoutstanding returns not yet received from customers, and estimateddiscounts, returns and claims expected but not yet finalized withcustomers. As of May 31, 2013 and 2012, the Company’s reserve balancesfor post-invoice sales discounts, returns and miscellaneous claims were $531million and $455 million, respectively.
Cost of SalesCost of sales consists primarily of inventory costs, as well as warehousingcosts (including the cost of warehouse labor), third party royalties, certainforeign currency hedge gains and losses, and research, design anddevelopment costs.
Shipping and Handling CostsShipping and handling costs are expensed as incurred and included in cost ofsales.
Operating Overhead ExpenseOperating overhead expense consists primarily of payroll and benefit relatedcosts, rent, depreciation and amortization, professional services, andmeetings and travel.
Demand Creation ExpenseDemand creation expense consists of advertising and promotion costs,including costs of endorsement contracts, television, digital and printadvertising, brand events, and retail brand presentation. Advertisingproduction costs are expensed the first time an advertisement is run.Advertising placement costs are expensed in the month the advertisingappears, while costs related to brand events are expensed when the eventoccurs. Costs related to retail brand presentation are expensed when thepresentation is completed and delivered.
A significant amount of the Company’s promotional expenses result frompayments under endorsement contracts. Accounting for endorsementpayments is based upon specific contract provisions. Generally,endorsement payments are expensed on a straight-line basis over the term ofthe contract after giving recognition to periodic performance complianceprovisions of the contracts. Prepayments made under contracts are includedin prepaid expenses or other assets depending on the period to which theprepayment applies.
Some of the contracts provide for contingent payments to endorsers basedupon specific achievements in their sports (e.g., winning a championship).The Company records selling and administrative expense for these amountswhen the endorser achieves the specific goal.
Some of the contracts provide for payments based upon endorsersmaintaining a level of performance in their sport over an extended period oftime (e.g., maintaining a top ranking in a sport for a year). These amounts arerecorded in selling and administrative expense when the Companydetermines that it is probable that the specified level of performance will bemaintained throughout the period. In these instances, to the extent that actualpayments to the endorser differ from our estimate due to changes in theendorser’s athletic performance, increased or decreased selling andadministrative expense may be recorded in a future period.
Some of the contracts provide for royalty payments to endorsers based upona predetermined percentage of sales of particular products. The Companyexpenses these payments in cost of sales as the related sales occur. Incertain contracts, the Company offers minimum guaranteed royaltypayments. For contractual obligations for which the Company estimates it willnot meet the minimum guaranteed amount of royalty fees through sales ofproduct, the Company records the amount of the guaranteed payment inexcess of that earned through sales of product in selling and administrativeexpense uniformly over the remaining guarantee period.
Through cooperative advertising programs, the Company reimburses retailcustomers for certain costs of advertising the Company’s products. TheCompany records these costs in selling and administrative expense at thepoint in time when it is obligated to its customers for the costs, which is whenthe related revenues are recognized. This obligation may arise prior to therelated advertisement being run.
Total advertising and promotion expenses were $2,745 million, $2,607million, and $2,344 million for the years ended May 31, 2013, 2012 and 2011,respectively. Prepaid advertising and promotion expenses recorded inprepaid expenses and other current assets totaled $386 million and $281million at May 31, 2013 and 2012, respectively.
Cash and EquivalentsCash and equivalents represent cash and short-term, highly liquid investments,including commercial paper, U.S. treasury, U.S. agency, and corporate debtsecurities with maturities of three months or less at date of purchase.
NIKE, INC. 2013 Annual Report and Notice of Annual Meeting 95
FOR
M10
-K

PART II
Short-Term InvestmentsShort-term investments consist of highly liquid investments, includingcommercial paper, U.S. treasury, U.S. agency, and corporate debt securities,with maturities over three months from the date of purchase. Debt securitiesthat the Company has the ability and positive intent to hold to maturity arecarried at amortized cost. At May 31, 2013 and 2012, the Company did nothold any short-term investments that were classified as trading or held-to-maturity.
At May 31, 2013 and 2012, short-term investments consisted of available-for-sale securities. Available-for-sale securities are recorded at fair value withunrealized gains and losses reported, net of tax, in other comprehensiveincome, unless unrealized losses are determined to be other than temporary.Realized gains and losses on the sale of securities are determined by specificidentification. The Company considers all available-for-sale securities,including those with maturity dates beyond 12 months, as available tosupport current operational liquidity needs and therefore classifies allsecurities with maturity dates beyond three months at the date of purchase ascurrent assets within short-term investments on the consolidated balancesheets.
Refer to Note 6 — Fair Value Measurements for more information on theCompany’s short-term investments.
Allowance for Uncollectible AccountsReceivableAccounts receivable consists primarily of amounts receivable fromcustomers. The Company makes ongoing estimates relating to thecollectability of its accounts receivable and maintains an allowance forestimated losses resulting from the inability of its customers to make requiredpayments. In determining the amount of the allowance, the Companyconsiders historical levels of credit losses and makes judgments about thecreditworthiness of significant customers based on ongoing creditevaluations. Accounts receivable with anticipated collection dates greaterthan 12 months from the balance sheet date and related allowances areconsidered non-current and recorded in other assets. The allowance foruncollectible accounts receivable was $104 million and $91 million at May 31,2013 and 2012, respectively, of which $54 million and $45 million,respectively, was classified as long-term and recorded in other assets.
Inventory ValuationInventories are stated at lower of cost or market and valued primarily on anaverage cost basis. Inventory costs primarily consist of product cost from oursuppliers, as well as freight, import duties, taxes, insurance and logistics andother handling fees.
Property, Plant and Equipment andDepreciationProperty, plant and equipment are recorded at cost. Depreciation for financialreporting purposes is determined on a straight-line basis for buildings andleasehold improvements over 2 to 40 years and for machinery and equipmentover 2 to 15 years.
Depreciation and amortization of assets used in manufacturing, warehousingand product distribution are recorded in cost of sales. Depreciation andamortization of other assets are recorded in selling and administrativeexpense.
Software Development CostsInternal Use Software. Expenditures for major software purchases andsoftware developed for internal use are capitalized and amortized over a 2 to10 year period on a straight-line basis. The Company’s policy provides for thecapitalization of external direct costs of materials and services associated with
developing or obtaining internal use computer software. In addition, theCompany also capitalizes certain payroll and payroll-related costs foremployees who are directly associated with internal use computer softwareprojects. The amount of capitalizable payroll costs with respect to theseemployees is limited to the time directly spent on such projects. Costsassociated with preliminary project stage activities, training, maintenance andall other post-implementation stage activities are expensed as incurred.
Computer Software to be Sold, Leased or Otherwise Marketed. Developmentcosts of computer software to be sold, leased, or otherwise marketed as anintegral part of a product are subject to capitalization beginning when aproduct’s technological feasibility has been established and ending when aproduct is available for general release to customers. In most instances, theCompany’s products are released soon after technological feasibility hasbeen established. Therefore, costs incurred subsequent to achievement oftechnological feasibility are usually not significant, and generally most softwaredevelopment costs have been expensed as incurred.
Impairment of Long-Lived AssetsThe Company reviews the carrying value of long-lived assets or asset groupsto be used in operations whenever events or changes in circumstancesindicate that the carrying amount of the assets might not be recoverable.Factors that would necessitate an impairment assessment include asignificant adverse change in the extent or manner in which an asset is used,a significant adverse change in legal factors or the business climate that couldaffect the value of the asset, or a significant decline in the observable marketvalue of an asset, among others. If such facts indicate a potential impairment,the Company would assess the recoverability of an asset group bydetermining if the carrying value of the asset group exceeds the sum of theprojected undiscounted cash flows expected to result from the use andeventual disposition of the assets over the remaining economic life of theprimary asset in the asset group. If the recoverability test indicates that thecarrying value of the asset group is not recoverable, the Company willestimate the fair value of the asset group using appropriate valuationmethodologies, which would typically include an estimate of discounted cashflows. Any impairment would be measured as the difference between theasset group’s carrying amount and its estimated fair value.
Identifiable Intangible Assets and GoodwillThe Company performs annual impairment tests on goodwill and intangibleassets with indefinite lives in the fourth quarter of each fiscal year, or whenevents occur or circumstances change that would, more likely than not,reduce the fair value of a reporting unit or an intangible asset with an indefinitelife below its carrying value. Events or changes in circumstances that maytrigger interim impairment reviews include significant changes in businessclimate, operating results, planned investments in the reporting unit, planneddivestitures or an expectation that the carrying amount may not berecoverable, among other factors. The Company may first assess qualitativefactors to determine whether it is more likely than not that the fair value of areporting unit is less than its carrying amount. If, after assessing the totality ofevents and circumstances, the Company determines that it is more likely thannot that the fair value of the reporting unit is greater than its carrying amount,the two-step impairment test is unnecessary. The two-step impairment testfirst requires the Company to estimate the fair value of its reporting units. If thecarrying value of a reporting unit exceeds its fair value, the goodwill of thatreporting unit is potentially impaired and the Company proceeds to step twoof the impairment analysis. In step two of the analysis, the Companymeasures and records an impairment loss equal to the excess of the carryingvalue of the reporting unit’s goodwill over its implied fair value, if any.
The Company generally bases its measurement of the fair value of a reportingunit on a blended analysis of the present value of future discounted cash flowsand the market valuation approach. The discounted cash flows modelindicates the fair value of the reporting unit based on the present value of thecash flows that the Company expects the reporting unit to generate in thefuture. The Company’s significant estimates in the discounted cash flowsmodel include: its weighted average cost of capital; long-term rate of growthand profitability of the reporting unit’s business; and working capital effects.
96

PART II
The market valuation approach indicates the fair value of the business basedon a comparison of the reporting unit to comparable publicly tradedcompanies in similar lines of business. Significant estimates in the marketvaluation approach model include identifying similar companies withcomparable business factors such as size, growth, profitability, risk and returnon investment, and assessing comparable revenue and operating incomemultiples in estimating the fair value of the reporting unit.
Indefinite-lived intangible assets primarily consist of acquired trade names andtrademarks. The Company may first perform a qualitative assessment todetermine whether it is more likely than not that an indefinite-lived intangibleasset is impaired. If, after assessing the totality of events and circumstances,the Company determines that it is more likely than not that the indefinite-livedintangible asset is not impaired, no quantitative fair value measurement isnecessary. If a quantitative fair value measurement calculation is required forthese intangible assets, the Company utilizes the relief-from-royalty method.This method assumes that trade names and trademarks have value to theextent that their owner is relieved of the obligation to pay royalties for thebenefits received from them. This method requires the Company to estimatethe future revenue for the related brands, the appropriate royalty rate and theweighted average cost of capital.
Operating LeasesThe Company leases retail store space, certain distribution and warehousefacilities, office space, and other non-real estate assets under operatingleases. Operating lease agreements may contain rent escalation clauses, rentholidays or certain landlord incentives, including tenant improvementallowances. Rent expense for non-cancelable operating leases withscheduled rent increases or landlord incentives are recognized on a straight-line basis over the lease term, beginning with the effective leasecommencement date, which is generally the date in which the Companytakes possession of or controls the physical use of the property. Certainleases also provide for contingent rents, which are determined as apercentage of sales in excess of specified levels. A contingent rent liability isrecognized together with the corresponding rent expense when specifiedlevels have been achieved or when the Company determines that achievingthe specified levels during the period is probable.
Fair Value MeasurementsThe Company measures certain financial assets and liabilities at fair value on arecurring basis, including derivatives and available-for-sale securities. Fairvalue is the price the Company would receive to sell an asset or pay to transfera liability in an orderly transaction with a market participant at themeasurement date. The Company uses a three-level hierarchy established bythe Financial Accounting Standards Board (“FASB”) that prioritizes fair valuemeasurements based on the types of inputs used for the various valuationtechniques (market approach, income approach, and cost approach).
The levels of hierarchy are described below:
• Level 1: Observable inputs such as quoted prices in active markets foridentical assets or liabilities.
• Level 2: Inputs other than quoted prices that are observable for the asset orliability, either directly or indirectly; these include quoted prices for similarassets or liabilities in active markets and quoted prices for identical or similarassets or liabilities in markets that are not active.
• Level 3: Unobservable inputs for which there is little or no market dataavailable, which require the reporting entity to develop its own assumptions.
The Company’s assessment of the significance of a particular input to the fairvalue measurement in its entirety requires judgment and considers factorsspecific to the asset or liability. Financial assets and liabilities are classified intheir entirety based on the most conservative level of input that is significant tothe fair value measurement.
Pricing vendors are utilized for certain Level 1 and Level 2 investments. Thesevendors either provide a quoted market price in an active market or use
observable inputs without applying significant adjustments in their pricing.Observable inputs include broker quotes, interest rates and yield curvesobservable at commonly quoted intervals, volatilities and credit risks. TheCompany’s fair value processes include controls that are designed to ensureappropriate fair values are recorded. These controls include an analysis ofperiod-over-period fluctuations and comparison to another independentpricing vendor.
Refer to Note 6 — Fair Value Measurements for additional information.
Foreign Currency Translation and ForeignCurrency TransactionsAdjustments resulting from translating foreign functional currency financialstatements into U.S. Dollars are included in the foreign currency translationadjustment, a component of accumulated other comprehensive income inshareholders’ equity.
The Company’s global subsidiaries have various assets and liabilities,primarily receivables and payables, which are denominated in currenciesother than their functional currency. These balance sheet items are subject toremeasurement, the impact of which is recorded in other (income) expense,net, within the consolidated statements of income.
Accounting for Derivatives and HedgingActivitiesThe Company uses derivative financial instruments to reduce its exposure tochanges in foreign currency exchange rates and interest rates. All derivativesare recorded at fair value on the balance sheet and changes in the fair value ofderivative financial instruments are either recognized in other comprehensiveincome (a component of shareholders’ equity), debt or net income dependingon the nature of the underlying exposure, whether the derivative is formallydesignated as a hedge, and, if designated, the extent to which the hedge iseffective. The Company classifies the cash flows at settlement fromderivatives in the same category as the cash flows from the related hedgeditems. For undesignated hedges and designated cash flow hedges, this iswithin the cash provided by operations component of the consolidatedstatements of cash flows. For designated net investment hedges, this isgenerally within the cash provided or used by investing activities componentof the cash flow statement. As our fair value hedges are receive-fixed, pay-variable interest rate swaps, the cash flows associated with these derivativeinstruments are periodic interest payments while the swaps are outstanding.These cash flows are reflected within the cash provided by operationscomponent of the cash flow statement.
Refer to Note 17 — Risk Management and Derivatives for more informationon the Company’s risk management program and derivatives.
Stock-Based CompensationThe Company estimates the fair value of options and stock appreciation rightsgranted under the NIKE, Inc. 1990 Stock Incentive Plan (the “1990 Plan”) andemployees’ purchase rights under the Employee Stock Purchase Plans(“ESPPs”) using the Black-Scholes option pricing model. The Companyrecognizes this fair value, net of estimated forfeitures, as selling andadministrative expense in the consolidated statements of income over thevesting period using the straight-line method.
Refer to Note 11 — Common Stock and Stock-Based Compensation formore information on the Company’s stock programs.
Income TaxesThe Company accounts for income taxes using the asset and liability method.This approach requires the recognition of deferred tax assets and liabilities forthe expected future tax consequences of temporary differences between thecarrying amounts and the tax basis of assets and liabilities. The Companyrecords a valuation allowance to reduce deferred tax assets to the amount
NIKE, INC. 2013 Annual Report and Notice of Annual Meeting 97
FOR
M10
-K

PART II
management believes is more likely than not to be realized. United Statesincome taxes are provided currently on financial statement earnings of non-U.S. subsidiaries that are expected to be repatriated. The Companydetermines annually the amount of undistributed non-U.S. earnings to investindefinitely in its non-U.S. operations.
The Company recognizes a tax benefit from uncertain tax positions in thefinancial statements only when it is more likely than not that the position will besustained upon examination by relevant tax authorities. The Companyrecognizes interest and penalties related to income tax matters in income taxexpense.
Refer to Note 9 — Income Taxes for further discussion.
Earnings Per ShareBasic earnings per common share is calculated by dividing net income by theweighted average number of common shares outstanding during the year.Diluted earnings per common share is calculated by adjusting weightedaverage outstanding shares, assuming conversion of all potentially dilutivestock options and awards.
Refer to Note 12 — Earnings Per Share for further discussion.
Management EstimatesThe preparation of financial statements in conformity with generally acceptedaccounting principles requires management to make estimates, includingestimates relating to assumptions that affect the reported amounts of assetsand liabilities and disclosure of contingent assets and liabilities at the date offinancial statements and the reported amounts of revenues and expensesduring the reporting period. Actual results could differ from these estimates.
Recently Adopted Accounting StandardsIn July 2012, the FASB issued an accounting standards update intended tosimplify how an entity tests indefinite-lived intangible assets other thangoodwill for impairment by providing entities with an option to perform aqualitative assessment to determine whether further impairment testing isnecessary. This accounting standard update will be effective for the Companybeginning June 1, 2013, and early adoption is permitted. The Company earlyadopted this standard and the adoption did not have a material impact on itsconsolidated financial position or results of operations.
In September 2011, the FASB issued updated guidance on the periodictesting of goodwill for impairment. This guidance will allow companies toassess qualitative factors to determine if it is more-likely-than-not that goodwillmight be impaired and whether it is necessary to perform the two-stepgoodwill impairment test required under current accounting standards. Thisnew guidance was effective for the Company beginning June 1, 2012 and theadoption did not have a material effect on its consolidated financial position orresults of operations.
In June 2011, the FASB issued guidance on the presentation ofcomprehensive income. This new guidance eliminates the current option toreport other comprehensive income and its components in the statement ofshareholders’ equity. Companies are now required to present thecomponents of net income and other comprehensive income in either onecontinuous statement, referred to as the statement of comprehensiveincome, or in two separate, but consecutive statements. This requirementwas effective for the Company beginning June 1, 2012. As this guidance onlyamended the presentation of the components of comprehensive income, theadoption did not have an impact on the Company’s consolidated financialposition or results of operations. Further, this guidance required companies topresent reclassification adjustments out of accumulated other comprehensiveincome by component in both the statement in which net income ispresented and the statement in which other comprehensive income ispresented. This requirement will be effective for the Company beginningJune 1, 2013. As this guidance only amends the presentation of thecomponents of comprehensive income, the Company does not anticipate theadoption will have an impact on the Company’s consolidated financialposition or results of operations.
Recently Issued Accounting StandardsIn December 2011, the FASB issued guidance enhancing disclosurerequirements surrounding the nature of an entity’s right to offset and relatedarrangements associated with its financial instruments and derivativeinstruments. This new guidance requires companies to disclose both grossand net information about instruments and transactions eligible for offset inthe statement of financial position and instruments and transactions subjectto master netting arrangements. This new guidance is effective for theCompany beginning June 1, 2013. As this guidance only requires expandeddisclosures, the Company does not anticipate the adoption will have animpact on its consolidated financial position or results of operations.
NOTE 2 — Inventories
Inventory balances of $3,434 million and $3,222 million at May 31, 2013 and 2012, respectively, were substantially all finished goods.
NOTE 3 — Property, Plant and Equipment
Property, plant and equipment included the following:
As of May 31,(In millions) 2013 2012Land $ 268 $ 252Buildings 1,174 1,158Machinery, equipment and internal-use software 2,985 2,654Leasehold improvements 945 883Construction in process 128 110Total property, plant and equipment, gross 5,500 5,057Less accumulated depreciation 3,048 2,848TOTAL PROPERTY, PLANT AND EQUIPMENT, NET $ 2,452 $ 2,209
98

PART II
Capitalized interest was not material for the years ended May 31, 2013, 2012, and 2011. The Company had $81 million in capital lease obligations as of May 31,2013 included in machinery, equipment, and internal-use software; there were no capital lease obligations as of May 31, 2012.
NOTE 4 — Identifiable Intangible Assets and Goodwill
The following table summarizes the Company’s identifiable intangible asset balances as of May 31, 2013 and 2012:
As of May 31, 2013 As of May 31, 2012
(In millions)Gross Carrying
AmountAccumulatedAmortization
Net CarryingAmount
Gross CarryingAmount
AccumulatedAmortization
Net CarryingAmount
Amortized intangible assets:Patents $ 119 $ (35) $ 84 $ 99 $ (29) $ 70Trademarks 43 (32) 11 40 (26) 14Other 20 (16) 4 19 (16) 3TOTAL $ 182 $ (83) $ 99 $ 158 $ (71) $ 87Unamortized intangible assets —Trademarks 283 283IDENTIFIABLE INTANGIBLEASSETS, NET $ 382 $ 370
Amortization expense, which is included in selling and administrative expense,was $14 million, $14 million, and $13 million for the years ended May 31,2013, 2012, and 2011, respectively. The estimated amortization expense forintangible assets subject to amortization for each of the years ending May 31,2014 through May 31, 2018 are as follows: 2014: $13 million; 2015: $9million; 2016: $9 million; 2017: $7 million; 2018: $6 million.
Goodwill was $131 million at May 31, 2013 and May 31, 2012, respectively,and is included in the Company’s “Other” category for segment reportingpurposes. There were no accumulated impairment balances for goodwill asof either period end.
NOTE 5 — Accrued Liabilities
Accrued liabilities included the following:
As of May 31,(In millions) 2013 2012Compensation and benefits, excluding taxes $ 713 $ 691Endorsement compensation 264 288Taxes other than income taxes 192 169Dividends payable 188 165Import and logistics costs 111 133Advertising and marketing 77 94Fair value of derivatives 34 55Other(1) 407 346TOTAL ACCRUED LIABILITIES $ 1,986 $ 1,941
(1) Other consists of various accrued expenses with no individual item accounting for more than 5% of the balance at May 31, 2013 and 2012.
NIKE, INC. 2013 Annual Report and Notice of Annual Meeting 99
FOR
M10
-K

PART II
NOTE 6 — Fair Value Measurements
The following table presents information about the Company’s financial assets and liabilities measured at fair value on a recurring basis as of May 31, 2013 and2012, and indicates the fair value hierarchy of the valuation techniques utilized by the Company to determine such fair value. Refer to Note 1 – Summary ofSignificant Accounting Policies for additional detail regarding the Company’s fair value measurement methodology.
As of May 31, 2013Fair Value
Measurements Using Assets/Liabilitiesat Fair Value(In millions) Level 1 Level 2 Level 3 Balance Sheet Classification
ASSETSDerivatives:Foreign exchange forwards and options $ — $ 278 $ — $ 278 Other current assets and other long-term assetsInterest rate swap contracts — 11 — 11 Other current assets and other long-term assets
Total derivatives — 289 — 289Available-for-sale securities:U.S. Treasury securities 425 — — 425 Cash and equivalentsU.S. Agency securities — 20 — 20 Cash and equivalentsCommercial paper and bonds — 1,035 — 1,035 Cash and equivalentsMoney market funds — 836 — 836 Cash and equivalentsU.S. Treasury securities 1,583 — — 1,583 Short-term investmentsU.S. Agency securities — 401 — 401 Short-term investmentsCommercial paper and bonds — 644 — 644 Short-term investmentsNon-marketable preferred stock — — 5 5 Other long-term assets
Total available-for-sale securities 2,008 2,936 5 4,949TOTAL ASSETS $ 2,008 $ 3,225 $ 5 $ 5,238LIABILITIESDerivatives:Foreign exchange forwards and options $ — $ 34 $ — $ 34 Accrued liabilities and other long-term liabilities
TOTAL LIABILITIES $ — $ 34 $ — $ 34
As of May 31, 2012Fair Value
Measurements Using Assets / Liabilitiesat Fair Value(In millions) Level 1 Level 2 Level 3 Balance Sheet Classification
ASSETSDerivatives:Foreign exchange forwards and options $ — $ 265 $ — $ 265 Other current assets and other long-term assetsEmbedded derivatives — 1 — 1 Other current assetsInterest rate swap contracts — 15 — 15 Other current assets and other long-term assets
Total derivatives — 281 — 281Available-for-sale securities:U.S. Treasury securities 226 — — 226 Cash and equivalentsU.S. Agency securities — 254 — 254 Cash and equivalentsCommercial paper and bonds — 159 — 159 Cash and equivalentsMoney market funds — 770 — 770 Cash and equivalentsU.S. Treasury securities 927 — — 927 Short-term investmentsU.S. Agency securities — 230 — 230 Short-term investmentsCommercial paper and bonds — 283 — 283 Short-term investmentsNon-marketable preferred stock — — 3 3 Other long-term assets
Total available-for-sale securities 1,153 1,696 3 2,852TOTAL ASSETS $ 1,153 $ 1,977 $ 3 $ 3,133LIABILITIESDerivatives:Foreign exchange forwards and options $ — $ 55 $ — $ 55 Accrued liabilities and other long-term liabilities
TOTAL LIABILITIES $ — $ 55 $ — $ 55
100

PART II
Derivative financial instruments include foreign exchange forwards andoptions, embedded derivatives and interest rate swap contracts. The fairvalue of derivative contracts is determined using observable market inputssuch as the daily market foreign currency rates, forward pricing curves,currency volatilities, currency correlations and interest rates, and considersnonperformance risk of the Company and that of its counterparties.Adjustments relating to these nonperformance risks were not material atMay 31, 2013 or 2012. Refer to Note 17 — Risk Management and Derivativesfor additional detail.
Available-for-sale securities comprise investments in U.S. Treasury andAgency securities, money market funds, corporate commercial paper andbonds. These securities are valued using market prices on both activemarkets (Level 1) and less active markets (Level 2). Pricing vendors are utilizedfor certain Level 1 or Level 2 investments. These vendors either provide aquoted market price in an active market or use observable inputs withoutapplying significant adjustments in their pricing. Observable inputs includebroker quotes, interest rates and yield curves observable at commonlyquoted intervals, volatilities and credit risks. The carrying amounts reflected inthe consolidated balance sheets for short-term investments and cash andequivalents approximate fair value.
The Company’s Level 3 assets comprise investments in certain non-marketable preferred stock. These investments are valued using internally
developed models with unobservable inputs. These Level 3 investments arean immaterial portion of our portfolio. Changes in Level 3 investment assetswere immaterial during the years ended May 31, 2013 and 2012.
No transfers among the levels within the fair value hierarchy occurred duringthe years ended May 31, 2013 or 2012.
As of May 31, 2013 and 2012, the Company had no assets or liabilities thatwere required to be measured at fair value on a non-recurring basis.
Short-Term InvestmentsAs of May 31, 2013 and 2012, short-term investments consisted of available-for-sale securities. As of May 31, 2013, the Company held $2,229 million ofavailable-for-sale securities with maturity dates within one year from thepurchase date and $399 million with maturity dates over one year and lessthan five years from the purchase date within short-term investments. As ofMay 31, 2012, the Company held $1,129 million of available-for-salesecurities with maturity dates within one year from purchase date and $311million with maturity dates over one year and less than five years frompurchase date within short-term investments.
Short-term investments classified as available-for-sale consist of the following at fair value:
As of May 31,(In millions) 2013 2012Available-for-sale investments:U.S. treasury and agencies $ 1,984 $ 1,157Commercial paper and bonds 644 283TOTAL AVAILABLE-FOR-SALE INVESTMENTS $ 2,628 $ 1,440
Included in interest (income) expense, net was interest income related to cashand equivalents and short-term investments of $26 million, $27 million, and$28 million for the years ended May 31, 2013, 2012, and 2011, respectively.
For fair value information regarding notes payable and long-term debt, refer toNote 7 — Short-Term Borrowings and Credit Lines and Note 8 — Long-TermDebt.
NOTE 7 — Short-Term Borrowings and Credit Lines
Notes payable and interest-bearing accounts payable to Sojitz Corporation of America (“Sojitz America”) as of May 31, 2013 and 2012, are summarized below:
As of May 31,2013 2012
(In millions) Borrowings Interest Rate Borrowings Interest RateNotes payable:U.S. operations $ 20 0.00%(1) $ 30 5.50%(1)
Non-U.S. operations 101 4.77%(1) 78 9.46%(1)
TOTAL NOTES PAYABLE $ 121 $ 108
Interest-Bearing Accounts Payable:Sojitz America $ 55 0.99% $ 75 1.10%
(1) Weighted average interest rate includes non-interest bearing overdrafts.
The carrying amounts reflected in the consolidated balance sheets for notespayable approximate fair value.
The Company purchases through Sojitz America certain athletic footwear,apparel and equipment it acquires from non-U.S. suppliers. These purchasesare for the Company’s operations outside of the United States, Europe andJapan. Accounts payable to Sojitz America are generally due up to 60 daysafter shipment of goods from the foreign port. The interest rate on suchaccounts payable is the 60-day London Interbank Offered Rate (“LIBOR”) asof the beginning of the month of the invoice date, plus 0.75%.
As of May 31, 2013 and 2012, the Company had no amounts outstandingunder its commercial paper program.
In November 2011, the Company entered into a committed credit facilityagreement with a syndicate of banks which provides for up to $1 billion of
borrowings pursuant to a revolving credit facility with the option to increaseborrowings to $1.5 billion with lender approval. The facility matures onNovember 1, 2016, with a one-year extension option prior to both the secondand third anniversary of the closing date, provided that extensions shall notextend beyond November 1, 2018. Based on the Company’s current long-term senior unsecured debt ratings of A+ and A1 from Standard and Poor’sCorporation and Moody’s Investor Services, respectively, the interest ratecharged on any outstanding borrowings would be the prevailing LIBOR plus0.56%. The facility fee is 0.065% of the total commitment. Under thiscommitted credit facility, the Company must maintain, among other things,certain minimum specified financial ratios with which the Company was incompliance at May 31, 2013. No amounts were outstanding under this facilityas of May 31, 2013 or 2012.
NIKE, INC. 2013 Annual Report and Notice of Annual Meeting 101
FOR
M10
-K

PART II
NOTE 8 — Long-Term Debt
Long-term debt, net of unamortized premiums and discounts and swap fair value adjustments, comprises the following:
Book Value OutstandingAs of May 31,
Scheduled Maturity (Dollars in millions)OriginalPrincipal
InterestRate
InterestPayments 2013 2012
Corporate Bond Payables:(4)
July 23, 2012(1) $ 25 5.66% Semi-Annually $ — $ 25August 7, 2012(1) $ 15 5.40% Semi-Annually — 15October 1, 2013 $ 50 4.70% Semi-Annually 50 50October 15, 2015(1) $ 100 5.15% Semi-Annually 111 115May 1, 2023(5) $ 500 2.25% Semi-Annually 499 —May 1, 2043(5) $ 500 3.63% Semi-Annually 499 —
Promissory Notes:(2)
April 1, 2017 $ 40 6.20% Monthly 40 —January 1, 2018 $ 19 6.79% Monthly 19 —
Japanese Yen Notes:August 20, 2001 through November 20, 2020(3) ¥ 9,000 2.60% Quarterly 34 50August 20, 2001 through November 20, 2020(3) ¥ 4,000 2.00% Quarterly 15 22Total 1,267 277Less current maturities 57 49TOTAL LONG-TERM DEBT $ 1,210 $ 228
(1) The Company has entered into interest rate swap agreements whereby the Company receives fixed interest payments at the same rate as the note and pays variable interest paymentsbased on the six-month LIBOR plus a spread. The swaps have the same notional amount and maturity date as the corresponding note. At May 31, 2013, the interest rates payable onthese swap agreements ranged from approximately 0.3% to 0.4%.
(2) The Company assumed a total of $59 million in bonds payable on May 30, 2013 as part of its agreement to purchase certain Corporate properties, which was treated as a non-cashfinancing transaction. The property serves as collateral for the debt. The purchase of these properties was accounted for as a business combination where the total consideration of $85million was allocated to the land and buildings acquired; no other tangible or intangible assets or liabilities resulted from the purchase. The bonds mature in 2017 and 2018 and theCompany does not have the ability to re-negotiate the terms of the debt agreements and would incur significant financial penalties if the notes are paid off prior to maturity.
(3) NIKE Logistics YK assumed a total of ¥13.0 billion in loans as part of its agreement to purchase a distribution center in Japan, which serves as collateral for the loans. These loans mature inequal quarterly installments during the period August 20, 2001 through November 20, 2020.
(4) Senior unsecured obligations rank equally with our other unsecured and unsubordinated indebtedness.
(5) The bonds carry a make whole call provision and are redeemable at any time prior to maturity. The bonds also feature a par call provision payable 3 months and 6 months prior to thescheduled maturity date for the bonds maturing on May 1, 2023 and May 1, 2043, respectively.
The scheduled maturity of long-term debt in each of the years ending May 31,2014 through 2018 are $57 million, $7 million, $108 million, $45 million and$25 million, respectively, at face value.
The fair value of the Company’s long-term debt, including the current portion,was approximately $1,219 million at May 31, 2013 and $283 million atMay 31, 2012. The fair value of long-term debt is estimated based uponquoted prices of similar instruments (level 2).
NOTE 9 — Income Taxes
Income before income taxes is as follows:
Year Ended May 31,(In millions) 2013 2012 2011Income before income taxes:United States $ 1,240 $ 804 $ 1,040Foreign 2,032 2,221 1,822
TOTAL INCOME BEFORE INCOME TAXES $ 3,272 $ 3,025 $ 2,862
102

PART II
The provision for income taxes is as follows:
Year Ended May 31,(In millions) 2013 2012 2011Current:United StatesFederal $ 434 $ 289 $ 298State 69 51 57
Foreign 398 488 435Total 901 828 790Deferred:United StatesFederal 1 (48) (62)State (4) 5 —
Foreign (90) (29) (38)Total (93) (72) (100)TOTAL INCOME TAX EXPENSE $ 808 $ 756 $ 690
A reconciliation from the U.S. statutory federal income tax rate to the effective income tax rate is as follows:
Year Ended May 31,2013 2012 2011
Federal income tax rate 35.0% 35.0% 35.0%State taxes, net of federal benefit 1.4% 1.3% 1.3%Foreign earnings -11.8% -11.9% -11.4%Other, net 0.1% 0.6% -0.8%EFFECTIVE INCOME TAX RATE 24.7% 25.0% 24.1%
The effective tax rate from continuing operations for the year ended May 31,2013 was 30 basis points lower than the effective tax rate from continuingoperations for the year ended May 31, 2012 primarily due to tax benefitsreceived from the intercompany sale of intellectual property rights outside ofthe U.S., the retroactive reinstatement of the research and development creditand the intra-period allocation of tax expense between continuing operations,discontinued operations, and other comprehensive income. The decrease in
the effective tax rate was partially offset by a higher effective tax rate onoperations as a result of an increase in earnings in higher tax jurisdictions. Theeffective tax rate from continuing operations for the year ended May 31, 2012was 90 basis points higher than the effective tax rate from continuingoperations for the year ended May 31, 2011 primarily due to the changes inuncertain tax positions partially offset by a reduction in the effective raterelated to a decrease in earnings in higher tax jurisdictions.
Deferred tax assets and (liabilities) comprise the following:
As of May 31,(In millions) 2013 2012Deferred tax assets:Allowance for doubtful accounts $ 20 $ 17Inventories 40 37Sales return reserves 101 84Deferred compensation 197 186Stock-based compensation 140 126Reserves and accrued liabilities 66 66Foreign loss carry-forwards 19 35Foreign tax credit carry-forwards 106 216Undistributed earnings of foreign subsidiaries 162 82Other 47 62
Total deferred tax assets 898 911Valuation allowance (5) (27)Total deferred tax assets after valuation allowance 893 884Deferred tax liabilities:Property, plant and equipment (241) (191)Intangibles (96) (98)Other (20) (22)
Total deferred tax liability (357) (311)NET DEFERRED TAX ASSET $ 536 $ 573
NIKE, INC. 2013 Annual Report and Notice of Annual Meeting 103
FOR
M10
-K
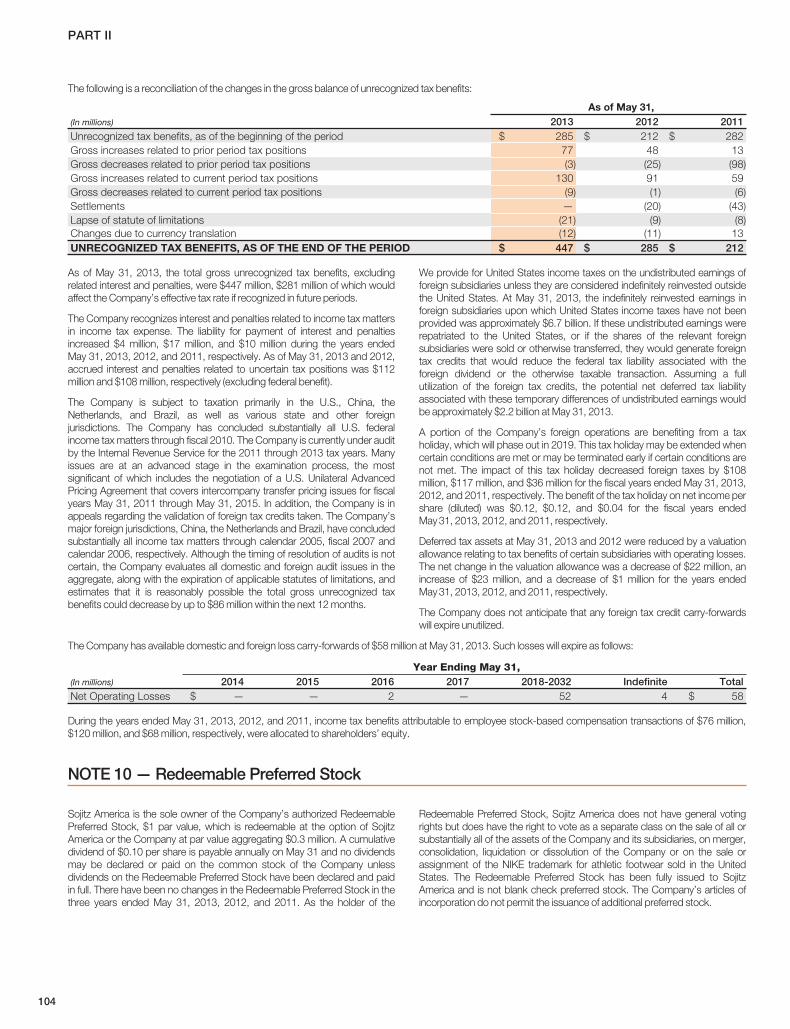
PART II
The following is a reconciliation of the changes in the gross balance of unrecognized tax benefits:
As of May 31,(In millions) 2013 2012 2011Unrecognized tax benefits, as of the beginning of the period $ 285 $ 212 $ 282Gross increases related to prior period tax positions 77 48 13Gross decreases related to prior period tax positions (3) (25) (98)Gross increases related to current period tax positions 130 91 59Gross decreases related to current period tax positions (9) (1) (6)Settlements — (20) (43)Lapse of statute of limitations (21) (9) (8)Changes due to currency translation (12) (11) 13UNRECOGNIZED TAX BENEFITS, AS OF THE END OF THE PERIOD $ 447 $ 285 $ 212
As of May 31, 2013, the total gross unrecognized tax benefits, excludingrelated interest and penalties, were $447 million, $281 million of which wouldaffect the Company’s effective tax rate if recognized in future periods.
The Company recognizes interest and penalties related to income tax mattersin income tax expense. The liability for payment of interest and penaltiesincreased $4 million, $17 million, and $10 million during the years endedMay 31, 2013, 2012, and 2011, respectively. As of May 31, 2013 and 2012,accrued interest and penalties related to uncertain tax positions was $112million and $108 million, respectively (excluding federal benefit).
The Company is subject to taxation primarily in the U.S., China, theNetherlands, and Brazil, as well as various state and other foreignjurisdictions. The Company has concluded substantially all U.S. federalincome tax matters through fiscal 2010. The Company is currently under auditby the Internal Revenue Service for the 2011 through 2013 tax years. Manyissues are at an advanced stage in the examination process, the mostsignificant of which includes the negotiation of a U.S. Unilateral AdvancedPricing Agreement that covers intercompany transfer pricing issues for fiscalyears May 31, 2011 through May 31, 2015. In addition, the Company is inappeals regarding the validation of foreign tax credits taken. The Company’smajor foreign jurisdictions, China, the Netherlands and Brazil, have concludedsubstantially all income tax matters through calendar 2005, fiscal 2007 andcalendar 2006, respectively. Although the timing of resolution of audits is notcertain, the Company evaluates all domestic and foreign audit issues in theaggregate, along with the expiration of applicable statutes of limitations, andestimates that it is reasonably possible the total gross unrecognized taxbenefits could decrease by up to $86 million within the next 12 months.
We provide for United States income taxes on the undistributed earnings offoreign subsidiaries unless they are considered indefinitely reinvested outsidethe United States. At May 31, 2013, the indefinitely reinvested earnings inforeign subsidiaries upon which United States income taxes have not beenprovided was approximately $6.7 billion. If these undistributed earnings wererepatriated to the United States, or if the shares of the relevant foreignsubsidiaries were sold or otherwise transferred, they would generate foreigntax credits that would reduce the federal tax liability associated with theforeign dividend or the otherwise taxable transaction. Assuming a fullutilization of the foreign tax credits, the potential net deferred tax liabilityassociated with these temporary differences of undistributed earnings wouldbe approximately $2.2 billion at May 31, 2013.
A portion of the Company’s foreign operations are benefiting from a taxholiday, which will phase out in 2019. This tax holiday may be extended whencertain conditions are met or may be terminated early if certain conditions arenot met. The impact of this tax holiday decreased foreign taxes by $108million, $117 million, and $36 million for the fiscal years ended May 31, 2013,2012, and 2011, respectively. The benefit of the tax holiday on net income pershare (diluted) was $0.12, $0.12, and $0.04 for the fiscal years endedMay 31, 2013, 2012, and 2011, respectively.
Deferred tax assets at May 31, 2013 and 2012 were reduced by a valuationallowance relating to tax benefits of certain subsidiaries with operating losses.The net change in the valuation allowance was a decrease of $22 million, anincrease of $23 million, and a decrease of $1 million for the years endedMay 31, 2013, 2012, and 2011, respectively.
The Company does not anticipate that any foreign tax credit carry-forwardswill expire unutilized.
The Company has available domestic and foreign loss carry-forwards of $58 million at May 31, 2013. Such losses will expire as follows:
Year Ending May 31,(In millions) 2014 2015 2016 2017 2018-2032 Indefinite TotalNet Operating Losses $ — — 2 — 52 4 $ 58
During the years ended May 31, 2013, 2012, and 2011, income tax benefits attributable to employee stock-based compensation transactions of $76 million,$120 million, and $68 million, respectively, were allocated to shareholders’ equity.
NOTE 10 — Redeemable Preferred Stock
Sojitz America is the sole owner of the Company’s authorized RedeemablePreferred Stock, $1 par value, which is redeemable at the option of SojitzAmerica or the Company at par value aggregating $0.3 million. A cumulativedividend of $0.10 per share is payable annually on May 31 and no dividendsmay be declared or paid on the common stock of the Company unlessdividends on the Redeemable Preferred Stock have been declared and paidin full. There have been no changes in the Redeemable Preferred Stock in thethree years ended May 31, 2013, 2012, and 2011. As the holder of the
Redeemable Preferred Stock, Sojitz America does not have general votingrights but does have the right to vote as a separate class on the sale of all orsubstantially all of the assets of the Company and its subsidiaries, on merger,consolidation, liquidation or dissolution of the Company or on the sale orassignment of the NIKE trademark for athletic footwear sold in the UnitedStates. The Redeemable Preferred Stock has been fully issued to SojitzAmerica and is not blank check preferred stock. The Company’s articles ofincorporation do not permit the issuance of additional preferred stock.
104

PART II
NOTE 11 — Common Stock and Stock-Based Compensation
The authorized number of shares of Class A Common Stock, no par value,and Class B Common Stock, no par value, are 200 million and 1,200 million,respectively. Each share of Class A Common Stock is convertible into oneshare of Class B Common Stock. Voting rights of Class B Common Stock arelimited in certain circumstances with respect to the election of directors. Thereare no differences in the dividend and liquidation preferences or participationrights of the Class A and Class B common shareholders.
In 1990, the Board of Directors adopted, and the shareholders approved, theNIKE, Inc. 1990 Stock Incentive Plan (the “1990 Plan”). The 1990 Planprovides for the issuance of up to 326 million previously unissued shares ofClass B Common Stock in connection with stock options and other awardsgranted under the plan. The 1990 Plan authorizes the grant of non-statutorystock options, incentive stock options, stock appreciation rights, restrictedstock, restricted stock units, and performance-based awards. The exercise
price for stock options and stock appreciation rights may not be less than thefair market value of the underlying shares on the date of grant. A committee ofthe Board of Directors administers the 1990 Plan. The committee has theauthority to determine the employees to whom awards will be made, theamount of the awards, and the other terms and conditions of the awards.Substantially all stock option grants outstanding under the 1990 Plan weregranted in the first quarter of each fiscal year, vest ratably over four years, andexpire 10 years from the date of grant.
The following table summarizes the Company’s total stock-based compensation expense recognized in selling and administrative expense:
Year Ended May 31,(In millions) 2013 2012 2011Stock options(1) $ 123 $ 96 $ 77ESPPs 19 16 14Restricted stock 32 18 14TOTAL STOCK-BASED COMPENSATION EXPENSE $ 174 $ 130 $ 105
(1) Expense for stock options includes the expense associated with stock appreciation rights. Accelerated stock option expense is recorded for employees eligible for accelerated stock optionvesting upon retirement. Accelerated stock option expense for years ended May 31, 2013, 2012, and 2011 was $22 million, $17 million, and $12 million, respectively.
As of May 31, 2013, the Company had $199 million of unrecognized compensation costs from stock options, net of estimated forfeitures, to be recognized asselling and administrative expense over a weighted average period of 2.3 years.
The weighted average fair value per share of the options granted during the years ended May 31, 2013, 2012, and 2011, as computed using the Black-Scholespricing model, was $12.71, $11.08, and $8.84, respectively. The weighted average assumptions used to estimate these fair values are as follows:
Year Ended May 31,2013 2012 2011
Dividend yield 1.5% 1.4% 1.6%Expected volatility 35.0% 29.5% 31.5%Weighted average expected life (in years) 5.3 5.0 5.0Risk-free interest rate 0.6% 1.4% 1.7%
The Company estimates the expected volatility based on the implied volatilityin market traded options on the Company’s common stock with a termgreater than one year, along with other factors. The weighted averageexpected life of options is based on an analysis of historical and expected
future exercise patterns. The interest rate is based on the U.S. Treasury(constant maturity) risk-free rate in effect at the date of grant for periodscorresponding with the expected term of the options.
The following summarizes the stock option transactions under the plan discussed above:
Shares(1)Weighted Average
Option Price(In millions)
Options outstanding May 31, 2010 72.2 $ 23.30Exercised (14.0) 21.35Forfeited (1.3) 29.03Granted 12.7 34.60
Options outstanding May 31, 2011 69.6 $ 25.65Exercised (18.0) 22.81Forfeited (1.0) 35.61Granted 13.7 45.87
Options outstanding May 31, 2012 64.3 $ 30.59Exercised (9.9) 24.70Forfeited (1.3) 40.14Granted 14.6 46.55
Options outstanding May 31, 2013 67.7 $ 34.72
Options exercisable at May 31,2011 40.1 $ 22.032012 33.9 24.382013 35.9 27.70
(1) Includes stock appreciation rights transactions.
NIKE, INC. 2013 Annual Report and Notice of Annual Meeting 105
FOR
M10
-K

PART II
The weighted average contractual life remaining for options outstanding andoptions exercisable at May 31, 2013 was 6.3 years and 4.7 years,respectively. The aggregate intrinsic value for options outstanding andexercisable at May 31, 2013 was $1,823 million and $1,218 million,respectively. The aggregate intrinsic value was the amount by which themarket value of the underlying stock exceeded the exercise price of theoptions. The total intrinsic value of the options exercised during the yearsended May 31, 2013, 2012, and 2011 was $293 million, $453 million, and$267 million, respectively.
In addition to the 1990 Plan, the Company gives employees the right topurchase shares at a discount to the market price under employee stockpurchase plans (“ESPPs”). Employees are eligible to participate throughpayroll deductions of up to 10% of their compensation. At the end of each six-month offering period, shares are purchased by the participants at 85% of thelower of the fair market value at the beginning or the end of the offering period.
Employees purchased 1.6 million, 1.7 million, and 1.6 million shares duringeach of the three years ended May 31, 2013, 2012 and 2011, respectively.
From time to time, the Company grants restricted stock units and restrictedstock to key employees under the 1990 Plan. The number of sharesunderlying such awards granted to employees during the years endedMay 31, 2013, 2012, and 2011 were 1.6 million, 0.7 million, and 0.4 millionwith weighted average values per share of $46.86, $49.49, and $35.11,respectively. Recipients of restricted stock are entitled to cash dividends andto vote their respective shares throughout the period of restriction. Recipientsof restricted stock units are entitled to dividend equivalent cash paymentsupon vesting. The value of all grants of restricted stock and restricted stockunits was established by the market price on the date of grant. During theyears ended May 31, 2013, 2012, and 2011, the aggregate fair value ofrestricted stock and restricted stock units vested was $25 million, $22 million,and $15 million, respectively, determined as of the date of vesting.
NOTE 12 — Earnings Per Share
The following is a reconciliation from basic earnings per share to diluted earnings per share. Options to purchase an additional 0.1 million, 0.2 million, and0.3 million shares of common stock were outstanding at May 31, 2013, 2012, and 2011 respectively, but were not included in the computation of diluted earningsper share because the options were anti-dilutive.
Year Ended May 31,(In millions, except per share data) 2013 2012 2011Determination of shares:Weighted average common shares outstanding 897.3 920.0 951.1Assumed conversion of dilutive stock options and awards 19.1 19.6 20.2DILUTED WEIGHTED AVERAGE COMMON SHARES OUTSTANDING 916.4 939.6 971.3
Earnings per share from continuing operations:Basic earnings per common share $ 2.75 $ 2.47 $ 2.28Diluted earnings per common share $ 2.69 $ 2.42 $ 2.24
Earnings per share from discontinued operations:Basic earnings per common share $ 0.02 $ (0.05) $ (0.04)Diluted earnings per common share $ 0.02 $ (0.05) $ (0.04)
Basic earnings per common share for NIKE, Inc. $ 2.77 $ 2.42 $ 2.24Diluted earnings per common share for NIKE, Inc. $ 2.71 $ 2.37 $ 2.20
NOTE 13 — Benefit Plans
The Company has a profit sharing plan available to most U.S.-basedemployees. The terms of the plan call for annual contributions by theCompany as determined by the Board of Directors. A subsidiary of theCompany also had a profit sharing plan available to its U.S.-based employeesprior to fiscal 2012. The terms of the plan called for annual contributions asdetermined by the subsidiary’s executive management. Contributions of $47million, $40 million, and $39 million were made to the plans and are includedin selling and administrative expense for the years ended May 31, 2013,2012, and 2011, respectively. The Company has various 401(k) employeesavings plans available to U.S.-based employees. The Company matches aportion of employee contributions. Company contributions to the savingsplans were $46 million, $42 million, and $38 million for the years endedMay 31, 2013, 2012, and 2011, respectively, and are included in selling andadministrative expense.
The Company also has a Long-Term Incentive Plan (“LTIP”) that was adoptedby the Board of Directors and approved by shareholders in September 1997and later amended in fiscal 2007. The Company recognized $50 million, $51million, and $31 million of selling and administrative expense related to cashawards under the LTIP during the years ended May 31, 2013, 2012, and2011, respectively.
The Company has pension plans in various countries worldwide. The pensionplans are only available to local employees and are generally governmentmandated. The liability related to the unfunded pension liabilities of the planswas $104 million and $113 million at May 31, 2013 and May 31, 2012,respectively, which was primarily classified as long-term in other liabilities.
106

PART II
NOTE 14 — Accumulated Other Comprehensive IncomeThe components of accumulated other comprehensive income, net of tax, are as follows:
May 31(In millions) 2013 2012Cumulative translation adjustment and other $ (14) $ (127)Net deferred gain on cash flow hedge derivatives 193 181Net deferred gain on net investment hedge derivatives 95 95ACCUMULATED OTHER COMPREHENSIVE INCOME $ 274 $ 149
Refer to Note 17 — Risk Management and Derivatives for more information on the Company’s risk management program and derivatives.
NOTE 15 — Discontinued OperationsThe Company continually evaluates its existing portfolio of businesses toensure resources are invested in those businesses that are accretive to theNIKE Brand and represent the largest growth potential and highest returns.During the year, the Company divested of Umbro and Cole Haan, allowing itto focus its resources on driving growth in the NIKE, Jordan, Converse andHurley brands.
On February 1, 2013, the Company completed the sale of Cole Haan to ApaxPartners for an agreed upon purchase price of $570 million and received atclosing $561 million, net of $9 million of purchase price adjustments. Thetransaction resulted in a gain on sale of $231 million, net of $137 million in taxexpense; this gain is included in the net income (loss) from discontinuedoperations line item on the consolidated statements of income. There were noadjustments to these recorded amounts as of May 31, 2013. BeginningNovember 30, 2012, the Company classified the Cole Haan disposal groupas held-for-sale and presented the results of Cole Haan’s operations in thenet income (loss) from discontinued operations line item on the consolidatedstatements of income. From this date until the sale, the assets and liabilities ofCole Haan were recorded in the assets of discontinued operations andliabilities of discontinued operations line items on the consolidated balancesheets, respectively. Previously, these amounts were reported in theCompany’s segment presentation as “Other Businesses.”
Under the sale agreement, the Company agreed to provide certain transitionservices to Cole Haan for an expected period of 3 to 9 months from the dateof sale. The Company will also license NIKE proprietary Air and Lunartechnologies to Cole Haan for a transition period. The continuing cash flowsrelated to these items are not expected to be significant to Cole Haan and theCompany will have no significant continuing involvement with Cole Haanbeyond the transition services. Additionally, preexisting guarantees of certain
Cole Haan lease payments remain in place after the sale; the maximumexposure under the guarantees is $44 million at May 31, 2013. The fair valueof the guarantees is not material.
On November 30, 2012, the Company completed the sale of certain assets ofUmbro to Iconix Brand Group (“Iconix”) for $225 million. The Umbro disposalgroup was classified as held-for-sale as of November 30, 2012 and theresults of Umbro’s operations are presented in the net income (loss) fromdiscontinued operations line item on the consolidated statements of income.The remaining liabilities of Umbro are recorded in the liabilities of discontinuedoperations line items on the consolidated balance sheets. Previously, theseamounts were reported in the Company’s segment presentation as “OtherBusinesses.” Upon meeting the held-for-sale criteria, the Company recordeda loss of $107 million, net of tax, on the sale of Umbro and the loss is includedin the net income (loss) from discontinued operations line item on theconsolidated statements of income. The loss on sale was calculated as thenet sales price less Umbro assets of $248 million, including intangibles,goodwill, and fixed assets, other miscellaneous charges of $22 million, andthe release of the associated cumulative translation adjustment of $129million. The tax benefit on the loss was $67 million. There were noadjustments to these recorded amounts as of May 31, 2013.
Under the sale agreement, the Company provided transition services to Iconixwhile certain markets were transitioned to Iconix-designated licensees. Thesetransition services are complete and the Company has wound down theremaining operations of Umbro.
For the year ended May 31, 2013, net income (loss) from discontinuedoperations included, for both businesses, the net gain or loss on sale, netoperating losses, tax expenses, and approximately $20 million in wind downcosts.
Summarized results of the Company’s discontinued operations are as follows:
Year Ended May 31,(In millions) 2013 2012 2011Revenues $ 523 $ 796 $ 746Income (loss) before income taxes 108 (43) (18)Income tax expense (benefit) 87 3 21Net income (loss) from discontinued operations $ 21 $ (46) $ (39)
As of May 31, 2013 and 2012, the aggregate components of assets and liabilities classified as discontinued operations and included in current assets and currentliabilities consisted of the following:
As of May 31,(In millions) 2013 2012Accounts Receivable, net $ — $ 148Inventories — 128Deferred income taxes and other assets — 35Property, plant and equipment, net — 70Identifiable intangible assets, net — 234TOTAL ASSETS $ — $ 615Accounts payable $ 1 $ 42Accrued liabilities 17 112Deferred income taxes and other liabilities — 16TOTAL LIABILITIES $ 18 $ 170
NIKE, INC. 2013 Annual Report and Notice of Annual Meeting 107
FOR
M10
-K

PART II
NOTE 16 — Commitments and Contingencies
The Company leases space for certain of its offices, warehouses and retailstores under leases expiring from 1 to 21 years after May 31, 2013. Rentexpense was $482 million, $431 million, and $386 million for the years endedMay 31, 2013, 2012 and 2011, respectively. Amounts of minimum futureannual rental commitments under non-cancelable operating leases in each ofthe five years ending May 31, 2014 through 2018 are $403 million, $340million, $304 million, $272 million, $225 million, respectively, and $816 millionin later years. Amounts of minimum future annual commitments under non-cancelable capital leases in each of the four years ending May 31, 2014through 2017 are $23 million, $28 million, $21 million, and $9 million,respectively; the Company has no capital lease obligations beyond the yearending May 31, 2017.
As of May 31, 2013 and 2012, the Company had letters of credit outstandingtotaling $149 million and $137 million, respectively. These letters of creditwere generally issued for the purchase of inventory and guarantees of theCompany’s performance under certain self-insurance and other programs.
In connection with various contracts and agreements, the Company providesroutine indemnifications relating to the enforceability of intellectual propertyrights, coverage for legal issues that arise and other items where theCompany is acting as the guarantor. Currently, the Company has severalsuch agreements in place. However, based on the Company’s historicalexperience and the estimated probability of future loss, the Company hasdetermined that the fair value of such indemnifications is not material to theCompany’s financial position or results of operations.
In the ordinary course of its business, the Company is involved in various legalproceedings involving contractual and employment relationships, productliability claims, trademark rights, and a variety of other matters. While theCompany cannot predict the outcome of its pending legal matters withcertainty, the Company does not believe any currently identified claim,proceeding or litigation, either individually or in aggregate, will have a materialimpact on the Company’s results of operations, financial position or cashflows.
NOTE 17 — Risk Management and Derivatives
The Company is exposed to global market risks, including the effect ofchanges in foreign currency exchange rates and interest rates, and usesderivatives to manage financial exposures that occur in the normal course ofbusiness. The Company does not hold or issue derivatives for trading orspeculative purposes.
The Company may elect to designate certain derivatives as hedginginstruments under the accounting standards for derivatives and hedging. TheCompany formally documents all relationships between designated hedginginstruments and hedged items as well as its risk management objective andstrategy for undertaking hedge transactions. This process includes linking all
derivatives designated as hedges to either recognized assets or liabilities orforecasted transactions.
The majority of derivatives outstanding as of May 31, 2013 are designated ascash flow or fair value hedges. All derivatives are recognized on the balancesheet at fair value and classified based on the instrument’s maturity date. Thetotal notional amount of outstanding derivatives as of May 31, 2013 wasapproximately $9 billion, which primarily comprises cash flow hedges forEuro/U.S. Dollar, British Pound/Euro, and Japanese Yen/U.S. Dollar currencypairs. As of May 31, 2013, there were outstanding currency forward contractswith maturities up to 24 months.
The following table presents the fair values of derivative instruments included within the consolidated balance sheets as of May 31, 2013 and 2012:
Asset Derivatives Liability Derivatives
(In millions)Balance Sheet
Location 2013 2012 Balance Sheet Location 2013 2012Derivatives formally designated ashedging instruments:Foreign exchange forwards andoptions
Prepaid expensesand other
current assets $ 141 $ 203 Accrued liabilities $ 12 $ 35Foreign exchange forwards andoptions
Deferred incometaxes and other
long-term assets 79 7
Deferred incometaxes and other
long-term liabilities — —Interest rate swap contracts Deferred income
taxes and otherlong-term assets 11 15
Deferred incometaxes and other
long-term liabilities — —Total derivatives formally designated ashedging instruments $ 231 $ 225 $ 12 $ 35Derivatives not designated as hedginginstruments:Foreign exchange forwards andoptions
Prepaid expensesand other
current assets $ 58 $ 55 Accrued liabilities $ 22 $ 20Embedded derivatives Prepaid expenses
and othercurrent assets — 1 Accrued liabilities — —
Total derivatives not designated ashedging instruments 58 56 22 20TOTAL DERIVATIVES $ 289 $ 281 $ 34 $ 55
108

PART II
The following tables present the amounts affecting the consolidated statements of income for years ended May 31, 2013, 2012 and 2011:
(In millions)
Amount of Gain (Loss)Recognized in Other
Comprehensive Incomeon Derivatives(1)
Amount of Gain (Loss)Reclassified From Accumulated
Other Comprehensive Income into Income(1)
Year Ended May 31, Location of Gain (Loss)Reclassified From Accumulated
Other Comprehensive IncomeInto Income(1)
Year Ended May 31,
2013 2012 2011 2013 2012 2011Derivatives designated as cash flow hedges:Foreign exchange forwards and options $ 42 $ (29) $ (87) Revenue $ (19) $ 5 $ (30)Foreign exchange forwards and options 67 253 (152) Cost of sales 113 (57) 103Foreign exchange forwards and options (3) 3 (4) Selling and administrative expense 2 (2) 1Foreign exchange forwards and options 33 36 (65) Other (income) expense, net 9 (9) 34
Total designated cash flow hedges $ 139 $ 263 $ (308) $ 105 $ (63) $ 108Derivatives designated as net investment hedges:Foreign exchange forwards and options $ — $ 45 $ (85) Other (income) expense, net $ — $ — $ —
(1) For the years ended May 31, 2013, 2012, and 2011, the amounts recorded in other (income) expense, net as a result of hedge ineffectiveness and the discontinuance of cash flow hedgesbecause the forecasted transactions were no longer probable of occurring were immaterial.
Amount of Gain (Loss) Recognized inIncome on Derivatives
Location of Gain (Loss) Recognizedin Income on Derivatives
Year Ended May 31,(In millions) 2013 2012 2011Derivatives designated as fair value hedges:Interest rate swaps(1) $ 5 $ 6 $ 6 Interest (income) expense, netDerivatives not designated as hedging instruments:Foreign exchange forwards and options 51 64 (30) Other (income) expense, netEmbedded derivatives $ (4) $ 1 $ — Other (income) expense, net
(1) All interest rate swap agreements meet the shortcut method requirements under the accounting standards for derivatives and hedging. Accordingly, changes in the fair values of theinterest rate swap agreements are considered to exactly offset changes in the fair value of the underlying long-term debt. Refer to “Fair Value Hedges” in this note for additional detail.
Refer to Note 5 — Accrued Liabilities for derivative instruments recorded inaccrued liabilities, Note 6 — Fair Value Measurements for a description of howthe above financial instruments are valued, Note 14 — Accumulated OtherComprehensive Income and the consolidated statements of shareholders’equity for additional information on changes in other comprehensive incomefor the years ended May 31, 2013, 2012 and 2011.
Cash Flow HedgesThe purpose of the Company’s foreign currency hedging activities is toprotect the Company from the risk that the eventual cash flows resulting fromtransactions in foreign currencies will be adversely affected by changes inexchange rates. Foreign currency exposures that the Company may elect tohedge in this manner include product cost exposures, non-functionalcurrency denominated external and intercompany revenues, selling andadministrative expenses, investments in U.S. Dollar-denominated available-for-sale debt securities and certain other intercompany transactions.
Product cost exposures are primarily generated through non-functionalcurrency denominated product purchases and the foreign currencyadjustment program described below. NIKE entities primarily purchaseproducts in two ways: (1) Certain NIKE entities purchase product from theNIKE Trading Company (“NTC”), a wholly-owned sourcing hub that buysNIKE branded products from third party factories, predominantly in U.S.Dollars. The NTC, whose functional currency is the U.S. Dollar, then sells theproducts to NIKE entities in their respective functional currencies. When theNTC sells to a NIKE entity with a different functional currency, the result is aforeign currency exposure for the NTC; (2) Other NIKE entities purchaseproduct directly from third party factories in U.S. Dollars. These purchasesgenerate a foreign currency exposure for those NIKE entities with a functionalcurrency other than the U.S. Dollar.
In January 2012, the Company implemented a foreign currency adjustmentprogram with certain factories. The program is designed to more effectivelymanage foreign currency risk by assuming certain of the factories’ foreigncurrency exposures, some of which are natural offsets to our existing foreign
currency exposures. Under this program, the Company’s payments to thesefactories are adjusted for rate fluctuations in the basket of currencies (“factorycurrency exposure index”) in which the labor, materials and overhead costsincurred by the factories in the production of NIKE branded products (“factoryinput costs”) are denominated. For the portion of the indices denominated inthe local or functional currency of the factory, the Company may elect to placeformally designated cash flow hedges. For all currencies within the indices,excluding the U.S. Dollar and the local or functional currency of the factory, anembedded derivative contract is created upon the factory’s acceptance ofNIKE’s purchase order. Embedded derivative contracts are separated fromthe related purchase order and their accounting treatment is described furtherbelow.
The Company’s policy permits the utilization of derivatives to reduce itsforeign currency exposures where internal netting or other strategies cannotbe effectively employed. Hedged transactions are denominated primarily inEuros, British Pounds and Japanese Yen. The Company may enter intohedge contracts typically starting up to 12 to 18 months in advance of theforecasted transaction and may place incremental hedges for up to 100% ofthe exposure by the time the forecasted transaction occurs.
All changes in fair value of derivatives designated as cash flow hedges,excluding any ineffective portion, are recorded in other comprehensiveincome until net income is affected by the variability of cash flows of thehedged transaction. In most cases, amounts recorded in othercomprehensive income will be released to net income some time after thematurity of the related derivative. Effective hedge results are classified withinthe consolidated statements of income in the same manner as the underlyingexposure, with the results of hedges of non-functional currency denominatedrevenues and product cost exposures, excluding embedded derivatives asdescribed below, recorded in revenues or cost of sales, when the underlyinghedged transaction affects consolidated net income. Results of hedges ofselling and administrative expense are recorded together with those costswhen the related expense is recorded. Results of hedges of anticipatedpurchases and sales of U.S. Dollar-denominated available-for-sale securitiesare recorded in other (income) expense, net when the securities are sold.
NIKE, INC. 2013 Annual Report and Notice of Annual Meeting 109
FOR
M10
-K

PART II
Results of hedges of certain anticipated intercompany transactions arerecorded in other (income) expense, net when the transaction occurs. TheCompany classifies the cash flows at settlement from these designated cashflow hedge derivatives in the same category as the cash flows from the relatedhedged items, generally within the cash provided by operations componentof the cash flow statement.
Premiums paid on options are initially recorded as deferred charges. TheCompany assesses the effectiveness of options based on the total cash flowsmethod and records total changes in the options’ fair value to othercomprehensive income to the degree they are effective.
The Company formally assesses, both at a hedge’s inception and on anongoing basis, whether the derivatives that are used in the hedgingtransaction have been highly effective in offsetting changes in the cash flowsof hedged items and whether those derivatives may be expected to remainhighly effective in future periods. Effectiveness for cash flow hedges isassessed based on forward rates. Ineffectiveness was not material for theyears ended May 31, 2013, 2012 and 2011.
The Company discontinues hedge accounting prospectively when (1) itdetermines that the derivative is no longer highly effective in offsettingchanges in the cash flows of a hedged item (including hedged items such asfirm commitments or forecasted transactions); (2) the derivative expires or issold, terminated, or exercised; (3) it is no longer probable that the forecastedtransaction will occur; or (4) management determines that designating thederivative as a hedging instrument is no longer appropriate.
When the Company discontinues hedge accounting because it is no longerprobable that the forecasted transaction will occur in the originally expectedperiod, but is expected to occur within an additional two-month period of timethereafter, the gain or loss on the derivative remains in accumulated othercomprehensive income and is reclassified to net income when the forecastedtransaction affects consolidated net income. However, if it is probable that aforecasted transaction will not occur by the end of the originally specified timeperiod or within an additional two-month period of time thereafter, the gainsand losses that were accumulated in other comprehensive income will berecognized immediately in other (income) expense, net. In all situations inwhich hedge accounting is discontinued and the derivative remainsoutstanding, the Company will carry the derivative at its fair value on thebalance sheet, recognizing future changes in the fair value in other (income)expense, net. For the years ended May 31, 2013, 2012 and 2011, theamounts recorded in other (income) expense, net as a result of thediscontinuance of cash flow hedging because the forecasted transaction wasno longer probable of occurring were immaterial.
As of May 31, 2013, $132 million of deferred net gains (net of tax) on bothoutstanding and matured derivatives accumulated in other comprehensiveincome are expected to be reclassified to net income during the next 12months concurrent with the underlying hedged transactions also beingrecorded in net income. Actual amounts ultimately reclassified to net incomeare dependent on the exchange rates in effect when derivative contracts thatare currently outstanding mature. As of May 31, 2013, the maximum termover which the Company is hedging exposures to the variability of cash flowsfor its forecasted transactions is 24 months.
Fair Value HedgesThe Company is also exposed to the risk of changes in the fair value of certainfixed-rate debt attributable to changes in interest rates. Derivatives currentlyused by the Company to hedge this risk are receive-fixed, pay-variableinterest rate swaps. As of May 31, 2013, all interest rate swap agreements aredesignated as fair value hedges of the related long-term debt and meet theshortcut method requirements under the accounting standards for derivativesand hedging. Accordingly, changes in the fair values of the interest rate swapagreements are considered to exactly offset changes in the fair value of theunderlying long-term debt. The cash flows associated with the Company’sfair value hedges are periodic interest payments while the swaps areoutstanding, which are reflected within the cash provided by operationscomponent of the cash flow statement. The Company recorded noineffectiveness from its interest rate swaps designated as fair value hedges forthe years ended May 31, 2013, 2012, or 2011.
Net Investment HedgesThe Company has hedged and may, in the future, hedge the risk of variability inforeign-currency-denominated net investments in wholly-owned internationaloperations. All changes in fair value of the derivatives designated as netinvestment hedges, except ineffective portions, are reported in the cumulativetranslation adjustment component of other comprehensive income along withthe foreign currency translation adjustments on those investments. TheCompany classifies the cash flows at settlement of its net investment hedgeswithin the cash provided or used by investing component of the cash flowstatement. The Company assesses hedge effectiveness based on changes inforward rates. The Company recorded no ineffectiveness from its netinvestment hedges for the years ended May 31, 2013, 2012, or 2011.
Embedded DerivativesAs part of the foreign currency adjustment program described above,currencies within the factory currency exposure indices that are neither theU.S. Dollar nor the local or functional currency of the factory, an embeddedderivative contract is created upon the factory’s acceptance of NIKE’spurchase order. Embedded derivative contracts are treated as foreigncurrency forward contracts that are bifurcated from the related purchaseorder and recorded at fair value as a derivative asset or liability on the balancesheet with their corresponding change in fair value recognized in other(income) expense, net from the date a purchase order is accepted by afactory through the date the purchase price is no longer subject to foreigncurrency fluctuations. At May 31, 2013, the notional amount of embeddedderivatives was approximately $136 million.
Undesignated Derivative InstrumentsThe Company may elect to enter into foreign exchange forwards to mitigatethe change in fair value of specific assets and liabilities on the balance sheetand/or the embedded derivative contracts explained above. These forwardsare not designated as hedging instruments under the accounting standards forderivatives and hedging. Accordingly, these undesignated instruments arerecorded at fair value as a derivative asset or liability on the balance sheet withtheir corresponding change in fair value recognized in other (income) expense,net, together with the re-measurement gain or loss from the hedged balancesheet position or embedded derivative contract. The Company classifies thecash flows at settlement from undesignated instruments in the same categoryas the cash flows from the related hedged items, generally within the cashprovided by operations component of the cash flow statement.
Credit RiskThe Company is exposed to credit-related losses in the event of non-performance by counterparties to hedging instruments. The counterparties toall derivative transactions are major financial institutions with investment gradecredit ratings. However, this does not eliminate the Company’s exposure tocredit risk with these institutions. This credit risk is limited to the unrealizedgains in such contracts should any of these counterparties fail to perform ascontracted. To manage this risk, the Company has established strictcounterparty credit guidelines that are continually monitored.
The Company’s derivative contracts contain credit risk related contingentfeatures designed to protect against significant deterioration in counterparties’creditworthiness and their ultimate ability to settle outstanding derivativecontracts in the normal course of business. The Company’s bilateral creditrelated contingent features generally require the owing entity, either theCompany or the derivative counterparty, to post collateral for the portion of thefair value in excess of $50 million should the fair value of outstanding derivativesper counterparty be greater than $50 million. Additionally, a certain level ofdecline in credit rating of either the Company or the counterparty could alsotrigger collateral requirements. As of May 31, 2013, the Company was incompliance with all credit risk related contingent features and the fair value of itsderivative instruments with credit risk related contingent features in a net liabilityposition was insignificant. Accordingly, the Company was not required to postany collateral as a result of these contingent features. Further, as of May 31,2013 those counterparties which were required to post collateral complied withsuch requirements. Given the considerations described above, the Companyconsiders the impact of the risk of counterparty default to be immaterial.
110

PART II
NOTE 18 — Operating Segments and Related Information
Operating Segments. The Company’s operating segments are evidence ofthe structure of the Company’s internal organization. The major segments aredefined by geographic regions for operations participating in NIKE Brandsales activity excluding NIKE Golf. Each NIKE Brand geographic segmentoperates predominantly in one industry: the design, development, marketingand selling of athletic footwear, apparel, and equipment. The Company’sreportable operating segments for the NIKE Brand are: North America,Western Europe, Central & Eastern Europe, Greater China, Japan, andEmerging Markets. The Company’s NIKE Brand Direct to Consumeroperations are managed within each geographic segment.
The Company’s “Other” category is broken into two components forpresentation purposes to align with the way management views theCompany. The “Global Brand Divisions” category primarily represents NIKEBrand licensing businesses that are not part of a geographic operatingsegment, demand creation and operating overhead expenses that arecentrally managed for the NIKE Brand, and costs associated with productdevelopment and supply chain operations. The “Other Businesses” categoryconsists of the activities of Converse Inc., Hurley International LLC, and NIKEGolf. Activities represented in the “Other” category are considered immaterialfor individual disclosure.
Corporate consists largely of unallocated general and administrativeexpenses, including expenses associated with centrally manageddepartments, depreciation and amortization related to the Company’sheadquarters, unallocated insurance and benefit programs, including stock-based compensation, certain foreign currency gains and losses, includingcertain hedge gains and losses, certain corporate eliminations and otheritems.
The primary financial measure used by the Company to evaluate performanceof individual operating segments is earnings before interest and taxes(commonly referred to as “EBIT”), which represents net income before interest(income) expense, net and income taxes in the consolidated statements ofincome. Reconciling items for EBIT represent corporate expense items thatare not allocated to the operating segments for management reporting.
As part of our centrally managed foreign exchange risk managementprogram, standard foreign currency rates are assigned twice per year to eachNIKE Brand entity in our geographic operating segments and certain OtherBusinesses. These rates are set approximately nine months in advance of thefuture selling season based on average market spot rates in the calendarmonth preceding the date they are established. Inventories and cost of salesfor geographic operating segments and certain Other Businesses reflect useof these standard rates to record non-functional currency product purchasesin the entity’s functional currency. Differences between assigned standardforeign currency rates and actual market rates are included in Corporate,together with foreign currency hedge gains and losses generated from ourcentrally managed foreign exchange risk management program and otherconversion gains and losses.
Accounts receivable, inventories and property, plant and equipment foroperating segments are regularly reviewed by management and are thereforeprovided below. Additions to long-lived assets as presented in the followingtable represent capital expenditures.
Certain prior year amounts have been reclassified to conform to fiscal 2013presentation.
NIKE, INC. 2013 Annual Report and Notice of Annual Meeting 111
FOR
M10
-K

PART II
Year Ended May 31,(In millions) 2013 2012 2011REVENUENorth America $ 10,387 $ 8,839 $ 7,579Western Europe 4,128 4,144 3,868Central & Eastern Europe 1,287 1,200 1,040Greater China 2,453 2,539 2,060Japan 791 835 773Emerging Markets 3,718 3,411 2,737Global Brand Divisions 117 111 96
Total NIKE Brand 22,881 21,079 18,153Other Businesses 2,500 2,298 2,041Corporate (68) (46) (77)
TOTAL NIKE CONSOLIDATED REVENUES $ 25,313 $ 23,331 $ 20,117
EARNINGS BEFORE INTEREST AND TAXESNorth America $ 2,534 $ 2,030 $ 1,736Western Europe 640 597 730Central & Eastern Europe 259 234 244Greater China 809 911 777Japan 133 136 114Emerging Markets 1,011 853 688Global Brand Divisions (1,396) (1,200) (971)
Total NIKE Brand 3,990 3,561 3,318Other Businesses 456 385 353Corporate (1,177) (917) (805)
Total NIKE Consolidated Earnings Before Interest and Taxes 3,269 3,029 2,866Interest (income) expense, net (3) 4 4
TOTAL NIKE CONSOLIDATED EARNINGS BEFORE TAXES $ 3,272 $ 3,025 $ 2,862
ADDITIONS TO LONG-LIVED ASSETSNorth America $ 201 $ 131 $ 79Western Europe 74 93 75Central & Eastern Europe 22 20 5Greater China 52 38 43Japan 6 14 9Emerging Markets 49 27 21Global Brand Divisions 216 131 44
Total NIKE Brand 620 454 276Other Businesses 29 24 27Corporate 131 109 118
TOTAL ADDITIONS TO LONG-LIVED ASSETS $ 780 $ 587 $ 421
DEPRECIATIONNorth America $ 85 $ 78 $ 70Western Europe 68 62 52Central & Eastern Europe 9 6 4Greater China 34 25 19Japan 21 23 22Emerging Markets 20 15 14Global Brand Divisions 83 53 39
Total NIKE Brand 320 262 220Other Businesses 24 25 24Corporate 74 66 71
TOTAL DEPRECIATION $ 418 $ 353 $ 315
112

PART II
As of May 31,(In millions) 2013 2012
ACCOUNTS RECEIVABLE, NETNorth America $ 1,214 $ 1,149Western Europe 356 420Central & Eastern Europe 301 261Greater China 52 221Japan 133 152Emerging Markets 546 476Global Brand Divisions 28 30
Total NIKE Brand 2,630 2,709Other Businesses 436 401Corporate 51 22
TOTAL ACCOUNTS RECEIVABLE, NET $ 3,117 $ 3,132
INVENTORIESNorth America $ 1,435 $ 1,272Western Europe 539 488Central & Eastern Europe 207 180Greater China 204 217Japan 60 83Emerging Markets 555 521Global Brand Divisions 32 35
Total NIKE Brand 3,032 2,796Other Businesses 400 384Corporate 2 42
TOTAL INVENTORIES $ 3,434 $ 3,222
PROPERTY, PLANT AND EQUIPMENT, NETNorth America $ 406 $ 378Western Europe 326 314Central & Eastern Europe 44 30Greater China 213 191Japan 269 359Emerging Markets 89 59Global Brand Divisions 353 205
Total NIKE Brand 1,700 1,536Other Businesses 77 76Corporate 675 597
TOTAL PROPERTY, PLANT AND EQUIPMENT, NET $ 2,452 $ 2,209
NIKE, INC. 2013 Annual Report and Notice of Annual Meeting 113
FOR
M10
-K

PART II
Revenues by Major Product Lines. Revenues to external customers for NIKE Brand products are attributable to sales of footwear, apparel and equipment. Otherrevenues to external customers primarily include external sales by Converse, Hurley, and NIKE Golf.
Year Ended May 31,(In millions) 2013 2012 2011Footwear $ 14,539 $ 13,428 $ 11,519Apparel 6,820 6,336 5,516Equipment 1,405 1,204 1,022Other 2,549 2,363 2,060TOTAL NIKE CONSOLIDATED REVENUES $ 25,313 $ 23,331 $ 20,117
Revenues and Long-Lived Assets byGeographic AreaGeographical area information is similar to what is reflected above underoperating segments with the exception of the Other activity, which has beenallocated to the geographical areas based on the location where the salesoriginated. Revenues derived in the United States were $11,385 million,$9,793 million, and $8,467 million for the years ended May 31, 2013, 2012,and 2011, respectively. The Company’s largest concentrations of long-livedassets primarily consist of the Company’s world headquarters anddistribution facilities in the United States and distribution facilities in Japan,Belgium and China. Long-lived assets attributable to operations in theUnited States, which are primarily composed of net property, plant &equipment, were $1,424 million, $1,204 million, and $1,056 million at May 31,
2013, 2012, and 2011, respectively. Long-lived assets attributable tooperations in Japan were $270 million, $360 million, and $361 million atMay 31, 2013, 2012, and 2011, respectively. Long-lived assets attributable tooperations in Belgium were $157 million, $164 million, and $182 million atMay 31, 2013, 2012, and 2011, respectively. Long-lived assets attributable tooperations in China were $212 million, $188 million, and $175 million atMay 31, 2013, 2012, and 2011, respectively.
Major CustomersNo customer accounted for 10% or more of the Company’s net revenuesduring the years ended May 31, 2013, 2012, and 2011.
ITEM 9. Changes In and Disagreements withAccountants on Accounting and FinancialDisclosure
There has been no change of accountants nor any disagreements with accountants on any matter of accounting principles or practices or financial statementdisclosure required to be reported under this Item.
ITEM 9A. Controls and ProceduresWe maintain disclosure controls and procedures that are designed to ensureinformation required to be disclosed in our Exchange Act reports is recorded,processed, summarized and reported within the time periods specified in theSecurities and Exchange Commission’s rules and forms and that suchinformation is accumulated and communicated to our management,including our Chief Executive Officer and Chief Financial Officer, asappropriate, to allow for timely decisions regarding required disclosure. Indesigning and evaluating the disclosure controls and procedures,management recognizes that any controls and procedures, no matter howwell designed and operated, can provide only reasonable assurance ofachieving the desired control objectives, and management is required toapply its judgment in evaluating the cost-benefit relationship of possiblecontrols and procedures.
We carry out a variety of on-going procedures, under the supervision and withthe participation of our management, including our Chief Executive Officerand Chief Financial Officer, to evaluate the effectiveness of the design andoperation of our disclosure controls and procedures. Based on the foregoing,our Chief Executive Officer and Chief Financial Officer concluded that ourdisclosure controls and procedures were effective at the reasonableassurance level as of May 31, 2013.
“Management’s Annual Report on Internal Control Over Financial Reporting”is included in Item 8 of this Report.
There has been no change in our internal control over financial reportingduring our most recent fiscal quarter that has materially affected, or isreasonable likely to materially affect, our internal control over financialreporting.
ITEM 9B. Other InformationNo disclosure is required under this Item.
114

PART III
PART III
ITEM 10. Directors, Executive Officers and CorporateGovernance
The information required by Item 401 of Regulation S-K regarding directors isincluded under “Election of Directors” in the definitive Proxy Statement for our2013 Annual Meeting of Shareholders and is incorporated herein byreference. The information required by Item 401 of Regulation S-K regardingexecutive officers is included under “Executive Officers of the Registrant” inItem 1 of this Report. The information required by Item 405 of Regulation S-Kis included under “Election of Directors — Section 16(a) Beneficial OwnershipReporting Compliance” in the definitive Proxy Statement for our 2013 AnnualMeeting of Shareholders and is incorporated herein by reference. The
information required by Item 406 of Regulation S-K is included under“Corporate Governance — Code of Business Conduct and Ethics” in thedefinitive Proxy Statement for our 2013 Annual Meeting of Shareholders andis incorporated herein by reference. The information required byItems 407(d)(4) and (d)(5) of Regulation S-K regarding the Audit Committee ofthe Board of Directors is included under “Corporate Governance — BoardCommittees” in the definitive Proxy Statement for our 2013 Annual Meeting ofShareholders and is incorporated herein by reference.
ITEM 11. Executive CompensationThe information required by Items 402, 407(e)(4) and 407(e)(5) of RegulationS-K regarding executive compensation is included under “Election ofDirectors — Director Compensation for Fiscal 2013,” “CompensationDiscussion and Analysis,” “Executive Compensation,” “Election of Directors
— Compensation Committee Interlocks and Insider Participation” and“Compensation Committee Report” in the definitive Proxy Statement for our2013 Annual Meeting of Shareholders and is incorporated herein byreference.
ITEM 12. Security Ownership of Certain BeneficialOwners and Management and RelatedStockholder Matters
The information required by Item 201(d) of Regulation S-K is included under“Executive Compensation — Equity Compensation Plans” in the definitiveProxy Statement for our 2013 Annual Meeting of Shareholders and isincorporated herein by reference. The information required by Item 403 of
Regulation S-K is included under “Election of Directors — Stock Holdings ofCertain Owners and Management” in the definitive Proxy Statement for our2013 Annual Meeting of Shareholders and is incorporated herein byreference.
ITEM 13. Certain Relationships and RelatedTransactions, and Director Independence
The information required by Items 404 and 407(a) of Regulation S-K is included under “Election of Directors — Transactions with Related Persons” and“Corporate Governance — Director Independence” in the definitive Proxy Statement for our 2013 Annual Meeting of Shareholders and is incorporated herein byreference.
ITEM 14. Principal Accountant Fees and ServicesThe information required by Item 9(e) of Schedule 14A is included under “Ratification Of Independent Registered Public Accounting Firm” in the definitive ProxyStatement for our 2013 Annual Meeting of Shareholders and is incorporated herein by reference.
NIKE, INC. 2013 Annual Report and Notice of Annual Meeting 115
FOR
M10
-K

PART IV
PART IV
ITEM 15. Exhibits and Financial Statement Schedules
(a) The following documents are filed as part of this report:
Form 10-KPage No.
1. Financial Statements:
Report of Independent Registered Public Accounting Firm 88
Consolidated Statements of Income for each of the three years ended May 31, 2013, May 31, 2012and May 31, 2011
89
Consolidated Statements of Comprehensive Income for each of the three years ended May 31,2013, May 31, 2012, and May 31, 2011.
90
Consolidated Balance Sheets at May 31, 2013 and May 31, 2012 91
Consolidated Statements of Cash Flows for each of the three years ended May 31, 2013, May 31,2012 and May 31, 2011
92
Consolidated Statements of Shareholders’ Equity for each of the three years ended May 31,2013, May 31, 2012 and May 31, 2011
93
Notes to Consolidated Financial Statements 94
2. Financial Statement Schedule:
II — Valuation and Qualifying Accounts 119
All other schedules are omitted because they are not applicable or the required information isshown in the financial statements or notes thereto.
116

PART IV
3. Exhibits:
3.1 Restated Articles of Incorporation, as amended (incorporated by reference to Exhibit 3.1 to the Company’s Quarterly Report onForm 10-Q for the fiscal quarter ended November 30, 2012).
3.2 Third Restated Bylaws, as amended (incorporated by reference to Exhibit 3.2 to the Company’s Current Report on Form 8-K filedJune 21, 2013).
4.1 Restated Articles of Incorporation, as amended (see Exhibit 3.1).4.2 Third Restated Bylaws, as amended (see Exhibit 3.2).10.1 Form of Non-Statutory Stock Option Agreement for options granted to non-employee directors prior to May 31, 2010 under the
1990 Stock Incentive Plan (incorporated by reference to Exhibit 10.3 to the Company’s Current Report on Form 8-K filed June 21,2005).*
10.2 Form of Non-Statutory Stock Option Agreement for options granted to non-employee directors after May 31, 2010 under the 1990Stock Incentive Plan (incorporated by reference to Exhibit 10.2 to the Company’s Annual Report on Form 10-K for the fiscal yearended May 31, 2010).*
10.3 Form of Non-Statutory Stock Option Agreement for options granted to executives prior to May 31, 2010 under the 1990 StockIncentive Plan (incorporated by reference to Exhibit 10.1 to the Company’s Annual Report on Form 10-K for the fiscal year endedMay 31, 2009).*
10.4 Form of Non-Statutory Stock Option Agreement for options granted to executives after May 31, 2010 under the 1990 StockIncentive Plan.*
10.5 Form of Indemnity Agreement entered into between the Company and each of its officers and directors (incorporated by referenceto Exhibit 10.2 to the Company’s Annual Report on Form 10-K for the fiscal year ended May 31, 2008).*
10.6 NIKE, Inc. 1990 Stock Incentive Plan (incorporated by reference to Exhibit 10.2 to the Company’s Current Report on Form 8-K filedon September 24, 2010).*
10.7 NIKE, Inc. Executive Performance Sharing Plan (incorporated by reference to Exhibit 10.7 to the Company’s Annual Report onForm 10-K for the fiscal year ended May 31, 2012).*
10.8 NIKE, Inc. Long-Term Incentive Plan (incorporated by reference to Exhibit 10.1 to the Company’s Current Report on Form 8-K filedon September 26, 2012).*
10.9 NIKE, Inc. Deferred Compensation Plan (Amended and Restated effective April 1, 2013).*10.10 NIKE, Inc. Deferred Compensation Plan (Amended and Restated effective June 1, 2004) (applicable to amounts deferred before
January 1, 2005) (incorporated by reference to Exhibit 10.6 to the Company’s Annual Report on Form 10-K for the fiscal year endedMay 31, 2004).*
10.11 Amendment No. 1 effective January 1, 2008 to the NIKE, Inc. Deferred Compensation Plan (June 1, 2004 Restatement)(incorporated by reference to Exhibit 10.9 to the Company’s Annual Report on Form 10-K for the fiscal year ended May 31, 2009).*
10.12 NIKE, Inc. Foreign Subsidiary Employee Stock Purchase Plan (incorporated by reference to Exhibit 10.1 to the Company’s QuarterlyReport on Form 10-Q for the fiscal quarter ended November 30, 2008).*
10.13 Amended and Restated Covenant Not To Compete and Non-Disclosure Agreement between NIKE, Inc. and Mark G. Parker datedJuly 24, 2008 (incorporated by reference to Exhibit 10.1 to the Company’s Current Report on Form 8-K filed July 24, 2008).*
10.14 Amended and Restated Covenant Not to Compete and Non-Disclosure Agreement between NIKE, Inc. and Charles D. Densondated July 24, 2008 (incorporated by reference to Exhibit 10.2 to the Company’s Current Report on Form 8-K filed July 24, 2008).*
10.15 Form of Restricted Stock Bonus Agreement under the 1990 Stock Incentive Plan for awards prior to May 31, 2010 (incorporated byreference to Exhibit 10.2 to the Company’s Current Report on Form 8-K filed June 21, 2005).*
10.16 Form of Restricted Stock Agreement under the 1990 Stock Incentive Plan for awards after May 31, 2010.*10.17 Form of Restricted Stock Unit Agreement under the 1990 Stock Incentive Plan.*10.18 Covenant Not to Compete and Non-Disclosure Agreement between NIKE, Inc. and Donald W. Blair dated November 10, 1999
(incorporated by reference to Exhibit 10.15 to the Company’s Annual Report on Form 10-K for the fiscal year ended May 31,2006).*
10.19 Covenant Not to Compete and Non-Disclosure Agreement between NIKE, Inc. and Eric D. Sprunk dated April 18, 2001(incorporated by reference to Exhibit 10.23 to the Company’s Annual Report on Form 10-K for the fiscal year ended May 31,2010).*
10.2 Covenant Not to Compete and Non-Disclosure Agreement between NIKE, Inc. and Trevor A. Edwards dated November 14, 2002(incorporated by reference to Exhibit 10.19 to the Company’s Annual Report on Form 10-K for the fiscal year ended May 31,2008).*
10.21 Policy for Recoupment of Incentive Compensation (incorporated by reference to Exhibit 10.3 to the Company’s Current Report onForm 8-K filed July 20, 2010).*
10.22 Credit Agreement dated as of November 1, 2011 among NIKE, Inc., Bank of America, N.A., individually and as Agent and the otherbanks party thereto (incorporated by reference to Exhibit 10.1 to the Company’s Current Report on Form 8-K filed November 2,2011).
12.1 Computation of Ratio of Earnings to Fixed Charges.21 Subsidiaries of the Registrant.23 Consent of PricewaterhouseCoopers LLP, Independent Registered Public Accounting Firm (included within this Annual Report on
Form 10-K).31.1 Rule 13a-14(a)/15d-14(a) Certification of Chief Executive Officer.31.2 Rule 13a-14(a)/15d-14(a) Certification of Chief Financial Officer.32 Section 1350 Certifications.
NIKE, INC. 2013 Annual Report and Notice of Annual Meeting 117
FOR
M10
-K

PART IV
101.INS XBRL Instance Document101.SCH XBRL Taxonomy Extension Schema101.CAL XBRL Taxonomy Extension Calculation Linkbase101.DEF XBRL Taxonomy Extension Definition Document101.LAB XBRL Taxonomy Extension Label Linkbase101.PRE XBRL Taxonomy Extension Presentation Linkbase
* Management contract or compensatory plan or arrangement.
The Exhibits filed herewith do not include certain instruments with respect to long-term debt of NIKE and its subsidiaries, inasmuch as the total amount of debtauthorized under any such instrument does not exceed 10 percent of the total assets of NIKE and its subsidiaries on a consolidated basis. NIKE agrees, pursuantto Item 601(b)(4)(iii) of Regulation S-K, that it will furnish a copy of any such instrument to the SEC upon request.
Upon written request to Investor Relations, NIKE, Inc., One Bowerman Drive, Beaverton, Oregon 97005-6453, NIKE will furnish shareholders with a copy of anyExhibit upon payment of $.10 per page, which represents our reasonable expenses in furnishing Exhibits.
118

PART IV
SCHEDULE II — Valuation and qualifying accounts
(In millions)Balance at
Beginning of PeriodCharged to Costs
and ExpensesCharged to
Other Accounts Write-Offs, NetBalance at End
of PeriodSales returns reserveFor the year ended May 31, 2011 $ 141 $ 354 $ 1 $ (345) $ 151For the year ended May 31, 2012 151 401 (3) (376) 173For the year ended May 31, 2013 173 538 1 (471) 241
Allowance for doubtful accounts(1)
For the year ended May 31, 2011 $ 109 $ 28 $ 14 $ (31) $ 120For the year ended May 31, 2012 120 21 (9) (41) 91For the year ended May 31, 2013 91 31 1 (19) 104
(1) Includes both current and non-current portions of the allowance for doubtful accounts. The non-current portion is classified in deferred income taxes and other assets on the consolidatedbalance sheets.
NIKE, INC. 2013 Annual Report and Notice of Annual Meeting 119
FOR
M10
-K

PART IV
Consent of Independent Registered Public Accounting Firm
We hereby consent to the incorporation by reference in the Registration Statements on Form S-3 (No. 333-188072) and Form S-8 (Nos. 033-63995, 333-63581,333-63583, 333-68864, 333-68886, 333-71660, 333-104822, 333-117059, 333-133360, 333-164248, 333-171647, and 333-173727) of NIKE, Inc. of ourreport dated July 23, 2013 relating to the financial statements, financial statement schedule and the effectiveness of internal control over financial reporting, whichappears in this Form 10-K.
/s/ PRICEWATERHOUSECOOPERS LLP
Portland, Oregon
July 23, 2013
120

PART IV
SignaturesPursuant to the requirements of Section 13 or 15(d) of the Securities Exchange Act of 1934, the registrant has duly caused this report to be signed on its behalf bythe undersigned, thereunto duly authorized.
NIKE, INC.
By: /s/ MARK G. PARKER
Mark G. ParkerChief Executive Officer and President
Date: July 23, 2013
Pursuant to the requirements of the Securities Exchange Act of 1934, as amended, this report has been signed below by the following persons on behalf of theregistrant and in the capacities and on the dates indicated.
Signature Title Date
PRINCIPAL EXECUTIVE OFFICER AND DIRECTOR:/s/ MARK G. PARKERMark G. Parker Director, Chief Executive Officer and President July 23, 2013PRINCIPAL FINANCIAL OFFICER:/s/ DONALD W. BLAIRDonald W. Blair Chief Financial Officer July 23, 2013PRINCIPAL ACCOUNTING OFFICER:/s/ BERNARD F. PLISKABernard F. Pliska Corporate Controller July 23, 2013DIRECTORS:/s/ PHILIP H. KNIGHTPhilip H. Knight Director, Chairman of the Board July 23, 2013
/s/ ELIZABETH J. COMSTOCKElizabeth J. Comstock Director July 23, 2013
/s/ JOHN G. CONNORSJohn G. Connors Director July 23, 2013
/s/ TIMOTHY D. COOKTimothy D. Cook Director July 23, 2013
/s/ ALAN B. GRAF, JR.Alan B. Graf, Jr. Director July 23, 2013
/s/ DOUGLAS G. HOUSERDouglas G. Houser Director July 23, 2013
/s/ JOHN C. LECHLEITERJohn C. Lechleiter Director July 23, 2013
/s/ JOHNATHAN A. RODGERSJohnathan A. Rodgers Director July 23, 2013
/s/ ORIN C. SMITHOrin C. Smith Director July 23, 2013
/s/ JOHN R. THOMPSON, JR.John R. Thompson, Jr. Director July 23, 2013
/s/ PHYLLIS M. WISEPhyllis M. Wise Director July 23, 2013
NIKE, INC. 2013 Annual Report and Notice of Annual Meeting 121
FOR
M10
-K

PART IV
EXHIBIT 12.1 NIKE, Inc. Computation of Ratio of Earnings to Fixed ChargesThe following disclosure reflects the company’s continuing operations:
Year Ended May 31,(in millions) 2013 2012 2011 2010 2009Net income from continuing operations 2,464 2,269 2,172 1,923 1,754Income taxes 808 756 690 614 652Income before income taxes 3,272 3,025 2,862 2,537 2,406Add fixed chargesInterest expense(1) 23 31 32 33 39Interest component of leases(2) 48 42 39 36 34TOTAL FIXED CHARGES 71 73 71 69 73Earnings before income taxes and fixed charges(3) 3,343 3,098 2,933 2,606 2,479Ratio of earnings to total fixed charges 47.1 42.4 41.3 37.8 34.0
(1) Interest expense includes interest both expensed and capitalized.
(2) Interest component of leases includes one-tenth of rental expense which approximates the interest component of operating leases.
(3) Earnings before income taxes and fixed charges are exclusive of capitalized interest.
122

PART IV
EXHIBIT 21
Entity Name Jurisdiction of FormationAir Max Limited BermudaAll Star C.V. NetherlandsAmerican NIKE S.L. SpainBRS NIKE Taiwan Inc. TaiwanConverse (Asia Pacific) Limited Hong KongConverse Canada Corp. CanadaConverse Canada Holding B.V. NetherlandsConverse Europe Limited United KingdomConverse Footwear Technical Service (Zhongshan) Co., Ltd. People’s Republic of ChinaConverse Holdings LLC DelawareConverse Hong Kong Holding Company Limited Hong KongConverse Hong Kong Limited Hong KongConverse Inc. DelawareConverse Netherlands B.V. NetherlandsConverse Sporting Goods (China) Co., Ltd. People’s Republic of ChinaConverse Trading Company B.V. NetherlandsExeter Brands Group LLC OregonFrench Football Merchandising S.A.S. FranceFutbol Club Barcelona Merchandising, S.L. SpainHurley 999, S.L.U. SpainHurley Australia Pty. Ltd. AustraliaHurley International Holdings B.V. NetherlandsHurley International LLC OregonHurley Phantom C.V. NetherlandsJuventus Merchandising S.r.l. ItalyLATAM Servicos de Licenciamento Esportivo Ltda. BrazilManchester United Merchandising Limited United KingdomNIKE 360 Holding B.V. NetherlandsNIKE Argentina S.R.L. ArgentinaNIKE Asia Holding B.V. NetherlandsNIKE Australia Holding B.V. NetherlandsNIKE Australia Pty. Ltd. AustraliaNIKE CA LLC DelawareNIKE Canada Corp. CanadaNIKE Canada Holding B.V. NetherlandsNIKE Chile B.V. NetherlandsNIKE China Holding HK Limited Hong KongNIKE Commercial (China) Co., Ltd. ChinaNIKE Cortez BermudaNIKE Costa Rica, SRL Costa RicaNIKE CR d.o.o CroatiaNIKE Czech s.r.o. Czech RepublicNIKE de Chile Ltda. ChileNIKE de Mexico S de R.L. de C.V. MexicoNIKE Denmark ApS DenmarkNIKE Deutschland GmbH GermanyNIKE do Brasil Comercio e Participacoes Ltda. BrazilNIKE Drive B.V. NetherlandsNIKE Dunk Holding B.V. NetherlandsNIKE Europe Holding B.V. NetherlandsNIKE European Operations Netherlands B.V. NetherlandsNIKE Finance Ltd. BermudaNIKE Finland OY FinlandNIKE Flight BermudaNIKE Force BermudaNIKE France S.A.S. FranceNIKE Fuel B.V. NetherlandsNIKE Galaxy Holding B.V. NetherlandsNIKE Gesellschaft m.b.H. AustriaNIKE Glide C.V. Netherlands
NIKE, INC. 2013 Annual Report and Notice of Annual Meeting 123
FOR
M10
-K

PART IV
Entity Name Jurisdiction of FormationNIKE Global Holding B.V. NetherlandsNIKE GLOBAL SERVICES PTE. LTD. SingaporeNIKE GLOBAL TRADING PTE. LTD. SingaporeNIKE Group Holding B.V. NetherlandsNIKE Hellas EPE GreeceNIKE Holding, LLC DelawareNIKE Hong Kong Limited Hong KongNIKE Huarache BermudaNIKE Hungary LLC HungaryNIKE Ignite LLC DelawareNIKE IHM, Inc. MissouriNIKE India Holding B.V. NetherlandsNIKE India Private Limited IndiaNIKE International Holding B.V. NetherlandsNIKE International Holding, Inc. DelawareNIKE International LLC DelawareNIKE International Ltd. BermudaNIKE Israel Ltd. IsraelNIKE Italy S.R.L. ItalyNIKE Japan Corp. JapanNIKE Japan Group LLC JapanNIKE Jump Ltd. BermudaNIKE Korea LLC KoreaNIKE Laser Holding B.V. NetherlandsNIKE Lavadome BermudaNIKE Licenciamentos Ltda. BrazilNIKE Logistics Yugen Kaisha JapanNIKE Max LLC DelawareNIKE Mercurial Corp. DelawareNIKE Mercurial Finance Limited United KingdomNIKE Mercurial Licensing Limited United KingdomNIKE Mercurial Ltd. United KingdomNIKE Mercurial I Limited United KingdomNIKE Mercurial II Limited United KingdomNIKE Mexico Holdings, LLC DelawareNIKE New Zealand Company New ZealandNIKE Norway AS NorwayNIKE NZ Holding B.V. NetherlandsNIKE Offshore Holding B.V. NetherlandsNIKE Pegasus BermudaNIKE Philippines, Inc. PhilippinesNIKE Poland Sp.zo.o PolandNIKE Retail B.V. NetherlandsNIKE Retail Hellas Ltd. GreeceNIKE Retail Israel Ltd. IsraelNIKE Retail LLC RussiaNIKE Retail Poland sp. z o. o. PolandNIKE Retail Services, Inc. OregonNIKE Retail Turkey TurkeyNIKE Russia LLC RussiaNIKE SALES (MALAYSIA) SDN. BHD. MalaysiaNIKE Servicios de Mexico S. de R.L. de C.V. MexicoNIKE SINGAPORE PTE LTD SingaporeNIKE Slovakia s.r.o. SlovakiaNIKE Sourcing India Private Limited IndiaNIKE Sourcing (Guangzhou) Co., Ltd. ChinaNIKE South Africa (Proprietary) Limited South AfricaNIKE South Africa Holdings LLC DelawareNIKE Sphere C.V. NetherlandsNIKE Sports (China) Company, Ltd. People’s Republic of ChinaNIKE Sports Korea Co., Ltd. South KoreaNIKE Suzhou Holding HK Limited Hong KongNIKE (Suzhou) Sports Company, Ltd. People’s Republic of China
124

PART IV
Entity Name Jurisdiction of FormationNIKE Sweden AB SwedenNIKE (Switzerland) GmbH SwitzerlandNIKE Tailwind BermudaNIKE Taiwan Limited TaiwanNIKE (Thailand) Limited ThailandNIKE TN, Inc. OregonNIKE Trading Company B.V. NetherlandsNIKE trgovina na debelo d.o.o. SloveniaNIKE UK Holding B.V. NetherlandsNIKE (UK) Limited United KingdomNIKE USA, Inc. OregonNIKE Vapor Ltd. United KingdomNIKE Victory Cooperatief U.A. NetherlandsNIKE Vietnam Limited Liability Company VietnamNIKE Vision, Timing and Techlab, LP TexasNIKE Vomero Cooperatief U.A. NetherlandsNIKE Waffle BermudaNIKE Wholesale LLC SloveniaNIKE Woodside I, LLC OregonNIKE Woodside II, LLC OregonNIKE Woodside I Holdings, Inc. OregonNIKE Woodside II Holdings, Inc. OregonNIKE Zoom LLC DelawarePT Hurley Indonesia IndonesiaPT NIKE Indonesia IndonesiaSavier, Inc. OregonTriax Insurance, Inc. HawaiiTwin Dragons Global Limited Hong KongTwin Dragons Holding B.V. NetherlandsUmbro Asia Sourcing Limited Hong KongUmbro Hong Kong Limited Hong KongUmbro International JV DelawareUmbro JV Limited United KingdomUmbro Schweiz Limited United KingdomUmbro Sportwear Limited United KingdomUmbro Worldwide Limited United KingdomUmbro.com United KingdomYugen Kaisha Hurley Japan Japan
NIKE, INC. 2013 Annual Report and Notice of Annual Meeting 125
FOR
M10
-K

D I R E C T O R S C O R P O R A T E O F F I C E R S
Elizabeth J. Comstock(3)(4)
Senior Vice President & Chief Marketing OfficerGeneral Electric CompanyFairfield, Connecticut
John G. Connors(2)(3)
PartnerIgnition Partners LLCBellevue, Washington
Timothy D. Cook(4)(6)
Chief Executive OfficerApple Inc.Cupertino, California
Alan B. Graf, Jr.(2)(6)
Executive Vice President & Chief Financial Officer,FedEx CorporationMemphis, Tennessee
Douglas G. Houser(1)(5)(6)
Senior PartnerBullivant, Houser, Bailey, P.C., AttorneysPortland, Oregon
Philip H. Knight(1)
Chairman of the BoardNIKE, Inc.Beaverton, Oregon
John C. Lechleiter(4)(5)
Chairman of the Board, President & Chief Executive OfficerEli Lilly and CompanyIndianapolis, Indiana
Mark G. Parker(1)
Chief Executive Officer & PresidentNIKE, Inc.Beaverton, Oregon
Johnathan A. Rodgers(4)(5)
President & Chief Executive Officer (Retired)TV One, LLCSilver Springs, Maryland
Orin C. Smith(2)(3)
President and Chief Executive Officer (Retired)Starbucks CorporationSeattle, Washington
John R. Thompson, Jr.(5)
Assistant to the President of Georgetown University for Urban AffairsGeorgetown UniversityWashington, D.C.
Phyllis M. Wise(5)(6)
ChancellorUniversity of Illinois, at Urbana-ChampaignUrbana, Illinois
Philip H. KnightChairman of the Board of Directors
Mark G. ParkerPresident & Chief Executive Officer
David J. AyreExecutive Vice President, Global Human Resources
Donald W. BlairExecutive Vice President & Chief Financial Officer
Trevor A. EdwardsPresident, NIKE Brand
Jeanne P. JacksonPresident, Product and Merchandising
Hilary K. KraneExecutive Vice President, Chief Administrative Officer and GeneralCounsel
John F. SlusherExecutive Vice President, Global Sports Marketing
Eric D. SprunkChief Operating Officer
Kelley K. HallVice President, Treasurer & Investor Relations
John F. Coburn IIIVice President & Corporate Secretary
Peter H. Koehler, Jr.Vice President, Legal & Assistant Secretary
Jeanine HayesVice President, Intellectual Property & Assistant Secretary
Evan S. ReynoldsAssistant General Counsel & Assistant Secretary
(1) Member — Executive Committee(2) Member — Audit Committee(3) Member — Finance Committee(4) Member — Compensation Committee(5) Member — Corporate Responsibility Committee(6) Member — Nominating and Corporate Governance Committee
128

S U B S I D I A R I E S L O C A T I O N S
James A. Calhoun Jr.Chief Executive Officer
Robert HurleyPresident & Chief Executive Officer
WORLD HEADQUARTERS
One Bowerman DriveBeaverton, Oregon 97005-6453
EUROPEAN HEADQUARTERS
Colosseum 11213 NL HilversumThe Netherlands
CONVERSE INC.
One High StreetNorth Andover, Massachusetts 01845-2601
HURLEY INTERNATIONAL LLC
1945 Placentia AvenueCosta Mesa,
California 92627
S H A R E H O L D E R I N F O R M A T I O N
I N D E P E N D E N T A C C O U N T A N T S
PricewaterhouseCoopers LLP1300 SW Fifth Avenue, Suite 3100Portland, Oregon 97201
R E G I S T R A R A N D S T O C K T R A N S F E R A G E N T
Computershare Trust Company, N.A.P.O. Box 43078Providence, RI 02940-3078800-756-8200Hearing Impaired #TDD: 800-952-9245http://www.computershare.com
Shareholder Information
NIKE, Inc. common stock is listed on the New York Stock Exchange under trading symbol ‘NKE.’ Copies of the Company’s Form 10-K or Form10-Q reports filed with the Securities and Exchange Commission are available from the Company without charge. To request a copy, please call800-640-8007 or write to NIKE’s Investor Relations Department at NIKE World Headquarters, One Bowerman Drive, Beaverton, Oregon 97005-6453. Copies are available on the investor relations website, http://investors.nikeinc.com.
Dividend Payments
Quarterly dividends on NIKE common stock, when declared by the Board of Directors, are paid on or about July 5, October 5, January 5, and April 5. Additionalfinancial information is available at http://investors.nikeinc.com.
Other Shareholder Assistance
Communications concerning shareholder address changes, stock transfers, changes of ownership, lost stock certificates, payment of dividends, dividend checkreplacements, duplicate mailings, or other account services should be directed to the Company’s Registrar and Stock Transfer Agent at the address or telephonenumber above.
NIKE, the Swoosh Design, and Just Do It are trademarks of NIKE, Inc.

NIKE, INC.One Bowerman DriveBeaverton, OR 97005-6453www.nike.com

2013AN
NUAL
REPORT
AND
NO
TICEO
FAN
NUAL
MEETIN
G