nihr guideline b01 r&d operational capability statement
TRANSCRIPT
Carnegie Mellon University 33.340 Modern Physics Laboratory
1
MOSSBAUER SPECTROSCOPY
v2.55 Last Revised: R. A. Schumacher, March 2019
I. INTRODUCTION The Mossbauer Effect consists of the "recoilless" emission of gamma ray photons from certain radioactive nuclei, and the selective reabsorption of those photons by other nearby nuclei. The process is exquisitely sensitive to small differences between the structure of the emitting and the absorbing nuclei. Mossbauer spectroscopy is the science of using this phenomenon to explore the nuclear and atomic structure of materials. In this experiment you will explore three phenomena: (i) the shift in nuclear energy levels induced by the static charge of nearby atomic electrons
(the "isomer shift"). (ii) the energy level splitting in a nucleus due to the magnetic fields induced by the nearby
atomic electrons ("nuclear Zeeman splitting"). (iii) the shift in nuclear energy levels induced by a strong electric field gradient due to
nearly electrons ("quadrupole splitting"). Different materials exhibit these effects to differing degrees. You will explore up to four different iron-containing materials in this experiment: pure iron, stainless steel, sodium nitroprusside, and hematite. BEFORE conducting the experiments in this write-up, consult your instructor about laboratory radiation safety procedures. II. BACKGROUND READING The following references may provide useful background for the experiment and should be perused: Reference Sections Pages Topics Melissinos1 9.3 385 - 399 Mossbauer experiment 6.2, 6.3 218 - 232 Atomic Zeeman splitting 6.4 236 – 238 Natural line width 8.3.3 327 - 328 Proportional Counters App D. 485 - 488 Radiation safety Wertheim2 Mossbauer effect monograph Krane3 74, 362, Introduction to theory 605, 645 ff Melissinos describes the basics of recoilless emission and resonant absorption, while Wertheim discusses the theory of the Mossbauer effect in more detail. Krane's book has

Carnegie Mellon University 33.340 Modern Physics Laboratory
2
the information scattered about, but is easier to follow than Wertheim. Below we give a brief overview of the theory, though you will need to read the reference books for a more complete picture. III. THEORY OVERVIEW 1. The Mossbauer Effect The Mossbauer+ effect involves the resonant absorption of photons emitted by nuclei which undergo recoilless transitions. Because the line widths of these transitions are very small compared to their energies, the process of resonant absorption is highly sensitive to small changes in photon energies. The resolution of the Mossbauer effect is typically on the order of one part in 1012 making it a powerful tool in nuclear spectroscopy and condensed matter physics. From Mossbauer spectra it is possible to determine a number of nuclear and condensed matter properties. In this experiment the condensed matter properties to be determined are the isomer shift, the nuclear electric quadrupole interaction, and the magnetic level-splitting interaction in ferromagnetic materials. The nuclear properties are the spins of the ground and excited nuclear states and the ratio of their magnetic moments. 2. Resonant Absorption When a photon is emitted in a transition between two energy levels, the frequency of the photon has a natural line width resulting from the finite lifetime of the excited state. If this photon is incident on a similar system in its ground state, there is some probability that it will be re-absorbed, raising that system to the excited state. This is what is meant by resonant absorption of photons. In a transition, however, not all of the energy goes into the photon. Because momentum is conserved some of the energy is lost to recoil of the emitter. Likewise, when the photon is absorbed, the absorber will recoil. The distributions of the emission and absorption energies are therefore separated by twice the recoil energy. The probability of resonant absorption is proportional to the overlap of these distributions. In the case of atomic transitions, recoil energies are small compared with natural line widths. For this reason, there is a high probability of resonant absorption in atomic transitions. In the case of nuclear transitions, however, photon energies are much higher and recoil energies are much larger than the natural line width Therefore, there is little or no overlap of transition energy probabilities. As a result, resonant absorption is not very probable for nuclear transitions. 3. Recoilless Emission When determining the recoil energy of a nucleus which is part of a solid, the interaction with the rest of the solid lattice structure must also be considered. By increasing + Discovered by Rudolf Mössbauer in 1958. We will omit the umlaut in the name.

Carnegie Mellon University 33.340 Modern Physics Laboratory
3
the effective mass of the recoiling system, the recoil energy is decreased. The nucleus transmits energy to the lattice by exciting vibrational states through the creation of phonons. If no phonons are produced (quantum mechanics allows this), then all of the energy of the transition goes into the emitted photon. This is what is meant by recoilless emission. The fraction of zero-phonon emission, given by the Debye-Waller factor, is a function of the Debye characteristic temperature, the g-ray energy and the temperatures of the emitter and absorber. Because vibrational excitation is a quantized process there is some (not small) probability that a given transition will transfer no energy to the lattice: recoilless emission. 4. Doppler Shift When an emitter has a motion relative to the absorber, the energy of the photons is Doppler shifted. For non-relativistic velocities, DE=hDn= bhno where b=v/c, and no is the frequency of the photon emitted from an atom at rest. This is the first-order Doppler shift and is valid for v<<c. According to this relation, the change in photon energy is proportional to the relative velocity. By varying the relative velocity of the emitter, it is possible to sweep photon energies over a range of values. In Mossbauer spectroscopy, absorption rate is measured as a function of source velocity. Using the Doppler formula we can convert velocity to energy shift. Analysis of observed absorption peaks reveals details about nuclear energy levels. 5. Observable Interactions Since the energy levels of the nucleus are dependent on a number of external factors, it is possible to obtain information about the atomic and molecular structure of materials from their Mossbauer spectra. Depending on the nature of the interaction, there may be a resulting split or shift of nuclear energy levels. In this experiment the isomer shift, the magnetic splitting, and the electric quadrupole coupling can be observed. The next three sections give a descriptive overview of each, but a more complete understanding will require consulting the references given. 6. Isomer Shift The energy levels of a nucleus are determined mostly by the strong interaction which binds the nucleons together. To a very slight degree, the overlap of the electronic wavefunction with the nucleus will also, via a Coulomb interaction, affect the levels of the states. In different materials containing a given type of nucleus, but with differing electronic properties, can therefore have small but measurably different nuclear energy levels. The so-called isomer shift involves a change in nuclear energy levels resulting from electron charge densities at the nucleus which differ for the emitting and absorbing materials.

Carnegie Mellon University 33.340 Modern Physics Laboratory
4
Consider an idealized atom consisting of a "point" nucleus with a Coulomb field. Solving the Schrödinger equation gives a ground state energy and some atomic (electronic) wave functions, , but we don't care about the details. Now we ask, how does the ground state energy level change when we consider the nucleus as an extended object of radius R and uniform charge density? In first-order perturbation theory this is done by letting the nuclear "perturbing Hamiltonian" , H', act upon the unperturbed ground state electron wave function, , according to:
(1)
This gives the first-order energy shift for the ground state energy, dEe. Roughly speaking, we compute the energy of interaction between an extended Coulomb potential due to the nucleus with the electron cloud. The perturbing Hamiltonian is the difference between the point-like Coulomb potential that yielded the unperturbed wave functions, Vo, and the potential due to the nucleus modeled as a small uniformly-charged sphere, V.
(2) where in MKS units
(3)
and
(4)
Exercise 1: Show that the preceding equation is true.
The Hamiltonian contains no derivatives, so it doesn't really do anything to the wavefunction when it operates. The wavefunction of the electrons, , is taken to be constant over the range of the tiny nucleus, and is therefore taken out of the integral and replaced with , the probability density of the electrons at the origin. Doing the integral leads to
(5)
Exercise 2: Show that the preceding equation is true.
A subscript n has been added R to indicate that this is the radius of the nth state of the nucleus. Thus we see that given a state, n, the so-called isomer shift depends upon the square of the "size" of the nucleus and upon the electron charge density at the location of
( )e ry
ey
δEe = ψe H 'ψe ≡ ψ*e (r)H '(r)ψe (r)d
3r∫
H ' = e (V −V0 )
V0 =14πε0
Zer
V (r < R) = Ze4πε0
1R32−12rR"
#$
%
&'
2"
#
$$
%
&
''
( )e ry
2(0)ey
δEe =110ε0
Ze2Rn2 ψe (0)
2

Carnegie Mellon University 33.340 Modern Physics Laboratory
5
the nucleus. Rn is not the same for all states. The shift of the energy levels for a given nuclear species depends upon the difference in electron densities between different materials. For a single material, the energy difference, DE, between a ground state (0) and an excited state (1) would be
(6)
We must realize that , or indeed, , depends not only on a single atom’s electrons, but also on the electrons of nearby atoms in the lattice of the given material. Now if the emitter of a gamma ray and the absorber of that same gamma ray in the Mossbauer measurement have different electronic charge densities at the position of the nucleus, then we get a small shift in the difference of the energy levels:
(7)
This is called the isomer shift, and it causes the centroid of the Mossbauer spectrum to be displaced from zero relative velocity between emitter and absorber. Depending on whether the excited state has a larger or a smaller radius than the ground state, the isomer shift will be either positive or negative. 7. Magnetic Level-Splitting (Nuclear Zeeman Effect)
Whenever a system with a magnetic dipole moment vector, µ, is placed in a magnetic field H there is a torque which tries to align the moment with the field. There is an energy associated with the degree of alignment that goes as
(8) In quantum mechanics we have objects with angular momentum, L, and finite magnetic moments; the vectors must point along the same direction since a given spinning object can have only one meaningful symmetry axis, on the average. However, quantum mechanics shows that the projection of L along some external direction, such as the H direction, can have only a fixed number of projections given by (2L+1), with a magnetic quantum number mL which specifies which state the system is in. Thus, when the quantum system tries to align itself with the magnetic field, it can only achieve this specific set of states, with a set of discrete energies to match. The magnetic moment of an atomic (electronic) or nuclear system is measured in units of "magnetons", where one magneton is the magnetic moment of a unit of charge when it has one unit of angular momentum. The value of the magneton is
, (9)
ΔE =110ε0
Ze2 ψe (0)2R12 − R0
2( )
2( )e ry 2(0)ey
ΔEisomer = ΔEabsorb −ΔEsource =110ε0
Ze2 R12 − R0
2( ) ψeabsorb(0)2− ψe
source (0)2#
$%&'(
EM = −!µ ⋅!H
µ =e!2m

Carnegie Mellon University 33.340 Modern Physics Laboratory
6
Exercise 3: Starting from the simple case of a massive charge in a circular orbit, show why this equation provides the most “natural” definition of a unit of magnetic moment. where the mass is the electron mass for atomic (electron) systems (µB is the "Bohr magneton"), or in nuclear systems the proton mass (µN is the "nuclear magneton"). It has units of Joules (or MeV) per Tesla in the MKS system. Any real system, however, can have a structure that makes its actual magnetic moment different than a single unit of either Bohr or nuclear magneton. The structural information is captured in the form of a unitless “g-factor" which can be calculated, in principle, for each given situation. In nuclear physics, total angular momentum (orbital plus intrinsic spin of nucleons) is traditionally designated by the letter I, to distinguish it from the total angular momentum J of the electronic wavefunction. Thus we have the interaction energy for a quantized nuclear system in the form:
(10) This energy is a "perturbation" on the energy of the system in the presence of the magnetic field, H. Given the index of the state mI, we can calculate the corresponding energy shift EM. Transitions can then occur between these sub-levels. The magnetic field can result from the atom's own electrons or in interaction with other atoms in the solid, and is called the internal field. The structure of the spectrum depends largely on the magnetic nature of the material, whether it is dia-, para-, ferro- or antiferro-magnetic. Consult Melissinos, Chapter 6, for more information on how the Zeeman Effect allows us to examine the transitions between these split energy levels. The chapter is written for atomic (electronic) systems, but the same physics applies at the nuclear level. The Mossbauer Effect allows one to "sweep" across absorber nuclei with a range of well-defined gamma ray energies to map out the spectrum of line-splittings in the absorber. For some materials used in this experiment a magnetic field is present at the Fe57 nucleus, so the I=1/2 ground state is split into two levels, while the I=3/2 excited state is split into 4 levels. With the electric dipole selection rule that mI should change by 0 or ±1 in the absorption process, there are a total of six possible "lines" corresponding to six different transitions. Exercise 4: Make a drawing of energy levels to show how this makes sense. The source you will be using was prepared such that the gamma rays are not themselves split into several energies. Thus, you will be sweeping a single Doppler-shifted energy across the split energy levels of the absorbing nuclei.
EM = −!µ ⋅!H = −gµNHmI

Carnegie Mellon University 33.340 Modern Physics Laboratory
7
8. Electric Quadrupole Splitting The charge or current distribution of a nucleus need not be spherically symmetric. As discussed above there may be a net magnetic dipole moment, for example. There can also be a net electric quadrupole moment, Q, which means that the distribution of electric charge is either prolate (Q>0, "cigar-shaped") or oblate (Q<0, "flattened"). The mean position of the charge remains at the origin, but it is deformed. In atomic or nuclear systems such permanent deformations are caused by tensor forces. The direction of a quadrupole moment is along the angular momentum vector, which must have one unit of ħ or greater. It is easy to show (ask your instructor) that an electric quadrupole moment tries to align itself in the direction of the gradient of an external electric field (not the field itself). In a given material there can be an electric field gradient (EFG) due to the atomic electrons, the overall structure of the material, or both. As in the case of the magnetic splitting there is a perturbation energy associated with this interaction which shifts the energy levels of some nuclear states. Roughly speaking, its magnitude is the quadrupole moment of the nucleus "times" the electric field gradient. But since the electric field is a vector quantity, its gradient is a 3-by-3 matrix of components with each of three field components acted upon by the gradient operator in each of three directions. Similarly, the quadrupole moment of the nucleus is in general a nine component tensor object. Fortunately, many systems have spatial symmetries which make many components vanish. The quadrupole moment, Q, for a nuclear electric charge distribution r(r) is given by 3
(11) where the polar angle is with respect to the nuclear spin direction. One sees from this equation that Q has units of area, and in fact tabulated values for Q are in units of barns, where 1 barn = 10-24 cm2 (See the Table of Isotopes4 for the value of Q for the excited state of Fe57). We do not need to do this integral: we will just look up the values for states of interest to us. For systems with suitable cylindrical symmetry the interaction energy, EQ, is given by 3
(12)
where this time the angle is between the symmetry axis of the external electric field and the symmetry axis of the nuclear spin, and Q’ is the quadrupole moment recomputed along the z axis. In this equation Vext is the electric potential, the gradient of which is the electric field, and the second derivative of which is the electric field gradient. The derivative factor
is sometimes written as "q", not to be confused with Q, the quadrupole
moment of the nucleus, or q which sometimes represents the charge of the nucleus. In quantum mechanics the spin may only take certain discrete directions with respect to the electric field, and the proper calculation3 then leads to the equation we can actually use in this experiment:
eQ = ρ(r) r2 (3cos2θ −1) d 3r∫
EQ =14e !Q 3
2cos2θ − 1
2
#
$%
&
'(∂2Vext∂z2
#
$%%
&
'((z=0
( )2 2
0=¶ ¶ext zV z

Carnegie Mellon University 33.340 Modern Physics Laboratory
8
(13)
The ground state of Fe57 has angular momentum I = 1/2, and thus has a vanishing quadrupole energy shift. The excited state has I = 3/2, however, and so will have four states with quantum number mI that take the values -3/2, -1/2, +1/2, and +3/2. From the equation you can see that the four states will split into only two different energies. Exercise 5: Compute the numerical factor in this equation for the I=3/2 states. What is the energy difference between the two levels?
Where might the electric field gradient necessary to have this effect come from? If the arrangement of electric charge external to the iron nucleus is such that there is an axis along which the electric field changes. In this experiment, you will use sodium nitroprusside, also known as sodium nitroferricyanide, and often abbreviated “SNP” by Mossbauer spectroscopists. Figure 1 illustrates the arrangement of atoms in this molecule, and it is quite plausible that the asymmetric arrangement of nitrogen, carbon, and oxygen atoms on either side of the iron atom could lead to an electric field gradient.
Figure 1: Two representations of the molecular structure of Sodium Nitroprusside or “SNP”. (image source: Wikipedia)
Exercise 6: Look up this material in a suitable reference. What is its main claim to usefulness?
EQ = eQ3mI
2 − I (I +1)4 I (2I −1)
∂2Vext∂z2
#
$%%
&
'((z=0

Carnegie Mellon University 33.340 Modern Physics Laboratory
9
IV. EXPERIMENTAL APPARATUS This section will describe briefly the apparatus which is used in this experiment. Data are gathered using a constant-acceleration, transmission-geometry Mossbauer spectrometer and a data acquisition system installed on a standard PC. Histograms of the number of detected gamma rays as a function of piston velocity are accumulated and stored. These histograms can then be analyzed using and Excel spreadsheet or similar programs. The g-ray source is attached to a vibrating mechanism driven so as to cause a triangular velocity waveform. That is, the velocities of the emitting source are swept through a specified range, increasing and then decreasing linearly with time. The velocity range is selected with a dial control, with maximum velocity up to 20 mm/s. The g-rays which pass through the sample are detected by a proportional counter. Signals from the counter pass through a pre-amp and a linear amplifier before reaching a single-channel analyzer (SCA), which generates a digital pulse if the analog signal falls within a selected pulse-height range. The digital output from the SCA is fed into the computer which sorts the event into the associated velocity bin. The computer accumulates data in 1000 data bins, each corresponding to a specific velocity. Synchronization is maintained between the computer and piston-driving electronics so as to produce one pass through all bins for each oscillation cycle. This produces a spectrum with two zero-velocity positions, near bins 250 and 750, and with the maximum speeds near bins 1, 500, and 1000 (Though note that the online display counts bins from 0 instead of 1). On the computer screen, several versions of the same information are displayed in order to “see” the accumulating data at different resolution. The source used in this experiment is Co57 which decays with a half-life of 270 days to the l36.4 keV excited state of Fe57 by electron capture. See Figure 9.13 in Melissinos for details. Gamma-ray transitions then occur very quickly by two paths, either to the 14.413 keV state, or directly to the ground state. The emission of the l4.413keV g-ray has a significant recoilless fraction, and is the one used in this experiment. The emitted photon energies are unsplit, i.e. they have only one precise energy. This is because this source was prepared by ion implantation of the cobalt into a copper substrate, in which none of the perturbing interactions are present. The ground state of the Fe57 has spin l /2, and the excited state at 14.413 keV has spin 3/2.
The samples used for absorbers are stainless steel (which exhibits only the isomer effect), soft iron (which shows the Zeeman splitting and the isomer effect), sodium nitroprusside “SNP” (Na2Fe(CN)5NO 2H2O) (which shows the quadrupole splitting and the isomer effect), and hematite (a-Fe2O3) (which shows all the effects). Note that hematite is a very common mineral oxide of iron and is one of form of iron ore. Each absorber contains the naturally-occurring abundance of the Fe57 isotope of iron, which is about 2%. The details of running the software and the computer are given in Appendix A.

Carnegie Mellon University 33.340 Modern Physics Laboratory
10
V. EXPERIMENTAL PROCEDURE The following general results are to be obtained for this experiment: 1. Determine the energy spacing of the nuclear Zeeman effect using the pure iron absorber. Obtain experimental values for source-absorber isomer shift, the strength of the magnetic field strength at the nucleus, and the ratio of g-factors for the two states. 2. Determine the line width of the source (in mm/s), and the relative source-absorber isomer shift, using a stainless steel absorber. Compute the lifetime of the excited state using the Heisenberg relationship, and compare to the handbook value. Compare the isomer shifts of stainless steel and soft iron. 3. Determine the quadrupole splitting of the sodium nitroprusside “SNP” absorber and its isomer shift relative to stainless steel. Determine a value for the electric field gradient at the nucleus. 4. Determine the magnetic and quadrupole splittings of the hematite absorber and the isomer shift relative to stainless steel. All these effects are present. The quadrupole splitting causes the m=3/2 states to move up slightly, and the m=1/2 states to move down slightly in energy. This gets reflected in the position of the peaks. Specific steps toward getting the results: 1) Look at the pulse-height spectrum from the proportional counter on an oscilloscope. Observe how the dominant pulse-heights change depending on the absorber present in the path of the gamma rays. Identifying which “band” of pulses from the detector corresponds to the desired 14.413 keV transition in iron needs to be done next. 2) Change the "E" setting on the single-channel analyzer in small steps and measure the count rate as a function of "E". The vernier scale on the analyzer module is calibrated roughly in volts, corresponding to the pulses you see on the oscilloscope. For this set of measurements, pick DE to be small: about 0.1 Volt. The measurements will trace out the pulse height spectrum of the gamma rays seen by the pulse-height analyzer. After obtaining this curve, decide on the best values to use for E and DE at which to run the experiment. 3) Velocity calibration of the piston. We will assume that the velocity calibration of the system is as given in this write-up. Set the front-panel maximum speed on the blue controller box using the large dial. It gives values in millimeters/second. The detailed velocity calibration by which you have to correct your data is given in Appendix B. 4) Soft iron absorber (also named “a-Fe” for the lattice structure of pure iron at room temperature). This material has a strong magnetic field at the location of the nucleus, and this induces a level-shifting of the different magnetic substates involved in the Mossbauer absorption process. It is like the atomic Zeeman effect, but at the nuclear level. Measure

Carnegie Mellon University 33.340 Modern Physics Laboratory
11
the absorption spectrum for soft iron. Instructions for using the data acquisition system are in Appendix A, but your instructor can get you started quickly. There should be six lines corresponding to the six possible transitions. Use the data to obtain values for the magnetic field strength at the nucleus using g-factors looked up in a handbook4, the measured ratio of the g-factors of the excited state and the ground state, and the value of the isomer shift in soft iron compared to copper. These three numbers are algebraically over-determined by the six numbers you have measured. Devise a way to make best use of your data to extract these numbers. Exercise 7: If you have taken or are taking the Nuclear and Particle physics course, use the single-particle shell model to estimate the g-factors for the ground and excited states. 5) Stainless steel absorber. The lattice structure of this material does not result in either the quadrupole or the magnetic Zeeman splitting of the Mossbauer line. It will only result in an isomer shift: the shift in energy level of the Fe57 14.4 keV line due to the atomic electrons in stainless steel versus the atomic electrons in copper (recall that our source is Fe57 ion-implanted into a copper substrate. Measure the isomer shift in mm/sec. Convert the result into an energy difference. 6) Sodium nitroprusside “SNP” absorber. This material has electronic structure which induces a strong electric field gradient at the iron nucleus. This field gradient is "felt" by the quadrupole moment of the nucleus. Obtain data for the absorption on this material. The splitting is proportional to the product of Q, the quadrupole moment of the nucleus and the electric field gradient. Look up4 the value for the quadrupole moment and obtain a value for the electric field gradient. 7) Hematite absorber. This material exhibits all three effects discussed previously. The excited state magnetic levels are modified by the quadrupole interaction: The m = ±3/2 levels shift up in energy and the m = ±1/2 levels move down in energy. Measure the absorption spectrum on hematite and compare to the others you have measured. Get new values for all of the parameters studied separately above: H at the nucleus, q, and the isomer shift with respect to stainless steel.
References
1) A. C. Melissinos & J. Napolitano, Experiments in Modern Physics, 2nd Ed. Academic Press, New York, 2003. 2) G. K. Wertheim, Mossbauer Effect: Principles and Applications. 3) K. S. Krane, Introductory Nuclear Physics, John Wiley & Sons, New York, 1988. 4) R. B. Firestone, V. S. Shirley et al, Table Of Isotopes, 8th Edition, John Wiley & Sons, Inc., New York, 1996. (Photocopied handouts available in the lab.) 5) P. R. Bevington and D. K. Robinson Data Reduction and Error Analysis for the Physical Sciences 3rd Ed., McGraw Hill Book Company, New York, 2003.
Carnegie Mellon University 33.340 Modern Physics Laboratory
12
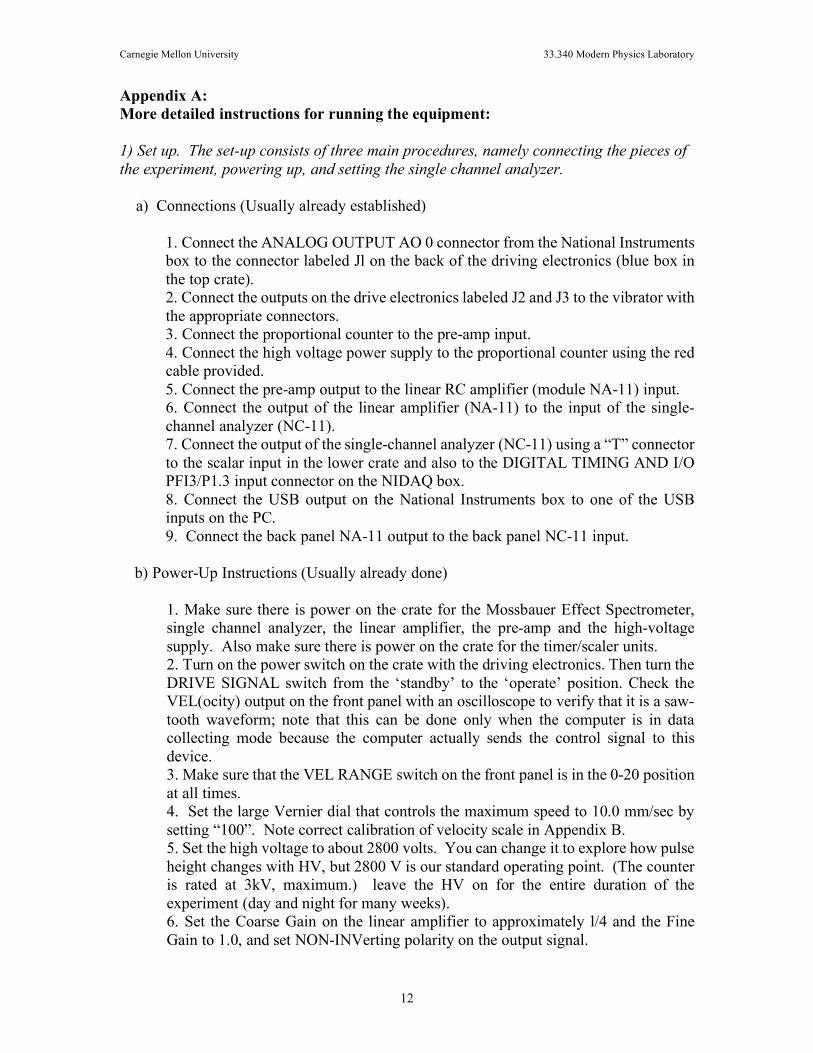
Appendix A: More detailed instructions for running the equipment: 1) Set up. The set-up consists of three main procedures, namely connecting the pieces of the experiment, powering up, and setting the single channel analyzer. a) Connections (Usually already established)
1. Connect the ANALOG OUTPUT AO 0 connector from the National Instruments box to the connector labeled Jl on the back of the driving electronics (blue box in the top crate). 2. Connect the outputs on the drive electronics labeled J2 and J3 to the vibrator with the appropriate connectors. 3. Connect the proportional counter to the pre-amp input. 4. Connect the high voltage power supply to the proportional counter using the red cable provided. 5. Connect the pre-amp output to the linear RC amplifier (module NA-11) input. 6. Connect the output of the linear amplifier (NA-11) to the input of the single-channel analyzer (NC-11). 7. Connect the output of the single-channel analyzer (NC-11) using a “T” connector to the scalar input in the lower crate and also to the DIGITAL TIMING AND I/O PFI3/P1.3 input connector on the NIDAQ box. 8. Connect the USB output on the National Instruments box to one of the USB inputs on the PC. 9. Connect the back panel NA-11 output to the back panel NC-11 input.
b) Power-Up Instructions (Usually already done)
1. Make sure there is power on the crate for the Mossbauer Effect Spectrometer, single channel analyzer, the linear amplifier, the pre-amp and the high-voltage supply. Also make sure there is power on the crate for the timer/scaler units. 2. Turn on the power switch on the crate with the driving electronics. Then turn the DRIVE SIGNAL switch from the ‘standby’ to the ‘operate’ position. Check the VEL(ocity) output on the front panel with an oscilloscope to verify that it is a saw-tooth waveform; note that this can be done only when the computer is in data collecting mode because the computer actually sends the control signal to this device. 3. Make sure that the VEL RANGE switch on the front panel is in the 0-20 position at all times. 4. Set the large Vernier dial that controls the maximum speed to 10.0 mm/sec by setting “100”. Note correct calibration of velocity scale in Appendix B. 5. Set the high voltage to about 2800 volts. You can change it to explore how pulse height changes with HV, but 2800 V is our standard operating point. (The counter is rated at 3kV, maximum.) leave the HV on for the entire duration of the experiment (day and night for many weeks). 6. Set the Coarse Gain on the linear amplifier to approximately l/4 and the Fine Gain to 1.0, and set NON-INVerting polarity on the output signal.

Carnegie Mellon University 33.340 Modern Physics Laboratory
13
7. Set the Mode of the single-channel analyzer to DIFFerential, and LOCal Baseline. 8. Make sure the computer is booted, and activate the data acquisition program called MossbauerExperiment#.vi on the computer desktop, where # is the highest available current version of the program. Clicking on the icon will initiate the LabVIEW software system that controls the National Instruments data acquisition box.
c) Setting the Single-Channel Analyzer
1. With a Co57 source in place, check the output of the linear amplifier on an oscilloscope. A number of peaks should appear corresponding to photon energies. To identify the 14 keV pulses, put a piece of 1/8" Lucite between the source and the counter. This should eliminate the 6 keV pulses. A l /32" thick piece of copper should eliminate the 14 keV pulses.
Exercise 8: Where do the unwanted 6 keV gamma's come from? Look in Melissinos or ask your instructor.
2. Note pulse height on the oscilloscope screen which fairly well isolates the 14 keV pulses. The signal should be DC coupled. 3. Measure the count rate for a given E, and DE. An E of 0.5 Volts and a DE of about 0.1 volts are appropriate for a first try. The count rate can be measured using the timer/scalar unit in the lower crate. Set a time to count (e.g. 1 minute) on the timer dial, arm it by moving the level to the ON position, reset the scaler using the lever on the mechanical counter, and press the START button. The timer should count down for the time set and stop when the time is expired. 4. Measure the count rate as a function of E, for values of E from 0.0 to 2.0 - DE in steps equal to your choice of DE. A DE of about 0.1 volts is appropriate. Plot the count rate vs. E and identify the positions for maximum count of the l4.4 keV line. This is the value of E to be used in data acquisition. Things may drift from day to day, so the optimum value of E should be checked, at least by varying E and watching the counter, before each run. 5. Set the E and DE controls on the single-channel analyzer (NC-11) (which are calibrated in volts) so that E and E+DE encompass the range of the 14 keV pulses.
2. Preparing a Sample To prepare a sample for analysis on the Mossbauer spectrometer you must insert the sample absorber between the gamma ray source and the proportional counter. This can be done by taping the sample (a thin foil mounted on a small plastic disk) over the opening in the lead collimator nearest to the source. Make sure that the vibrating piston, collimator and proportional counter are aligned so that gamma rays that pass through the sample will reach the counter. The next step is to set the velocity range for the oscillator using the dial control. To determine the sweep velocity needed to cover the entire spectrum, consult the sample

Carnegie Mellon University 33.340 Modern Physics Laboratory
14
spectra for each of the absorbers. Be sure to check both ends of the spectrum to determine the required magnitude of the velocity sweep. Add an extra ten percent for possible calibration error and to be sure the ends are out of the resonance region. 3. Running the Data Acquisition program The data is accumulated using a commercially available National Instruments data acquisition box that is configured to measure the arrival time of the pulses from the detector relative to the triangle-pulses that control the velocity of the source piston. The software is a LabVIEW program called MossbauerExperiment#.vi on the computer desktop, where # is the highest available current version of the program. Double click on the icon to activate the program.
Once all the connections have been made (see above), start the “run” by clicking the small arrow icon near the top of the screen. Immediately you should see “events” accumulating in the histograms. You must now simply wait until the statistical power of all the accumulated events lets you “see” the peaks in the spectrum.
The program sends a driver signal in the form of a square wave to the Spectrometer
that operates at 25.0 Hz. That is, the piston is made to go through 25 complete cycles per second.
On each cycle of piston oscillation, the data acquisition system records 1000
measurements of the gamma rays arriving in each slice of time, and adds those gamma ray counts to the histograms in the appropriate bin.
The bottom left histogram shows the full spectrum of 999 bins. Bin 0 corresponds
to positive maximum speed, Bin 499 corresponds to negative maximum speed, and Bin 998 corresponds again to positive maximum speed. Thus, you can also figure out which bins correspond to zero speed.
The top histogram shows just the first 500 bins of the data on an expanded scale to
show the spectrum with more definition. The bottom right histogram shows the middle 100 channels of the data in order to help see the shift of the peak positions from the zero velocity position. When you judge that enough data has been accumulated, stop the data acquisition by clicking “END RUN and save data”. Only at this moment will the data that has accumulated be written to the file that you specify in the dialog box. Open this simple text file with any text-reading program. After an introductory header, it has two columns of numbers. This first is the “channel number” from 0 to 998 that corresponds to each velocity bin; you must figure out the correct conversion from channel number to velocity based on the settings of your run. The second column shows the total number of events that were accumulated in the given velocity bins during the run. Most student groups use a spreadsheet program such as Excel to manage this data to identify the peak locations, the uncertainties on the peak locations, etc.

Carnegie Mellon University 33.340 Modern Physics Laboratory
15
Appendix B:
CALIBRATION OF VELOCITY DIAL FOR MOSSBAUER EXPERIMENT
DRIVER CIRCUIT The following graph shows the calibration of the Mossbauer unit’s dial indication. The actual maximum speed is given on the vertical axis for a given nominal dial setting given on the horizontal axis.
The calibration was done during April 2011 using the known spacing of the outermost absorption lines in soft iron.
0.0
2.0
4.0
6.0
8.0
10.0
12.0
14.0
16.0
0.0 2.0 4.0 6.0 8.0 10.0 12.0 14.0 16.0
Cal
ibra
ted
Spee
d (m
m/s
ec)
Nominal Speed (mm/sec) (Dial Setting)
MPL Mossbauer Setup Calibration
Y = (1.102±0.003)X - (0.96±0.02)