niger food security update march 2009 -...
TRANSCRIPT

FEWS NET Niger Niamey Tel: 00 227 20 31 71 33 [email protected]
FEWS NET Washington 1717 H St NW Washington DC 20006 [email protected]
FEWS NET is a USAID-funded activity. The authors’ views expressed in this publication do not necessarily reflect the view of the United States Agency for International Development or the United States Government.
www.fews.net/niger
NIGER Food Security Update March 2009 • According to the household food security and
vulnerability survey conducted by the national Early Warning System (SAP), the National Statistics Bureau (INS), and their partners, 2,943,000 individuals or 22 percent of the nation’s households are food‐insecure, and 32 percent of households, or some 966,000 individuals, are highly or extremely food‐insecure.
• Analyses of final crop performance data for the 2008/09 growing season by the Agricultural Statistics Office put grain production from rainfed crops (millet, sorghum, corn, and fonio) at 4,813,984 MT, plus 142,931 MT of irrigated crops.
• New outbreaks of measles and meningitis have
occured, particularly in the Zinder, Maradi, Dosso, Tahoua, and Tillabery regions. This seasonal deterioration in health conditions aggravates nutrition problems.
• Grain prices are stable, though well above the five‐year average for this time of year, curtailing market access by food‐deficit households, pastoralists and poor urban dwellers.
• Business is slow on livestock markets, with a conspicuous absence of exporters. This is driving down prices and weakening livestock:cereal terms of trade.
Seasonal calendar and critical events
Source : FEWS NET
Figure 1. Current food security conditions, March 2009
Please visit www.fews.net/FoodInsecurityScale for more information on the
FEWS NET food insecurity severity scale.
Source: FEWS NET Niger

NIGER Food Security Update March 2009
Famine Early Warning Systems Network
2
Food security overview The final production figures released by the government for the 2008/09 cropping season put gross output from local grain crops (millet, sorghum, corn, and fonio) at approximately 4,956,915 MT, up 7.6 percent from preliminary estimates. An analysis of this Harvest Forecasting and Assessment Survey (EPER) data and the forage balance sheet by the Agricultural Statistics Office has helped pinpoint to areas vulnerable to food insecurity. This qualitative assessment of the household food situation is based, among other things, on the main vulnerability factors in these areas, such as this year’s grain deficit, past cereal deficits, household food access, market supplies, the condition of pasture resources, access to pasture and watering holes, cash crop production, and sources of income. The findings by the joint household food security and vulnerability survey conducted by the national Early Warning System (SAP) and National Statistics Bureau (INS), in conjunction with their partners, in December of last year put the size of the moderately and highly food‐insecure population at approximately 2,943,000 individuals, including 966,000 highly and extremely food‐insecure individuals. This survey is part of annual data collection activities conducted at the end of the growing season and the beginning of the hunger season to provide useful statistical data and to support food security projections for different population groups over the coming months. Survey data for the same period of 2007 showed 4,098,032 food‐insecure individuals, including 1,441,967 highly and extremely food‐insecure individuals. The survey is based on a national sample of 10,000 households. The data collection process uses questionnaires and focus groups and the resulting data is representative of a particular region and department. The findings are used to classify households into four main categories, namely food‐secure, moderately food‐insecure, critically food‐insecure and extremely food‐insecure. Food‐insecure population groups are identified based on a multidimensional statistical analysis of five variables reflecting the three dimensions of food security, namely food availability, access, and use. The indicators used in this identification process are the household food consumption score, the proportion of total expenditures going on food, the duration of available food reserves, the number of head of livestock per household, and a composite indicator (the survival strategy index) reflecting household resilience strategies for coping with food shortages. The advantage of this index is that it better reflects current food insecurity. Studies of the survey data show that moderately food‐insecure populations should be assisted through the creation or strengthening of grain banks in areas where food crops are unavailable on local markets and through cash‐for‐work programs in areas where crops are available, but their high prices compared with the five‐year average are curtailing food access. Highly or extremely food‐insecure groups require targeted distributions of food aid. According to the survey, 78 percent of households (or 10,100,000 individuals) are food‐secure. Barring any serious shocks, all food‐secure households are able to meet their food needs until the next round of harvests. The food security of these households is reflected in study data showing a major improvement in the coverage period of their food reserves from an average of 3.7 months in 2007 to this year’s average of 5.4 months, giving them an average of 1.7 additional months worth of food reserves. Nevertheless, with prices for staple grain crops in most parts of the country on the rise, and threatening to undermine food security, the implementation of proposed interventions in the food and livestock sectors, as spelled out in the contingency plan, are crucial. Health and nutritional conditions are steadily deteriorating with the surge in outbreaks of meningitis and measles. As of March 15th of this year, there were a total of 3,440 reported cases of meningitis nationwide. Since the second week of March, there has been an average of 1,000 new cases a week, bringing the cumulative number of cases reported over the period from January through March of this year to 5,729, compared with 559 cases for the same three‐month period in
Table 1: Percentage of the population classified as severely food-insecure based on the 2008 SAP/INS survey
Région % Département %
Diffa 14 Diffa 17
N'Guigmi 13
Mainé Soroa 12Tahoua 12 Tchintabaraden 30
Illéla 21
Abalak 17
Keita 17Bouza 11
Madaoua 11Tillabéri 8 Tillabéri 18
Ouallam 14Zinder Gouré 13
Niamey CU Niamey (périphérie) 13 Source: Joint SAP/INS/partners survey

NIGER Food Security Update March 2009
Famine Early Warning Systems Network
3
2008, with most outbreaks concentrated in the Zinder, Maradi, Dosso, and Tahoua regions. The measles outbreak is concentrated mainly in the Zinder, Tahoua, and Tillabery regions, which account for 31, 26, and 16 percent, respectively, of all measles cases reported nationwide. The situation as far as malaria, bloody diarrhea, and cholera are concerned is relatively stable. Therapeutic feeding centers in areas with meningitis and measles flare‐ups have reported an increase in the number of cases of child malnutrition. Interestingly enough, the areas reporting sharp increases in the number of cases of malnutrition are the same areas affected by cuts in services since the government shutdown operations by the French chapter of Doctors Without Borders in Maradi and by Action Against Hunger in Tahoua in July of last year. As usual, nutrition indicators are expected to steadily deteriorate between now and May/June of this year, in line with negative trends such as the surge in epidemic outbreaks and the insecurity with respect to food access and access to health care. The government is in the process of framing standard responses to these problems based on recommendations by the national early warning system (SAP) and National Statistics Bureau (INS). Seasonal progress Final crop production estimates by the Agricultural Statistics Office put gross output from local grain crops (millet, sorghum, corn, and fonio) at approximately 4,956,915 MT (Figure 2), which is a 31 percent improvement over last season and 7.6 percent above preliminary estimates. The food balance sheet shows a net surplus of 1,031,166 MT over and above aggregate nationwide food needs, which puts per capita food availability at 322 kg for the year. At the household level, according to the survey data, this production figure translates into an overall reduction in the proportion of households classified as severely food‐insecure at this time of year from 12 to 7 percent. This boost in crop production is also reflected in the extension in the coverage period of household food reserves from an average of 3.7 months in 2007 to an average of 5.4 months in 2008. The government’s direct purchasing program for cash crops at attractive prices inspired farmers to produce a record 1,548,103 MT cowpea harvest. Good harvests of groundnut and chufa nuts produced roughly 304,969 MT and 32,470 MT of crops, respectively. Moreover, there are surpluses of all major food balance sheet items with the exception of the tuber and meat categories. Thus, on the whole, food availability in Niger is more than sufficient to meet consumption needs. Analyses of apparent per capita consumption and surpluses put food reserves at high levels. These surpluses will not be unloaded on the market until after revenues from sales of cash crops have plummeted, in April and May, and, hopefully, will help stabilize grain prices through the end of June or July. Thus, households vulnerable to high‐price shocks (net grain‐consuming poor urban and rural households and pastoralists) could be facing stable, moderate levels of food insecurity between now and the end of the hunger season in September. Markets and trade Markets have adequate supplies of local and imported grain crops from local farmers and traders. Cereals are flowing into markets in increasingly large quantities after a long period of sales of mainly cowpea crops. Adding to large local grain supplies, commercial grain imports from Nigeria are picking up considerably with the positive downward trend in the
Figure 2. Cereal production in Niger 2003-08 (millet, sorghum, corn, and rice)
Source: DSA/MDA and FEWS NET Niger

NIGER Food Security Update March 2009
Famine Early Warning Systems Network
4
exchange rate for the naira, which lost 25 percent of its value since November of last year, trading at an average of 325 nairas per 1,000 CFA francs in March, compared with an average of 300 nairas per 1,000 CFA francs in February. These good market supplies could last with the devaluation of the naira, though commercial inventories may dwindle with the expected rise in shipping costs due to new regulations requiring the use of weighbridges, whose implementation has been expected for several months now. The goal is to control the weight, loads and size of trucks used in shipping operations to prevent untimely damage to roadways. Fines for exceeding standard authorized weight limits are driving up shipping costs and being passed on to the consumer in prices for staple commodities. Right now, with the improvement in supplies and a faltering commercial demand with the devaluation of the naira, prices on retail grain markets are relatively stable, after the steady rise in prices over the last few months. However, prices are still running well above the nominal five‐year average and nominal prices for 2004/05, which was regarded as a crisis year (Price annex). With prices up by more than 30 percent in some cases (e.g., Abalak and Ouallam), good food availability on domestic markets is not translating into an improvement in food access. Business on livestock markets has slowed and involves mostly local traders. The devaluation of the naira vis‐à‐vis the CFA franc has sharply reduced demand for exports. Thus, despite a good supply of fattened animals still in fairly good condition, sales on livestock markets are generally slow, which is driving down the market value of livestock. With the decline in prices for livestock and the high level of grain prices, terms of trade are generally working against pastoralists. This could pose an ongoing problem with Nigerian traders increasingly turning their sights on grain crops, to the detriment of trade in livestock.
Figure 3. Terms of trade for male goats/millet on the NGuigmi (Diffa) market
Source: SIMA, SIMB, and FEWS NET Niger Figure 4. Terms of trade for male goats/millet on the Abalak (Tahoua) market
Source: SIMA, SIMB, and FEWS NET Niger

Famine Early Warning Systems Network i
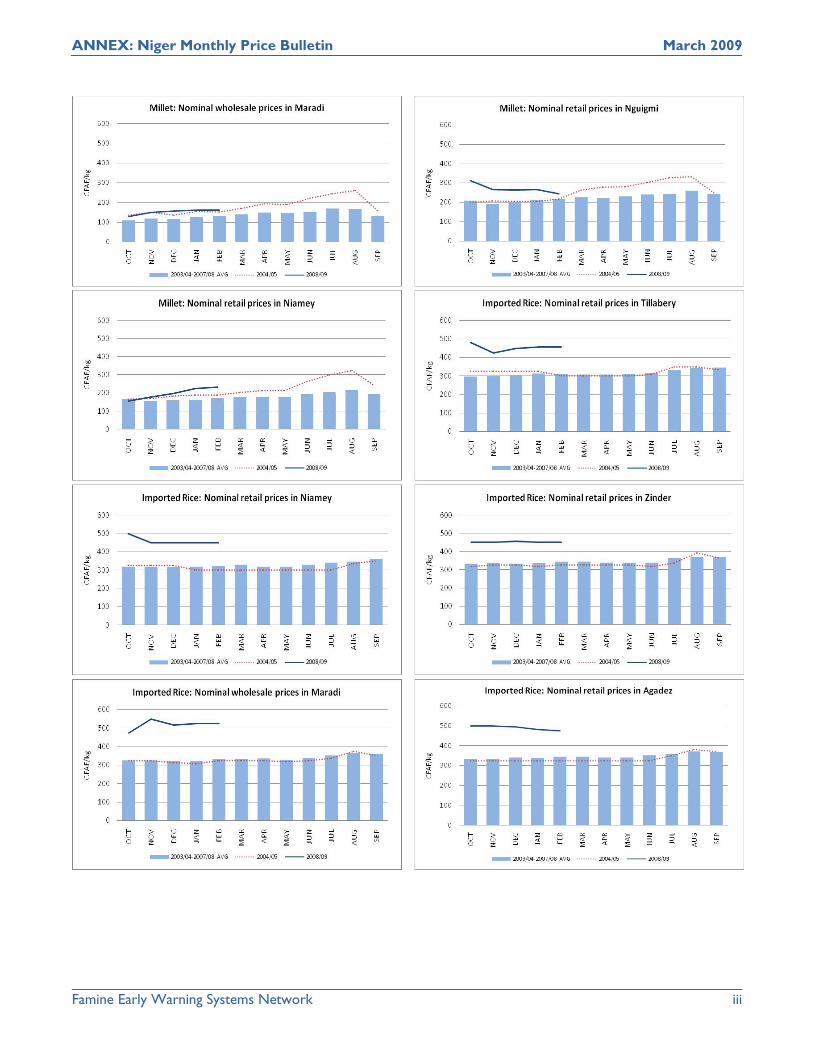
ANNEX: Niger Monthly Price Bulletin March 2009
Monthly prices are supplied by FEWS NET enumerators, local government agencies, market information systems, UN agencies, NGOs, and other network and private sector partners.
Millet, maize, cowpea (niébé), and imported rice are the most important food commodities. Millet is consumed by both rural and poor urban households throughout the country. Maize and imported rice are most important for urban households, while cowpea is mainly consumed by poor households in rural and urban areas as a protein source. Niamey is the most important national market and an international trade center, and also supplies urban households. Tillaberi is also an urban center that supplies the surrounding area. Gaya market represents a main urban market for maize with cross‐border connections. Maradi, Tounfafi, and Diffa are regional assembly and cross‐border markets for Niger and other countries in the region. These are markets where households and herders coming from the northern cereal deficit areas regularly buy their food. Agadez and Zinder are also important national and regional markets. Nguigmi and Abalak are located in pastoral areas, where people are heavily dependent on cereal markets for their food supply. They are particularly important during the rainy season, when herders are confined to the pastoral zone.

ANNEX: Niger Monthly Price Bulletin March 2009
Famine Early Warning Systems Network ii
ANNEX: Niger Monthly Price Bulletin March 2009
Famine Early Warning Systems Network iii