nifty 50 reports for the week (21st - 25th february '11)
TRANSCRIPT

8/7/2019 Nifty 50 Reports for the Week (21st - 25th February '11)
http://slidepdf.com/reader/full/nifty-50-reports-for-the-week-21st-25th-february-11 1/52 w w w . c a p i t a l v i a . c
o m
G LO BA L RESEA RCH LTD.
WEEKLYWEEKLY
STOCKS REPORTS21st Feb - 25t h Feb 201 1

8/7/2019 Nifty 50 Reports for the Week (21st - 25th February '11)
http://slidepdf.com/reader/full/nifty-50-reports-for-the-week-21st-25th-february-11 2/52
Technical Picture
Figure: 1 : Nifty50 Graph
WEEKLY
21st Feb t o 25th Feb 2011
R ES EA R C H
TECHNICAL OVERVIEW
ACC W E E K A H E A D
Weekly Pivots
A C C
The stock moved in sideways trend throughout this week. It has resistance at 1030; crossing
of this level may take the stock further upwards till the levels of 1045-1050 in coming
trading sessions else it may also bounce from resistance level. One has to wait for crossing of
level.
RESISTANCE 1030
SUPPORT 970
STOCK R2 R1 PP S1 S2
www.capitalvia.com 2
ACC 1036.97 1006.13 964.17 933.33 891.37

8/7/2019 Nifty 50 Reports for the Week (21st - 25th February '11)
http://slidepdf.com/reader/full/nifty-50-reports-for-the-week-21st-25th-february-11 3/52
Technical Picture
Figure: 2 : Nifty50 Graph
www.capitalvia.com
R ES EA R C H
3
TECHNICAL OVERVIEW
AMBUJA CEMENT W E E K A H E A D
Weekly Pivots
A M B H U J A
C E M E N T
The stock had a pull back from lower support levels and moved in an up rally this week. If it
manages to sustain above the level of 127, one may expect some more upward movement
in the stock till the levels of 130-134.50 in near term.
RESISTANCE 130
SUPPORT 119
STOCK R2 R1 PP S1 S2
WEEKLY
21st Feb t o 25th Feb 2011
AMBUJACEM 127.28 121.87 116.73 111.32 106.18

8/7/2019 Nifty 50 Reports for the Week (21st - 25th February '11)
http://slidepdf.com/reader/full/nifty-50-reports-for-the-week-21st-25th-february-11 4/52
Technical Picture
Figure: 3 : Nifty50 Graph
www.capitalvia.com
R ES EA R C H
4
TECHNICAL OVERVIEW
AXIS W E E K A H E A D
Weekly Pivots
A X I S
The stock continued its uptrend after taking support at lowers. It faces next resistance at
1351. A short t erm correction is expected in the stock, one could go for buy on dip strategy
in the stock as it is expected to continue its uptrend.
RESISTANCE 1351
SUPPORT 1265
STOCK R2 R1 PP S1 S2
WEEKLY
21st Feb t o 25th Feb 2011
AXISBANK 1297.1 1259.4 1204.7 1167 1112.3

8/7/2019 Nifty 50 Reports for the Week (21st - 25th February '11)
http://slidepdf.com/reader/full/nifty-50-reports-for-the-week-21st-25th-february-11 5/52
Technical Picture
Figure: 4 : Nifty50 Graph
www.capitalvia.com
R ES EA R C H
5
TECHNICAL OVERVIEW
BAJAJ AUTO W E E K A H E A D
Weekly Pivots
B A J A J A U T O
The stock is consolidating currently after a robust upward movement earlier this week. It
faces next resistance at 1392; crossing of t his level may bring some more upward movement
in the stock. One should wait for sometime in the stock as a short term correction is expected
in the stock after a continuous up rally.
RESISTANCE 1392
SUPPORT 1260
STOCK R2 R1 PP S1 S2
WEEKLY
21st Feb t o 25th Feb 2011
BAJAJ-AUTO 1317.3 1286.6 1238.3 1207.6 1159.3

8/7/2019 Nifty 50 Reports for the Week (21st - 25th February '11)
http://slidepdf.com/reader/full/nifty-50-reports-for-the-week-21st-25th-february-11 6/52
Technical Picture
Figure: 5 : Nifty50 Graph
www.capitalvia.com
R ES EA R C H
6
TECHNICAL OVERVIEW
BHEL W E E K A H E A D
Weekly Pivots
B H E L
The stock had an either side movement this week. It has next support at the level of 2030;
breach of this level may take the stock further southward while it has resistance at 2152,
crossing of this level may take it . One should wait for crossing of levels on either side before
taking any positions in the stock.
RESISTANCE 2152
SUPPORT 2030
STOCK R2 R1 PP S1 S2
WEEKLY
21st Feb t o 25th Feb 2011
BHEL 2307.92 2171.93 2085.02 1949.03 1862.12

8/7/2019 Nifty 50 Reports for the Week (21st - 25th February '11)
http://slidepdf.com/reader/full/nifty-50-reports-for-the-week-21st-25th-february-11 7/52
Technical Picture
Figure: 6 : Nifty50 Graph
www.capitalvia.com
R ES EA R C H
7
TECHNICAL OVERVIEW
BPCL W E E K A H E A D
Weekly Pivots
B P C L
The stock has successfully taken resistance at higher levels and moved in a down rally and is
consolidating near support levels from last a few trading sessions. It has next support at 565,
breach of this level may continue its bearish t rend else it may also bounce back f rom lower
support levels.
RESISTANCE 625
SUPPORT 580
STOCK R2 R1 PP S1 S2
WEEKLY
21st Feb t o 25th Feb 2011
BPCL 649.72 616.33 581.82 548.43 513.92
8/7/2019 Nifty 50 Reports for the Week (21st - 25th February '11)
http://slidepdf.com/reader/full/nifty-50-reports-for-the-week-21st-25th-february-11 8/52
Technical Picture
Figure: 7 : Nifty50 Graph
www.capitalvia.com
R ES EA R C H
8
TECHNICAL OVERVIEW
BHARTI AIRTEL W E E K A H E A D
Weekly Pivots
B H A R T I A I R T E L
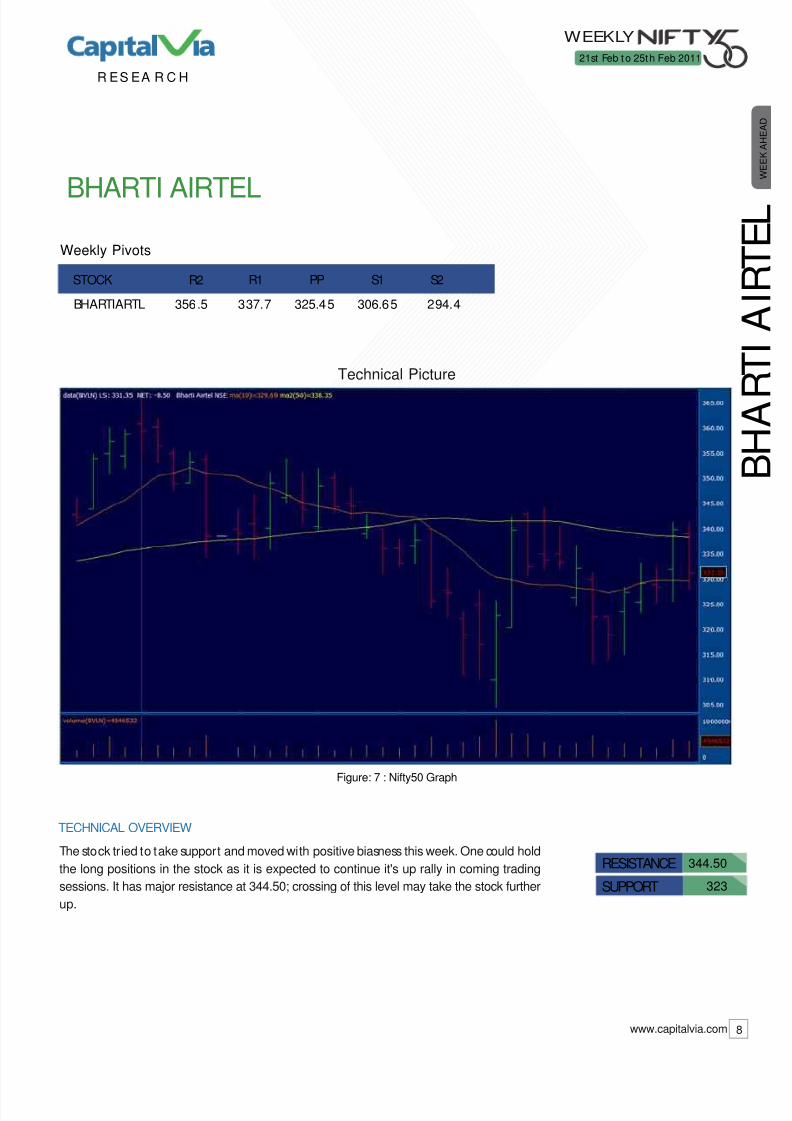
The stock tried to take support and moved with positive biasness this week. One could hold
the long positions in the stock as it is expected to continue it's up rally in coming trading
sessions. It has major resistance at 344.50; crossing of this level may take the stock further
up.
RESISTANCE 344.50
SUPPORT 323
STOCK R2 R1 PP S1 S2
WEEKLY
21st Feb t o 25th Feb 2011
BHARTIARTL 356.5 337.7 325.45 306.65 294.4

8/7/2019 Nifty 50 Reports for the Week (21st - 25th February '11)
http://slidepdf.com/reader/full/nifty-50-reports-for-the-week-21st-25th-february-11 9/52
Technical Picture
Figure: 8 : Nifty50 Graph
www.capitalvia.com
R ES EA R C H
9
TECHNICAL OVERVIEW
CIPLA W E E K A H E A D
Weekly Pivots
C I P L A
The stock consolidated throughout this week with negative biasness. It managed to breach
its major support level of 335 last week, it now has major support at 322, breach of this may
continue the bearish trend for the stock else it may get bounce back from its lower support
levels.
RESISTANCE 323
SUPPORT 300
STOCK R2 R1 PP S1 S2
WEEKLY
21st Feb t o 25th Feb 2011
CIPLA 336.05 323.6 309.95 297.5 283.85

8/7/2019 Nifty 50 Reports for the Week (21st - 25th February '11)
http://slidepdf.com/reader/full/nifty-50-reports-for-the-week-21st-25th-february-11 10/52
Technical Picture
Figure: 9 : Nifty50 Graph
www.capitalvia.com
R ES EA R C H
10
TECHNICAL OVERVIEW
CAIRN W E E K A H E A D
Weekly Pivots
C A I R N
The stock moved with negative biasness this week. It faces resistance at 330; crossing of this
may take the stock further upward while it has support at 311, breach of which may take the
stock downward.
RESISTANCE 330
SUPPORT 311
STOCK R2 R1 PP S1 S2
WEEKLY
21st Feb t o 25th Feb 2011
CAIRN 345.42 335.63 320.82 311.03 296.22

8/7/2019 Nifty 50 Reports for the Week (21st - 25th February '11)
http://slidepdf.com/reader/full/nifty-50-reports-for-the-week-21st-25th-february-11 11/52
Technical Picture
Figure: 10 : Nifty50 Graph
www.capitalvia.com
R ES EA R C H
11
TECHNICAL OVERVIEW
DLF W E E K A H E A D
Weekly Pivots
D L F
The stock had a steep pull back from lower levels earlier and then successfully took
resistance at higher levels and moved with negative biasness. It faces resistance at 255;
crossing of this level may take the stock further upwards while has support at 225.50, breach
of this level may take the stock downward.
RESISTANCE 255
SUPPORT 235
STOCK R2 R1 PP S1 S2
WEEKLY
21st Feb t o 25th Feb 2011
DLF 263.25 255.45 241.75 233.95 220.25

8/7/2019 Nifty 50 Reports for the Week (21st - 25th February '11)
http://slidepdf.com/reader/full/nifty-50-reports-for-the-week-21st-25th-february-11 12/52
Technical Picture
Figure: 11 : Nifty50 Graph
R ES EA R C H
TECHNICAL OVERVIEW
DR REDDY W E E K A H E A D
Weekly Pivots
D R R E D D Y
Dr.Reddy Lab. has positive closing in this week. The stock is trading in uptrend and above the
level of 1565 the stock may further continue the uptrend in the coming t ime. RESISTANCE 1565
SUPPORT 1510
STOCK R2 R1 PP S1 S2
www.capitalvia.com 12
WEEKLY
21st Feb t o 25th Feb 2011
DRREDDY 1631.08 1564.17 1521.08 1454.17 1411.08

8/7/2019 Nifty 50 Reports for the Week (21st - 25th February '11)
http://slidepdf.com/reader/full/nifty-50-reports-for-the-week-21st-25th-february-11 13/52
Technical Picture
Figure: 12 : Nifty50 Graph
R ES EA R C H
TECHNICAL OVERVIEW
GAIL INDIA W E E K A H E A D
Weekly Pivots
D R R E D D Y
GAIL India has flat closing in this week with the negative bias. The stock is trading below the
short and medium term moving average and looking weak. So below the support level some
more correction can be seen in it.
RESISTANCE 455
SUPPORT 435
STOCK R2 R1 PP S1 S2
www.capitalvia.com 13
WEEKLY
21st Feb t o 25th Feb 2011
GAIL 475.85 460.85 443.7 428.7 411.55

8/7/2019 Nifty 50 Reports for the Week (21st - 25th February '11)
http://slidepdf.com/reader/full/nifty-50-reports-for-the-week-21st-25th-february-11 14/52
Technical Picture
Figure: 13 : Nifty50 Graph
R ES EA R C H
TECHNICAL OVERVIEW
HCL W E E K A H E A D
Weekly Pivots
H C L
HCL has continued to t rade with the negative trend. The stock has weak closing and below
the level of 450 it may further continue the downtrend in the coming time. RESISTANCE 470
SUPPORT 450
STOCK R2 R1 PP S1 S2
www.capitalvia.com 14
WEEKLY
21st Feb t o 25th Feb 2011
W E E K A H E A D
HCLTECH 504.77 487.13 469.32 451.68 433.87

8/7/2019 Nifty 50 Reports for the Week (21st - 25th February '11)
http://slidepdf.com/reader/full/nifty-50-reports-for-the-week-21st-25th-february-11 15/52
Technical Picture
Figure: 14 : Nifty50 Graph
R ES EA R C H
TECHNICAL OVERVIEW
HDFC BANK W E E K A H E A D
Weekly Pivots
H D F C B A N K
HDFC Bank was closed with gains on wow basis. In today's session the stock has sharp
correction from the higher level and if it breaches the support level of 2125 then it may show
some more correction in the coming t ime.
RESISTANCE 2245
SUPPORT 2125
STOCK R2 R1 PP S1 S2
www.capitalvia.com 15
WEEKLY
21st Feb t o 25th Feb 2011
W E E K A H E A D
HDFCBANK 2112.17 2085.73 2033.57 2007.13 1954.97

8/7/2019 Nifty 50 Reports for the Week (21st - 25th February '11)
http://slidepdf.com/reader/full/nifty-50-reports-for-the-week-21st-25th-february-11 16/52
Technical Picture
Figure: 15 : Nifty50 Graph
R ES EA R C H
TECHNICAL OVERVIEW
HOUSING DEVELOPMENT FINANCE W E E K A H E A D
Weekly Pivots
H O U S
I N G D E V E L O P M E N T F I N A N C E
Housing Development Finance was closed with gains on wow basis. In today's session the
stock has sharp correction f rom the higher level and if it breaches the support level of 625
then it may show some more correction in the coming t ime.
RESISTANCE 665
SUPPORT 625
STOCK R2 R1 PP S1 S2
www.capitalvia.com 16
WEEKLY
21st Feb t o 25th Feb 2011
HDFC 654.25 638.7 610.5 594.95 566.75
8/7/2019 Nifty 50 Reports for the Week (21st - 25th February '11)
http://slidepdf.com/reader/full/nifty-50-reports-for-the-week-21st-25th-february-11 17/52
Technical Picture
Figure: 16 : Nifty50 Graph
R ES EA R C H
TECHNICAL OVERVIEW
HERO HONDA W E E K A H E A D
Weekly Pivots
H E R O
H O N D A
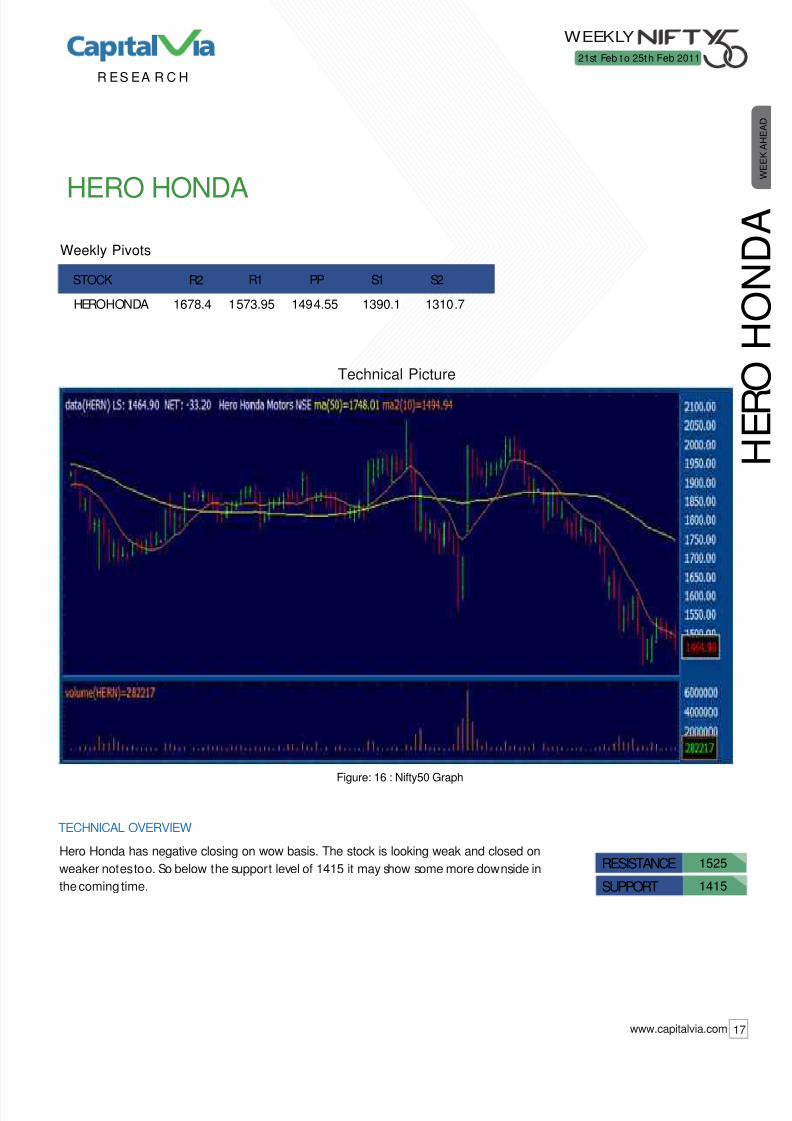
Hero Honda has negative closing on wow basis. The stock is looking weak and closed on
weaker notes too. So below the support level of 1415 it may show some more downside in
the coming time.
RESISTANCE 1525
SUPPORT 1415
STOCK R2 R1 PP S1 S2
www.capitalvia.com 17
WEEKLY
21st Feb t o 25th Feb 2011
HEROHONDA 1678.4 1573.95 1494.55 1390.1 1310.7

8/7/2019 Nifty 50 Reports for the Week (21st - 25th February '11)
http://slidepdf.com/reader/full/nifty-50-reports-for-the-week-21st-25th-february-11 18/52
Technical Picture
Figure: 17 : Nifty50 Graph
R ES EA R C H
TECHNICAL OVERVIEW
HINDALCO W E E K A H E A D
Weekly Pivots
H I
N D A L C O
Hindalco has quite t rading session in this week. The stock is trading in weak t rend and below
the level of 207 it may show some more correction in the coming t ime. RESISTANCE 218
SUPPORT 207
STOCK R2 R1 PP S1 S2
www.capitalvia.com 18
WEEKLY
21st Feb t o 25th Feb 2011
HINDALCO 254.55 232.75 217.15 195.35 179.75

8/7/2019 Nifty 50 Reports for the Week (21st - 25th February '11)
http://slidepdf.com/reader/full/nifty-50-reports-for-the-week-21st-25th-february-11 19/52
Technical Picture
Figure: 18 : Nifty50 Graph
R ES EA R C H
TECHNICAL OVERVIEW
HUL W E E K A H E A D
Weekly Pivots
H U L
HUL has continued to oscillate in the range of 267-283 in this week. The stock is not looking
lucrative in the short run and waits for proper breakout in it . RESISTANCE 283
SUPPORT 271
STOCK R2 R1 PP S1 S2
www.capitalvia.com 19
WEEKLY
21st Feb t o 25th Feb 2011
HINDUNILVR 282.42 275.78 272.07 265.43 261.72

8/7/2019 Nifty 50 Reports for the Week (21st - 25th February '11)
http://slidepdf.com/reader/full/nifty-50-reports-for-the-week-21st-25th-february-11 20/52
Technical Picture
Figure: 19 : Nifty50 Graph
R ES EA R C H
TECHNICAL OVERVIEW
ICICI BANK W E E K A H E A D
Weekly Pivots
I C I C I B A N K
ICICI Bank was closed with the gains on wow basis. In today's session the stock has sharp
correction rally and has weak closing too. So below the support level of 1010 some more
correction can be seen in it.
RESISTANCE 1075
SUPPORT 1010
STOCK R2 R1 PP S1 S2
www.capitalvia.com 20
WEEKLY
21st Feb t o 25th Feb 2011
WEEKLY
21st Feb t o 25th Feb 2011
ICICIBANK 1050.98 1025.77 982.78 957.57 914.58

8/7/2019 Nifty 50 Reports for the Week (21st - 25th February '11)
http://slidepdf.com/reader/full/nifty-50-reports-for-the-week-21st-25th-february-11 21/52
Technical Picture
Figure: 20 : Nifty50 Graph
R ES EA R C H
TECHNICAL OVERVIEW
IDFC W E E K A H E A D
Weekly Pivots
I D F C
IDFC was closed with the gains on wow basis. In today's session the stock has sharp
correction rally and has weak closing too. So below the support level of 139 some more
correction can be seen in it.
RESISTANCE 150.50
SUPPORT 139
STOCK R2 R1 PP S1 S2
www.capitalvia.com 21
WEEKLY
21st Feb t o 25th Feb 2011
IDFC 153.07 144.18 129.82 120.93 106.57

8/7/2019 Nifty 50 Reports for the Week (21st - 25th February '11)
http://slidepdf.com/reader/full/nifty-50-reports-for-the-week-21st-25th-february-11 22/52
Technical Picture
Figure: 21 : Nifty50 Graph
R ES EA R C H
TECHNICAL OVERVIEW
INFOSYS TECHNOLOGIES W E E K A H E A D
Weekly Pivots
I N F O S
Y S T E C H N O L O G I E S
Infosys in from the last few trading session was moving sideways and it was down by 0.42
%. It is now taking support at 3074 and resistance at 3164 form this level either side of
movement would be expected. It has resistance at 3164 above this it would be in an upward
trend else below 3074 it would might face more selling pressure.
RESISTANCE 3164
SUPPORT 3074
STOCK R2 R1 PP S1 S2
www.capitalvia.com 22
WEEKLY
21st Feb t o 25th Feb 2011
INFOSYSTCH 3212.98 3126.92 3073.63 2987.57 2934.28
8/7/2019 Nifty 50 Reports for the Week (21st - 25th February '11)
http://slidepdf.com/reader/full/nifty-50-reports-for-the-week-21st-25th-february-11 23/52
Technical Picture
Figure: 22 : Nifty50 Graph
R ES EA R C H
TECHNICAL OVERVIEW
ITC W E E K A H E A D
Weekly Pivots I T C
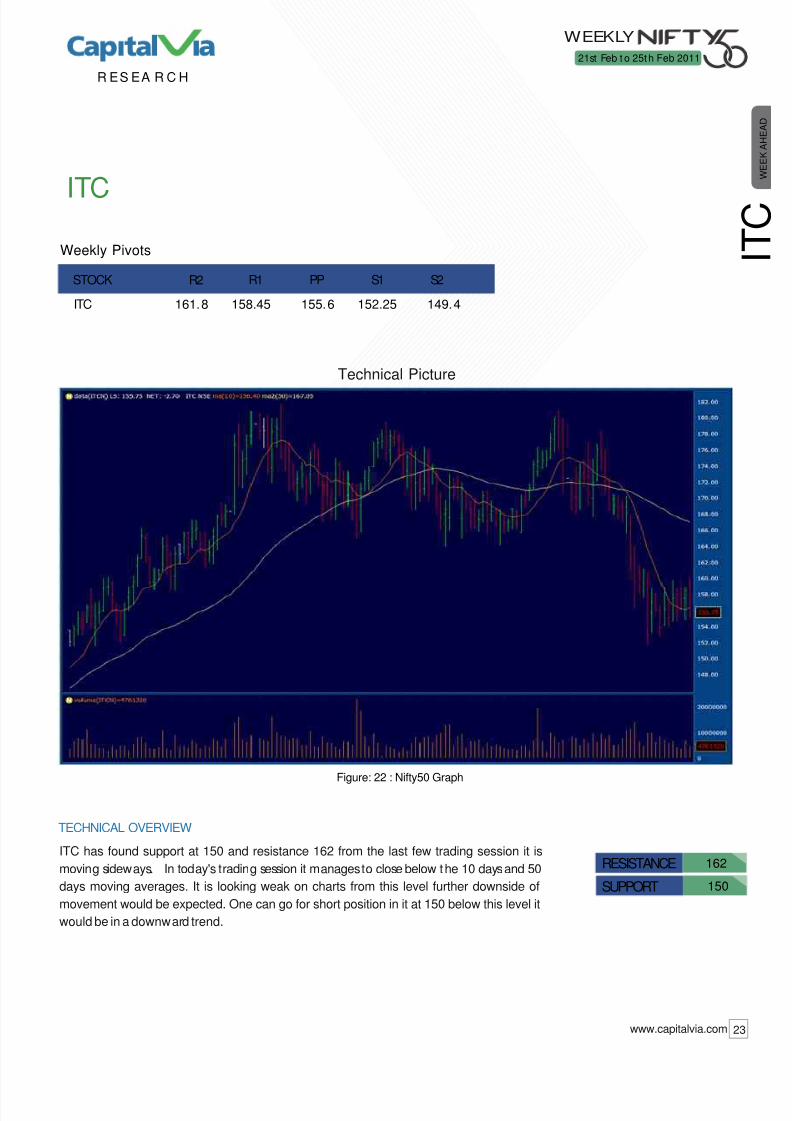
ITC has found support at 150 and resistance 162 from the last few trading session it is
moving sideways. In today's trading session it manages to close below the 10 days and 50
days moving averages. It is looking weak on charts from this level further downside of
movement would be expected. One can go for short position in it at 150 below this level it
would be in a downward trend.
RESISTANCE 162
SUPPORT 150
STOCK R2 R1 PP S1 S2
www.capitalvia.com 23
WEEKLY
21st Feb t o 25th Feb 2011
ITC 161.8 158.45 155.6 152.25 149.4

8/7/2019 Nifty 50 Reports for the Week (21st - 25th February '11)
http://slidepdf.com/reader/full/nifty-50-reports-for-the-week-21st-25th-february-11 24/52
Technical Picture
Figure: 23 : Nifty50 Graph
R ES EA R C H
TECHNICAL OVERVIEW
JAIPRAKASH ASSOCIATES W E E K A H E A D
Weekly Pivots
J A I P R A
K A S H A S S
O C I A T E S
Jaiprakash Associates battered down to 84.30 levels form 92.30. It is looking weak on charts
from the last few trading session was moving sideways and in today's trading session it was
down by 5.65 % from this level further down side of movement would be expected. It
has resistance at 95 above this level it would be bullish in t rend else below 82 it would might
face more selling pressure.
RESISTANCE 95
SUPPORT 82
STOCK R2 R1 PP S1 S2
www.capitalvia.com 24
WEEKLY
21st Feb t o 25th Feb 2011
JPASSOCIAT 96.6 89.25 79.65 72.3 62.7

8/7/2019 Nifty 50 Reports for the Week (21st - 25th February '11)
http://slidepdf.com/reader/full/nifty-50-reports-for-the-week-21st-25th-february-11 25/52
Technical Picture
Figure: 24 : Nifty50 Graph
R ES EA R C H
TECHNICAL OVERVIEW
JINDAL STEEL & POWER W E E K A H E A D
Weekly Pivots
J I N D A L S T E E L &
P O W E R
Jindal Steel & Power gave smart recovery from 677 levels which served as a strong support
level. It is now taking support at 677 and resistance at 710. It is looking positive in the
coming trading session if it manages to trade above the resistance level of 710 else below
667 it would might test the next support level of 646.
RESISTANCE 710
SUPPORT 677
STOCK R2 R1 PP S1 S2
www.capitalvia.com 25
WEEKLY
21st Feb t o 25th Feb 2011
JINDALSTEL 670.62 643.53 623.72 596.63 576.82

8/7/2019 Nifty 50 Reports for the Week (21st - 25th February '11)
http://slidepdf.com/reader/full/nifty-50-reports-for-the-week-21st-25th-february-11 26/52
Technical Picture
Figure: 25 : Nifty50 Graph
R ES EA R C H
TECHNICAL OVERVIEW
LARSEN AND TOUBRO W E E K A H E A D
Weekly Pivots
L A R
S E N A N D
T O U B R O
L&T from the last few trading session was moving sideways in today's trading session it was
up by 3.32 % . It is taking support at 1616 and resistance at 1733. It is looking bearish in the
coming trading session if it manages to trade below the support level of 1615 else above the
resistance level of 1700 it would be in an upward trend.
RESISTANCE 1700
SUPPORT 1615
STOCK R2 R1 PP S1 S2
www.capitalvia.com 26
WEEKLY
21st Feb t o 25th Feb 2011
LT 1658.03 1607.07 1534.03 1483.07 1410.03

8/7/2019 Nifty 50 Reports for the Week (21st - 25th February '11)
http://slidepdf.com/reader/full/nifty-50-reports-for-the-week-21st-25th-february-11 27/52
Technical Picture
Figure: 26 : Nifty50 Graph
R ES EA R C H
TECHNICAL OVERVIEW
KOTAK MAHINDRA BANK W E E K A H E A D
Weekly Pivots
K O T A K
M A H I N D R
A B A N K
Kotak Mahindra Bank gave recovery from the level of 333 which made to trade above the 10
days and 50 days moving averages. In today's trading session it was moving sideways from
this level downside movement would be expected. It is looking weak on charts below 400 it
would be in a bearish trend. One can go for short position in it at 400 for the target of 380.
RESISTANCE 425
SUPPORT 400
STOCK R2 R1 PP S1 S2
www.capitalvia.com 27
WEEKLY
21st Feb t o 25th Feb 2011
KOTAKBANK 414.03 396.07 364.53 346.57 315.03

8/7/2019 Nifty 50 Reports for the Week (21st - 25th February '11)
http://slidepdf.com/reader/full/nifty-50-reports-for-the-week-21st-25th-february-11 28/52
Technical Picture
Figure: 27 : Nifty50 Graph
R ES EA R C H
TECHNICAL OVERVIEW
MAHINDRA & MAHINDRA W E E K A H E A D
Weekly Pivots
M A H I N
D R A & M A
H I N D R A
M&M is making bearish engulf ing pattern it is a sign of bearishness, from this level further
downside movement would be expected. It has support at 636 and resistance at 680. One
can go for short position in it at 645 for the target of 620.
RESISTANCE 680
SUPPORT 636
STOCK R2 R1 PP S1 S2
www.capitalvia.com 28
WEEKLY
21st Feb t o 25th Feb 2011
M&M 718.2 691.7 655.3 628.8 592.4

8/7/2019 Nifty 50 Reports for the Week (21st - 25th February '11)
http://slidepdf.com/reader/full/nifty-50-reports-for-the-week-21st-25th-february-11 29/52
Technical Picture
Figure: 28 : Nifty50 Graph
R ES EA R C H
TECHNICAL OVERVIEW
MARUTI SUZUKI INDIA W E E K A H E A D
Weekly Pivots
M A R U T I S U Z U
K I I N D I A
It is taking support at 1212 and resistance at 1256, a pulled back from the support level of
1145 made it to trade above the 10 days and 50 days moving averages. In today's trading
session it was up by 0.05 % averages. It is looking bullish in the coming trading session if it
manages to trade above the resistance level of 1256 else below 1212 it would be in an
bearish trend
RESISTANCE 1256
SUPPORT 1212
STOCK R2 R1 PP S1 S2
www.capitalvia.com 29
WEEKLY
21st Feb t o 25th Feb 2011
MARUTI 1231.78 1206.57 1175.78 1150.57 1119.78

8/7/2019 Nifty 50 Reports for the Week (21st - 25th February '11)
http://slidepdf.com/reader/full/nifty-50-reports-for-the-week-21st-25th-february-11 30/52
Technical Picture
Figure: 29 : Nifty50 Graph
R ES EA R C H
TECHNICAL OVERVIEW
NTPC W E E K A H E A D
Weekly Pivots
N T P C
NTPC from the last few trading session was moving sideways and it closed near to the
support level of 177, from this level further downside movement would be expected. It is
taking support at 177 and resistance at 183. It is looking bearish in the coming trading
session if it manages to break the support level of 177 below this it may test the next support
level of 170.
RESISTANCE 183
SUPPORT 177
STOCK R2 R1 PP S1 S2
www.capitalvia.com 30
WEEKLY
21st Feb t o 25th Feb 2011
NTPC 188.22 182.53 176.27 170.58 164.32

8/7/2019 Nifty 50 Reports for the Week (21st - 25th February '11)
http://slidepdf.com/reader/full/nifty-50-reports-for-the-week-21st-25th-february-11 31/52
Technical Picture
Figure: 30 : Nifty50 Graph
R ES EA R C H
TECHNICAL OVERVIEW
ONGC W E E K A H E A D
Weekly Pivots
O N G C
ONGC is looking weak on charts in today's trading session it was down by 3.40 %. It is now
taking resistance at 288 and support at 265, f rom this level further downside of movement
would be expected. If it breaks the support level of 265 it may test the next support level of
258 else above 288 it might be in a bullish trend.
RESISTANCE 288
SUPPORT 265
STOCK R2 R1 PP S1 S2
www.capitalvia.com 31
WEEKLY
21st Feb t o 25th Feb 2011
ONGC 321.68 299.37 282.18 259.87 242.68

8/7/2019 Nifty 50 Reports for the Week (21st - 25th February '11)
http://slidepdf.com/reader/full/nifty-50-reports-for-the-week-21st-25th-february-11 32/52
Technical Picture
Figure: 31 : Nifty50 Graph
R ES EA R C H
TECHNICAL OVERVIEW
POWER GRID CORPORATION OF INDIA W E E K A H E A D
Weekly Pivots
P O W E
R G R I D C O R
P O R A T I O N O F I N D I A
In today's trading session it was down by 0.51 % from the few t rading session it is moving in
a particular price range of 95-100. It is now taking resistance at 101 and support at 94, from
this level either side of movement would be expected. One can go for long position in it at
100 above this level it would be bullish in trend.
RESISTANCE 100
SUPPORT 94
STOCK R2 R1 PP S1 S2
www.capitalvia.com 32
WEEKLY
21st Feb t o 25th Feb 2011
ONGC 321.68 299.37 282.18 259.87 242.68

8/7/2019 Nifty 50 Reports for the Week (21st - 25th February '11)
http://slidepdf.com/reader/full/nifty-50-reports-for-the-week-21st-25th-february-11 33/52
Technical Picture
Figure: 32 : Nifty50 Graph
R ES EA R C H
TECHNICAL OVERVIEW
PUNJAB NATIONAL BANK W E E K A H E A D
Weekly Pivots
P U N J A B N A T I O N A L B A N K
After making a low of 989.90 it is continuously moving in an upward trend, it is now trading
at 1095.05 and it was down by 1.12 %. It has resistance at 1139 and support at 1080. It is
looking positive in the coming t rading session if it manages to t rade above resistance level of
1139 else below 1080 it would be in bearish trend.
RESISTANCE 1122
SUPPORT 1080
STOCK R2 R1 PP S1 S2
www.capitalvia.com 33
WEEKLY
21st Feb t o 25th Feb 2011
PNB 1128.45 1081.2 1025.75 978.5 923.05
8/7/2019 Nifty 50 Reports for the Week (21st - 25th February '11)
http://slidepdf.com/reader/full/nifty-50-reports-for-the-week-21st-25th-february-11 34/52
Technical Picture
Figure: 33 : Nifty50 Graph
R ES EA R C H
TECHNICAL OVERVIEW
RANBAXY W E E K A H E A D
Weekly Pivots
R
A N B A X Y
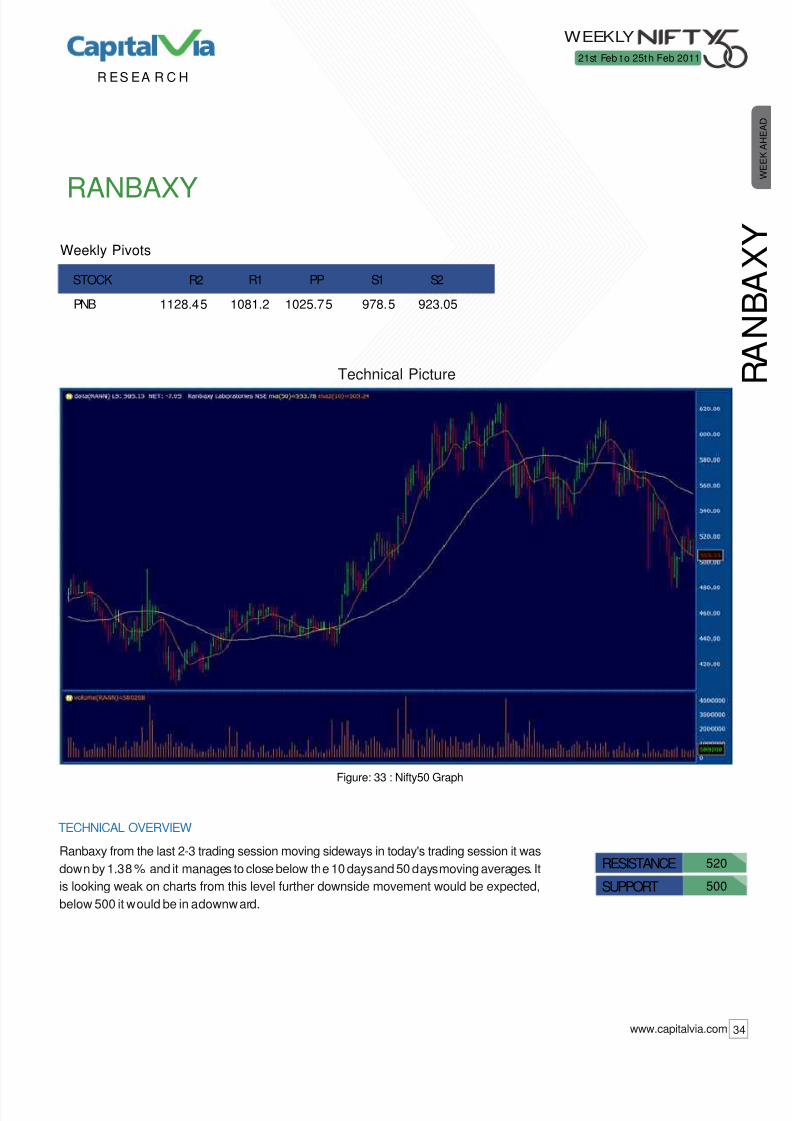
Ranbaxy from the last 2-3 trading session moving sideways in today's trading session it was
down by 1.38 % and it manages to close below the 10 days and 50 days moving averages. It
is looking weak on charts from this level further downside movement would be expected,
below 500 it would be in a downward.
RESISTANCE 520
SUPPORT 500
STOCK R2 R1 PP S1 S2
www.capitalvia.com 34
WEEKLY
21st Feb t o 25th Feb 2011
PNB 1128.45 1081.2 1025.75 978.5 923.05

8/7/2019 Nifty 50 Reports for the Week (21st - 25th February '11)
http://slidepdf.com/reader/full/nifty-50-reports-for-the-week-21st-25th-february-11 35/52
Technical Picture
Figure: 34 : Nifty50 Graph
R ES EA R C H
TECHNICAL OVERVIEW
RELIANCE CAPITAL W E E K A H E A D
Weekly Pivots
R E L I A N C E
C A P I T A L
Reliance capital battered down to 388 f rom 726 levels. In today's trading session it a short
recovery from the support level made it to turn into green in the first half of the session. It is
now taking support at 423 and resistance at 491. One can go for short position in it at 423
below this level it would might face more selling pressure.
RESISTANCE 491
SUPPORT 423
STOCK R2 R1 PP S1 S2
www.capitalvia.com 35
WEEKLY
21st Feb t o 25th Feb 2011
RELCAPITAL 555.28 491.97 440.18 376.87 325.08

8/7/2019 Nifty 50 Reports for the Week (21st - 25th February '11)
http://slidepdf.com/reader/full/nifty-50-reports-for-the-week-21st-25th-february-11 36/52
Technical Picture
Figure: 35 : Nifty50 Graph
R ES EA R C H
TECHNICAL OVERVIEW
RELIANCE COMMUNICATION W E E K A H E A D
Weekly Pivots
R E L I A N C
E C O M M U N
I C A T I O N
Reliance communication from the last few trading session was moving sideways and in
today's trading session it manages to move and close below the 10 days and 50 days moving
averages. It is looking weak on charts below support level of 89 it would be in a bearish
trend. One can go for short position in it at 96 below this level it would might face more
selling pressure.
RESISTANCE 102
SUPPORT 89
STOCK R2 R1 PP S1 S2
www.capitalvia.com 36
WEEKLY
21st Feb t o 25th Feb 2011
RCOM 129.88 113.52 101.63 85.27 73.38

8/7/2019 Nifty 50 Reports for the Week (21st - 25th February '11)
http://slidepdf.com/reader/full/nifty-50-reports-for-the-week-21st-25th-february-11 37/52
Technical Picture
Figure: 36 : Nifty50 Graph
R ES EA R C H
TECHNICAL OVERVIEW
RELIANCE INDUSTRIES W E E K A H E A D
Weekly Pivots
R
E L I A N C E I N D U S T R I E S
It is taking resistance at 968 and support at 910. It is looking bullish in the coming trading
session, one can go for long position in at 968 else below 910 it would be in a downward
trend.
RESISTANCE 968
SUPPORT 910
STOCK R2 R1 PP S1 S2
www.capitalvia.com 37
WEEKLY
21st Feb t o 25th Feb 2011
RELIANCE 964.98 937.47 911.28 883.77 857.58

8/7/2019 Nifty 50 Reports for the Week (21st - 25th February '11)
http://slidepdf.com/reader/full/nifty-50-reports-for-the-week-21st-25th-february-11 38/52
Technical Picture
Figure: 37 : Nifty50 Graph
R ES EA R C H
TECHNICAL OVERVIEW
RELIANCE INFRAUSTRUCTURE W E E K A H E A D
Weekly Pivots
R E L I A N C E I N F R A U S T R U C T U R E
Reliance Infra is looking weak on chart in today's trading session it was down by 5.84 %
from this level further downside movement would be expected. It is taking support at 559
and resistance at 653. Once can go for short position in it at 559 below this level it might be
in a bearish t rend.
RESISTANCE 653
SUPPORT 559
STOCK R2 R1 PP S1 S2
www.capitalvia.com 38
WEEKLY
21st Feb t o 25th Feb 2011
RELINFRA 797.68 707.42 599.73 509.47 401.78

8/7/2019 Nifty 50 Reports for the Week (21st - 25th February '11)
http://slidepdf.com/reader/full/nifty-50-reports-for-the-week-21st-25th-february-11 39/52
Technical Picture
Figure: 38 : Nifty50 Graph
R ES EA R C H
TECHNICAL OVERVIEW
RELIANCE POWER W E E K A H E A D
Weekly Pivots
R E L I A N C E P O W E R
The stock had an up rally earlier this week after a steep downfall previously then resisting at
higher levels it had a sharp downfall in the last trading session with losses up to 5.8% . it has
support at 110 and resistance at 124. An either side movement is expected till it crosses any
of the levels on either side.
RESISTANCE 124
SUPPORT 110
STOCK R2 R1 PP S1 S2
www.capitalvia.com 39
WEEKLY
21st Feb t o 25th Feb 2011
RPOWER 142 128.45 117.45 103.9 92.9

8/7/2019 Nifty 50 Reports for the Week (21st - 25th February '11)
http://slidepdf.com/reader/full/nifty-50-reports-for-the-week-21st-25th-february-11 40/52
Technical Picture
Figure: 39 : Nifty50 Graph
R ES EA R C H
TECHNICAL OVERVIEW
SIEMENS W E E K A H E A D
Weekly Pivots
S I E M E N S
The stock continued to consolidate at higher levels this week as well. One has to wait for
crossing of levels on either side before taking any positions in it . RESISTANCE 863
SUPPORT 828
STOCK R2 R1 PP S1 S2
www.capitalvia.com 40
WEEKLY
21st Feb t o 25th Feb 2011
SIEMENS 862.02 853.08 847.07 838.13 832.12

8/7/2019 Nifty 50 Reports for the Week (21st - 25th February '11)
http://slidepdf.com/reader/full/nifty-50-reports-for-the-week-21st-25th-february-11 41/52
Technical Picture
Figure: 40 : Nifty50 Graph
R ES EA R C H
TECHNICAL OVERVIEW
STERLITE W E E K A H E A D
Weekly Pivots
S T E R L I T E
The stock is consolidated throughout this week. It has resistance at 168; crossing of this level
may take the stock upwards while it has support at 159.50, breach of this level may take the
stock further downward.
RESISTANCE 168
SUPPORT 159.50
STOCK R2 R1 PP S1 S2
www.capitalvia.com 41
WEEKLY
21st Feb t o 25th Feb 2011
STER 181.4 171.1 161.6 151.3 141.8

8/7/2019 Nifty 50 Reports for the Week (21st - 25th February '11)
http://slidepdf.com/reader/full/nifty-50-reports-for-the-week-21st-25th-february-11 42/52
Technical Picture
Figure: 41 : Nifty50 Graph
R ES EA R C H
TECHNICAL OVERVIEW
STATE BANK OF INDIA W E E K A H E A D
Weekly Pivots
S T A T E B A N K O F I N D I A
The stock has successfully taken support at lower levels and moved in an uptrend this week.
After a continuous up rally, it consolidated in today's trading session. One could hold the
long positions in the stock as it is expected to continue its bullish trend.
RESISTANCE 2815
SUPPORT 2720
STOCK R2 R1 PP S1 S2
www.capitalvia.com 42
WEEKLY
21st Feb t o 25th Feb 2011
SBIN 2797.07 2694.83 2585.57 2483.33 2374.07

8/7/2019 Nifty 50 Reports for the Week (21st - 25th February '11)
http://slidepdf.com/reader/full/nifty-50-reports-for-the-week-21st-25th-february-11 43/52
Technical Picture
Figure: 42 : Nifty50 Graph
R ES EA R C H
TECHNICAL OVERVIEW
SAIL W E E K A H E A D
Weekly Pivots
S A I L
The stock is currently moving in sideways trend. It has resistance at 166 while support at 150.
One has to wait for crossing of levels on either side before taking any positions in the stock. RESISTANCE 166
SUPPORT 150
STOCK R2 R1 PP S1 S2
www.capitalvia.com 43
WEEKLY
21st Feb t o 25th Feb 2011
SAIL 170.88 165.57 158.53 153.22 146.18

8/7/2019 Nifty 50 Reports for the Week (21st - 25th February '11)
http://slidepdf.com/reader/full/nifty-50-reports-for-the-week-21st-25th-february-11 44/52
Technical Picture
Figure: 43 : Nifty50 Graph
R ES EA R C H
TECHNICAL OVERVIEW
SUN PHARMACEUTICAL W E E K A H E A D
Weekly Pivots
S U N P H A R M A C
E U T I C A L
Sun Pharma closed with the gains on wow basis. The stock has quite and positive trading
session in this week. So a decisive breakout above the resistance level of 437 may continue
the uptrend in the short run.
RESISTANCE 437
SUPPORT 410
STOCK R2 R1 PP S1 S2
www.capitalvia.com 44
WEEKLY
21st Feb t o 25th Feb 2011
SUNPHARMA 443.65 430.95 412.05 399.35 380.45

8/7/2019 Nifty 50 Reports for the Week (21st - 25th February '11)
http://slidepdf.com/reader/full/nifty-50-reports-for-the-week-21st-25th-february-11 45/52
Technical Picture
Figure: 44 : Nifty50 Graph
R ES EA R C H
TECHNICAL OVERVIEW
SUZLON W E E K A H E A D
Weekly Pivots
S U Z L O N
Suzlon has sharp correction rally in the last trading session. The stock has weak closing and
near the crucial support level of 47. So below the support it may show some more downside
in the coming time.
RESISTANCE 51
SUPPORT 47
STOCK R2 R1 PP S1 S2
www.capitalvia.com 45
WEEKLY
21st Feb t o 25th Feb 2011
SUZLON 55.65 50.7 46.75 41.8 37.85

8/7/2019 Nifty 50 Reports for the Week (21st - 25th February '11)
http://slidepdf.com/reader/full/nifty-50-reports-for-the-week-21st-25th-february-11 46/52
Technical Picture
Figure: 45 : Nifty50 Graph
R ES EA R C H
TECHNICAL OVERVIEW
TCS W E E K A H E A D
Weekly Pivots
T C S
TCS has flat closing in this week with the negative bias. So below the support level of 1075
some more downtrend may be seen in it. RESISTANCE 1135
SUPPORT 1075
STOCK R2 R1 PP S1 S2
www.capitalvia.com 46
WEEKLY
21st Feb t o 25th Feb 2011
TCS 1223.93 1156.77 1106.33 1039.17 988.73

8/7/2019 Nifty 50 Reports for the Week (21st - 25th February '11)
http://slidepdf.com/reader/full/nifty-50-reports-for-the-week-21st-25th-february-11 47/52
Technical Picture
Figure: 46 : Nifty50 Graph
R ES EA R C H
TECHNICAL OVERVIEW
TATA MOTOR W E E K A H E A D
Weekly Pivots
T A T A
M O T O R
Tata motor has flat closing in this week with the negative bias. So below the support level of
1190 some more downt rend may be seen in it . RESISTANCE 1265
SUPPORT 1190
STOCK R2 R1 PP S1 S2
www.capitalvia.com 47
WEEKLY
21st Feb t o 25th Feb 2011
TATAMOTORS 1239.23 1190.97 1121.73 1073.47 1004.23

8/7/2019 Nifty 50 Reports for the Week (21st - 25th February '11)
http://slidepdf.com/reader/full/nifty-50-reports-for-the-week-21st-25th-february-11 48/52
Technical Picture
Figure: 47 : Nifty50 Graph
R ES EA R C H
TECHNICAL OVERVIEW
TATA STEEL W E E K A H E A D
Weekly Pivots
T A
T A S T E E L
Tata steel has witnessed large profit booking at the higher level. The stock has bearish
engulfing pattern in it and if sustains below the level of 635 then some more correction can
be seen in it.
RESISTANCE 665
SUPPORT 635
STOCK R2 R1 PP S1 S2
www.capitalvia.com 48
WEEKLY
21st Feb t o 25th Feb 2011
TATASTEEL 675.7 635.5 605.3 565.1 534.9

8/7/2019 Nifty 50 Reports for the Week (21st - 25th February '11)
http://slidepdf.com/reader/full/nifty-50-reports-for-the-week-21st-25th-february-11 49/52
Technical Picture
Figure: 48 : Nifty50 Graph
R ES EA R C H
TECHNICAL OVERVIEW
TATA POWER W E E K A H E A D
Weekly Pivots
T A T A
P O W E R
Tata power losses half of its initial gain in this week. The stock has weak closing and below
the immediate support level some more profit booking can be seen in it . RESISTANCE 1300
SUPPORT 1250
STOCK R2 R1 PP S1 S2
www.capitalvia.com 49
WEEKLY
21st Feb t o 25th Feb 2011
TATAPOWER 1278.47 1239.03 1197.57 1158.13 1116.67

8/7/2019 Nifty 50 Reports for the Week (21st - 25th February '11)
http://slidepdf.com/reader/full/nifty-50-reports-for-the-week-21st-25th-february-11 50/52
Technical Picture
Figure: 49 : Nifty50 Graph
R ES EA R C H
TECHNICAL OVERVIEW
SESA GOA W E E K A H E A D
Weekly Pivots
S E S A G O A
The stock is consolidating currently after a sharp recovery previously. It has next support at
280; breach of this level may take the stock further down while it has resistance at 317,
crossing of these may take the stock upward.
RESISTANCE 317
SUPPORT 306
STOCK R2 R1 PP S1 S2
www.capitalvia.com 50
WEEKLY
21st Feb t o 25th Feb 2011
SESAGOA 342.18 318.07 299.28 275.17 256.38

8/7/2019 Nifty 50 Reports for the Week (21st - 25th February '11)
http://slidepdf.com/reader/full/nifty-50-reports-for-the-week-21st-25th-february-11 51/52
Technical Picture
Figure: 50 : Nifty50 Graph
R ES EA R C H
TECHNICAL OVERVIEW
WIPRO W E E K A H E A D
Weekly Pivots
W I P R O
Wipro has positive closing in this week but witnessed profit booking at the level of 442 and
shown some correction from there. The stock has immediate support level of 428 and below
which if it sustains then some more downside momentum may be seen in it in the short run.
RESISTANCE 442
SUPPORT 428
STOCK R2 R1 PP S1 S2
www.capitalvia.com 51
WEEKLY
21st Feb t o 25th Feb 2011
WIPRO 456.35 438.3 422.9 404.85 389.45

8/7/2019 Nifty 50 Reports for the Week (21st - 25th February '11)
http://slidepdf.com/reader/full/nifty-50-reports-for-the-week-21st-25th-february-11 52/52
R ES EA R C H
Disclaimer
The information and views in this report, our website & all the service we provide are believed to be reliable, but we do
not accept any responsibility (or liabilit y) for errors of fact or opinion. Users have the right to choose the product/s that
suits them the most.
Sincere efforts have been made to present the right investment perspective. The
information contained herein is based on Ahead and up on sources that we consider reliable.This material is for personal information and
based upon it & take no responsibility
The stock price projections shown are not necessarily indicative of future price performance. The information herein,
together with all estimates and forecasts, can change without notice.
Analyst or any person related to CapitalVia might be holding positions in the stocks recommended.
It is understood that anyone who is browsing through the site has done so at his free will and does not read any views
expressed as a recommendation for which either the site or its owners or anyone can be held responsible for.
Any surfing and reading of the information is the acceptance of this disclaimer.
All Rights Reserved.
Investment in Stocks has its own risks.
We, however, do notvouch for the accuracy or the completeness thereof. we are not
responsible for any loss incurred whatsoever for any financial profits or loss which
may arise from the recommendations above.
CapitalVia does not purport to be an invitation or an offer to buy or sell any financial instrument.
Our Clients (Paid Or Unpaid), Any third party or anyone else have no rights to forward or share our calls or SMS or Report
or Any Information Provided by us to/with anyone which is received directly or indirectly by them. If found so then
Serious Legal Actions can be taken.
WEEKLY
21st Feb t o 25th Feb 2011