ni pollution monitoring & weather station contest final report
TRANSCRIPT

NI Pollution Monitoring & Weather Station Contest
Final Report
Submitted By:
Qatar University
College Of Engineering
Department of Electrical Engineering
Names of Students:
Abdulrahman Samir Al-Assi
Ahmad Mirdad Khan
Alaa Mousa Altawalbeh
Ayat Rebhi Al-Aswad
Dalal Lutfi Ayesh
Ihab Jihad Aljayyousi
Nada Ahmed Hussein
Reem Subhi Al Disi
Saad Abdulati Elasad
Supervised by:
Prof. Mohieddine Benammar and
Dr. Farid Touati

1 | P a g e
Contents Acknowledgment ............................................................................................................................................ 2
Dedication ..................................................................................................................................................... 2
1. Abstract ..................................................................................................................................................... 3
2. Introduction ............................................................................................................................................... 3
3. Literature review ......................................................................................................................................... 4
3.1 Related works ........................................................................................................................................ 4
3.2 WHO Air Quality guidelines ..................................................................................................................... 5
4. Significance ................................................................................................................................................ 6
5. Objectives .................................................................................................................................................. 6
6. Design realistic constraints ........................................................................................................................... 7
7. Methodology .............................................................................................................................................. 8
8. Architecture ............................................................................................................................................... 9
8.1. Block Diagram ....................................................................................................................................... 9
9. System Design and Implementation ............................................................................................................ 11
9.1 Network Design ....................................................................................................................................... 11
9.2. Sensors and Electronics Design ............................................................................................................. 13
9.3 Remote Server Design........................................................................................................................... 20
10. Results and Discussion ............................................................................................................................. 25
10.1 The snapshots of the LabVIEW device and program: ............................................................................... 25
10.2 Discussion of the results ...................................................................................................................... 26
10.3 Potential for solar energy (PV and thermal) and wind energy .................................................................. 27
10.4 System Enhancement ......................................................................................................................... 29
11. Conclusion .............................................................................................................................................. 30
References ................................................................................................................................................... 31
Appendix A: Rooftop of QU CENG PV panels .................................................................................................... 32

2 | P a g e
Acknowledgment
We would like to thank Prof. Mohieddine Benammar and Dr. Farid Touati for their guidance and
professional advice throughout this project. We are in debt to Eng. Antonio Gonzalez for his support in
designing the LabVIEW VI and to Eng. Mohammed Elsayed for his effort in ordering the hardware
components. Also, we would like to acknowledge to cooperation of the Department of Chemical
Engineering in the calibration of gas sensors. Last but not the least, would like to thank National Instruments
for shedding light onto regional environmental concerns through this competition.
Dedication
We dedicate this project to all the heroes of today who spent time and effort to protect the environment and
preserve nature. We dedicate this project to all the heroes who stand fearlessly in the face of irresponsible
activities and businesses that selfishly profit on the expense of mother earth.

3 | P a g e
1. Abstract
Air pollution is one the most crucial factors affecting the quality of life and health of increasingly urban
populations; a country with a fast-growing economy based on hydrocarbons such as Qatar is not an
exception. In addition to the adverse impact of air pollution on humans, animals and plants, the presence
of dust and air-borne particulate matter affect negatively the efficiency of Solar Panels used for power
generation. In the present project, a comprehensive wireless solution is proposed for monitoring the level
of harmful gases both indoor and outdoor. Additionally, since there is a correlation between gas levels and
weather variables, the latters are also measured. The proposed system enables measurement of the levels
of the known harmful gases CO2, NO2 and CH4, dust, temperature, humidity, solar irradiance, pressure,
wind-direction and wind speed. Data is collected by appropriate sensors nodes that communicate
wirelessly (using IEEE 802.15.4 protocol) with a host computer that process, store and display the collected
information. The software part of the project has been developed under LabVIEW environment. The
complete system has been implemented and successfully tested in a chosen site within Qatar University
Campus. In the long term, we hope that the data collected from our air quality monitoring system will help
in future areas of research related to environmental monitoring and assessment of efficiency of PV cells.
The present report gives details about the design of the proposed system, its implementation, calibration
and field deployment and testing.
2. Introduction
National Instruments Company focuses on raising the standards of life through its technology to lead to
strong, tough and stable future company. They transform the way the engineers and scientists around the
world design prototypes and deploy systems for test, control and embedded design applications. Using NI
provided graphical programming software and modular hardware to increase productivity and to reduce the
time to market. NI technology is used to continuously develop innovative technologies that impact millions
of people by improving the industry in fields like electrical power, oil and gas, wind energy and automotive.
Also there are a lot of application that were developed by NI as embedded control, machine design, medical,
data logging, robotic, solar power plant control and communication.
One of the greatest problems that the world is facing nowadays is that the environmental pollution that
increases rapidly day after day causing critical damages to our health, life style and environment [1-3].
Environmental pollution consists namely of five basic types; air, water, soil, noise and light. g Knowing
these facts, our project “NI Pollution Monitoring & Weather Station Contest” focuses on measuring
different types of harmful substances that are effecting our health in the short and long terms. In addition to
measuring outdoor variables, the most important part of our project is to measure temperature, pressure,
humidity, CO2, CH4 indoors. Qatar and other Gulf states are known for their hot climate, high humidity,
lack of natural green spaces, high carbon footprint related to the oil and gas industry, high living standard
and availability of indoor recreation facilities. These factors orient most of the population in Qatar to spend
most of their time indoors, that’s why it is important to measure these environmental indicators. This
experiment will help the Scientists to control and maintain a normal environment for Qatar community to
live in, the people to become more aware of the risks and to make a smart system to help in minimizing
them.

4 | P a g e
In the State of Qatar, through its ambitious Qatar National Vision 2030 (QNV2030), there is a challenging
task to strike a balance between rapid economic growth based essentially on Liquefied Natural Gas (LNG)
production, social development and environmental protection. In addition to its thriving natural gas-based
industries, the country is expanding massively due to an urgent need to infrastructure capacity, which has
raised a concern about the ability of the atmosphere to process pollutants and safely remove them. The
various entities and government agencies concerned with the topic of Indoor & Outdoor AQ (IOAQ) have
been contacted. It was found that Qatar (and the Gulf Region) does not specify IOAQ guidelines but relies
on international institutions for reference. Qatar carbon footprint (per capita) is the highest in the world and
Qatar and its region are lagging behind in tackling the problem of pollution and its negative impact.
Recently, intensive activities have been relentlessly witnessed in an attempt to address the problem. The
QNV2030 associated Qatar National Development Strategy 2011-2016 (QNDS 2011-2016), through a set
of well-defined recommendations, stresses on the need to address the issues of environment and air pollution
[4]. As was reported in the press lately in April 2011, Qatar is embarking on developing a national policy to
manage air pollution, greenhouse gas emissions and the broader challenges of climate change [5]. In
response to QNDS 2011-2016 recommendations, Qatar Ministry of Environment (QME) has been
considering major projects through its dedicated Strategy Technical Committee and Environmental Impact
Assessment Team. Also, the Qatar Forum on “The Grand Challenges for Engineering: Global Perspective
and Local Outlook” held in September 2012 and organized by Texas A&M University at Qatar & QU
resulted in a white paper that defines how to establish a roadmap for implementing the QNDS 2011-2016
where protection of the environment was a focus. Moreover, the panelists of the "First Qatar Clean Air
Research (QCAR) Workshop", held at the institution Environmental Study Centre (ESC) on 22-24 April
2012 clearly highlighted the need to monitoring and assessing AQ through deliberate research to inform AQ
policy and community education on related issues.
In addition, local universities and colleges, as main stakeholders in the development matrix, have the
mandate to prepare young engineers to play a key role, through undergraduate and graduate courses as well
as projects (e.g. QNRF-UREP) in environment management and AQ monitoring and control. The main
outcome of all these endeavors would be the development of Qatar AQ Strategy that would impose
regulation through legislation. This NI competition subject foster developing that sought AQ Strategy.
3. Literature review
3.1 Related works There were many preceding researches and papers that were facilitated to acquire the knowledge and the
information to achieve our aim and build our weather station one of these researches is the one below.
A previous research was done outdoor in Nashville, Tennessee called “Near road air quality monitoring
research”. The reason why they were concerned to do such a research is that living, working, or going to
school near major roadways has been associated with numerous adverse health endpoints such as respiratory
effects (e.g., asthma, bronchitis), cardiovascular effects, adverse birth outcomes/developmental effects,
premature mortality and cancer. More than 1,000 compounds have been identified in exhaust and
evaporative emissions from mobile sources, many of them with known health implications for example
NAAQS Pollutants
Air Toxics
Particulate Matter

5 | P a g e
Other air pollutant emissions from mobile sources are identified to be:
Tire wear
Brake wear
Re-suspended road dust
Noise
When the measurement was done the most pollutants identified were:
NAAQS pollutants
o Carbon monoxide
o Nitrogen oxides (NO/NO2/NOx)
o Particulate Matter Mass (PM10, PM2.5)
Air Toxics
o Benzene
o Metals
PM constituents
o Ultrafine particles from combustion
o Black carbon (elemental carbon, soot)
3.2 WHO Air Quality guidelines
The 2005 amended World Health Organization Air Quality Guidelines (WHO-AQGs) recommend limits
(see Table 1) for the concentration of selected outdoor air pollutants, namely, particulate matter (PM), ozone
(O3), nitrogen dioxide (NO2) and sulfur dioxide (SO2), applicable across all WHO regions. It is well known
that PM10 and PM2.5 are closely relevant to people health; therefore, this study will consider only these
PMs. The WHO Air quality guidelines represent the most widely agreed and up-to-date assessment of health
effects of air pollution, recommending targets for air quality at which the health risks are significantly
reduced. Despite the established links between health and IAQ, the WHO has developed related guidelines
only in 2010 [6] whilst other relevant guidelines are developed by ASHREA.
Table 1: Recommended limits for air pollutants
Particulate Matter Ozone Nitrogen dioxide Sulfur dioxide
PM2.5 PM10 O3 NO2 SO2
2005 WHO Air
quality guidelines
10 μg/m3 annual
mean
25 μg/m3 24-
hour mean
20 μg/m3 annual
mean
50 μg/m3 24-
hour mean
100 μg/m3 8-
hour mean
40 μg/m3 annual
mean
200 μg/m3 1-
hour mean
20 μg/m3 24-
hour mean
500 μg/m3 10-
minute mean
U.S. EPA
recommended
limits for air
pollutants
35 µg/m3 24-
hour mean
150 µg/m3 24-
hour mean
0.075 ppm 8-
hour mean
0.053 ppm
Annual mean
0.03 ppm annual
mean
0.14 ppm 24-
hour mean (1)
(1) Not to be exceeded more than once per year

6 | P a g e
4. Significance
The outcome of the proposed project will add values to the existing knowledge and techniques in the area of
AQ assessment and management. Significant added values are:
Develop awareness, knowledge capacity and know-how in young engineers who will assume current
challenges the world is/will be facing.
Provide stepping stones to the final resolution of the Engineering Grand Challenges of Environment
Protection (forum) in the State of Qatar through junior researchers.
Involvement in community service like involvement in national committees such as the Strategy
Technical Committee and Environmental Impact Assessment Team of Qatar Ministry of Environment
(QME).
Whilst enhancing awareness of such a global challenge, it also engages engineers, scientists, industry
representatives, local funding agencies (e.g. QNRF) and policy makers in a common research area. This
would foster building integrated management system and recognizing the contributions of academic
institutions in Qatar in addressing contemporary challenges.
Improve the scientific knowledge about the nature, scale and effect of air pollution in Qatar. This would
provide further incentives to regulate air pollution and avoid critical lag between this knowledge and the
implementation of timely and appropriate legislation.
Build local and regional partnerships and network in this strategic area (e.g. worldwide universities
participating in this NI competition, QME, Qatar National Food Security Program, Qatar Energy and
Environment Research Center, Qatar Environment Studies Center). This will develop a long-term
partnership with stakeholders to ensure continuity of this effort and widening of its scope.
5. Objectives
The overall objective of this project aims at designing innovatively a smart platform applicable to
indoor/outdoor AQ an weather monitoring in Qatar that holds the promise of identifying major
indoor/outdoor air pollutants along with helping junior engineers developing soft skills and technical
solutions, in an attempt to be part of the whole process of environmental protection and management the
country is witnessing. This constitutes an area of increasing interest to the region because of its unique
climatic conditions, massive development and heavy-concentration oil/gas industry.
Specific objectives are:
i. Develop an outdoor/indoor AQ and weather monitoring system that records and monitors air pollutants
and weather parameters and which can be demonstrated at Qatar University and worldwide throughout
all phases of this NI competition. This system has to be scalable.
ii. Conduct an experimental study to identify major indoor/outdoor air pollutants in a range of campus
sites by tracking trends in AQ and weather conditions over an extended time window.
iii. Determine compliance with International Ambient AQ Standards (e.g. WHO).
iv. Determine whether or not there is a potential of solar PV
v. Foster developing technical as well as soft skills of engineering students through such high-profile
experimental research experience by addressing one of the alarming issues in the region and the world
(thank you NI).

7 | P a g e
Expected outcomes
The following outcomes shall emanate from this work:
Design of a wireless sensor network based on NI devices integrating appropriate sensors for
measurement of indoor/outdoor pollutants along with weather parameters.
Development of a remote server that regularly records & monitors levels of air pollutants (with overall
Air Quality Index) as well climatic and environmental parameters.
Development of the necessary algorithms for assessing AQ levels in a reliable manner.
Comparison of these levels to international standards.
Exposure to challenging engineering design competitions of high-caliber like National Instrument (NI)
Pollution Monitoring and Weather Station Contest. Through stringent requirements, such competitions
put a lot of constraints and pose challenges to student-designers which foster developing solid problem
solving skills.
Dissemination of findings through reports to NI juries worldwide in addition to the relevant
governmental entities in Qatar, participation in forums, and conference/journal publications.
6. Design realistic constraints
As any engineering design, there are certain constraints that will influence all design phases. For this project,
we have to cope with the following constraints:
1. Using NI: We should use NI products; all sensors; NI ELVISE breadboard, and NI Lab View software.
2. Cost effective: the cost of the system should stay below QAR ?????. In this in-house-made design, the
students should strive for as-cheap-as possible system while meeting all the constraints. Also, the design
should feature flexibility for upgrade without incurring significant cost increase.
3. Harsh environment: the design should be reliable and can withstand the country harsh environment
featuring high temperature, high radiation, high relative humidity, and dust.
4. Time: The deadline for submitting the final report to NI jury is set to April 25, 2013 firm. Therefore,
this is abiding and thus we have to cope with along with the various assignments and exams in courses
we are taking in this semester (Spring 2013).
5. Health and Safe Usage: Health and safety issues are to be considered in all steps of the design,
implementation, and testing.
6. Environmental: The design should infer no environmental adverse effects by selecting appropriate parts
(recyclable, not emitting toxic gases nor materials, etc.).
7. Manufacturability: Our solution has to be made from easy-to-buy easy-to-fabricate/integrate
components using off-the-shelf components.
8. Sustainability: The results and recommendations at the end will be helpful for others to build on and
continue improving the whole system by adding other features aiming at improved versions that will
capitalize on recommendations.
9. Legality: No direct political or legal issues should be raised by this project under the provision that
again we are abiding by the university regulations.
10. Social impact: This project should change the social paradigm on environment, giving a positive impact
on how engineering solutions contribute to improving the welfare of the society through resources and
environment conservation.

8 | P a g e
7. Methodology
In order to achieve the above objectives, we proceeded as follows:
i. Survey of indoor/outdoor AQ (IOAQ) Assessment and Monitoring Systems: survey indicators relevant
to gas pollutants and particulate matters. Also, identify the requirements for commissioning an
optimized, cost effective, and scalable wireless sensor network for IOAQ monitoring and assessment
purpose.
ii. Preliminary IOAQ Measurements in Sample Locations and Selection of Sensors: determine, through
preliminary measurements, the most critical pollutants in Qatar and hence select appropriate sensors
from NI (types and characteristics) for purchase to achieve the project objectives. Also, appropriate
weather sensors will be purchased (ambient temperature, relative humidity, wind speed and direction,
and solar irradiation).
iii. Development of IOAQ Wireless Sensor Network (IOAQ-WSN): design sensor nodes and integrate
them into a wireless star network centered on a central unit (or gateway from NI). Issues of reliability,
robustness, and node power have to be considered.
iv. Integration of IOAQ-WSN with a Wide-Area Connectivity Network: connect the gateway to a server
via fttp. Remote pcs log onto the server through a customized website to monitor AQI as well as
measured IOAQ data (real-time and past).
v. Data Analysis: analyze indoor/outdoor pollutants concentrations and climatic and environmental
parameters (e.g. temperature, humidity, wind data, solar irradiance), and then:
a) Compare recorded levels to WHO standards (eventually alarm on critical IOAQ levels).
b) Identify potential of solar energy to reduce greenhouse gases (GHGs).
The system will be designed to collect measurement at three different locations (1 outdoor and 2 indoor) as
follows; however, this can easily be extended to include many more sites.
a) Indoor: we decided to measure the following parameters for an office and a lab in the College of
Engineering of Qatar University (QU CENG).
o Ambient Temperature
o Humidity
o Atmospheric Pressure
o
It is unnecessary to measure Wind Speed and Direction, Precipitation Level and Solar Irradiance.
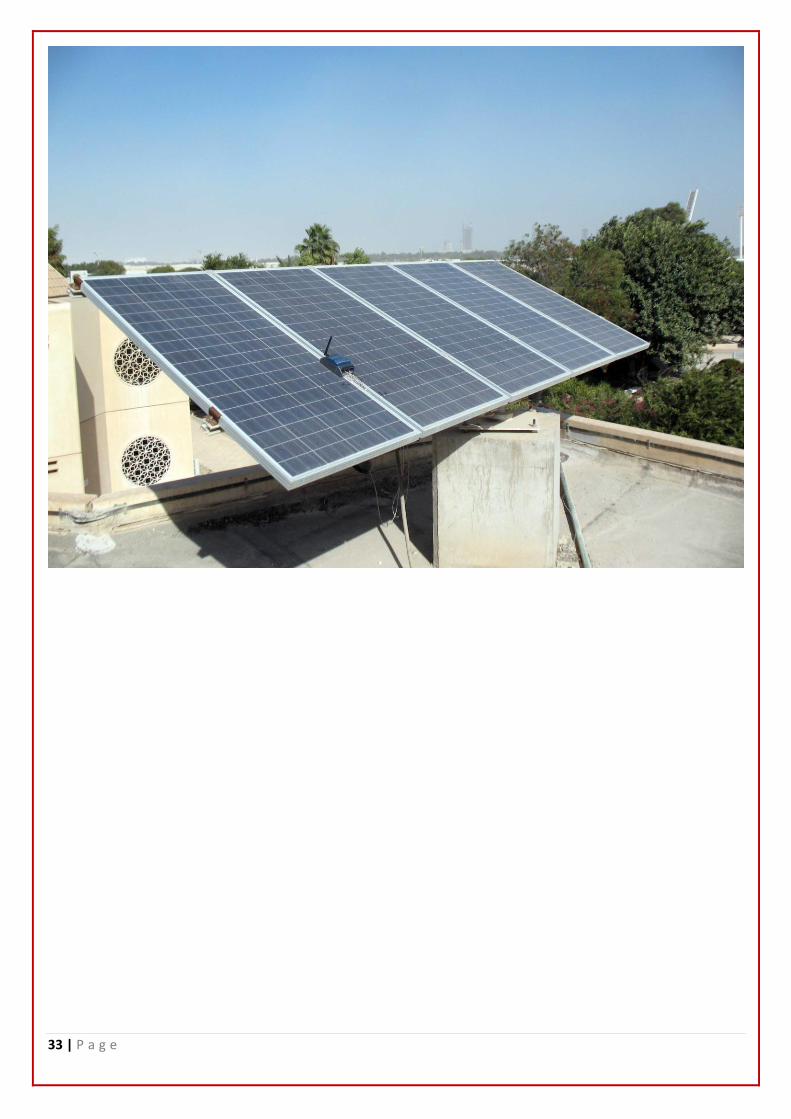
b) Outdoor: we decided to measure the following parameters on the rooftop of the corridor of QU
CENG using one sensor node and one multiplexer (see appendix A):
o Ambient Temperature
o Humidity
o Atmospheric Pressure
o o Wind Speed and Direction
o Precipitation Level
o Solar Irradiance
o Dust (Particulate Matters)
After measuring the data, we will analyze for the following purposes:
a) To check if it is efficient to use PV cells or wind turbines to generate power in the area.
b) To check the pollution levels and alarm the users if it reaches the limits of the air quality standards.

9 | P a g e
We have chosen these two purposes for two main reasons:
i. First, the rooftop of the corridor is already covered by solar panels, and this constitutes an excellent
opportunity dedicated to check solar PV efficiency with the presence of omnipresent factors like
wind and dust.
ii. Second, the Qatar National Vision 2030 (QNV2030) associated Qatar National Development
Strategy 2011-2016 (QNDS 2011-2016), through a set of well-defined recommendations, stresses on
the need to address the issues of environment and air pollution. As was reported in the press lately in
April 2011, Qatar is embarking on developing a national policy to manage air pollution, greenhouse
gas emissions and the broader challenges of climate change. This is an active for so many private and
governmental institutions in Qatar such as Chevron and Green Golf today in Qatar Science and
Technology Park (QSTP), Qatar Ministry of Environment (QME) which has been considering major
projects through its dedicated Strategy Technical Committee and Environmental Impact Assessment
Team, and the Qatar Forum on “The Grand Challenges for Engineering: Global Perspective and
Local Outlook” held in September 2012 and organized by Texas A&M University at Qatar & QU
which resulted in a white paper that defines how to establish a roadmap for implementing the QNDS
2011-2016 where protection of the environment was a focus. Finally, this project complements the
current project of Qatar Air Pollution Surveillance System (QAPSS, [7]), which is carried out by Qatar
Mobile Innovations Centre (QMIC at QSTP of Qatar Foundation, previously called QUWIC) in collaboration
with The Health, Safety, Security & Environment Directorate of Qatar Foundation.
On the other hand, since the Precipitation Level in Doha is very low and there is almost no agriculture, so
we found it unnecessary to analyze the level of precipitation to help check if the area is suitable for certain
type of agriculture. We also decided on not doing the weather prediction since this would require advanced
knowledge like Artificial Neural Network (ANN).
8. System architecture
Figures 1-3 show the system architecture, block diagram, and process operation of the proposed system.
8.1. Block Diagram
At the center of the wireless network, there exists the gateway (NI WSN-9791) that will send and receives
signals to and from the network nodes (three NI WSN-3202). The wireless sensor nodes are distributed at
desired locations within the range of the gateway where the required parameters to be sensed can be
measured. The sensor node provides analog input connection with each parameter transducer; which consists
of the sensor itself and its required signal conditioning block. A computer running NI LabVIEW is directly
connected to the gateway in order to store, process, and to display both numerically and graphically the
information extracted from the signals transmitted by the nodes and received by the gateway. The computer
continuously runs a LabVIEW VI which is a computer program that will provide all the necessary
abstraction required for acquiring the signals from the gateway, processing them, and finally displaying and
drawing suitable inferences from them. Finally, the computer used also hosts an FTP server which can be
accessed from anywhere within the university WLAN network coverage. The LabVIEW VI is also
programmed to periodically log and update a .HTML report that is saved on the host FTP directory. This
report can be accessed by browsing into the host computer network address.

10 | P a g e
Figure 2: The block diagram and operation process of the proposed system.
Figure 1: system architecture

11 | P a g e
Figure 3: process flow chart
9. System Design and Implementation
9.1 Network Design
This system utilizes a wireless sensor network used to sense various climatic and air quality parameters, and
then send it to a processing unit through a gateway for signal processing. In telecommunications, a network
can simply be defined as a collection of terminals, links, and nodes.
The terminals of the network are the devices that we wish to make a communication between (In our case it
is the sensors and the computer). Terminals can be thought of as the starting and ending points of the
network, hence the name terminals. The links are the channels that connect the terminals and the nodes. The
nodes are connection points, either a redistribution point or a communication endpoint. Nodes can loosely be
thought of as in-between terminals that join the links in their work to communicate signals between the main
terminals of the network.
These three elements of networks mentioned above (the terminals, the links, and the nodes) can be
connected in various ways; the way these elements are connected is called the topology of the network. Over
the years many standard topologies have been established. Each topology has its advantages and
disadvantages, thus the choice can only be made depending on the nature of the network required itself.
Listed below a few examples of standard network topologies:

12 | P a g e
Point-to-point
Bus
Star
Ring
Mesh
Tree
Hybrid
Daisy chain
Figure 4: Diagram of different network topologies
Building the Network
Again we go back to the fundamental three elements of a network; terminals; links, and nodes. We will set
up each one of these elements individually then the chosen topology will be applied to connect the elements.
Network Terminals
The main terminal of the network is the NI WSN-9792 gateway connected to a server computer via
Ethernet.
Network Links
The channels linking the gateway with the wireless sensor nodes are based on IEEE 802.115.4 standard.
Network Nodes
A sensor node is a node in a wireless sensor network that is capable of performing some processing,
gathering sensory information and communicating with other connected nodes in the network. A mote is a
node but a node is not always a mote.
We have chosen to use NI WSN-3202 general purpose node. The wireless sensor nodes allow for the
connection of the sensing transducers. The signals from the transducers are then received by the gateway
and displayed on a LabVIEW executable program
Since each node has four analog inputs, and the number of parameters to be measured at each location
exceeds this value, analog multiplexers were used to control the flow of the input parameters to the nodes.
Following this analogy, the number of nodes at each location was reduced to one. This idea is better
illustrated in the figure 5.

13 | P a g e
Figure 5: an illustration for using a MUX to reduce the number of nodes involved in the design
Network Topology
We have chosen to use star topology for the following reasons:
Simpler to implement
The network covers a relatively small area thus there are no problems with signal weakening.
The network is set-up in campus and can be easily accessed and fixed in case of a problem.
9.2. Sensors and Electronics Design
The various sensors have to be calibrated to ensure that the readings and information given by the
system are reliable. The sensors were calibrated in the Chemical Engineering Department of Qatar
University. Nevertheless, the output of the sensors (transducers) have to be conditioned in order to match the
analog input full scale range of the node to reduce errors in A/D conversion at the node. In the LabVIEW
program, the received signal levels will be translated into physical quantities (temperature, RH, dust,
methane, etc.) using the calibration equations. The powering of the sensors and behind electronics is made
from batteries. The team is studying powering from solar using appropriate PV modules and required power
electronics (buck-boost DC-DC converters).
The calibration and conditioning of the different sensors are described below. References [8-15] were
surveyed to understand calibration of sensors and conditioning of sensor’s signal.
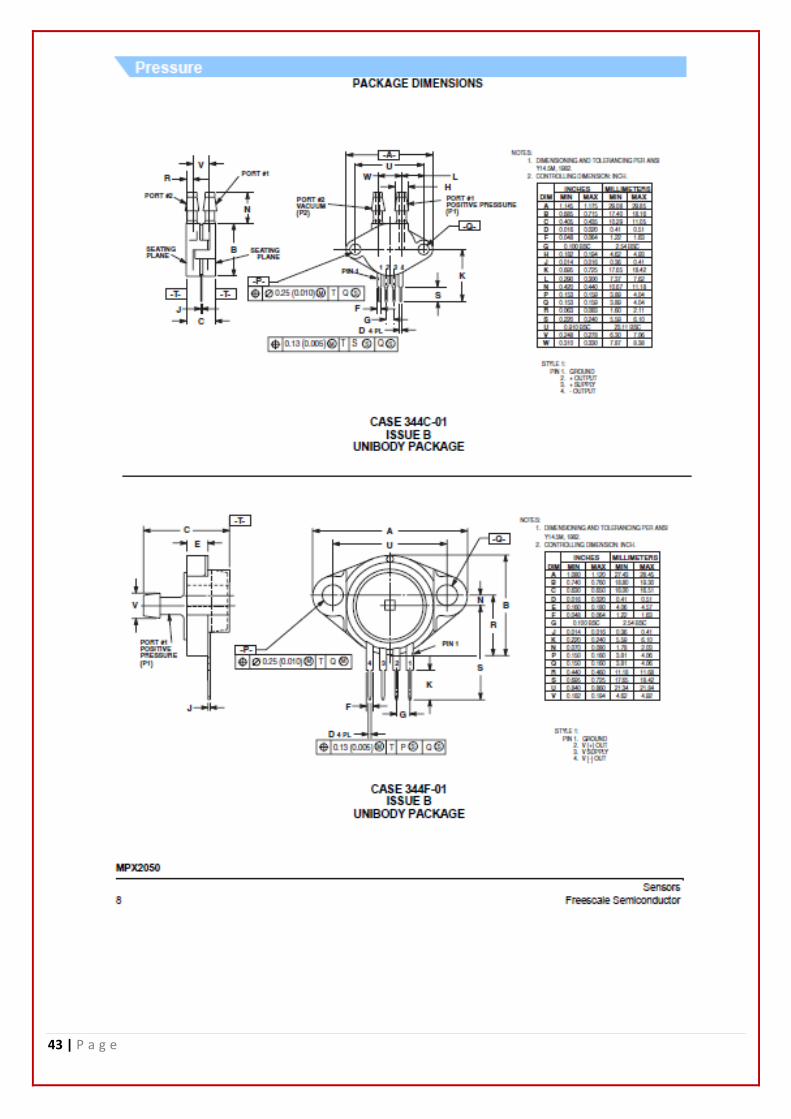
a) Pressure sensor:
Calibration curve
The sensor was already calibrated by the manufacturer and might need calibration after 2-3 years, figure 6
shows the calibration curve obtained from the sensor’s datasheet (Appendix B).

14 | P a g e
Figure 6: pressure sensor calibration curve
Conditioning circuit
Figure 7: the conditioning circuit designed for Pressure sensor.
( ) ( )

15 | P a g e
b) Dust sensor:
Calibration process
To calibrate the dust sensor we first placed the sensor in a clean environment, than we exposed it to smoke
with different densities. We used Matlab to plot the curve.
ation curveCalibr
Figure8: shows the calibration curve we obtained for dust sensor.
Conditioning circuit
Figure 9: the conditioning circuit designed for dust sensor.
( )

16 | P a g e
c) Precipitation sensor:
Calibration process
To calibrate this sensor, we placed the sensor in different amounts of precipitations and used Matlab to plot
the curve.
Calibration curve
Figure 10: the calibration curve we obtained for precipitation sensor.
Conditioning circuit
Figure 11: shows the conditioning circuit designed for precipitation sensor.
( )

17 | P a g e
We have used the circuit in figure # for the liquid level sensor. The reason behind having the 2k resistor is to
achieve the maximum power transfer at normal condition. This is because the sensor impedance value is
changeable, however, under normal condition it is estimated as 2k ohm.
d) Solar irradiance sensor:
Calibration process
The calibration curve was obtained from previous work done by a Qatar University student.
Calibration curve
Figure 12: the calibration curve we obtained for solar irradiance sensor.
Conditioning circuit
Figure 13: the conditioning circuit designed for solar irradiance sensor.
( )
(
) ( )
1
10
100
1000
10000
100000
1 10 100 1000 10000 100000
Re
sist
ance
(Ω
)
Light intensity (Lux)
Experimental Estimated

18 | P a g e
e) Methane sensor:
Calibration process
Since it is hard to create an environment full of methane, we used the sensor’s calibration curve from its
datasheet (Appendix B). The problem was that the curve in the datasheet was between the methane
concentration and the resistance and we wanted a direct relationship with the output voltage. To do that, we
had to find the resistance in which the environment is 80% – 90% full of oxygen. (Not 100% oxygen). After
placing the sensor in that environment, with the help of the chemical engineering department, we obtained
that resistance (which is used in the circuit design) and found a relationship between the methane
concentration and the output voltage. We used Matlab to plot the curve.
Calibration curve
Figure 14: shows the calibration curve for solar irradiance sensor using MATLAB
Conditioning circuit
Figure15: shows the conditioning circuit designed for Methane sensor.
( )

19 | P a g e
We used a value of 20k ohm for RL which is the same as RS in the fresh air. In order to measure the value of
VOut, we have placed the system in a closed environment with oxygen.
f) Ambient temperature sensor:
Calibration process
Using the Digiac 1750 Transducers and Instrumentation kit available at Qatar University, we applied
different temperature values on the sensor and plotted the curve using Matlab.
Calibration curve
Figure 16: shows the calibration curve we obtained for ambient temperature sensor.
Conditioning circuit
The output of the ambient temperature sensor (LM45-IC) does need conditioning since the sensor is of IC
type and generates volts order.
( )
( )
g) Relative humidity sensor:
Calibration process
The calibration curve was obtained by three of Qatar University students in a previous project for the
Sensors course.

20 | P a g e
Calibration curve
Figure 17: shows the calibration curve we obtained for Relative humidity sensor.
Conditioning circuit
Similar to the ambient temperature sensor, the relative humidity sensor generates volts order outputs and
hence does need conditioning.
( )
h) CO2 and NO2 sensors:
Although we ordered the sensors at early stages, however, we could not acquire it till now due to delays in
delivering and others out of control. We will integrate this sensor like the others the moment it becomes
available. It is being considered in Labview program and GUI interface.
Equations 1-8 are used to translate the levels of signals received by Labview into the original physical
quantities (temperature, dust, CO2, etc….).
9.3 Remote Server Design
The Signals sent by the WSN-3202 nodes is received by the NI-9792 Gateway, which is connected to a
PC where National Instruments LabVIEW 2012 was used to process the data received from the nodes and to
convert them into useful information. The first step was to read the data from the analog inputs; this step was
done separately for each node, the input signals were then reverted back to produce values that represent
their respective parameters. These results were then connected to numerical and graphical indicators.
An example is given in figure 18 below.

21 | P a g e
Figure 18: illustration for data acquisition using LabVIEW for one of the nodes
Figure 18 shows that three analog inputs were processed directly. The fourth input is the one
connected to the analog multiplexer. The Mux used was an eight to one Multiplexer, so it has to be
controlled using three digital switches –which are available in the WSN-3202 nodes. The controls have to be
switched automatically in a continuous sequence to allow receiving data from different sensors. For this
reason, for loop was used with a user-determined delay to switch between the different cases. Case
structures were used to set the output of each case. The LabVIEW segment dedicated for this task is shown
in figure 19. It can be seen that the loop counts from 0 to 5, since the maximum number for parameters to be
measured through a multiplexer is 6 (Outdoor Case). The loop delay is controlled by the user, where he
enters the desired delay, then this number is divided by 6 (# Of loop iterations) and the result is multiplied
by 1000 to get the loop delay in ms. This input delay is also considered as a reading period for the whole
program, since the main code is running inside an infinite while loop that has to wait for the whole program
to execute in order for it to go to the next iteration. The minimum reading time is 12 seconds, any time less
than that will cause a clash between the sampling interval of the nodes and the loops delay.
For the other two indoor nodes, the multiplexers read two inputs only. However, the iterations and cases are
maintained to 6 to keep the consistency of the whole system, and their loop delays are connected to the same
delay as the outdoor loop through property nodes. These property nodes are used through the block diagram
whenever connecting a variable from one of the internal case structures to the main program is required.

22 | P a g e
Figure 19: The LabVIEW Program segment used to read different inputs of the MUX
After obtaining the required inputs, some of the parameters – such as gas levels- have to be compared with
their safety threshold values. This is done by using a Boolean comparator, where the result is compared with
the threshold, and the output is then set as a control for another case structure that sets the output message
depending on the comparator value. "The threshold was set to 0 in the figure above during the development
stage and doesn't represent the real case". In addition, an Air Quality Index was developed for each location
to state if the weather is healthy depending on the comparators output. Property nodes were used to connect
the comparators output from the different cases of the case structures. For the outdoor node, the AQ is
considered good if Temperature, Pressure, CO2, CH4 and Dust levels were below the safe threshold values.
The same is true for the indoor nodes. However, Dust is excluded since it's not among the indoor
measurands, and N2O is not included also as the sensors were not used due to their high cost. The LabVIEW
logic behind designing this idea is using an OR gate, if only one measurand exceeds the threshold value,
then the gate output will alter causing the output message to change, this is better illustrated in figure 20.
Figure 20: AQI LabVIEW Segment for one of the locations

23 | P a g e
Another feature that was added to the system was writing to measurement files. That is, the parameters
related to the PV cells efficiency are stored in a log file, and the data for monitoring some environmental
parameters than effect the health are stored in a different file for each location (Outdoor, Office and Lab).
The user is given the choice of where to save the files and what to name them. Also, he is given the ability to
enable or disable this process. One of the LabVIEW segments made for this purpose is shown in figure 21.
Figure 21: LabVIEW segment for writing to measurement files
After describing the individual segments of the LabVIEW program, it's the time to see the full picture by
showing the full block diagram. Figure 22 summarizes the whole code that was used for this project.
Figure 22: The Full LabVIEW block diagram

24 | P a g e
The front panel of the program is also shown n figure 23 below.
Figure 23: LabVIEW program Front Panel (During Development)
As seen from the figure above, the front panel was designed to be user friendly and easy to understand. The
user has to enter the reading time as explained above; the default input is set to 12 to avoid initial errors.
Also, the default case for writing to log files is set to be false, so the user is given the choice whether he
wants to start recording from the beginning or later whenever he decides. The contents of the log files are
also explained in terms of column headers.

25 | P a g e
For the Air Quality Index, the three circles at the top indicate the weather condition at the three different
locations. The circle color change to red if something abnormal is detected, following the location. This
generalized monitoring system allows the user to accurately detect the source of abnormality by choosing
the tab corresponding to the affected location and noticing the levels of all the parameters.
Nodes battery voltage and Link Quality with the Gateway are also shown locally for each location on the
front panel, so that the user can monitor them and act according to their level.
10. Results and Discussion:
In this section, we will show the equipment we used and experimental results we obtained in this project by
our system. Figure 24 shows a typical setup of signal conditioning testing using NI ELVIS II and Labview.
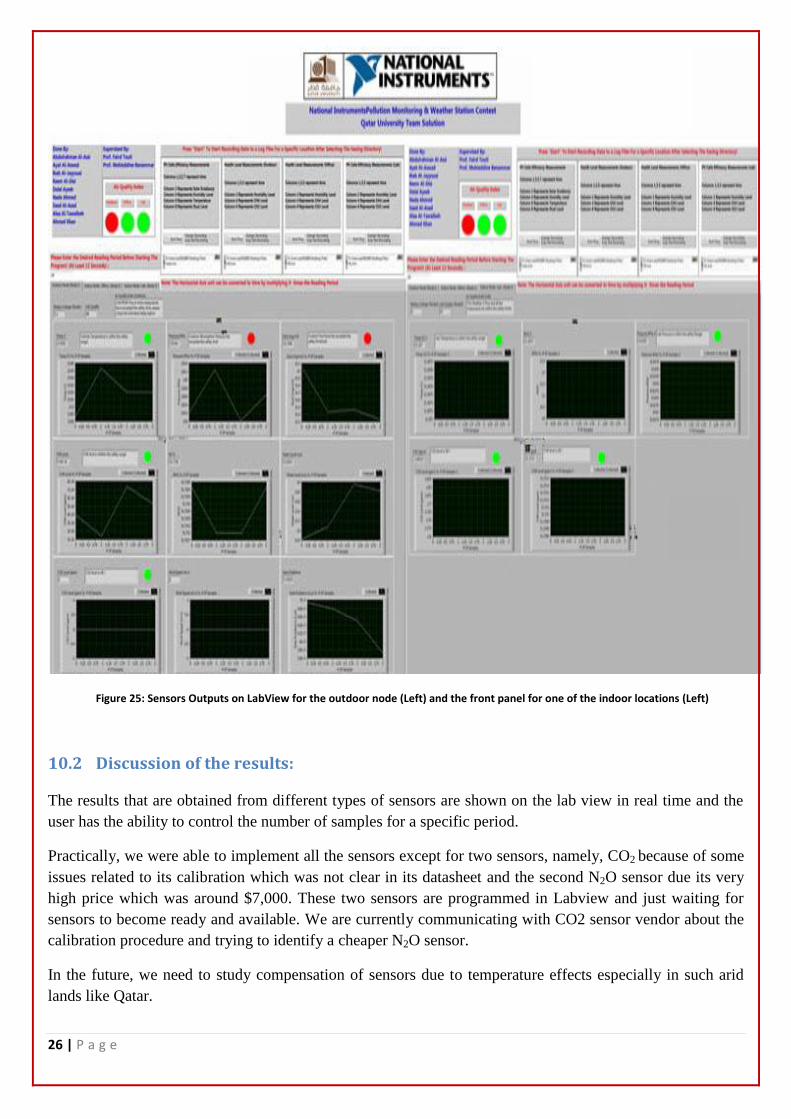
10.1 The snapshots of the LabVIEW device and program:
Figure 25 shows all indoor and outdoor physical quantities received in real time by the server with Labview.
Figure 24: conditioning circuits used for the sensors
26 | P a g e
Figure 25: Sensors Outputs on LabView for the outdoor node (Left) and the front panel for one of the indoor locations (Left)
10.2 Discussion of the results:
The results that are obtained from different types of sensors are shown on the lab view in real time and the
user has the ability to control the number of samples for a specific period.
Practically, we were able to implement all the sensors except for two sensors, namely, CO2 because of some
issues related to its calibration which was not clear in its datasheet and the second N2O sensor due its very
high price which was around $7,000. These two sensors are programmed in Labview and just waiting for
sensors to become ready and available. We are currently communicating with CO2 sensor vendor about the
calibration procedure and trying to identify a cheaper N2O sensor.
In the future, we need to study compensation of sensors due to temperature effects especially in such arid
lands like Qatar.

27 | P a g e
10.3 Air Quality in Qatar and Potential for solar energy (PV and thermal)
Air Quality in Qatar
The results we obtained during the period of measurement of climatic and environmental parameters show
that the levels are below the WHO thresholds. Therefore, we can say that the AQ is acceptable. However, to
reach a genuine and more comprehensive conclusion, we are planning to do the following:
Carry out extended measurement over seasons and during day and night
Extend our measurement (since our system is scalable) to cover more areas outdoor where we expect
deterioration of Air Quality.
Solar potential energy in Qatar
Figure 26 shows the amount of solar irradiance we recorded in Doha for mono-crystalline PV panels of 160
W. As can be seen obviously, the Panel is generating virtually its maximum power between around 11:00
and 14:00. This result is untapped elsewhere. This demonstrates the real potential of solar energy in the
region.
Figure 26: Amount of radiation in Doha during a very sunny day.
Indeed Qatar, with one of the highest solar irradiation rates in the world, has recently announced plans to
utilize the sun’s rays as a sustainable energy resource by installing 1.8 GW of solar power over the next few
years. With every square kilometer of land in Qatar receiving solar energy equivalent to 1.5 mn barrels of
crude oil in a year, Qatar is geographically well-positioned to exploit significant solar energy, according to
top officials of Qatar Petroleum (QP). Qatar has solar irradiation levels with studies showing an annual rate
of 1,858 kWh (kilowatt hour) per square meter/year, though considerable seasonal variations exist between
summer and winter months, large potential is available throughout the year. During the summer months of
May to July, the potential is over 6 kWh per square meter per day, whereas during the winter months
(December to February), it is about 3.5 to 4.4 kWh per square meter per day. Electricity consumption in
0
40
80
120
160
7:00 9:24 11:48 14:12 16:36 19:00
Sola
r ra
dia
tio
n (
Wat
t/m
^2
)
Day
Mono-crystallinesilicon PV
11:00-14:00

28 | P a g e
Qatar increased by 13% in 2012 in comparison to 2011 despite the governmental campaign to rationalize
power consumption. Qatar is moving ahead to reduce the electricity consumption by 20 percent over the
next five years. So now it is introducing a new industry of solar energy in Qatar that is Qatar Solar
Technologies (QSTec). QSTec, a joint venture between Qatar Foundation (70%), Solar World AG (29%)
and Qatar Development Bank (1%) is building a poly silicon production plant in Ras Laffan Industrial City.
It is being built on a 1.2 mn sq km land at a cost of $1bn, estimated to produce 8,000 metric tons per year
(MTPY) of poly silicon with a design to expand its capacity. Eventually, more than 45,000 MTPY of poly
silicon can be produced with the plant being designed seamlessly incorporates ingots, wafers, cells and
modules.
Omni-practicalities affecting solar PV efficiency under harsh environment
Despite the untapped solar potential in Qatar, there exist environmental challenges that prohibit the real
uptake of solar PV in the region. Solar photovoltaic (PV) system uses solar cells to convert energy from sun
radiation into electricity. The system is made up by one or more panels, a battery, a charge control and the
load. Solar PV panels are normally mounted on roofs and wired into a building by an inverter, which
converts the direct current energy received from solar panels into alternating current. Ironically, while there
is plenty of solar radiation in Qatar, there is a huge amount of sand and dust and sandstorms are frequent.
Taking into account the fact that photovoltaic cells already have low conversion efficiencies the
accumulation of sand and dust particles on their surface further reduces their output efficiency. Nonetheless,
the effects of the ambient temperature, relative humidity, and solar flux on the conversion efficiency can
also be critical.
Dust has a major effect on the PV cells so, there have been different studies to inspect the effect of dust
on solar cells [16-26]. A wide range of reduction in performance have been reported including average
reduction of 1% with a peak of 4.7% in a two-month period in united states. 40% degradation in a 6-month
period in Saudi Arabia 32% reduction in an 8-month time again in Saudi Arabia, 17%–65% reduction
depending on the tilt angle in 38 days in Kuwait. In another study done in Egypt 33.5%–65.8% reductions in
performance have been announced in duration of one to six months exposure respectively .More specifically
in the tropical climate of Thailand, 11% reduction in transmittance for a period of one month has been
reported.
Humidity affects efficiency of solar panel as it affects the current of solar panels. Furthermore it affects
the output voltage but with smaller amount. Increase in current is favored by low relative humidity 69% to
70% .From this research it has also been shown that voltage is relatively stable between 70% and 74%. And
that efficiency is also high during low relative humidity between 70% and 70%.This last for a very long
period of time during the day", a technical paper from gulf times' website.
The effect of temperature on solar panel power production varies depending on the solar panel unit
employed. Higher voltage photovoltaic units are less negatively affected by high temperatures than lower
voltage units. Methods of cooling the panels such as dousing them with water can improve power efficiency.
The development of more effective designs for electrical generation from photovoltaic may also render the
inefficiencies of temperature moot, as the strength and duration of sunlight remain the dominant factors in
solar panel power production.
Therefore, despite the huge potential of solar energy in Qatar and the region there are a lot of challenges that
have to be faced with regard to mitigating the adverse effects of the harsh environment on PV efficiency.

29 | P a g e
10.4 System Enhancement
We have many further improvements that can be applied to this project to make it more efficient and to add
more functionality to it. These improvements are:
1- Connecting the AQ to the HVAC system:
One major improvement is to expand the functionality of this system to be more independent and
intelligent. This can be done by connecting the Air Quality Monitoring system to the HVAC (heating,
ventilation, and air conditioning) system which will result in a direct communication that is ruled by an
algorithm to allow the system to adjust the system directly to help improving the air quality instead of
given warning to the user only. For instance, if the temperature inside the lab became high due to the
devices and the people in it, the system shall switch the AC on.
2- Temperature compensation:
Another improvement is to perform temperature compensation to overcome the fact that the sensors
output changes with the temperature change.
3- Adding GSM/GPRS module with the NI nodes* :
In the design, the system is enhanced by adding GSM/GPRS module with the NI nodes. The goal of this
enhancement is two-fold:
Improve system’s robustness: when nodes link quality drops below a certain threshold, LabVIEW
should switch the connection with the sensors network from the nodes to the GSM network.
Instant warning: if the AQ indoor or outdoor is falling below standards or there is a failure in
system (e.g. sensors down, battery low, etc…), the manager receives warning messages instantly.
The idea has not totally been implemented to this project, but it will be ready by the time of the project
presentation next month. This concept is better illustrated in the figure 27.
Figure 27: GSM Vs. Link Quality idea illustration
Figure 28 below, shows data retrieved via FTTP by a remote authenticated user (e.g. student, manager)

30 | P a g e
Figure 28: FTP server so anyone can observe the results from this server anytime and anywhere in the university.
11. Conclusion
A complete system for monitoring air pollution and weather variables has been successfully developed,
implemented and tested. The most challenging part in the project was the gas sensors calibration which was carried
out in the laboratories of the department of chemical engineering of Qatar University. Beside the technical hardware
and software skills acquired and/or improved in this project, the opportunity to work on a topic of great importance
to our society and to sharpen soft skills such as leadership, lifelong learning, and teamwork and time management
has been a great one.

31 | P a g e
References:
1. A. Bener et al., The impact of air pollution on hospital admission for respiratory and cardiovascular
diseases in an oil and gas-rich country, Eur. Ann. Allergy Clin. Immunol., Vol. 41, pp. 80-84, 2009.
2. F. S. Al-Anzi and A. A. Salman, Correlation of Asthma Symptoms with Prevalence of Indoor NO2
Concentration in Kuwait, Journal of Environmental Protection, Vol. 2, pp. 186-193, 2011.
3. Lian-Yu Lin et al., The effects of indoor particle exposure on blood pressure and heart rate among
young adults: An air filtration-based intervention study, Atmospheric Environment, Vol. 45, pp.
5540-44, 2011.
4. Qatar National Development Strategy 2011~2016 (Towards Qatar National Vision 2030), Gulf
Publishing and Printing Company, 2011.
5. http://www.qatarisbooming.com/2011/04/01/qatar-to-develop-policy-to-monitor-air-quality/
6. WHO guidelines for indoor air quality: selected pollutants, World Health Organization, 2010
(http://www.euro.who.int/__data/assets/pdf_file/0009/128169/e94535.pdf ).
7. Kadri, R. K. Rao, and Jin Jiang, Low-power chirp spread spectrum signals for wireless
communication within nuclear power plants. Journal of Nuclear Technology, American Nuclear
Society, 166:156–169, May 2009. 8. http://www.ti.com
9. http://www.ni.com/pdf/manuals/372775e.pdf
10. http://www.ebooksdownloadfree.com/Engineering/Principles-of-Chemical-Sensors-BI2304.html
11. http://www.ebooksdownloadfree.com/Engineering/Sensors-and-Low-Power-Signal-Processing-BI19490.html
12. http://books.google.com.qa/books?id=YdI6nXeCFAUC&printsec=frontcover&hl=ar&source=gbs_ge_summary
_r&cad=0#v=onepage&q&f=false
13. http://www.sciencedirect.com/science/article
14. http://greenliving.nationalgeographic.com 15. http://sites.tufts.edu/cafeh/files/2012/01/Near-Road-Air-Quality-Monitoring-Research.pdf
16. Goossens, D., Offer, Z.Y., Zangvil, A. (1993). Wind tunnel experiments and field investigations of
eolian dust deposition on photovoltaic solar collectors. Solar Energy 50(1): 75-84.
17. Hamid, R.H., El-Hussainy, F., Beheary, M.M., Abdel-Moneim, K.M. (2006). Effect of the dust on the
transparent cover of solar collectors. Energy Conversion and Management 47: 3192–3203.
18. Hassan, A.H., Rahoma, U.A., Elminir, H.K., Fathy, A.M. (2005). Effect of airborne dust
concentration on the performance of PV modules. Journal of Astronomical Society 13(1): 24-38.
19. Hegazy, A.A. (2001). Effect of dust accumulation on solar transmittance through glass covers of
plate-type collectors. Renewable Energy 22: 525-540.
20. Mani, M., Pillai, R. (2010). Impact Of dust on photovoltaic (PV) performance: research status,
challenges and recommendations. Renewable and Sustainable Energy Reviews 14: 3124–3131.
21. Mastekbayeva, G.A., Kumar, S. (2000). Effect of dust on the transmittance of low density
polyethylene glazing in a tropical climate. Solar Energy 68(2): 135-141.
22. Nahar, N., Gupta, J. (1990). Effect pf dust on transmittance of glazing materials for solar collectors
under arid zone conditions of India. Solar Wind Technology 7: 237-243.
23. Nimmo, B., Seid, S.A.M. (1979). Effects of dust on the performance of thermal and photovoltaic flat
plate collectors in Saudi Arabia: preliminary results. In: Proc. of the 2nd Miami International
Conference on Alternative Energy Sources in 1979, pp. 223-235.
24. Omubo-Pepple, V. B., Israel-Cookey, C., Alamunokuma, G.I. (2009). Effects of temperature, solar
flux and relative humidity on the efficient conversion of solar energy to electricity. European Journal
Of Scientific Research 35: 173-180.
25. Said, S. (1990). Effect of dust accumulation on performances of thermal and PV flat plate collectors.
Applied Energy 37:73-84.
26. Sayigh, A.A.M., Al-Jandal, S., Ahmed, H. (1985). Dust effect on solar flat surfaces devices in
Kuwait. In: Proc. of the Workshop on the Physics of Non-Conventional Energy Sources and
Materials Science for Energy in 1985, pp. 353-367.

32 | P a g e
Appendix A: PV panels on rooftop of corridor of the College of Engineering of
Qatar University.
33 | P a g e

34 | P a g e
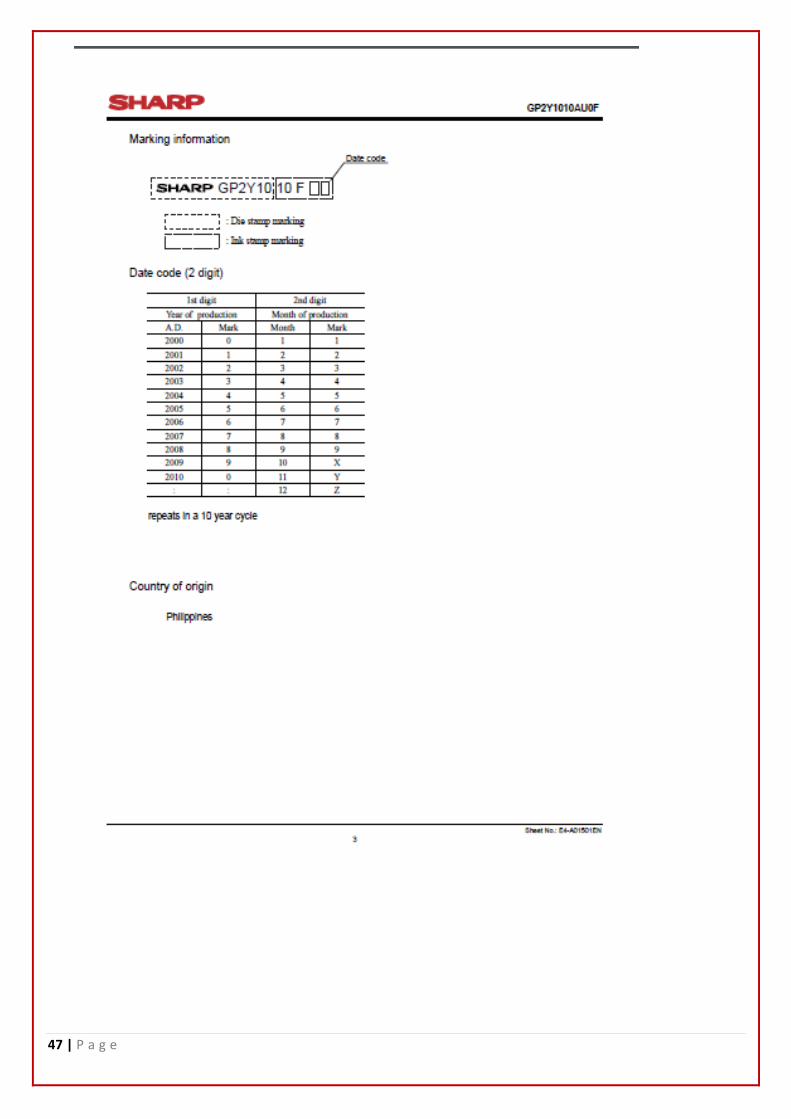
Appendix B: Datasheets

35 | P a g e

36 | P a g e

37 | P a g e

38 | P a g e

39 | P a g e

40 | P a g e
H

41 | P a g e

42 | P a g e
43 | P a g e
44 | P a g e

45 | P a g e

46 | P a g e
47 | P a g e

48 | P a g e

49 | P a g e

50 | P a g e

51 | P a g e
52 | P a g e

53 | P a g e

54 | P a g e
55 | P a g e
56 | P a g e

57 | P a g e

58 | P a g e

59 | P a g e