nhs rightcare intelligence focus pack
TRANSCRIPT
NHS Blackpool CCG
NHS RightCareIntelligence Focus PackNeurological Problems
February 2019
Page 1
Purpose and audience for this RightCare data packThis is a data pack produced by your RightCare regional analytical team to support your local operational work on the RightCare programme. This is not an official NHS England publication and has not been through national NHS England publication processes. It includes updated data from national sources, and any guidance or narrative is taken from previously produced RightCare packs from the national RightCare programme team.
The slides have been produced to support RightCare Delivery Partners in their work on priority areas, comparing activity, spend and outcomes vs similar CCGs. It is for sharing at local RightCare meetings via appropriate stakeholders within your CCG, in conjunction with support from your RightCare delivery partner and other colleagues, and is not for public use.
For further information please contact your regional analytical team -
South: [email protected]
M&E: [email protected]
London: [email protected]
North: [email protected]
Page 2
Introduction: Welcome to your focus packWelcome to your focus pack on Neurology. This pack uses the most up to date data available. Information contained in this pack is personalised for your CCG and should be used to support local discussions and inform a more in-depth analysis around Neurological services.
Each of these focus packs provides detailed information on the opportunities to improve in the highest spending programmes previously covered by the NHS RightCare packs. They include a wider range of outcomes measures and information on the most common procedures and diagnoses for the condition in question.
By using this information, together with local intelligence and reports such as your Joint Strategic Needs Assessment, your CCG will be able to ensure its plans focus on those opportunities which have the potential to provide the biggest improvements in health outcomes, resource allocation and reducing inequalities.
One of the main focuses for NHS RightCare has always been reducing unwarranted variation in outcomes. NHS England, Public Health England and CCGs have legal duties under the Health and Social Care Act 2012 with regard to reducing health inequalities. Commissioners should continue to use these packs and supporting tools to drive local action to reduce inequalities in access to services and in the health outcomes achieved.
Page 3
The primary objective for NHS RightCare is to maximise value:
• the value that the patient derives from their own care and treatment
• the value the whole population derives from the investment in their healthcare
The approach has been tested and proven successful in recent years in a number of different
health economies. The programme focusses on improving population value including improving
outcomes, quality, and releasing capacity and resources for future investment.
To build on the success and value of the NHS RightCare programme, NHS England and Public
Health England are taking forward the RightCare approach to ensure it becomes embedded in
the new commissioning and public health agendas for the NHS. It is now referenced in the
Mandate to NHS England, the NHS Planning Guidance, the CCG Improvement and Assessment
Framework and the Quality Premium for 2017-19.
The NHS RightCare programme includes the Intelligence (formerly Commissioning for Value)
packs and tools, the NHS Atlas series, NHS RightCare pathways, scenarios and casebooks. All
CCGs in England are now receiving support to implement NHS RightCare improvement
programmes through a team of Delivery Partners working with local health economies.
NHS RightCare
Page 4
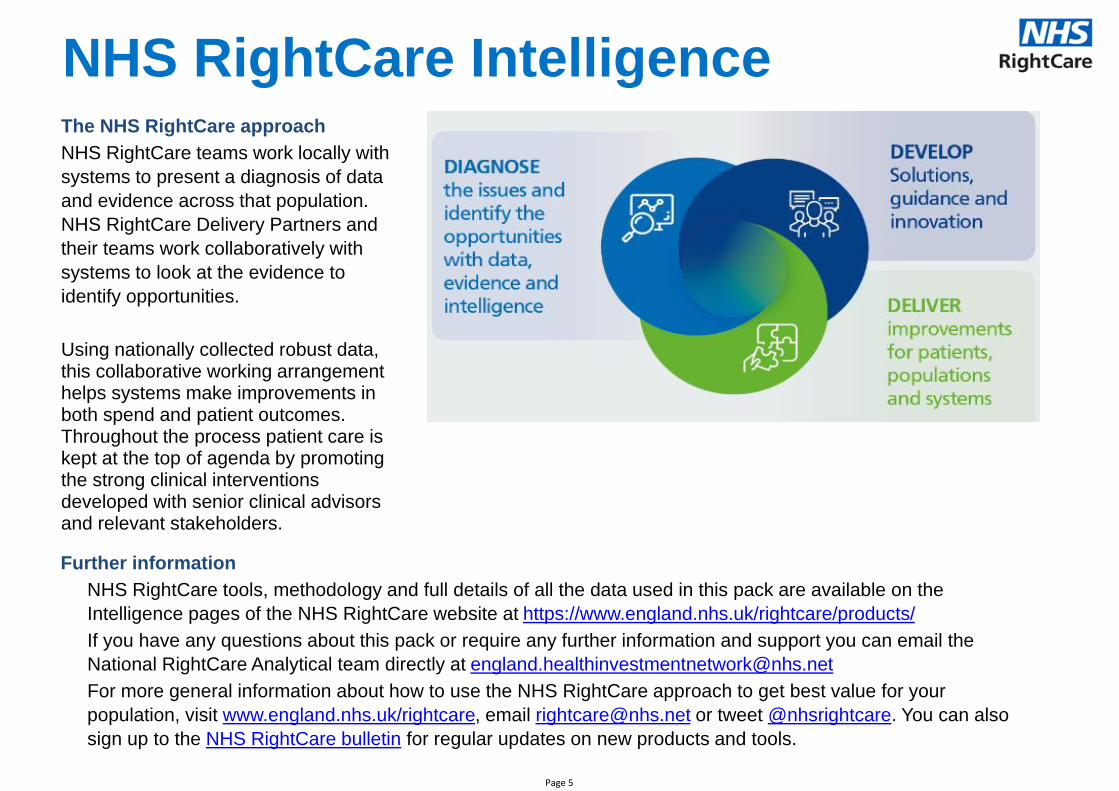
The NHS RightCare approach
NHS RightCare teams work locally with
systems to present a diagnosis of data
and evidence across that population.
NHS RightCare Delivery Partners and
their teams work collaboratively with
systems to look at the evidence to
identify opportunities.
Using nationally collected robust data, this collaborative working arrangement helps systems make improvements in both spend and patient outcomes. Throughout the process patient care is kept at the top of agenda by promoting the strong clinical interventions developed with senior clinical advisors and relevant stakeholders.
Further information
NHS RightCare tools, methodology and full details of all the data used in this pack are available on the
Intelligence pages of the NHS RightCare website at https://www.england.nhs.uk/rightcare/products/
If you have any questions about this pack or require any further information and support you can email the
National RightCare Analytical team directly at [email protected]
For more general information about how to use the NHS RightCare approach to get best value for your
population, visit www.england.nhs.uk/rightcare, email [email protected] or tweet @nhsrightcare. You can also
sign up to the NHS RightCare bulletin for regular updates on new products and tools.
NHS RightCare Intelligence
Page 5
This focus pack presents analysis of a wide range of indicators focussing predominantly on spend and activity. The indicators have been chosen with advice from national clinical leads and other key stakeholders.
The data in this pack are the latest available at the time of production. Data quality has been assessed and only indicators which are sufficiently robust have been included in the pack.
The data are presented as an exploration, starting with prevalence, then moving through primary care prescribing, admissions, outpatients and procedures.
Should you have any queries about the indicators or the data, please contact your local delivery partner or regional analytical team.
Your data
Page 6
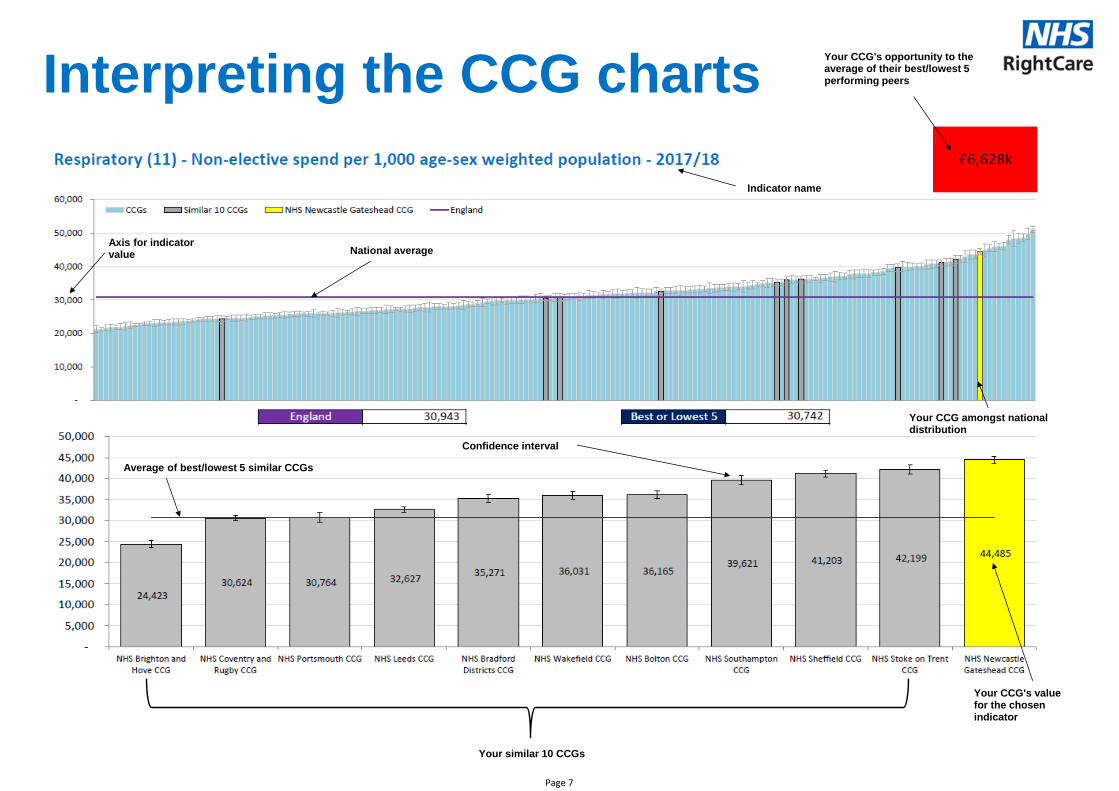
National average
Your CCG amongst national distribution
Confidence interval
Your CCG's value for the chosen indicator
Axis for indicator value
Your similar 10 CCGs
Average of best/lowest 5 similar CCGs
Your CCG's opportunity to the average of their best/lowest 5 performing peers
Indicator name
Interpreting the CCG charts
Page 7
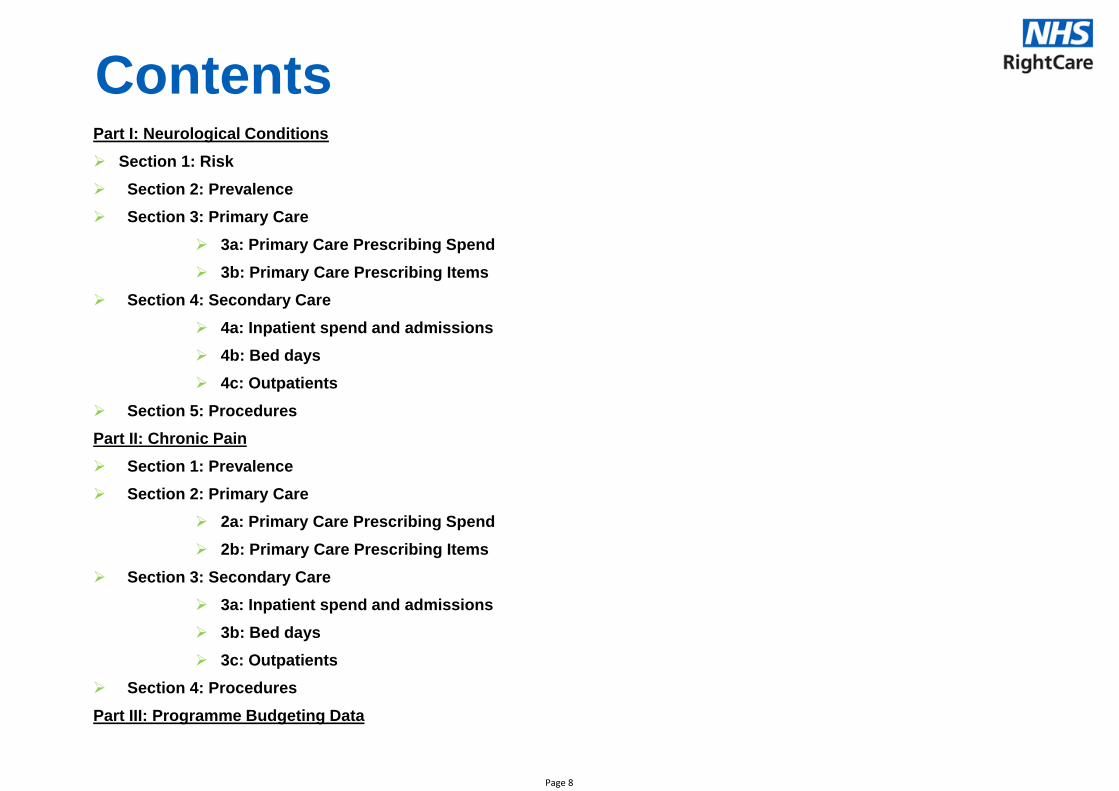
ContentsPart I: Neurological Conditions
➢ Section 1: Risk
➢ Section 2: Prevalence
➢ Section 3: Primary Care
➢ 3a: Primary Care Prescribing Spend
➢ 3b: Primary Care Prescribing Items
➢ Section 4: Secondary Care
➢ 4a: Inpatient spend and admissions
➢ 4b: Bed days
➢ 4c: Outpatients
➢ Section 5: Procedures
Part II: Chronic Pain
➢ Section 1: Prevalence
➢ Section 2: Primary Care
➢ 2a: Primary Care Prescribing Spend
➢ 2b: Primary Care Prescribing Items
➢ Section 3: Secondary Care
➢ 3a: Inpatient spend and admissions
➢ 3b: Bed days
➢ 3c: Outpatients
➢ Section 4: Procedures
Part III: Programme Budgeting Data
Page 8
Part I - Neurological Conditions
Page 9
Section 1 - Risk
Page 10
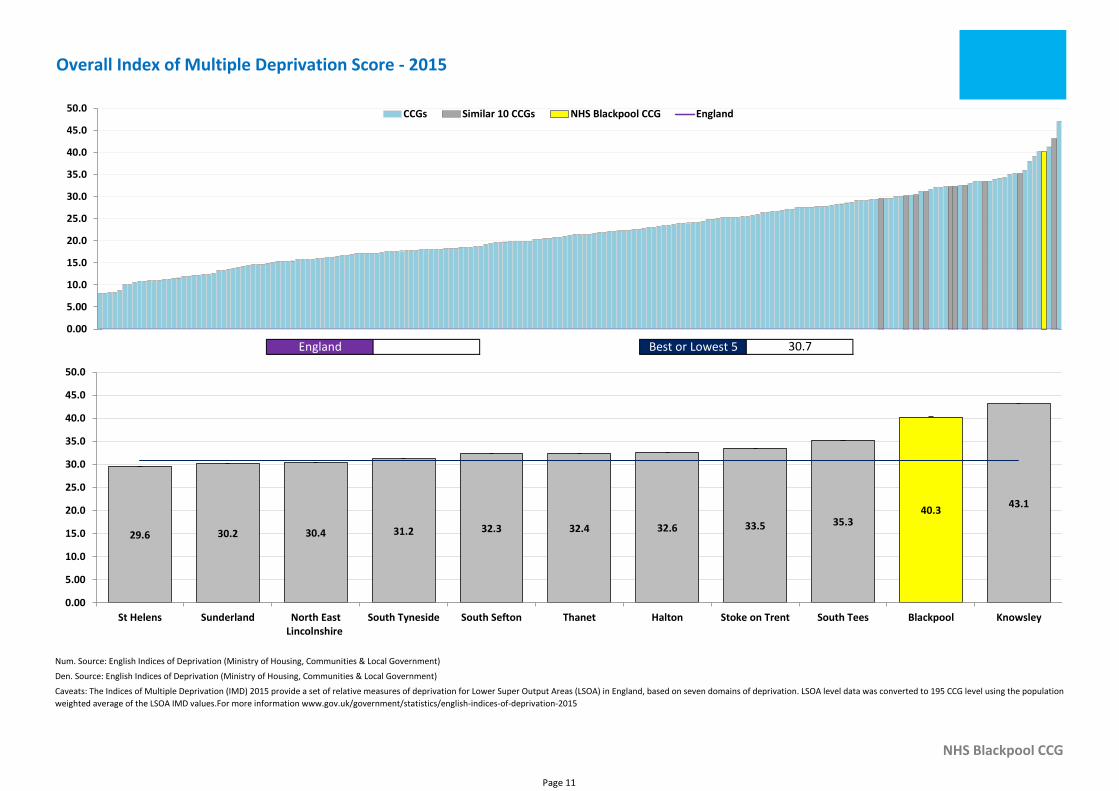
Num. Source: English Indices of Deprivation (Ministry of Housing, Communities & Local Government)
Den. Source: English Indices of Deprivation (Ministry of Housing, Communities & Local Government)
NHS Blackpool CCG
Caveats: The Indices of Multiple Deprivation (IMD) 2015 provide a set of relative measures of deprivation for Lower Super Output Areas (LSOA) in England, based on seven domains of deprivation. LSOA level data was converted to 195 CCG level using the population
weighted average of the LSOA IMD values.For more information www.gov.uk/government/statistics/english-indices-of-deprivation-2015
Overall Index of Multiple Deprivation Score - 2015
England Best or Lowest 5 30.7
0.00
5.00
10.0
15.0
20.0
25.0
30.0
35.0
40.0
45.0
50.0 CCGs Similar 10 CCGs NHS Blackpool CCG England
40.3
29.6 30.2 30.4 31.2 32.3 32.4 32.6 33.5 35.3
43.1
0.00
5.00
10.0
15.0
20.0
25.0
30.0
35.0
40.0
45.0
50.0
St Helens Sunderland North EastLincolnshire
South Tyneside South Sefton Thanet Halton Stoke on Trent South Tees Blackpool Knowsley
Page 11
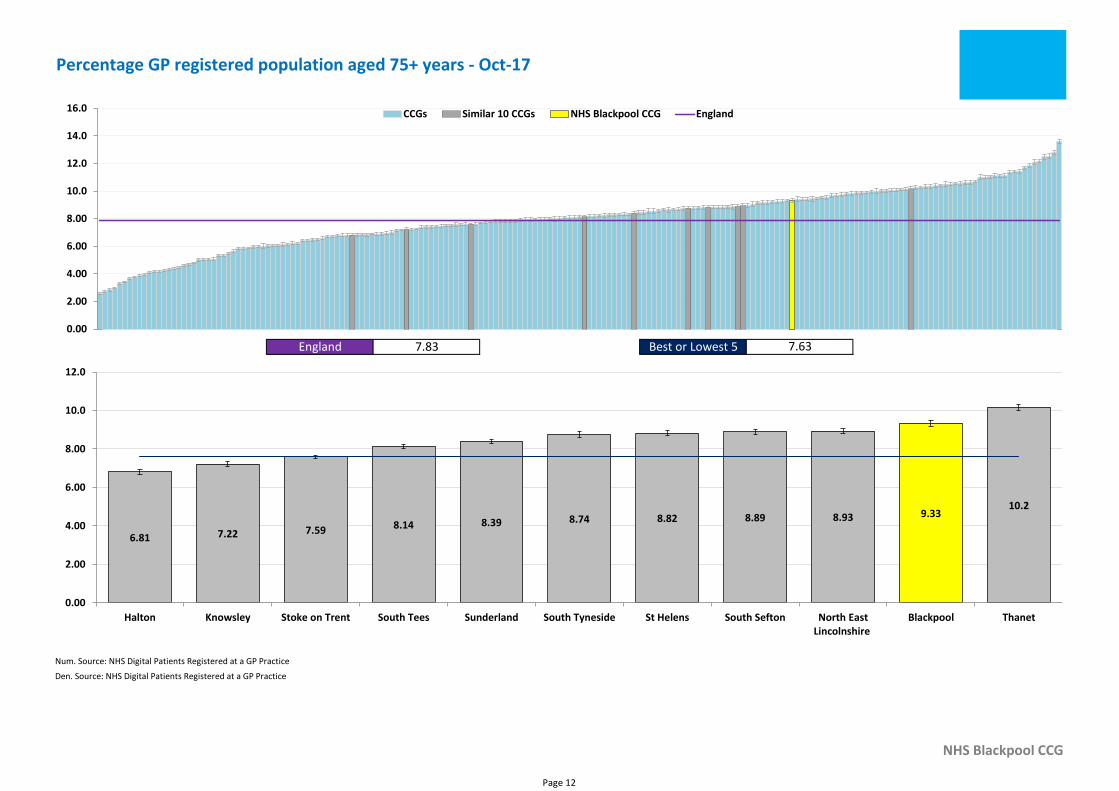
Num. Source: NHS Digital Patients Registered at a GP Practice
Den. Source: NHS Digital Patients Registered at a GP Practice
NHS Blackpool CCG
Percentage GP registered population aged 75+ years - Oct-17
England 7.83 Best or Lowest 5 7.63
0.00
2.00
4.00
6.00
8.00
10.0
12.0
14.0
16.0 CCGs Similar 10 CCGs NHS Blackpool CCG England
9.33
6.81 7.22 7.59 8.14 8.39 8.74 8.82 8.89 8.9310.2
0.00
2.00
4.00
6.00
8.00
10.0
12.0
Halton Knowsley Stoke on Trent South Tees Sunderland South Tyneside St Helens South Sefton North EastLincolnshire
Blackpool Thanet
Page 12
Num. Source: English Indices of Deprivation (Ministry of Housing, Communities & Local Government)
Den. Source: English Indices of Deprivation (Ministry of Housing, Communities & Local Government)
NHS Blackpool CCG
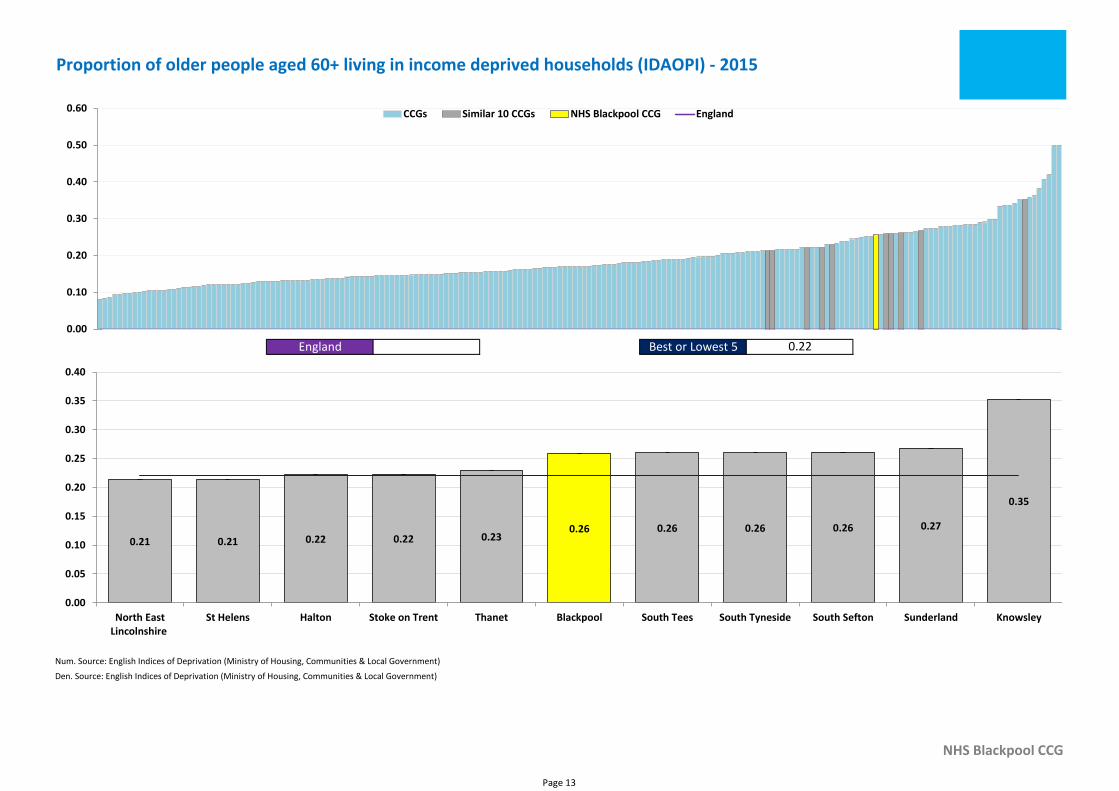
Proportion of older people aged 60+ living in income deprived households (IDAOPI) - 2015
England Best or Lowest 5 0.22
0.00
0.10
0.20
0.30
0.40
0.50
0.60 CCGs Similar 10 CCGs NHS Blackpool CCG England
0.260.21 0.21 0.22 0.22 0.23
0.26 0.26 0.26 0.27
0.35
0.00
0.05
0.10
0.15
0.20
0.25
0.30
0.35
0.40
North EastLincolnshire
St Helens Halton Stoke on Trent Thanet Blackpool South Tees South Tyneside South Sefton Sunderland Knowsley
Page 13

Section 2 - Prevalence
Page 14
Num. Source: Quality and Outcomes Framework (QOF), NHS Digital
Den. Source: Quality and Outcomes Framework (QOF), NHS Digital
NHS Blackpool CCG
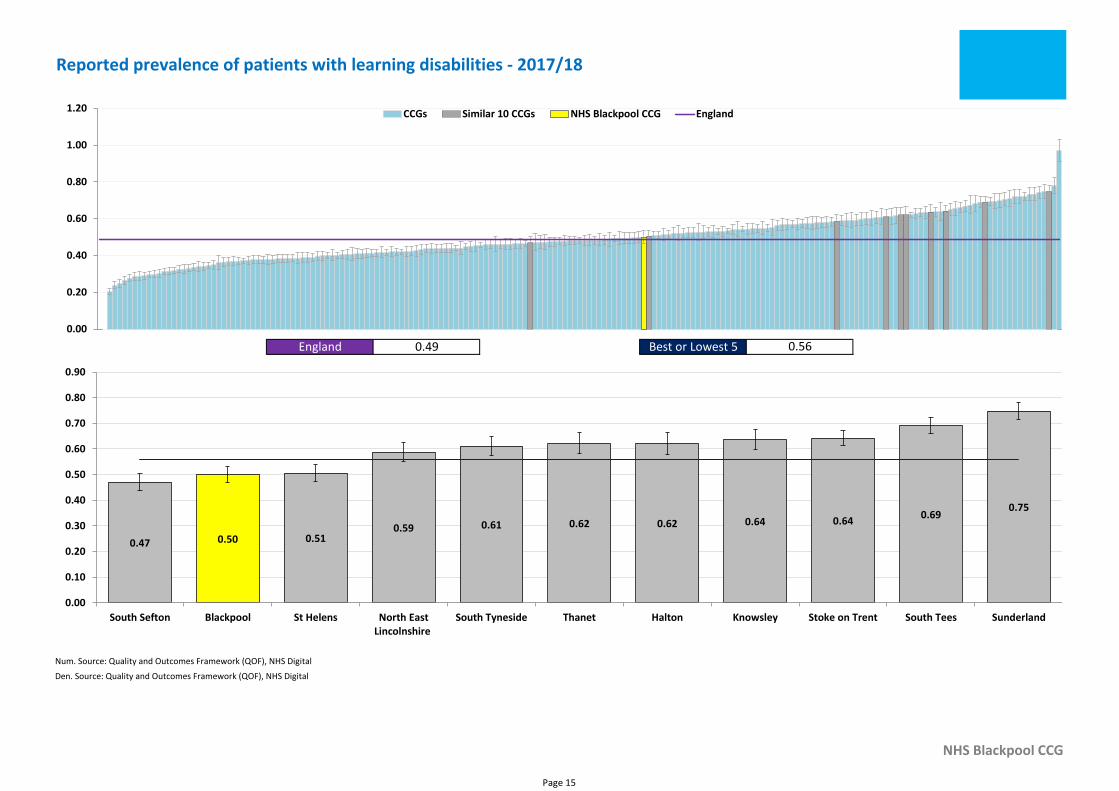
Reported prevalence of patients with learning disabilities - 2017/18
England 0.49 Best or Lowest 5 0.56
0.00
0.20
0.40
0.60
0.80
1.00
1.20 CCGs Similar 10 CCGs NHS Blackpool CCG England
0.500.47 0.510.59 0.61 0.62 0.62 0.64 0.64
0.690.75
0.00
0.10
0.20
0.30
0.40
0.50
0.60
0.70
0.80
0.90
South Sefton Blackpool St Helens North EastLincolnshire
South Tyneside Thanet Halton Knowsley Stoke on Trent South Tees Sunderland
Page 15
Num. Source: Quality and Outcomes Framework (QOF), NHS Digital
Den. Source: Quality and Outcomes Framework (QOF), NHS Digital
NHS Blackpool CCG
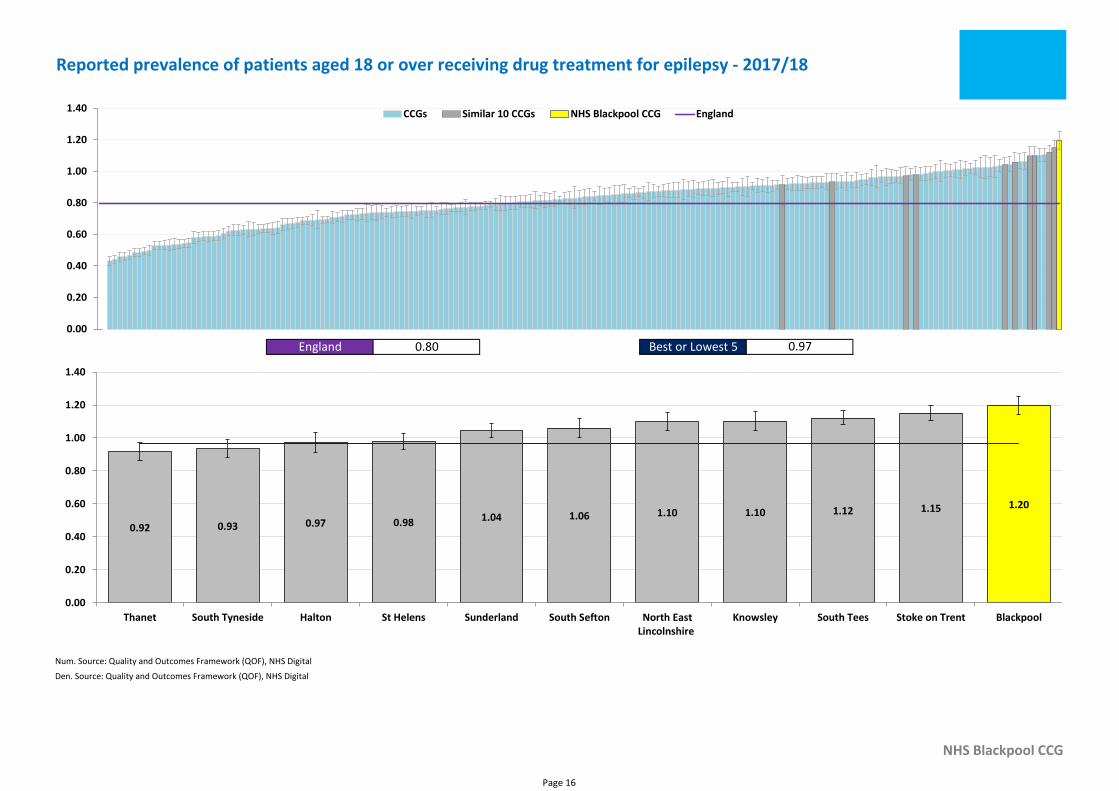
Reported prevalence of patients aged 18 or over receiving drug treatment for epilepsy - 2017/18
England 0.80 Best or Lowest 5 0.97
0.00
0.20
0.40
0.60
0.80
1.00
1.20
1.40 CCGs Similar 10 CCGs NHS Blackpool CCG England
1.20
0.92 0.93 0.97 0.98 1.04 1.06 1.10 1.10 1.12 1.15
0.00
0.20
0.40
0.60
0.80
1.00
1.20
1.40
Thanet South Tyneside Halton St Helens Sunderland South Sefton North EastLincolnshire
Knowsley South Tees Stoke on Trent Blackpool
Page 16
Num. Source: GP Patient survey, NHS England
Den. Source: GP Patient survey, NHS England
NHS Blackpool CCG
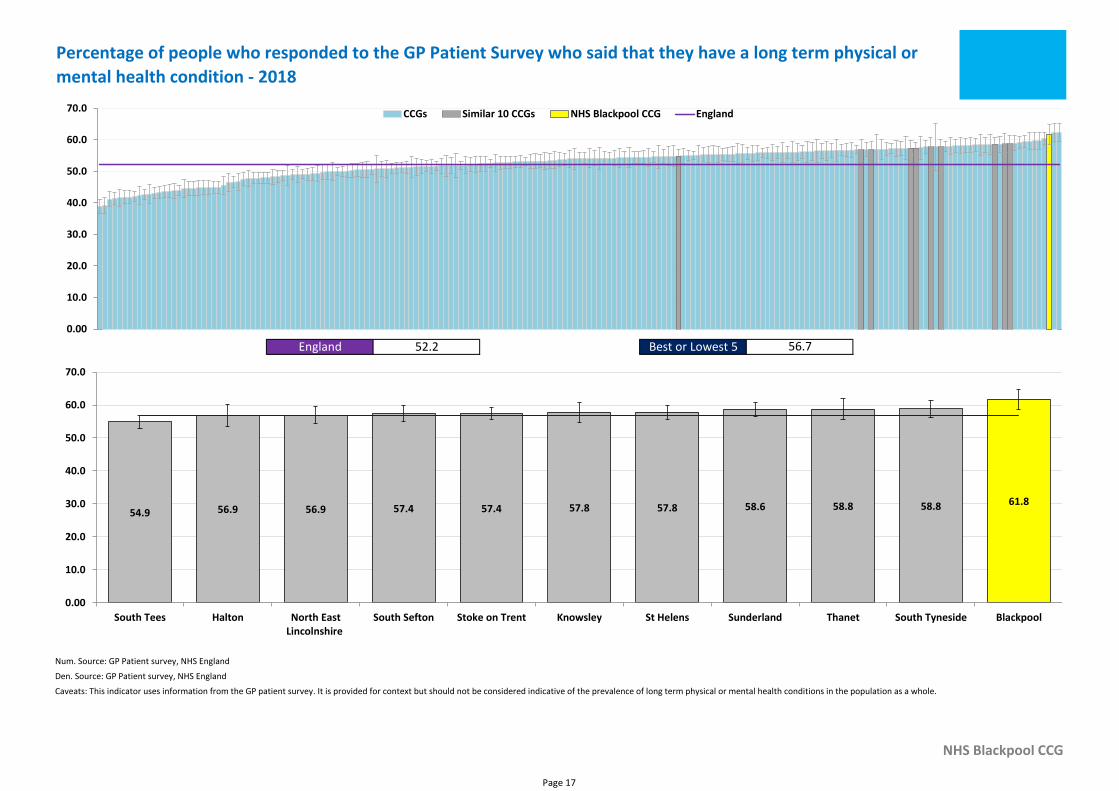
Caveats: This indicator uses information from the GP patient survey. It is provided for context but should not be considered indicative of the prevalence of long term physical or mental health conditions in the population as a whole.
Percentage of people who responded to the GP Patient Survey who said that they have a long term physical or
mental health condition - 2018
England 52.2 Best or Lowest 5 56.7
0.00
10.0
20.0
30.0
40.0
50.0
60.0
70.0 CCGs Similar 10 CCGs NHS Blackpool CCG England
61.854.9 56.9 56.9 57.4 57.4 57.8 57.8 58.6 58.8 58.8
0.00
10.0
20.0
30.0
40.0
50.0
60.0
70.0
South Tees Halton North EastLincolnshire
South Sefton Stoke on Trent Knowsley St Helens Sunderland Thanet South Tyneside Blackpool
Page 17
Num. Source: GP Patient survey, NHS England
Den. Source: GP Patient survey, NHS England
NHS Blackpool CCG
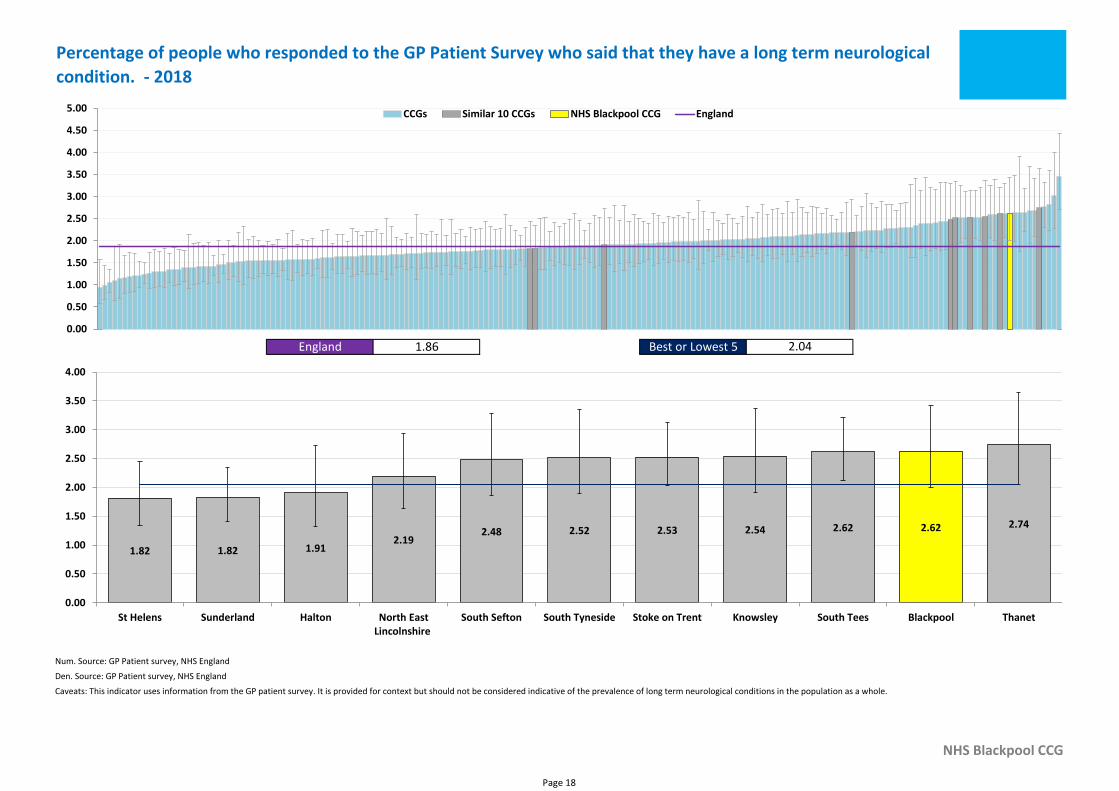
Caveats: This indicator uses information from the GP patient survey. It is provided for context but should not be considered indicative of the prevalence of long term neurological conditions in the population as a whole.
Percentage of people who responded to the GP Patient Survey who said that they have a long term neurological
condition. - 2018
England 1.86 Best or Lowest 5 2.04
0.00
0.50
1.00
1.50
2.00
2.50
3.00
3.50
4.00
4.50
5.00 CCGs Similar 10 CCGs NHS Blackpool CCG England
2.62
1.82 1.82 1.912.19
2.48 2.52 2.53 2.54 2.62 2.74
0.00
0.50
1.00
1.50
2.00
2.50
3.00
3.50
4.00
St Helens Sunderland Halton North EastLincolnshire
South Sefton South Tyneside Stoke on Trent Knowsley South Tees Blackpool Thanet
Page 18

Section 3a - Primary Care
• Primary Care Prescribing Spend
Page 19
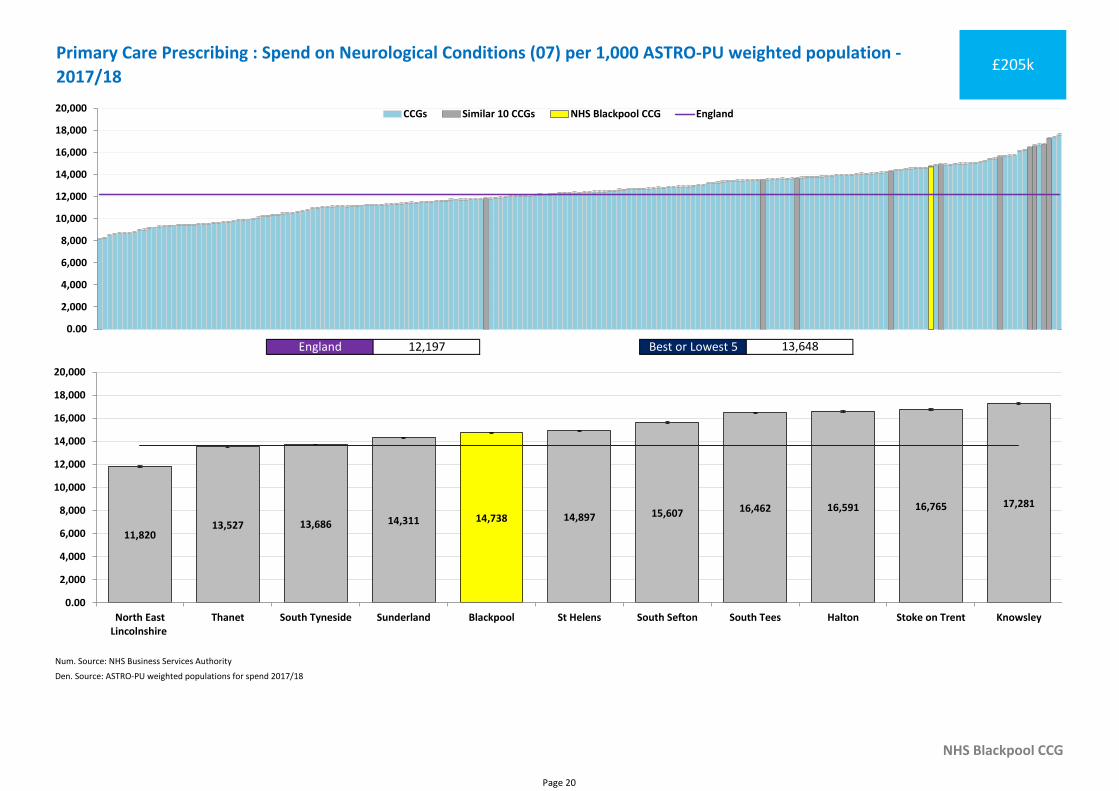
Num. Source: NHS Business Services Authority
Den. Source: ASTRO-PU weighted populations for spend 2017/18
NHS Blackpool CCG
Primary Care Prescribing : Spend on Neurological Conditions (07) per 1,000 ASTRO-PU weighted population -
2017/18£205k
England 12,197 Best or Lowest 5 13,648
0.00
2,000
4,000
6,000
8,000
10,000
12,000
14,000
16,000
18,000
20,000 CCGs Similar 10 CCGs NHS Blackpool CCG England
14,738
11,82013,527 13,686 14,311 14,897 15,607 16,462 16,591 16,765 17,281
0.00
2,000
4,000
6,000
8,000
10,000
12,000
14,000
16,000
18,000
20,000
North EastLincolnshire
Thanet South Tyneside Sunderland Blackpool St Helens South Sefton South Tees Halton Stoke on Trent Knowsley
Page 20

Num. Source: NHS Business Services Authority
Den. Source: ASTRO-PU weighted populations for spend 2017/18
NHS Blackpool CCG
Primary Care Prescribing : Spend on Anti-epileptic drugs per 1,000 ASTRO-PU weighted population - 2017/18 £392k
England 5,544 Best or Lowest 5 6,054
0.00
1,000
2,000
3,000
4,000
5,000
6,000
7,000
8,000
9,000 CCGs Similar 10 CCGs NHS Blackpool CCG England
8,138
5,715 5,893 5,950 6,294 6,419 6,823 6,902 7,230 7,5518,499
0.00
1,000
2,000
3,000
4,000
5,000
6,000
7,000
8,000
9,000
North EastLincolnshire
South Tyneside St Helens Sunderland Halton Thanet South Sefton South Tees Knowsley Blackpool Stoke on Trent
Page 21
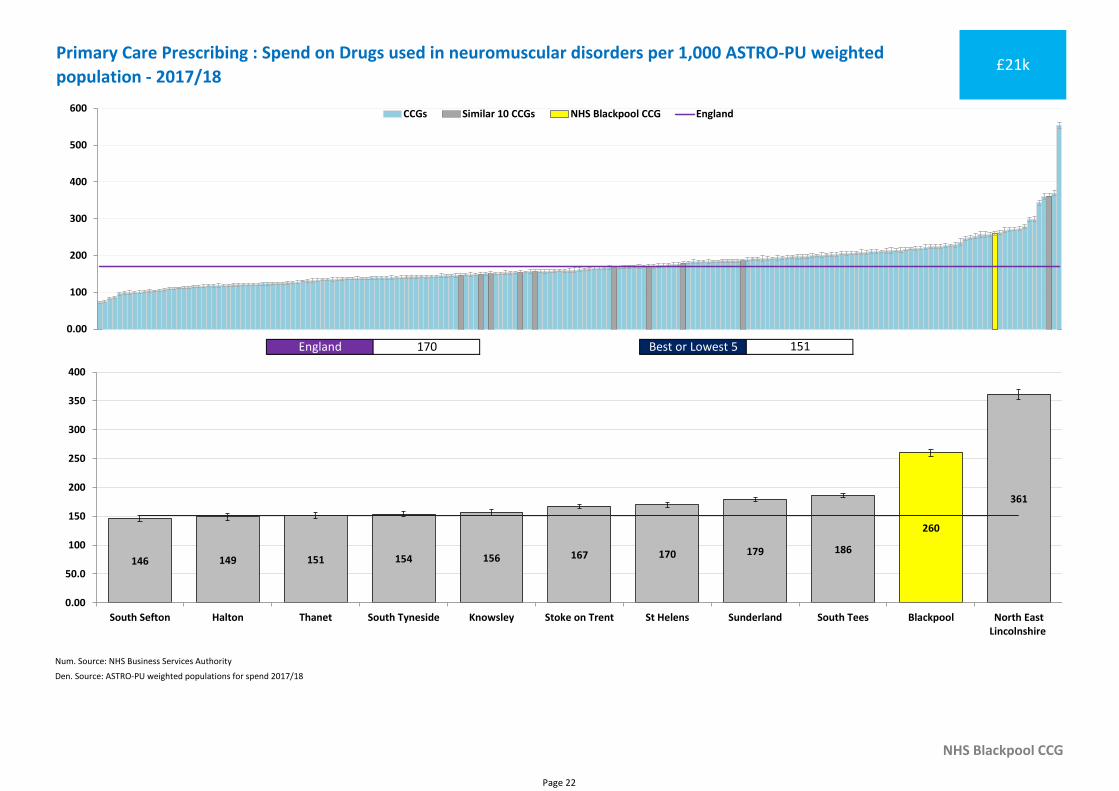
Num. Source: NHS Business Services Authority
Den. Source: ASTRO-PU weighted populations for spend 2017/18
NHS Blackpool CCG
Primary Care Prescribing : Spend on Drugs used in neuromuscular disorders per 1,000 ASTRO-PU weighted
population - 2017/18£21k
England 170 Best or Lowest 5 151
0.00
100
200
300
400
500
600 CCGs Similar 10 CCGs NHS Blackpool CCG England
260
146 149 151 154 156 167 170 179 186
361
0.00
50.0
100
150
200
250
300
350
400
South Sefton Halton Thanet South Tyneside Knowsley Stoke on Trent St Helens Sunderland South Tees Blackpool North EastLincolnshire
Page 22
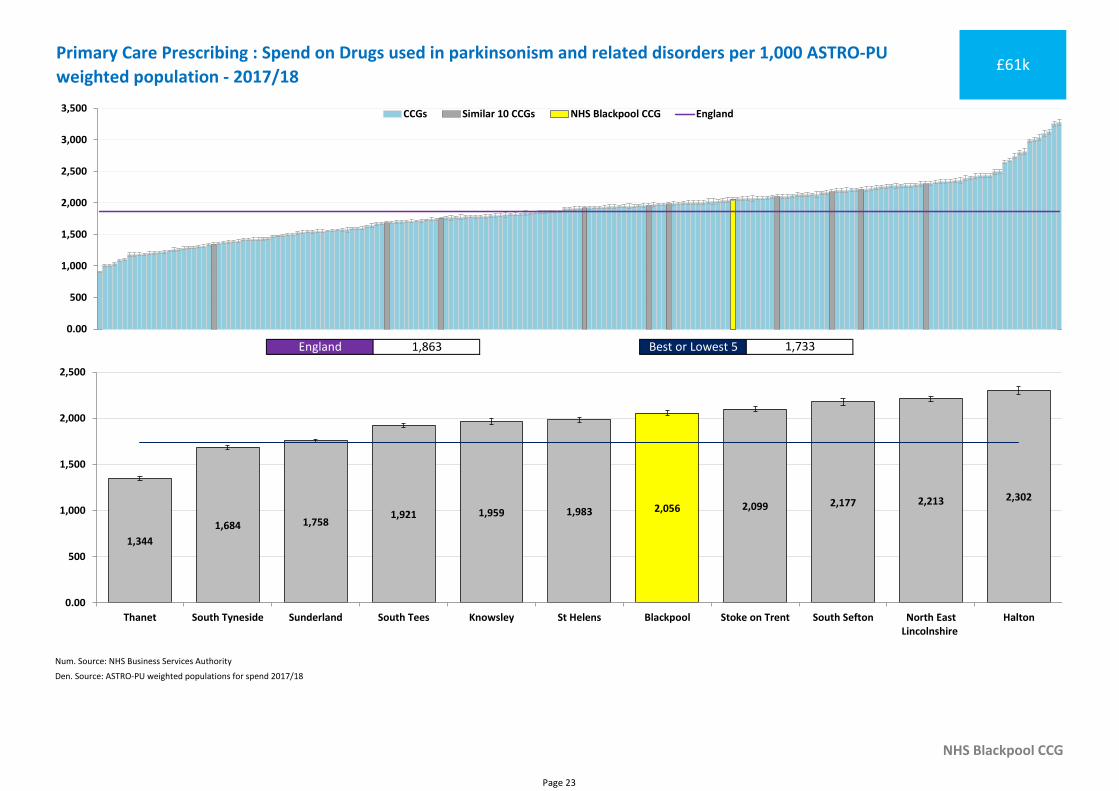
Num. Source: NHS Business Services Authority
Den. Source: ASTRO-PU weighted populations for spend 2017/18
NHS Blackpool CCG
Primary Care Prescribing : Spend on Drugs used in parkinsonism and related disorders per 1,000 ASTRO-PU
weighted population - 2017/18£61k
England 1,863 Best or Lowest 5 1,733
0.00
500
1,000
1,500
2,000
2,500
3,000
3,500 CCGs Similar 10 CCGs NHS Blackpool CCG England
2,056
1,344
1,684 1,7581,921 1,959 1,983 2,099 2,177 2,213 2,302
0.00
500
1,000
1,500
2,000
2,500
Thanet South Tyneside Sunderland South Tees Knowsley St Helens Blackpool Stoke on Trent South Sefton North EastLincolnshire
Halton
Page 23

Num. Source: NHS Business Services Authority
Den. Source: ASTRO-PU weighted populations for spend 2017/18
NHS Blackpool CCG
Primary Care Prescribing : Spend on Neurological Conditions - (Other) (07X) prescribing per 1,000 ASTRO-PU
weighted population - 2017/18£186k
England 11,259 Best or Lowest 5 12,456
0.00
2,000
4,000
6,000
8,000
10,000
12,000
14,000
16,000
18,000 CCGs Similar 10 CCGs NHS Blackpool CCG England
13,44711,234
12,343 12,376 12,838 13,492 14,216 15,025 15,190 15,334 16,022
0.00
2,000
4,000
6,000
8,000
10,000
12,000
14,000
16,000
18,000
North EastLincolnshire
South Tyneside Thanet Sunderland Blackpool St Helens South Sefton Stoke on Trent South Tees Halton Knowsley
Page 24

Section 3b - Primary Care
• Primary Care Prescribing Items
Page 25
Num. Source: NHS Business Services Authority
Den. Source: ASTRO-PU weighted populations for items 2017/18
NHS Blackpool CCG
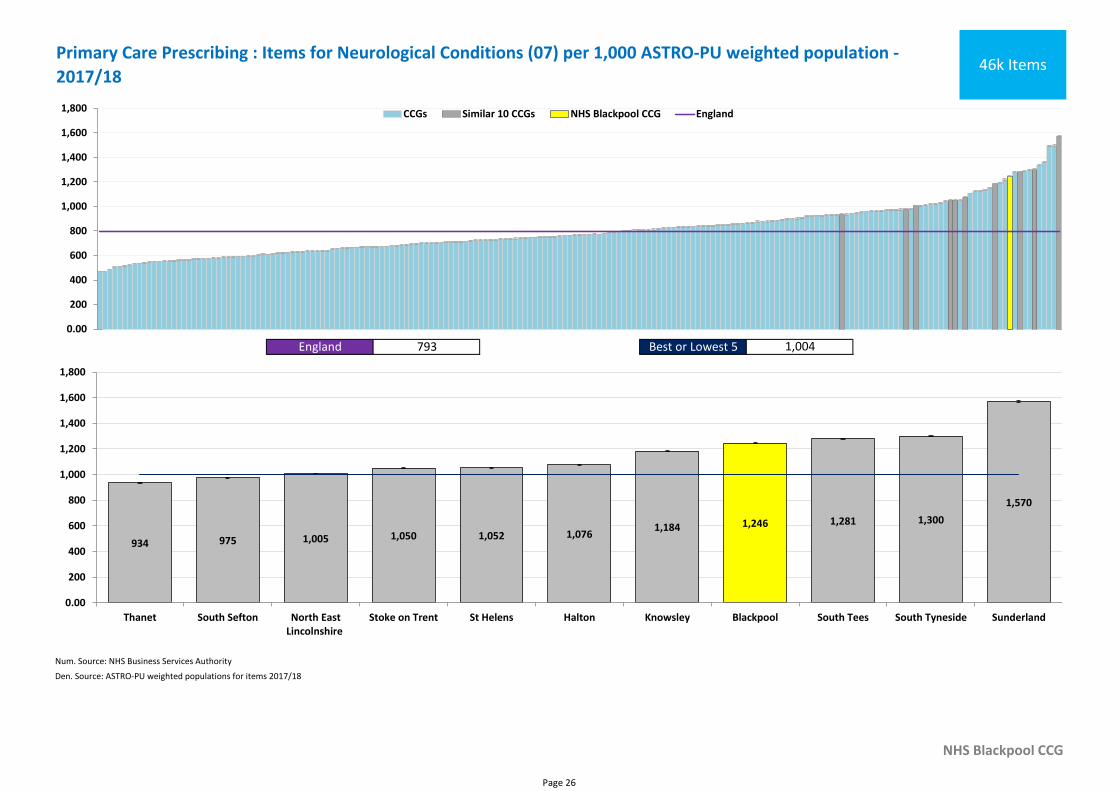
Primary Care Prescribing : Items for Neurological Conditions (07) per 1,000 ASTRO-PU weighted population -
2017/1846k Items
England 793 Best or Lowest 5 1,004
0.00
200
400
600
800
1,000
1,200
1,400
1,600
1,800 CCGs Similar 10 CCGs NHS Blackpool CCG England
1,246
934 975 1,005 1,050 1,052 1,0761,184
1,281 1,300
1,570
0.00
200
400
600
800
1,000
1,200
1,400
1,600
1,800
Thanet South Sefton North EastLincolnshire
Stoke on Trent St Helens Halton Knowsley Blackpool South Tees South Tyneside Sunderland
Page 26
Num. Source: NHS Business Services Authority
Den. Source: ASTRO-PU weighted populations for items 2017/18
NHS Blackpool CCG
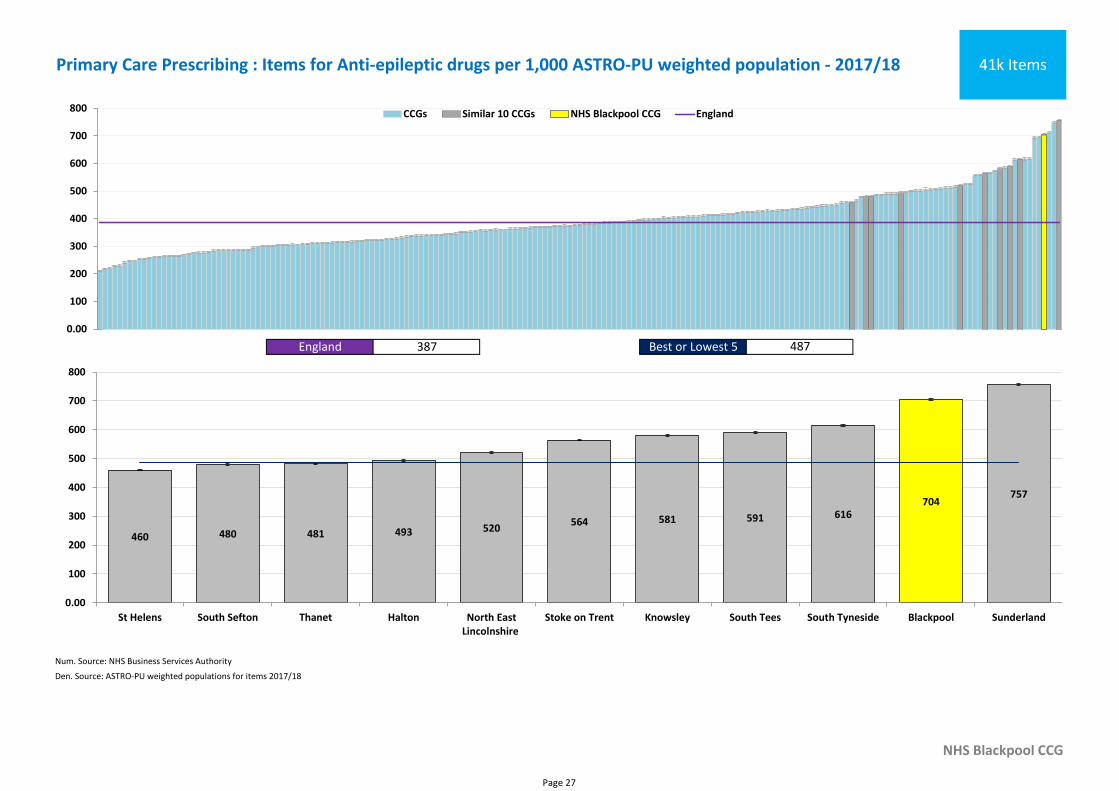
Primary Care Prescribing : Items for Anti-epileptic drugs per 1,000 ASTRO-PU weighted population - 2017/18 41k Items
England 387 Best or Lowest 5 487
0.00
100
200
300
400
500
600
700
800 CCGs Similar 10 CCGs NHS Blackpool CCG England
704
460 480 481 493 520564 581 591 616
757
0.00
100
200
300
400
500
600
700
800
St Helens South Sefton Thanet Halton North EastLincolnshire
Stoke on Trent Knowsley South Tees South Tyneside Blackpool Sunderland
Page 27
Num. Source: NHS Business Services Authority
Den. Source: ASTRO-PU weighted populations for items 2017/18
NHS Blackpool CCG
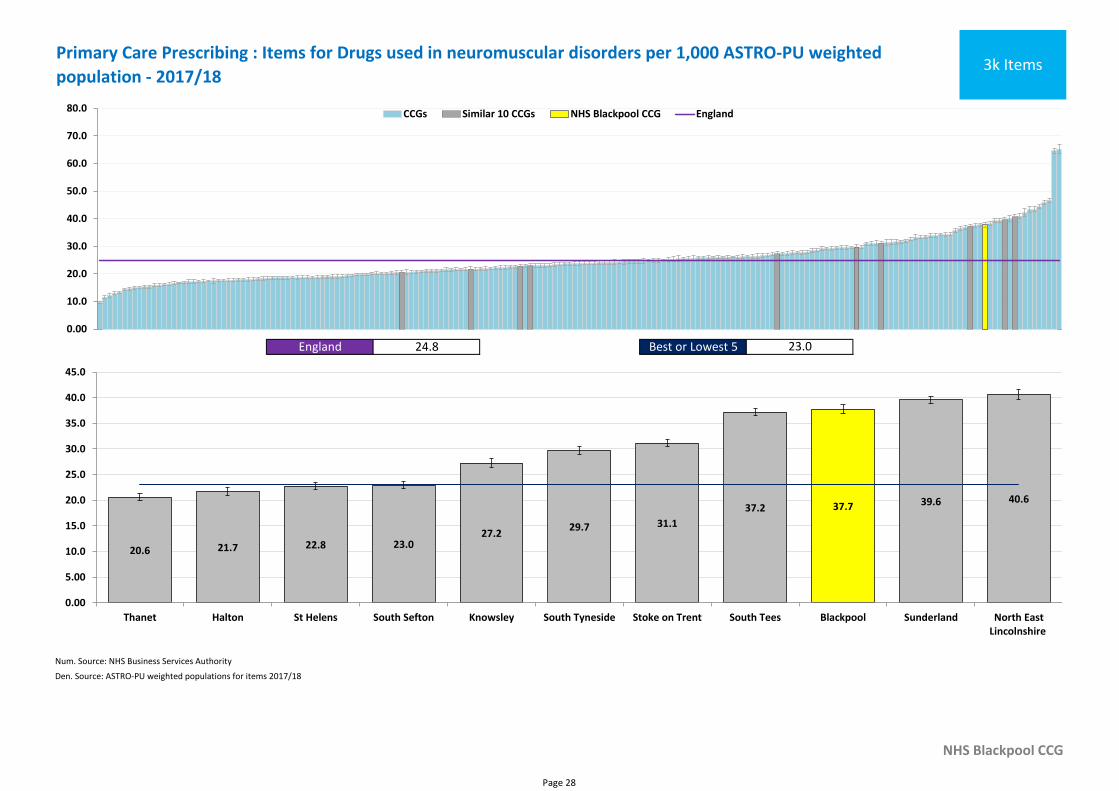
Primary Care Prescribing : Items for Drugs used in neuromuscular disorders per 1,000 ASTRO-PU weighted
population - 2017/183k Items
England 24.8 Best or Lowest 5 23.0
0.00
10.0
20.0
30.0
40.0
50.0
60.0
70.0
80.0 CCGs Similar 10 CCGs NHS Blackpool CCG England
37.7
20.6 21.7 22.8 23.027.2
29.7 31.1
37.239.6 40.6
0.00
5.00
10.0
15.0
20.0
25.0
30.0
35.0
40.0
45.0
Thanet Halton St Helens South Sefton Knowsley South Tyneside Stoke on Trent South Tees Blackpool Sunderland North EastLincolnshire
Page 28
Num. Source: NHS Business Services Authority
Den. Source: ASTRO-PU weighted populations for items 2017/18
NHS Blackpool CCG
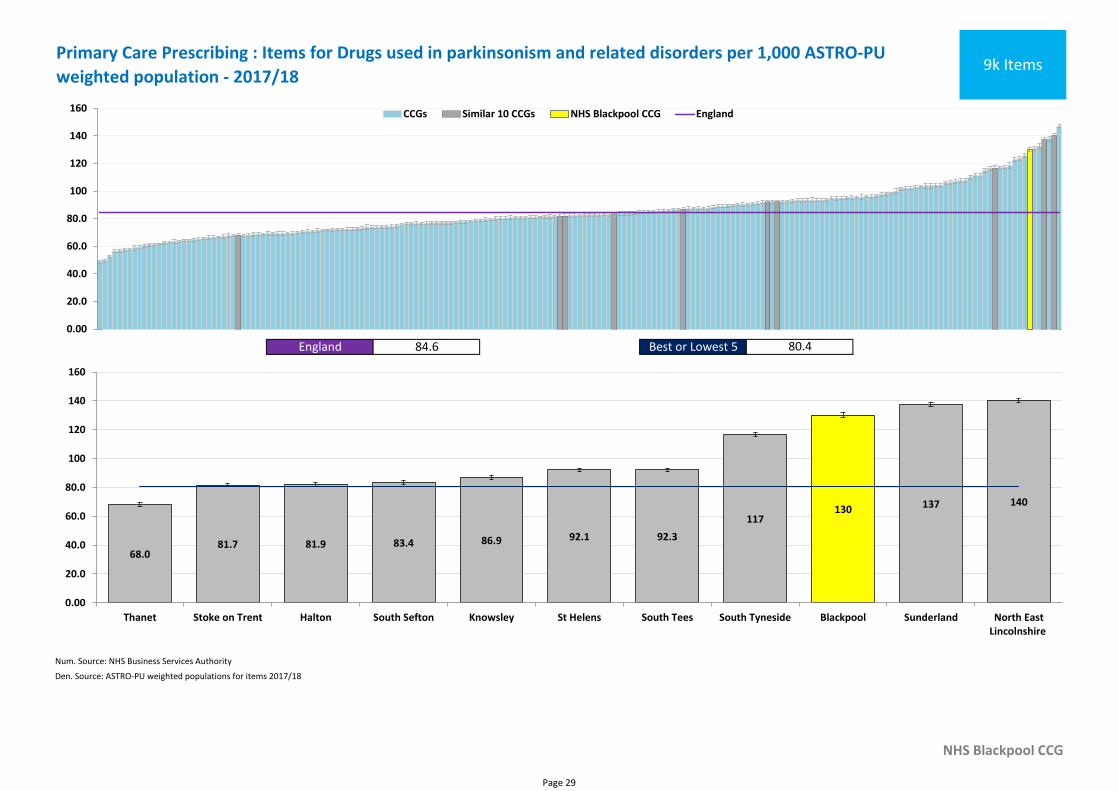
Primary Care Prescribing : Items for Drugs used in parkinsonism and related disorders per 1,000 ASTRO-PU
weighted population - 2017/189k Items
England 84.6 Best or Lowest 5 80.4
0.00
20.0
40.0
60.0
80.0
100
120
140
160 CCGs Similar 10 CCGs NHS Blackpool CCG England
130
68.081.7 81.9 83.4 86.9 92.1 92.3
117
137 140
0.00
20.0
40.0
60.0
80.0
100
120
140
160
Thanet Stoke on Trent Halton South Sefton Knowsley St Helens South Tees South Tyneside Blackpool Sunderland North EastLincolnshire
Page 29
Num. Source: NHS Business Services Authority
Den. Source: ASTRO-PU weighted populations for items 2017/18
NHS Blackpool CCG
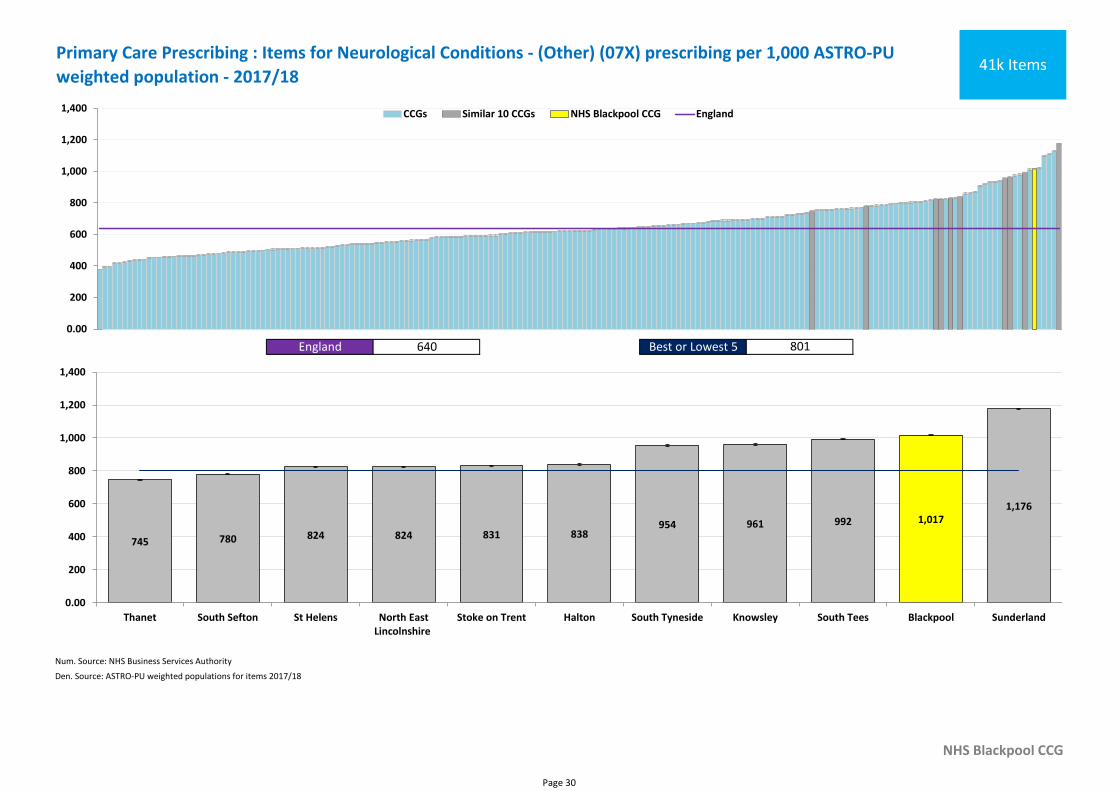
Primary Care Prescribing : Items for Neurological Conditions - (Other) (07X) prescribing per 1,000 ASTRO-PU
weighted population - 2017/1841k Items
England 640 Best or Lowest 5 801
0.00
200
400
600
800
1,000
1,200
1,400 CCGs Similar 10 CCGs NHS Blackpool CCG England
1,017
745 780 824 824 831 838954 961 992
1,176
0.00
200
400
600
800
1,000
1,200
1,400
Thanet South Sefton St Helens North EastLincolnshire
Stoke on Trent Halton South Tyneside Knowsley South Tees Blackpool Sunderland
Page 30
Section 4a - Secondary Care
• Inpatient spend
• Percentage of all admissions which are day case
• Average annual rate of admissions
• Percentage of admissions where the main consultant is a
Neurologist/Neurosurgeon
Page 31
Num. Source: National Commissioning Data Repository (NCDR) – Hospital Admissions Databases, SUS+ SEM (Secondary Uses Services Plus, Standard Extract Mart)
Den. Source: Mid-year GP registered population, NHAIS (National Health Application and Infrastructure Services), NHS Digital
NHS Blackpool CCG
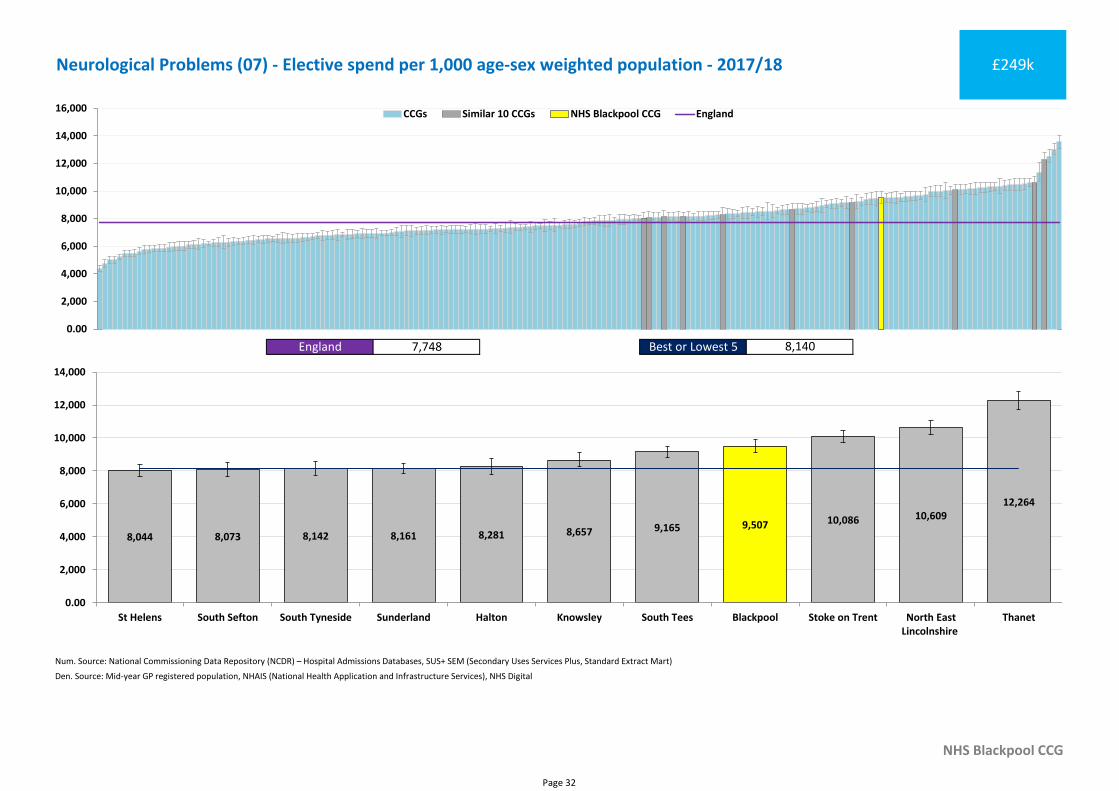
Neurological Problems (07) - Elective spend per 1,000 age-sex weighted population - 2017/18 £249k
England 7,748 Best or Lowest 5 8,140
0.00
2,000
4,000
6,000
8,000
10,000
12,000
14,000
16,000 CCGs Similar 10 CCGs NHS Blackpool CCG England
9,5078,044 8,073 8,142 8,161 8,281 8,657 9,165
10,086 10,60912,264
0.00
2,000
4,000
6,000
8,000
10,000
12,000
14,000
St Helens South Sefton South Tyneside Sunderland Halton Knowsley South Tees Blackpool Stoke on Trent North EastLincolnshire
Thanet
Page 32
Num. Source: National Commissioning Data Repository (NCDR) – Hospital Admissions Databases, SUS+ SEM (Secondary Uses Services Plus, Standard Extract Mart)
Den. Source: Mid-year GP registered population, NHAIS (National Health Application and Infrastructure Services), NHS Digital
NHS Blackpool CCG
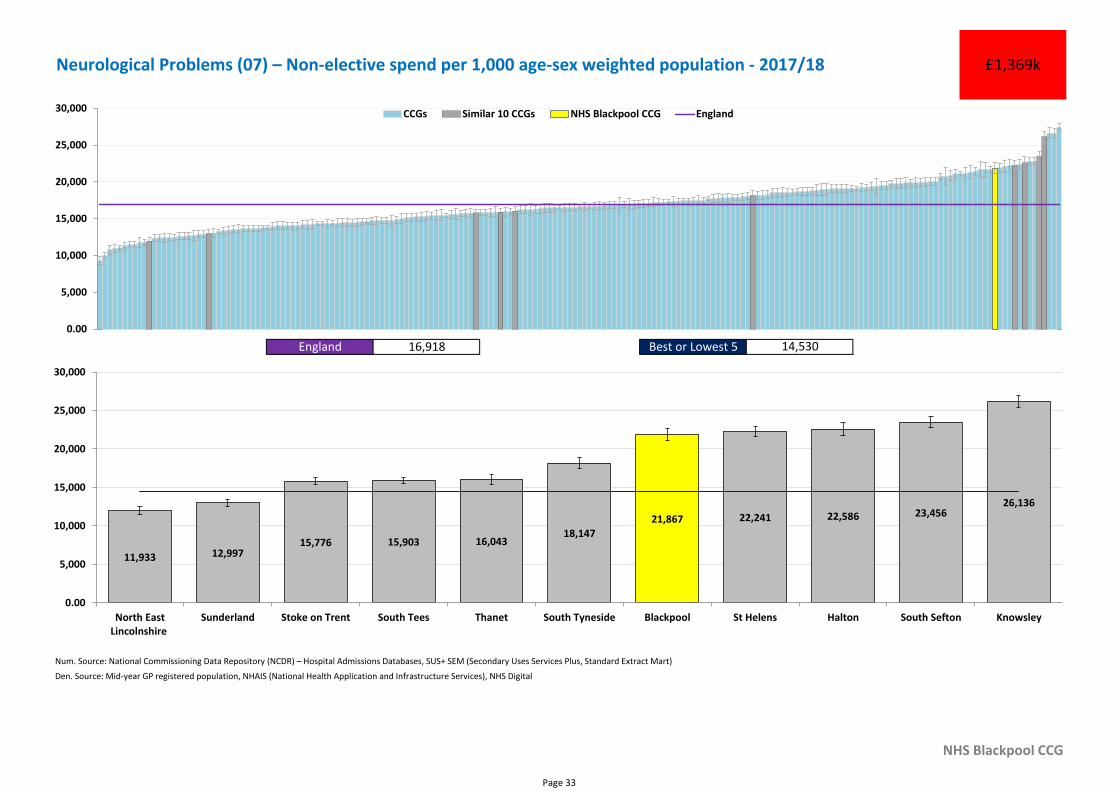
Neurological Problems (07) – Non-elective spend per 1,000 age-sex weighted population - 2017/18 £1,369k
England 16,918 Best or Lowest 5 14,530
0.00
5,000
10,000
15,000
20,000
25,000
30,000 CCGs Similar 10 CCGs NHS Blackpool CCG England
21,867
11,933 12,99715,776 15,903 16,043
18,147
22,241 22,586 23,45626,136
0.00
5,000
10,000
15,000
20,000
25,000
30,000
North EastLincolnshire
Sunderland Stoke on Trent South Tees Thanet South Tyneside Blackpool St Helens Halton South Sefton Knowsley
Page 33
Num. Source: National Commissioning Data Repository (NCDR) – Hospital Admissions Databases, SUS+ SEM (Secondary Uses Services Plus, Standard Extract Mart)
Den. Source: Mid-year GP registered population, NHAIS (National Health Application and Infrastructure Services), NHS Digital
NHS Blackpool CCG
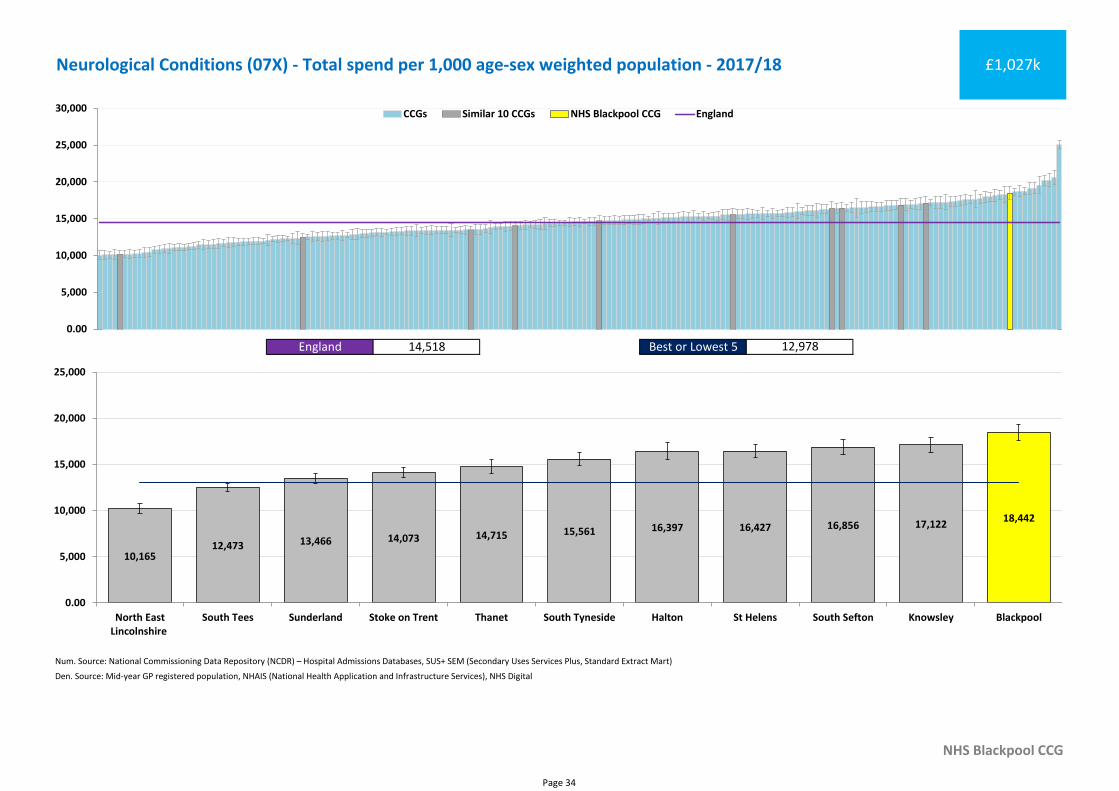
Neurological Conditions (07X) - Total spend per 1,000 age-sex weighted population - 2017/18 £1,027k
England 14,518 Best or Lowest 5 12,978
0.00
5,000
10,000
15,000
20,000
25,000
30,000 CCGs Similar 10 CCGs NHS Blackpool CCG England
18,442
10,16512,473 13,466 14,073 14,715 15,561 16,397 16,427 16,856 17,122
0.00
5,000
10,000
15,000
20,000
25,000
North EastLincolnshire
South Tees Sunderland Stoke on Trent Thanet South Tyneside Halton St Helens South Sefton Knowsley Blackpool
Page 34
Num. Source: National Commissioning Data Repository (NCDR) – Hospital Admissions Databases, SUS+ SEM (Secondary Uses Services Plus, Standard Extract Mart)
Den. Source: Mid-year GP registered population, NHAIS (National Health Application and Infrastructure Services), NHS Digital
NHS Blackpool CCG
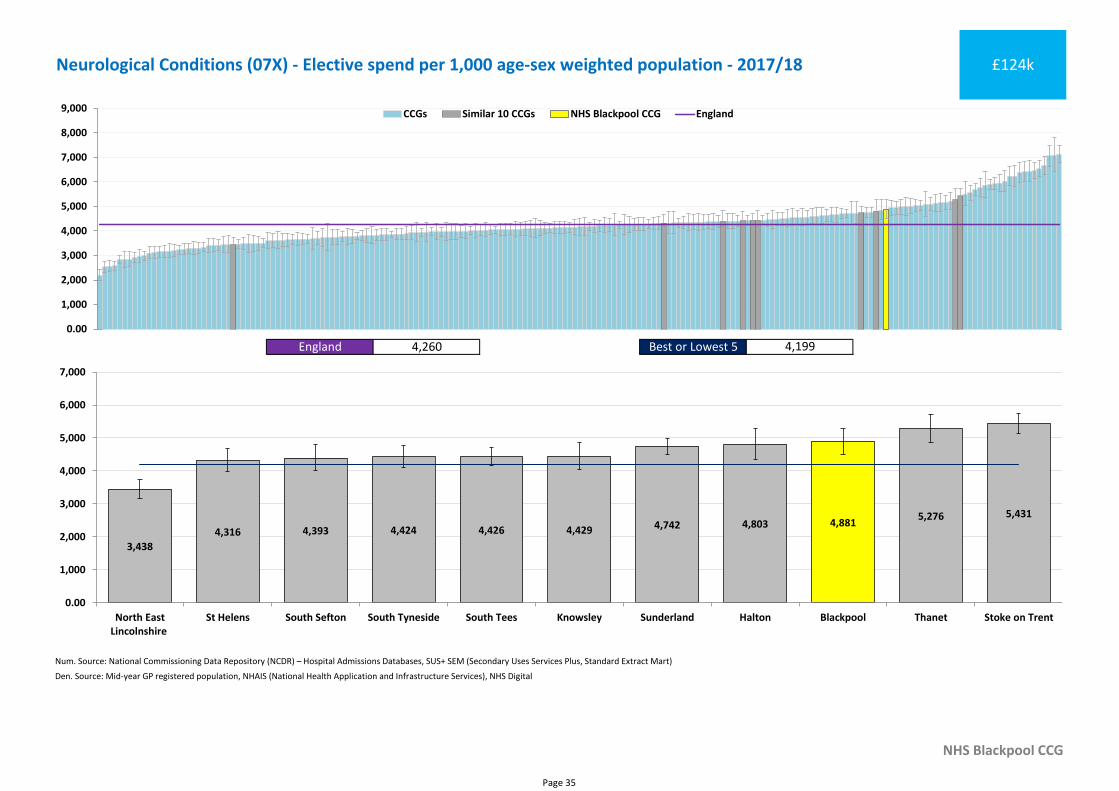
Neurological Conditions (07X) - Elective spend per 1,000 age-sex weighted population - 2017/18 £124k
England 4,260 Best or Lowest 5 4,199
0.00
1,000
2,000
3,000
4,000
5,000
6,000
7,000
8,000
9,000 CCGs Similar 10 CCGs NHS Blackpool CCG England
4,881
3,438
4,316 4,393 4,424 4,426 4,429 4,742 4,8035,276 5,431
0.00
1,000
2,000
3,000
4,000
5,000
6,000
7,000
North EastLincolnshire
St Helens South Sefton South Tyneside South Tees Knowsley Sunderland Halton Blackpool Thanet Stoke on Trent
Page 35
Num. Source: National Commissioning Data Repository (NCDR) – Hospital Admissions Databases, SUS+ SEM (Secondary Uses Services Plus, Standard Extract Mart)
Den. Source: Mid-year GP registered population, NHAIS (National Health Application and Infrastructure Services), NHS Digital
NHS Blackpool CCG
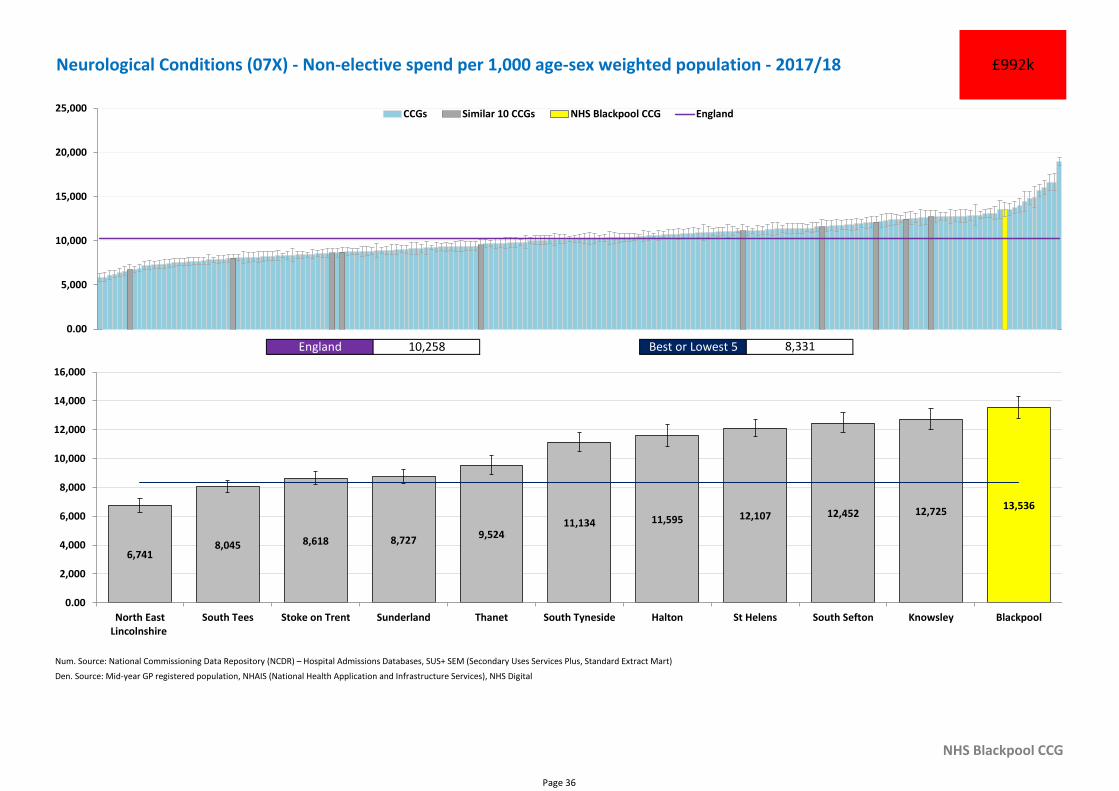
Neurological Conditions (07X) - Non-elective spend per 1,000 age-sex weighted population - 2017/18 £992k
England 10,258 Best or Lowest 5 8,331
0.00
5,000
10,000
15,000
20,000
25,000 CCGs Similar 10 CCGs NHS Blackpool CCG England
13,536
6,7418,045 8,618 8,727
9,52411,134 11,595 12,107 12,452 12,725
0.00
2,000
4,000
6,000
8,000
10,000
12,000
14,000
16,000
North EastLincolnshire
South Tees Stoke on Trent Sunderland Thanet South Tyneside Halton St Helens South Sefton Knowsley Blackpool
Page 36
Num. Source: National Commissioning Data Repository (NCDR) – Hospital Admissions Databases, SUS+ SEM (Secondary Uses Services Plus, Standard Extract Mart)
Den. Source: National Commissioning Data Repository (NCDR) – Hospital Admissions Databases, SUS+ SEM (Secondary Uses Services Plus, Standard Extract Mart)
NHS Blackpool CCG
Caveats: Benchmarked to the highest 5
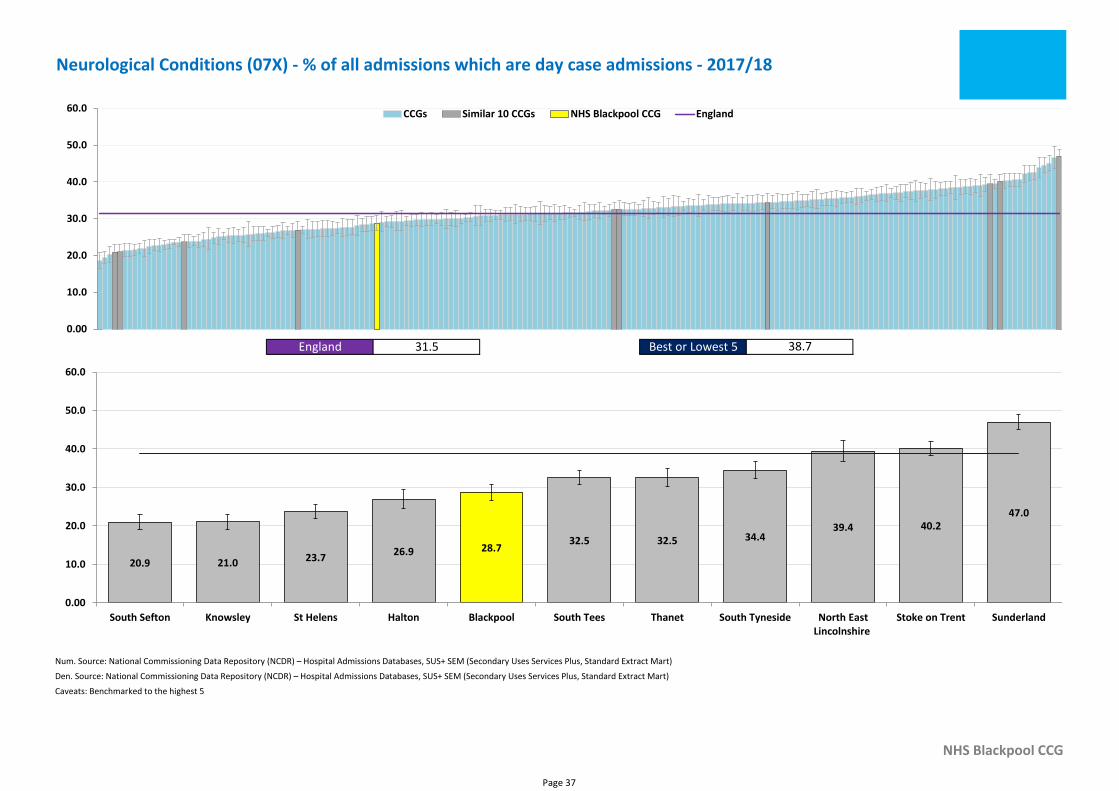
Neurological Conditions (07X) - % of all admissions which are day case admissions - 2017/18
England 31.5 Best or Lowest 5 38.7
0.00
10.0
20.0
30.0
40.0
50.0
60.0 CCGs Similar 10 CCGs NHS Blackpool CCG England
28.7
20.9 21.0 23.726.9
32.5 32.5 34.439.4 40.2
47.0
0.00
10.0
20.0
30.0
40.0
50.0
60.0
South Sefton Knowsley St Helens Halton Blackpool South Tees Thanet South Tyneside North EastLincolnshire
Stoke on Trent Sunderland
Page 37
Num. Source: National Commissioning Data Repository (NCDR) – Hospital Admissions Databases, SUS+ SEM (Secondary Uses Services Plus, Standard Extract Mart)
Den. Source: Mid-year GP registered population, NHAIS (National Health Application and Infrastructure Services), NHS Digital
NHS Blackpool CCG
Caveats: Neurological condition group classifications in this pack are based on the Public Health England Neurology Intelligence Network classification of Neurological Conditions: https://www.gov.uk/guidance/neurology-data-and-analysis-a-guide-for-health-
professionals
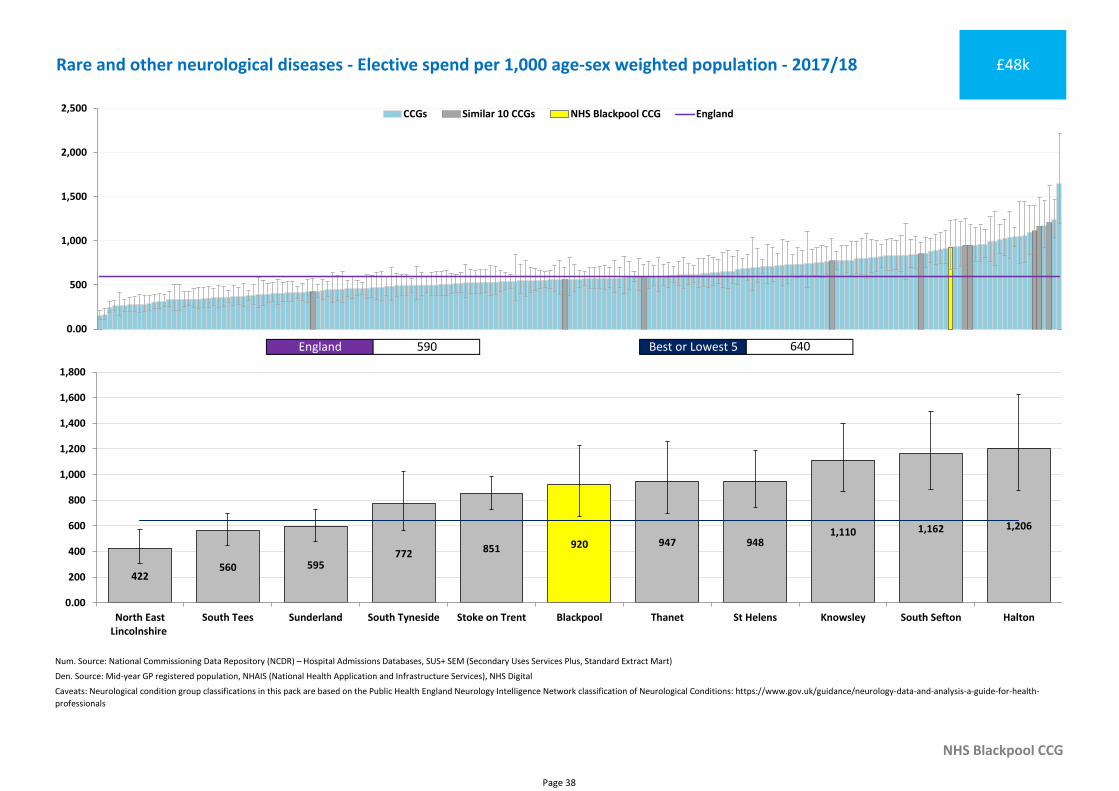
Rare and other neurological diseases - Elective spend per 1,000 age-sex weighted population - 2017/18 £48k
England 590 Best or Lowest 5 640
0.00
500
1,000
1,500
2,000
2,500 CCGs Similar 10 CCGs NHS Blackpool CCG England
920
422560 595
772 851947 948
1,110 1,162 1,206
0.00
200
400
600
800
1,000
1,200
1,400
1,600
1,800
North EastLincolnshire
South Tees Sunderland South Tyneside Stoke on Trent Blackpool Thanet St Helens Knowsley South Sefton Halton
Page 38
Num. Source: National Commissioning Data Repository (NCDR) – Hospital Admissions Databases, SUS+ SEM (Secondary Uses Services Plus, Standard Extract Mart)
Den. Source: Mid-year GP registered population, NHAIS (National Health Application and Infrastructure Services), NHS Digital
NHS Blackpool CCG
Caveats: Neurological condition group classifications in this pack are based on the Public Health England Neurology Intelligence Network classification of Neurological Conditions: https://www.gov.uk/guidance/neurology-data-and-analysis-a-guide-for-health-
professionals
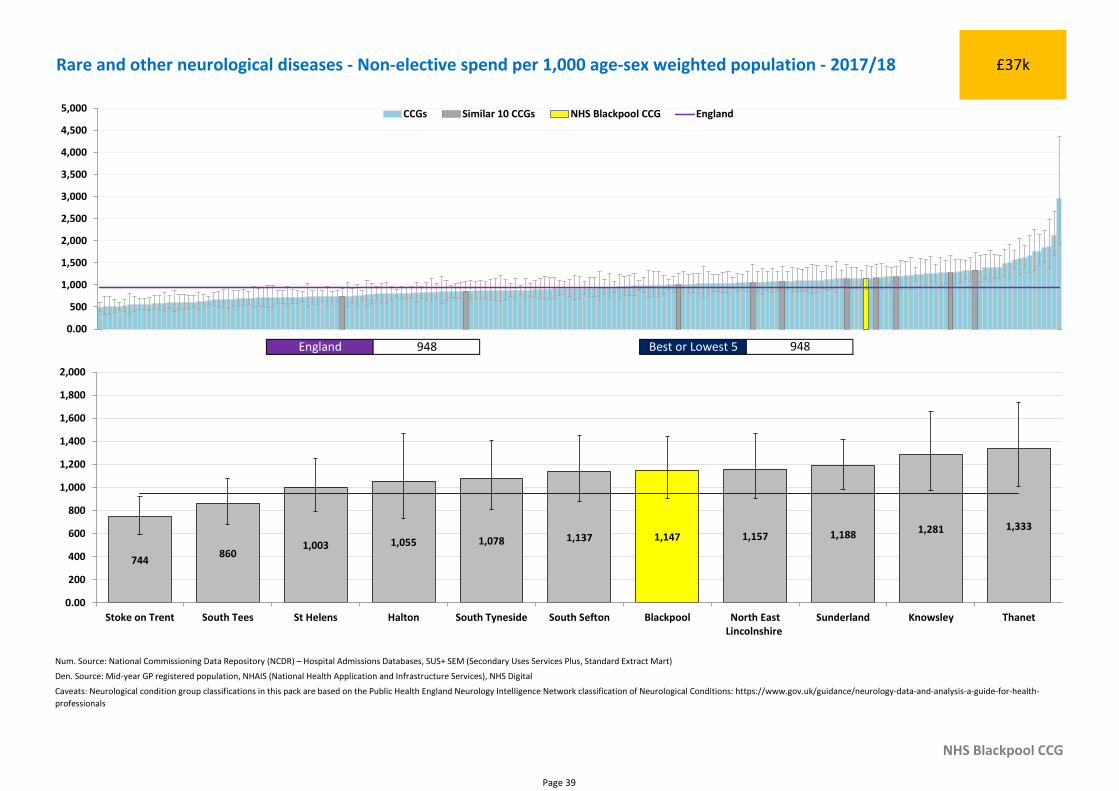
Rare and other neurological diseases - Non-elective spend per 1,000 age-sex weighted population - 2017/18 £37k
England 948 Best or Lowest 5 948
0.00
500
1,000
1,500
2,000
2,500
3,000
3,500
4,000
4,500
5,000 CCGs Similar 10 CCGs NHS Blackpool CCG England
1,147
744860
1,003 1,055 1,078 1,137 1,157 1,188 1,281 1,333
0.00
200
400
600
800
1,000
1,200
1,400
1,600
1,800
2,000
Stoke on Trent South Tees St Helens Halton South Tyneside South Sefton Blackpool North EastLincolnshire
Sunderland Knowsley Thanet
Page 39
Num. Source: National Commissioning Data Repository (NCDR) – Hospital Admissions Databases, SUS+ SEM (Secondary Uses Services Plus, Standard Extract Mart)
Den. Source: Mid-year GP registered populations, NHAIS (National Health Application and Infrastructure Services), NHS Digital
NHS Blackpool CCG
Caveats: Neurological condition group classifications in this pack are based on the Public Health England Neurology Intelligence Network classification of Neurological Conditions: https://www.gov.uk/guidance/neurology-data-and-analysis-a-guide-for-health-
professionals
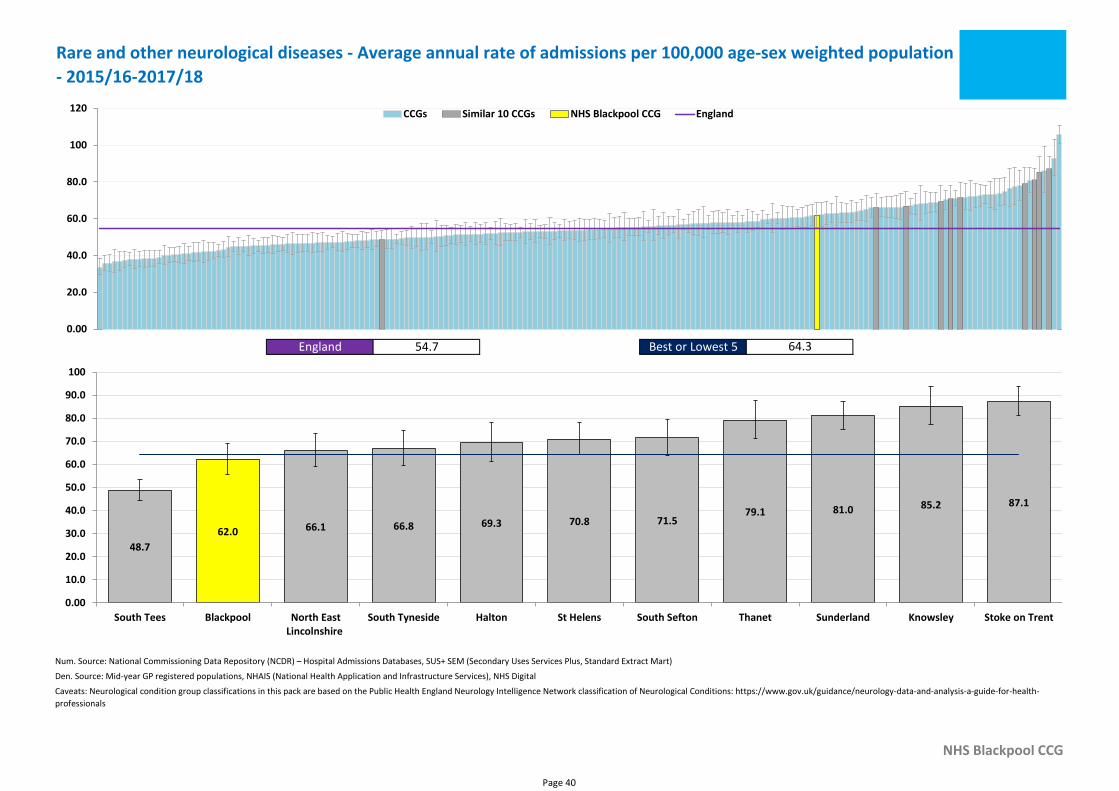
Rare and other neurological diseases - Average annual rate of admissions per 100,000 age-sex weighted population
- 2015/16-2017/18
England 54.7 Best or Lowest 5 64.3
0.00
20.0
40.0
60.0
80.0
100
120 CCGs Similar 10 CCGs NHS Blackpool CCG England
62.0
48.7
66.1 66.8 69.3 70.8 71.579.1 81.0 85.2 87.1
0.00
10.0
20.0
30.0
40.0
50.0
60.0
70.0
80.0
90.0
100
South Tees Blackpool North EastLincolnshire
South Tyneside Halton St Helens South Sefton Thanet Sunderland Knowsley Stoke on Trent
Page 40
Num. Source: National Commissioning Data Repository (NCDR) – Hospital Admissions Databases, SUS+ SEM (Secondary Uses Services Plus, Standard Extract Mart)
Den. Source: National Commissioning Data Repository (NCDR) – Hospital Admissions Databases, SUS+ SEM (Secondary Uses Services Plus, Standard Extract Mart)
NHS Blackpool CCG
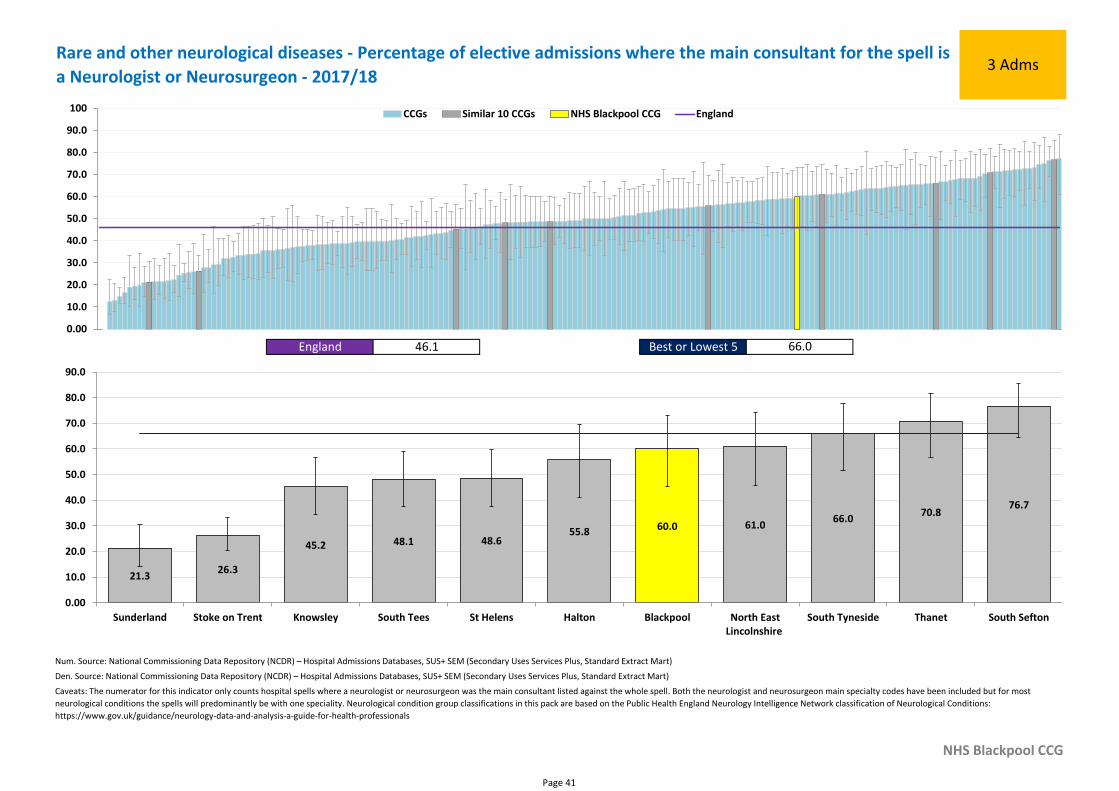
Caveats: The numerator for this indicator only counts hospital spells where a neurologist or neurosurgeon was the main consultant listed against the whole spell. Both the neurologist and neurosurgeon main specialty codes have been included but for most
neurological conditions the spells will predominantly be with one speciality. Neurological condition group classifications in this pack are based on the Public Health England Neurology Intelligence Network classification of Neurological Conditions:
https://www.gov.uk/guidance/neurology-data-and-analysis-a-guide-for-health-professionals
Rare and other neurological diseases - Percentage of elective admissions where the main consultant for the spell is
a Neurologist or Neurosurgeon - 2017/183 Adms
England 46.1 Best or Lowest 5 66.0
0.00
10.0
20.0
30.0
40.0
50.0
60.0
70.0
80.0
90.0
100 CCGs Similar 10 CCGs NHS Blackpool CCG England
60.0
21.326.3
45.2 48.1 48.655.8
61.066.0
70.876.7
0.00
10.0
20.0
30.0
40.0
50.0
60.0
70.0
80.0
90.0
Sunderland Stoke on Trent Knowsley South Tees St Helens Halton Blackpool North EastLincolnshire
South Tyneside Thanet South Sefton
Page 41
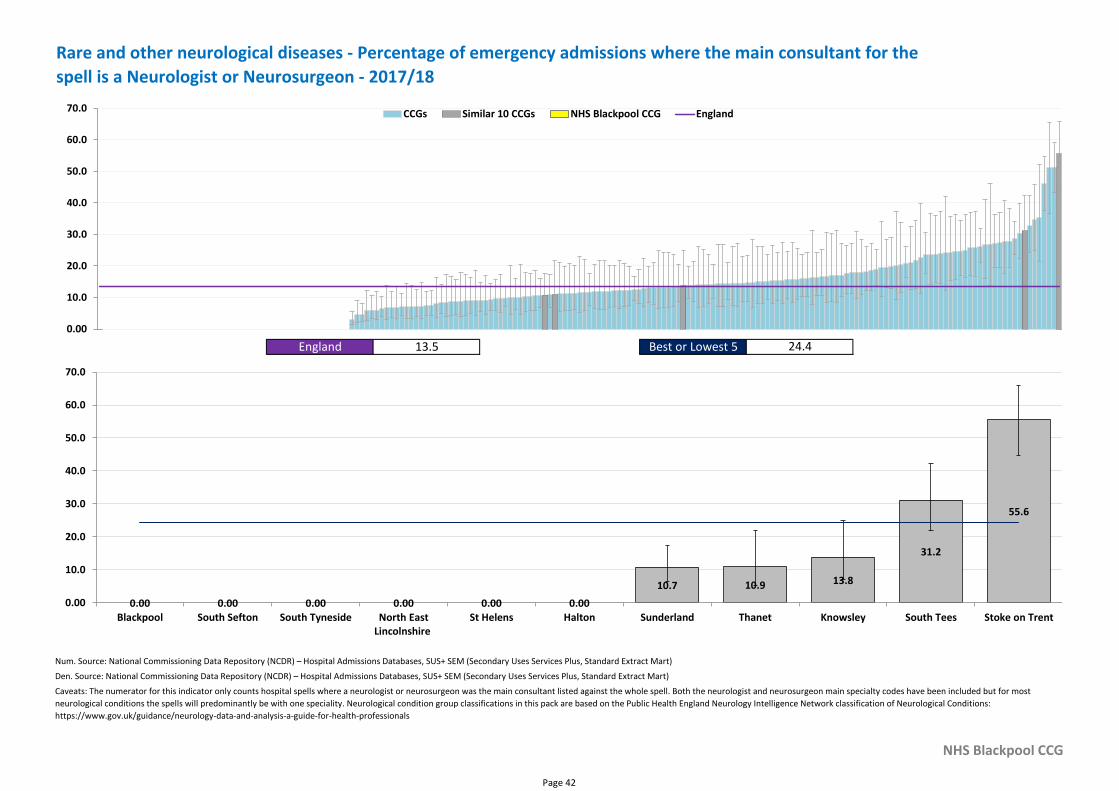
Num. Source: National Commissioning Data Repository (NCDR) – Hospital Admissions Databases, SUS+ SEM (Secondary Uses Services Plus, Standard Extract Mart)
Den. Source: National Commissioning Data Repository (NCDR) – Hospital Admissions Databases, SUS+ SEM (Secondary Uses Services Plus, Standard Extract Mart)
NHS Blackpool CCG
Caveats: The numerator for this indicator only counts hospital spells where a neurologist or neurosurgeon was the main consultant listed against the whole spell. Both the neurologist and neurosurgeon main specialty codes have been included but for most
neurological conditions the spells will predominantly be with one speciality. Neurological condition group classifications in this pack are based on the Public Health England Neurology Intelligence Network classification of Neurological Conditions:
https://www.gov.uk/guidance/neurology-data-and-analysis-a-guide-for-health-professionals
Rare and other neurological diseases - Percentage of emergency admissions where the main consultant for the
spell is a Neurologist or Neurosurgeon - 2017/18
England 13.5 Best or Lowest 5 24.4
0.00
10.0
20.0
30.0
40.0
50.0
60.0
70.0 CCGs Similar 10 CCGs NHS Blackpool CCG England
0.00 0.00 0.00 0.00 0.00 0.00
10.7 10.9 13.8
31.2
55.6
0.00
10.0
20.0
30.0
40.0
50.0
60.0
70.0
Blackpool South Sefton South Tyneside North EastLincolnshire
St Helens Halton Sunderland Thanet Knowsley South Tees Stoke on Trent
Page 42
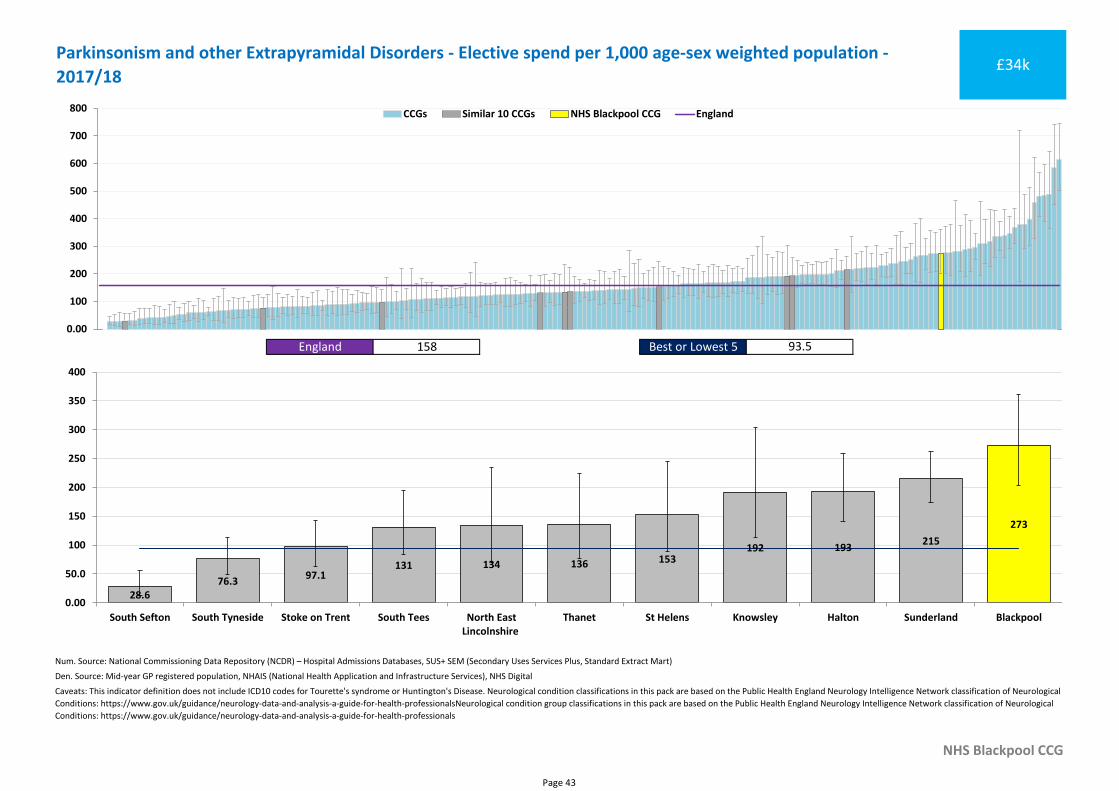
Num. Source: National Commissioning Data Repository (NCDR) – Hospital Admissions Databases, SUS+ SEM (Secondary Uses Services Plus, Standard Extract Mart)
Den. Source: Mid-year GP registered population, NHAIS (National Health Application and Infrastructure Services), NHS Digital
NHS Blackpool CCG
Caveats: This indicator definition does not include ICD10 codes for Tourette's syndrome or Huntington's Disease. Neurological condition classifications in this pack are based on the Public Health England Neurology Intelligence Network classification of Neurological
Conditions: https://www.gov.uk/guidance/neurology-data-and-analysis-a-guide-for-health-professionalsNeurological condition group classifications in this pack are based on the Public Health England Neurology Intelligence Network classification of Neurological
Conditions: https://www.gov.uk/guidance/neurology-data-and-analysis-a-guide-for-health-professionals
Parkinsonism and other Extrapyramidal Disorders - Elective spend per 1,000 age-sex weighted population -
2017/18£34k
England 158 Best or Lowest 5 93.5
0.00
100
200
300
400
500
600
700
800 CCGs Similar 10 CCGs NHS Blackpool CCG England
273
28.676.3
97.1131 134 136 153
192 193215
0.00
50.0
100
150
200
250
300
350
400
South Sefton South Tyneside Stoke on Trent South Tees North EastLincolnshire
Thanet St Helens Knowsley Halton Sunderland Blackpool
Page 43
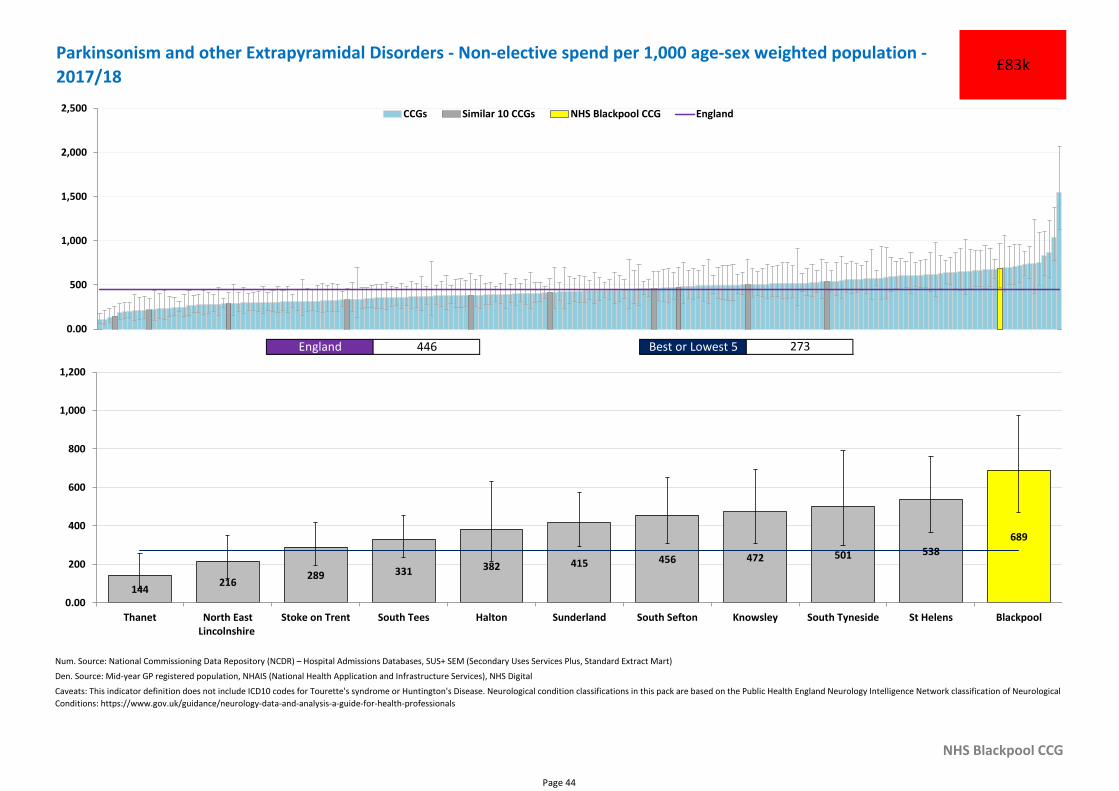
Num. Source: National Commissioning Data Repository (NCDR) – Hospital Admissions Databases, SUS+ SEM (Secondary Uses Services Plus, Standard Extract Mart)
Den. Source: Mid-year GP registered population, NHAIS (National Health Application and Infrastructure Services), NHS Digital
NHS Blackpool CCG
Caveats: This indicator definition does not include ICD10 codes for Tourette's syndrome or Huntington's Disease. Neurological condition classifications in this pack are based on the Public Health England Neurology Intelligence Network classification of Neurological
Conditions: https://www.gov.uk/guidance/neurology-data-and-analysis-a-guide-for-health-professionals
Parkinsonism and other Extrapyramidal Disorders - Non-elective spend per 1,000 age-sex weighted population -
2017/18£83k
England 446 Best or Lowest 5 273
0.00
500
1,000
1,500
2,000
2,500 CCGs Similar 10 CCGs NHS Blackpool CCG England
689
144216
289 331 382 415 456 472 501 538
0.00
200
400
600
800
1,000
1,200
Thanet North EastLincolnshire
Stoke on Trent South Tees Halton Sunderland South Sefton Knowsley South Tyneside St Helens Blackpool
Page 44
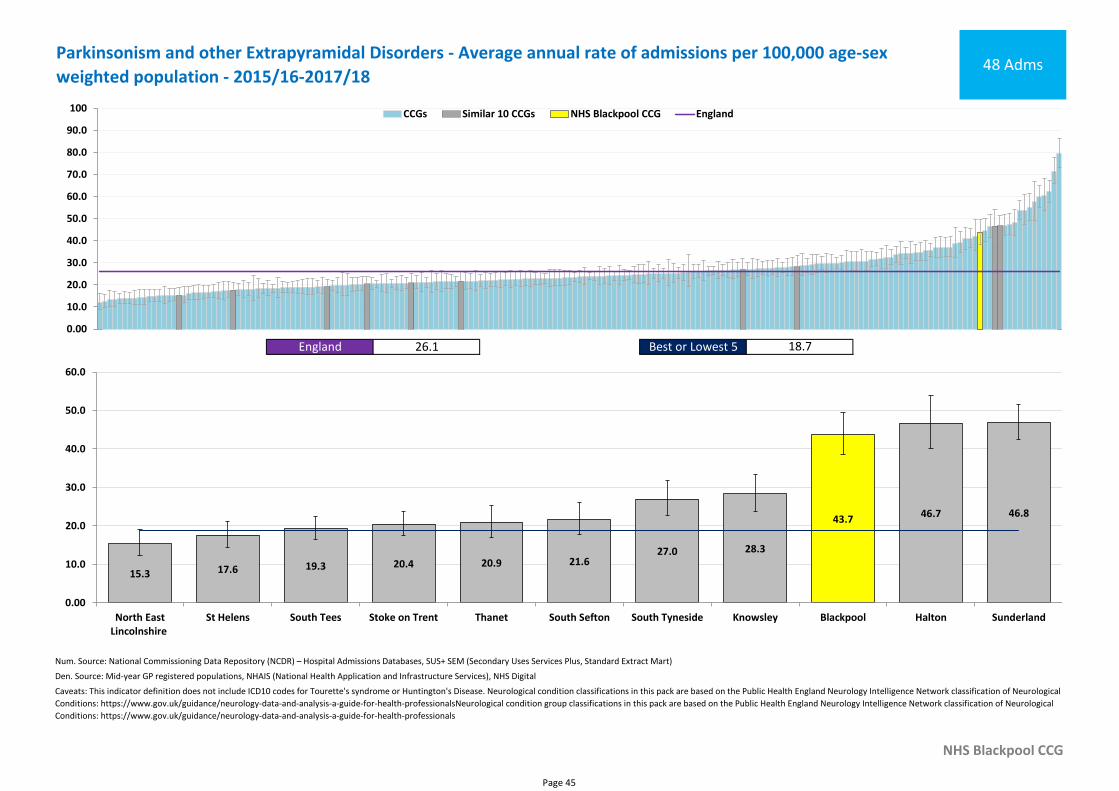
Num. Source: National Commissioning Data Repository (NCDR) – Hospital Admissions Databases, SUS+ SEM (Secondary Uses Services Plus, Standard Extract Mart)
Den. Source: Mid-year GP registered populations, NHAIS (National Health Application and Infrastructure Services), NHS Digital
NHS Blackpool CCG
Caveats: This indicator definition does not include ICD10 codes for Tourette's syndrome or Huntington's Disease. Neurological condition classifications in this pack are based on the Public Health England Neurology Intelligence Network classification of Neurological
Conditions: https://www.gov.uk/guidance/neurology-data-and-analysis-a-guide-for-health-professionalsNeurological condition group classifications in this pack are based on the Public Health England Neurology Intelligence Network classification of Neurological
Conditions: https://www.gov.uk/guidance/neurology-data-and-analysis-a-guide-for-health-professionals
Parkinsonism and other Extrapyramidal Disorders - Average annual rate of admissions per 100,000 age-sex
weighted population - 2015/16-2017/1848 Adms
England 26.1 Best or Lowest 5 18.7
0.00
10.0
20.0
30.0
40.0
50.0
60.0
70.0
80.0
90.0
100 CCGs Similar 10 CCGs NHS Blackpool CCG England
43.7
15.3 17.6 19.3 20.4 20.9 21.627.0 28.3
46.7 46.8
0.00
10.0
20.0
30.0
40.0
50.0
60.0
North EastLincolnshire
St Helens South Tees Stoke on Trent Thanet South Sefton South Tyneside Knowsley Blackpool Halton Sunderland
Page 45
Num. Source: National Commissioning Data Repository (NCDR) – Hospital Admissions Databases, SUS+ SEM (Secondary Uses Services Plus, Standard Extract Mart)
Den. Source: National Commissioning Data Repository (NCDR) – Hospital Admissions Databases, SUS+ SEM (Secondary Uses Services Plus, Standard Extract Mart)
NHS Blackpool CCG
Caveats: The numerator for this indicator only counts hospital spells where a neurologist or neurosurgeon was the main consultant listed against the whole spell. Both the neurologist and neurosurgeon main specialty codes have been included but for most
neurological conditions the spells will predominantly be with one speciality. This indicator definition does not include ICD10 codes for Tourette's syndrome or Huntington's Disease. Neurological condition group classifications in this pack are based on the Public
Health England Neurology Intelligence Network classification of Neurological Conditions: https://www.gov.uk/guidance/neurology-data-and-analysis-a-guide-for-health-professionals
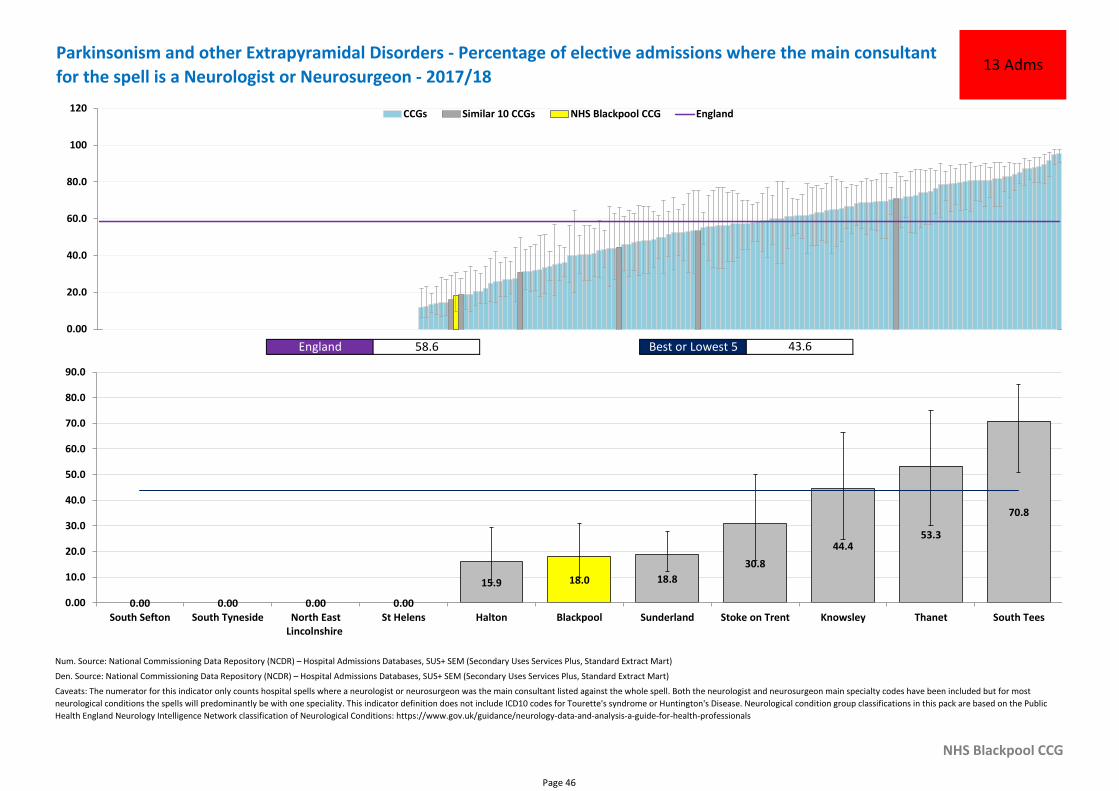
Parkinsonism and other Extrapyramidal Disorders - Percentage of elective admissions where the main consultant
for the spell is a Neurologist or Neurosurgeon - 2017/1813 Adms
England 58.6 Best or Lowest 5 43.6
0.00
20.0
40.0
60.0
80.0
100
120 CCGs Similar 10 CCGs NHS Blackpool CCG England
18.0
0.00 0.00 0.00 0.00
15.9 18.8
30.8
44.453.3
70.8
0.00
10.0
20.0
30.0
40.0
50.0
60.0
70.0
80.0
90.0
South Sefton South Tyneside North EastLincolnshire
St Helens Halton Blackpool Sunderland Stoke on Trent Knowsley Thanet South Tees
Page 46
Num. Source: National Commissioning Data Repository (NCDR) – Hospital Admissions Databases, SUS+ SEM (Secondary Uses Services Plus, Standard Extract Mart)
Den. Source: Mid-year GP registered population, NHAIS (National Health Application and Infrastructure Services), NHS Digital
NHS Blackpool CCG
Caveats: Some of the ICD10 codes in this indicator come under the Musculoskeletal Programme Budget Category (15X). The remainder come under Neurological Conditions (07X). Neurological condition group classifications in this pack are based on the Public
Health England Neurology Intelligence Network classification of Neurological Conditions: https://www.gov.uk/guidance/neurology-data-and-analysis-a-guide-for-health-professionals
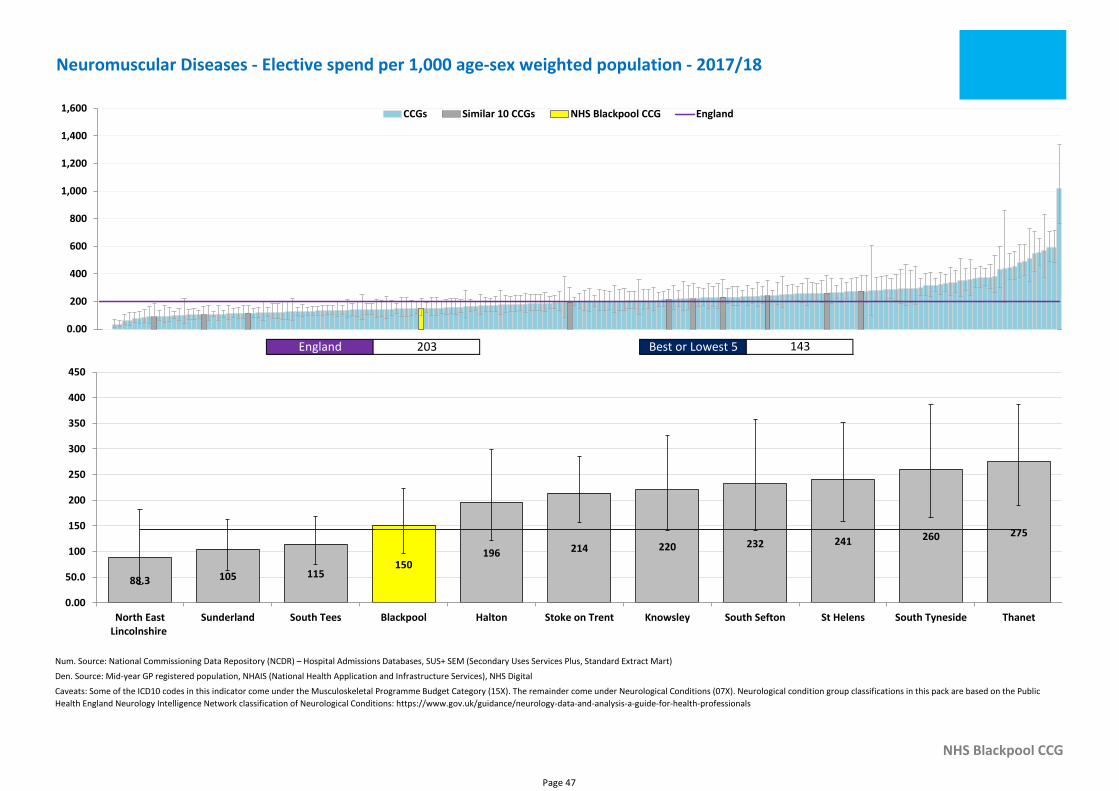
Neuromuscular Diseases - Elective spend per 1,000 age-sex weighted population - 2017/18
England 203 Best or Lowest 5 143
0.00
200
400
600
800
1,000
1,200
1,400
1,600 CCGs Similar 10 CCGs NHS Blackpool CCG England
150
88.3 105 115
196 214 220 232 241 260 275
0.00
50.0
100
150
200
250
300
350
400
450
North EastLincolnshire
Sunderland South Tees Blackpool Halton Stoke on Trent Knowsley South Sefton St Helens South Tyneside Thanet
Page 47
Num. Source: National Commissioning Data Repository (NCDR) – Hospital Admissions Databases, SUS+ SEM (Secondary Uses Services Plus, Standard Extract Mart)
Den. Source: Mid-year GP registered population, NHAIS (National Health Application and Infrastructure Services), NHS Digital
NHS Blackpool CCG
Caveats: Some of the ICD10 codes in this indicator come under the Musculoskeletal Programme Budget Category (15X). The remainder come under Neurological Conditions (07X). Neurological condition group classifications in this pack are based on the Public
Health England Neurology Intelligence Network classification of Neurological Conditions: https://www.gov.uk/guidance/neurology-data-and-analysis-a-guide-for-health-professionals
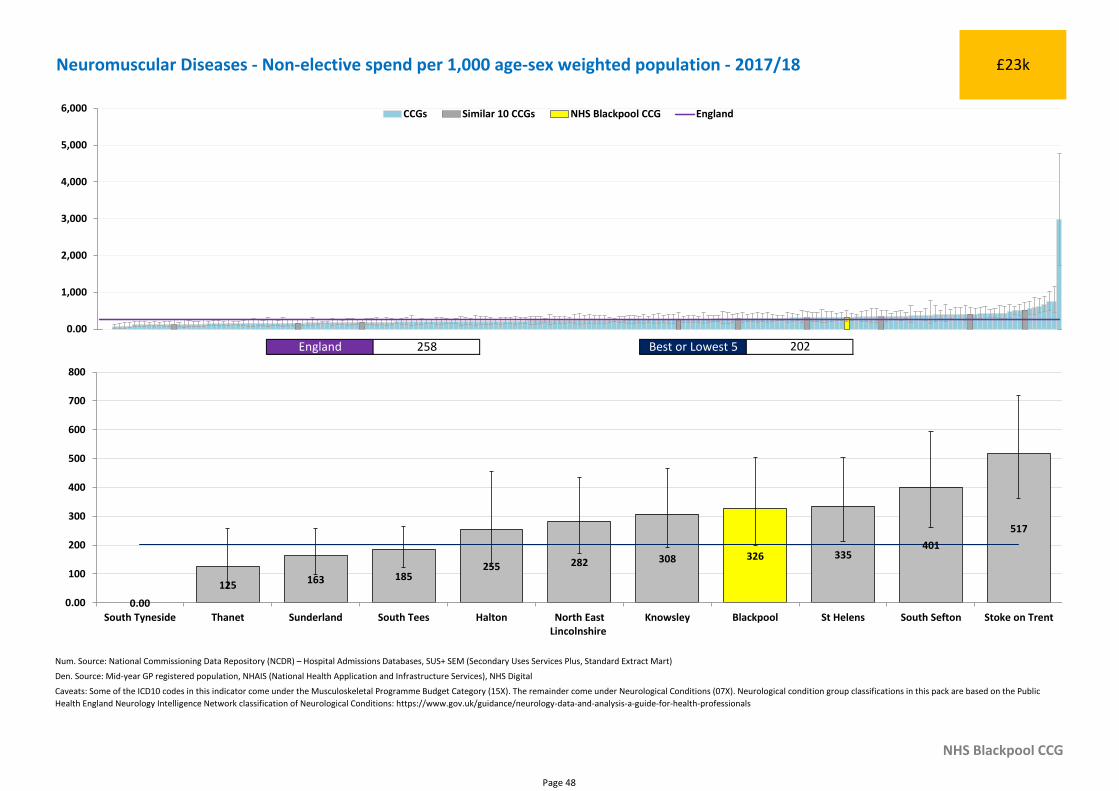
Neuromuscular Diseases - Non-elective spend per 1,000 age-sex weighted population - 2017/18 £23k
England 258 Best or Lowest 5 202
0.00
1,000
2,000
3,000
4,000
5,000
6,000 CCGs Similar 10 CCGs NHS Blackpool CCG England
326
0.00
125 163 185255 282 308 335
401
517
0.00
100
200
300
400
500
600
700
800
South Tyneside Thanet Sunderland South Tees Halton North EastLincolnshire
Knowsley Blackpool St Helens South Sefton Stoke on Trent
Page 48
Num. Source: National Commissioning Data Repository (NCDR) – Hospital Admissions Databases, SUS+ SEM (Secondary Uses Services Plus, Standard Extract Mart)
Den. Source: Mid-year GP registered populations, NHAIS (National Health Application and Infrastructure Services), NHS Digital
NHS Blackpool CCG
Caveats: Some of the ICD10 codes in this indicator come under the Musculoskeletal Programme Budget Category (15X). The remainder come under Neurological Conditions (07X). Neurological condition group classifications in this pack are based on the Public
Health England Neurology Intelligence Network classification of Neurological Conditions: https://www.gov.uk/guidance/neurology-data-and-analysis-a-guide-for-health-professionals
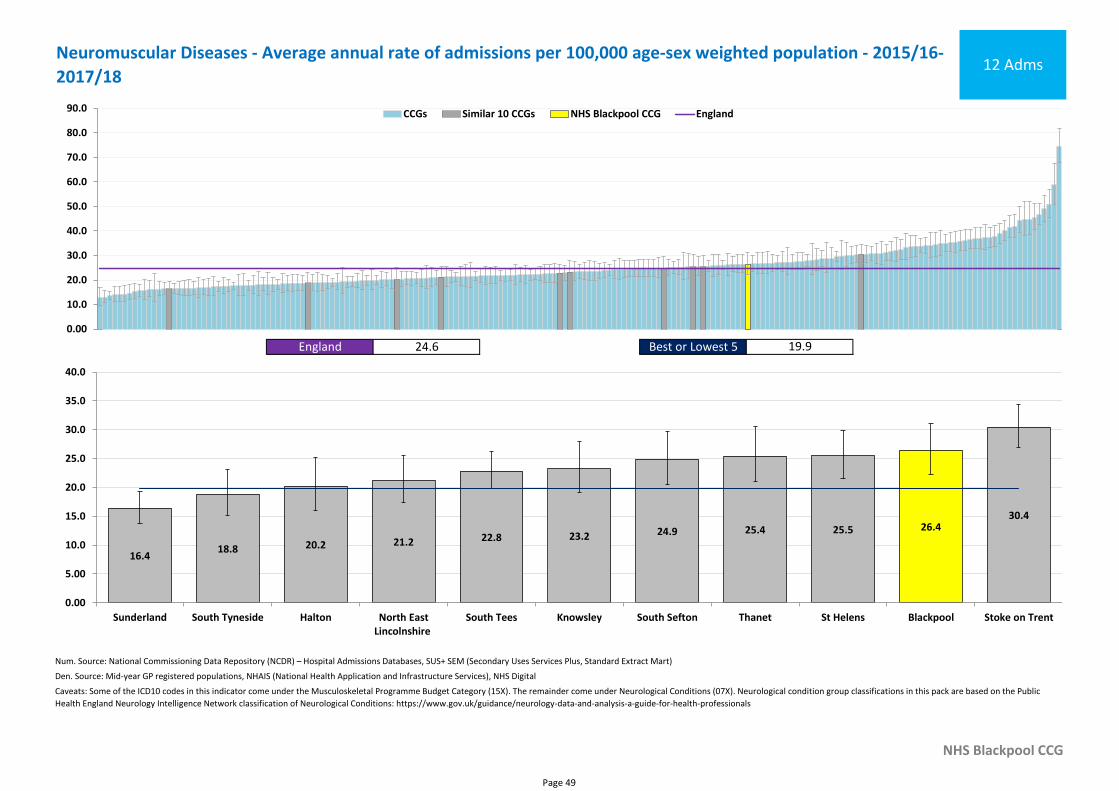
Neuromuscular Diseases - Average annual rate of admissions per 100,000 age-sex weighted population - 2015/16-
2017/1812 Adms
England 24.6 Best or Lowest 5 19.9
0.00
10.0
20.0
30.0
40.0
50.0
60.0
70.0
80.0
90.0 CCGs Similar 10 CCGs NHS Blackpool CCG England
26.4
16.418.8 20.2 21.2 22.8 23.2 24.9 25.4 25.5
30.4
0.00
5.00
10.0
15.0
20.0
25.0
30.0
35.0
40.0
Sunderland South Tyneside Halton North EastLincolnshire
South Tees Knowsley South Sefton Thanet St Helens Blackpool Stoke on Trent
Page 49
Num. Source: National Commissioning Data Repository (NCDR) – Hospital Admissions Databases, SUS+ SEM (Secondary Uses Services Plus, Standard Extract Mart)
Den. Source: National Commissioning Data Repository (NCDR) – Hospital Admissions Databases, SUS+ SEM (Secondary Uses Services Plus, Standard Extract Mart)
NHS Blackpool CCG
Caveats: The numerator for this indicator only counts hospital spells where a neurologist or neurosurgeon was the main consultant listed against the whole spell. Both the neurologist and neurosurgeon main specialty codes have been included but for most
neurological conditions the spells will predominantly be with one speciality. Some of the ICD10 codes in this indicator come under the Musculoskeletal Programme Budget Category (15X). The remainder come under Neurological Conditions (07X). Neurological
condition group classifications in this pack are based on the Public Health England Neurology Intelligence Network classification of Neurological Conditions: https://www.gov.uk/guidance/neurology-data-and-analysis-a-guide-for-health-professionals
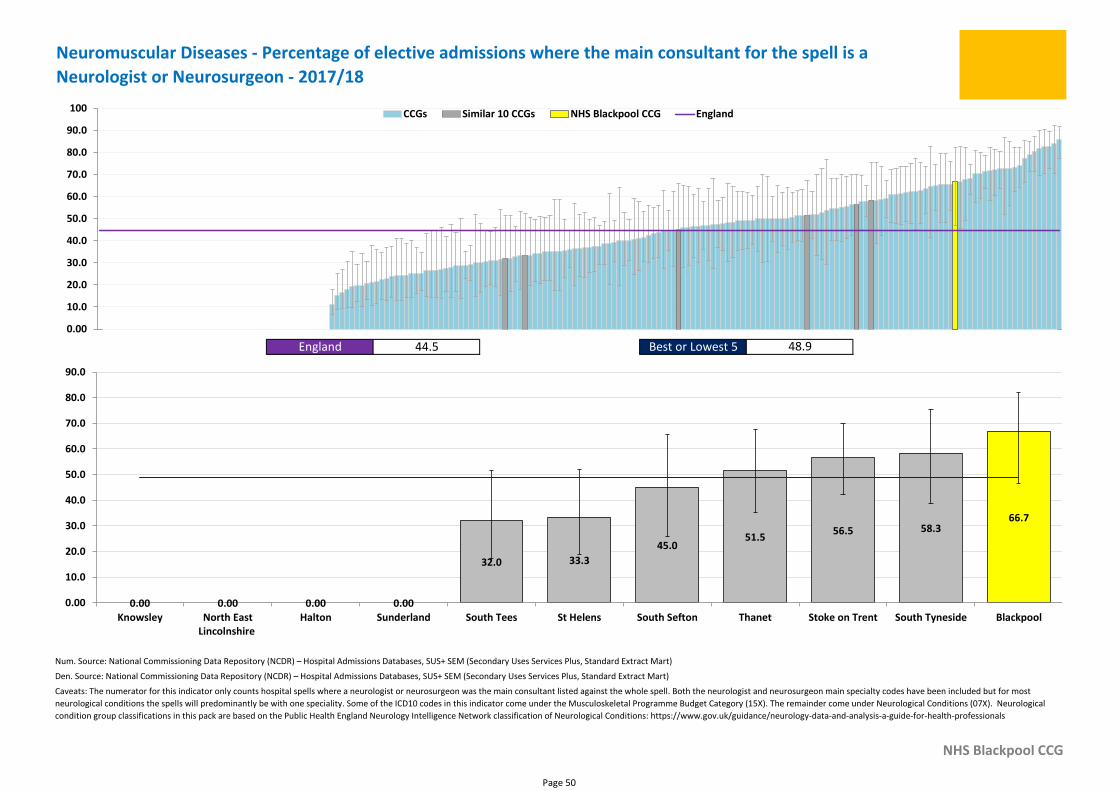
Neuromuscular Diseases - Percentage of elective admissions where the main consultant for the spell is a
Neurologist or Neurosurgeon - 2017/18
England 44.5 Best or Lowest 5 48.9
0.00
10.0
20.0
30.0
40.0
50.0
60.0
70.0
80.0
90.0
100 CCGs Similar 10 CCGs NHS Blackpool CCG England
66.7
0.00 0.00 0.00 0.00
32.0 33.3
45.051.5
56.5 58.3
0.00
10.0
20.0
30.0
40.0
50.0
60.0
70.0
80.0
90.0
Knowsley North EastLincolnshire
Halton Sunderland South Tees St Helens South Sefton Thanet Stoke on Trent South Tyneside Blackpool
Page 50
Num. Source: National Commissioning Data Repository (NCDR) – Hospital Admissions Databases, SUS+ SEM (Secondary Uses Services Plus, Standard Extract Mart)
Den. Source: Mid-year GP registered population, NHAIS (National Health Application and Infrastructure Services), NHS Digital
NHS Blackpool CCG
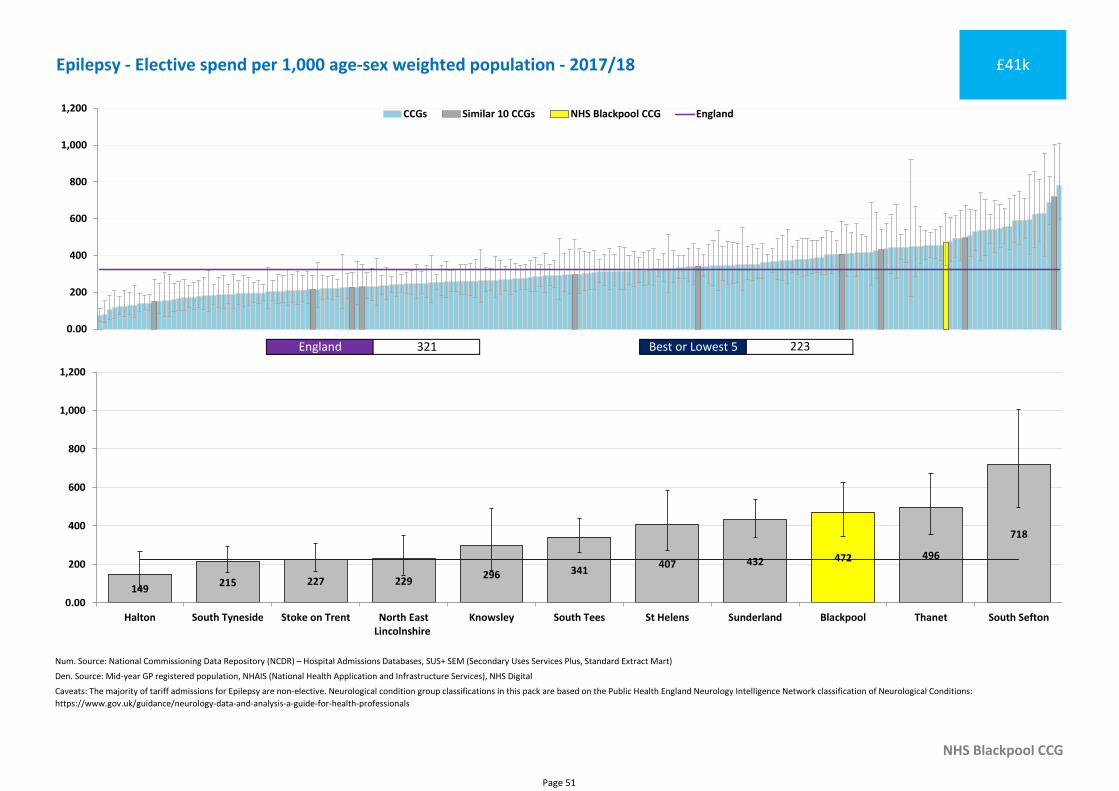
Caveats: The majority of tariff admissions for Epilepsy are non-elective. Neurological condition group classifications in this pack are based on the Public Health England Neurology Intelligence Network classification of Neurological Conditions:
https://www.gov.uk/guidance/neurology-data-and-analysis-a-guide-for-health-professionals
Epilepsy - Elective spend per 1,000 age-sex weighted population - 2017/18 £41k
England 321 Best or Lowest 5 223
0.00
200
400
600
800
1,000
1,200 CCGs Similar 10 CCGs NHS Blackpool CCG England
472
149215 227 229
296 341407 432
496
718
0.00
200
400
600
800
1,000
1,200
Halton South Tyneside Stoke on Trent North EastLincolnshire
Knowsley South Tees St Helens Sunderland Blackpool Thanet South Sefton
Page 51
Num. Source: National Commissioning Data Repository (NCDR) – Hospital Admissions Databases, SUS+ SEM (Secondary Uses Services Plus, Standard Extract Mart)
Den. Source: Mid-year GP registered population, NHAIS (National Health Application and Infrastructure Services), NHS Digital
NHS Blackpool CCG
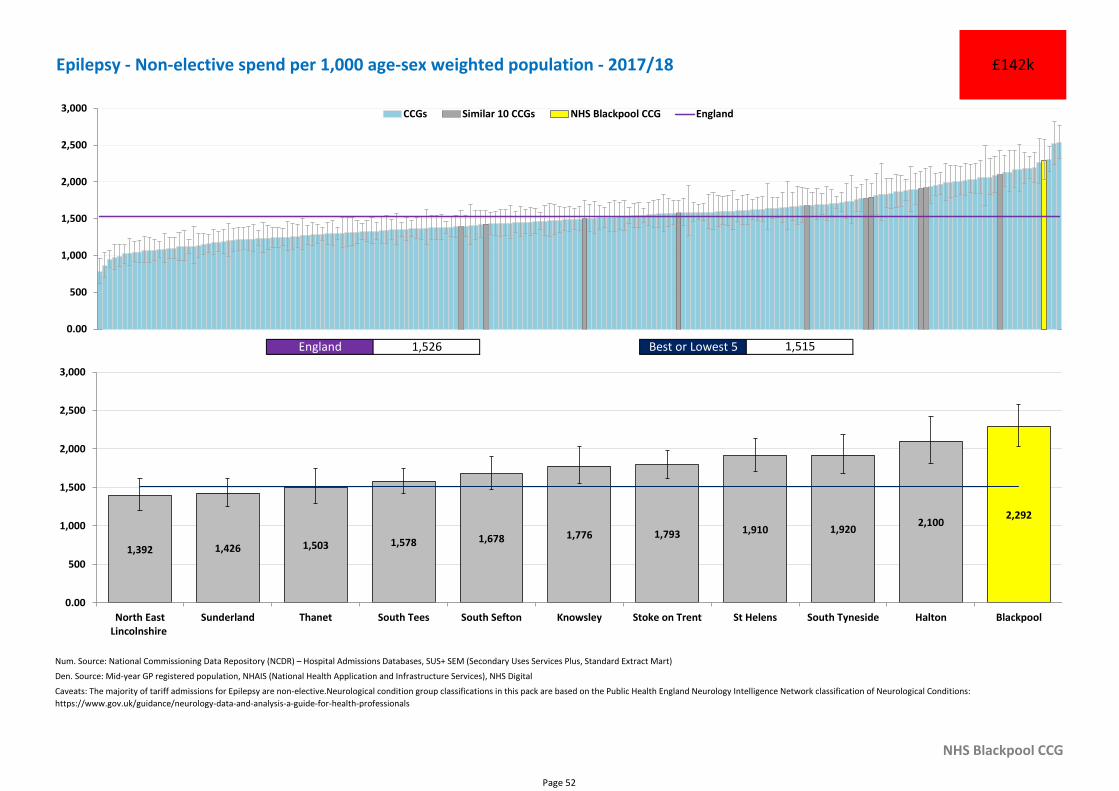
Caveats: The majority of tariff admissions for Epilepsy are non-elective.Neurological condition group classifications in this pack are based on the Public Health England Neurology Intelligence Network classification of Neurological Conditions:
https://www.gov.uk/guidance/neurology-data-and-analysis-a-guide-for-health-professionals
Epilepsy - Non-elective spend per 1,000 age-sex weighted population - 2017/18 £142k
England 1,526 Best or Lowest 5 1,515
0.00
500
1,000
1,500
2,000
2,500
3,000 CCGs Similar 10 CCGs NHS Blackpool CCG England
2,292
1,392 1,426 1,503 1,578 1,678 1,776 1,793 1,910 1,9202,100
0.00
500
1,000
1,500
2,000
2,500
3,000
North EastLincolnshire
Sunderland Thanet South Tees South Sefton Knowsley Stoke on Trent St Helens South Tyneside Halton Blackpool
Page 52
Num. Source: National Commissioning Data Repository (NCDR) – Hospital Admissions Databases, SUS+ SEM (Secondary Uses Services Plus, Standard Extract Mart)
Den. Source: Mid-year GP registered population, NHAIS (National Health Application and Infrastructure Services), NHS Digital
NHS Blackpool CCG
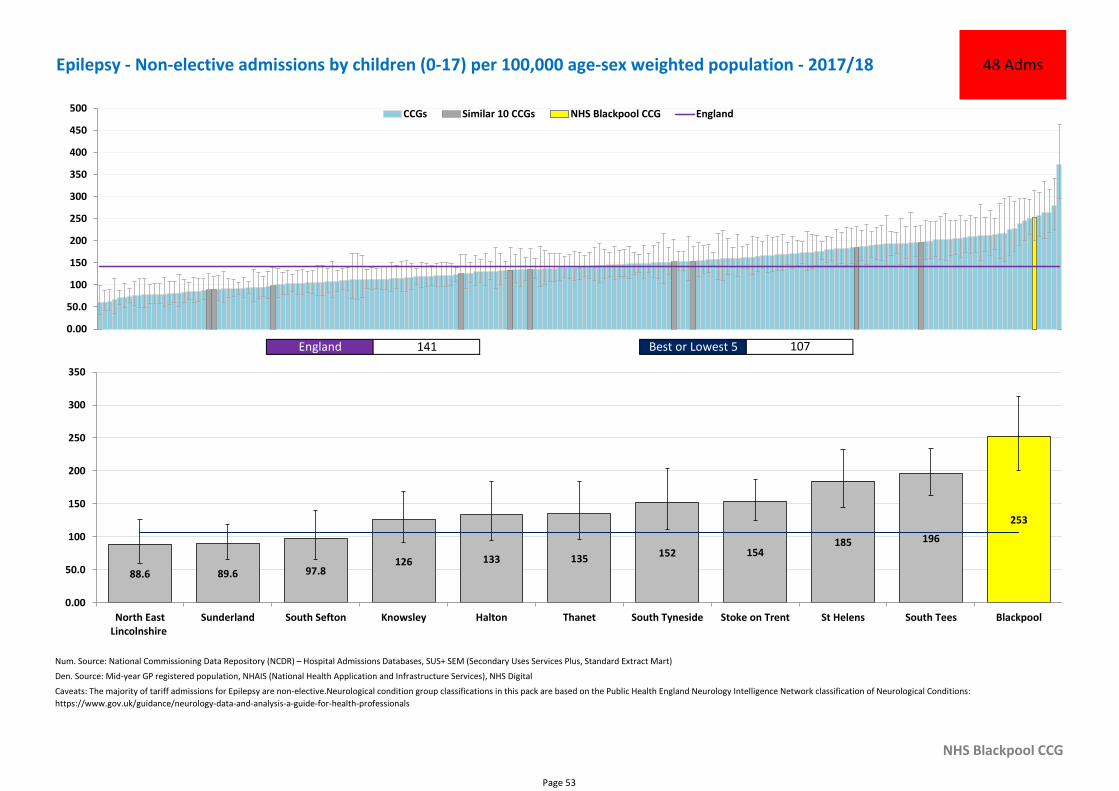
Caveats: The majority of tariff admissions for Epilepsy are non-elective.Neurological condition group classifications in this pack are based on the Public Health England Neurology Intelligence Network classification of Neurological Conditions:
https://www.gov.uk/guidance/neurology-data-and-analysis-a-guide-for-health-professionals
Epilepsy - Non-elective admissions by children (0-17) per 100,000 age-sex weighted population - 2017/18 48 Adms
England 141 Best or Lowest 5 107
0.00
50.0
100
150
200
250
300
350
400
450
500 CCGs Similar 10 CCGs NHS Blackpool CCG England
253
88.6 89.6 97.8126 133 135
152 154185 196
0.00
50.0
100
150
200
250
300
350
North EastLincolnshire
Sunderland South Sefton Knowsley Halton Thanet South Tyneside Stoke on Trent St Helens South Tees Blackpool
Page 53
Num. Source: National Commissioning Data Repository (NCDR) – Hospital Admissions Databases, SUS+ SEM (Secondary Uses Services Plus, Standard Extract Mart)
Den. Source: Mid-year GP registered population, NHAIS (National Health Application and Infrastructure Services), NHS Digital
NHS Blackpool CCG
Caveats: The majority of tariff admissions for Epilepsy are non-elective.Neurological condition group classifications in this pack are based on the Public Health England Neurology Intelligence Network classification of Neurological Conditions:
https://www.gov.uk/guidance/neurology-data-and-analysis-a-guide-for-health-professionals
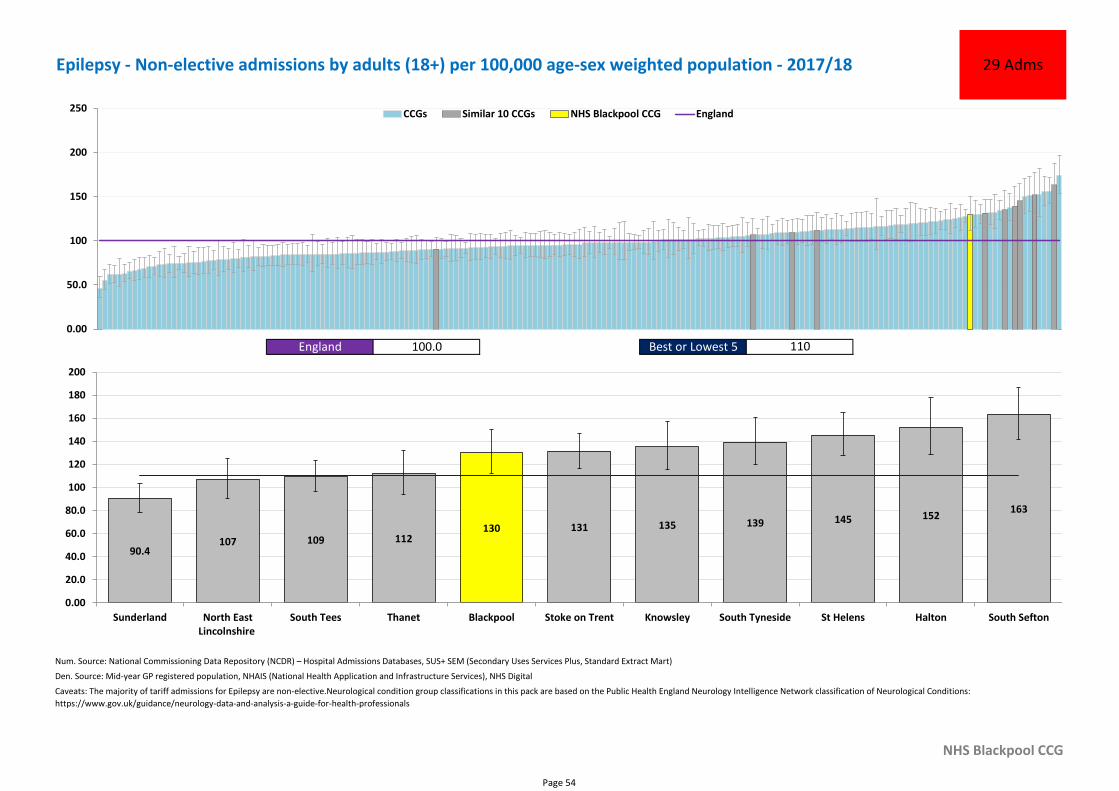
Epilepsy - Non-elective admissions by adults (18+) per 100,000 age-sex weighted population - 2017/18 29 Adms
England 100.0 Best or Lowest 5 110
0.00
50.0
100
150
200
250 CCGs Similar 10 CCGs NHS Blackpool CCG England
130
90.4107 109 112
131 135 139 145 152163
0.00
20.0
40.0
60.0
80.0
100
120
140
160
180
200
Sunderland North EastLincolnshire
South Tees Thanet Blackpool Stoke on Trent Knowsley South Tyneside St Helens Halton South Sefton
Page 54
Num. Source: National Commissioning Data Repository (NCDR) – Hospital Admissions Databases, SUS+ SEM (Secondary Uses Services Plus, Standard Extract Mart)
Den. Source: Mid-year GP registered populations, NHAIS (National Health Application and Infrastructure Services), NHS Digital
NHS Blackpool CCG
Caveats: The majority of tariff admissions for Epilepsy are non-elective.Neurological condition group classifications in this pack are based on the Public Health England Neurology Intelligence Network classification of Neurological Conditions:
https://www.gov.uk/guidance/neurology-data-and-analysis-a-guide-for-health-professionals
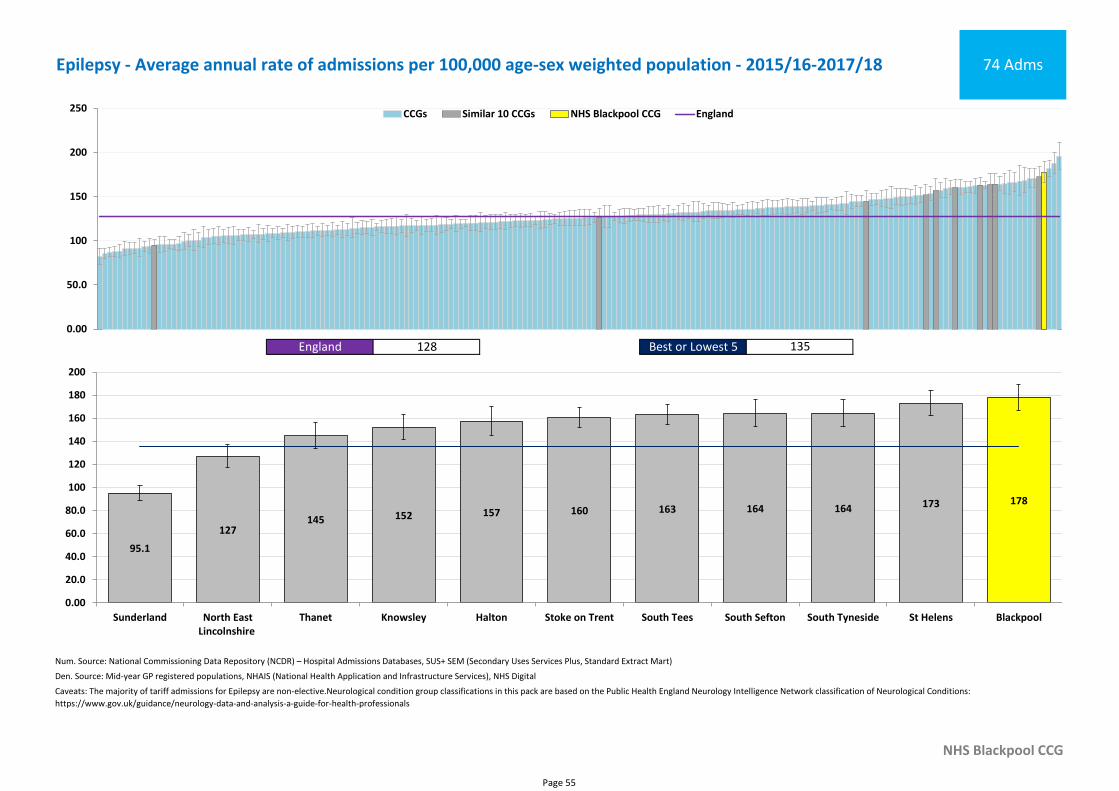
Epilepsy - Average annual rate of admissions per 100,000 age-sex weighted population - 2015/16-2017/18 74 Adms
England 128 Best or Lowest 5 135
0.00
50.0
100
150
200
250 CCGs Similar 10 CCGs NHS Blackpool CCG England
178
95.1
127145 152 157 160 163 164 164 173
0.00
20.0
40.0
60.0
80.0
100
120
140
160
180
200
Sunderland North EastLincolnshire
Thanet Knowsley Halton Stoke on Trent South Tees South Sefton South Tyneside St Helens Blackpool
Page 55
Num. Source: National Commissioning Data Repository (NCDR) – Hospital Admissions Databases, SUS+ SEM (Secondary Uses Services Plus, Standard Extract Mart)
Den. Source: National Commissioning Data Repository (NCDR) – Hospital Admissions Databases, SUS+ SEM (Secondary Uses Services Plus, Standard Extract Mart)
NHS Blackpool CCG
Caveats: The numerator for this indicator only counts hospital spells where a neurologist or neurosurgeon was the main consultant listed against the whole spell. Both the neurologist and neurosurgeon main specialty codes have been included but for most
neurological conditions the spells will predominantly be with one speciality. The majority of tariff admissions for Epilepsy are non-elective. Neurological condition group classifications in this pack are based on the Public Health England Neurology Intelligence
Network classification of Neurological Conditions: https://www.gov.uk/guidance/neurology-data-and-analysis-a-guide-for-health-professionals
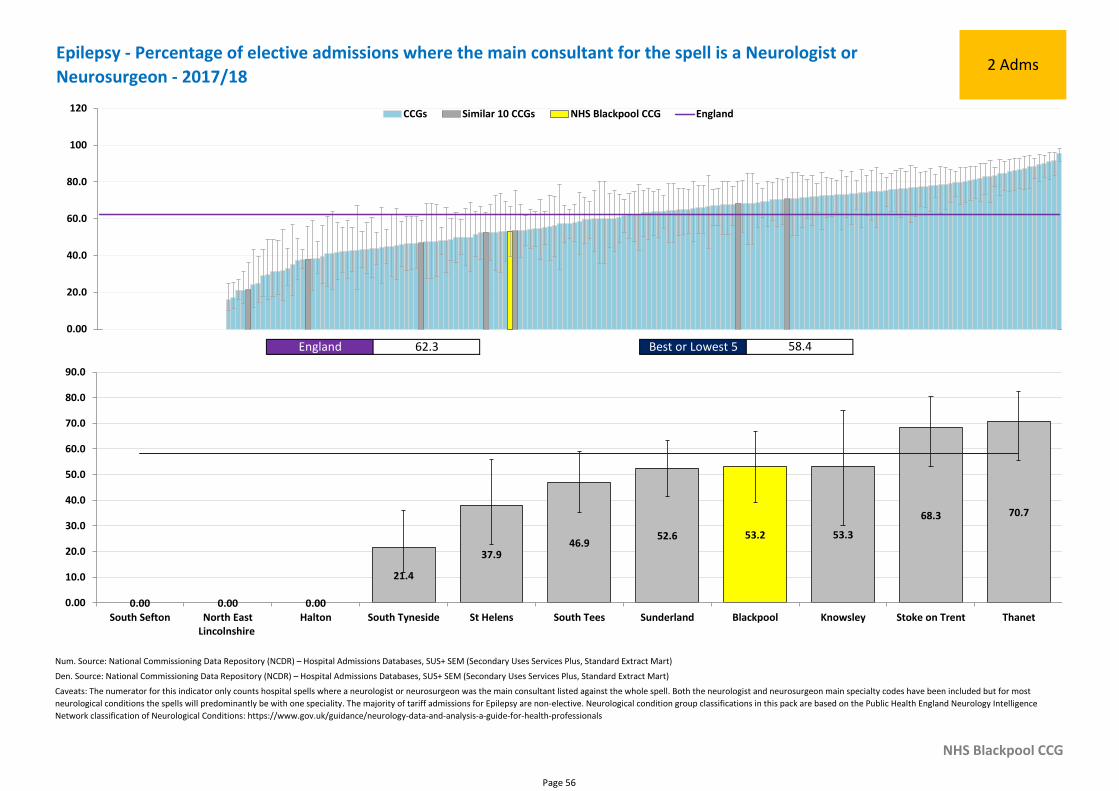
Epilepsy - Percentage of elective admissions where the main consultant for the spell is a Neurologist or
Neurosurgeon - 2017/182 Adms
England 62.3 Best or Lowest 5 58.4
0.00
20.0
40.0
60.0
80.0
100
120 CCGs Similar 10 CCGs NHS Blackpool CCG England
53.2
0.00 0.00 0.00
21.4
37.946.9
52.6 53.3
68.3 70.7
0.00
10.0
20.0
30.0
40.0
50.0
60.0
70.0
80.0
90.0
South Sefton North EastLincolnshire
Halton South Tyneside St Helens South Tees Sunderland Blackpool Knowsley Stoke on Trent Thanet
Page 56
Num. Source: National Commissioning Data Repository (NCDR) – Hospital Admissions Databases, SUS+ SEM (Secondary Uses Services Plus, Standard Extract Mart)
Den. Source: National Commissioning Data Repository (NCDR) – Hospital Admissions Databases, SUS+ SEM (Secondary Uses Services Plus, Standard Extract Mart)
NHS Blackpool CCG
Caveats: The numerator for this indicator only counts hospital spells where a neurologist or neurosurgeon was the main consultant listed against the whole spell. Both the neurologist and neurosurgeon main specialty codes have been included but for most
neurological conditions the spells will predominantly be with one speciality. The majority of tariff admissions for Epilepsy are non-elective. Neurological condition group classifications in this pack are based on the Public Health England Neurology Intelligence
Network classification of Neurological Conditions: https://www.gov.uk/guidance/neurology-data-and-analysis-a-guide-for-health-professionals
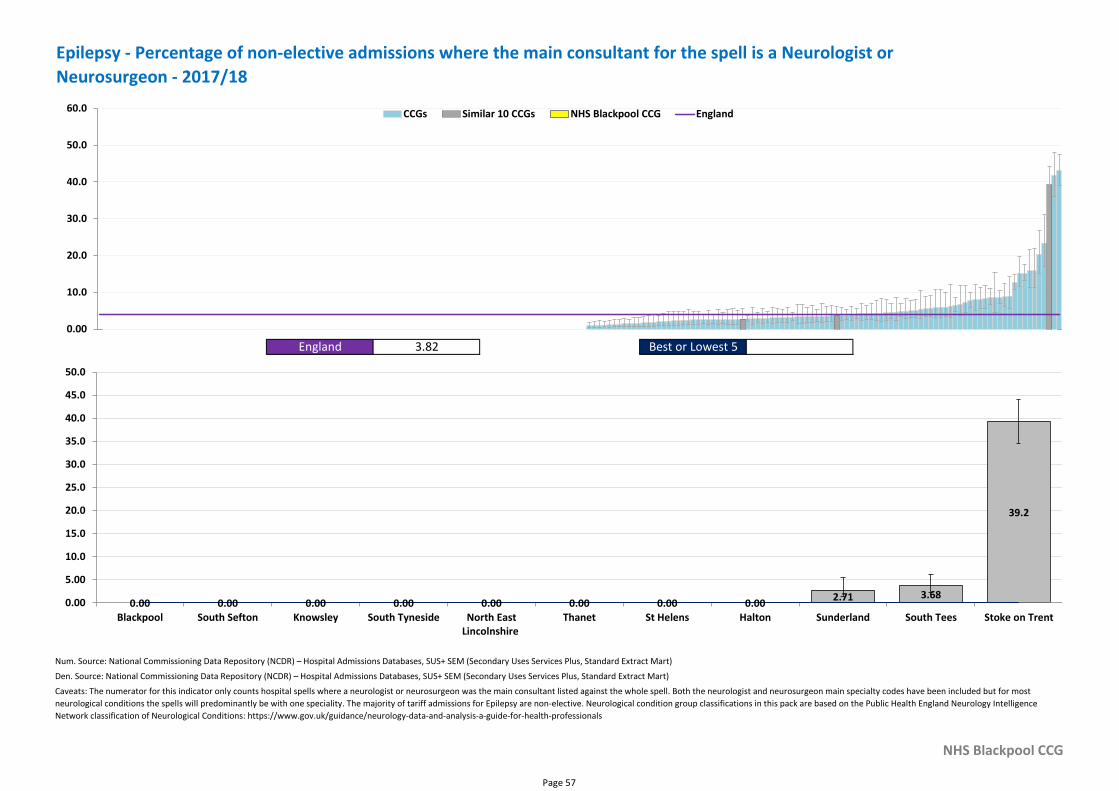
Epilepsy - Percentage of non-elective admissions where the main consultant for the spell is a Neurologist or
Neurosurgeon - 2017/18
England 3.82 Best or Lowest 5
0.00
10.0
20.0
30.0
40.0
50.0
60.0 CCGs Similar 10 CCGs NHS Blackpool CCG England
0.00 0.00 0.00 0.00 0.00 0.00 0.00 0.002.71 3.68
39.2
0.00
5.00
10.0
15.0
20.0
25.0
30.0
35.0
40.0
45.0
50.0
Blackpool South Sefton Knowsley South Tyneside North EastLincolnshire
Thanet St Helens Halton Sunderland South Tees Stoke on Trent
Page 57
Num. Source: National Commissioning Data Repository (NCDR) – Hospital Admissions Databases, SUS+ SEM (Secondary Uses Services Plus, Standard Extract Mart)
Den. Source: Mid-year GP registered population, NHAIS (National Health Application and Infrastructure Services), NHS Digital
NHS Blackpool CCG
Caveats: The majority of tariff admissions for Epilepsy are non-elective. Neurological condition group classifications in this pack are based on the Public Health England Neurology Intelligence Network classification of Neurological Conditions:
https://www.gov.uk/guidance/neurology-data-and-analysis-a-guide-for-health-professionals
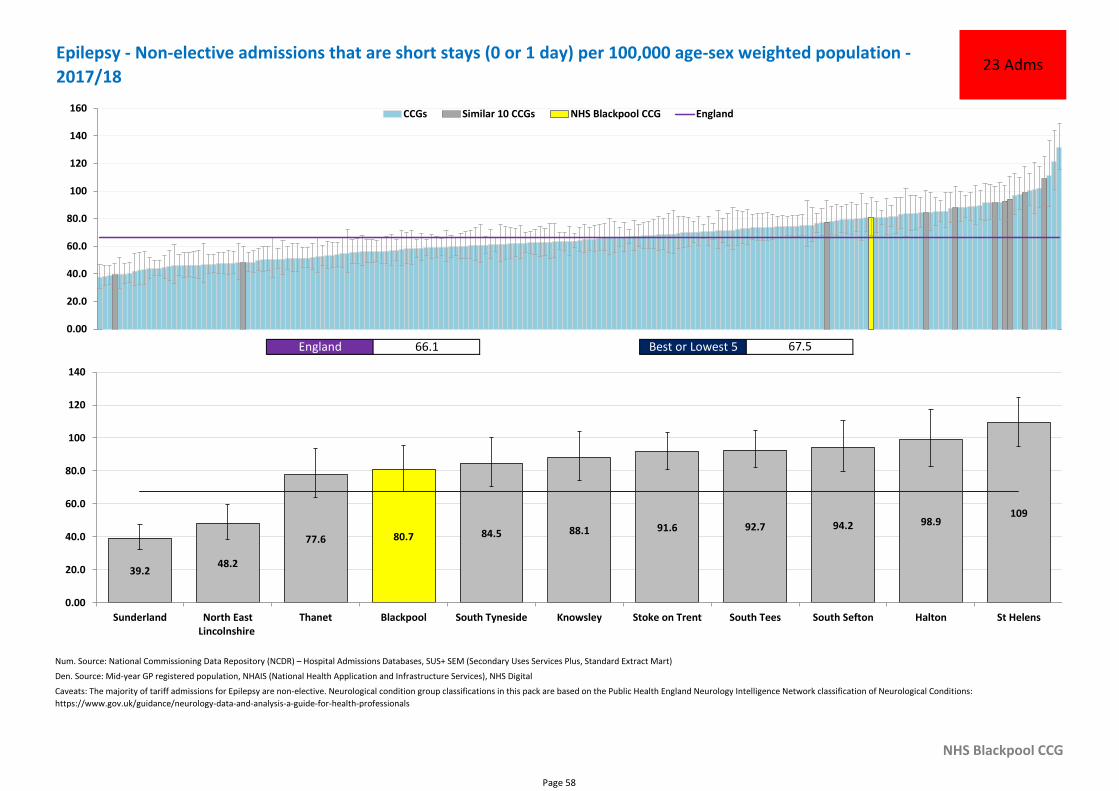
Epilepsy - Non-elective admissions that are short stays (0 or 1 day) per 100,000 age-sex weighted population -
2017/1823 Adms
England 66.1 Best or Lowest 5 67.5
0.00
20.0
40.0
60.0
80.0
100
120
140
160 CCGs Similar 10 CCGs NHS Blackpool CCG England
80.7
39.248.2
77.684.5 88.1 91.6 92.7 94.2 98.9
109
0.00
20.0
40.0
60.0
80.0
100
120
140
Sunderland North EastLincolnshire
Thanet Blackpool South Tyneside Knowsley Stoke on Trent South Tees South Sefton Halton St Helens
Page 58
Num. Source: National Commissioning Data Repository (NCDR) – Hospital Admissions Databases, SUS+ SEM (Secondary Uses Services Plus, Standard Extract Mart)
Den. Source: Mid-year GP registered population, NHAIS (National Health Application and Infrastructure Services), NHS Digital
NHS Blackpool CCG
Caveats: The ICD10 codes for this indicator come under the Cancers and Tumours Programme Budget Category (02). Neurological condition group classifications in this pack are based on the Public Health England Neurology Intelligence Network classification of
Neurological Conditions: https://www.gov.uk/guidance/neurology-data-and-analysis-a-guide-for-health-professionals
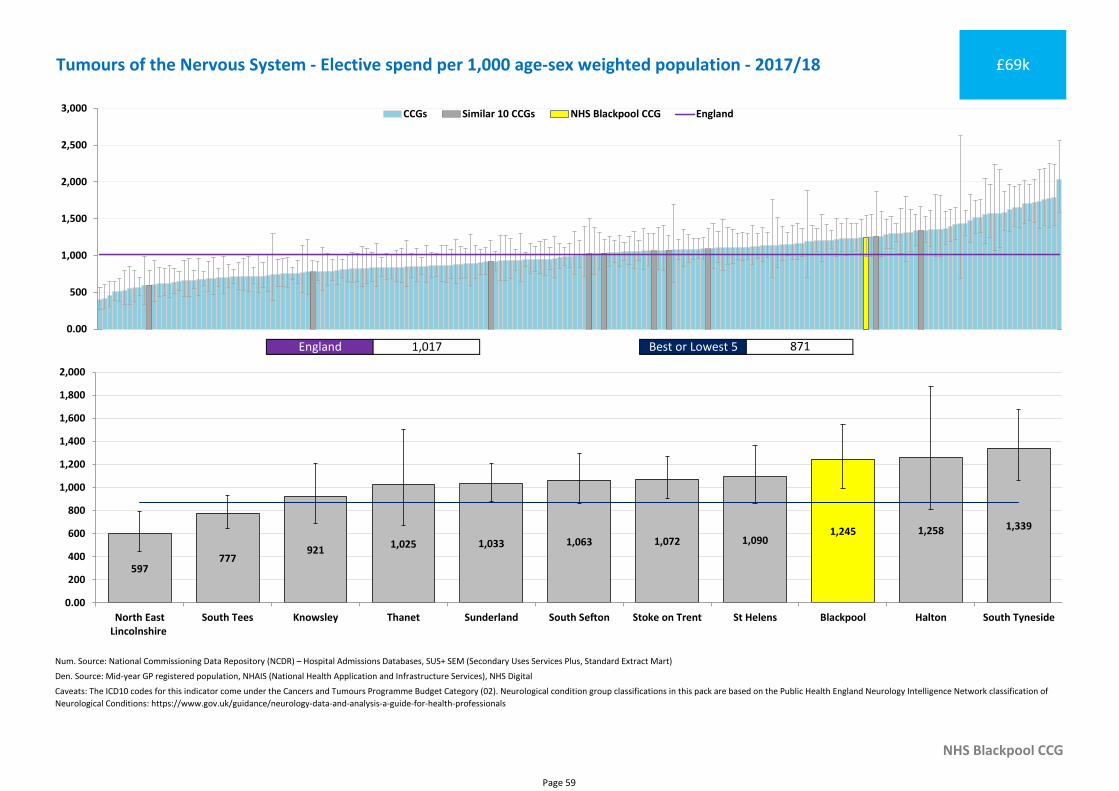
Tumours of the Nervous System - Elective spend per 1,000 age-sex weighted population - 2017/18 £69k
England 1,017 Best or Lowest 5 871
0.00
500
1,000
1,500
2,000
2,500
3,000 CCGs Similar 10 CCGs NHS Blackpool CCG England
1,245
597777
9211,025 1,033 1,063 1,072 1,090
1,258 1,339
0.00
200
400
600
800
1,000
1,200
1,400
1,600
1,800
2,000
North EastLincolnshire
South Tees Knowsley Thanet Sunderland South Sefton Stoke on Trent St Helens Blackpool Halton South Tyneside
Page 59

Num. Source: National Commissioning Data Repository (NCDR) – Hospital Admissions Databases, SUS+ SEM (Secondary Uses Services Plus, Standard Extract Mart)
Den. Source: Mid-year GP registered population, NHAIS (National Health Application and Infrastructure Services), NHS Digital
NHS Blackpool CCG
Caveats: The ICD10 codes for this indicator come under the Cancers and Tumours Programme Budget Category (02). Neurological condition group classifications in this pack are based on the Public Health England Neurology Intelligence Network classification of
Neurological Conditions: https://www.gov.uk/guidance/neurology-data-and-analysis-a-guide-for-health-professionals
Tumours of the Nervous System - Non-elective spend per 1,000 age-sex weighted population - 2017/18 £67k
England 1,023 Best or Lowest 5 833
0.00
500
1,000
1,500
2,000
2,500
3,000 CCGs Similar 10 CCGs NHS Blackpool CCG England
1,185
518
839 853 8921,061 1,139
1,343 1,439 1,477 1,501
0.00
500
1,000
1,500
2,000
2,500
Stoke on Trent South Tees Thanet Sunderland St Helens Halton Blackpool Knowsley South Tyneside North EastLincolnshire
South Sefton
Page 60
Num. Source: National Commissioning Data Repository (NCDR) – Hospital Admissions Databases, SUS+ SEM (Secondary Uses Services Plus, Standard Extract Mart)
Den. Source: Mid-year GP registered populations, NHAIS (National Health Application and Infrastructure Services), NHS Digital
NHS Blackpool CCG
Caveats: The ICD10 codes for this indicator come under the Cancers and Tumours Programme Budget Category (02). Neurological condition group classifications in this pack are based on the Public Health England Neurology Intelligence Network classification of
Neurological Conditions: https://www.gov.uk/guidance/neurology-data-and-analysis-a-guide-for-health-professionals
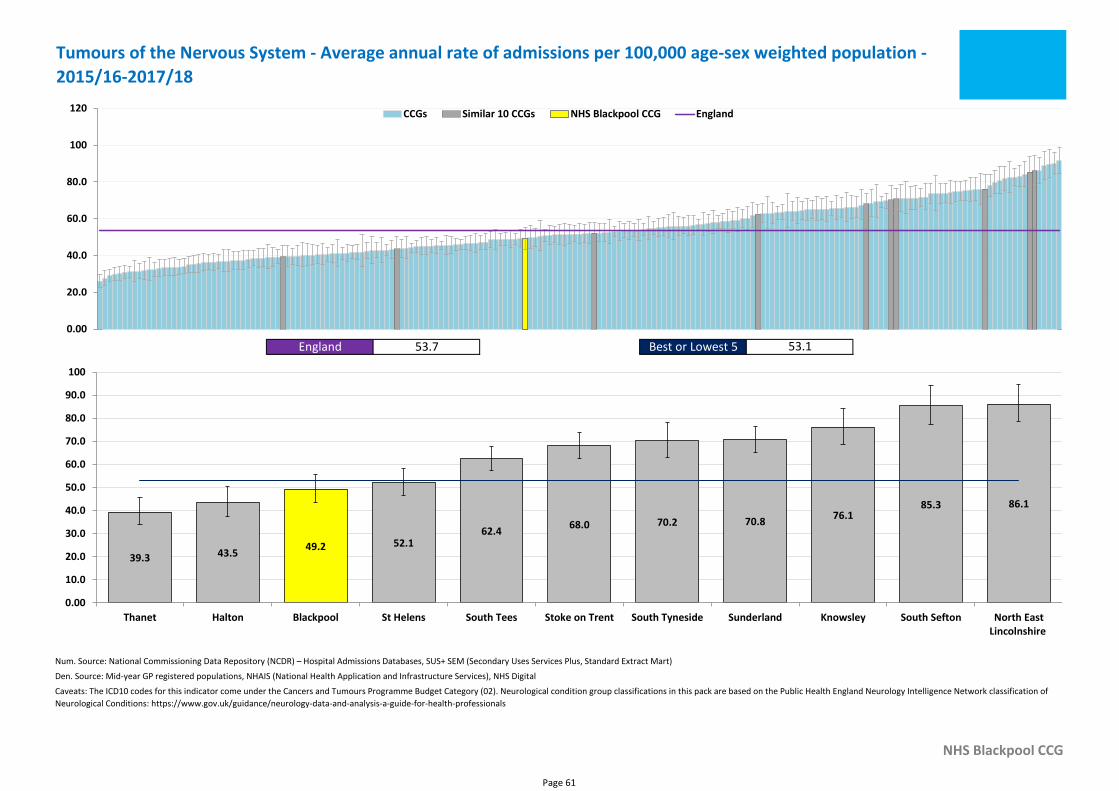
Tumours of the Nervous System - Average annual rate of admissions per 100,000 age-sex weighted population -
2015/16-2017/18
England 53.7 Best or Lowest 5 53.1
0.00
20.0
40.0
60.0
80.0
100
120 CCGs Similar 10 CCGs NHS Blackpool CCG England
49.239.3 43.5
52.162.4
68.0 70.2 70.876.1
85.3 86.1
0.00
10.0
20.0
30.0
40.0
50.0
60.0
70.0
80.0
90.0
100
Thanet Halton Blackpool St Helens South Tees Stoke on Trent South Tyneside Sunderland Knowsley South Sefton North EastLincolnshire
Page 61
Num. Source: National Commissioning Data Repository (NCDR) – Hospital Admissions Databases, SUS+ SEM (Secondary Uses Services Plus, Standard Extract Mart)
Den. Source: National Commissioning Data Repository (NCDR) – Hospital Admissions Databases, SUS+ SEM (Secondary Uses Services Plus, Standard Extract Mart)
NHS Blackpool CCG
Caveats: The numerator for this indicator only counts hospital spells where a neurologist or neurosurgeon was the main consultant listed against the whole spell. Both the neurologist and neurosurgeon main specialty codes have been included but for most
neurological conditions the spells will predominantly be with one speciality. The ICD10 codes for this indicator come under the Cancers and Tumours Programme Budget Category (02). Neurological condition group classifications in this pack are based on the Public
Health England Neurology Intelligence Network classification of Neurological Conditions: https://www.gov.uk/guidance/neurology-data-and-analysis-a-guide-for-health-professionals
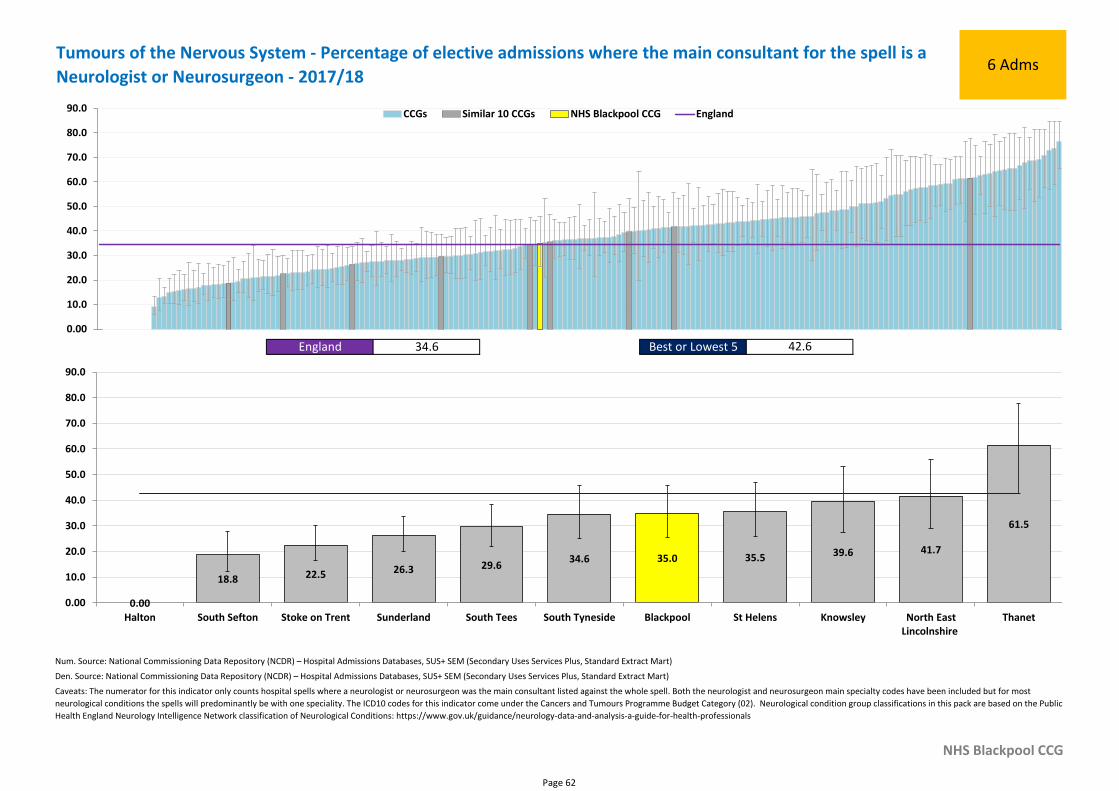
Tumours of the Nervous System - Percentage of elective admissions where the main consultant for the spell is a
Neurologist or Neurosurgeon - 2017/186 Adms
England 34.6 Best or Lowest 5 42.6
0.00
10.0
20.0
30.0
40.0
50.0
60.0
70.0
80.0
90.0 CCGs Similar 10 CCGs NHS Blackpool CCG England
35.0
0.00
18.8 22.5 26.3 29.634.6 35.5 39.6 41.7
61.5
0.00
10.0
20.0
30.0
40.0
50.0
60.0
70.0
80.0
90.0
Halton South Sefton Stoke on Trent Sunderland South Tees South Tyneside Blackpool St Helens Knowsley North EastLincolnshire
Thanet
Page 62
Num. Source: National Commissioning Data Repository (NCDR) – Hospital Admissions Databases, SUS+ SEM (Secondary Uses Services Plus, Standard Extract Mart)
Den. Source: National Commissioning Data Repository (NCDR) – Hospital Admissions Databases, SUS+ SEM (Secondary Uses Services Plus, Standard Extract Mart)
NHS Blackpool CCG
Caveats: The numerator for this indicator only counts hospital spells where a neurologist or neurosurgeon was the main consultant listed against the whole spell. Both the neurologist and neurosurgeon main specialty codes have been included but for most
neurological conditions the spells will predominantly be with one speciality. The ICD10 codes for this indicator come under the Cancers and Tumours Programme Budget Category (02). Neurological condition group classifications in this pack are based on the Public
Health England Neurology Intelligence Network classification of Neurological Conditions: https://www.gov.uk/guidance/neurology-data-and-analysis-a-guide-for-health-professionals
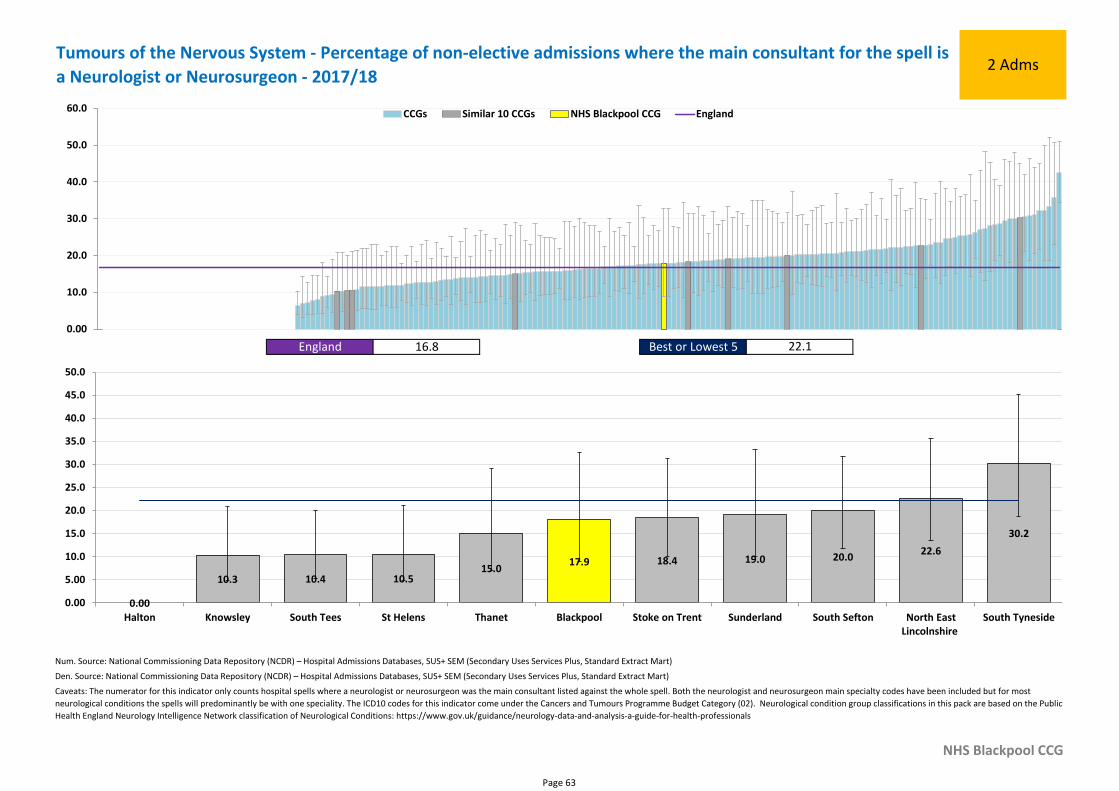
Tumours of the Nervous System - Percentage of non-elective admissions where the main consultant for the spell is
a Neurologist or Neurosurgeon - 2017/182 Adms
England 16.8 Best or Lowest 5 22.1
0.00
10.0
20.0
30.0
40.0
50.0
60.0 CCGs Similar 10 CCGs NHS Blackpool CCG England
17.9
0.00
10.3 10.4 10.515.0
18.4 19.0 20.022.6
30.2
0.00
5.00
10.0
15.0
20.0
25.0
30.0
35.0
40.0
45.0
50.0
Halton Knowsley South Tees St Helens Thanet Blackpool Stoke on Trent Sunderland South Sefton North EastLincolnshire
South Tyneside
Page 63
Num. Source: National Commissioning Data Repository (NCDR) – Hospital Admissions Databases, SUS+ SEM (Secondary Uses Services Plus, Standard Extract Mart)
Den. Source: Mid-year GP registered population, NHAIS (National Health Application and Infrastructure Services), NHS Digital
NHS Blackpool CCG
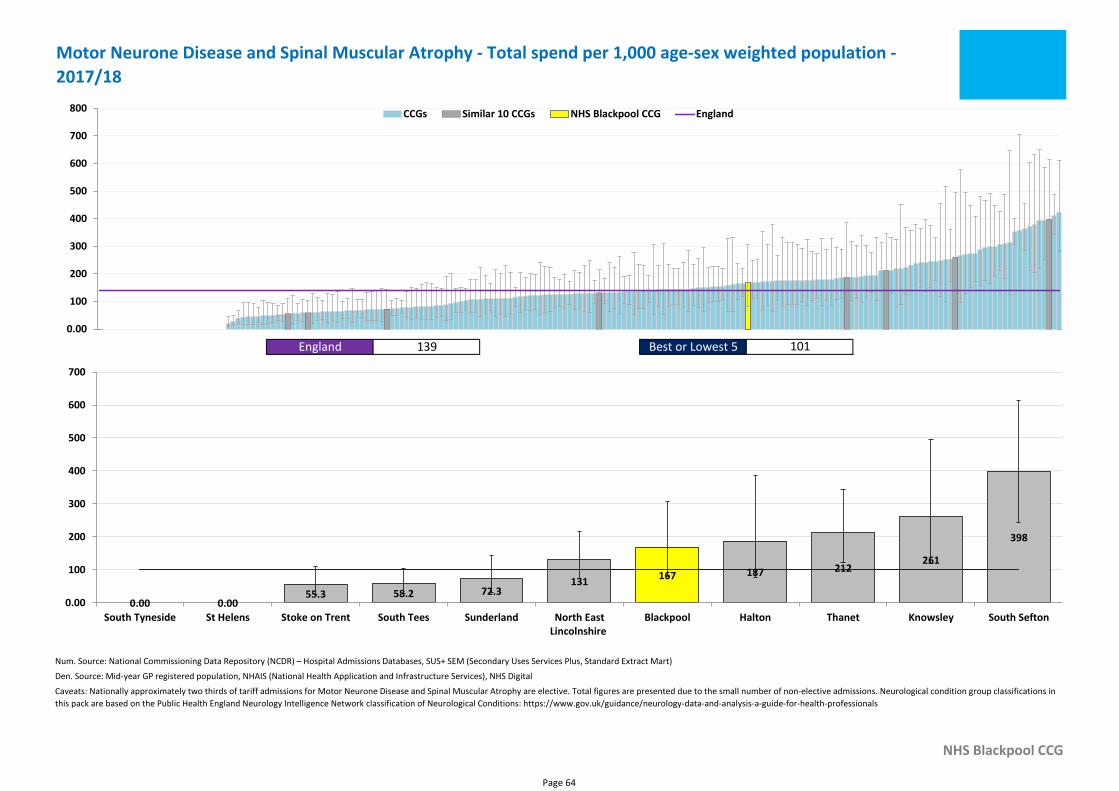
Caveats: Nationally approximately two thirds of tariff admissions for Motor Neurone Disease and Spinal Muscular Atrophy are elective. Total figures are presented due to the small number of non-elective admissions. Neurological condition group classifications in
this pack are based on the Public Health England Neurology Intelligence Network classification of Neurological Conditions: https://www.gov.uk/guidance/neurology-data-and-analysis-a-guide-for-health-professionals
Motor Neurone Disease and Spinal Muscular Atrophy - Total spend per 1,000 age-sex weighted population -
2017/18
England 139 Best or Lowest 5 101
0.00
100
200
300
400
500
600
700
800 CCGs Similar 10 CCGs NHS Blackpool CCG England
167
0.00 0.0055.3 58.2 72.3
131187 212
261
398
0.00
100
200
300
400
500
600
700
South Tyneside St Helens Stoke on Trent South Tees Sunderland North EastLincolnshire
Blackpool Halton Thanet Knowsley South Sefton
Page 64
Num. Source: National Commissioning Data Repository (NCDR) – Hospital Admissions Databases, SUS+ SEM (Secondary Uses Services Plus, Standard Extract Mart)
Den. Source: Mid-year GP registered populations, NHAIS (National Health Application and Infrastructure Services), NHS Digital
NHS Blackpool CCG
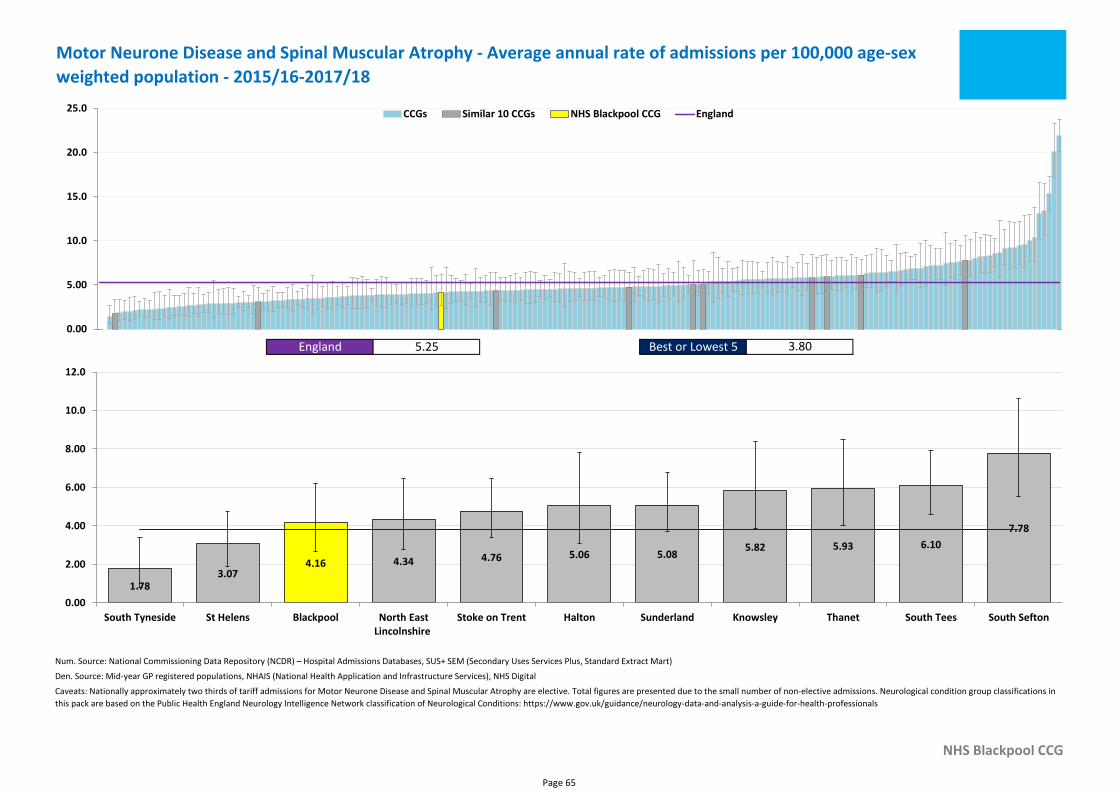
Caveats: Nationally approximately two thirds of tariff admissions for Motor Neurone Disease and Spinal Muscular Atrophy are elective. Total figures are presented due to the small number of non-elective admissions. Neurological condition group classifications in
this pack are based on the Public Health England Neurology Intelligence Network classification of Neurological Conditions: https://www.gov.uk/guidance/neurology-data-and-analysis-a-guide-for-health-professionals
Motor Neurone Disease and Spinal Muscular Atrophy - Average annual rate of admissions per 100,000 age-sex
weighted population - 2015/16-2017/18
England 5.25 Best or Lowest 5 3.80
0.00
5.00
10.0
15.0
20.0
25.0 CCGs Similar 10 CCGs NHS Blackpool CCG England
4.16
1.783.07
4.34 4.76 5.06 5.085.82 5.93 6.10
7.78
0.00
2.00
4.00
6.00
8.00
10.0
12.0
South Tyneside St Helens Blackpool North EastLincolnshire
Stoke on Trent Halton Sunderland Knowsley Thanet South Tees South Sefton
Page 65
Num. Source: National Commissioning Data Repository (NCDR) – Hospital Admissions Databases, SUS+ SEM (Secondary Uses Services Plus, Standard Extract Mart)
Den. Source: Mid-year GP registered population, NHAIS (National Health Application and Infrastructure Services), NHS Digital
NHS Blackpool CCG
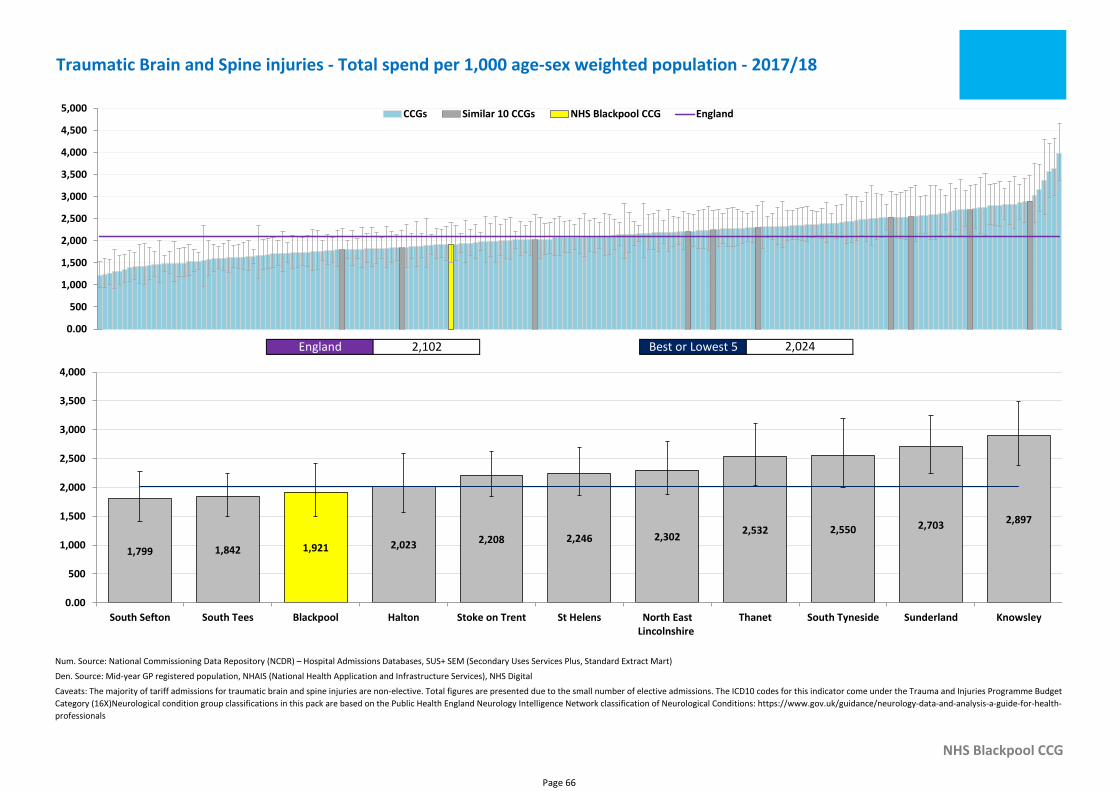
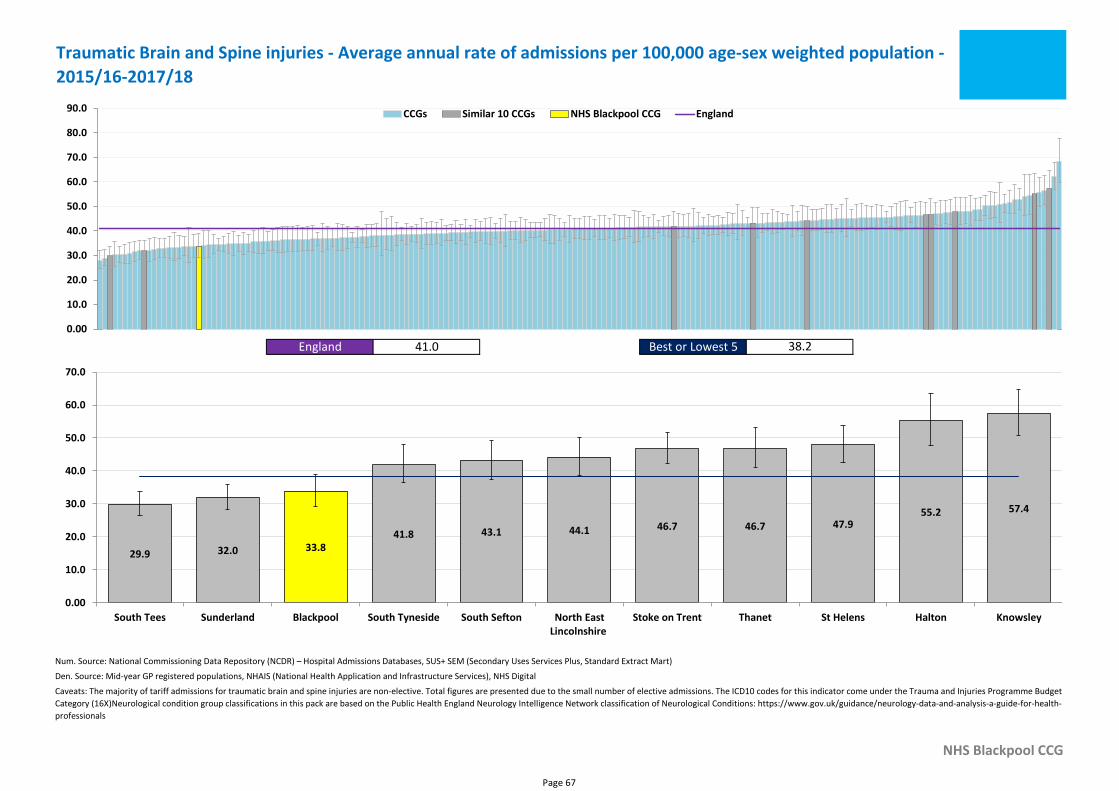
Caveats: The majority of tariff admissions for traumatic brain and spine injuries are non-elective. Total figures are presented due to the small number of elective admissions. The ICD10 codes for this indicator come under the Trauma and Injuries Programme Budget
Category (16X)Neurological condition group classifications in this pack are based on the Public Health England Neurology Intelligence Network classification of Neurological Conditions: https://www.gov.uk/guidance/neurology-data-and-analysis-a-guide-for-health-
professionals
Traumatic Brain and Spine injuries - Total spend per 1,000 age-sex weighted population - 2017/18
England 2,102 Best or Lowest 5 2,024
0.00
500
1,000
1,500
2,000
2,500
3,000
3,500
4,000
4,500
5,000 CCGs Similar 10 CCGs NHS Blackpool CCG England
1,9211,799 1,842 2,023 2,208 2,246 2,3022,532 2,550 2,703 2,897
0.00
500
1,000
1,500
2,000
2,500
3,000
3,500
4,000
South Sefton South Tees Blackpool Halton Stoke on Trent St Helens North EastLincolnshire
Thanet South Tyneside Sunderland Knowsley
Page 66
Num. Source: National Commissioning Data Repository (NCDR) – Hospital Admissions Databases, SUS+ SEM (Secondary Uses Services Plus, Standard Extract Mart)
Den. Source: Mid-year GP registered populations, NHAIS (National Health Application and Infrastructure Services), NHS Digital
NHS Blackpool CCG
Caveats: The majority of tariff admissions for traumatic brain and spine injuries are non-elective. Total figures are presented due to the small number of elective admissions. The ICD10 codes for this indicator come under the Trauma and Injuries Programme Budget
Category (16X)Neurological condition group classifications in this pack are based on the Public Health England Neurology Intelligence Network classification of Neurological Conditions: https://www.gov.uk/guidance/neurology-data-and-analysis-a-guide-for-health-
professionals
Traumatic Brain and Spine injuries - Average annual rate of admissions per 100,000 age-sex weighted population -
2015/16-2017/18
England 41.0 Best or Lowest 5 38.2
0.00
10.0
20.0
30.0
40.0
50.0
60.0
70.0
80.0
90.0 CCGs Similar 10 CCGs NHS Blackpool CCG England
33.829.9 32.0
41.8 43.1 44.1 46.7 46.7 47.955.2 57.4
0.00
10.0
20.0
30.0
40.0
50.0
60.0
70.0
South Tees Sunderland Blackpool South Tyneside South Sefton North EastLincolnshire
Stoke on Trent Thanet St Helens Halton Knowsley
Page 67
Num. Source: National Commissioning Data Repository (NCDR) – Hospital Admissions Databases, SUS+ SEM (Secondary Uses Services Plus, Standard Extract Mart)
Den. Source: National Commissioning Data Repository (NCDR) – Hospital Admissions Databases, SUS+ SEM (Secondary Uses Services Plus, Standard Extract Mart)
NHS Blackpool CCG
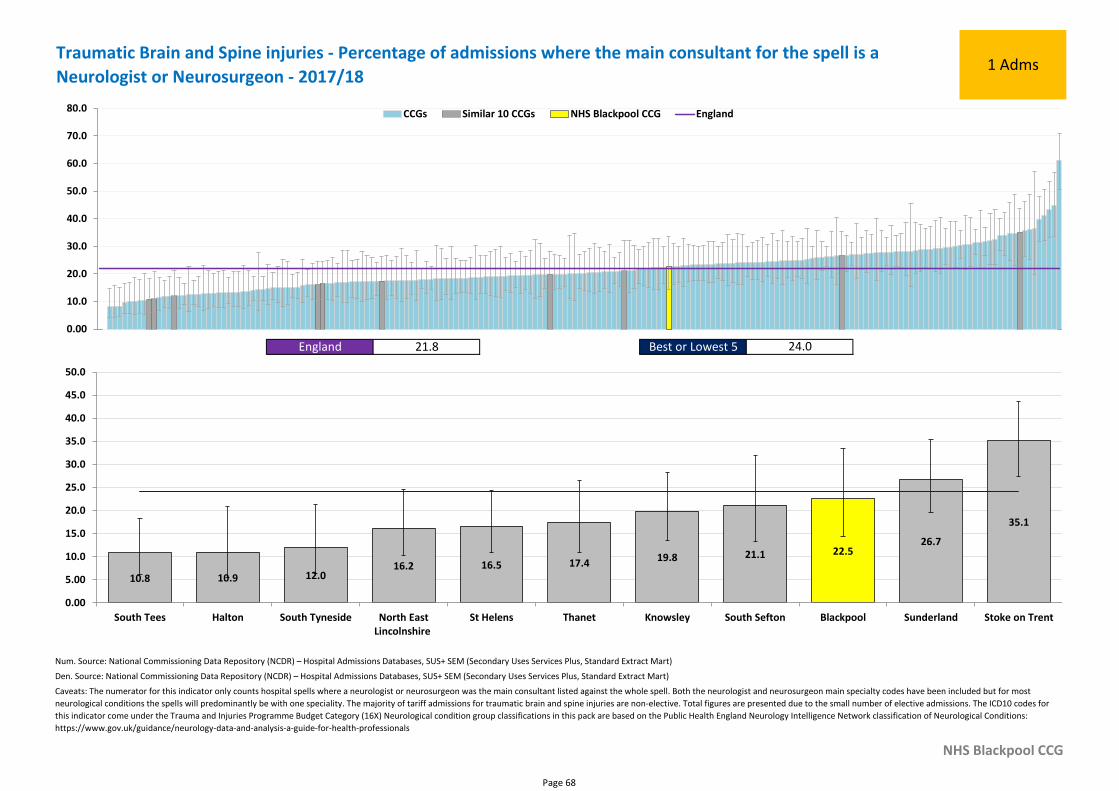
Caveats: The numerator for this indicator only counts hospital spells where a neurologist or neurosurgeon was the main consultant listed against the whole spell. Both the neurologist and neurosurgeon main specialty codes have been included but for most
neurological conditions the spells will predominantly be with one speciality. The majority of tariff admissions for traumatic brain and spine injuries are non-elective. Total figures are presented due to the small number of elective admissions. The ICD10 codes for
this indicator come under the Trauma and Injuries Programme Budget Category (16X) Neurological condition group classifications in this pack are based on the Public Health England Neurology Intelligence Network classification of Neurological Conditions:
https://www.gov.uk/guidance/neurology-data-and-analysis-a-guide-for-health-professionals
Traumatic Brain and Spine injuries - Percentage of admissions where the main consultant for the spell is a
Neurologist or Neurosurgeon - 2017/181 Adms
England 21.8 Best or Lowest 5 24.0
0.00
10.0
20.0
30.0
40.0
50.0
60.0
70.0
80.0 CCGs Similar 10 CCGs NHS Blackpool CCG England
22.5
10.8 10.9 12.016.2 16.5 17.4 19.8 21.1
26.7
35.1
0.00
5.00
10.0
15.0
20.0
25.0
30.0
35.0
40.0
45.0
50.0
South Tees Halton South Tyneside North EastLincolnshire
St Helens Thanet Knowsley South Sefton Blackpool Sunderland Stoke on Trent
Page 68
Num. Source: National Commissioning Data Repository (NCDR) – Hospital Admissions Databases, SUS+ SEM (Secondary Uses Services Plus, Standard Extract Mart)
Den. Source: Mid-year GP registered population, NHAIS (National Health Application and Infrastructure Services), NHS Digital
NHS Blackpool CCG
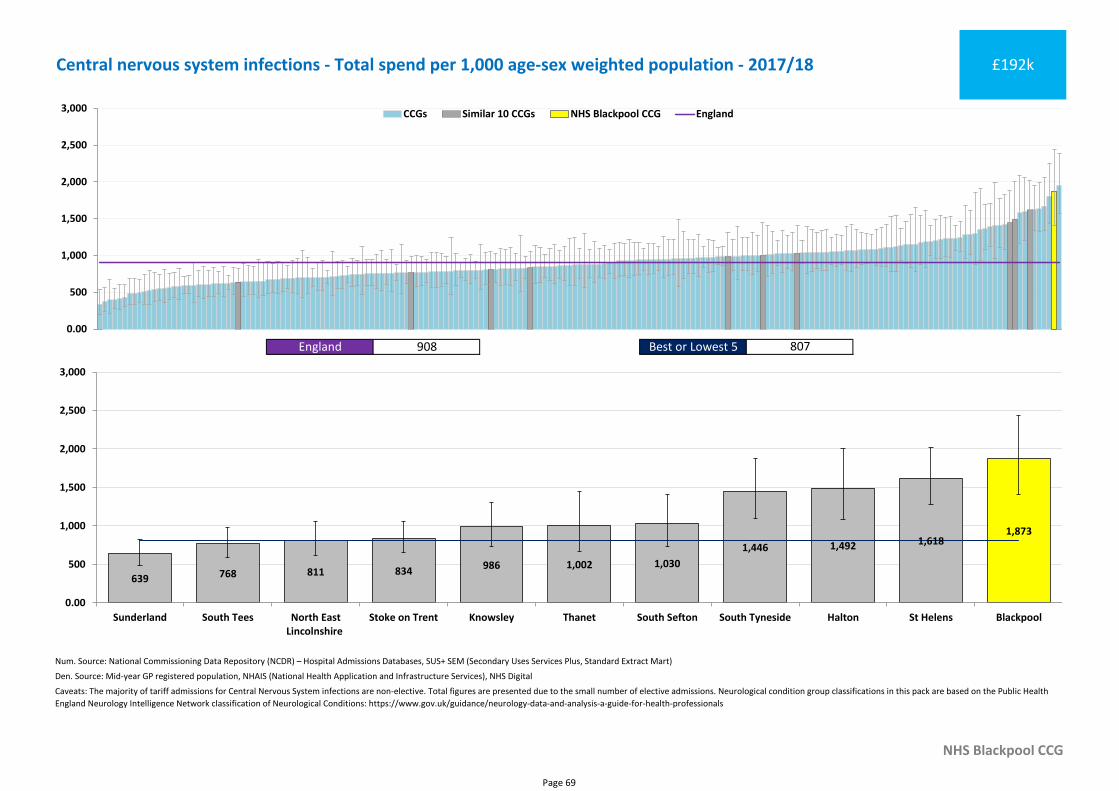
Caveats: The majority of tariff admissions for Central Nervous System infections are non-elective. Total figures are presented due to the small number of elective admissions. Neurological condition group classifications in this pack are based on the Public Health
England Neurology Intelligence Network classification of Neurological Conditions: https://www.gov.uk/guidance/neurology-data-and-analysis-a-guide-for-health-professionals
Central nervous system infections - Total spend per 1,000 age-sex weighted population - 2017/18 £192k
England 908 Best or Lowest 5 807
0.00
500
1,000
1,500
2,000
2,500
3,000 CCGs Similar 10 CCGs NHS Blackpool CCG England
1,873
639 768 811 834986 1,002 1,030
1,446 1,492 1,618
0.00
500
1,000
1,500
2,000
2,500
3,000
Sunderland South Tees North EastLincolnshire
Stoke on Trent Knowsley Thanet South Sefton South Tyneside Halton St Helens Blackpool
Page 69
Num. Source: National Commissioning Data Repository (NCDR) – Hospital Admissions Databases, SUS+ SEM (Secondary Uses Services Plus, Standard Extract Mart)
Den. Source: Mid-year GP registered populations, NHAIS (National Health Application and Infrastructure Services), NHS Digital
NHS Blackpool CCG
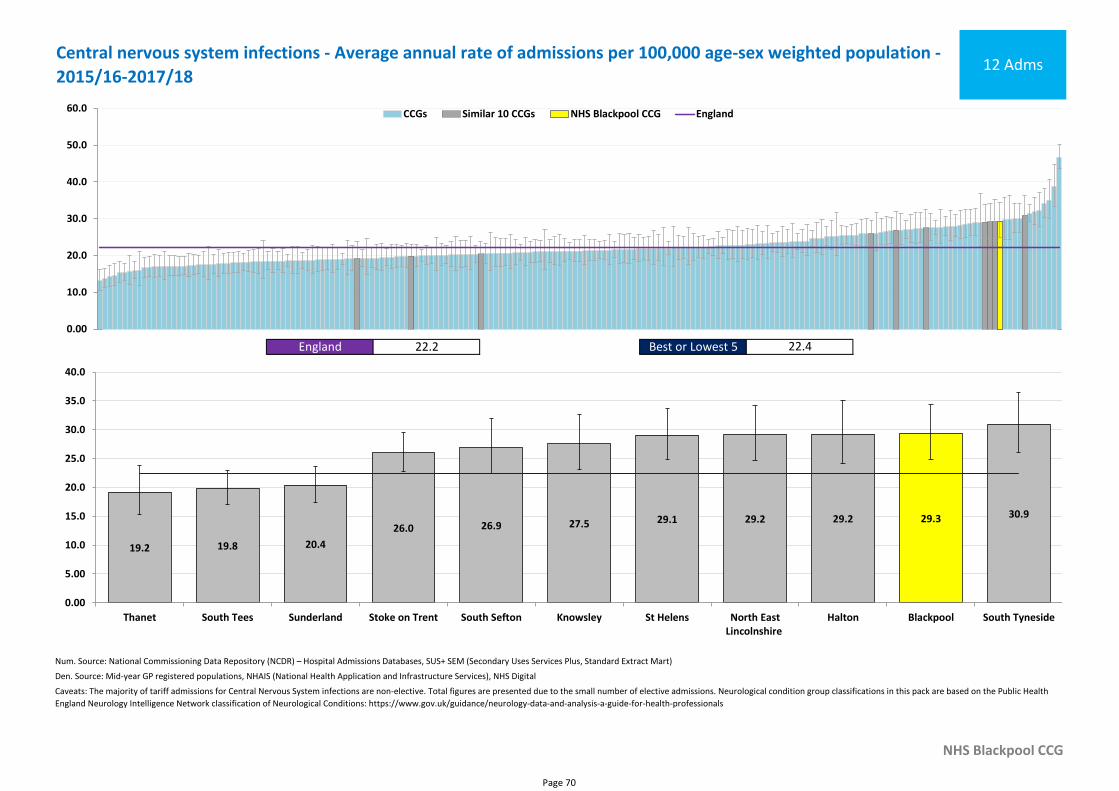
Caveats: The majority of tariff admissions for Central Nervous System infections are non-elective. Total figures are presented due to the small number of elective admissions. Neurological condition group classifications in this pack are based on the Public Health
England Neurology Intelligence Network classification of Neurological Conditions: https://www.gov.uk/guidance/neurology-data-and-analysis-a-guide-for-health-professionals
Central nervous system infections - Average annual rate of admissions per 100,000 age-sex weighted population -
2015/16-2017/1812 Adms
England 22.2 Best or Lowest 5 22.4
0.00
10.0
20.0
30.0
40.0
50.0
60.0 CCGs Similar 10 CCGs NHS Blackpool CCG England
29.3
19.2 19.8 20.4
26.0 26.9 27.5 29.1 29.2 29.2 30.9
0.00
5.00
10.0
15.0
20.0
25.0
30.0
35.0
40.0
Thanet South Tees Sunderland Stoke on Trent South Sefton Knowsley St Helens North EastLincolnshire
Halton Blackpool South Tyneside
Page 70
Num. Source: National Commissioning Data Repository (NCDR) – Hospital Admissions Databases, SUS+ SEM (Secondary Uses Services Plus, Standard Extract Mart)
Den. Source: National Commissioning Data Repository (NCDR) – Hospital Admissions Databases, SUS+ SEM (Secondary Uses Services Plus, Standard Extract Mart)
NHS Blackpool CCG
Caveats: The numerator for this indicator only counts hospital spells where a neurologist or neurosurgeon was the main consultant listed against the whole spell. Both the neurologist and neurosurgeon main specialty codes have been included but for most
neurological conditions the spells will predominantly be with one speciality. The majority of tariff admissions for Central Nervous System infections are non-elective. Total figures are presented due to the small number of elective admissions. Neurological
condition group classifications in this pack are based on the Public Health England Neurology Intelligence Network classification of Neurological Conditions: https://www.gov.uk/guidance/neurology-data-and-analysis-a-guide-for-health-professionals
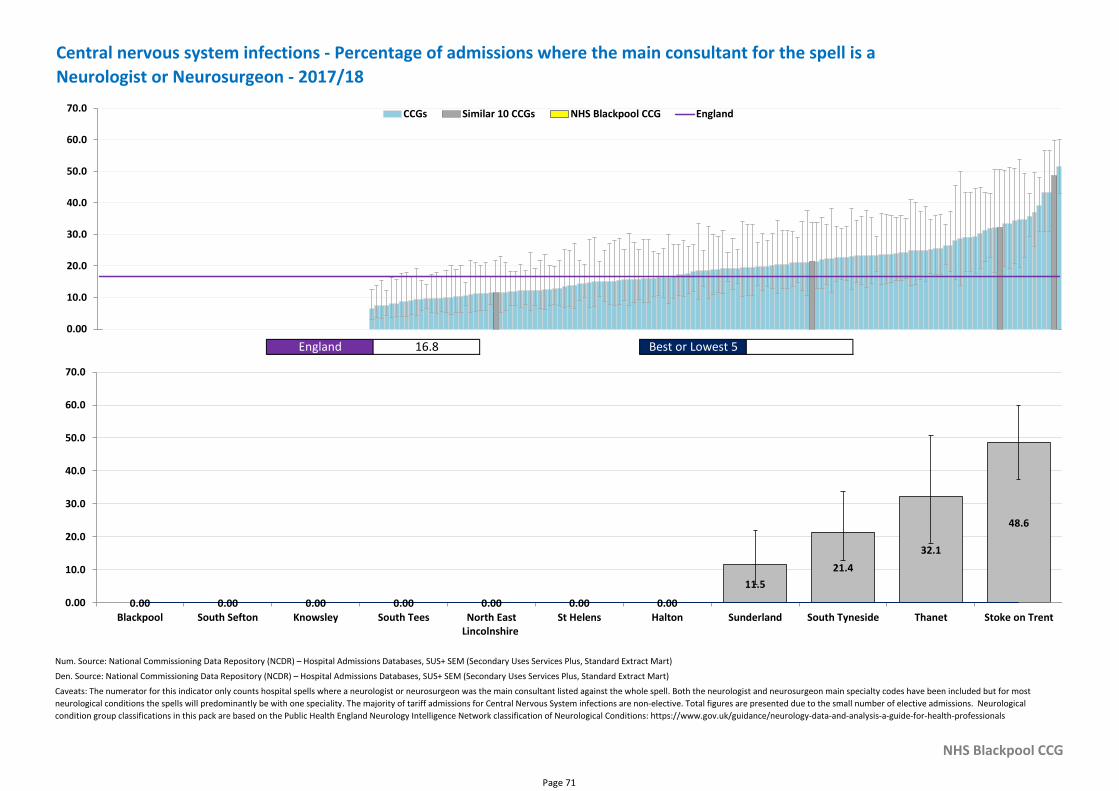
Central nervous system infections - Percentage of admissions where the main consultant for the spell is a
Neurologist or Neurosurgeon - 2017/18
England 16.8 Best or Lowest 5
0.00
10.0
20.0
30.0
40.0
50.0
60.0
70.0 CCGs Similar 10 CCGs NHS Blackpool CCG England
0.00 0.00 0.00 0.00 0.00 0.00 0.00
11.5
21.4
32.1
48.6
0.00
10.0
20.0
30.0
40.0
50.0
60.0
70.0
Blackpool South Sefton Knowsley South Tees North EastLincolnshire
St Helens Halton Sunderland South Tyneside Thanet Stoke on Trent
Page 71
Num. Source: National Commissioning Data Repository (NCDR) – Hospital Admissions Databases, SUS+ SEM (Secondary Uses Services Plus, Standard Extract Mart)
Den. Source: Mid-year GP registered population, NHAIS (National Health Application and Infrastructure Services), NHS Digital
NHS Blackpool CCG
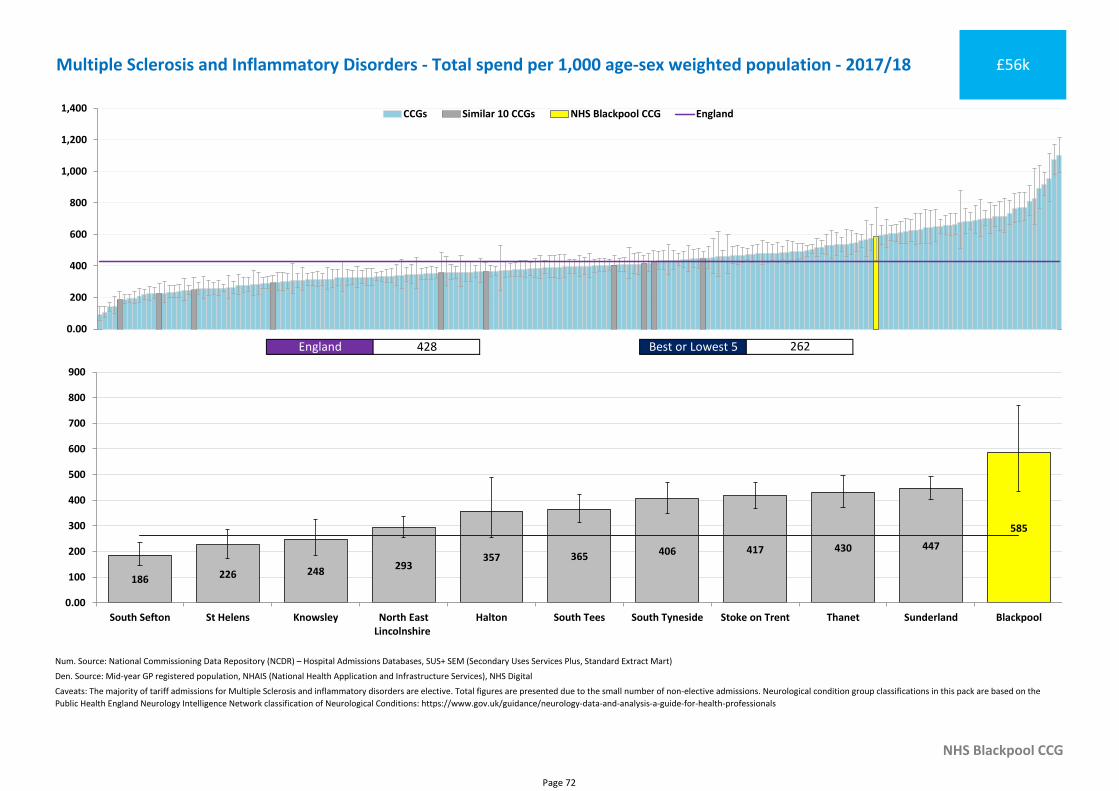
Caveats: The majority of tariff admissions for Multiple Sclerosis and inflammatory disorders are elective. Total figures are presented due to the small number of non-elective admissions. Neurological condition group classifications in this pack are based on the
Public Health England Neurology Intelligence Network classification of Neurological Conditions: https://www.gov.uk/guidance/neurology-data-and-analysis-a-guide-for-health-professionals
Multiple Sclerosis and Inflammatory Disorders - Total spend per 1,000 age-sex weighted population - 2017/18 £56k
England 428 Best or Lowest 5 262
0.00
200
400
600
800
1,000
1,200
1,400 CCGs Similar 10 CCGs NHS Blackpool CCG England
585
186 226 248293
357 365 406 417 430 447
0.00
100
200
300
400
500
600
700
800
900
South Sefton St Helens Knowsley North EastLincolnshire
Halton South Tees South Tyneside Stoke on Trent Thanet Sunderland Blackpool
Page 72
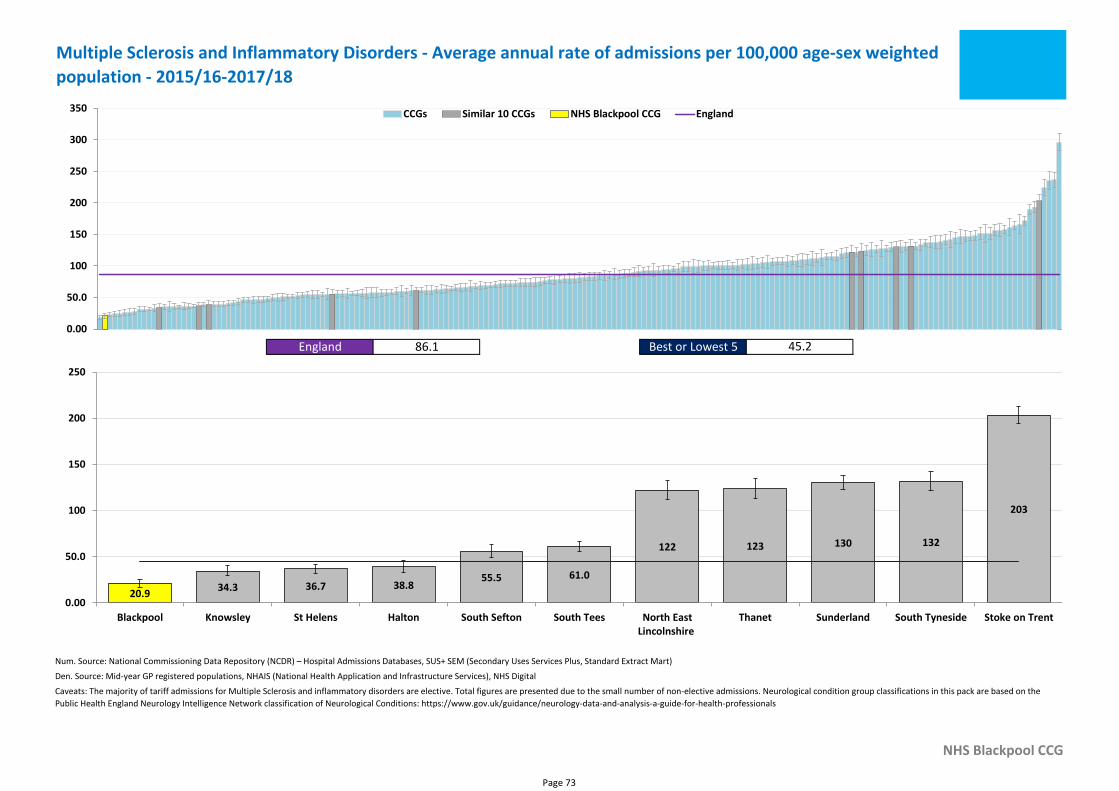
Num. Source: National Commissioning Data Repository (NCDR) – Hospital Admissions Databases, SUS+ SEM (Secondary Uses Services Plus, Standard Extract Mart)
Den. Source: Mid-year GP registered populations, NHAIS (National Health Application and Infrastructure Services), NHS Digital
NHS Blackpool CCG
Caveats: The majority of tariff admissions for Multiple Sclerosis and inflammatory disorders are elective. Total figures are presented due to the small number of non-elective admissions. Neurological condition group classifications in this pack are based on the
Public Health England Neurology Intelligence Network classification of Neurological Conditions: https://www.gov.uk/guidance/neurology-data-and-analysis-a-guide-for-health-professionals
Multiple Sclerosis and Inflammatory Disorders - Average annual rate of admissions per 100,000 age-sex weighted
population - 2015/16-2017/18
England 86.1 Best or Lowest 5 45.2
0.00
50.0
100
150
200
250
300
350 CCGs Similar 10 CCGs NHS Blackpool CCG England
20.934.3 36.7 38.8
55.5 61.0
122 123 130 132
203
0.00
50.0
100
150
200
250
Blackpool Knowsley St Helens Halton South Sefton South Tees North EastLincolnshire
Thanet Sunderland South Tyneside Stoke on Trent
Page 73
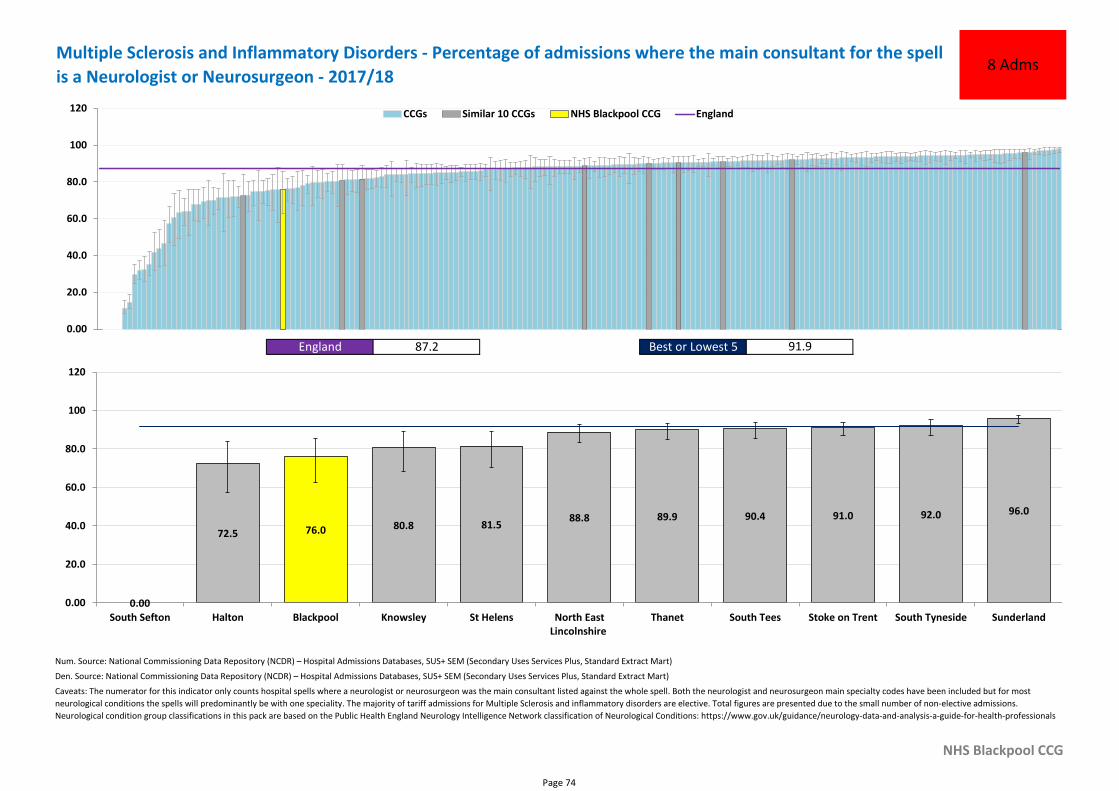
Num. Source: National Commissioning Data Repository (NCDR) – Hospital Admissions Databases, SUS+ SEM (Secondary Uses Services Plus, Standard Extract Mart)
Den. Source: National Commissioning Data Repository (NCDR) – Hospital Admissions Databases, SUS+ SEM (Secondary Uses Services Plus, Standard Extract Mart)
NHS Blackpool CCG
Caveats: The numerator for this indicator only counts hospital spells where a neurologist or neurosurgeon was the main consultant listed against the whole spell. Both the neurologist and neurosurgeon main specialty codes have been included but for most
neurological conditions the spells will predominantly be with one speciality. The majority of tariff admissions for Multiple Sclerosis and inflammatory disorders are elective. Total figures are presented due to the small number of non-elective admissions.
Neurological condition group classifications in this pack are based on the Public Health England Neurology Intelligence Network classification of Neurological Conditions: https://www.gov.uk/guidance/neurology-data-and-analysis-a-guide-for-health-professionals
Multiple Sclerosis and Inflammatory Disorders - Percentage of admissions where the main consultant for the spell
is a Neurologist or Neurosurgeon - 2017/188 Adms
England 87.2 Best or Lowest 5 91.9
0.00
20.0
40.0
60.0
80.0
100
120 CCGs Similar 10 CCGs NHS Blackpool CCG England
76.0
0.00
72.580.8 81.5
88.8 89.9 90.4 91.0 92.0 96.0
0.00
20.0
40.0
60.0
80.0
100
120
South Sefton Halton Blackpool Knowsley St Helens North EastLincolnshire
Thanet South Tees Stoke on Trent South Tyneside Sunderland
Page 74
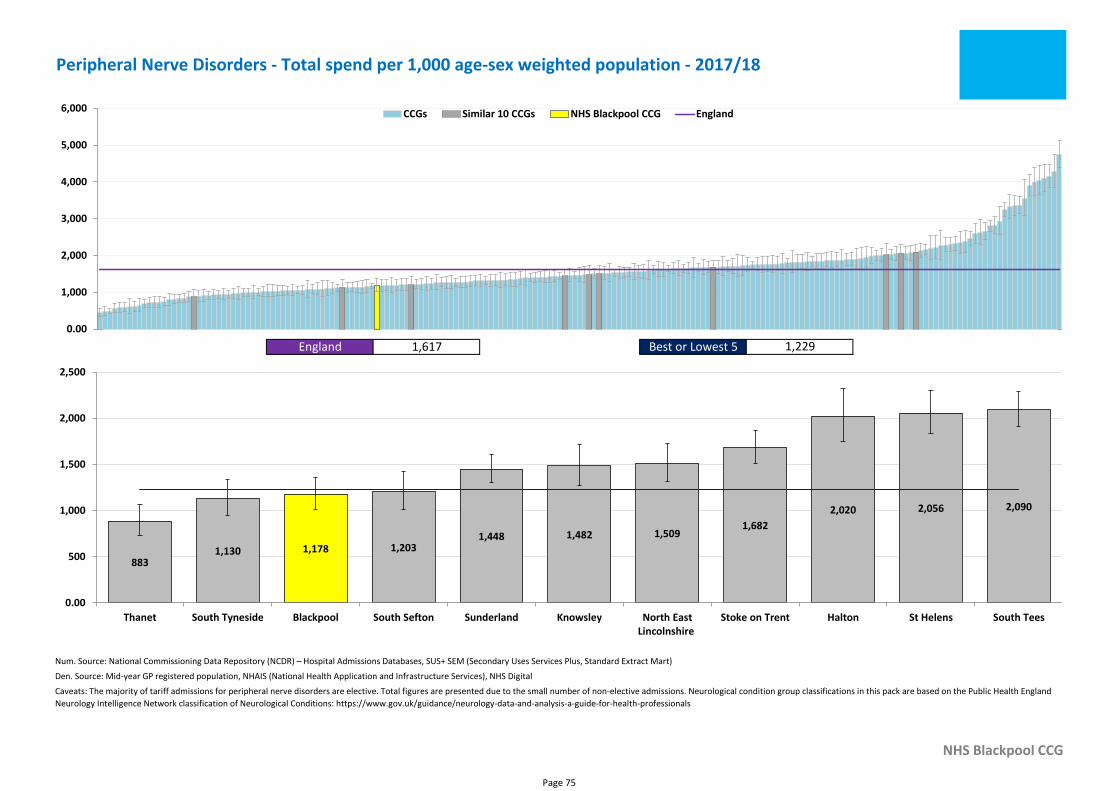
Num. Source: National Commissioning Data Repository (NCDR) – Hospital Admissions Databases, SUS+ SEM (Secondary Uses Services Plus, Standard Extract Mart)
Den. Source: Mid-year GP registered population, NHAIS (National Health Application and Infrastructure Services), NHS Digital
NHS Blackpool CCG
Caveats: The majority of tariff admissions for peripheral nerve disorders are elective. Total figures are presented due to the small number of non-elective admissions. Neurological condition group classifications in this pack are based on the Public Health England
Neurology Intelligence Network classification of Neurological Conditions: https://www.gov.uk/guidance/neurology-data-and-analysis-a-guide-for-health-professionals
Peripheral Nerve Disorders - Total spend per 1,000 age-sex weighted population - 2017/18
England 1,617 Best or Lowest 5 1,229
0.00
1,000
2,000
3,000
4,000
5,000
6,000 CCGs Similar 10 CCGs NHS Blackpool CCG England
1,178883
1,130 1,2031,448 1,482 1,509
1,682
2,020 2,056 2,090
0.00
500
1,000
1,500
2,000
2,500
Thanet South Tyneside Blackpool South Sefton Sunderland Knowsley North EastLincolnshire
Stoke on Trent Halton St Helens South Tees
Page 75
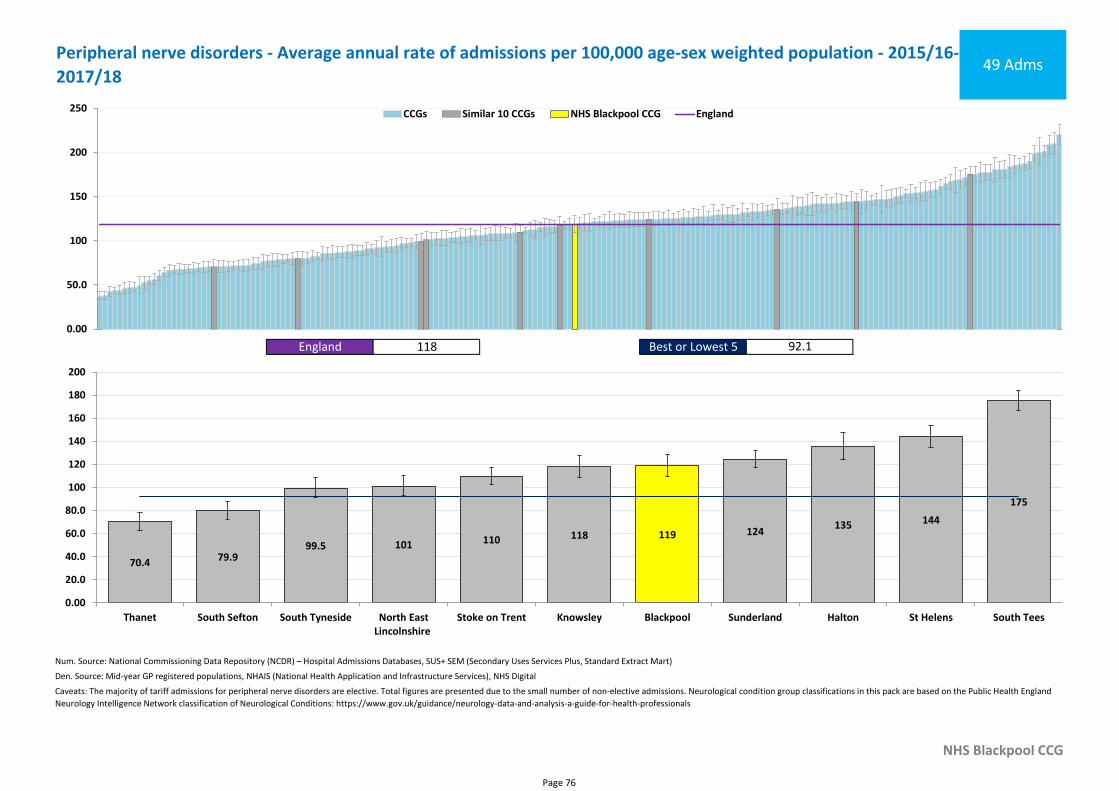
Num. Source: National Commissioning Data Repository (NCDR) – Hospital Admissions Databases, SUS+ SEM (Secondary Uses Services Plus, Standard Extract Mart)
Den. Source: Mid-year GP registered populations, NHAIS (National Health Application and Infrastructure Services), NHS Digital
NHS Blackpool CCG
Caveats: The majority of tariff admissions for peripheral nerve disorders are elective. Total figures are presented due to the small number of non-elective admissions. Neurological condition group classifications in this pack are based on the Public Health England
Neurology Intelligence Network classification of Neurological Conditions: https://www.gov.uk/guidance/neurology-data-and-analysis-a-guide-for-health-professionals
Peripheral nerve disorders - Average annual rate of admissions per 100,000 age-sex weighted population - 2015/16-
2017/1849 Adms
England 118 Best or Lowest 5 92.1
0.00
50.0
100
150
200
250 CCGs Similar 10 CCGs NHS Blackpool CCG England
119
70.4 79.999.5 101 110 118 124
135 144
175
0.00
20.0
40.0
60.0
80.0
100
120
140
160
180
200
Thanet South Sefton South Tyneside North EastLincolnshire
Stoke on Trent Knowsley Blackpool Sunderland Halton St Helens South Tees
Page 76
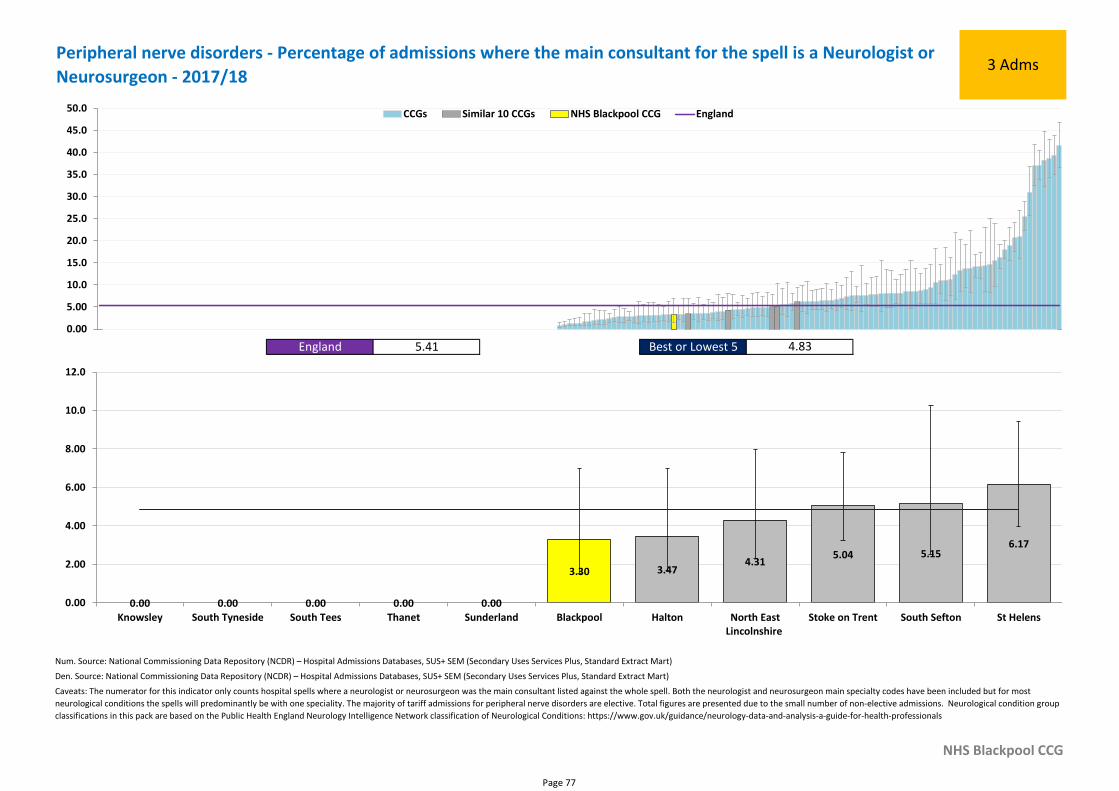
Num. Source: National Commissioning Data Repository (NCDR) – Hospital Admissions Databases, SUS+ SEM (Secondary Uses Services Plus, Standard Extract Mart)
Den. Source: National Commissioning Data Repository (NCDR) – Hospital Admissions Databases, SUS+ SEM (Secondary Uses Services Plus, Standard Extract Mart)
NHS Blackpool CCG
Caveats: The numerator for this indicator only counts hospital spells where a neurologist or neurosurgeon was the main consultant listed against the whole spell. Both the neurologist and neurosurgeon main specialty codes have been included but for most
neurological conditions the spells will predominantly be with one speciality. The majority of tariff admissions for peripheral nerve disorders are elective. Total figures are presented due to the small number of non-elective admissions. Neurological condition group
classifications in this pack are based on the Public Health England Neurology Intelligence Network classification of Neurological Conditions: https://www.gov.uk/guidance/neurology-data-and-analysis-a-guide-for-health-professionals
Peripheral nerve disorders - Percentage of admissions where the main consultant for the spell is a Neurologist or
Neurosurgeon - 2017/183 Adms
England 5.41 Best or Lowest 5 4.83
0.00
5.00
10.0
15.0
20.0
25.0
30.0
35.0
40.0
45.0
50.0 CCGs Similar 10 CCGs NHS Blackpool CCG England
3.30
0.00 0.00 0.00 0.00 0.00
3.474.31
5.04 5.156.17
0.00
2.00
4.00
6.00
8.00
10.0
12.0
Knowsley South Tyneside South Tees Thanet Sunderland Blackpool Halton North EastLincolnshire
Stoke on Trent South Sefton St Helens
Page 77
Section 4b - Secondary Care
• Total bed days
• Elective bed days
• Non-elective bed days
Page 78
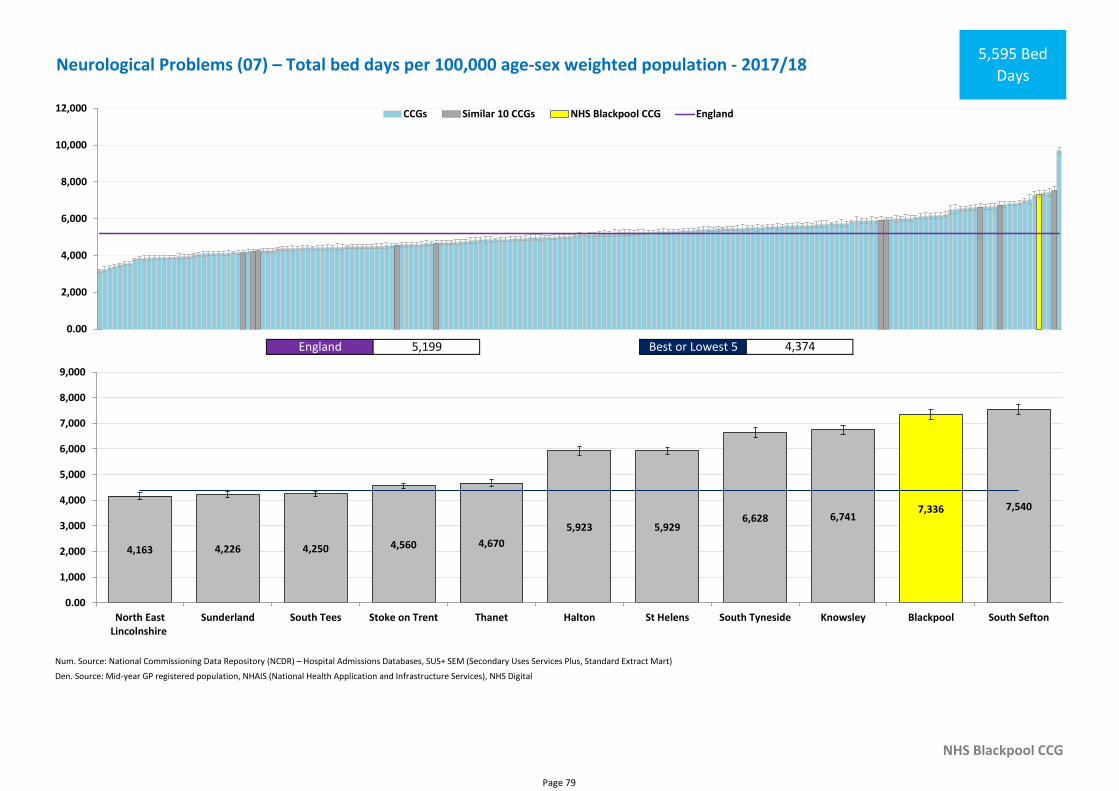
Num. Source: National Commissioning Data Repository (NCDR) – Hospital Admissions Databases, SUS+ SEM (Secondary Uses Services Plus, Standard Extract Mart)
Den. Source: Mid-year GP registered population, NHAIS (National Health Application and Infrastructure Services), NHS Digital
NHS Blackpool CCG
Neurological Problems (07) – Total bed days per 100,000 age-sex weighted population - 2017/185,595 Bed
Days
England 5,199 Best or Lowest 5 4,374
0.00
2,000
4,000
6,000
8,000
10,000
12,000 CCGs Similar 10 CCGs NHS Blackpool CCG England
7,336
4,163 4,226 4,250 4,560 4,670
5,923 5,9296,628 6,741
7,540
0.00
1,000
2,000
3,000
4,000
5,000
6,000
7,000
8,000
9,000
North EastLincolnshire
Sunderland South Tees Stoke on Trent Thanet Halton St Helens South Tyneside Knowsley Blackpool South Sefton
Page 79
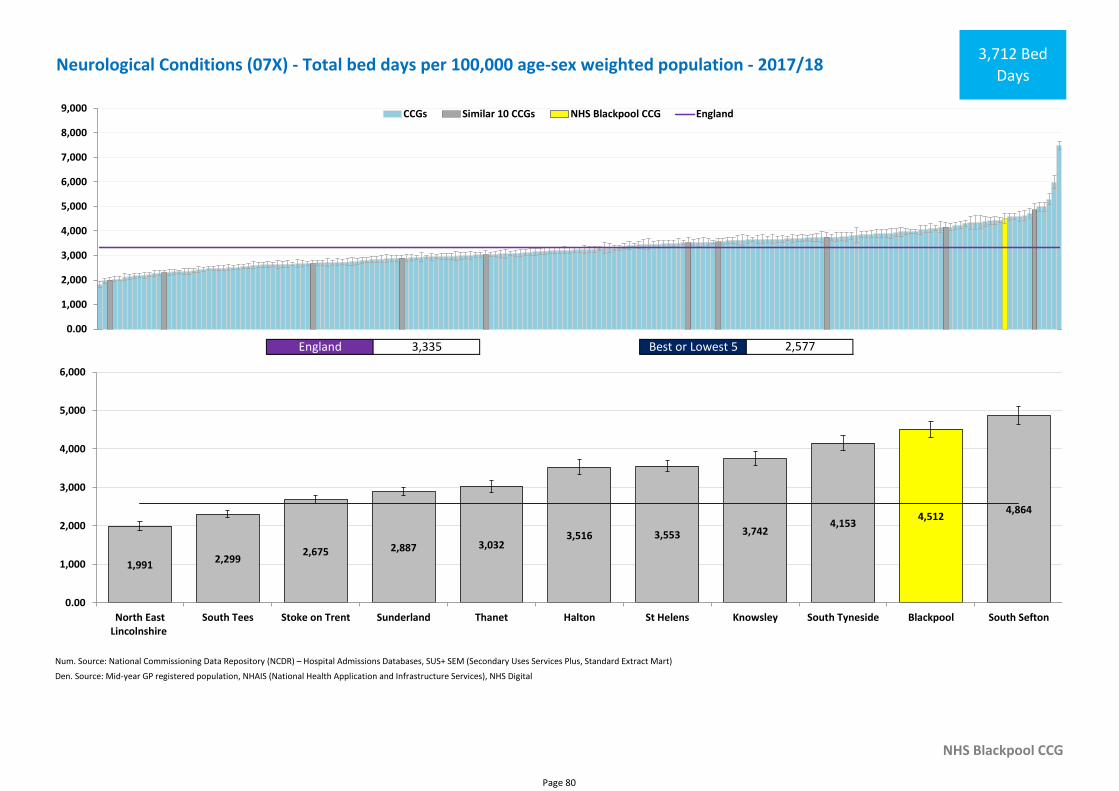
Num. Source: National Commissioning Data Repository (NCDR) – Hospital Admissions Databases, SUS+ SEM (Secondary Uses Services Plus, Standard Extract Mart)
Den. Source: Mid-year GP registered population, NHAIS (National Health Application and Infrastructure Services), NHS Digital
NHS Blackpool CCG
Neurological Conditions (07X) - Total bed days per 100,000 age-sex weighted population - 2017/183,712 Bed
Days
England 3,335 Best or Lowest 5 2,577
0.00
1,000
2,000
3,000
4,000
5,000
6,000
7,000
8,000
9,000 CCGs Similar 10 CCGs NHS Blackpool CCG England
4,512
1,9912,299
2,675 2,887 3,0323,516 3,553 3,742
4,1534,864
0.00
1,000
2,000
3,000
4,000
5,000
6,000
North EastLincolnshire
South Tees Stoke on Trent Sunderland Thanet Halton St Helens Knowsley South Tyneside Blackpool South Sefton
Page 80

Num. Source: National Commissioning Data Repository (NCDR) – Hospital Admissions Databases, SUS+ SEM (Secondary Uses Services Plus, Standard Extract Mart)
Den. Source: Mid-year GP registered population, NHAIS (National Health Application and Infrastructure Services), NHS Digital
NHS Blackpool CCG
Caveats: Neurological condition group classifications in this pack are based on the Public Health England Neurology Intelligence Network classification of Neurological Conditions: https://www.gov.uk/guidance/neurology-data-and-analysis-a-guide-for-health-
professionals
Rare and other neurological diseases - Elective bed days per 100,000 age-sex weighted population - 2017/18
England 74.0 Best or Lowest 5 62.2
0.00
50.0
100
150
200
250
300
350
400
450 CCGs Similar 10 CCGs NHS Blackpool CCG England
72.9
30.257.6 64.9 68.5
89.7 103 117
172 184 190
0.00
50.0
100
150
200
250
300
North EastLincolnshire
Sunderland St Helens South Tees Blackpool Knowsley Thanet South Tyneside Halton Stoke on Trent South Sefton
Page 81
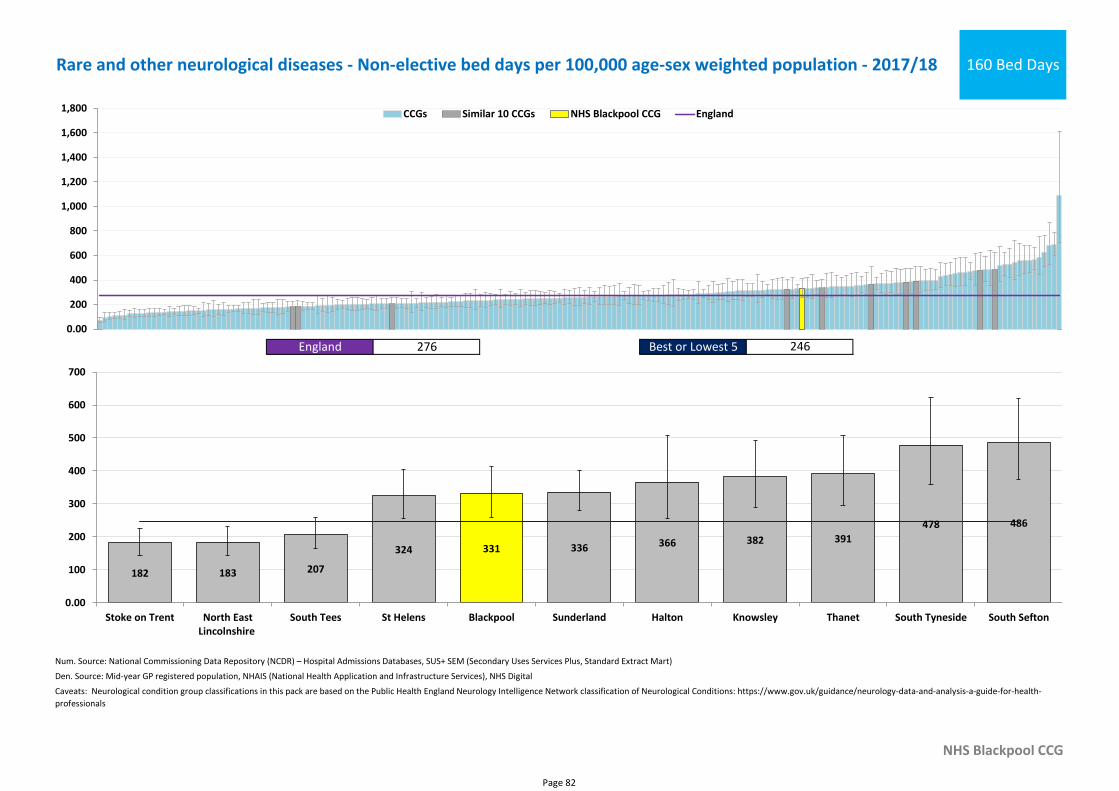
Num. Source: National Commissioning Data Repository (NCDR) – Hospital Admissions Databases, SUS+ SEM (Secondary Uses Services Plus, Standard Extract Mart)
Den. Source: Mid-year GP registered population, NHAIS (National Health Application and Infrastructure Services), NHS Digital
NHS Blackpool CCG
Caveats: Neurological condition group classifications in this pack are based on the Public Health England Neurology Intelligence Network classification of Neurological Conditions: https://www.gov.uk/guidance/neurology-data-and-analysis-a-guide-for-health-
professionals
Rare and other neurological diseases - Non-elective bed days per 100,000 age-sex weighted population - 2017/18 160 Bed Days
England 276 Best or Lowest 5 246
0.00
200
400
600
800
1,000
1,200
1,400
1,600
1,800 CCGs Similar 10 CCGs NHS Blackpool CCG England
331
182 183 207
324 336 366 382 391
478 486
0.00
100
200
300
400
500
600
700
Stoke on Trent North EastLincolnshire
South Tees St Helens Blackpool Sunderland Halton Knowsley Thanet South Tyneside South Sefton
Page 82
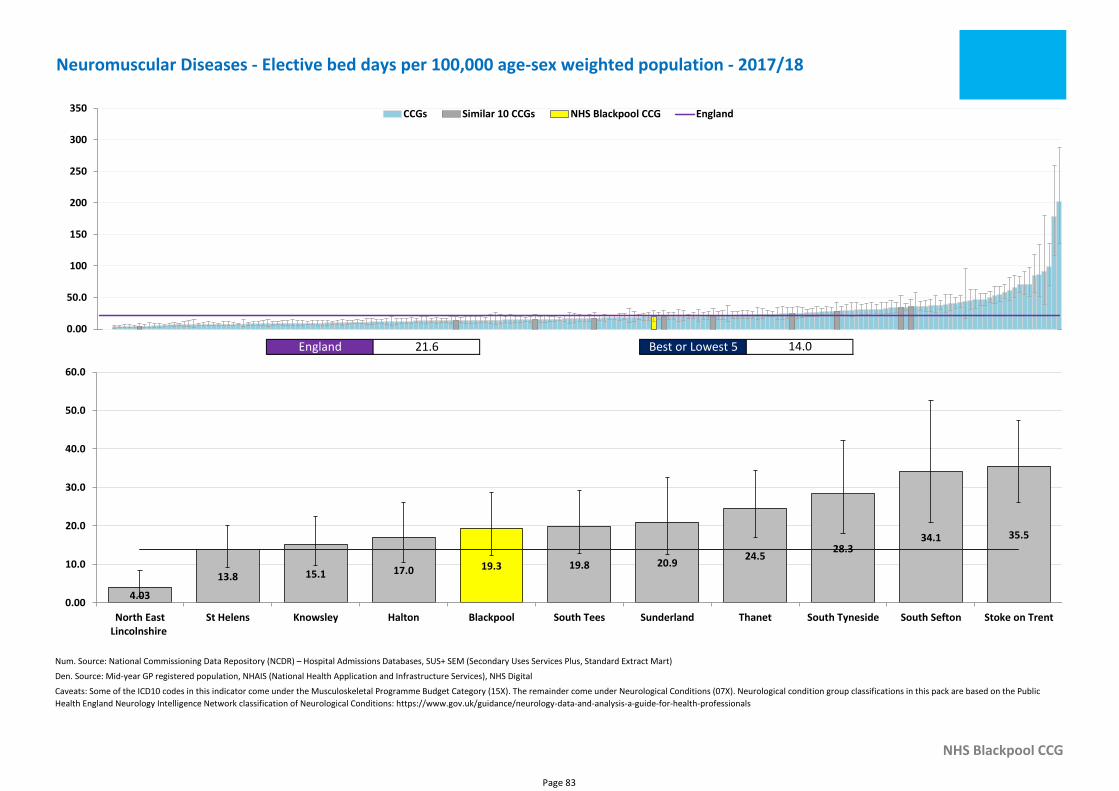
Num. Source: National Commissioning Data Repository (NCDR) – Hospital Admissions Databases, SUS+ SEM (Secondary Uses Services Plus, Standard Extract Mart)
Den. Source: Mid-year GP registered population, NHAIS (National Health Application and Infrastructure Services), NHS Digital
NHS Blackpool CCG
Caveats: Some of the ICD10 codes in this indicator come under the Musculoskeletal Programme Budget Category (15X). The remainder come under Neurological Conditions (07X). Neurological condition group classifications in this pack are based on the Public
Health England Neurology Intelligence Network classification of Neurological Conditions: https://www.gov.uk/guidance/neurology-data-and-analysis-a-guide-for-health-professionals
Neuromuscular Diseases - Elective bed days per 100,000 age-sex weighted population - 2017/18
England 21.6 Best or Lowest 5 14.0
0.00
50.0
100
150
200
250
300
350 CCGs Similar 10 CCGs NHS Blackpool CCG England
19.3
4.03
13.8 15.1 17.0 19.8 20.924.5
28.334.1 35.5
0.00
10.0
20.0
30.0
40.0
50.0
60.0
North EastLincolnshire
St Helens Knowsley Halton Blackpool South Tees Sunderland Thanet South Tyneside South Sefton Stoke on Trent
Page 83
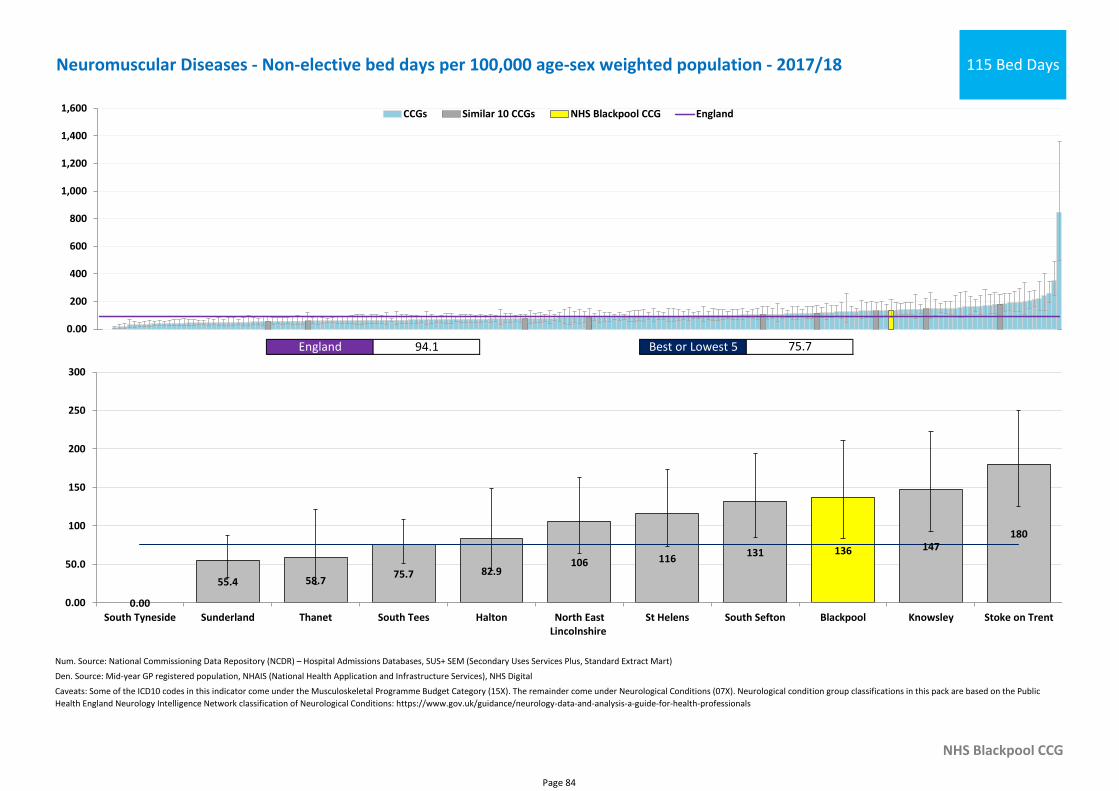
Num. Source: National Commissioning Data Repository (NCDR) – Hospital Admissions Databases, SUS+ SEM (Secondary Uses Services Plus, Standard Extract Mart)
Den. Source: Mid-year GP registered population, NHAIS (National Health Application and Infrastructure Services), NHS Digital
NHS Blackpool CCG
Caveats: Some of the ICD10 codes in this indicator come under the Musculoskeletal Programme Budget Category (15X). The remainder come under Neurological Conditions (07X). Neurological condition group classifications in this pack are based on the Public
Health England Neurology Intelligence Network classification of Neurological Conditions: https://www.gov.uk/guidance/neurology-data-and-analysis-a-guide-for-health-professionals
Neuromuscular Diseases - Non-elective bed days per 100,000 age-sex weighted population - 2017/18 115 Bed Days
England 94.1 Best or Lowest 5 75.7
0.00
200
400
600
800
1,000
1,200
1,400
1,600 CCGs Similar 10 CCGs NHS Blackpool CCG England
136
0.00
55.4 58.775.7 82.9
106 116131
147180
0.00
50.0
100
150
200
250
300
South Tyneside Sunderland Thanet South Tees Halton North EastLincolnshire
St Helens South Sefton Blackpool Knowsley Stoke on Trent
Page 84
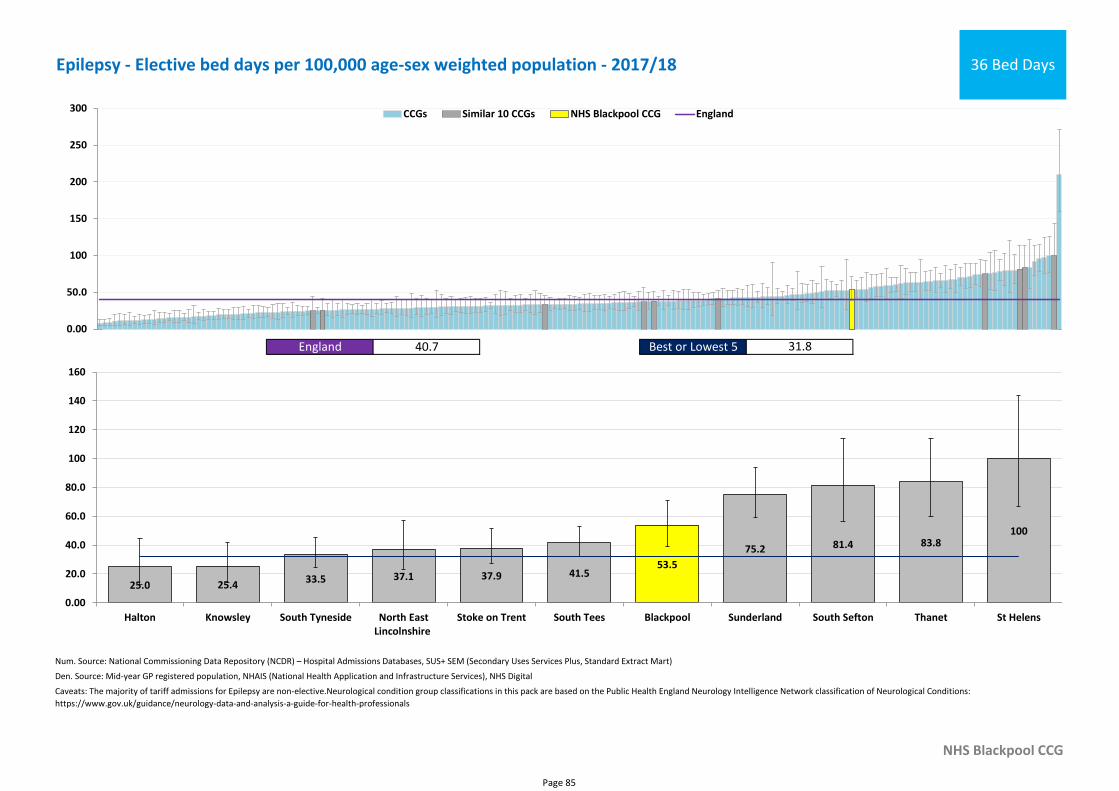
Num. Source: National Commissioning Data Repository (NCDR) – Hospital Admissions Databases, SUS+ SEM (Secondary Uses Services Plus, Standard Extract Mart)
Den. Source: Mid-year GP registered population, NHAIS (National Health Application and Infrastructure Services), NHS Digital
NHS Blackpool CCG
Caveats: The majority of tariff admissions for Epilepsy are non-elective.Neurological condition group classifications in this pack are based on the Public Health England Neurology Intelligence Network classification of Neurological Conditions:
https://www.gov.uk/guidance/neurology-data-and-analysis-a-guide-for-health-professionals
Epilepsy - Elective bed days per 100,000 age-sex weighted population - 2017/18 36 Bed Days
England 40.7 Best or Lowest 5 31.8
0.00
50.0
100
150
200
250
300 CCGs Similar 10 CCGs NHS Blackpool CCG England
53.5
25.0 25.433.5 37.1 37.9 41.5
75.2 81.4 83.8100
0.00
20.0
40.0
60.0
80.0
100
120
140
160
Halton Knowsley South Tyneside North EastLincolnshire
Stoke on Trent South Tees Blackpool Sunderland South Sefton Thanet St Helens
Page 85
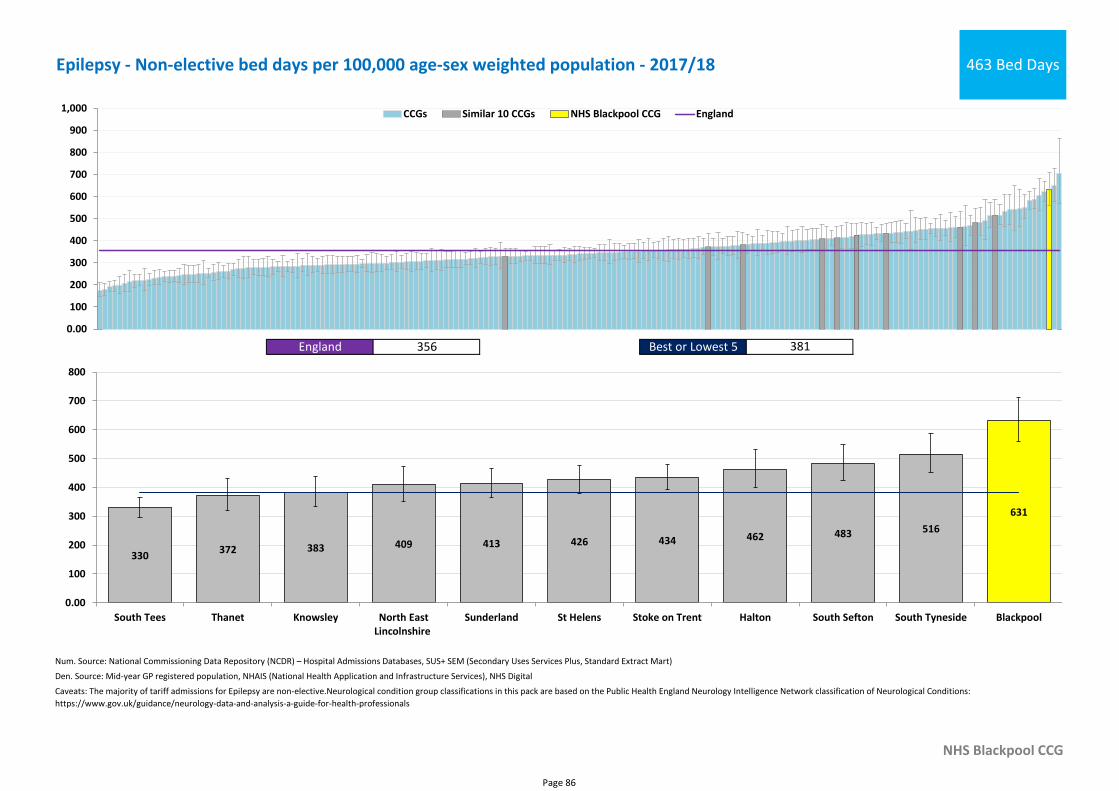
Num. Source: National Commissioning Data Repository (NCDR) – Hospital Admissions Databases, SUS+ SEM (Secondary Uses Services Plus, Standard Extract Mart)
Den. Source: Mid-year GP registered population, NHAIS (National Health Application and Infrastructure Services), NHS Digital
NHS Blackpool CCG
Caveats: The majority of tariff admissions for Epilepsy are non-elective.Neurological condition group classifications in this pack are based on the Public Health England Neurology Intelligence Network classification of Neurological Conditions:
https://www.gov.uk/guidance/neurology-data-and-analysis-a-guide-for-health-professionals
Epilepsy - Non-elective bed days per 100,000 age-sex weighted population - 2017/18 463 Bed Days
England 356 Best or Lowest 5 381
0.00
100
200
300
400
500
600
700
800
900
1,000 CCGs Similar 10 CCGs NHS Blackpool CCG England
631
330372 383 409 413 426 434 462 483 516
0.00
100
200
300
400
500
600
700
800
South Tees Thanet Knowsley North EastLincolnshire
Sunderland St Helens Stoke on Trent Halton South Sefton South Tyneside Blackpool
Page 86
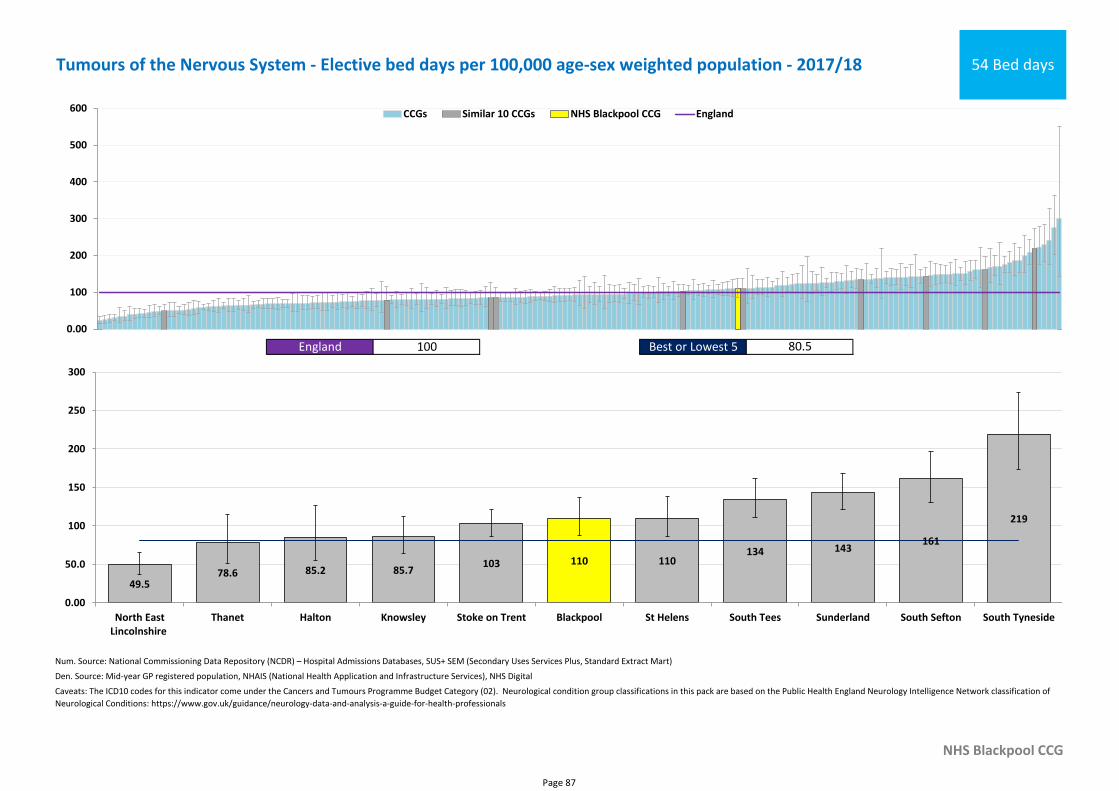
Num. Source: National Commissioning Data Repository (NCDR) – Hospital Admissions Databases, SUS+ SEM (Secondary Uses Services Plus, Standard Extract Mart)
Den. Source: Mid-year GP registered population, NHAIS (National Health Application and Infrastructure Services), NHS Digital
NHS Blackpool CCG
Caveats: The ICD10 codes for this indicator come under the Cancers and Tumours Programme Budget Category (02). Neurological condition group classifications in this pack are based on the Public Health England Neurology Intelligence Network classification of
Neurological Conditions: https://www.gov.uk/guidance/neurology-data-and-analysis-a-guide-for-health-professionals
Tumours of the Nervous System - Elective bed days per 100,000 age-sex weighted population - 2017/18 54 Bed days
England 100 Best or Lowest 5 80.5
0.00
100
200
300
400
500
600 CCGs Similar 10 CCGs NHS Blackpool CCG England
110
49.578.6 85.2 85.7
103 110134 143
161
219
0.00
50.0
100
150
200
250
300
North EastLincolnshire
Thanet Halton Knowsley Stoke on Trent Blackpool St Helens South Tees Sunderland South Sefton South Tyneside
Page 87
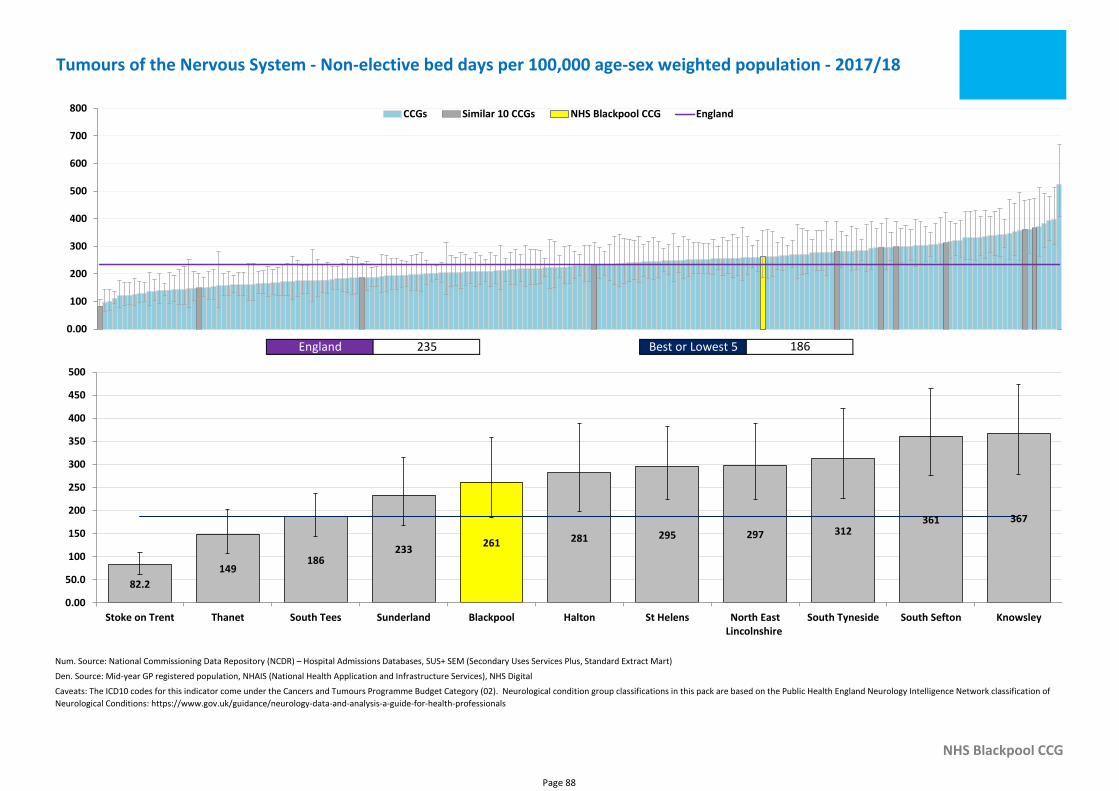
Num. Source: National Commissioning Data Repository (NCDR) – Hospital Admissions Databases, SUS+ SEM (Secondary Uses Services Plus, Standard Extract Mart)
Den. Source: Mid-year GP registered population, NHAIS (National Health Application and Infrastructure Services), NHS Digital
NHS Blackpool CCG
Caveats: The ICD10 codes for this indicator come under the Cancers and Tumours Programme Budget Category (02). Neurological condition group classifications in this pack are based on the Public Health England Neurology Intelligence Network classification of
Neurological Conditions: https://www.gov.uk/guidance/neurology-data-and-analysis-a-guide-for-health-professionals
Tumours of the Nervous System - Non-elective bed days per 100,000 age-sex weighted population - 2017/18
England 235 Best or Lowest 5 186
0.00
100
200
300
400
500
600
700
800 CCGs Similar 10 CCGs NHS Blackpool CCG England
261
82.2
149186
233281 295 297 312
361 367
0.00
50.0
100
150
200
250
300
350
400
450
500
Stoke on Trent Thanet South Tees Sunderland Blackpool Halton St Helens North EastLincolnshire
South Tyneside South Sefton Knowsley
Page 88
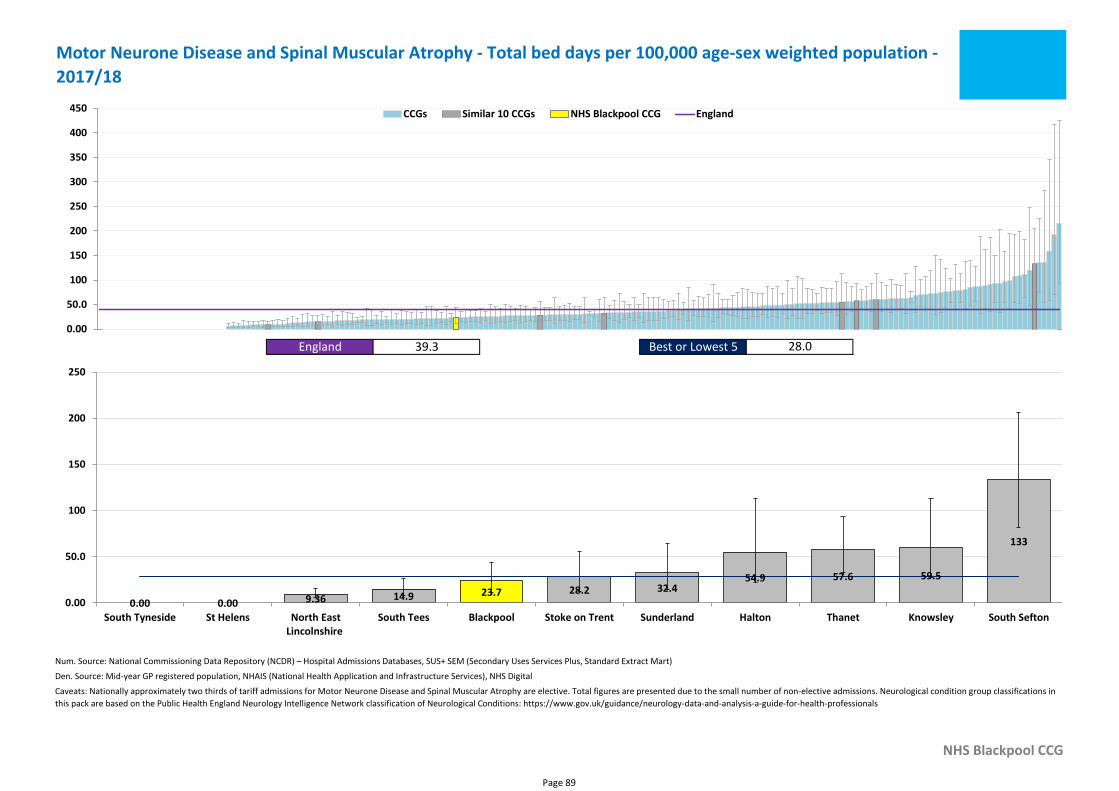
Num. Source: National Commissioning Data Repository (NCDR) – Hospital Admissions Databases, SUS+ SEM (Secondary Uses Services Plus, Standard Extract Mart)
Den. Source: Mid-year GP registered population, NHAIS (National Health Application and Infrastructure Services), NHS Digital
NHS Blackpool CCG
Caveats: Nationally approximately two thirds of tariff admissions for Motor Neurone Disease and Spinal Muscular Atrophy are elective. Total figures are presented due to the small number of non-elective admissions. Neurological condition group classifications in
this pack are based on the Public Health England Neurology Intelligence Network classification of Neurological Conditions: https://www.gov.uk/guidance/neurology-data-and-analysis-a-guide-for-health-professionals
Motor Neurone Disease and Spinal Muscular Atrophy - Total bed days per 100,000 age-sex weighted population -
2017/18
England 39.3 Best or Lowest 5 28.0
0.00
50.0
100
150
200
250
300
350
400
450 CCGs Similar 10 CCGs NHS Blackpool CCG England
23.70.00 0.00 9.36 14.9
28.2 32.454.9 57.6 59.5
133
0.00
50.0
100
150
200
250
South Tyneside St Helens North EastLincolnshire
South Tees Blackpool Stoke on Trent Sunderland Halton Thanet Knowsley South Sefton
Page 89
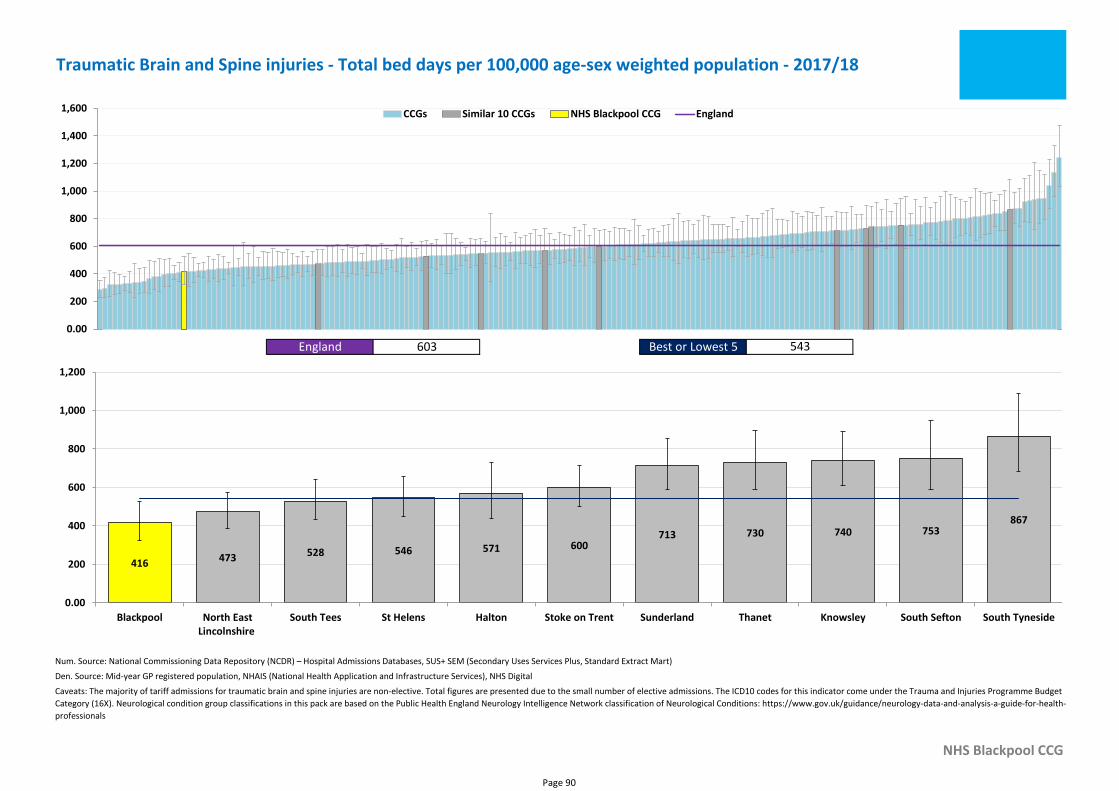
Num. Source: National Commissioning Data Repository (NCDR) – Hospital Admissions Databases, SUS+ SEM (Secondary Uses Services Plus, Standard Extract Mart)
Den. Source: Mid-year GP registered population, NHAIS (National Health Application and Infrastructure Services), NHS Digital
NHS Blackpool CCG
Caveats: The majority of tariff admissions for traumatic brain and spine injuries are non-elective. Total figures are presented due to the small number of elective admissions. The ICD10 codes for this indicator come under the Trauma and Injuries Programme Budget
Category (16X). Neurological condition group classifications in this pack are based on the Public Health England Neurology Intelligence Network classification of Neurological Conditions: https://www.gov.uk/guidance/neurology-data-and-analysis-a-guide-for-health-
professionals
Traumatic Brain and Spine injuries - Total bed days per 100,000 age-sex weighted population - 2017/18
England 603 Best or Lowest 5 543
0.00
200
400
600
800
1,000
1,200
1,400
1,600 CCGs Similar 10 CCGs NHS Blackpool CCG England
416 473 528 546 571 600713 730 740 753
867
0.00
200
400
600
800
1,000
1,200
Blackpool North EastLincolnshire
South Tees St Helens Halton Stoke on Trent Sunderland Thanet Knowsley South Sefton South Tyneside
Page 90
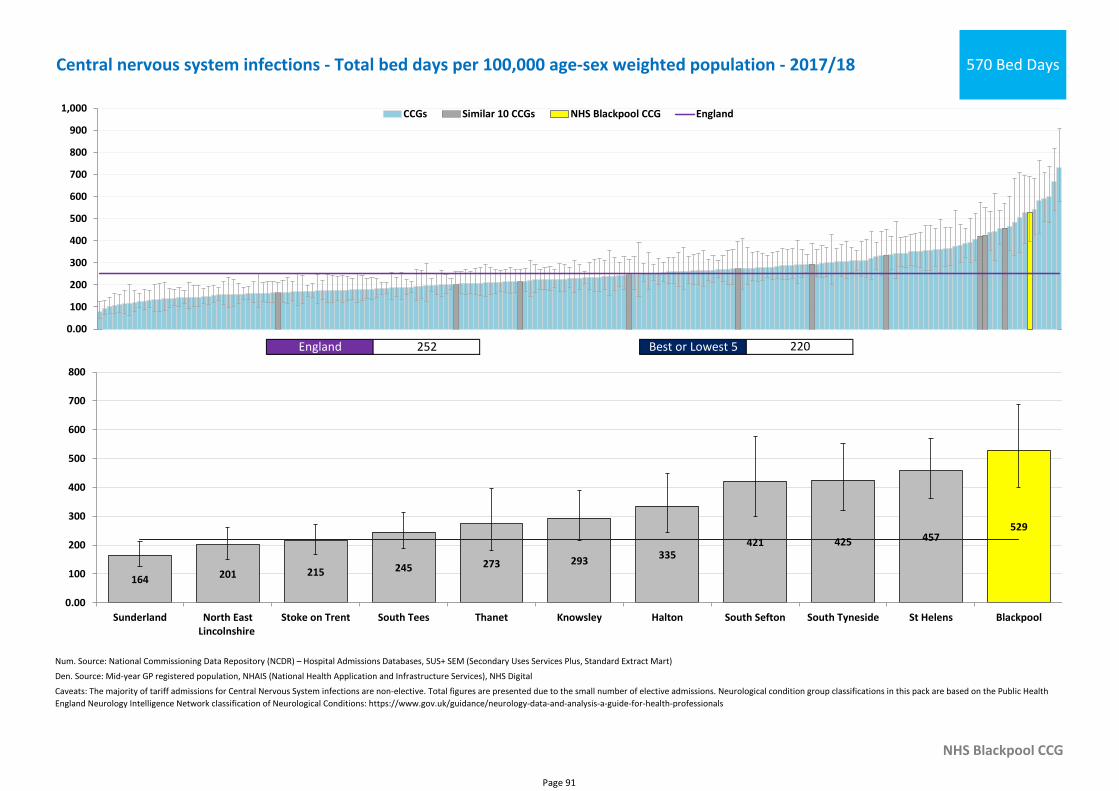
Num. Source: National Commissioning Data Repository (NCDR) – Hospital Admissions Databases, SUS+ SEM (Secondary Uses Services Plus, Standard Extract Mart)
Den. Source: Mid-year GP registered population, NHAIS (National Health Application and Infrastructure Services), NHS Digital
NHS Blackpool CCG
Caveats: The majority of tariff admissions for Central Nervous System infections are non-elective. Total figures are presented due to the small number of elective admissions. Neurological condition group classifications in this pack are based on the Public Health
England Neurology Intelligence Network classification of Neurological Conditions: https://www.gov.uk/guidance/neurology-data-and-analysis-a-guide-for-health-professionals
Central nervous system infections - Total bed days per 100,000 age-sex weighted population - 2017/18 570 Bed Days
England 252 Best or Lowest 5 220
0.00
100
200
300
400
500
600
700
800
900
1,000 CCGs Similar 10 CCGs NHS Blackpool CCG England
529
164 201 215 245 273 293335
421 425 457
0.00
100
200
300
400
500
600
700
800
Sunderland North EastLincolnshire
Stoke on Trent South Tees Thanet Knowsley Halton South Sefton South Tyneside St Helens Blackpool
Page 91
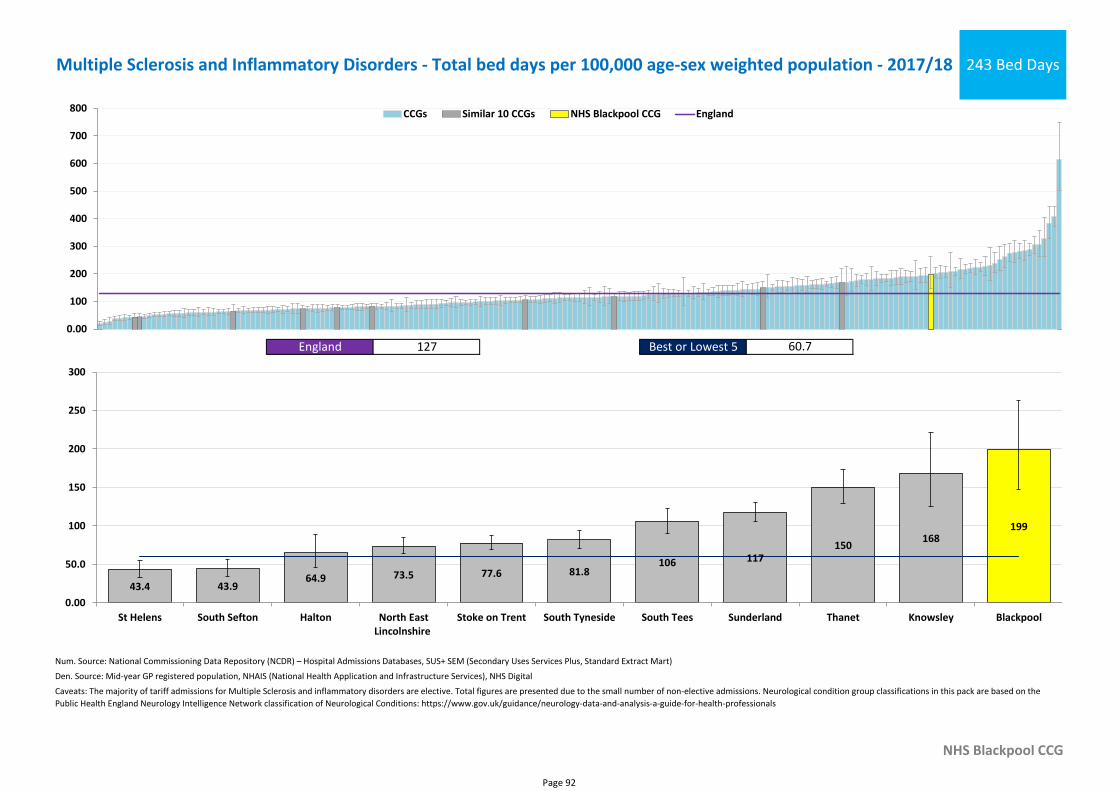
Num. Source: National Commissioning Data Repository (NCDR) – Hospital Admissions Databases, SUS+ SEM (Secondary Uses Services Plus, Standard Extract Mart)
Den. Source: Mid-year GP registered population, NHAIS (National Health Application and Infrastructure Services), NHS Digital
NHS Blackpool CCG
Caveats: The majority of tariff admissions for Multiple Sclerosis and inflammatory disorders are elective. Total figures are presented due to the small number of non-elective admissions. Neurological condition group classifications in this pack are based on the
Public Health England Neurology Intelligence Network classification of Neurological Conditions: https://www.gov.uk/guidance/neurology-data-and-analysis-a-guide-for-health-professionals
Multiple Sclerosis and Inflammatory Disorders - Total bed days per 100,000 age-sex weighted population - 2017/18 243 Bed Days
England 127 Best or Lowest 5 60.7
0.00
100
200
300
400
500
600
700
800 CCGs Similar 10 CCGs NHS Blackpool CCG England
199
43.4 43.964.9 73.5 77.6 81.8
106 117150
168
0.00
50.0
100
150
200
250
300
St Helens South Sefton Halton North EastLincolnshire
Stoke on Trent South Tyneside South Tees Sunderland Thanet Knowsley Blackpool
Page 92
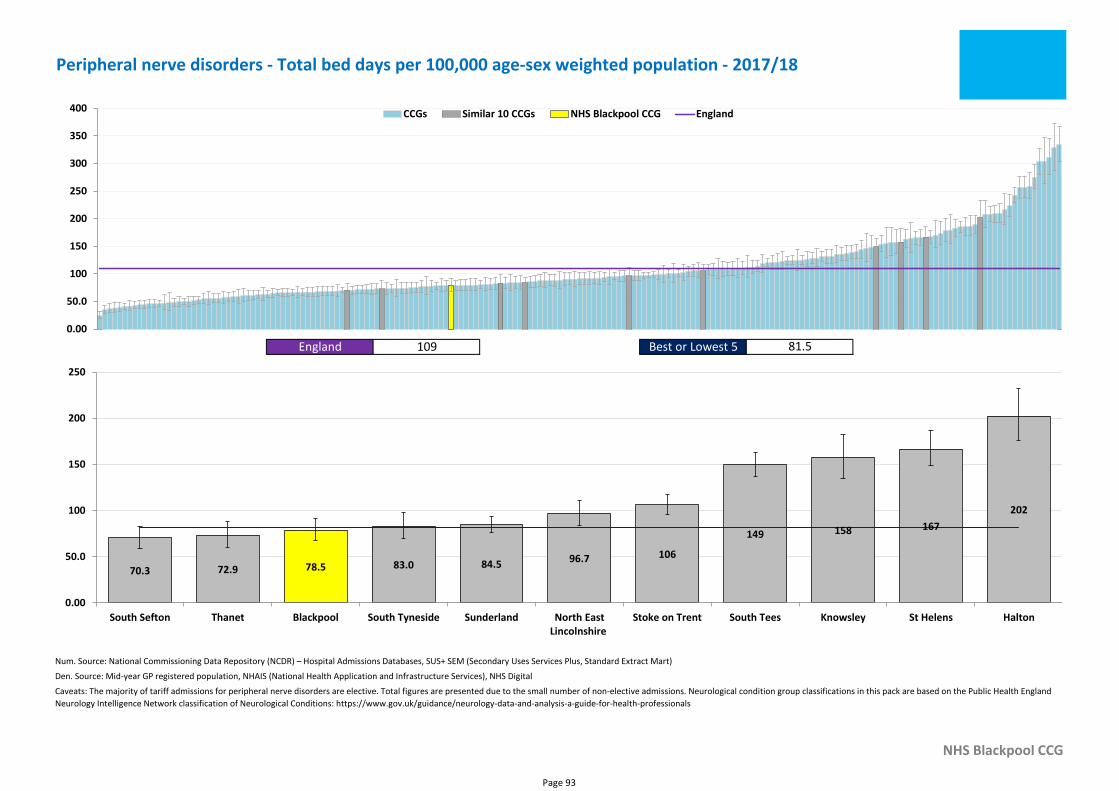
Num. Source: National Commissioning Data Repository (NCDR) – Hospital Admissions Databases, SUS+ SEM (Secondary Uses Services Plus, Standard Extract Mart)
Den. Source: Mid-year GP registered population, NHAIS (National Health Application and Infrastructure Services), NHS Digital
NHS Blackpool CCG
Caveats: The majority of tariff admissions for peripheral nerve disorders are elective. Total figures are presented due to the small number of non-elective admissions. Neurological condition group classifications in this pack are based on the Public Health England
Neurology Intelligence Network classification of Neurological Conditions: https://www.gov.uk/guidance/neurology-data-and-analysis-a-guide-for-health-professionals
Peripheral nerve disorders - Total bed days per 100,000 age-sex weighted population - 2017/18
England 109 Best or Lowest 5 81.5
0.00
50.0
100
150
200
250
300
350
400 CCGs Similar 10 CCGs NHS Blackpool CCG England
78.570.3 72.9 83.0 84.5 96.7 106
149 158 167
202
0.00
50.0
100
150
200
250
South Sefton Thanet Blackpool South Tyneside Sunderland North EastLincolnshire
Stoke on Trent South Tees Knowsley St Helens Halton
Page 93
Section 4c - Secondary Care
• Outpatients
Page 94
SUS+ Outpatient Treatment Function Codes (TFC) CCG Activity
The following slides show SUS+ CCG outpatient activity for the Outpatient Treatment Function Codes (TFC) of most relevance to this Programme Budgeting Category. Only those TFCs classed as ‘specific acute’ have been included, and only where there is sufficient activity nationally.
Indirectly age-sex standardised rates of attended outpatient appointments for that TFC are shown – this includes both attended new (first) and follow-up appointments. Potential opportunities are provided by comparing each CCG’s rate to the average activity rates of its lowest 5 similar CCGs. It should be noted that local interpretation is required to determine whether higher or lower rates of Outpatient appointments TFC for primary care prescribing and elective inpatient admissions are appropriate.
There is likely to be significant variation nationally in how attended appointments are allocated to TFCs, particularly to the General Surgery and General Medicine TFCs. These TFCs are included in the RightCare Where to Look pack as they do not align with a specific programme.
Also included are the percentage of new outpatient attendances out of all outpatient attendances. These indicators are given to provide further context to the overall rate of appointments indicator, and for CCGs to see on average how many follow-up appointments a patient has. Variation in this measure is likely due to the mix of patients, the treatment method chosen and provider processes. However, given the amount of variation nationally, it is likely that provider processes are the key driver.
Page 95
SUS+ Outpatient Treatment Function Codes (TFC) CCG Activity
For CCGs with higher percentages of new attended appointments (and therefore on average their patients having had relatively fewer follow-up appointments) they may find that their patients have had a poorer experience of care and may be more likely to be re-referred. It may also be an indication of over-referral from primary care, or prioritisation of new patient appointments in the outpatient setting. For CCGs with lower percentages of new appointments (and therefore on average their patients having had relatively more follow-up appointments) they may find that their capacity for seeing new patients is limited and may want to analyse their referral to treatment and waiting times data. It may also indicate under-referral from primary care.1
NHS RightCare encourages systems to use outpatient data to identify potential opportunities to reduce burden of referrals to secondary care services where appropriate. Working with Trusts and primary care, systems should work collectively to understand the drivers for their outpatient appointment rates in specific clinical specialties, and to ensure that local referral processes are appropriate and being adhered to. The NHS Operational Planning and Contracting guidance for 2019/202 states that systems should increase the focus on the development of primary care service to further reduce referrals to secondary care and secondary care follow-ups.
Spend indicators using SUS+ data for outpatients have not been presented; please refer to the Programme Budgeting indicator section for outpatient spend indicators for this programme.
These indicators are a new addition to the RightCare packs and any feedback to [email protected] would be welcome.
1 GIRFT Programme Urology National Specialty Report, July 2018 https://gettingitrightfirsttime.co.uk/wp-content/uploads/2018/07/GIRFT-Urology.pdf
2 https://www.england.nhs.uk/publication/preparing-for-2019-20-operational-planning-and-contracting/
Page 96
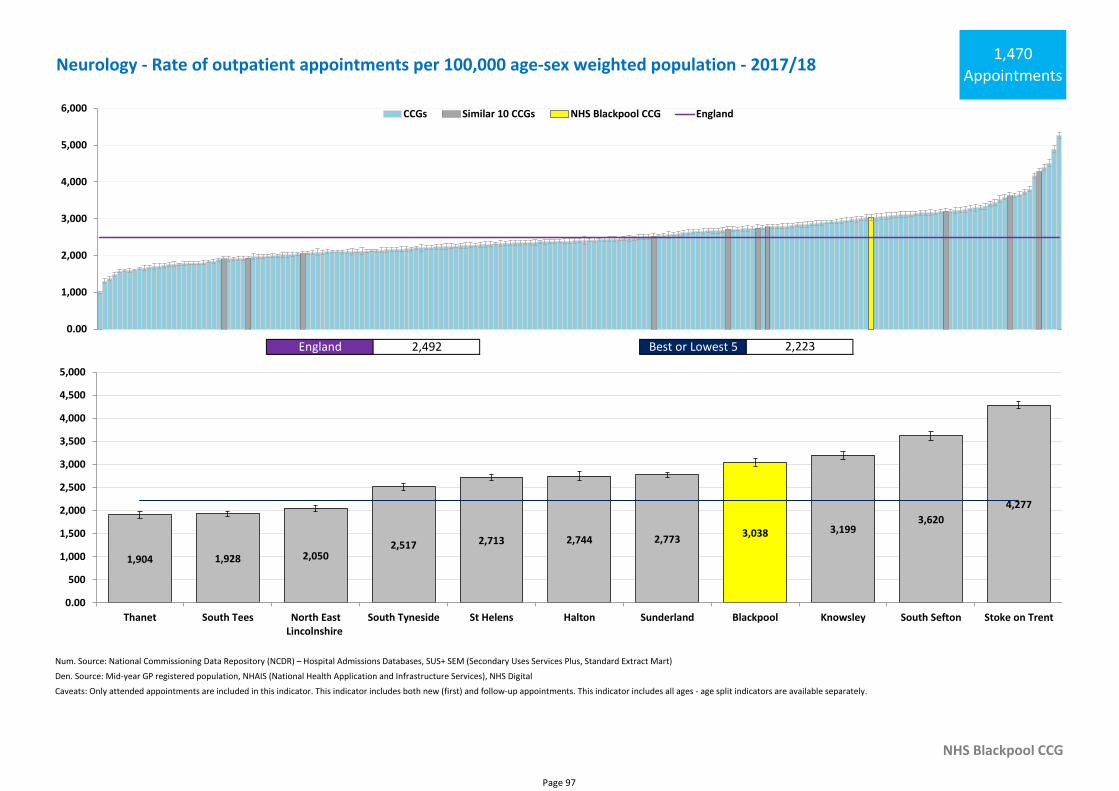
Num. Source: National Commissioning Data Repository (NCDR) – Hospital Admissions Databases, SUS+ SEM (Secondary Uses Services Plus, Standard Extract Mart)
Den. Source: Mid-year GP registered population, NHAIS (National Health Application and Infrastructure Services), NHS Digital
NHS Blackpool CCG
Caveats: Only attended appointments are included in this indicator. This indicator includes both new (first) and follow-up appointments. This indicator includes all ages - age split indicators are available separately.
Neurology - Rate of outpatient appointments per 100,000 age-sex weighted population - 2017/181,470
Appointments
England 2,492 Best or Lowest 5 2,223
0.00
1,000
2,000
3,000
4,000
5,000
6,000 CCGs Similar 10 CCGs NHS Blackpool CCG England
3,038
1,904 1,928 2,0502,517 2,713 2,744 2,773
3,1993,620
4,277
0.00
500
1,000
1,500
2,000
2,500
3,000
3,500
4,000
4,500
5,000
Thanet South Tees North EastLincolnshire
South Tyneside St Helens Halton Sunderland Blackpool Knowsley South Sefton Stoke on Trent
Page 97
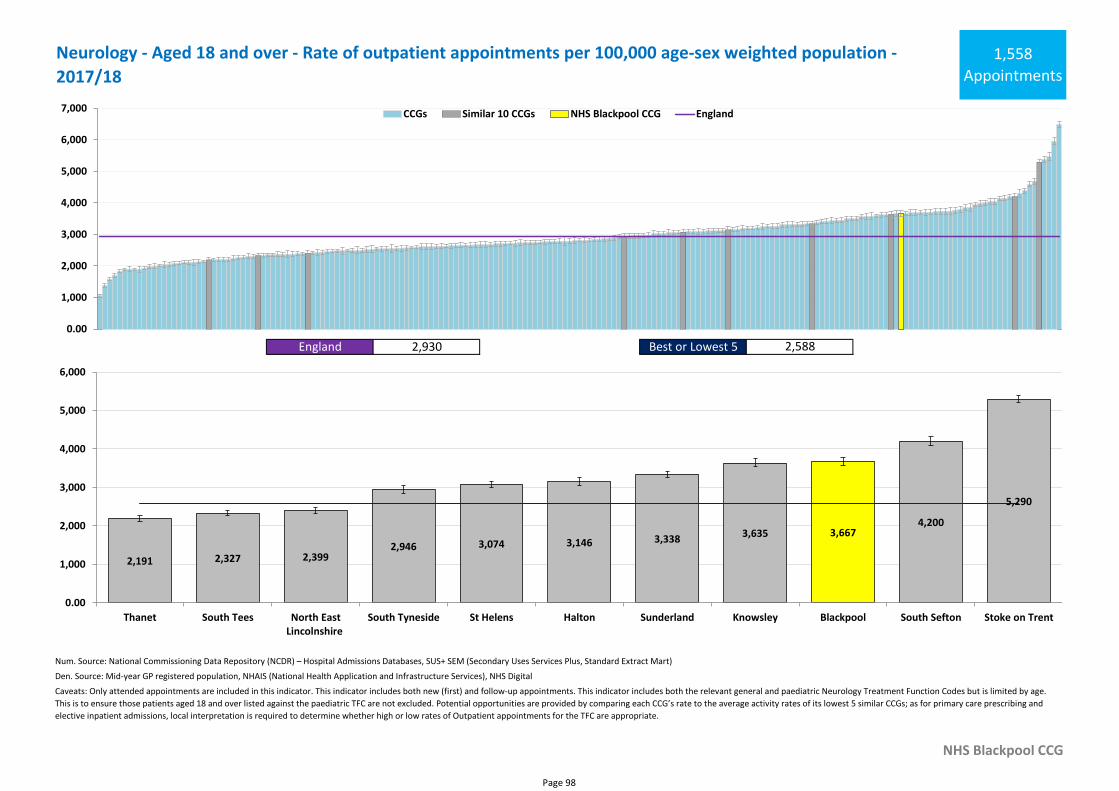
Num. Source: National Commissioning Data Repository (NCDR) – Hospital Admissions Databases, SUS+ SEM (Secondary Uses Services Plus, Standard Extract Mart)
Den. Source: Mid-year GP registered population, NHAIS (National Health Application and Infrastructure Services), NHS Digital
NHS Blackpool CCG
Caveats: Only attended appointments are included in this indicator. This indicator includes both new (first) and follow-up appointments. This indicator includes both the relevant general and paediatric Neurology Treatment Function Codes but is limited by age.
This is to ensure those patients aged 18 and over listed against the paediatric TFC are not excluded. Potential opportunities are provided by comparing each CCG’s rate to the average activity rates of its lowest 5 similar CCGs; as for primary care prescribing and
elective inpatient admissions, local interpretation is required to determine whether high or low rates of Outpatient appointments for the TFC are appropriate.
Neurology - Aged 18 and over - Rate of outpatient appointments per 100,000 age-sex weighted population -
2017/181,558
Appointments
England 2,930 Best or Lowest 5 2,588
0.00
1,000
2,000
3,000
4,000
5,000
6,000
7,000 CCGs Similar 10 CCGs NHS Blackpool CCG England
3,667
2,191 2,327 2,3992,946 3,074 3,146 3,338
3,6354,200
5,290
0.00
1,000
2,000
3,000
4,000
5,000
6,000
Thanet South Tees North EastLincolnshire
South Tyneside St Helens Halton Sunderland Knowsley Blackpool South Sefton Stoke on Trent
Page 98
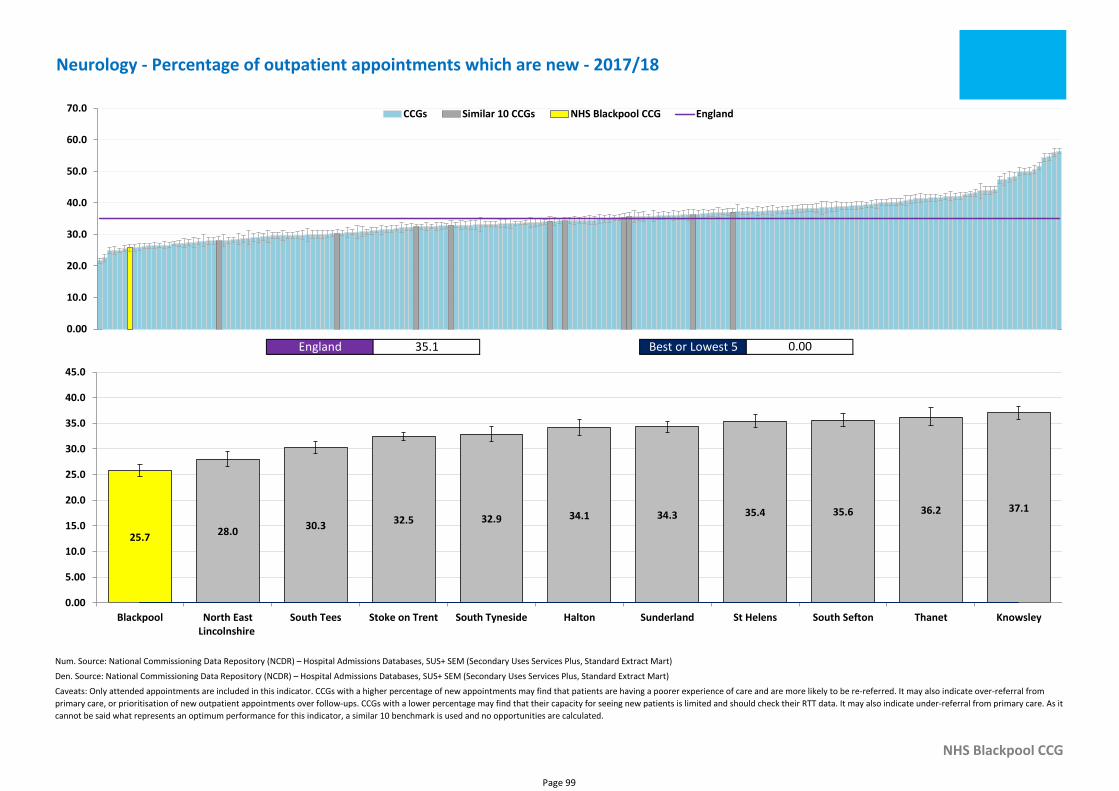
Num. Source: National Commissioning Data Repository (NCDR) – Hospital Admissions Databases, SUS+ SEM (Secondary Uses Services Plus, Standard Extract Mart)
Den. Source: National Commissioning Data Repository (NCDR) – Hospital Admissions Databases, SUS+ SEM (Secondary Uses Services Plus, Standard Extract Mart)
NHS Blackpool CCG
Caveats: Only attended appointments are included in this indicator. CCGs with a higher percentage of new appointments may find that patients are having a poorer experience of care and are more likely to be re-referred. It may also indicate over-referral from
primary care, or prioritisation of new outpatient appointments over follow-ups. CCGs with a lower percentage may find that their capacity for seeing new patients is limited and should check their RTT data. It may also indicate under-referral from primary care. As it
cannot be said what represents an optimum performance for this indicator, a similar 10 benchmark is used and no opportunities are calculated.
Neurology - Percentage of outpatient appointments which are new - 2017/18
England 35.1 Best or Lowest 5 0.00
0.00
10.0
20.0
30.0
40.0
50.0
60.0
70.0 CCGs Similar 10 CCGs NHS Blackpool CCG England
25.728.0
30.3 32.5 32.9 34.1 34.3 35.4 35.6 36.2 37.1
0.00
5.00
10.0
15.0
20.0
25.0
30.0
35.0
40.0
45.0
Blackpool North EastLincolnshire
South Tees Stoke on Trent South Tyneside Halton Sunderland St Helens South Sefton Thanet Knowsley
Page 99
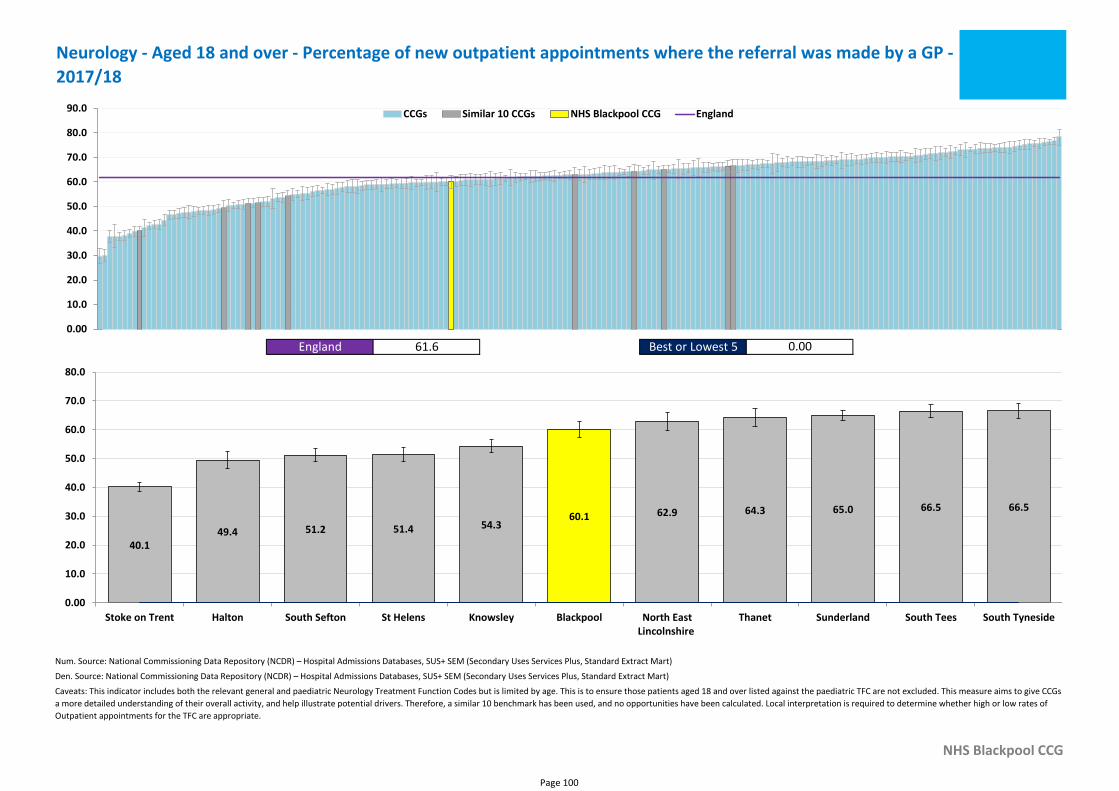
Num. Source: National Commissioning Data Repository (NCDR) – Hospital Admissions Databases, SUS+ SEM (Secondary Uses Services Plus, Standard Extract Mart)
Den. Source: National Commissioning Data Repository (NCDR) – Hospital Admissions Databases, SUS+ SEM (Secondary Uses Services Plus, Standard Extract Mart)
NHS Blackpool CCG
Caveats: This indicator includes both the relevant general and paediatric Neurology Treatment Function Codes but is limited by age. This is to ensure those patients aged 18 and over listed against the paediatric TFC are not excluded. This measure aims to give CCGs
a more detailed understanding of their overall activity, and help illustrate potential drivers. Therefore, a similar 10 benchmark has been used, and no opportunities have been calculated. Local interpretation is required to determine whether high or low rates of
Outpatient appointments for the TFC are appropriate.
Neurology - Aged 18 and over - Percentage of new outpatient appointments where the referral was made by a GP -
2017/18
England 61.6 Best or Lowest 5 0.00
0.00
10.0
20.0
30.0
40.0
50.0
60.0
70.0
80.0
90.0 CCGs Similar 10 CCGs NHS Blackpool CCG England
60.1
40.149.4 51.2 51.4 54.3
62.9 64.3 65.0 66.5 66.5
0.00
10.0
20.0
30.0
40.0
50.0
60.0
70.0
80.0
Stoke on Trent Halton South Sefton St Helens Knowsley Blackpool North EastLincolnshire
Thanet Sunderland South Tees South Tyneside
Page 100
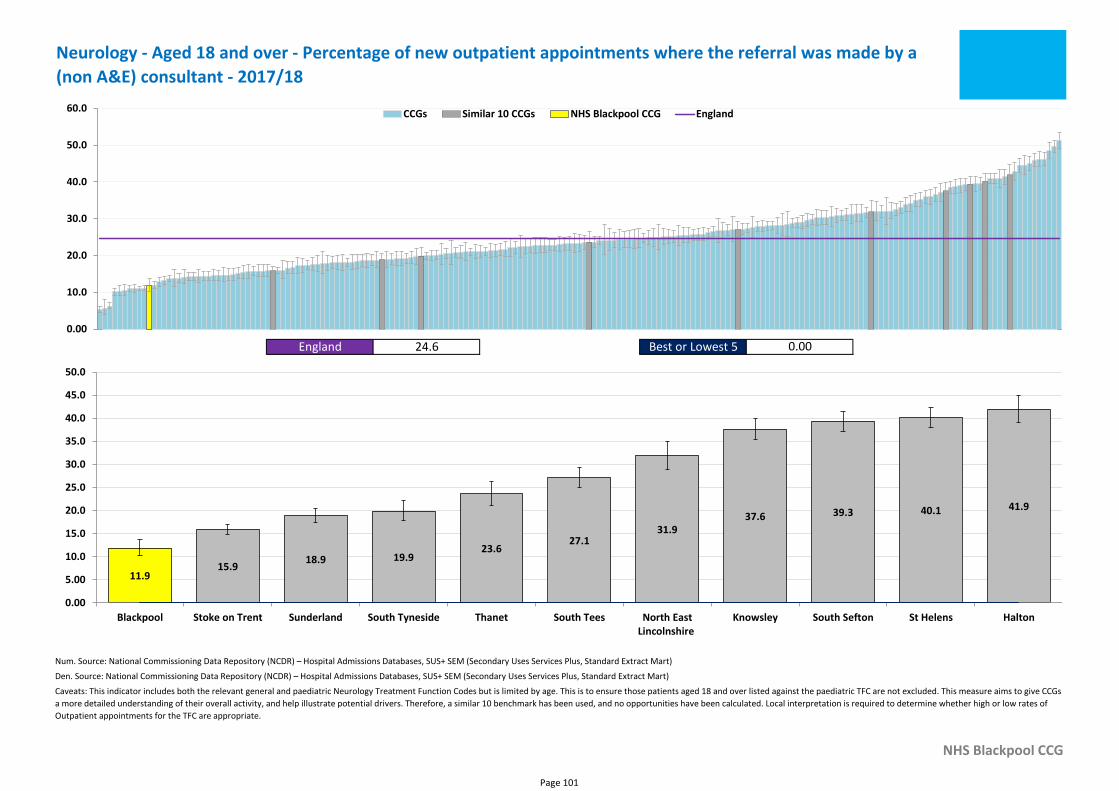
Num. Source: National Commissioning Data Repository (NCDR) – Hospital Admissions Databases, SUS+ SEM (Secondary Uses Services Plus, Standard Extract Mart)
Den. Source: National Commissioning Data Repository (NCDR) – Hospital Admissions Databases, SUS+ SEM (Secondary Uses Services Plus, Standard Extract Mart)
NHS Blackpool CCG
Caveats: This indicator includes both the relevant general and paediatric Neurology Treatment Function Codes but is limited by age. This is to ensure those patients aged 18 and over listed against the paediatric TFC are not excluded. This measure aims to give CCGs
a more detailed understanding of their overall activity, and help illustrate potential drivers. Therefore, a similar 10 benchmark has been used, and no opportunities have been calculated. Local interpretation is required to determine whether high or low rates of
Outpatient appointments for the TFC are appropriate.
Neurology - Aged 18 and over - Percentage of new outpatient appointments where the referral was made by a
(non A&E) consultant - 2017/18
England 24.6 Best or Lowest 5 0.00
0.00
10.0
20.0
30.0
40.0
50.0
60.0 CCGs Similar 10 CCGs NHS Blackpool CCG England
11.915.9
18.9 19.923.6
27.131.9
37.6 39.3 40.1 41.9
0.00
5.00
10.0
15.0
20.0
25.0
30.0
35.0
40.0
45.0
50.0
Blackpool Stoke on Trent Sunderland South Tyneside Thanet South Tees North EastLincolnshire
Knowsley South Sefton St Helens Halton
Page 101
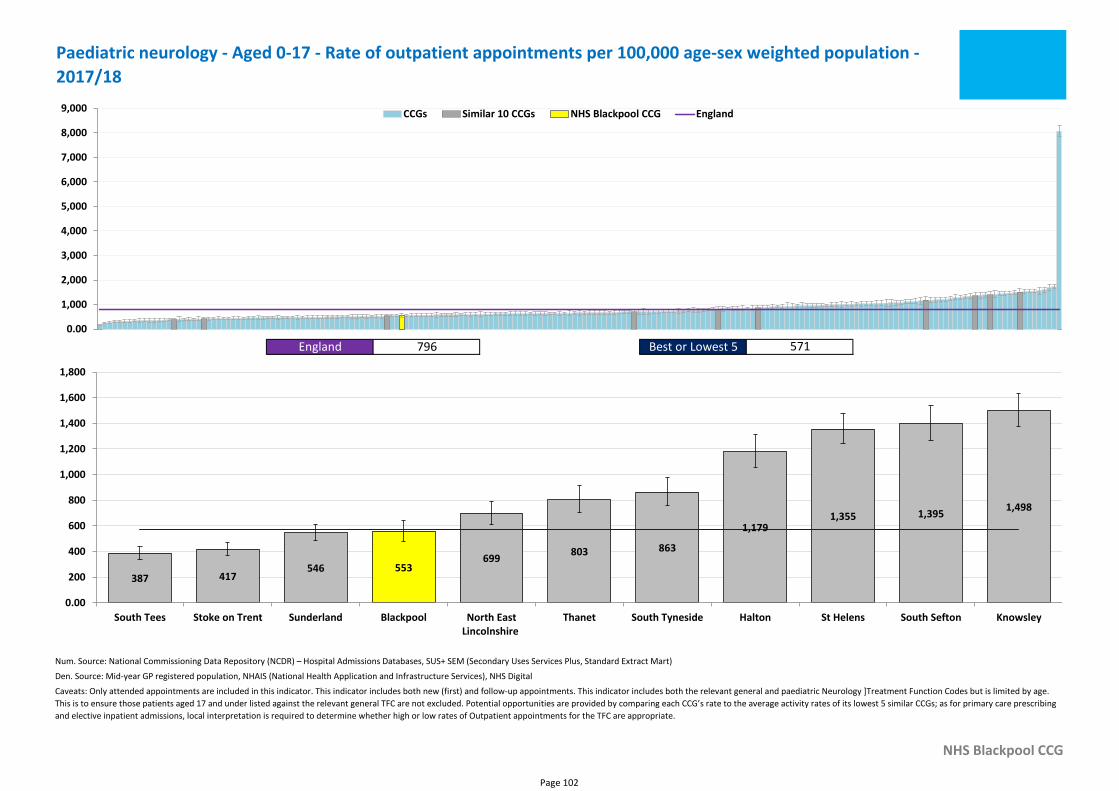
Num. Source: National Commissioning Data Repository (NCDR) – Hospital Admissions Databases, SUS+ SEM (Secondary Uses Services Plus, Standard Extract Mart)
Den. Source: Mid-year GP registered population, NHAIS (National Health Application and Infrastructure Services), NHS Digital
NHS Blackpool CCG
Caveats: Only attended appointments are included in this indicator. This indicator includes both new (first) and follow-up appointments. This indicator includes both the relevant general and paediatric Neurology ]Treatment Function Codes but is limited by age.
This is to ensure those patients aged 17 and under listed against the relevant general TFC are not excluded. Potential opportunities are provided by comparing each CCG’s rate to the average activity rates of its lowest 5 similar CCGs; as for primary care prescribing
and elective inpatient admissions, local interpretation is required to determine whether high or low rates of Outpatient appointments for the TFC are appropriate.
Paediatric neurology - Aged 0-17 - Rate of outpatient appointments per 100,000 age-sex weighted population -
2017/18
England 796 Best or Lowest 5 571
0.00
1,000
2,000
3,000
4,000
5,000
6,000
7,000
8,000
9,000 CCGs Similar 10 CCGs NHS Blackpool CCG England
553387 417
546699
803 863
1,1791,355 1,395
1,498
0.00
200
400
600
800
1,000
1,200
1,400
1,600
1,800
South Tees Stoke on Trent Sunderland Blackpool North EastLincolnshire
Thanet South Tyneside Halton St Helens South Sefton Knowsley
Page 102
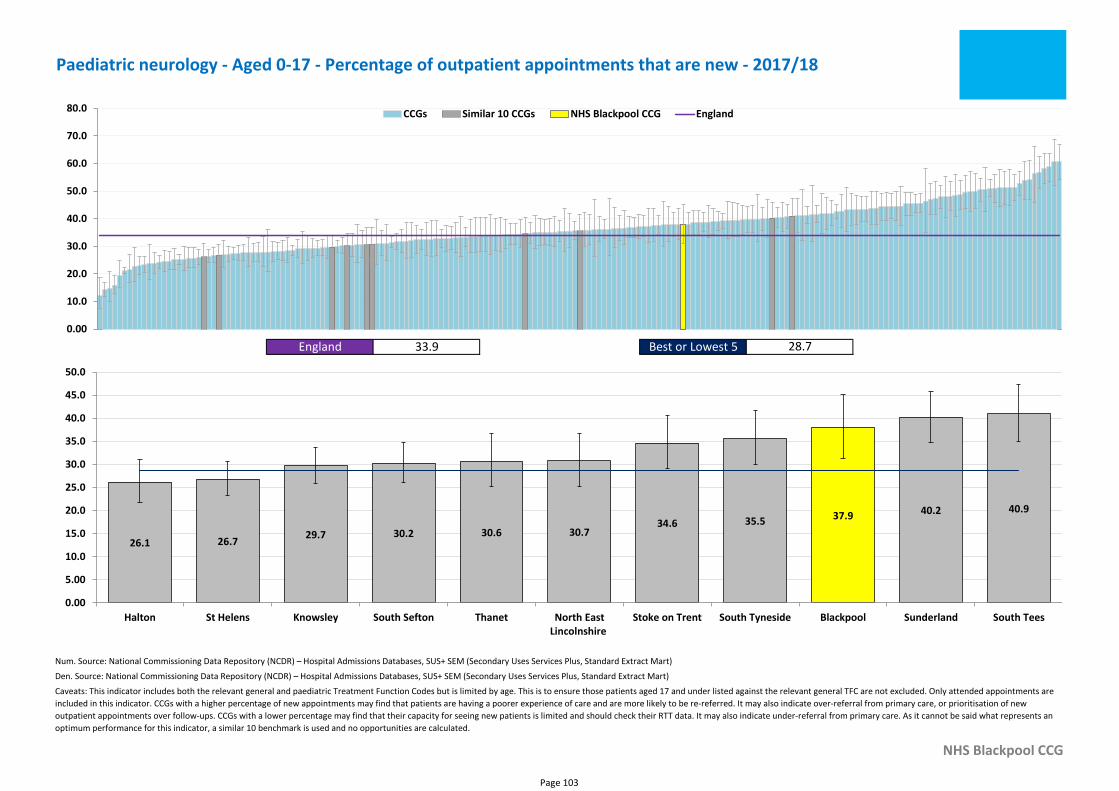
Num. Source: National Commissioning Data Repository (NCDR) – Hospital Admissions Databases, SUS+ SEM (Secondary Uses Services Plus, Standard Extract Mart)
Den. Source: National Commissioning Data Repository (NCDR) – Hospital Admissions Databases, SUS+ SEM (Secondary Uses Services Plus, Standard Extract Mart)
NHS Blackpool CCG
Caveats: This indicator includes both the relevant general and paediatric Treatment Function Codes but is limited by age. This is to ensure those patients aged 17 and under listed against the relevant general TFC are not excluded. Only attended appointments are
included in this indicator. CCGs with a higher percentage of new appointments may find that patients are having a poorer experience of care and are more likely to be re-referred. It may also indicate over-referral from primary care, or prioritisation of new
outpatient appointments over follow-ups. CCGs with a lower percentage may find that their capacity for seeing new patients is limited and should check their RTT data. It may also indicate under-referral from primary care. As it cannot be said what represents an
optimum performance for this indicator, a similar 10 benchmark is used and no opportunities are calculated.
Paediatric neurology - Aged 0-17 - Percentage of outpatient appointments that are new - 2017/18
England 33.9 Best or Lowest 5 28.7
0.00
10.0
20.0
30.0
40.0
50.0
60.0
70.0
80.0 CCGs Similar 10 CCGs NHS Blackpool CCG England
37.9
26.1 26.729.7 30.2 30.6 30.7
34.6 35.540.2 40.9
0.00
5.00
10.0
15.0
20.0
25.0
30.0
35.0
40.0
45.0
50.0
Halton St Helens Knowsley South Sefton Thanet North EastLincolnshire
Stoke on Trent South Tyneside Blackpool Sunderland South Tees
Page 103
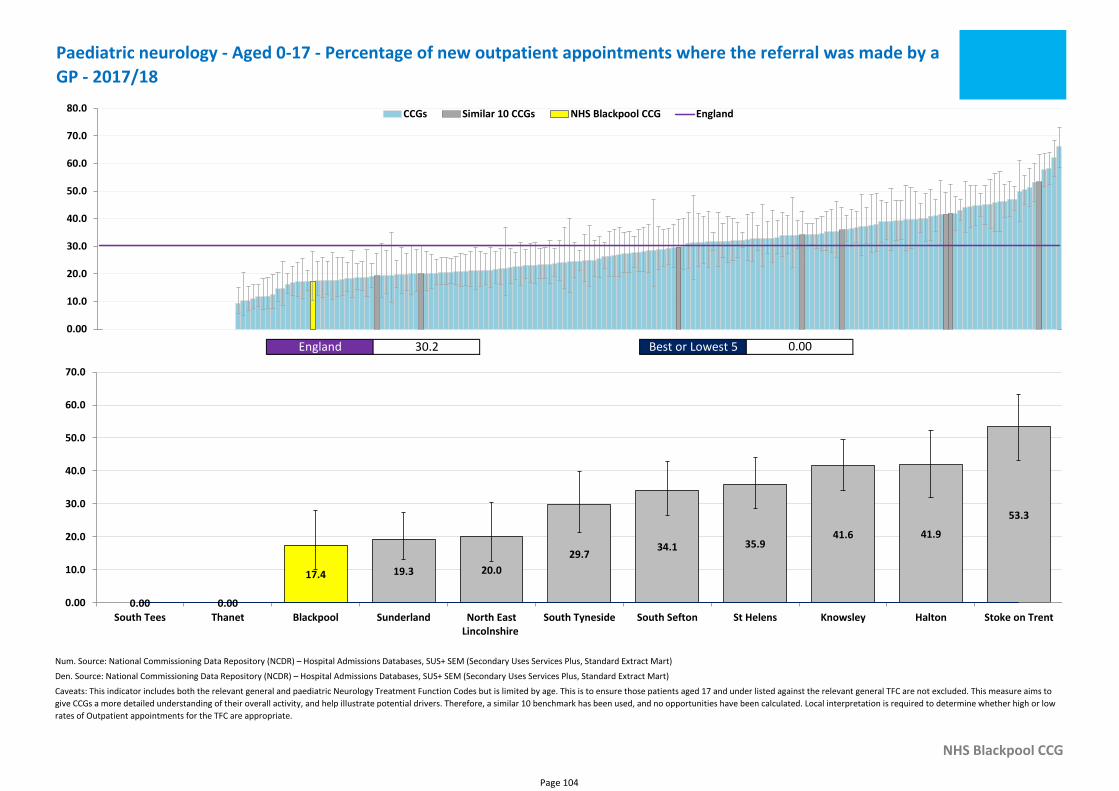
Num. Source: National Commissioning Data Repository (NCDR) – Hospital Admissions Databases, SUS+ SEM (Secondary Uses Services Plus, Standard Extract Mart)
Den. Source: National Commissioning Data Repository (NCDR) – Hospital Admissions Databases, SUS+ SEM (Secondary Uses Services Plus, Standard Extract Mart)
NHS Blackpool CCG
Caveats: This indicator includes both the relevant general and paediatric Neurology Treatment Function Codes but is limited by age. This is to ensure those patients aged 17 and under listed against the relevant general TFC are not excluded. This measure aims to
give CCGs a more detailed understanding of their overall activity, and help illustrate potential drivers. Therefore, a similar 10 benchmark has been used, and no opportunities have been calculated. Local interpretation is required to determine whether high or low
rates of Outpatient appointments for the TFC are appropriate.
Paediatric neurology - Aged 0-17 - Percentage of new outpatient appointments where the referral was made by a
GP - 2017/18
England 30.2 Best or Lowest 5 0.00
0.00
10.0
20.0
30.0
40.0
50.0
60.0
70.0
80.0 CCGs Similar 10 CCGs NHS Blackpool CCG England
17.4
0.00 0.00
19.3 20.0
29.734.1 35.9
41.6 41.9
53.3
0.00
10.0
20.0
30.0
40.0
50.0
60.0
70.0
South Tees Thanet Blackpool Sunderland North EastLincolnshire
South Tyneside South Sefton St Helens Knowsley Halton Stoke on Trent
Page 104
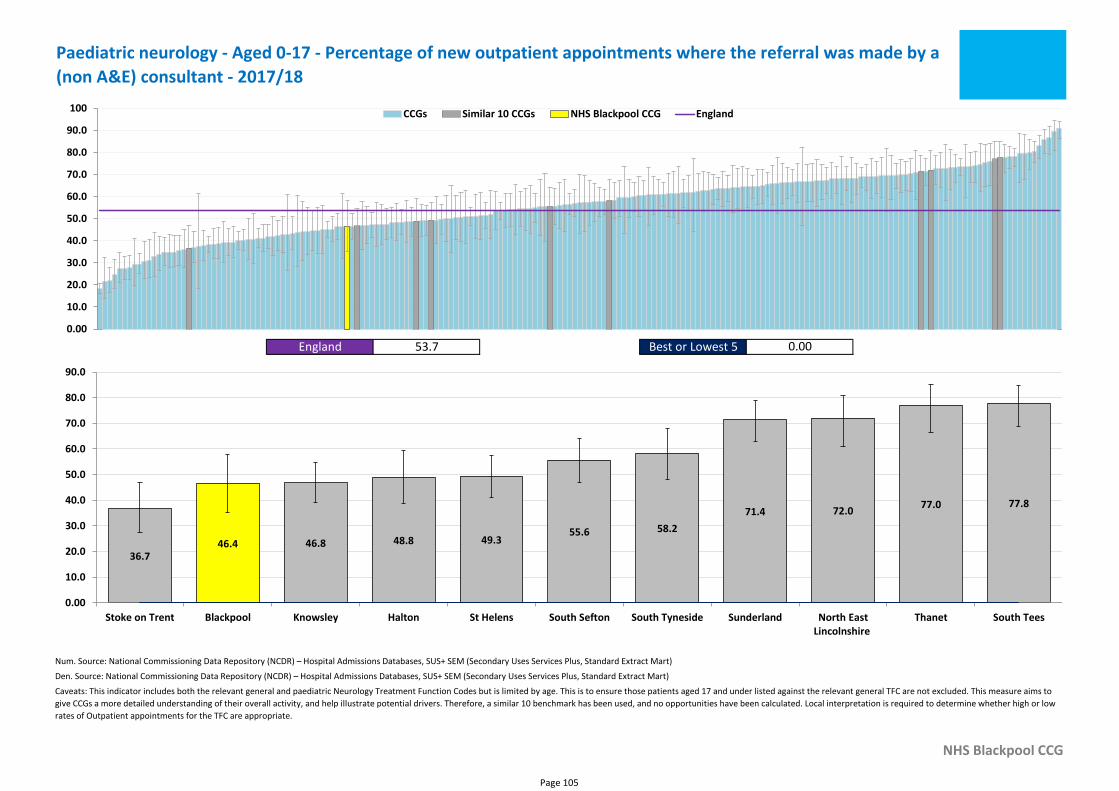
Num. Source: National Commissioning Data Repository (NCDR) – Hospital Admissions Databases, SUS+ SEM (Secondary Uses Services Plus, Standard Extract Mart)
Den. Source: National Commissioning Data Repository (NCDR) – Hospital Admissions Databases, SUS+ SEM (Secondary Uses Services Plus, Standard Extract Mart)
NHS Blackpool CCG
Caveats: This indicator includes both the relevant general and paediatric Neurology Treatment Function Codes but is limited by age. This is to ensure those patients aged 17 and under listed against the relevant general TFC are not excluded. This measure aims to
give CCGs a more detailed understanding of their overall activity, and help illustrate potential drivers. Therefore, a similar 10 benchmark has been used, and no opportunities have been calculated. Local interpretation is required to determine whether high or low
rates of Outpatient appointments for the TFC are appropriate.
Paediatric neurology - Aged 0-17 - Percentage of new outpatient appointments where the referral was made by a
(non A&E) consultant - 2017/18
England 53.7 Best or Lowest 5 0.00
0.00
10.0
20.0
30.0
40.0
50.0
60.0
70.0
80.0
90.0
100 CCGs Similar 10 CCGs NHS Blackpool CCG England
46.436.7
46.8 48.8 49.355.6 58.2
71.4 72.077.0 77.8
0.00
10.0
20.0
30.0
40.0
50.0
60.0
70.0
80.0
90.0
Stoke on Trent Blackpool Knowsley Halton St Helens South Sefton South Tyneside Sunderland North EastLincolnshire
Thanet South Tees
Page 105
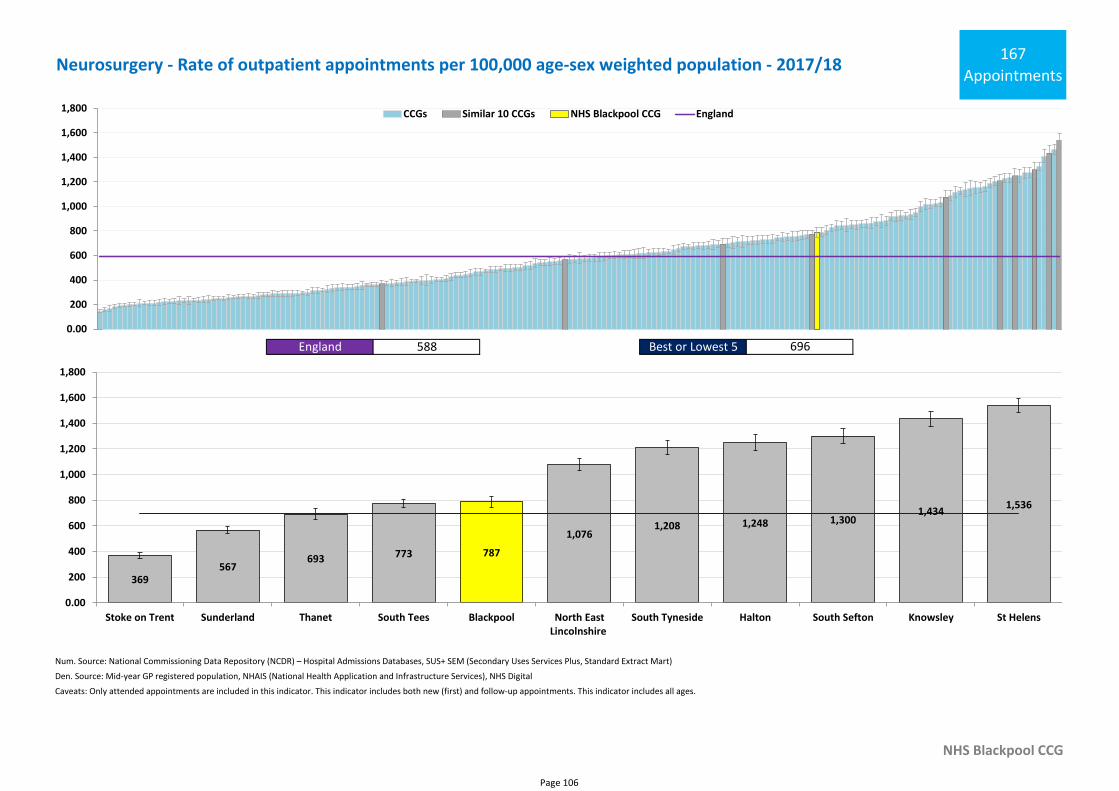
Num. Source: National Commissioning Data Repository (NCDR) – Hospital Admissions Databases, SUS+ SEM (Secondary Uses Services Plus, Standard Extract Mart)
Den. Source: Mid-year GP registered population, NHAIS (National Health Application and Infrastructure Services), NHS Digital
NHS Blackpool CCG
Caveats: Only attended appointments are included in this indicator. This indicator includes both new (first) and follow-up appointments. This indicator includes all ages.
Neurosurgery - Rate of outpatient appointments per 100,000 age-sex weighted population - 2017/18167
Appointments
England 588 Best or Lowest 5 696
0.00
200
400
600
800
1,000
1,200
1,400
1,600
1,800 CCGs Similar 10 CCGs NHS Blackpool CCG England
787
369567
693 773
1,0761,208 1,248 1,300
1,4341,536
0.00
200
400
600
800
1,000
1,200
1,400
1,600
1,800
Stoke on Trent Sunderland Thanet South Tees Blackpool North EastLincolnshire
South Tyneside Halton South Sefton Knowsley St Helens
Page 106
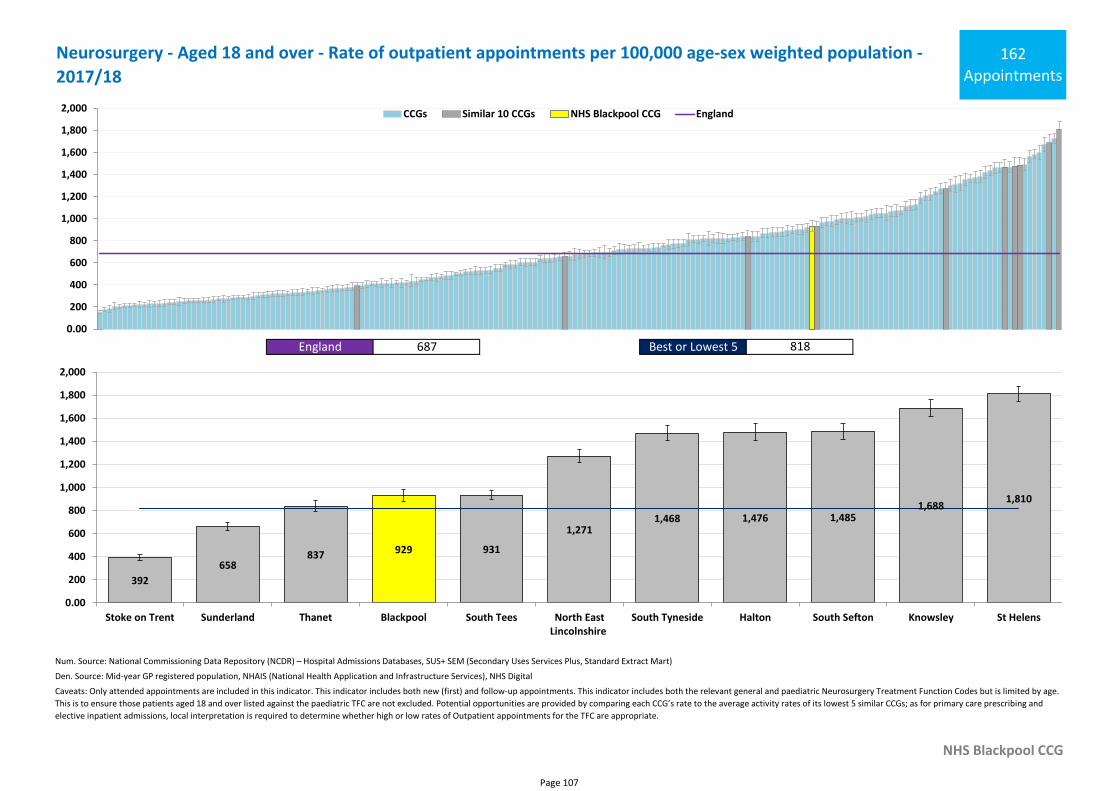
Num. Source: National Commissioning Data Repository (NCDR) – Hospital Admissions Databases, SUS+ SEM (Secondary Uses Services Plus, Standard Extract Mart)
Den. Source: Mid-year GP registered population, NHAIS (National Health Application and Infrastructure Services), NHS Digital
NHS Blackpool CCG
Caveats: Only attended appointments are included in this indicator. This indicator includes both new (first) and follow-up appointments. This indicator includes both the relevant general and paediatric Neurosurgery Treatment Function Codes but is limited by age.
This is to ensure those patients aged 18 and over listed against the paediatric TFC are not excluded. Potential opportunities are provided by comparing each CCG’s rate to the average activity rates of its lowest 5 similar CCGs; as for primary care prescribing and
elective inpatient admissions, local interpretation is required to determine whether high or low rates of Outpatient appointments for the TFC are appropriate.
Neurosurgery - Aged 18 and over - Rate of outpatient appointments per 100,000 age-sex weighted population -
2017/18162
Appointments
England 687 Best or Lowest 5 818
0.00
200
400
600
800
1,000
1,200
1,400
1,600
1,800
2,000 CCGs Similar 10 CCGs NHS Blackpool CCG England
929
392
658837 931
1,2711,468 1,476 1,485
1,6881,810
0.00
200
400
600
800
1,000
1,200
1,400
1,600
1,800
2,000
Stoke on Trent Sunderland Thanet Blackpool South Tees North EastLincolnshire
South Tyneside Halton South Sefton Knowsley St Helens
Page 107
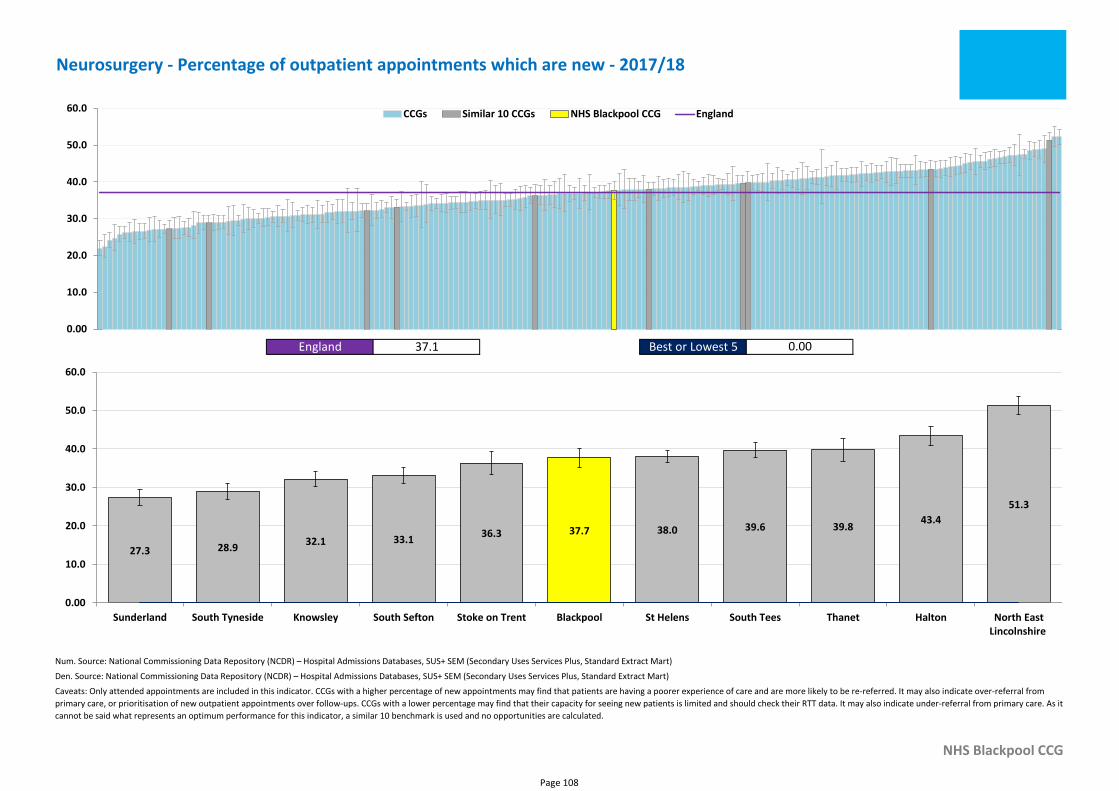
Num. Source: National Commissioning Data Repository (NCDR) – Hospital Admissions Databases, SUS+ SEM (Secondary Uses Services Plus, Standard Extract Mart)
Den. Source: National Commissioning Data Repository (NCDR) – Hospital Admissions Databases, SUS+ SEM (Secondary Uses Services Plus, Standard Extract Mart)
NHS Blackpool CCG
Caveats: Only attended appointments are included in this indicator. CCGs with a higher percentage of new appointments may find that patients are having a poorer experience of care and are more likely to be re-referred. It may also indicate over-referral from
primary care, or prioritisation of new outpatient appointments over follow-ups. CCGs with a lower percentage may find that their capacity for seeing new patients is limited and should check their RTT data. It may also indicate under-referral from primary care. As it
cannot be said what represents an optimum performance for this indicator, a similar 10 benchmark is used and no opportunities are calculated.
Neurosurgery - Percentage of outpatient appointments which are new - 2017/18
England 37.1 Best or Lowest 5 0.00
0.00
10.0
20.0
30.0
40.0
50.0
60.0 CCGs Similar 10 CCGs NHS Blackpool CCG England
37.7
27.3 28.932.1 33.1
36.3 38.0 39.6 39.843.4
51.3
0.00
10.0
20.0
30.0
40.0
50.0
60.0
Sunderland South Tyneside Knowsley South Sefton Stoke on Trent Blackpool St Helens South Tees Thanet Halton North EastLincolnshire
Page 108
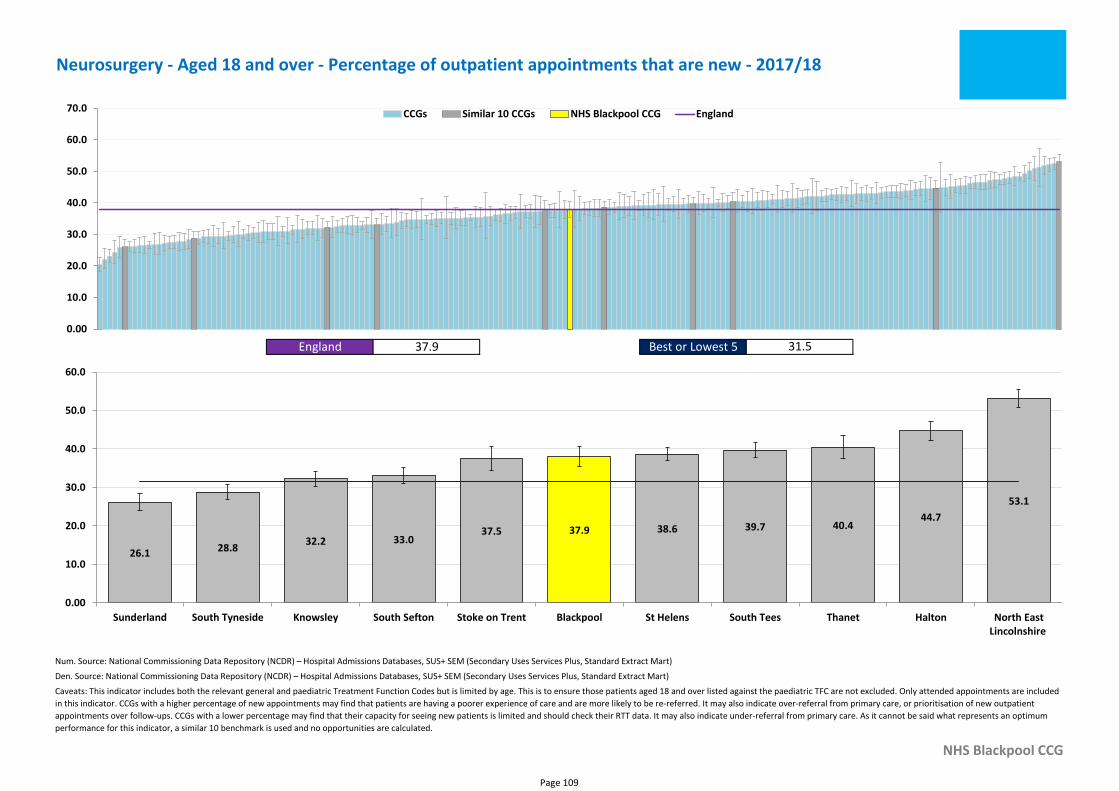
Num. Source: National Commissioning Data Repository (NCDR) – Hospital Admissions Databases, SUS+ SEM (Secondary Uses Services Plus, Standard Extract Mart)
Den. Source: National Commissioning Data Repository (NCDR) – Hospital Admissions Databases, SUS+ SEM (Secondary Uses Services Plus, Standard Extract Mart)
NHS Blackpool CCG
Caveats: This indicator includes both the relevant general and paediatric Treatment Function Codes but is limited by age. This is to ensure those patients aged 18 and over listed against the paediatric TFC are not excluded. Only attended appointments are included
in this indicator. CCGs with a higher percentage of new appointments may find that patients are having a poorer experience of care and are more likely to be re-referred. It may also indicate over-referral from primary care, or prioritisation of new outpatient
appointments over follow-ups. CCGs with a lower percentage may find that their capacity for seeing new patients is limited and should check their RTT data. It may also indicate under-referral from primary care. As it cannot be said what represents an optimum
performance for this indicator, a similar 10 benchmark is used and no opportunities are calculated.
Neurosurgery - Aged 18 and over - Percentage of outpatient appointments that are new - 2017/18
England 37.9 Best or Lowest 5 31.5
0.00
10.0
20.0
30.0
40.0
50.0
60.0
70.0 CCGs Similar 10 CCGs NHS Blackpool CCG England
37.9
26.1 28.832.2 33.0
37.5 38.6 39.7 40.444.7
53.1
0.00
10.0
20.0
30.0
40.0
50.0
60.0
Sunderland South Tyneside Knowsley South Sefton Stoke on Trent Blackpool St Helens South Tees Thanet Halton North EastLincolnshire
Page 109
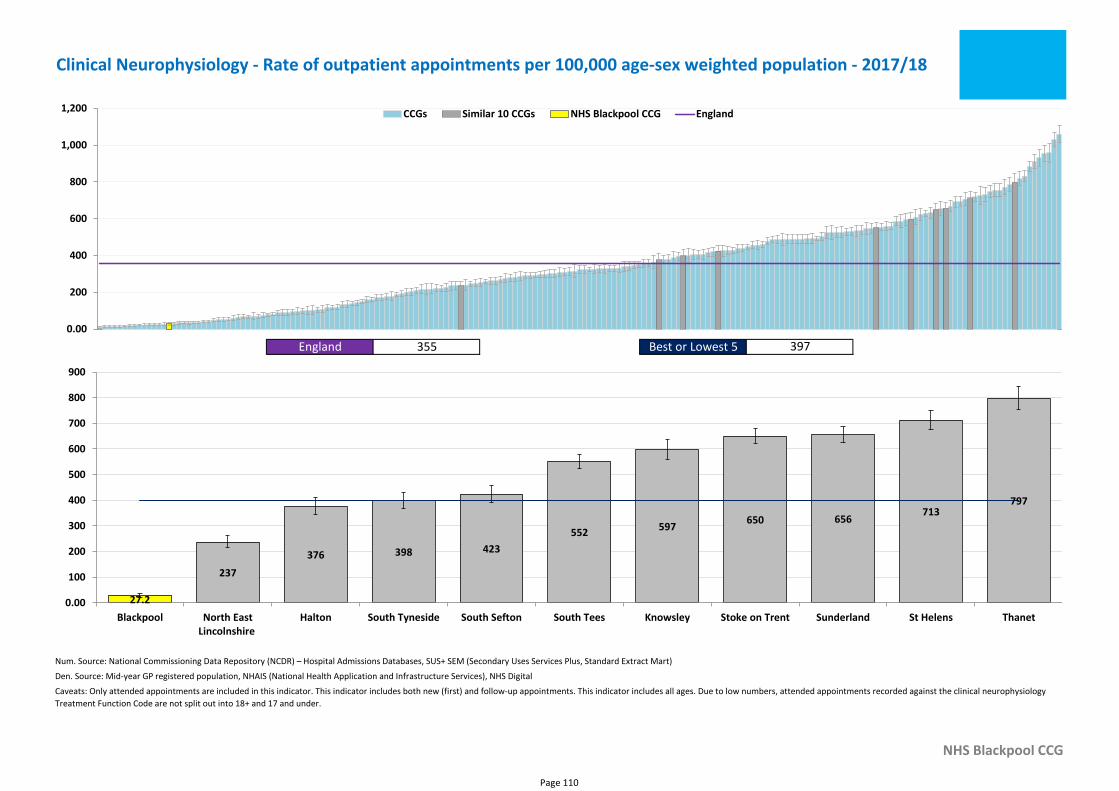
Num. Source: National Commissioning Data Repository (NCDR) – Hospital Admissions Databases, SUS+ SEM (Secondary Uses Services Plus, Standard Extract Mart)
Den. Source: Mid-year GP registered population, NHAIS (National Health Application and Infrastructure Services), NHS Digital
NHS Blackpool CCG
Caveats: Only attended appointments are included in this indicator. This indicator includes both new (first) and follow-up appointments. This indicator includes all ages. Due to low numbers, attended appointments recorded against the clinical neurophysiology
Treatment Function Code are not split out into 18+ and 17 and under.
Clinical Neurophysiology - Rate of outpatient appointments per 100,000 age-sex weighted population - 2017/18
England 355 Best or Lowest 5 397
0.00
200
400
600
800
1,000
1,200 CCGs Similar 10 CCGs NHS Blackpool CCG England
27.2
237
376 398 423
552597
650 656713
797
0.00
100
200
300
400
500
600
700
800
900
Blackpool North EastLincolnshire
Halton South Tyneside South Sefton South Tees Knowsley Stoke on Trent Sunderland St Helens Thanet
Page 110
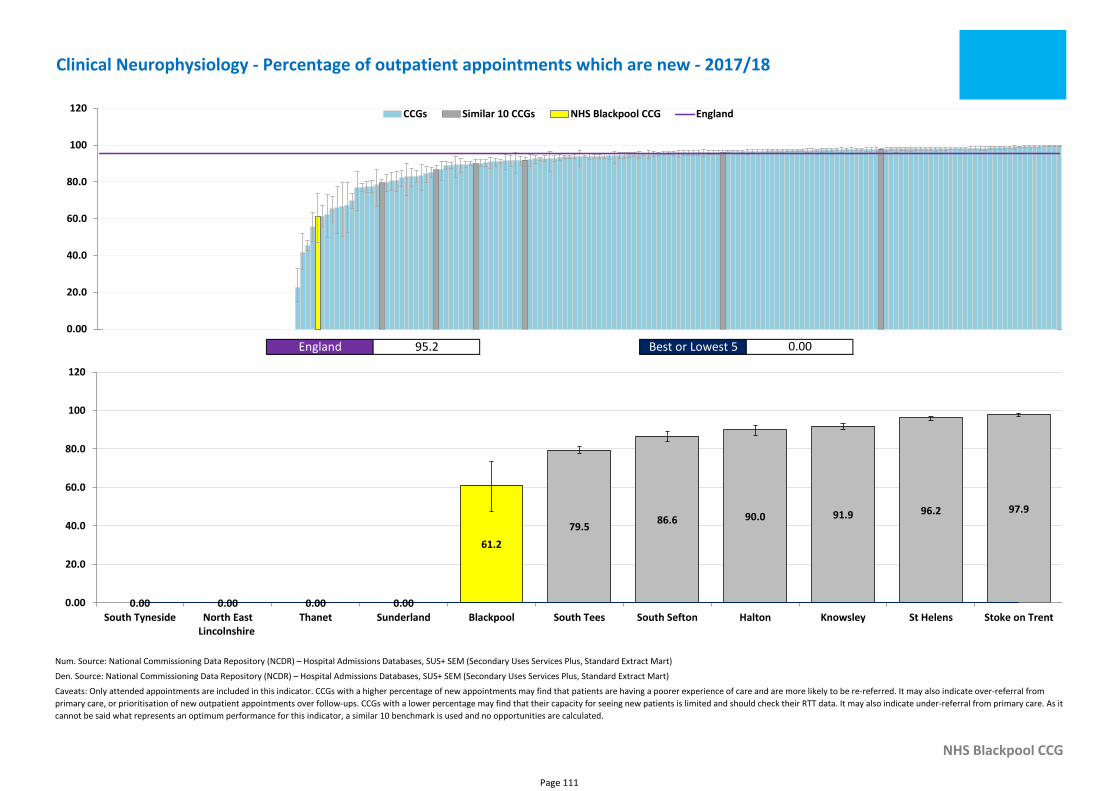
Num. Source: National Commissioning Data Repository (NCDR) – Hospital Admissions Databases, SUS+ SEM (Secondary Uses Services Plus, Standard Extract Mart)
Den. Source: National Commissioning Data Repository (NCDR) – Hospital Admissions Databases, SUS+ SEM (Secondary Uses Services Plus, Standard Extract Mart)
NHS Blackpool CCG
Caveats: Only attended appointments are included in this indicator. CCGs with a higher percentage of new appointments may find that patients are having a poorer experience of care and are more likely to be re-referred. It may also indicate over-referral from
primary care, or prioritisation of new outpatient appointments over follow-ups. CCGs with a lower percentage may find that their capacity for seeing new patients is limited and should check their RTT data. It may also indicate under-referral from primary care. As it
cannot be said what represents an optimum performance for this indicator, a similar 10 benchmark is used and no opportunities are calculated.
Clinical Neurophysiology - Percentage of outpatient appointments which are new - 2017/18
England 95.2 Best or Lowest 5 0.00
0.00
20.0
40.0
60.0
80.0
100
120 CCGs Similar 10 CCGs NHS Blackpool CCG England
61.2
0.00 0.00 0.00 0.00
79.586.6 90.0 91.9 96.2 97.9
0.00
20.0
40.0
60.0
80.0
100
120
South Tyneside North EastLincolnshire
Thanet Sunderland Blackpool South Tees South Sefton Halton Knowsley St Helens Stoke on Trent
Page 111
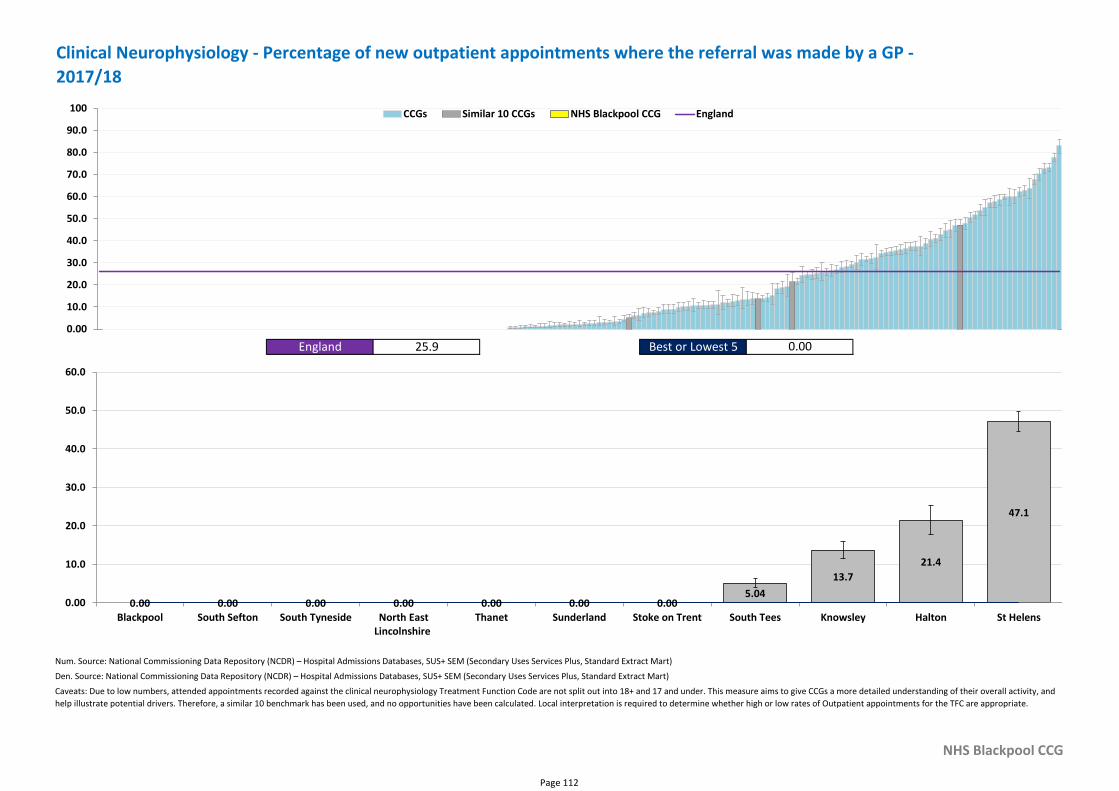
Num. Source: National Commissioning Data Repository (NCDR) – Hospital Admissions Databases, SUS+ SEM (Secondary Uses Services Plus, Standard Extract Mart)
Den. Source: National Commissioning Data Repository (NCDR) – Hospital Admissions Databases, SUS+ SEM (Secondary Uses Services Plus, Standard Extract Mart)
NHS Blackpool CCG
Caveats: Due to low numbers, attended appointments recorded against the clinical neurophysiology Treatment Function Code are not split out into 18+ and 17 and under. This measure aims to give CCGs a more detailed understanding of their overall activity, and
help illustrate potential drivers. Therefore, a similar 10 benchmark has been used, and no opportunities have been calculated. Local interpretation is required to determine whether high or low rates of Outpatient appointments for the TFC are appropriate.
Clinical Neurophysiology - Percentage of new outpatient appointments where the referral was made by a GP -
2017/18
England 25.9 Best or Lowest 5 0.00
0.00
10.0
20.0
30.0
40.0
50.0
60.0
70.0
80.0
90.0
100 CCGs Similar 10 CCGs NHS Blackpool CCG England
0.00 0.00 0.00 0.00 0.00 0.00 0.005.04
13.7
21.4
47.1
0.00
10.0
20.0
30.0
40.0
50.0
60.0
Blackpool South Sefton South Tyneside North EastLincolnshire
Thanet Sunderland Stoke on Trent South Tees Knowsley Halton St Helens
Page 112
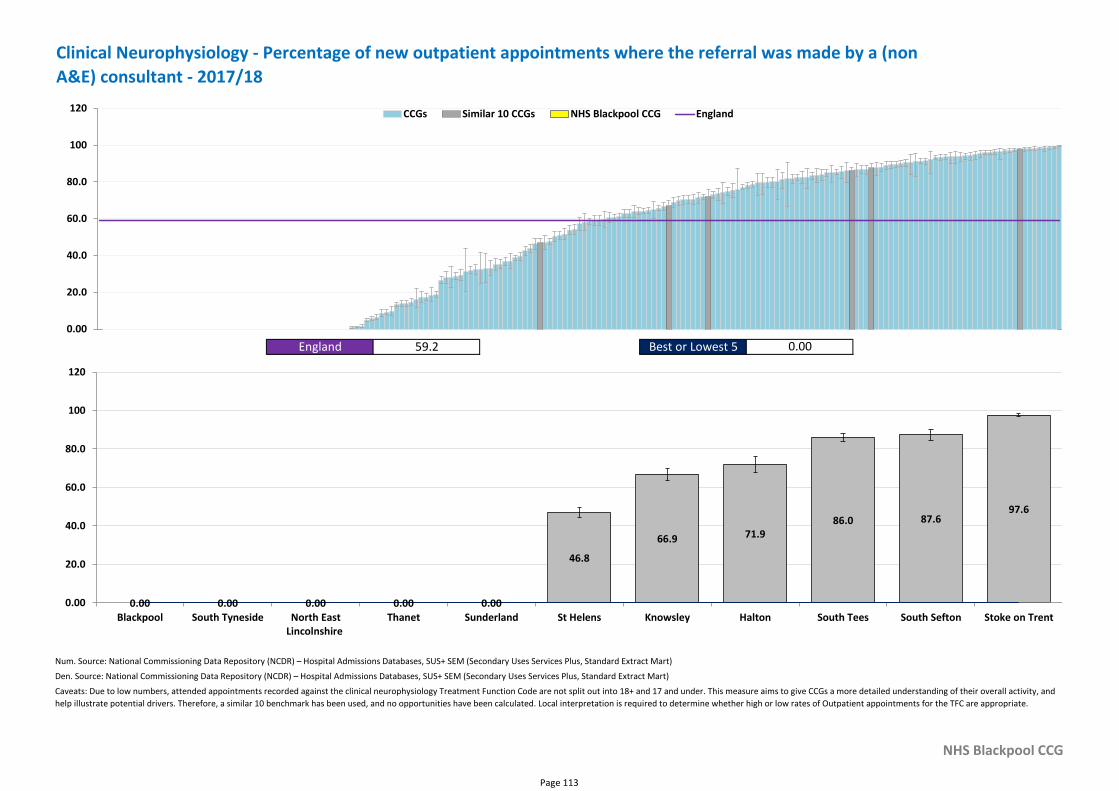
Num. Source: National Commissioning Data Repository (NCDR) – Hospital Admissions Databases, SUS+ SEM (Secondary Uses Services Plus, Standard Extract Mart)
Den. Source: National Commissioning Data Repository (NCDR) – Hospital Admissions Databases, SUS+ SEM (Secondary Uses Services Plus, Standard Extract Mart)
NHS Blackpool CCG
Caveats: Due to low numbers, attended appointments recorded against the clinical neurophysiology Treatment Function Code are not split out into 18+ and 17 and under. This measure aims to give CCGs a more detailed understanding of their overall activity, and
help illustrate potential drivers. Therefore, a similar 10 benchmark has been used, and no opportunities have been calculated. Local interpretation is required to determine whether high or low rates of Outpatient appointments for the TFC are appropriate.
Clinical Neurophysiology - Percentage of new outpatient appointments where the referral was made by a (non
A&E) consultant - 2017/18
England 59.2 Best or Lowest 5 0.00
0.00
20.0
40.0
60.0
80.0
100
120 CCGs Similar 10 CCGs NHS Blackpool CCG England
0.00 0.00 0.00 0.00 0.00
46.8
66.9 71.986.0 87.6
97.6
0.00
20.0
40.0
60.0
80.0
100
120
Blackpool South Tyneside North EastLincolnshire
Thanet Sunderland St Helens Knowsley Halton South Tees South Sefton Stoke on Trent
Page 113
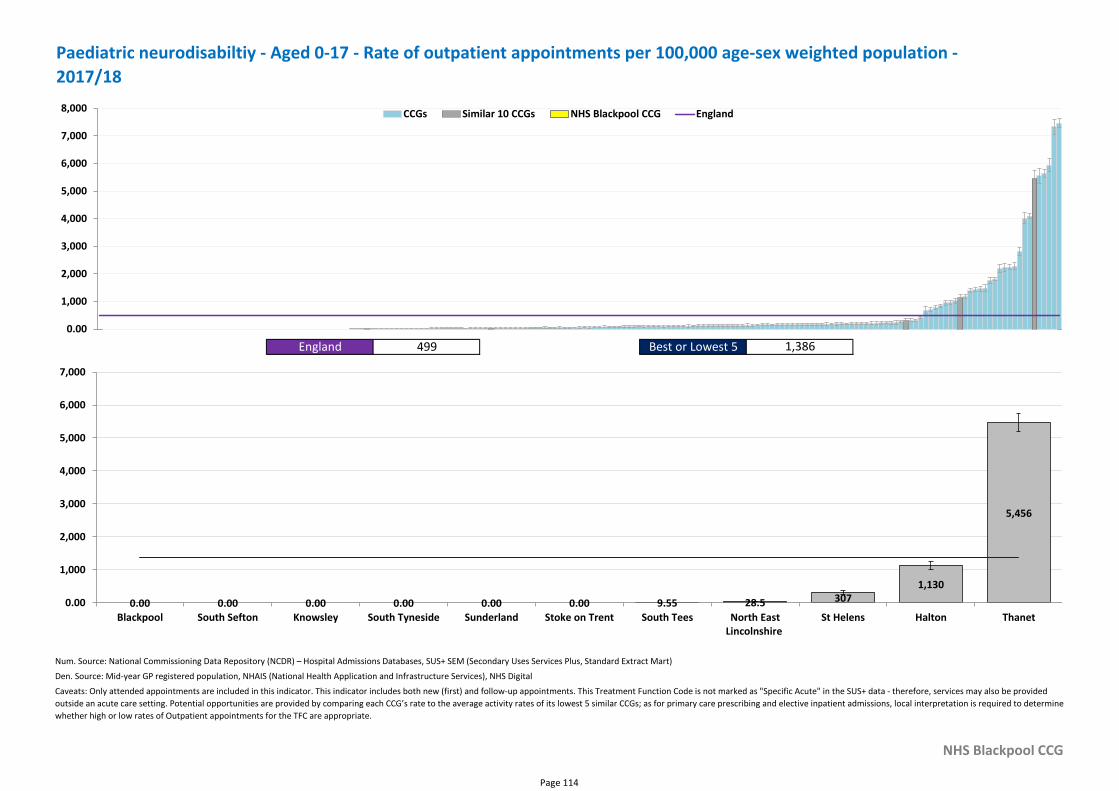
Num. Source: National Commissioning Data Repository (NCDR) – Hospital Admissions Databases, SUS+ SEM (Secondary Uses Services Plus, Standard Extract Mart)
Den. Source: Mid-year GP registered population, NHAIS (National Health Application and Infrastructure Services), NHS Digital
NHS Blackpool CCG
Caveats: Only attended appointments are included in this indicator. This indicator includes both new (first) and follow-up appointments. This Treatment Function Code is not marked as "Specific Acute" in the SUS+ data - therefore, services may also be provided
outside an acute care setting. Potential opportunities are provided by comparing each CCG’s rate to the average activity rates of its lowest 5 similar CCGs; as for primary care prescribing and elective inpatient admissions, local interpretation is required to determine
whether high or low rates of Outpatient appointments for the TFC are appropriate.
Paediatric neurodisabiltiy - Aged 0-17 - Rate of outpatient appointments per 100,000 age-sex weighted population -
2017/18
England 499 Best or Lowest 5 1,386
0.00
1,000
2,000
3,000
4,000
5,000
6,000
7,000
8,000 CCGs Similar 10 CCGs NHS Blackpool CCG England
0.00 0.00 0.00 0.00 0.00 0.00 9.55 28.5 3071,130
5,456
0.00
1,000
2,000
3,000
4,000
5,000
6,000
7,000
Blackpool South Sefton Knowsley South Tyneside Sunderland Stoke on Trent South Tees North EastLincolnshire
St Helens Halton Thanet
Page 114
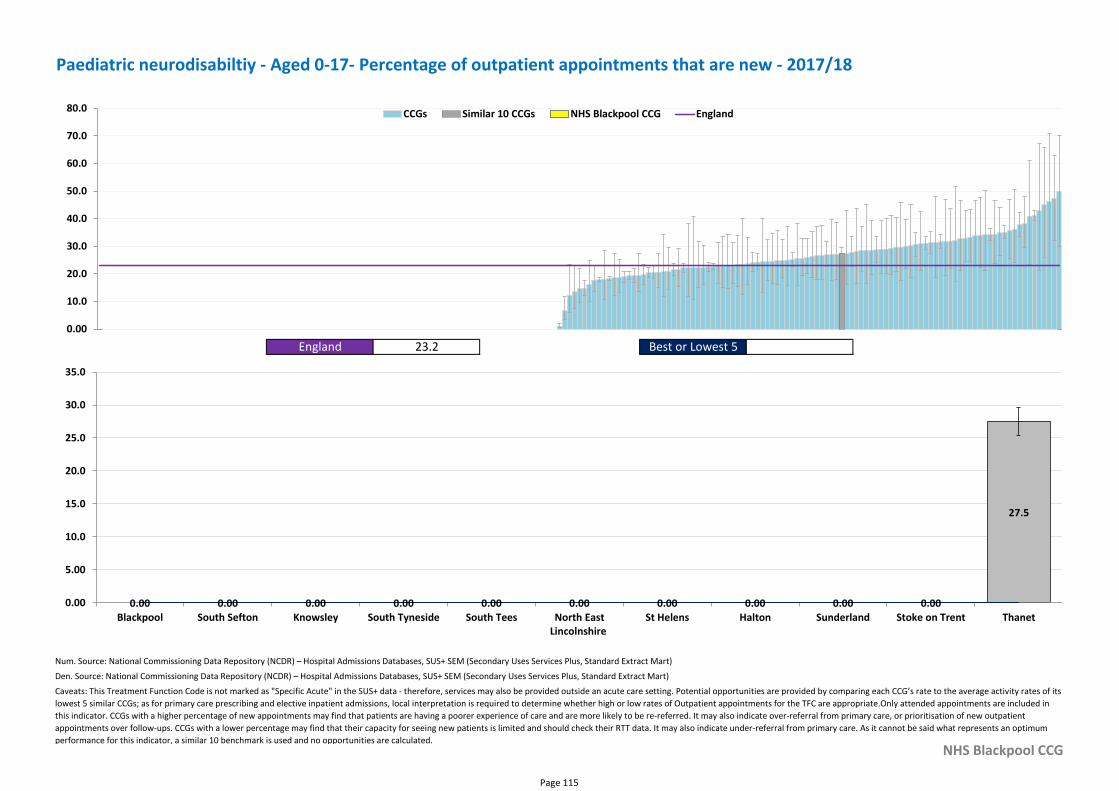
Num. Source: National Commissioning Data Repository (NCDR) – Hospital Admissions Databases, SUS+ SEM (Secondary Uses Services Plus, Standard Extract Mart)
Den. Source: National Commissioning Data Repository (NCDR) – Hospital Admissions Databases, SUS+ SEM (Secondary Uses Services Plus, Standard Extract Mart)
NHS Blackpool CCG
Caveats: This Treatment Function Code is not marked as "Specific Acute" in the SUS+ data - therefore, services may also be provided outside an acute care setting. Potential opportunities are provided by comparing each CCG’s rate to the average activity rates of its
lowest 5 similar CCGs; as for primary care prescribing and elective inpatient admissions, local interpretation is required to determine whether high or low rates of Outpatient appointments for the TFC are appropriate.Only attended appointments are included in
this indicator. CCGs with a higher percentage of new appointments may find that patients are having a poorer experience of care and are more likely to be re-referred. It may also indicate over-referral from primary care, or prioritisation of new outpatient
appointments over follow-ups. CCGs with a lower percentage may find that their capacity for seeing new patients is limited and should check their RTT data. It may also indicate under-referral from primary care. As it cannot be said what represents an optimum
performance for this indicator, a similar 10 benchmark is used and no opportunities are calculated.
Paediatric neurodisabiltiy - Aged 0-17- Percentage of outpatient appointments that are new - 2017/18
England 23.2 Best or Lowest 5
0.00
10.0
20.0
30.0
40.0
50.0
60.0
70.0
80.0 CCGs Similar 10 CCGs NHS Blackpool CCG England
0.00 0.00 0.00 0.00 0.00 0.00 0.00 0.00 0.00 0.00
27.5
0.00
5.00
10.0
15.0
20.0
25.0
30.0
35.0
Blackpool South Sefton Knowsley South Tyneside South Tees North EastLincolnshire
St Helens Halton Sunderland Stoke on Trent Thanet
Page 115
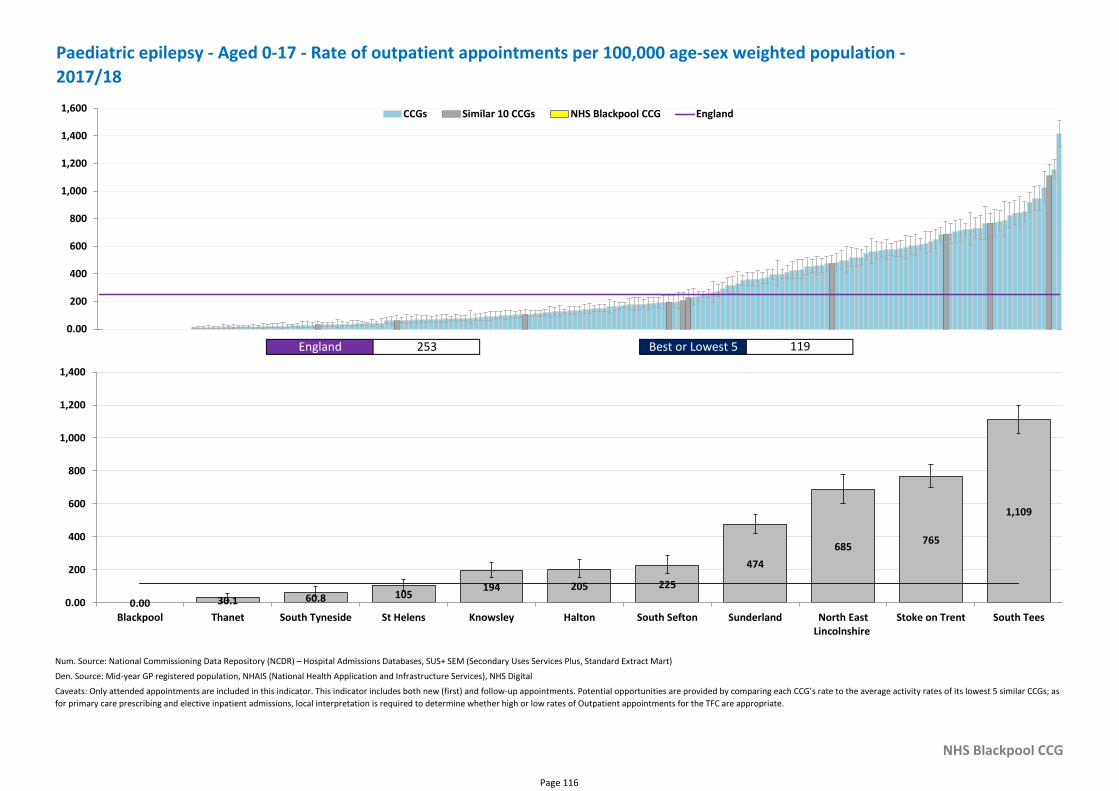
Num. Source: National Commissioning Data Repository (NCDR) – Hospital Admissions Databases, SUS+ SEM (Secondary Uses Services Plus, Standard Extract Mart)
Den. Source: Mid-year GP registered population, NHAIS (National Health Application and Infrastructure Services), NHS Digital
NHS Blackpool CCG
Caveats: Only attended appointments are included in this indicator. This indicator includes both new (first) and follow-up appointments. Potential opportunities are provided by comparing each CCG’s rate to the average activity rates of its lowest 5 similar CCGs; as
for primary care prescribing and elective inpatient admissions, local interpretation is required to determine whether high or low rates of Outpatient appointments for the TFC are appropriate.
Paediatric epilepsy - Aged 0-17 - Rate of outpatient appointments per 100,000 age-sex weighted population -
2017/18
England 253 Best or Lowest 5 119
0.00
200
400
600
800
1,000
1,200
1,400
1,600 CCGs Similar 10 CCGs NHS Blackpool CCG England
0.00 30.1 60.8 105194 205 225
474
685765
1,109
0.00
200
400
600
800
1,000
1,200
1,400
Blackpool Thanet South Tyneside St Helens Knowsley Halton South Sefton Sunderland North EastLincolnshire
Stoke on Trent South Tees
Page 116
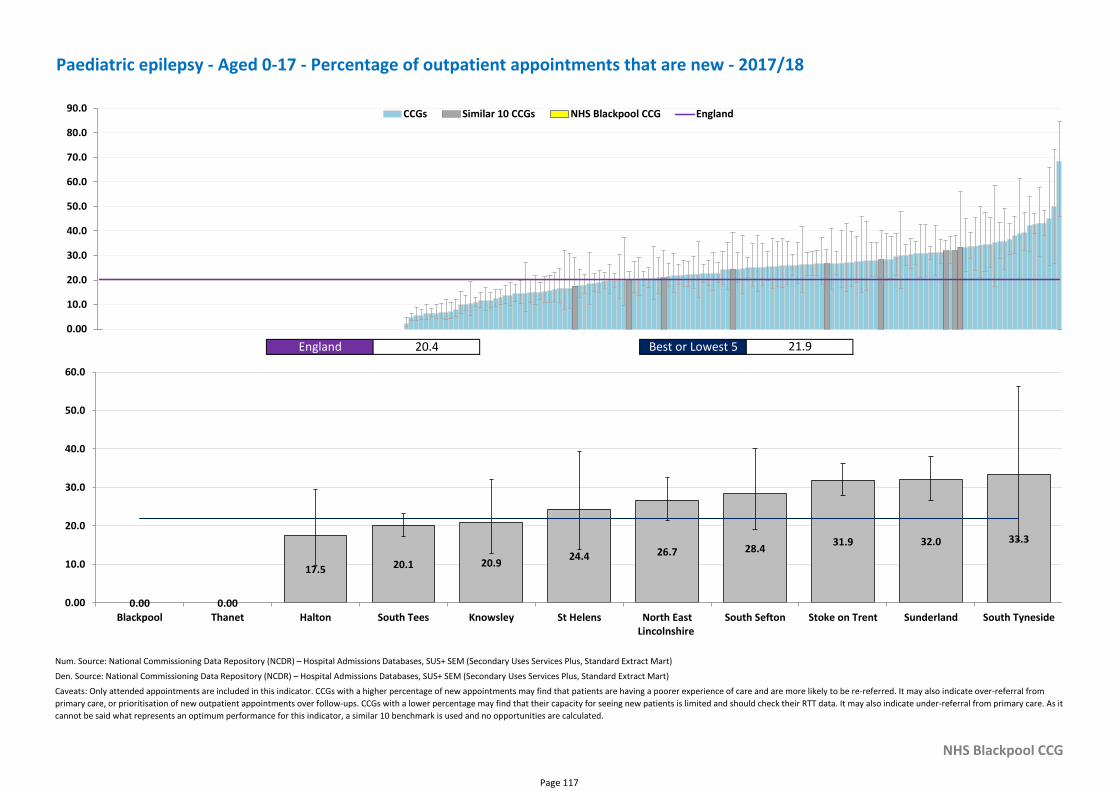
Num. Source: National Commissioning Data Repository (NCDR) – Hospital Admissions Databases, SUS+ SEM (Secondary Uses Services Plus, Standard Extract Mart)
Den. Source: National Commissioning Data Repository (NCDR) – Hospital Admissions Databases, SUS+ SEM (Secondary Uses Services Plus, Standard Extract Mart)
NHS Blackpool CCG
Caveats: Only attended appointments are included in this indicator. CCGs with a higher percentage of new appointments may find that patients are having a poorer experience of care and are more likely to be re-referred. It may also indicate over-referral from
primary care, or prioritisation of new outpatient appointments over follow-ups. CCGs with a lower percentage may find that their capacity for seeing new patients is limited and should check their RTT data. It may also indicate under-referral from primary care. As it
cannot be said what represents an optimum performance for this indicator, a similar 10 benchmark is used and no opportunities are calculated.
Paediatric epilepsy - Aged 0-17 - Percentage of outpatient appointments that are new - 2017/18
England 20.4 Best or Lowest 5 21.9
0.00
10.0
20.0
30.0
40.0
50.0
60.0
70.0
80.0
90.0 CCGs Similar 10 CCGs NHS Blackpool CCG England
0.00 0.00
17.5 20.1 20.924.4 26.7 28.4
31.9 32.0 33.3
0.00
10.0
20.0
30.0
40.0
50.0
60.0
Blackpool Thanet Halton South Tees Knowsley St Helens North EastLincolnshire
South Sefton Stoke on Trent Sunderland South Tyneside
Page 117
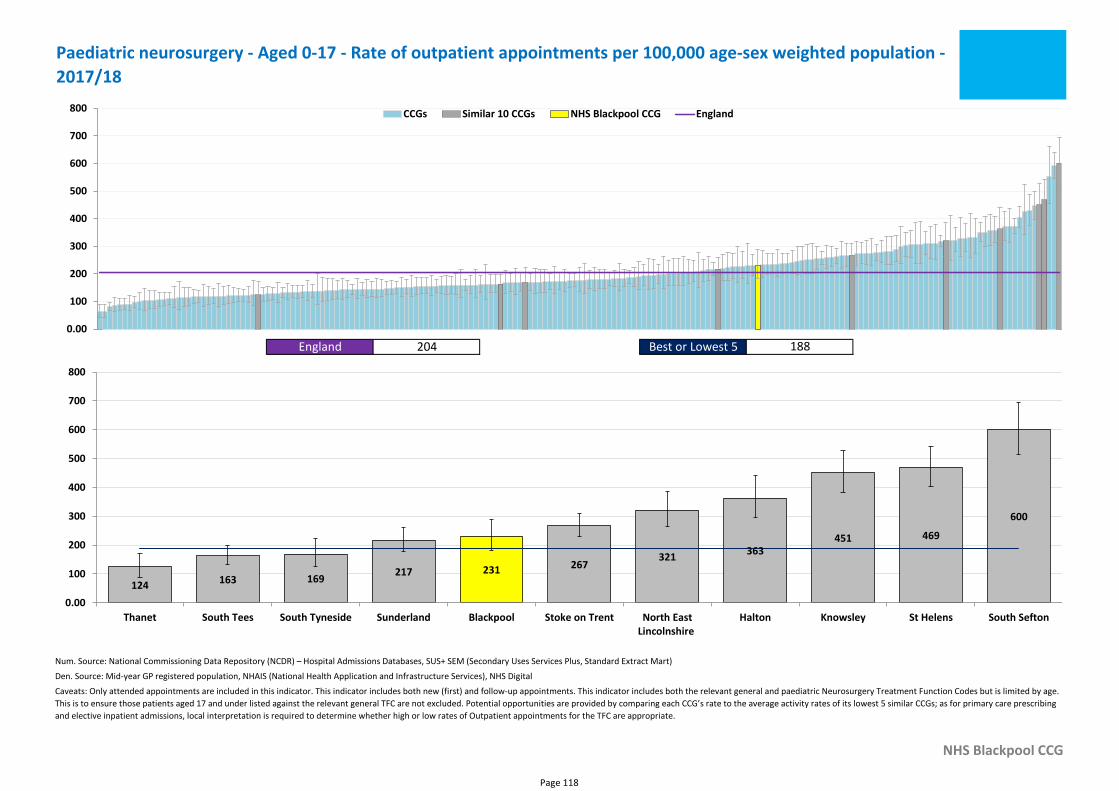
Num. Source: National Commissioning Data Repository (NCDR) – Hospital Admissions Databases, SUS+ SEM (Secondary Uses Services Plus, Standard Extract Mart)
Den. Source: Mid-year GP registered population, NHAIS (National Health Application and Infrastructure Services), NHS Digital
NHS Blackpool CCG
Caveats: Only attended appointments are included in this indicator. This indicator includes both new (first) and follow-up appointments. This indicator includes both the relevant general and paediatric Neurosurgery Treatment Function Codes but is limited by age.
This is to ensure those patients aged 17 and under listed against the relevant general TFC are not excluded. Potential opportunities are provided by comparing each CCG’s rate to the average activity rates of its lowest 5 similar CCGs; as for primary care prescribing
and elective inpatient admissions, local interpretation is required to determine whether high or low rates of Outpatient appointments for the TFC are appropriate.
Paediatric neurosurgery - Aged 0-17 - Rate of outpatient appointments per 100,000 age-sex weighted population -
2017/18
England 204 Best or Lowest 5 188
0.00
100
200
300
400
500
600
700
800 CCGs Similar 10 CCGs NHS Blackpool CCG England
231
124 163 169217
267321
363451 469
600
0.00
100
200
300
400
500
600
700
800
Thanet South Tees South Tyneside Sunderland Blackpool Stoke on Trent North EastLincolnshire
Halton Knowsley St Helens South Sefton
Page 118
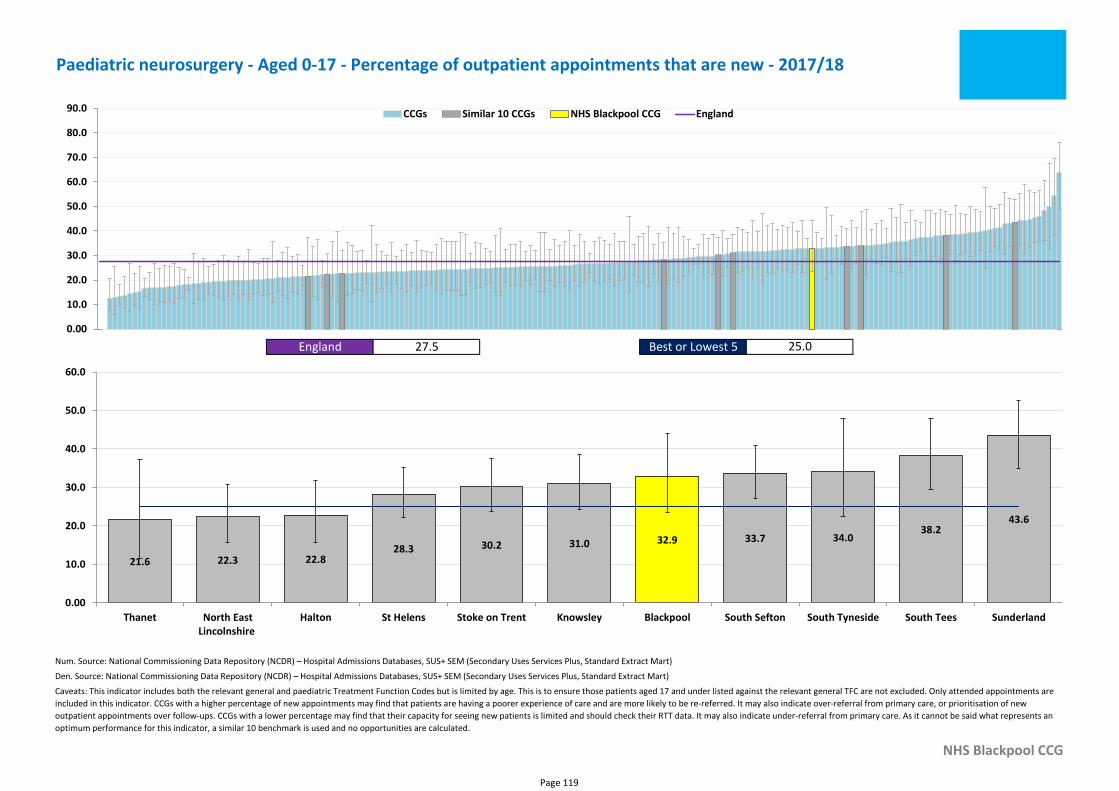
Num. Source: National Commissioning Data Repository (NCDR) – Hospital Admissions Databases, SUS+ SEM (Secondary Uses Services Plus, Standard Extract Mart)
Den. Source: National Commissioning Data Repository (NCDR) – Hospital Admissions Databases, SUS+ SEM (Secondary Uses Services Plus, Standard Extract Mart)
NHS Blackpool CCG
Caveats: This indicator includes both the relevant general and paediatric Treatment Function Codes but is limited by age. This is to ensure those patients aged 17 and under listed against the relevant general TFC are not excluded. Only attended appointments are
included in this indicator. CCGs with a higher percentage of new appointments may find that patients are having a poorer experience of care and are more likely to be re-referred. It may also indicate over-referral from primary care, or prioritisation of new
outpatient appointments over follow-ups. CCGs with a lower percentage may find that their capacity for seeing new patients is limited and should check their RTT data. It may also indicate under-referral from primary care. As it cannot be said what represents an
optimum performance for this indicator, a similar 10 benchmark is used and no opportunities are calculated.
Paediatric neurosurgery - Aged 0-17 - Percentage of outpatient appointments that are new - 2017/18
England 27.5 Best or Lowest 5 25.0
0.00
10.0
20.0
30.0
40.0
50.0
60.0
70.0
80.0
90.0 CCGs Similar 10 CCGs NHS Blackpool CCG England
32.9
21.6 22.3 22.828.3 30.2 31.0 33.7 34.0
38.243.6
0.00
10.0
20.0
30.0
40.0
50.0
60.0
Thanet North EastLincolnshire
Halton St Helens Stoke on Trent Knowsley Blackpool South Sefton South Tyneside South Tees Sunderland
Page 119
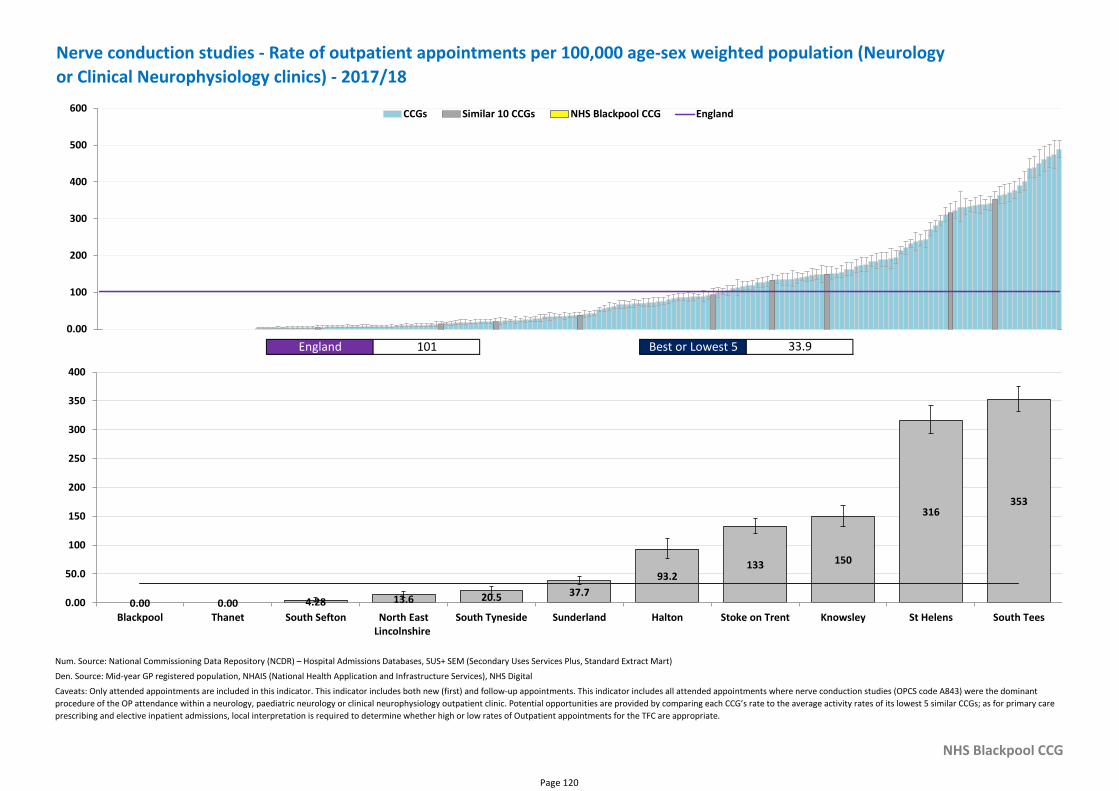
Num. Source: National Commissioning Data Repository (NCDR) – Hospital Admissions Databases, SUS+ SEM (Secondary Uses Services Plus, Standard Extract Mart)
Den. Source: Mid-year GP registered population, NHAIS (National Health Application and Infrastructure Services), NHS Digital
NHS Blackpool CCG
Caveats: Only attended appointments are included in this indicator. This indicator includes both new (first) and follow-up appointments. This indicator includes all attended appointments where nerve conduction studies (OPCS code A843) were the dominant
procedure of the OP attendance within a neurology, paediatric neurology or clinical neurophysiology outpatient clinic. Potential opportunities are provided by comparing each CCG’s rate to the average activity rates of its lowest 5 similar CCGs; as for primary care
prescribing and elective inpatient admissions, local interpretation is required to determine whether high or low rates of Outpatient appointments for the TFC are appropriate.
Nerve conduction studies - Rate of outpatient appointments per 100,000 age-sex weighted population (Neurology
or Clinical Neurophysiology clinics) - 2017/18
England 101 Best or Lowest 5 33.9
0.00
100
200
300
400
500
600 CCGs Similar 10 CCGs NHS Blackpool CCG England
0.00 0.00 4.28 13.6 20.5 37.7
93.2133 150
316353
0.00
50.0
100
150
200
250
300
350
400
Blackpool Thanet South Sefton North EastLincolnshire
South Tyneside Sunderland Halton Stoke on Trent Knowsley St Helens South Tees
Page 120
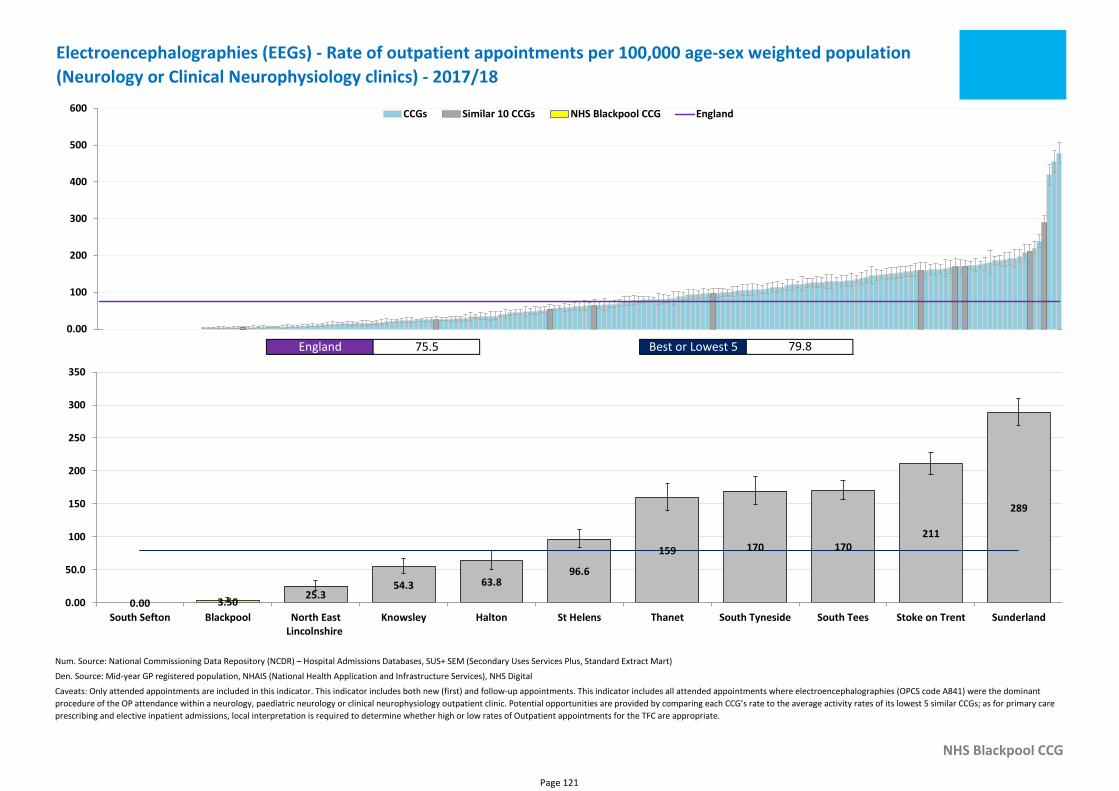
Num. Source: National Commissioning Data Repository (NCDR) – Hospital Admissions Databases, SUS+ SEM (Secondary Uses Services Plus, Standard Extract Mart)
Den. Source: Mid-year GP registered population, NHAIS (National Health Application and Infrastructure Services), NHS Digital
NHS Blackpool CCG
Caveats: Only attended appointments are included in this indicator. This indicator includes both new (first) and follow-up appointments. This indicator includes all attended appointments where electroencephalographies (OPCS code A841) were the dominant
procedure of the OP attendance within a neurology, paediatric neurology or clinical neurophysiology outpatient clinic. Potential opportunities are provided by comparing each CCG’s rate to the average activity rates of its lowest 5 similar CCGs; as for primary care
prescribing and elective inpatient admissions, local interpretation is required to determine whether high or low rates of Outpatient appointments for the TFC are appropriate.
Electroencephalographies (EEGs) - Rate of outpatient appointments per 100,000 age-sex weighted population
(Neurology or Clinical Neurophysiology clinics) - 2017/18
England 75.5 Best or Lowest 5 79.8
0.00
100
200
300
400
500
600 CCGs Similar 10 CCGs NHS Blackpool CCG England
3.500.0025.3
54.3 63.896.6
159 170 170211
289
0.00
50.0
100
150
200
250
300
350
South Sefton Blackpool North EastLincolnshire
Knowsley Halton St Helens Thanet South Tyneside South Tees Stoke on Trent Sunderland
Page 121
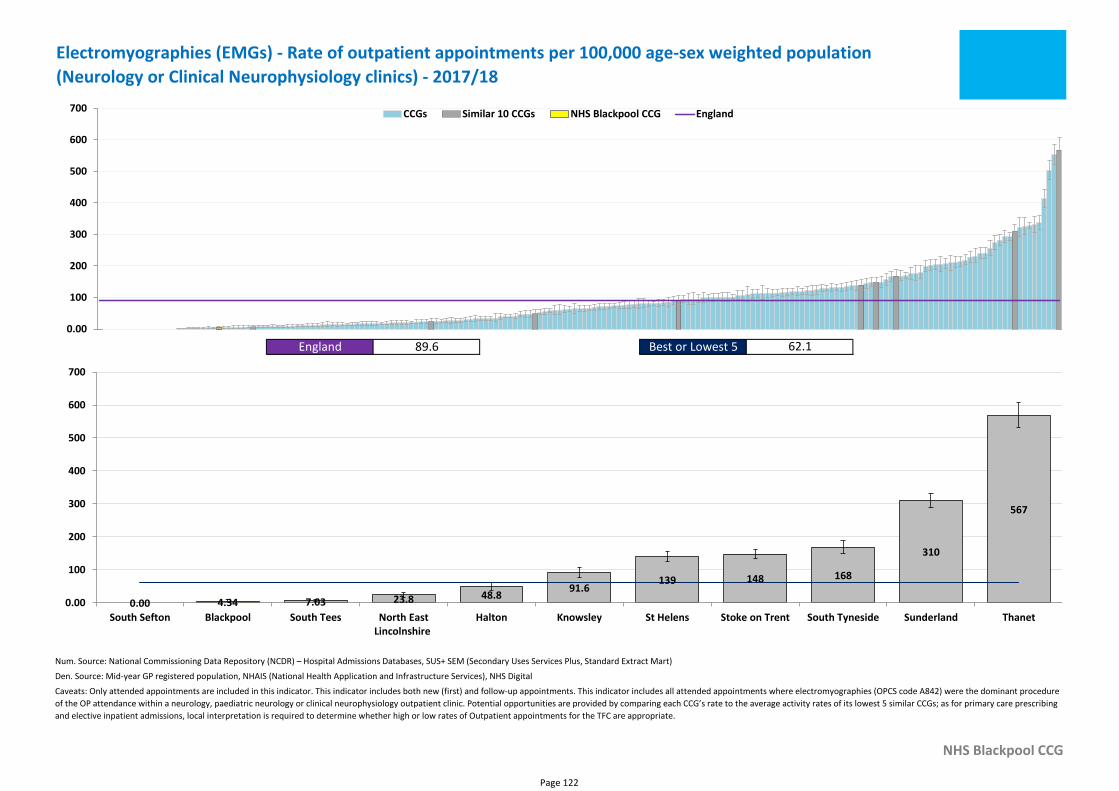
Num. Source: National Commissioning Data Repository (NCDR) – Hospital Admissions Databases, SUS+ SEM (Secondary Uses Services Plus, Standard Extract Mart)
Den. Source: Mid-year GP registered population, NHAIS (National Health Application and Infrastructure Services), NHS Digital
NHS Blackpool CCG
Caveats: Only attended appointments are included in this indicator. This indicator includes both new (first) and follow-up appointments. This indicator includes all attended appointments where electromyographies (OPCS code A842) were the dominant procedure
of the OP attendance within a neurology, paediatric neurology or clinical neurophysiology outpatient clinic. Potential opportunities are provided by comparing each CCG’s rate to the average activity rates of its lowest 5 similar CCGs; as for primary care prescribing
and elective inpatient admissions, local interpretation is required to determine whether high or low rates of Outpatient appointments for the TFC are appropriate.
Electromyographies (EMGs) - Rate of outpatient appointments per 100,000 age-sex weighted population
(Neurology or Clinical Neurophysiology clinics) - 2017/18
England 89.6 Best or Lowest 5 62.1
0.00
100
200
300
400
500
600
700 CCGs Similar 10 CCGs NHS Blackpool CCG England
4.340.00 7.03 23.8 48.891.6
139 148 168
310
567
0.00
100
200
300
400
500
600
700
South Sefton Blackpool South Tees North EastLincolnshire
Halton Knowsley St Helens Stoke on Trent South Tyneside Sunderland Thanet
Page 122
Section 5 - Procedures
Page 123
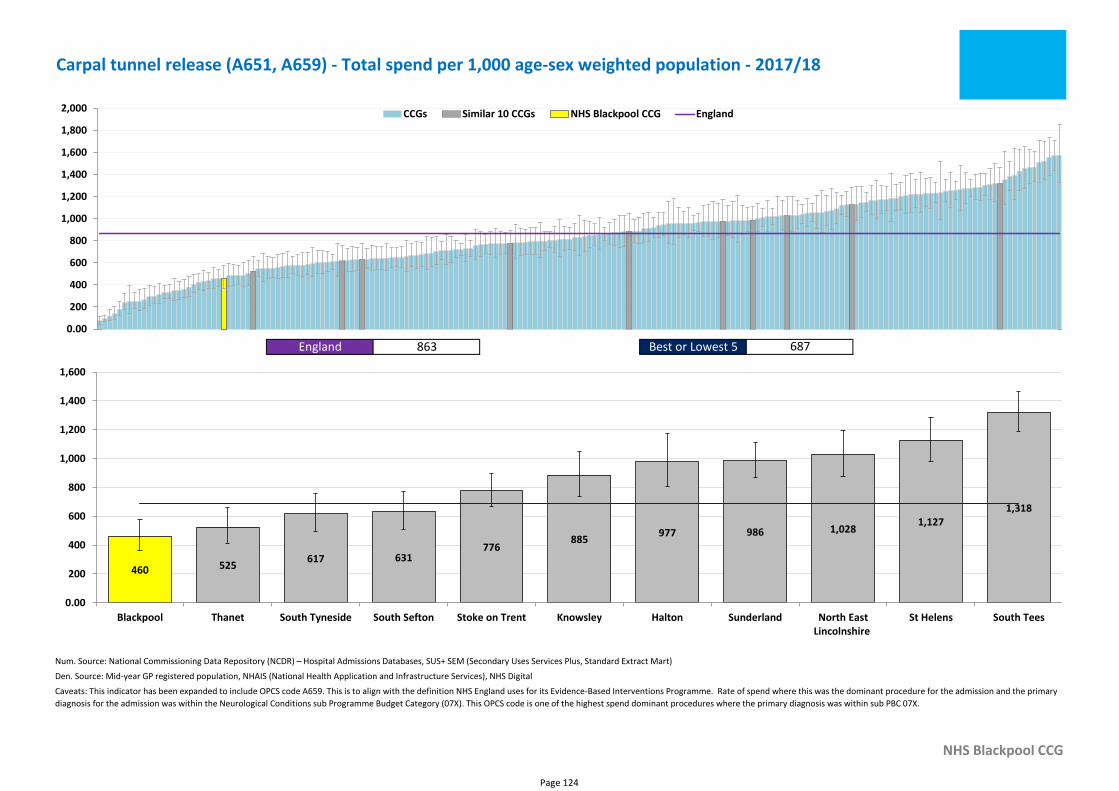
Num. Source: National Commissioning Data Repository (NCDR) – Hospital Admissions Databases, SUS+ SEM (Secondary Uses Services Plus, Standard Extract Mart)
Den. Source: Mid-year GP registered population, NHAIS (National Health Application and Infrastructure Services), NHS Digital
NHS Blackpool CCG
Caveats: This indicator has been expanded to include OPCS code A659. This is to align with the definition NHS England uses for its Evidence-Based Interventions Programme. Rate of spend where this was the dominant procedure for the admission and the primary
diagnosis for the admission was within the Neurological Conditions sub Programme Budget Category (07X). This OPCS code is one of the highest spend dominant procedures where the primary diagnosis was within sub PBC 07X.
Carpal tunnel release (A651, A659) - Total spend per 1,000 age-sex weighted population - 2017/18
England 863 Best or Lowest 5 687
0.00
200
400
600
800
1,000
1,200
1,400
1,600
1,800
2,000 CCGs Similar 10 CCGs NHS Blackpool CCG England
460 525617 631
776885
977 986 1,0281,127
1,318
0.00
200
400
600
800
1,000
1,200
1,400
1,600
Blackpool Thanet South Tyneside South Sefton Stoke on Trent Knowsley Halton Sunderland North EastLincolnshire
St Helens South Tees
Page 124
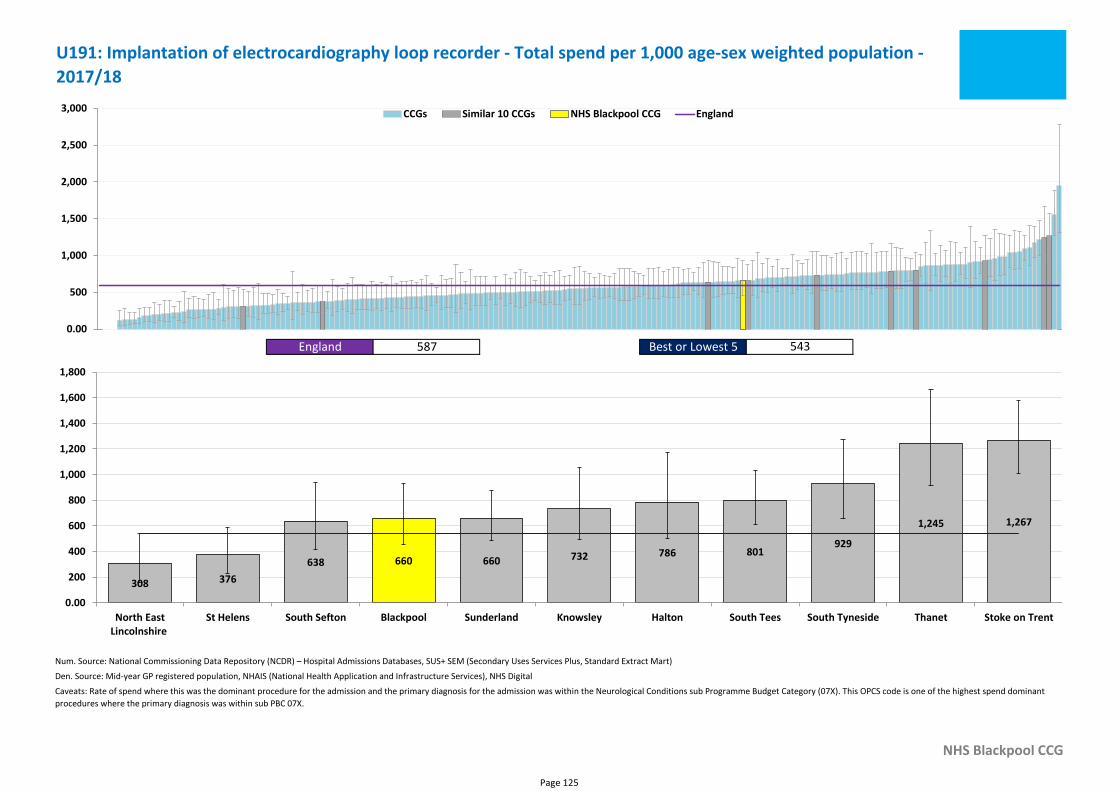
Num. Source: National Commissioning Data Repository (NCDR) – Hospital Admissions Databases, SUS+ SEM (Secondary Uses Services Plus, Standard Extract Mart)
Den. Source: Mid-year GP registered population, NHAIS (National Health Application and Infrastructure Services), NHS Digital
NHS Blackpool CCG
Caveats: Rate of spend where this was the dominant procedure for the admission and the primary diagnosis for the admission was within the Neurological Conditions sub Programme Budget Category (07X). This OPCS code is one of the highest spend dominant
procedures where the primary diagnosis was within sub PBC 07X.
U191: Implantation of electrocardiography loop recorder - Total spend per 1,000 age-sex weighted population -
2017/18
England 587 Best or Lowest 5 543
0.00
500
1,000
1,500
2,000
2,500
3,000 CCGs Similar 10 CCGs NHS Blackpool CCG England
660
308 376
638 660 732 786 801929
1,245 1,267
0.00
200
400
600
800
1,000
1,200
1,400
1,600
1,800
North EastLincolnshire
St Helens South Sefton Blackpool Sunderland Knowsley Halton South Tees South Tyneside Thanet Stoke on Trent
Page 125
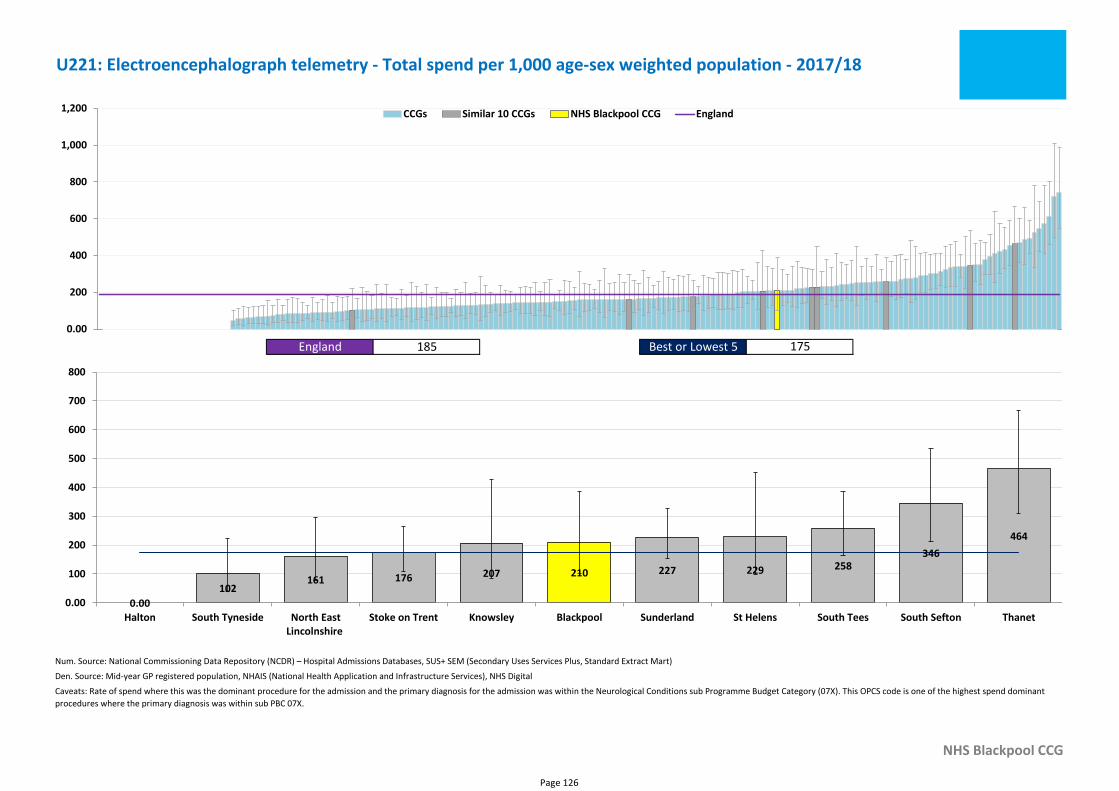
Num. Source: National Commissioning Data Repository (NCDR) – Hospital Admissions Databases, SUS+ SEM (Secondary Uses Services Plus, Standard Extract Mart)
Den. Source: Mid-year GP registered population, NHAIS (National Health Application and Infrastructure Services), NHS Digital
NHS Blackpool CCG
Caveats: Rate of spend where this was the dominant procedure for the admission and the primary diagnosis for the admission was within the Neurological Conditions sub Programme Budget Category (07X). This OPCS code is one of the highest spend dominant
procedures where the primary diagnosis was within sub PBC 07X.
U221: Electroencephalograph telemetry - Total spend per 1,000 age-sex weighted population - 2017/18
England 185 Best or Lowest 5 175
0.00
200
400
600
800
1,000
1,200 CCGs Similar 10 CCGs NHS Blackpool CCG England
210
0.00
102161 176 207 227 229 258
346
464
0.00
100
200
300
400
500
600
700
800
Halton South Tyneside North EastLincolnshire
Stoke on Trent Knowsley Blackpool Sunderland St Helens South Tees South Sefton Thanet
Page 126
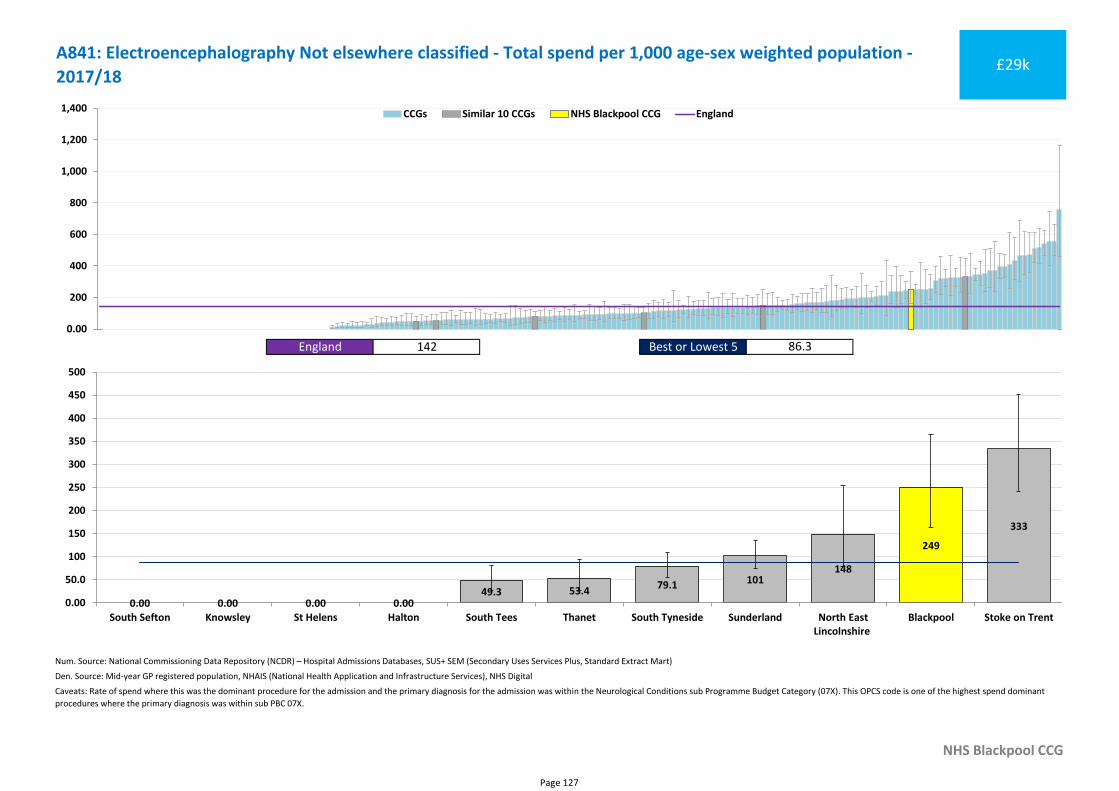
Num. Source: National Commissioning Data Repository (NCDR) – Hospital Admissions Databases, SUS+ SEM (Secondary Uses Services Plus, Standard Extract Mart)
Den. Source: Mid-year GP registered population, NHAIS (National Health Application and Infrastructure Services), NHS Digital
NHS Blackpool CCG
Caveats: Rate of spend where this was the dominant procedure for the admission and the primary diagnosis for the admission was within the Neurological Conditions sub Programme Budget Category (07X). This OPCS code is one of the highest spend dominant
procedures where the primary diagnosis was within sub PBC 07X.
A841: Electroencephalography Not elsewhere classified - Total spend per 1,000 age-sex weighted population -
2017/18£29k
England 142 Best or Lowest 5 86.3
0.00
200
400
600
800
1,000
1,200
1,400 CCGs Similar 10 CCGs NHS Blackpool CCG England
249
0.00 0.00 0.00 0.0049.3 53.4
79.1 101148
333
0.00
50.0
100
150
200
250
300
350
400
450
500
South Sefton Knowsley St Helens Halton South Tees Thanet South Tyneside Sunderland North EastLincolnshire
Blackpool Stoke on Trent
Page 127

Num. Source: National Commissioning Data Repository (NCDR) – Hospital Admissions Databases, SUS+ SEM (Secondary Uses Services Plus, Standard Extract Mart)
Den. Source: Mid-year GP registered population, NHAIS (National Health Application and Infrastructure Services), NHS Digital
NHS Blackpool CCG
Caveats: Rate of spend where this was the dominant procedure for the admission and the primary diagnosis for the admission was within the Neurological Conditions sub Programme Budget Category (07X). This OPCS code is one of the highest spend dominant
procedures where the primary diagnosis was within sub PBC 07X.
A671: Cubital tunnel release - Total spend per 1,000 age-sex weighted population - 2017/18
England 97.3 Best or Lowest 5 79.2
0.00
50.0
100
150
200
250
300
350
400
450
500 CCGs Similar 10 CCGs NHS Blackpool CCG England
47.046.967.4 73.3
100 108 114131
146 156 167
0.00
50.0
100
150
200
250
300
Knowsley Blackpool North EastLincolnshire
South Sefton Stoke on Trent South Tyneside Halton St Helens Sunderland Thanet South Tees
Page 128
Part II - Chronic Pain
Page 129

Section 1 - Prevalence
Page 130
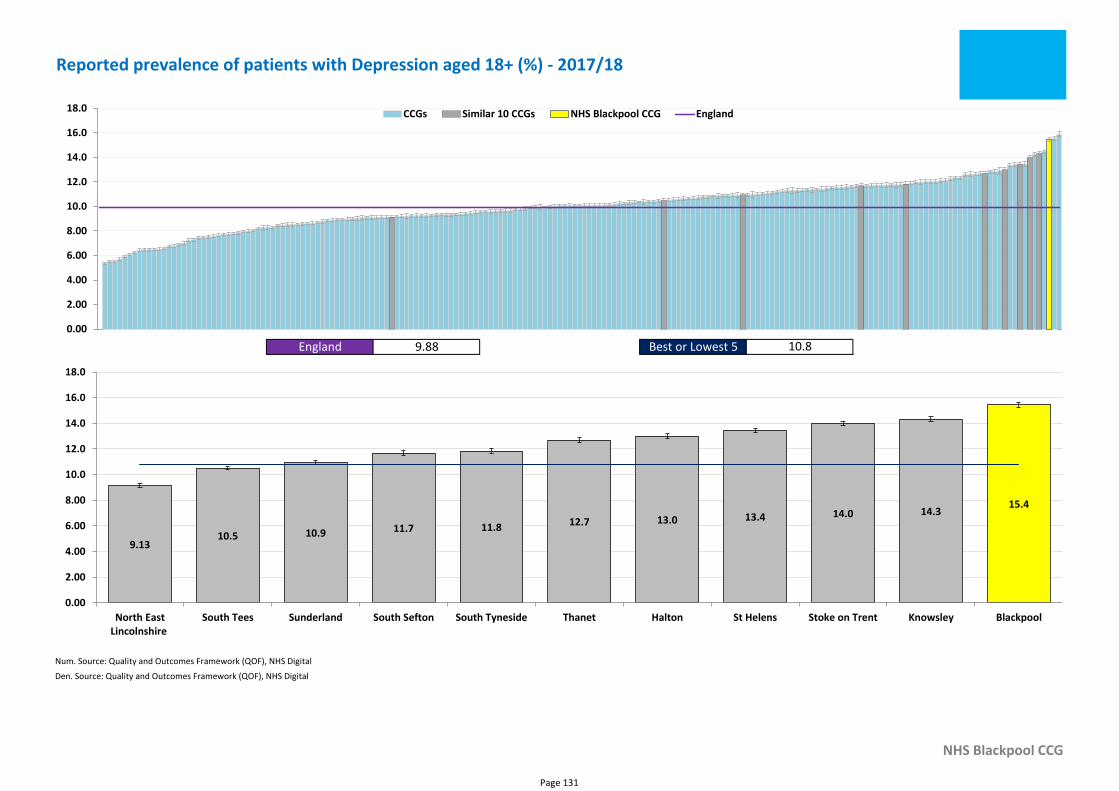
Num. Source: Quality and Outcomes Framework (QOF), NHS Digital
Den. Source: Quality and Outcomes Framework (QOF), NHS Digital
NHS Blackpool CCG
Reported prevalence of patients with Depression aged 18+ (%) - 2017/18
England 9.88 Best or Lowest 5 10.8
0.00
2.00
4.00
6.00
8.00
10.0
12.0
14.0
16.0
18.0 CCGs Similar 10 CCGs NHS Blackpool CCG England
15.4
9.1310.5 10.9 11.7 11.8 12.7 13.0 13.4 14.0 14.3
0.00
2.00
4.00
6.00
8.00
10.0
12.0
14.0
16.0
18.0
North EastLincolnshire
South Tees Sunderland South Sefton South Tyneside Thanet Halton St Helens Stoke on Trent Knowsley Blackpool
Page 131

Section 2a - Primary Care
• Primary Care Prescribing Spend
Page 132
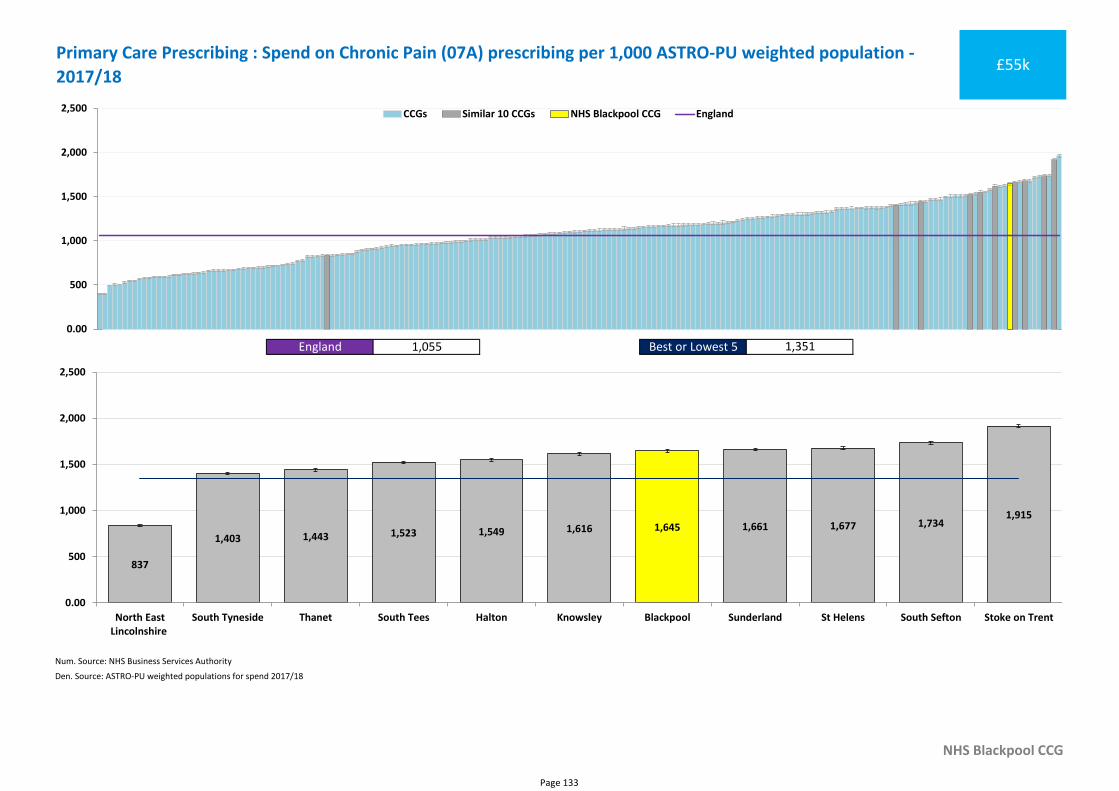
Num. Source: NHS Business Services Authority
Den. Source: ASTRO-PU weighted populations for spend 2017/18
NHS Blackpool CCG
Primary Care Prescribing : Spend on Chronic Pain (07A) prescribing per 1,000 ASTRO-PU weighted population -
2017/18£55k
England 1,055 Best or Lowest 5 1,351
0.00
500
1,000
1,500
2,000
2,500 CCGs Similar 10 CCGs NHS Blackpool CCG England
1,645
837
1,403 1,443 1,523 1,549 1,616 1,661 1,677 1,7341,915
0.00
500
1,000
1,500
2,000
2,500
North EastLincolnshire
South Tyneside Thanet South Tees Halton Knowsley Blackpool Sunderland St Helens South Sefton Stoke on Trent
Page 133
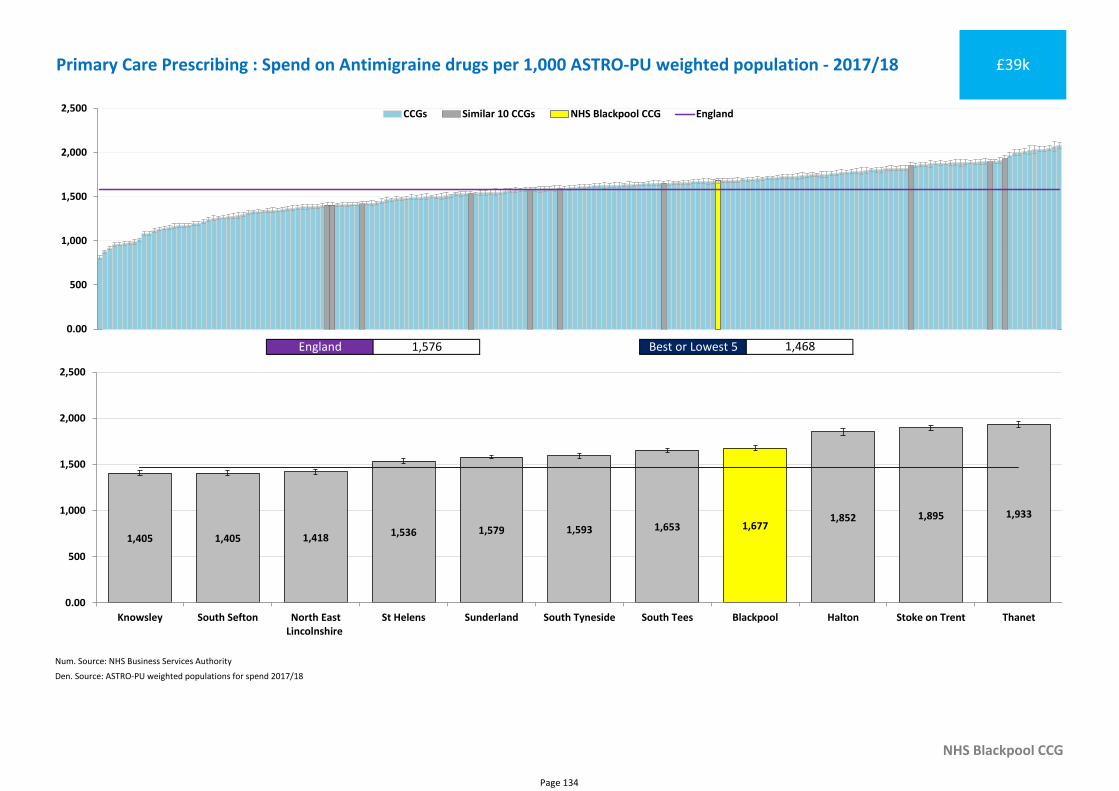
Num. Source: NHS Business Services Authority
Den. Source: ASTRO-PU weighted populations for spend 2017/18
NHS Blackpool CCG
Primary Care Prescribing : Spend on Antimigraine drugs per 1,000 ASTRO-PU weighted population - 2017/18 £39k
England 1,576 Best or Lowest 5 1,468
0.00
500
1,000
1,500
2,000
2,500 CCGs Similar 10 CCGs NHS Blackpool CCG England
1,6771,405 1,405 1,418 1,536 1,579 1,593 1,653
1,852 1,895 1,933
0.00
500
1,000
1,500
2,000
2,500
Knowsley South Sefton North EastLincolnshire
St Helens Sunderland South Tyneside South Tees Blackpool Halton Stoke on Trent Thanet
Page 134
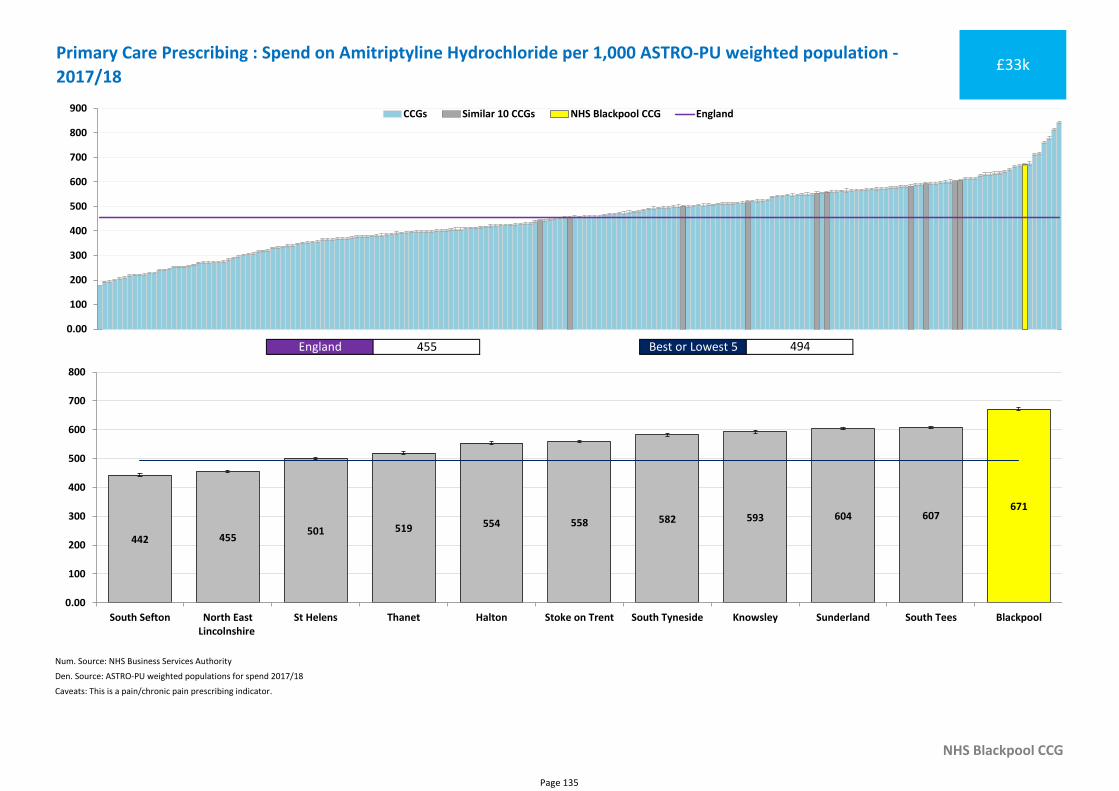
Num. Source: NHS Business Services Authority
Den. Source: ASTRO-PU weighted populations for spend 2017/18
NHS Blackpool CCG
Caveats: This is a pain/chronic pain prescribing indicator.
Primary Care Prescribing : Spend on Amitriptyline Hydrochloride per 1,000 ASTRO-PU weighted population -
2017/18£33k
England 455 Best or Lowest 5 494
0.00
100
200
300
400
500
600
700
800
900 CCGs Similar 10 CCGs NHS Blackpool CCG England
671
442 455501 519 554 558 582 593 604 607
0.00
100
200
300
400
500
600
700
800
South Sefton North EastLincolnshire
St Helens Thanet Halton Stoke on Trent South Tyneside Knowsley Sunderland South Tees Blackpool
Page 135
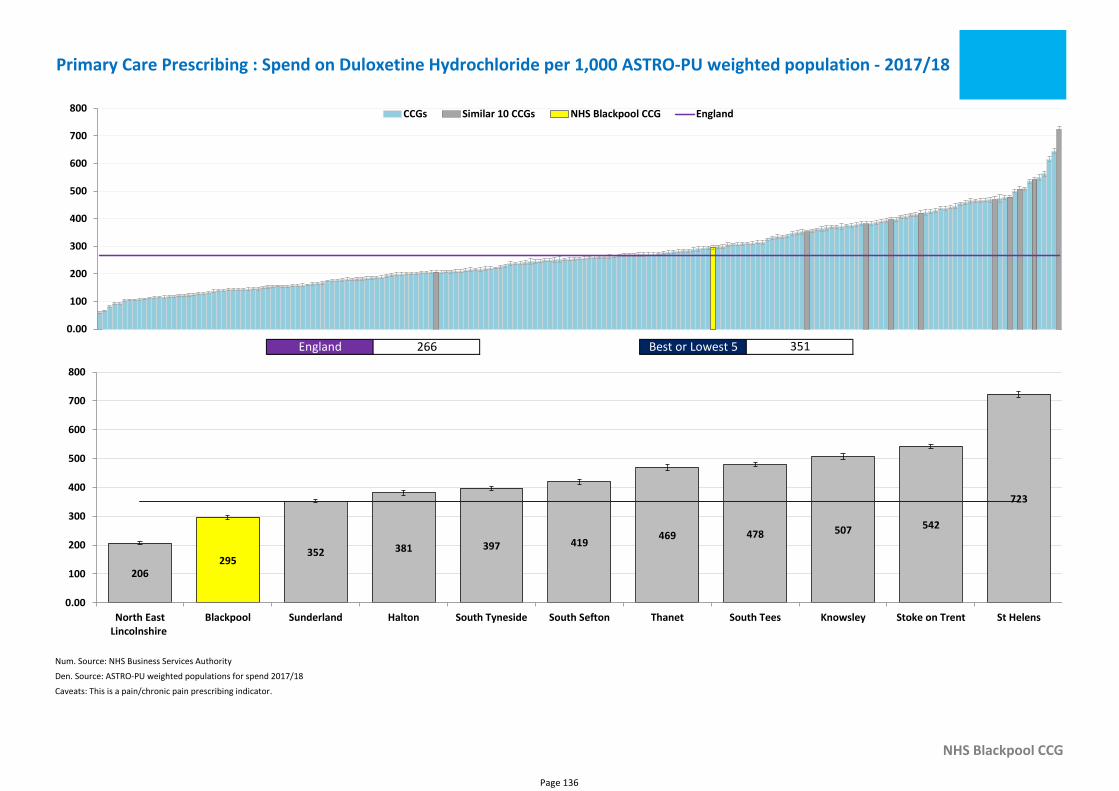
Num. Source: NHS Business Services Authority
Den. Source: ASTRO-PU weighted populations for spend 2017/18
NHS Blackpool CCG
Caveats: This is a pain/chronic pain prescribing indicator.
Primary Care Prescribing : Spend on Duloxetine Hydrochloride per 1,000 ASTRO-PU weighted population - 2017/18
England 266 Best or Lowest 5 351
0.00
100
200
300
400
500
600
700
800 CCGs Similar 10 CCGs NHS Blackpool CCG England
295206
352 381 397 419469 478 507 542
723
0.00
100
200
300
400
500
600
700
800
North EastLincolnshire
Blackpool Sunderland Halton South Tyneside South Sefton Thanet South Tees Knowsley Stoke on Trent St Helens
Page 136
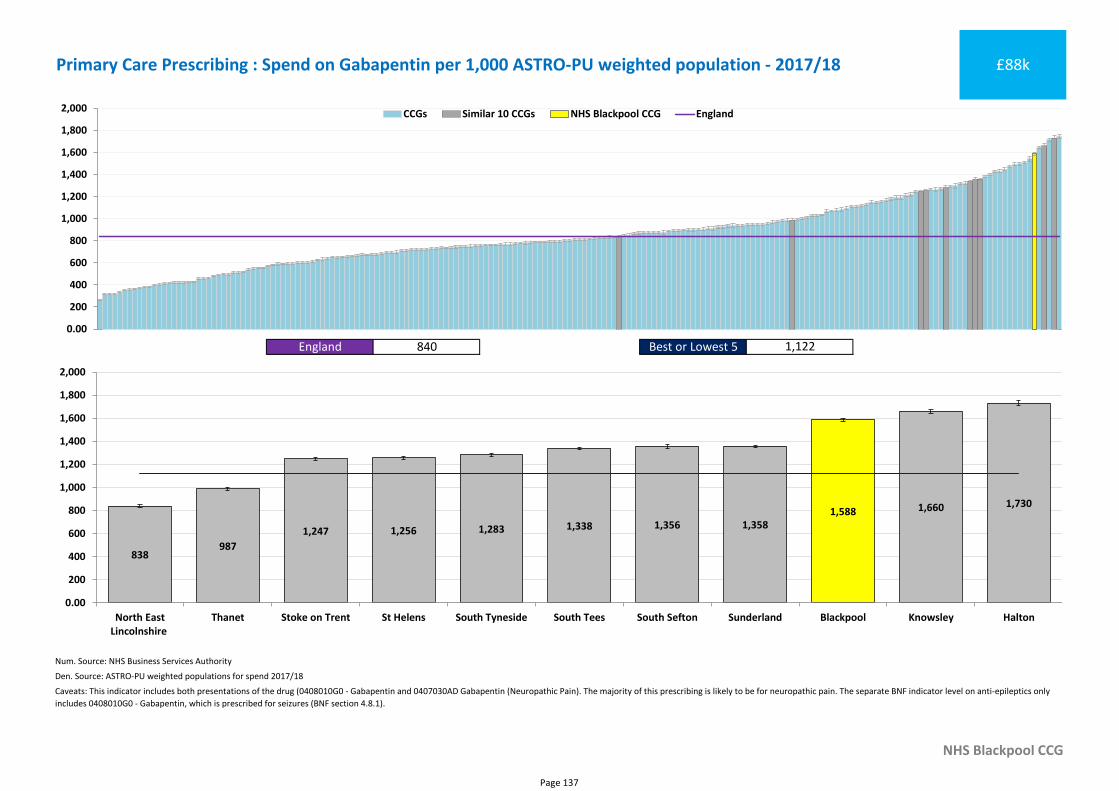
Num. Source: NHS Business Services Authority
Den. Source: ASTRO-PU weighted populations for spend 2017/18
NHS Blackpool CCG
Caveats: This indicator includes both presentations of the drug (0408010G0 - Gabapentin and 0407030AD Gabapentin (Neuropathic Pain). The majority of this prescribing is likely to be for neuropathic pain. The separate BNF indicator level on anti-epileptics only
includes 0408010G0 - Gabapentin, which is prescribed for seizures (BNF section 4.8.1).
Primary Care Prescribing : Spend on Gabapentin per 1,000 ASTRO-PU weighted population - 2017/18 £88k
England 840 Best or Lowest 5 1,122
0.00
200
400
600
800
1,000
1,200
1,400
1,600
1,800
2,000 CCGs Similar 10 CCGs NHS Blackpool CCG England
1,588
838987
1,247 1,256 1,283 1,338 1,356 1,358
1,660 1,730
0.00
200
400
600
800
1,000
1,200
1,400
1,600
1,800
2,000
North EastLincolnshire
Thanet Stoke on Trent St Helens South Tyneside South Tees South Sefton Sunderland Blackpool Knowsley Halton
Page 137
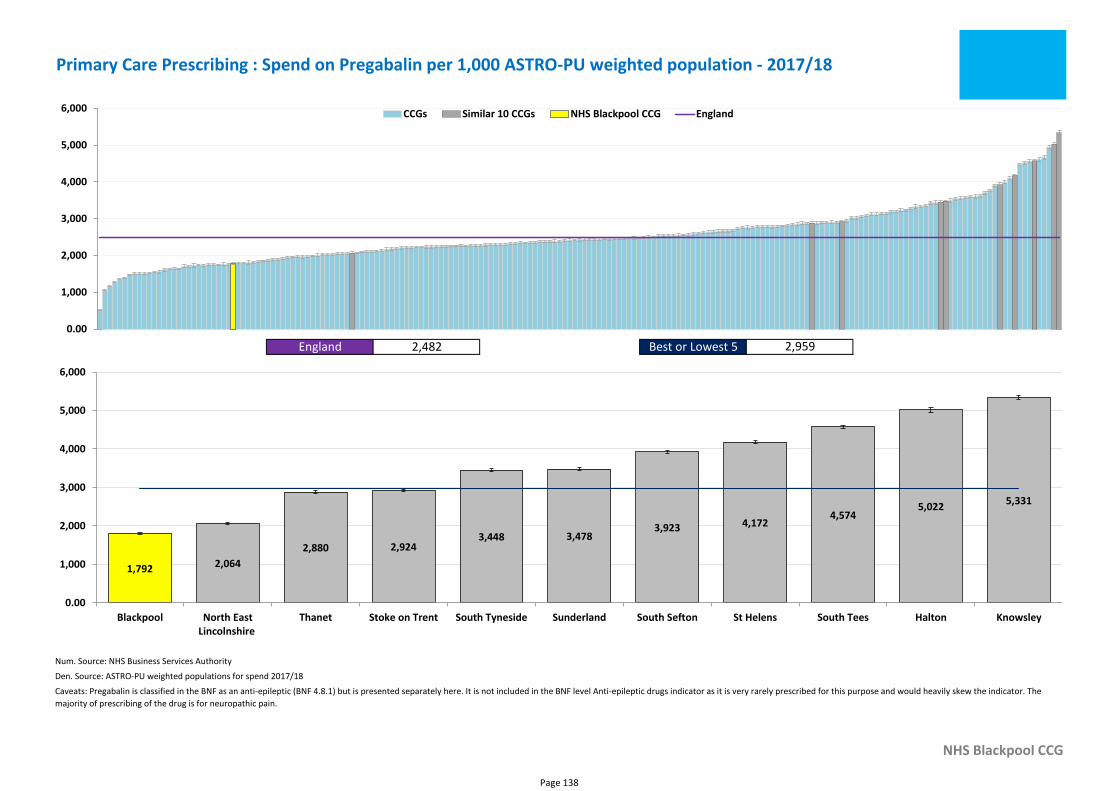
Num. Source: NHS Business Services Authority
Den. Source: ASTRO-PU weighted populations for spend 2017/18
NHS Blackpool CCG
Caveats: Pregabalin is classified in the BNF as an anti-epileptic (BNF 4.8.1) but is presented separately here. It is not included in the BNF level Anti-epileptic drugs indicator as it is very rarely prescribed for this purpose and would heavily skew the indicator. The
majority of prescribing of the drug is for neuropathic pain.
Primary Care Prescribing : Spend on Pregabalin per 1,000 ASTRO-PU weighted population - 2017/18
England 2,482 Best or Lowest 5 2,959
0.00
1,000
2,000
3,000
4,000
5,000
6,000 CCGs Similar 10 CCGs NHS Blackpool CCG England
1,792 2,064
2,880 2,9243,448 3,478
3,923 4,1724,574
5,0225,331
0.00
1,000
2,000
3,000
4,000
5,000
6,000
Blackpool North EastLincolnshire
Thanet Stoke on Trent South Tyneside Sunderland South Sefton St Helens South Tees Halton Knowsley
Page 138
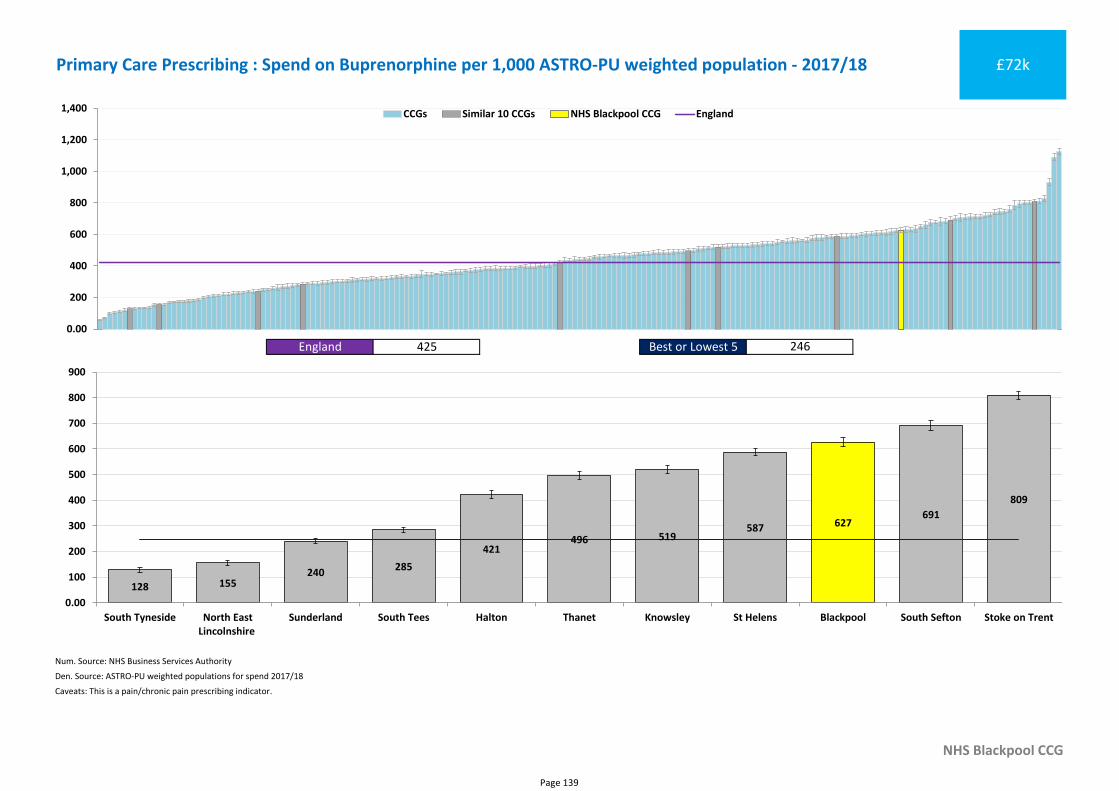
Num. Source: NHS Business Services Authority
Den. Source: ASTRO-PU weighted populations for spend 2017/18
NHS Blackpool CCG
Caveats: This is a pain/chronic pain prescribing indicator.
Primary Care Prescribing : Spend on Buprenorphine per 1,000 ASTRO-PU weighted population - 2017/18 £72k
England 425 Best or Lowest 5 246
0.00
200
400
600
800
1,000
1,200
1,400 CCGs Similar 10 CCGs NHS Blackpool CCG England
627
128 155240
285
421496 519
587691
809
0.00
100
200
300
400
500
600
700
800
900
South Tyneside North EastLincolnshire
Sunderland South Tees Halton Thanet Knowsley St Helens Blackpool South Sefton Stoke on Trent
Page 139
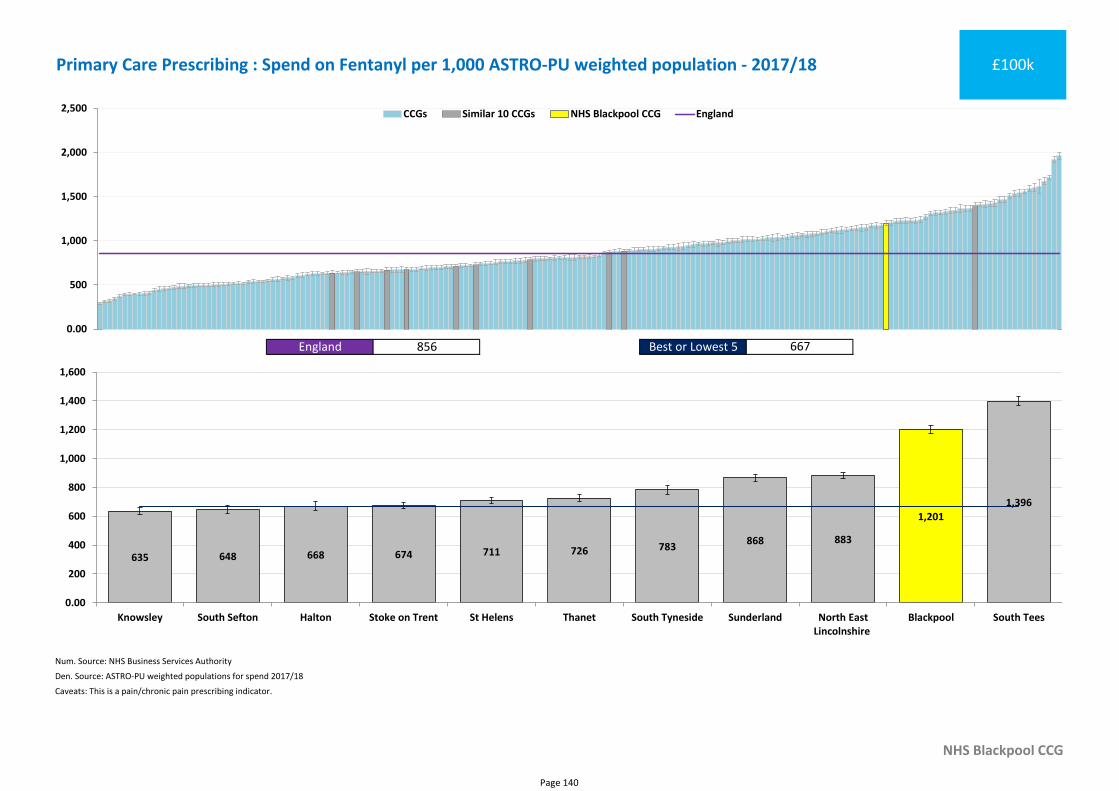
Num. Source: NHS Business Services Authority
Den. Source: ASTRO-PU weighted populations for spend 2017/18
NHS Blackpool CCG
Caveats: This is a pain/chronic pain prescribing indicator.
Primary Care Prescribing : Spend on Fentanyl per 1,000 ASTRO-PU weighted population - 2017/18 £100k
England 856 Best or Lowest 5 667
0.00
500
1,000
1,500
2,000
2,500 CCGs Similar 10 CCGs NHS Blackpool CCG England
1,201
635 648 668 674 711 726 783868 883
1,396
0.00
200
400
600
800
1,000
1,200
1,400
1,600
Knowsley South Sefton Halton Stoke on Trent St Helens Thanet South Tyneside Sunderland North EastLincolnshire
Blackpool South Tees
Page 140
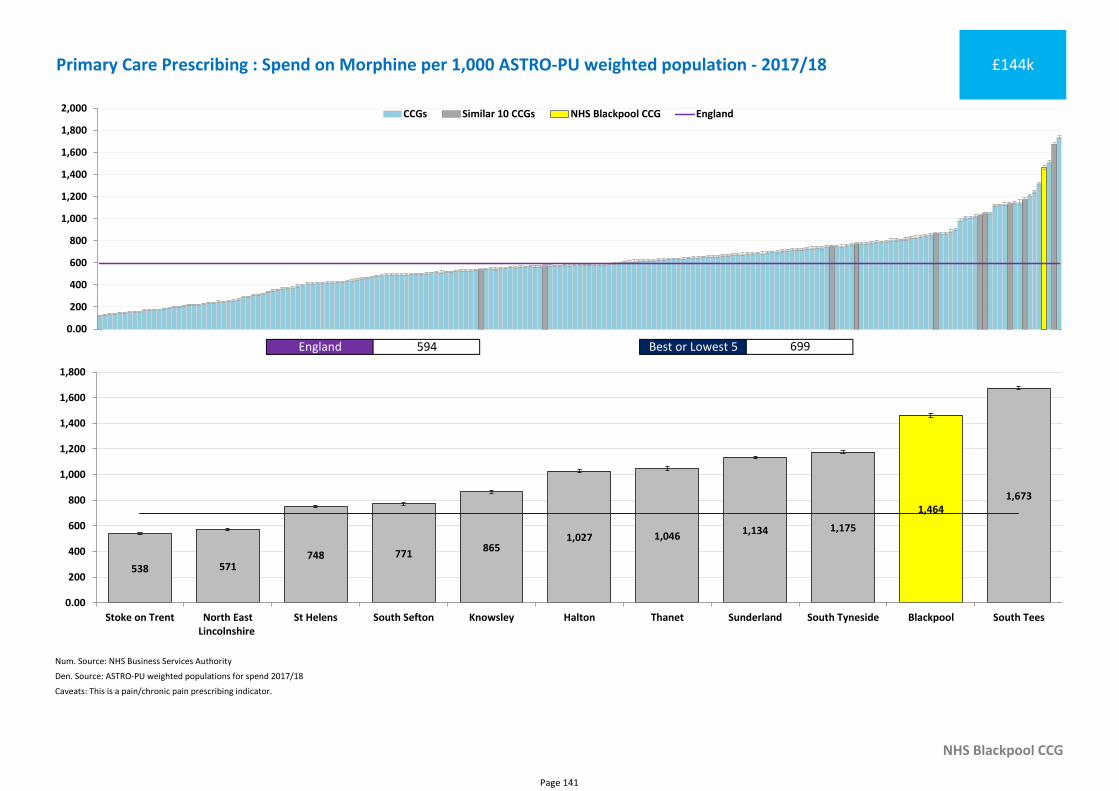
Num. Source: NHS Business Services Authority
Den. Source: ASTRO-PU weighted populations for spend 2017/18
NHS Blackpool CCG
Caveats: This is a pain/chronic pain prescribing indicator.
Primary Care Prescribing : Spend on Morphine per 1,000 ASTRO-PU weighted population - 2017/18 £144k
England 594 Best or Lowest 5 699
0.00
200
400
600
800
1,000
1,200
1,400
1,600
1,800
2,000 CCGs Similar 10 CCGs NHS Blackpool CCG England
1,464
538 571748 771
8651,027 1,046 1,134 1,175
1,673
0.00
200
400
600
800
1,000
1,200
1,400
1,600
1,800
Stoke on Trent North EastLincolnshire
St Helens South Sefton Knowsley Halton Thanet Sunderland South Tyneside Blackpool South Tees
Page 141
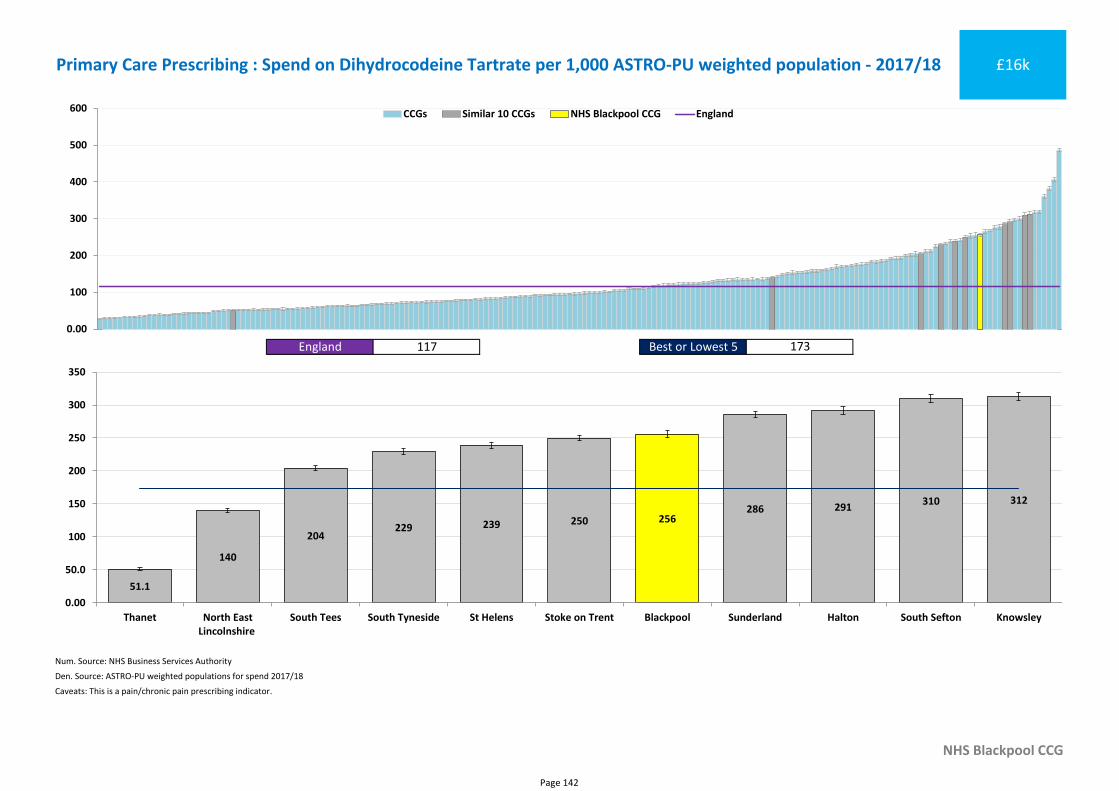
Num. Source: NHS Business Services Authority
Den. Source: ASTRO-PU weighted populations for spend 2017/18
NHS Blackpool CCG
Caveats: This is a pain/chronic pain prescribing indicator.
Primary Care Prescribing : Spend on Dihydrocodeine Tartrate per 1,000 ASTRO-PU weighted population - 2017/18 £16k
England 117 Best or Lowest 5 173
0.00
100
200
300
400
500
600 CCGs Similar 10 CCGs NHS Blackpool CCG England
256
51.1
140
204229 239 250
286 291310 312
0.00
50.0
100
150
200
250
300
350
Thanet North EastLincolnshire
South Tees South Tyneside St Helens Stoke on Trent Blackpool Sunderland Halton South Sefton Knowsley
Page 142
Section 2b - Primary Care
• Primary Care Prescribing Items
Page 143
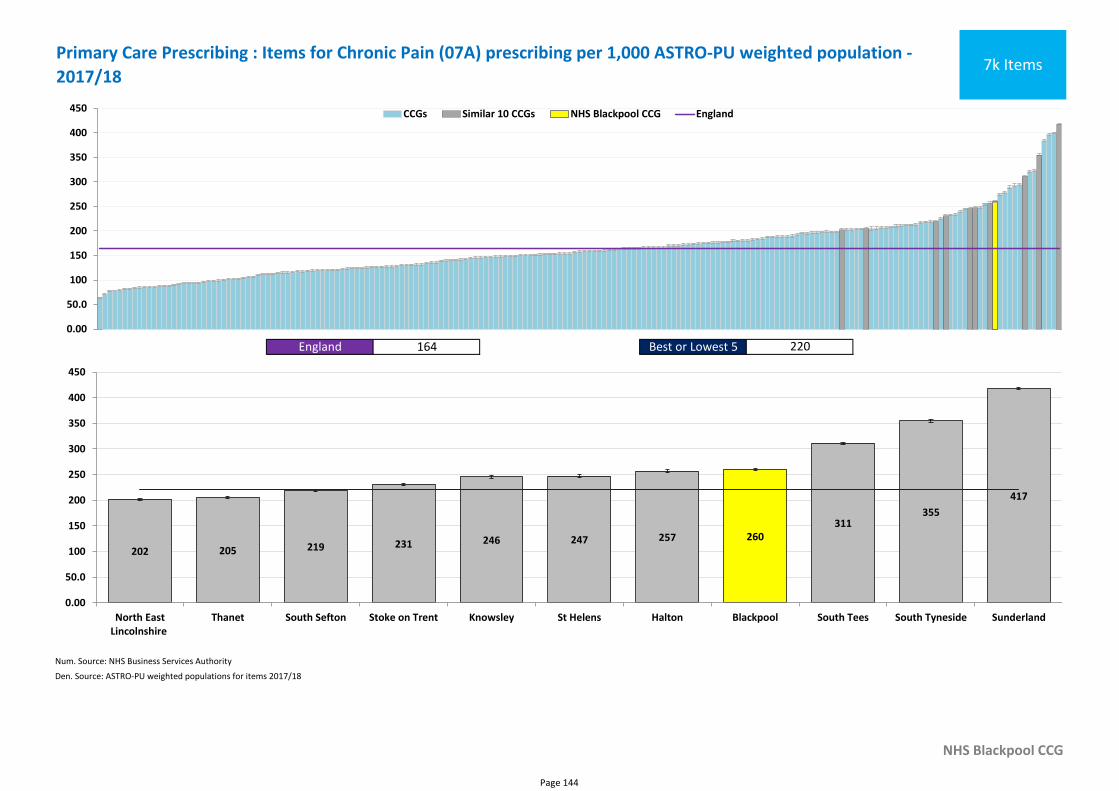
Num. Source: NHS Business Services Authority
Den. Source: ASTRO-PU weighted populations for items 2017/18
NHS Blackpool CCG
Primary Care Prescribing : Items for Chronic Pain (07A) prescribing per 1,000 ASTRO-PU weighted population -
2017/187k Items
England 164 Best or Lowest 5 220
0.00
50.0
100
150
200
250
300
350
400
450 CCGs Similar 10 CCGs NHS Blackpool CCG England
260
202 205 219 231 246 247 257311
355
417
0.00
50.0
100
150
200
250
300
350
400
450
North EastLincolnshire
Thanet South Sefton Stoke on Trent Knowsley St Helens Halton Blackpool South Tees South Tyneside Sunderland
Page 144
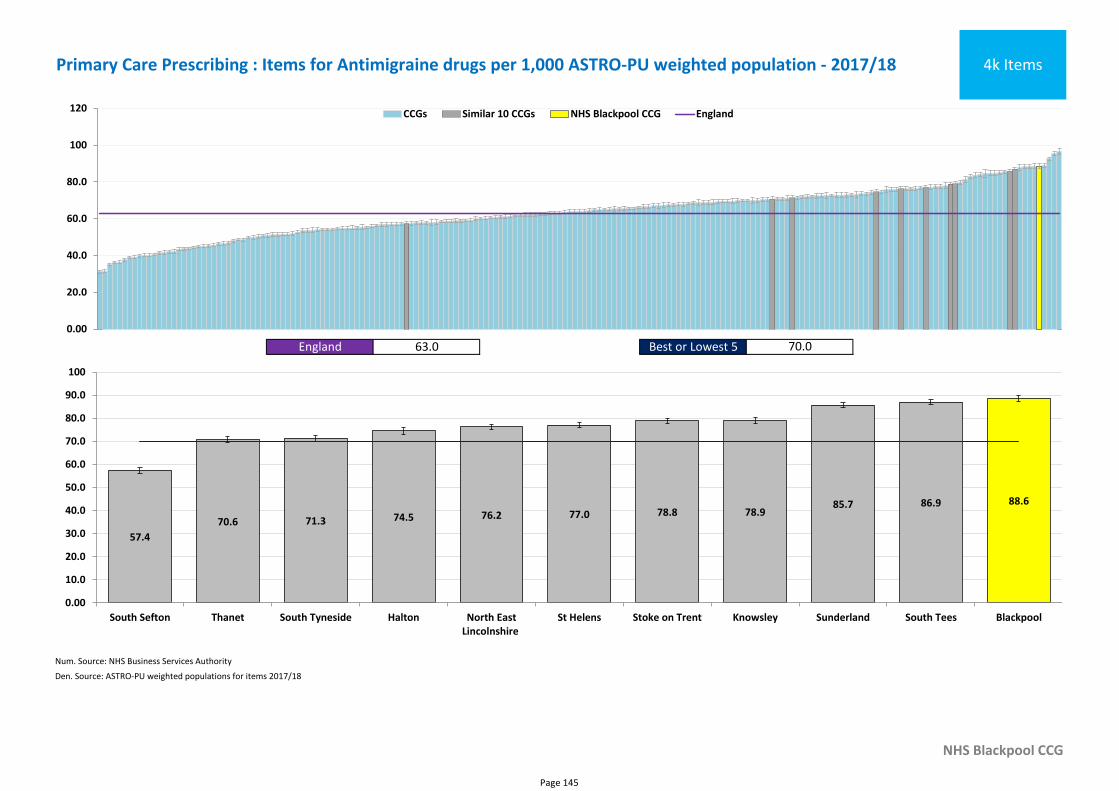
Num. Source: NHS Business Services Authority
Den. Source: ASTRO-PU weighted populations for items 2017/18
NHS Blackpool CCG
Primary Care Prescribing : Items for Antimigraine drugs per 1,000 ASTRO-PU weighted population - 2017/18 4k Items
England 63.0 Best or Lowest 5 70.0
0.00
20.0
40.0
60.0
80.0
100
120 CCGs Similar 10 CCGs NHS Blackpool CCG England
88.6
57.4
70.6 71.3 74.5 76.2 77.0 78.8 78.985.7 86.9
0.00
10.0
20.0
30.0
40.0
50.0
60.0
70.0
80.0
90.0
100
South Sefton Thanet South Tyneside Halton North EastLincolnshire
St Helens Stoke on Trent Knowsley Sunderland South Tees Blackpool
Page 145
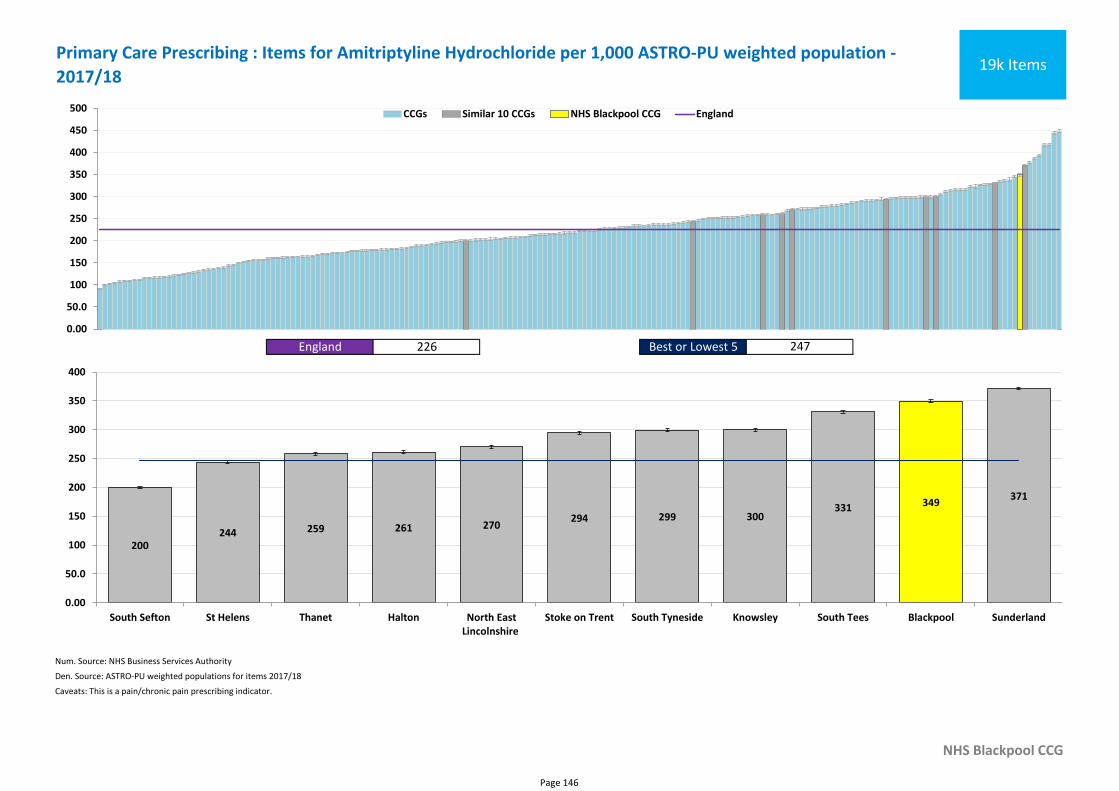
Num. Source: NHS Business Services Authority
Den. Source: ASTRO-PU weighted populations for items 2017/18
NHS Blackpool CCG
Caveats: This is a pain/chronic pain prescribing indicator.
Primary Care Prescribing : Items for Amitriptyline Hydrochloride per 1,000 ASTRO-PU weighted population -
2017/1819k Items
England 226 Best or Lowest 5 247
0.00
50.0
100
150
200
250
300
350
400
450
500 CCGs Similar 10 CCGs NHS Blackpool CCG England
349
200244 259 261 270
294 299 300331
371
0.00
50.0
100
150
200
250
300
350
400
South Sefton St Helens Thanet Halton North EastLincolnshire
Stoke on Trent South Tyneside Knowsley South Tees Blackpool Sunderland
Page 146
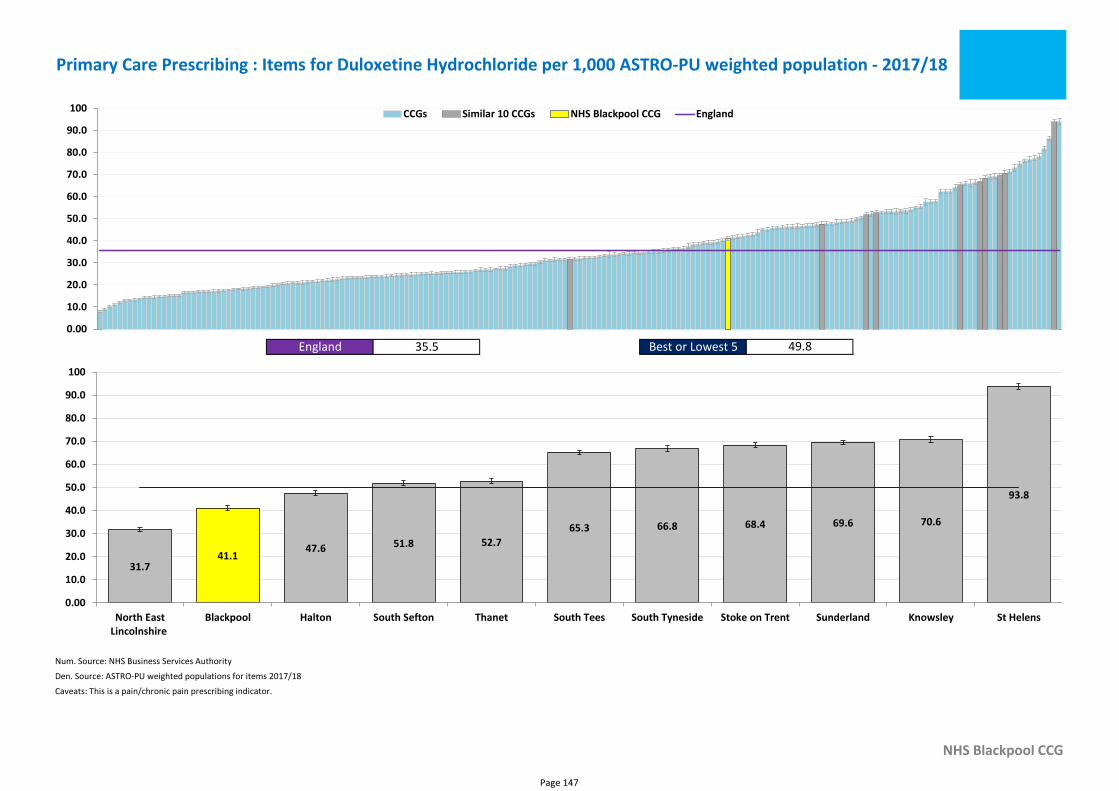
Num. Source: NHS Business Services Authority
Den. Source: ASTRO-PU weighted populations for items 2017/18
NHS Blackpool CCG
Caveats: This is a pain/chronic pain prescribing indicator.
Primary Care Prescribing : Items for Duloxetine Hydrochloride per 1,000 ASTRO-PU weighted population - 2017/18
England 35.5 Best or Lowest 5 49.8
0.00
10.0
20.0
30.0
40.0
50.0
60.0
70.0
80.0
90.0
100 CCGs Similar 10 CCGs NHS Blackpool CCG England
41.131.7
47.6 51.8 52.7
65.3 66.8 68.4 69.6 70.6
93.8
0.00
10.0
20.0
30.0
40.0
50.0
60.0
70.0
80.0
90.0
100
North EastLincolnshire
Blackpool Halton South Sefton Thanet South Tees South Tyneside Stoke on Trent Sunderland Knowsley St Helens
Page 147
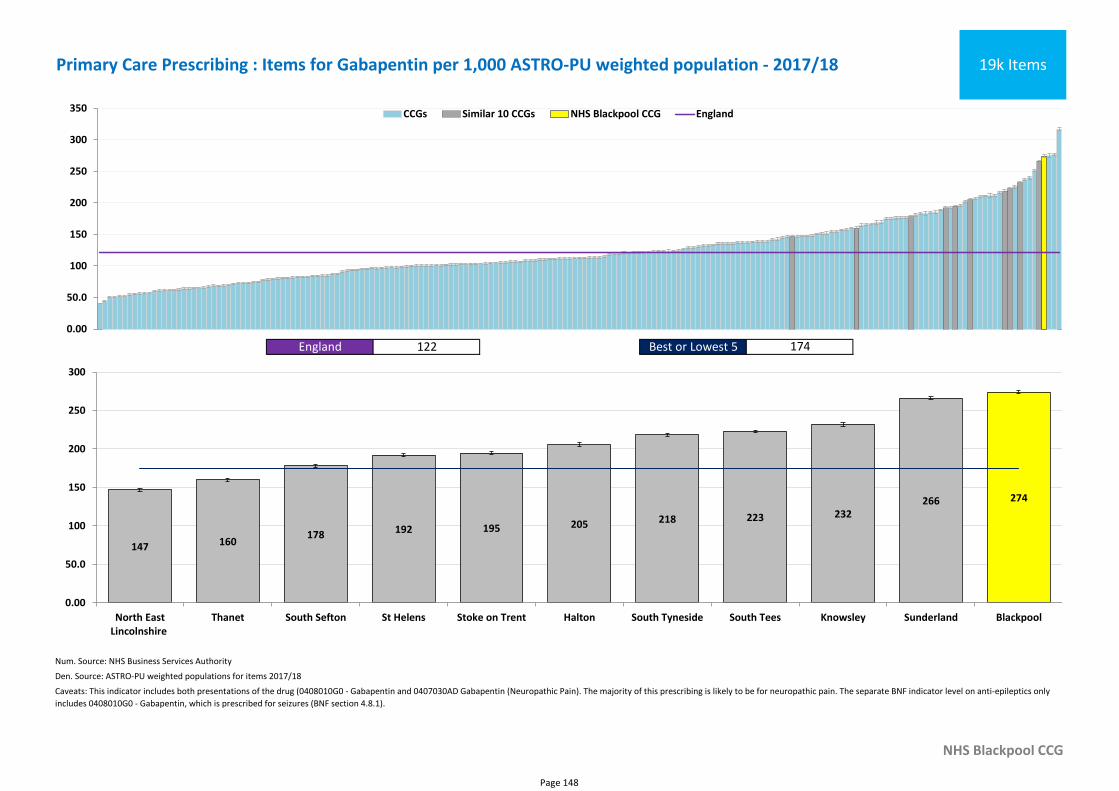
Num. Source: NHS Business Services Authority
Den. Source: ASTRO-PU weighted populations for items 2017/18
NHS Blackpool CCG
Caveats: This indicator includes both presentations of the drug (0408010G0 - Gabapentin and 0407030AD Gabapentin (Neuropathic Pain). The majority of this prescribing is likely to be for neuropathic pain. The separate BNF indicator level on anti-epileptics only
includes 0408010G0 - Gabapentin, which is prescribed for seizures (BNF section 4.8.1).
Primary Care Prescribing : Items for Gabapentin per 1,000 ASTRO-PU weighted population - 2017/18 19k Items
England 122 Best or Lowest 5 174
0.00
50.0
100
150
200
250
300
350 CCGs Similar 10 CCGs NHS Blackpool CCG England
274
147 160178 192 195 205 218 223 232
266
0.00
50.0
100
150
200
250
300
North EastLincolnshire
Thanet South Sefton St Helens Stoke on Trent Halton South Tyneside South Tees Knowsley Sunderland Blackpool
Page 148
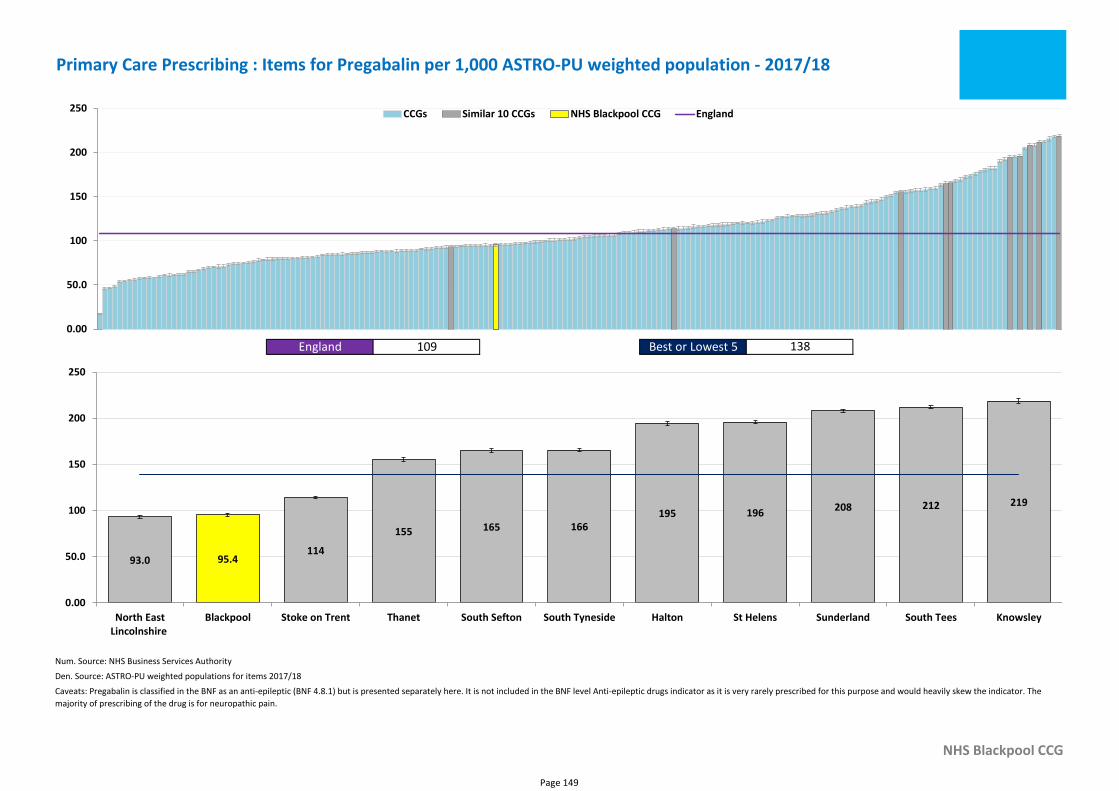
Num. Source: NHS Business Services Authority
Den. Source: ASTRO-PU weighted populations for items 2017/18
NHS Blackpool CCG
Caveats: Pregabalin is classified in the BNF as an anti-epileptic (BNF 4.8.1) but is presented separately here. It is not included in the BNF level Anti-epileptic drugs indicator as it is very rarely prescribed for this purpose and would heavily skew the indicator. The
majority of prescribing of the drug is for neuropathic pain.
Primary Care Prescribing : Items for Pregabalin per 1,000 ASTRO-PU weighted population - 2017/18
England 109 Best or Lowest 5 138
0.00
50.0
100
150
200
250 CCGs Similar 10 CCGs NHS Blackpool CCG England
95.493.0114
155 165 166195 196
208 212 219
0.00
50.0
100
150
200
250
North EastLincolnshire
Blackpool Stoke on Trent Thanet South Sefton South Tyneside Halton St Helens Sunderland South Tees Knowsley
Page 149
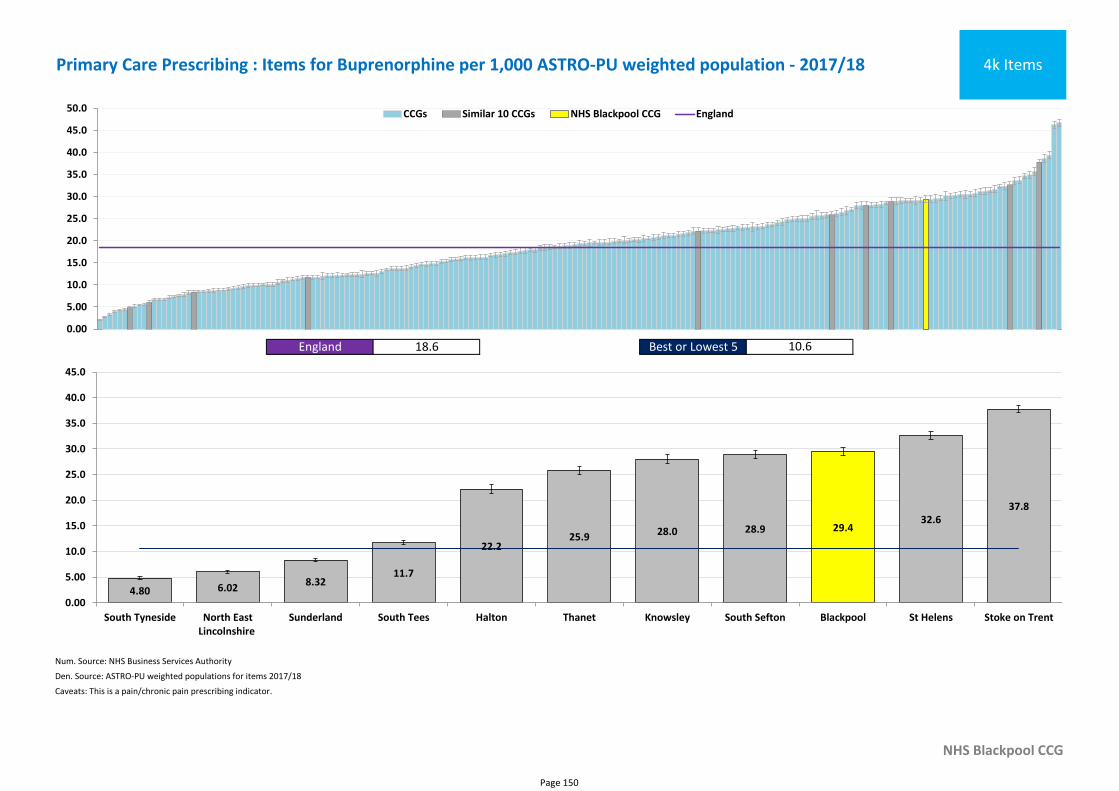
Num. Source: NHS Business Services Authority
Den. Source: ASTRO-PU weighted populations for items 2017/18
NHS Blackpool CCG
Caveats: This is a pain/chronic pain prescribing indicator.
Primary Care Prescribing : Items for Buprenorphine per 1,000 ASTRO-PU weighted population - 2017/18 4k Items
England 18.6 Best or Lowest 5 10.6
0.00
5.00
10.0
15.0
20.0
25.0
30.0
35.0
40.0
45.0
50.0 CCGs Similar 10 CCGs NHS Blackpool CCG England
29.4
4.80 6.028.32
11.7
22.225.9 28.0 28.9
32.637.8
0.00
5.00
10.0
15.0
20.0
25.0
30.0
35.0
40.0
45.0
South Tyneside North EastLincolnshire
Sunderland South Tees Halton Thanet Knowsley South Sefton Blackpool St Helens Stoke on Trent
Page 150
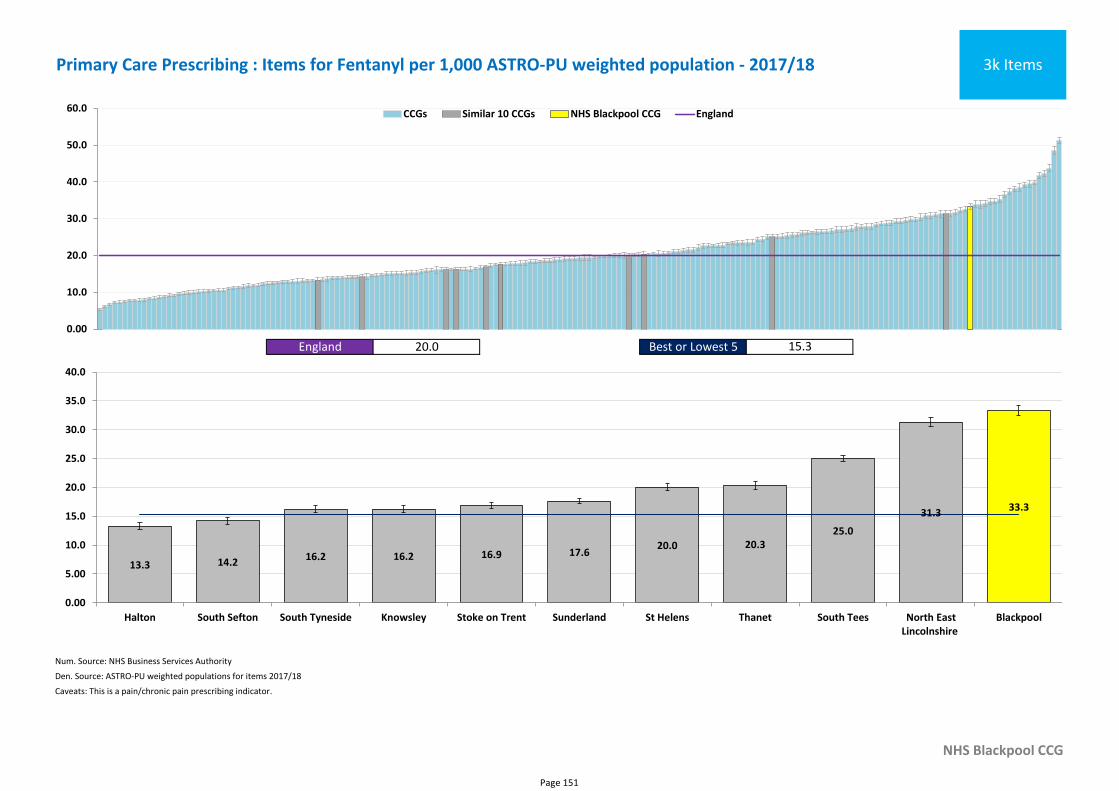
Num. Source: NHS Business Services Authority
Den. Source: ASTRO-PU weighted populations for items 2017/18
NHS Blackpool CCG
Caveats: This is a pain/chronic pain prescribing indicator.
Primary Care Prescribing : Items for Fentanyl per 1,000 ASTRO-PU weighted population - 2017/18 3k Items
England 20.0 Best or Lowest 5 15.3
0.00
10.0
20.0
30.0
40.0
50.0
60.0 CCGs Similar 10 CCGs NHS Blackpool CCG England
33.3
13.3 14.216.2 16.2 16.9 17.6
20.0 20.325.0
31.3
0.00
5.00
10.0
15.0
20.0
25.0
30.0
35.0
40.0
Halton South Sefton South Tyneside Knowsley Stoke on Trent Sunderland St Helens Thanet South Tees North EastLincolnshire
Blackpool
Page 151
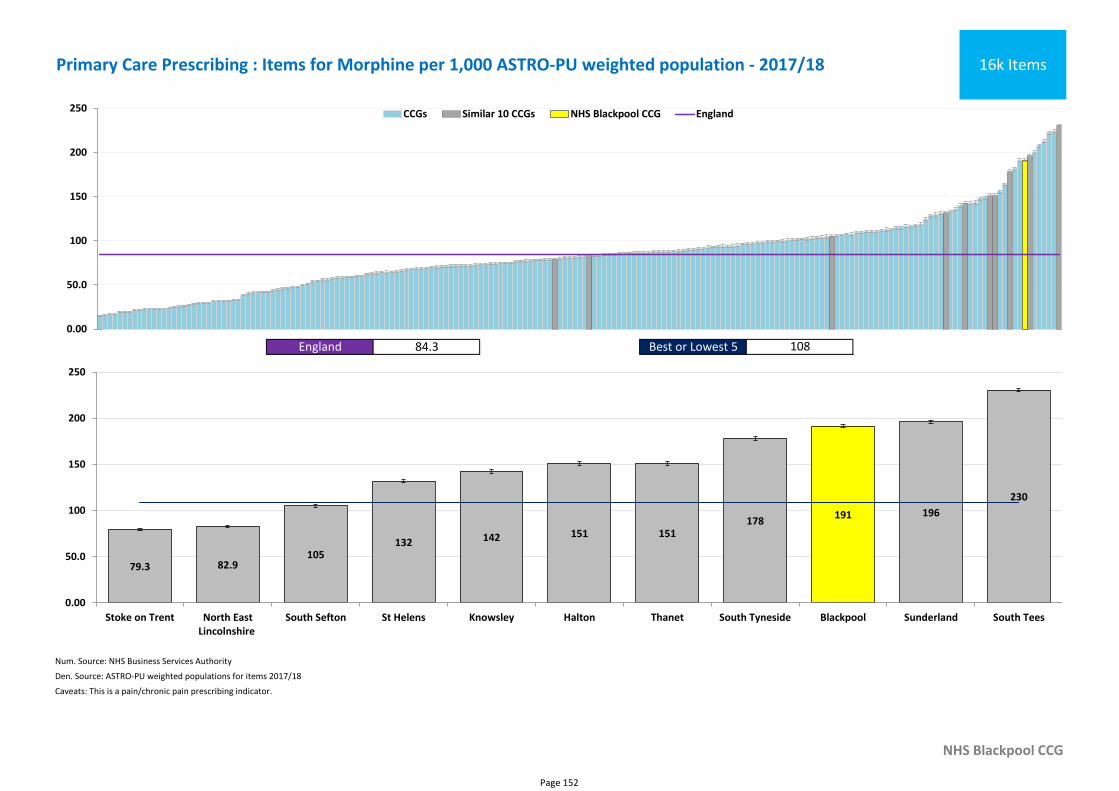
Num. Source: NHS Business Services Authority
Den. Source: ASTRO-PU weighted populations for items 2017/18
NHS Blackpool CCG
Caveats: This is a pain/chronic pain prescribing indicator.
Primary Care Prescribing : Items for Morphine per 1,000 ASTRO-PU weighted population - 2017/18 16k Items
England 84.3 Best or Lowest 5 108
0.00
50.0
100
150
200
250 CCGs Similar 10 CCGs NHS Blackpool CCG England
191
79.3 82.9105
132 142 151 151178
196
230
0.00
50.0
100
150
200
250
Stoke on Trent North EastLincolnshire
South Sefton St Helens Knowsley Halton Thanet South Tyneside Blackpool Sunderland South Tees
Page 152
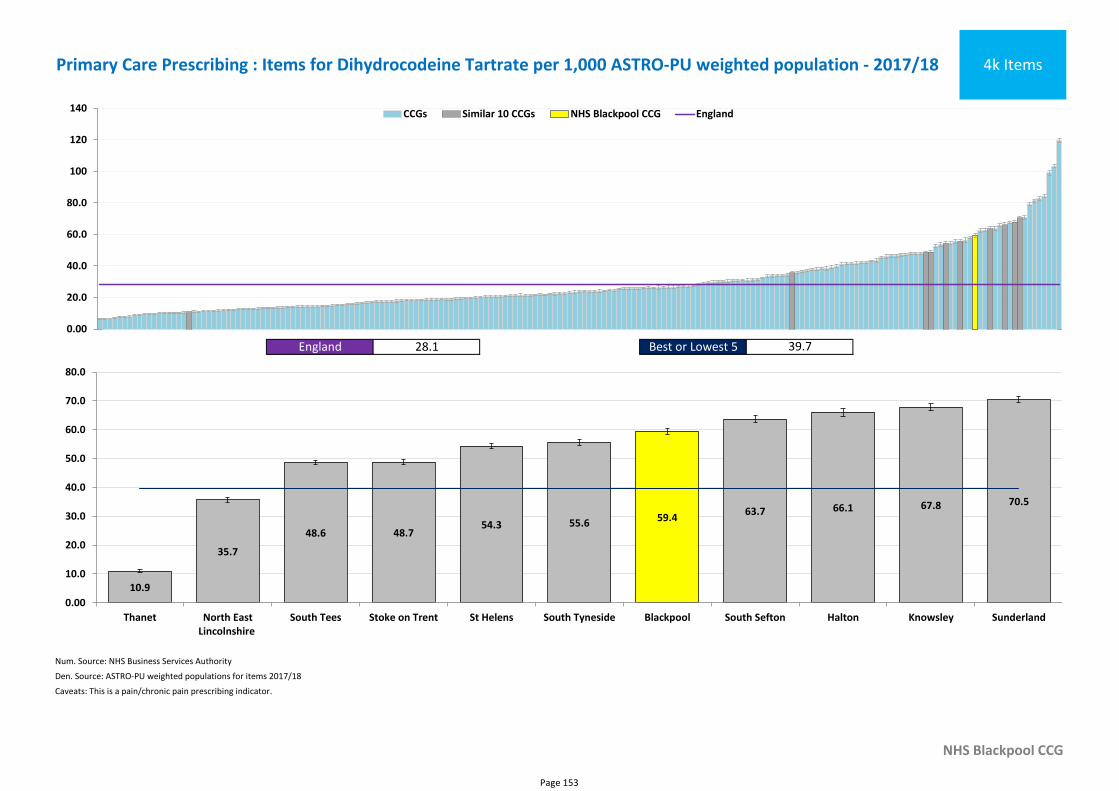
Num. Source: NHS Business Services Authority
Den. Source: ASTRO-PU weighted populations for items 2017/18
NHS Blackpool CCG
Caveats: This is a pain/chronic pain prescribing indicator.
Primary Care Prescribing : Items for Dihydrocodeine Tartrate per 1,000 ASTRO-PU weighted population - 2017/18 4k Items
England 28.1 Best or Lowest 5 39.7
0.00
20.0
40.0
60.0
80.0
100
120
140 CCGs Similar 10 CCGs NHS Blackpool CCG England
59.4
10.9
35.7
48.6 48.754.3 55.6
63.7 66.1 67.8 70.5
0.00
10.0
20.0
30.0
40.0
50.0
60.0
70.0
80.0
Thanet North EastLincolnshire
South Tees Stoke on Trent St Helens South Tyneside Blackpool South Sefton Halton Knowsley Sunderland
Page 153
Section 3a - Secondary Care• Inpatient spend
• Percentage of all admissions which are day case
• Average annual rate of admissions
• Percentage of admissions where the main consultant is a
Neurologist/Neurosurgeon
• Admissions which are short stays
Page 154
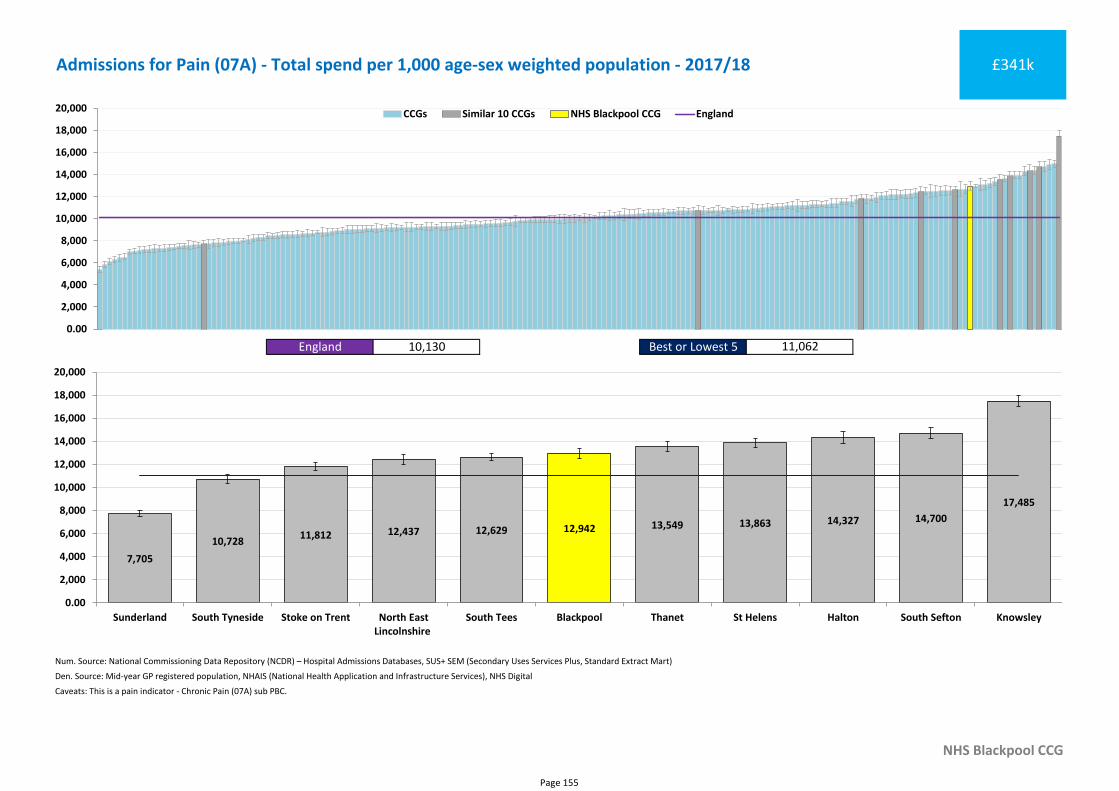
Num. Source: National Commissioning Data Repository (NCDR) – Hospital Admissions Databases, SUS+ SEM (Secondary Uses Services Plus, Standard Extract Mart)
Den. Source: Mid-year GP registered population, NHAIS (National Health Application and Infrastructure Services), NHS Digital
NHS Blackpool CCG
Caveats: This is a pain indicator - Chronic Pain (07A) sub PBC.
Admissions for Pain (07A) - Total spend per 1,000 age-sex weighted population - 2017/18 £341k
England 10,130 Best or Lowest 5 11,062
0.00
2,000
4,000
6,000
8,000
10,000
12,000
14,000
16,000
18,000
20,000 CCGs Similar 10 CCGs NHS Blackpool CCG England
12,942
7,705
10,72811,812 12,437 12,629 13,549 13,863 14,327 14,700
17,485
0.00
2,000
4,000
6,000
8,000
10,000
12,000
14,000
16,000
18,000
20,000
Sunderland South Tyneside Stoke on Trent North EastLincolnshire
South Tees Blackpool Thanet St Helens Halton South Sefton Knowsley
Page 155
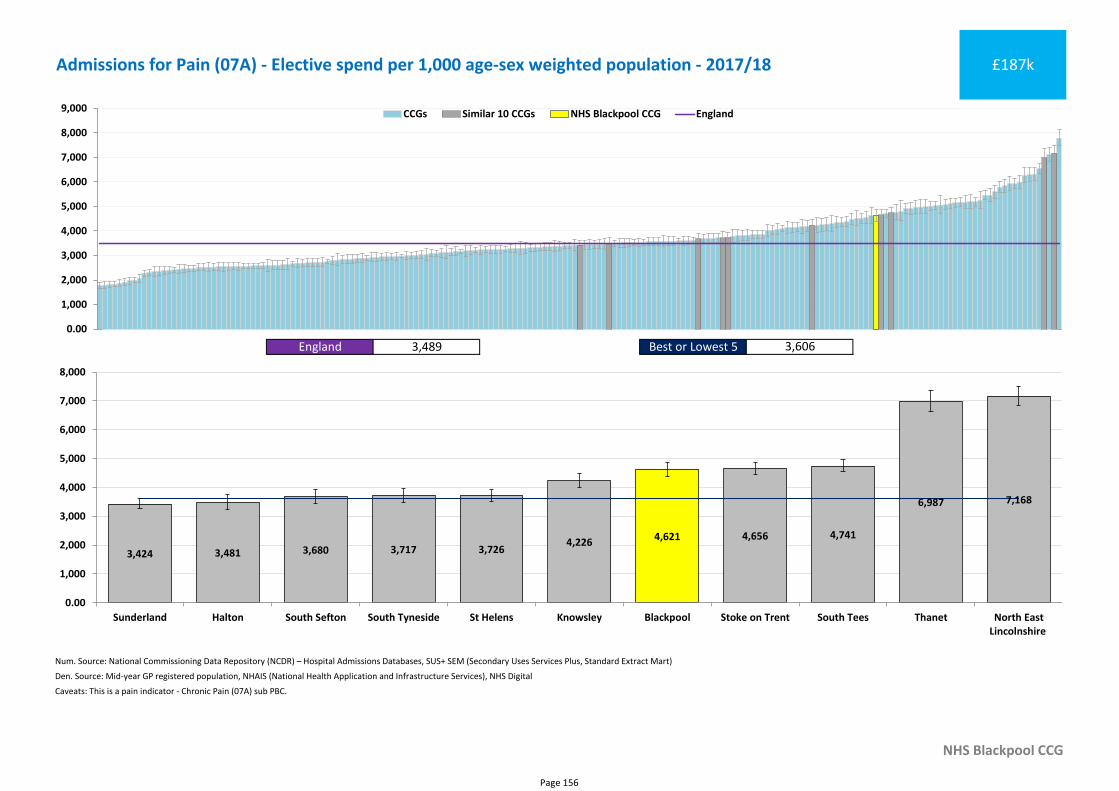
Num. Source: National Commissioning Data Repository (NCDR) – Hospital Admissions Databases, SUS+ SEM (Secondary Uses Services Plus, Standard Extract Mart)
Den. Source: Mid-year GP registered population, NHAIS (National Health Application and Infrastructure Services), NHS Digital
NHS Blackpool CCG
Caveats: This is a pain indicator - Chronic Pain (07A) sub PBC.
Admissions for Pain (07A) - Elective spend per 1,000 age-sex weighted population - 2017/18 £187k
England 3,489 Best or Lowest 5 3,606
0.00
1,000
2,000
3,000
4,000
5,000
6,000
7,000
8,000
9,000 CCGs Similar 10 CCGs NHS Blackpool CCG England
4,621
3,424 3,481 3,680 3,717 3,7264,226
4,656 4,741
6,987 7,168
0.00
1,000
2,000
3,000
4,000
5,000
6,000
7,000
8,000
Sunderland Halton South Sefton South Tyneside St Helens Knowsley Blackpool Stoke on Trent South Tees Thanet North EastLincolnshire
Page 156
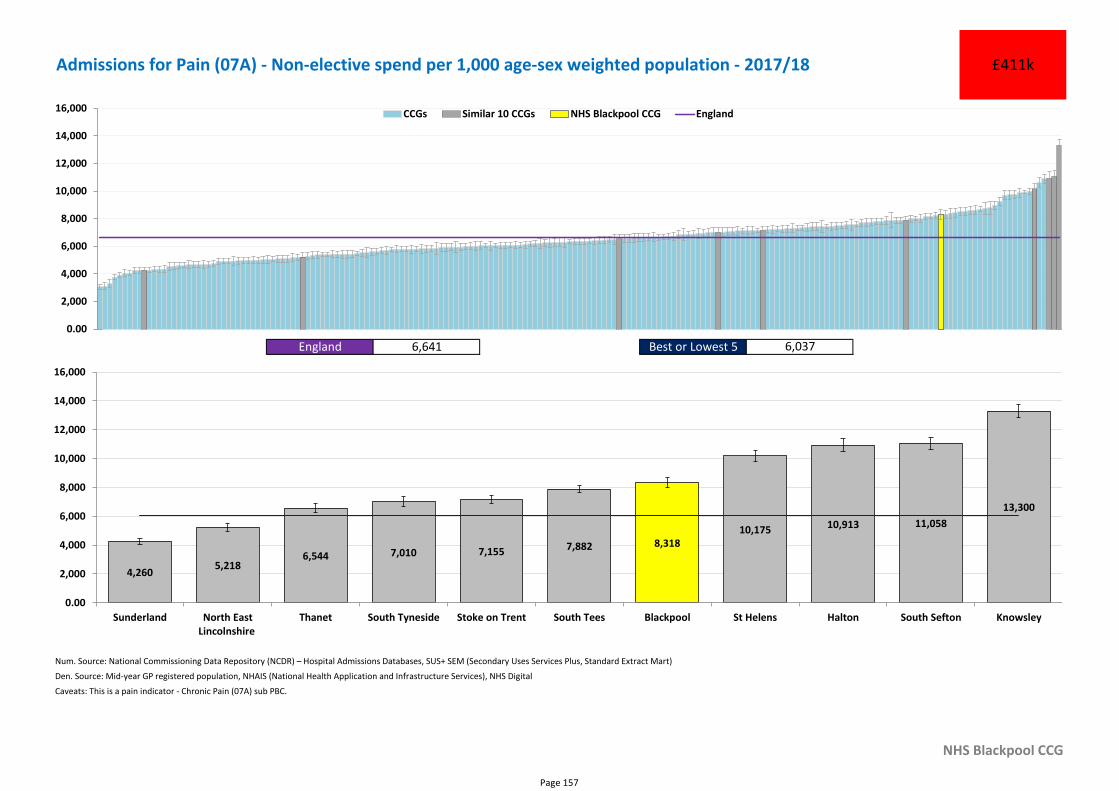
Num. Source: National Commissioning Data Repository (NCDR) – Hospital Admissions Databases, SUS+ SEM (Secondary Uses Services Plus, Standard Extract Mart)
Den. Source: Mid-year GP registered population, NHAIS (National Health Application and Infrastructure Services), NHS Digital
NHS Blackpool CCG
Caveats: This is a pain indicator - Chronic Pain (07A) sub PBC.
Admissions for Pain (07A) - Non-elective spend per 1,000 age-sex weighted population - 2017/18 £411k
England 6,641 Best or Lowest 5 6,037
0.00
2,000
4,000
6,000
8,000
10,000
12,000
14,000
16,000 CCGs Similar 10 CCGs NHS Blackpool CCG England
8,318
4,2605,218
6,544 7,010 7,155 7,882
10,175 10,913 11,058
13,300
0.00
2,000
4,000
6,000
8,000
10,000
12,000
14,000
16,000
Sunderland North EastLincolnshire
Thanet South Tyneside Stoke on Trent South Tees Blackpool St Helens Halton South Sefton Knowsley
Page 157
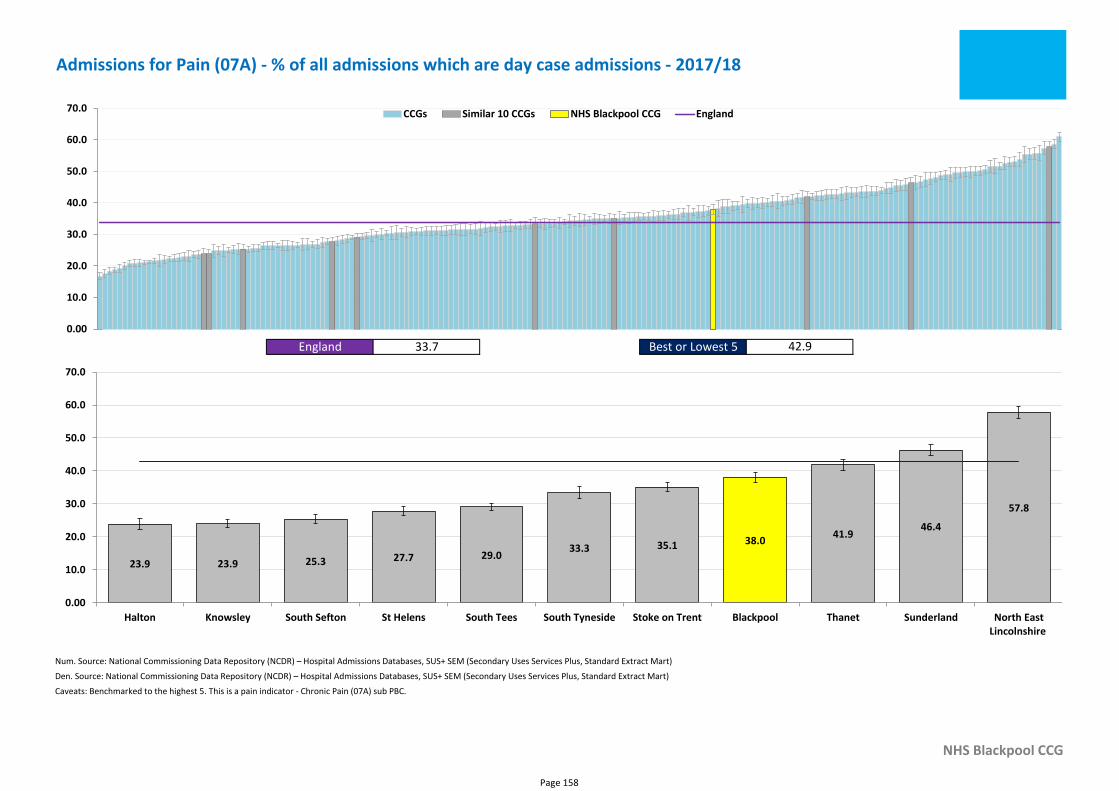
Num. Source: National Commissioning Data Repository (NCDR) – Hospital Admissions Databases, SUS+ SEM (Secondary Uses Services Plus, Standard Extract Mart)
Den. Source: National Commissioning Data Repository (NCDR) – Hospital Admissions Databases, SUS+ SEM (Secondary Uses Services Plus, Standard Extract Mart)
NHS Blackpool CCG
Caveats: Benchmarked to the highest 5. This is a pain indicator - Chronic Pain (07A) sub PBC.
Admissions for Pain (07A) - % of all admissions which are day case admissions - 2017/18
England 33.7 Best or Lowest 5 42.9
0.00
10.0
20.0
30.0
40.0
50.0
60.0
70.0 CCGs Similar 10 CCGs NHS Blackpool CCG England
38.0
23.9 23.9 25.3 27.7 29.033.3 35.1
41.946.4
57.8
0.00
10.0
20.0
30.0
40.0
50.0
60.0
70.0
Halton Knowsley South Sefton St Helens South Tees South Tyneside Stoke on Trent Blackpool Thanet Sunderland North EastLincolnshire
Page 158
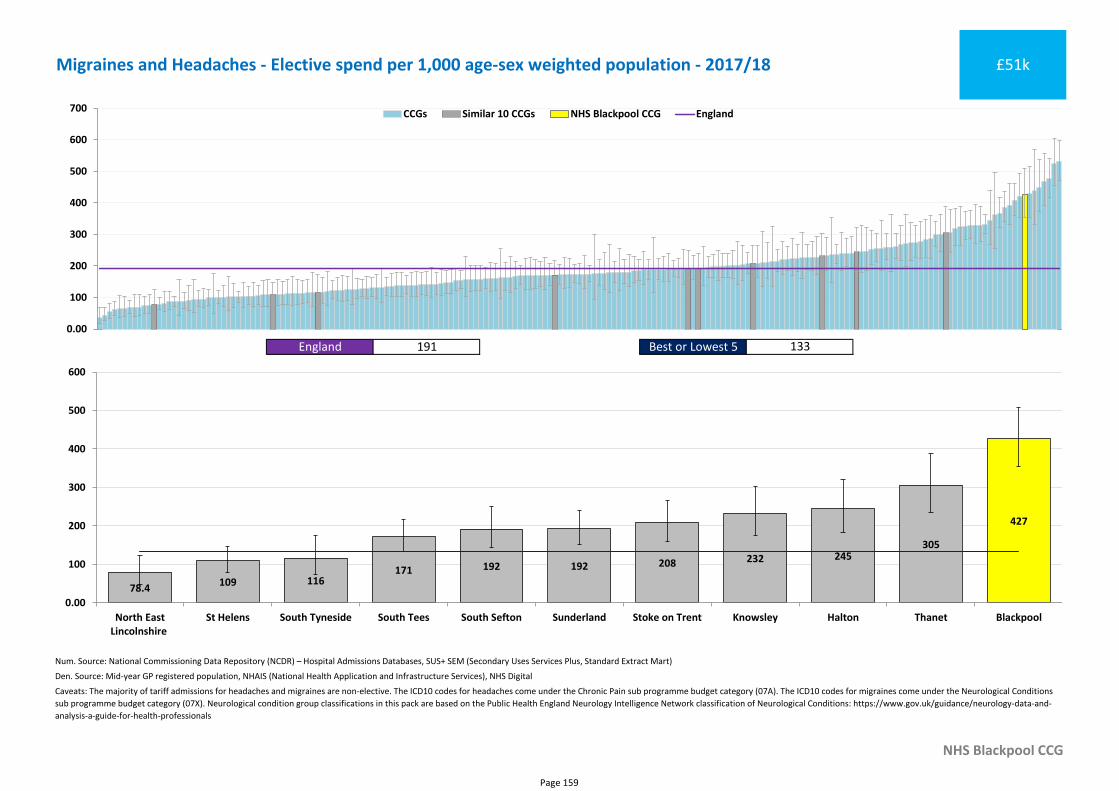
Num. Source: National Commissioning Data Repository (NCDR) – Hospital Admissions Databases, SUS+ SEM (Secondary Uses Services Plus, Standard Extract Mart)
Den. Source: Mid-year GP registered population, NHAIS (National Health Application and Infrastructure Services), NHS Digital
NHS Blackpool CCG
Caveats: The majority of tariff admissions for headaches and migraines are non-elective. The ICD10 codes for headaches come under the Chronic Pain sub programme budget category (07A). The ICD10 codes for migraines come under the Neurological Conditions
sub programme budget category (07X). Neurological condition group classifications in this pack are based on the Public Health England Neurology Intelligence Network classification of Neurological Conditions: https://www.gov.uk/guidance/neurology-data-and-
analysis-a-guide-for-health-professionals
Migraines and Headaches - Elective spend per 1,000 age-sex weighted population - 2017/18 £51k
England 191 Best or Lowest 5 133
0.00
100
200
300
400
500
600
700 CCGs Similar 10 CCGs NHS Blackpool CCG England
427
78.4109 116
171 192 192 208 232 245305
0.00
100
200
300
400
500
600
North EastLincolnshire
St Helens South Tyneside South Tees South Sefton Sunderland Stoke on Trent Knowsley Halton Thanet Blackpool
Page 159
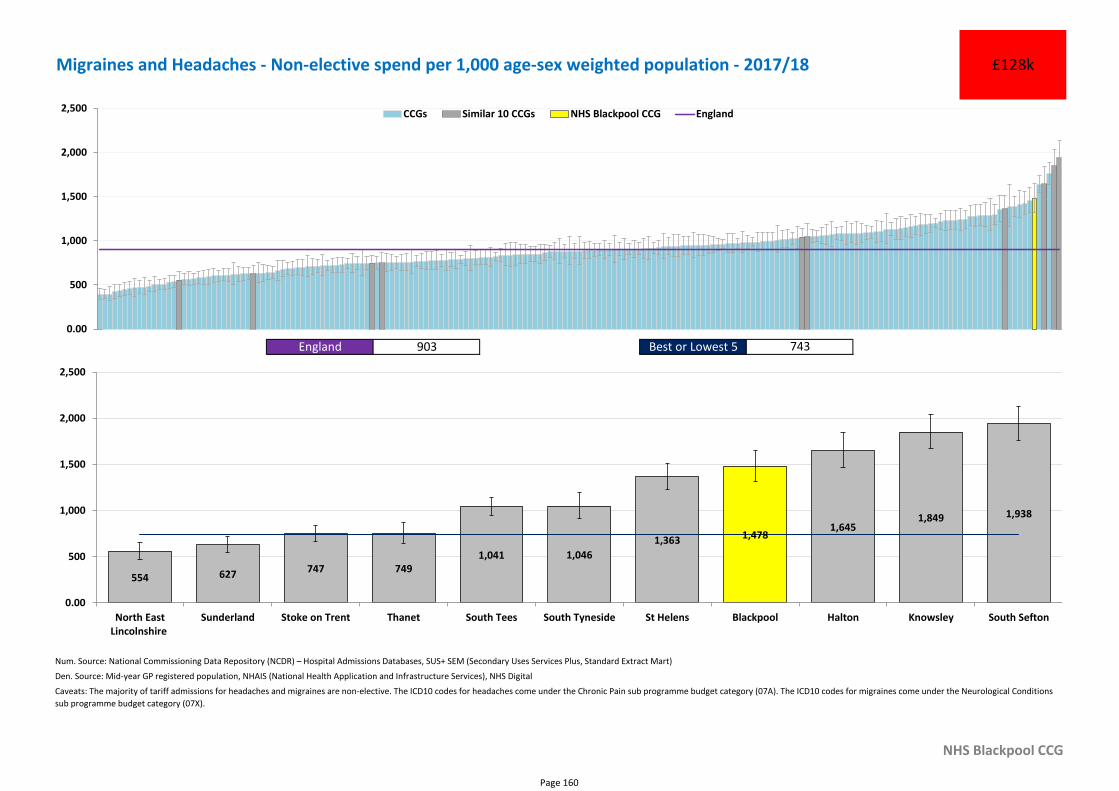
Num. Source: National Commissioning Data Repository (NCDR) – Hospital Admissions Databases, SUS+ SEM (Secondary Uses Services Plus, Standard Extract Mart)
Den. Source: Mid-year GP registered population, NHAIS (National Health Application and Infrastructure Services), NHS Digital
NHS Blackpool CCG
Caveats: The majority of tariff admissions for headaches and migraines are non-elective. The ICD10 codes for headaches come under the Chronic Pain sub programme budget category (07A). The ICD10 codes for migraines come under the Neurological Conditions
sub programme budget category (07X).
Migraines and Headaches - Non-elective spend per 1,000 age-sex weighted population - 2017/18 £128k
England 903 Best or Lowest 5 743
0.00
500
1,000
1,500
2,000
2,500 CCGs Similar 10 CCGs NHS Blackpool CCG England
1,478
554 627 747 7491,041 1,046
1,3631,645
1,849 1,938
0.00
500
1,000
1,500
2,000
2,500
North EastLincolnshire
Sunderland Stoke on Trent Thanet South Tees South Tyneside St Helens Blackpool Halton Knowsley South Sefton
Page 160
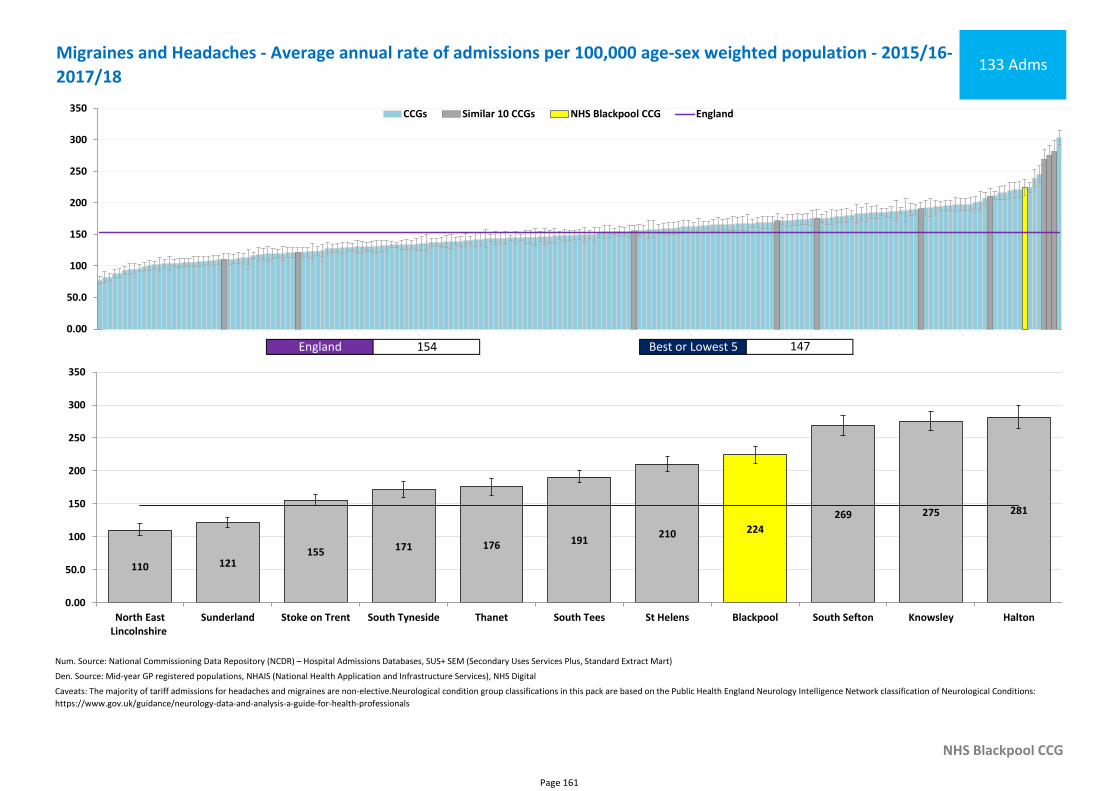
Num. Source: National Commissioning Data Repository (NCDR) – Hospital Admissions Databases, SUS+ SEM (Secondary Uses Services Plus, Standard Extract Mart)
Den. Source: Mid-year GP registered populations, NHAIS (National Health Application and Infrastructure Services), NHS Digital
NHS Blackpool CCG
Caveats: The majority of tariff admissions for headaches and migraines are non-elective.Neurological condition group classifications in this pack are based on the Public Health England Neurology Intelligence Network classification of Neurological Conditions:
https://www.gov.uk/guidance/neurology-data-and-analysis-a-guide-for-health-professionals
Migraines and Headaches - Average annual rate of admissions per 100,000 age-sex weighted population - 2015/16-
2017/18133 Adms
England 154 Best or Lowest 5 147
0.00
50.0
100
150
200
250
300
350 CCGs Similar 10 CCGs NHS Blackpool CCG England
224
110 121155 171 176 191
210
269 275 281
0.00
50.0
100
150
200
250
300
350
North EastLincolnshire
Sunderland Stoke on Trent South Tyneside Thanet South Tees St Helens Blackpool South Sefton Knowsley Halton
Page 161
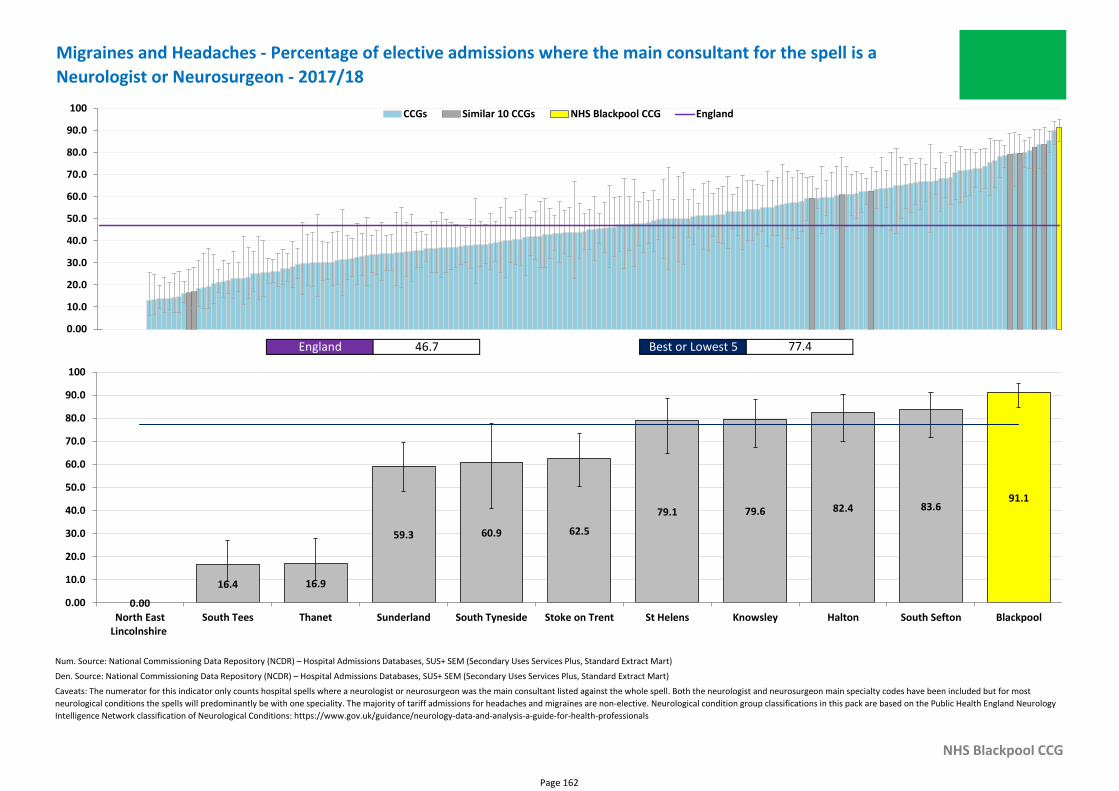
Num. Source: National Commissioning Data Repository (NCDR) – Hospital Admissions Databases, SUS+ SEM (Secondary Uses Services Plus, Standard Extract Mart)
Den. Source: National Commissioning Data Repository (NCDR) – Hospital Admissions Databases, SUS+ SEM (Secondary Uses Services Plus, Standard Extract Mart)
NHS Blackpool CCG
Caveats: The numerator for this indicator only counts hospital spells where a neurologist or neurosurgeon was the main consultant listed against the whole spell. Both the neurologist and neurosurgeon main specialty codes have been included but for most
neurological conditions the spells will predominantly be with one speciality. The majority of tariff admissions for headaches and migraines are non-elective. Neurological condition group classifications in this pack are based on the Public Health England Neurology
Intelligence Network classification of Neurological Conditions: https://www.gov.uk/guidance/neurology-data-and-analysis-a-guide-for-health-professionals
Migraines and Headaches - Percentage of elective admissions where the main consultant for the spell is a
Neurologist or Neurosurgeon - 2017/18
England 46.7 Best or Lowest 5 77.4
0.00
10.0
20.0
30.0
40.0
50.0
60.0
70.0
80.0
90.0
100 CCGs Similar 10 CCGs NHS Blackpool CCG England
91.1
0.00
16.4 16.9
59.3 60.9 62.5
79.1 79.6 82.4 83.6
0.00
10.0
20.0
30.0
40.0
50.0
60.0
70.0
80.0
90.0
100
North EastLincolnshire
South Tees Thanet Sunderland South Tyneside Stoke on Trent St Helens Knowsley Halton South Sefton Blackpool
Page 162
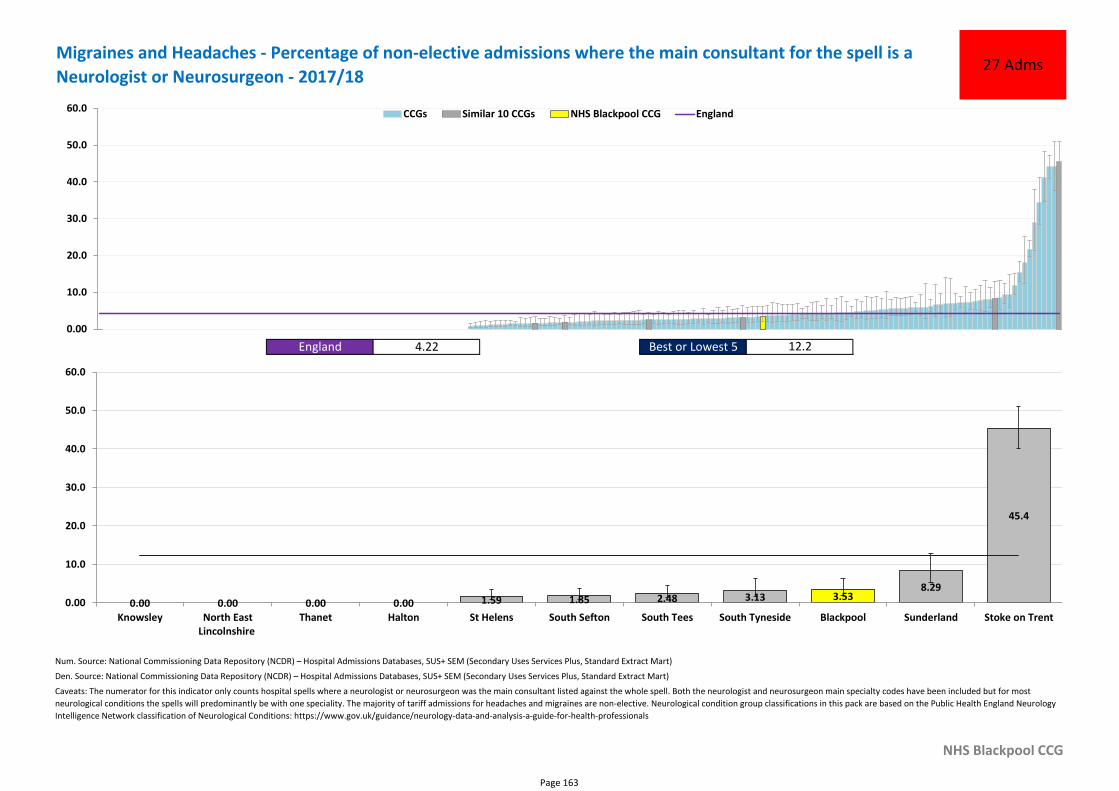
Num. Source: National Commissioning Data Repository (NCDR) – Hospital Admissions Databases, SUS+ SEM (Secondary Uses Services Plus, Standard Extract Mart)
Den. Source: National Commissioning Data Repository (NCDR) – Hospital Admissions Databases, SUS+ SEM (Secondary Uses Services Plus, Standard Extract Mart)
NHS Blackpool CCG
Caveats: The numerator for this indicator only counts hospital spells where a neurologist or neurosurgeon was the main consultant listed against the whole spell. Both the neurologist and neurosurgeon main specialty codes have been included but for most
neurological conditions the spells will predominantly be with one speciality. The majority of tariff admissions for headaches and migraines are non-elective. Neurological condition group classifications in this pack are based on the Public Health England Neurology
Intelligence Network classification of Neurological Conditions: https://www.gov.uk/guidance/neurology-data-and-analysis-a-guide-for-health-professionals
Migraines and Headaches - Percentage of non-elective admissions where the main consultant for the spell is a
Neurologist or Neurosurgeon - 2017/1827 Adms
England 4.22 Best or Lowest 5 12.2
0.00
10.0
20.0
30.0
40.0
50.0
60.0 CCGs Similar 10 CCGs NHS Blackpool CCG England
3.530.00 0.00 0.00 0.00 1.59 1.85 2.48 3.13
8.29
45.4
0.00
10.0
20.0
30.0
40.0
50.0
60.0
Knowsley North EastLincolnshire
Thanet Halton St Helens South Sefton South Tees South Tyneside Blackpool Sunderland Stoke on Trent
Page 163
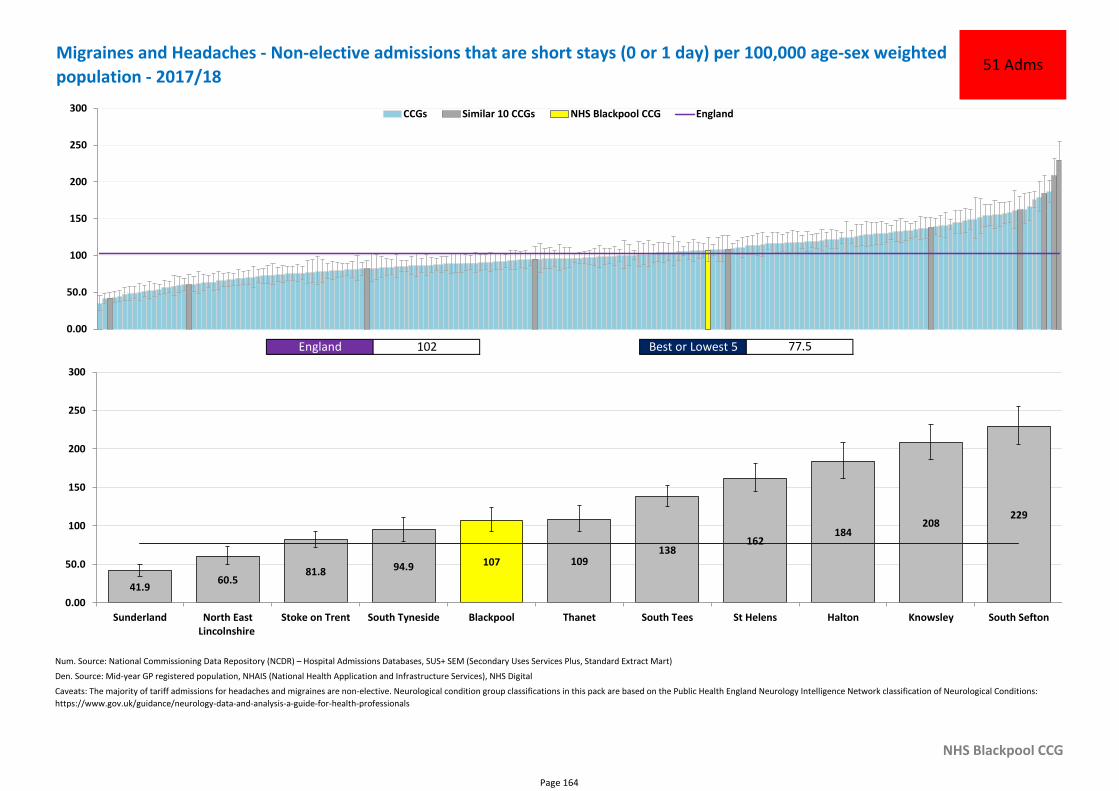
Num. Source: National Commissioning Data Repository (NCDR) – Hospital Admissions Databases, SUS+ SEM (Secondary Uses Services Plus, Standard Extract Mart)
Den. Source: Mid-year GP registered population, NHAIS (National Health Application and Infrastructure Services), NHS Digital
NHS Blackpool CCG
Caveats: The majority of tariff admissions for headaches and migraines are non-elective. Neurological condition group classifications in this pack are based on the Public Health England Neurology Intelligence Network classification of Neurological Conditions:
https://www.gov.uk/guidance/neurology-data-and-analysis-a-guide-for-health-professionals
Migraines and Headaches - Non-elective admissions that are short stays (0 or 1 day) per 100,000 age-sex weighted
population - 2017/1851 Adms
England 102 Best or Lowest 5 77.5
0.00
50.0
100
150
200
250
300 CCGs Similar 10 CCGs NHS Blackpool CCG England
107
41.960.5
81.8 94.9 109138
162184
208229
0.00
50.0
100
150
200
250
300
Sunderland North EastLincolnshire
Stoke on Trent South Tyneside Blackpool Thanet South Tees St Helens Halton Knowsley South Sefton
Page 164
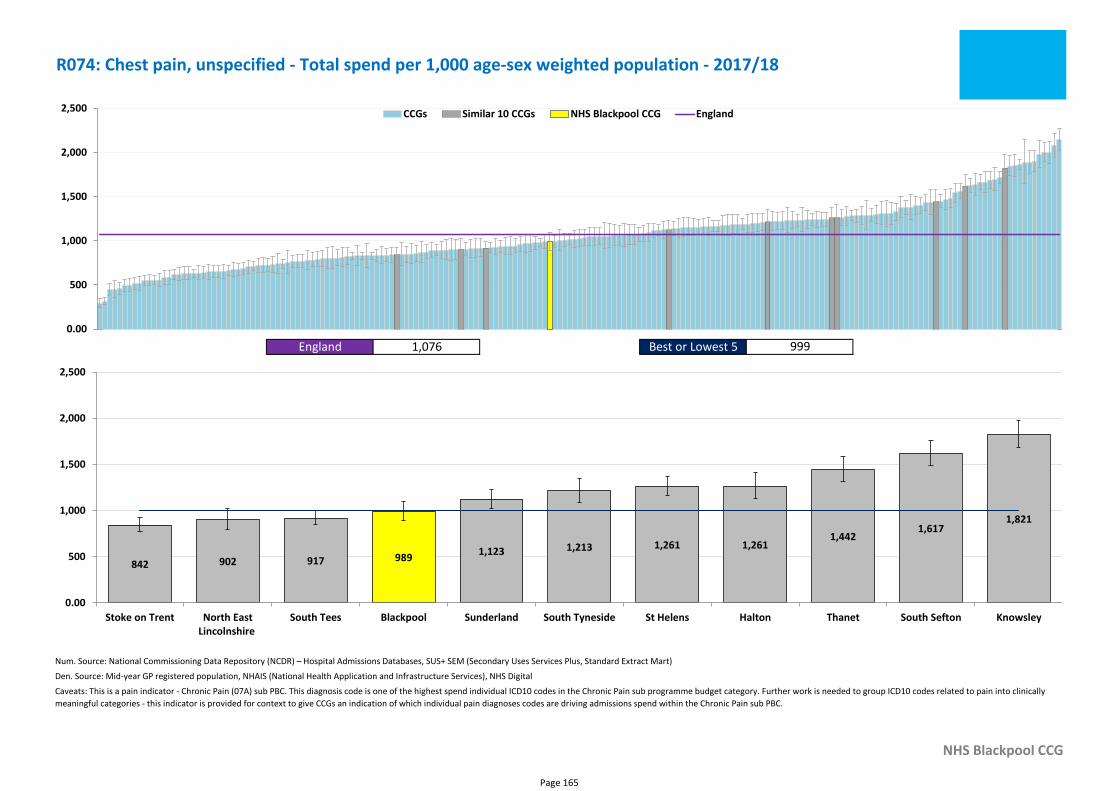
Num. Source: National Commissioning Data Repository (NCDR) – Hospital Admissions Databases, SUS+ SEM (Secondary Uses Services Plus, Standard Extract Mart)
Den. Source: Mid-year GP registered population, NHAIS (National Health Application and Infrastructure Services), NHS Digital
NHS Blackpool CCG
Caveats: This is a pain indicator - Chronic Pain (07A) sub PBC. This diagnosis code is one of the highest spend individual ICD10 codes in the Chronic Pain sub programme budget category. Further work is needed to group ICD10 codes related to pain into clinically
meaningful categories - this indicator is provided for context to give CCGs an indication of which individual pain diagnoses codes are driving admissions spend within the Chronic Pain sub PBC.
R074: Chest pain, unspecified - Total spend per 1,000 age-sex weighted population - 2017/18
England 1,076 Best or Lowest 5 999
0.00
500
1,000
1,500
2,000
2,500 CCGs Similar 10 CCGs NHS Blackpool CCG England
989842 902 917
1,123 1,213 1,261 1,2611,442
1,6171,821
0.00
500
1,000
1,500
2,000
2,500
Stoke on Trent North EastLincolnshire
South Tees Blackpool Sunderland South Tyneside St Helens Halton Thanet South Sefton Knowsley
Page 165
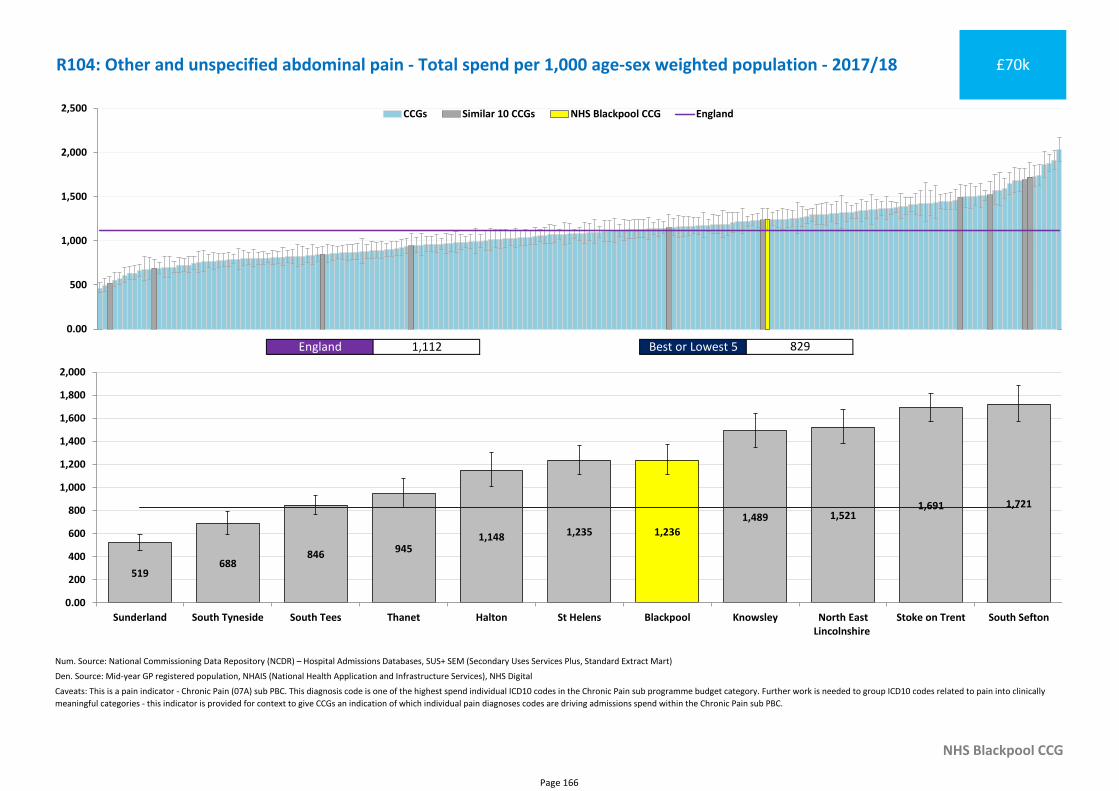
Num. Source: National Commissioning Data Repository (NCDR) – Hospital Admissions Databases, SUS+ SEM (Secondary Uses Services Plus, Standard Extract Mart)
Den. Source: Mid-year GP registered population, NHAIS (National Health Application and Infrastructure Services), NHS Digital
NHS Blackpool CCG
Caveats: This is a pain indicator - Chronic Pain (07A) sub PBC. This diagnosis code is one of the highest spend individual ICD10 codes in the Chronic Pain sub programme budget category. Further work is needed to group ICD10 codes related to pain into clinically
meaningful categories - this indicator is provided for context to give CCGs an indication of which individual pain diagnoses codes are driving admissions spend within the Chronic Pain sub PBC.
R104: Other and unspecified abdominal pain - Total spend per 1,000 age-sex weighted population - 2017/18 £70k
England 1,112 Best or Lowest 5 829
0.00
500
1,000
1,500
2,000
2,500 CCGs Similar 10 CCGs NHS Blackpool CCG England
1,236
519688
846945
1,148 1,235
1,489 1,5211,691 1,721
0.00
200
400
600
800
1,000
1,200
1,400
1,600
1,800
2,000
Sunderland South Tyneside South Tees Thanet Halton St Helens Blackpool Knowsley North EastLincolnshire
Stoke on Trent South Sefton
Page 166
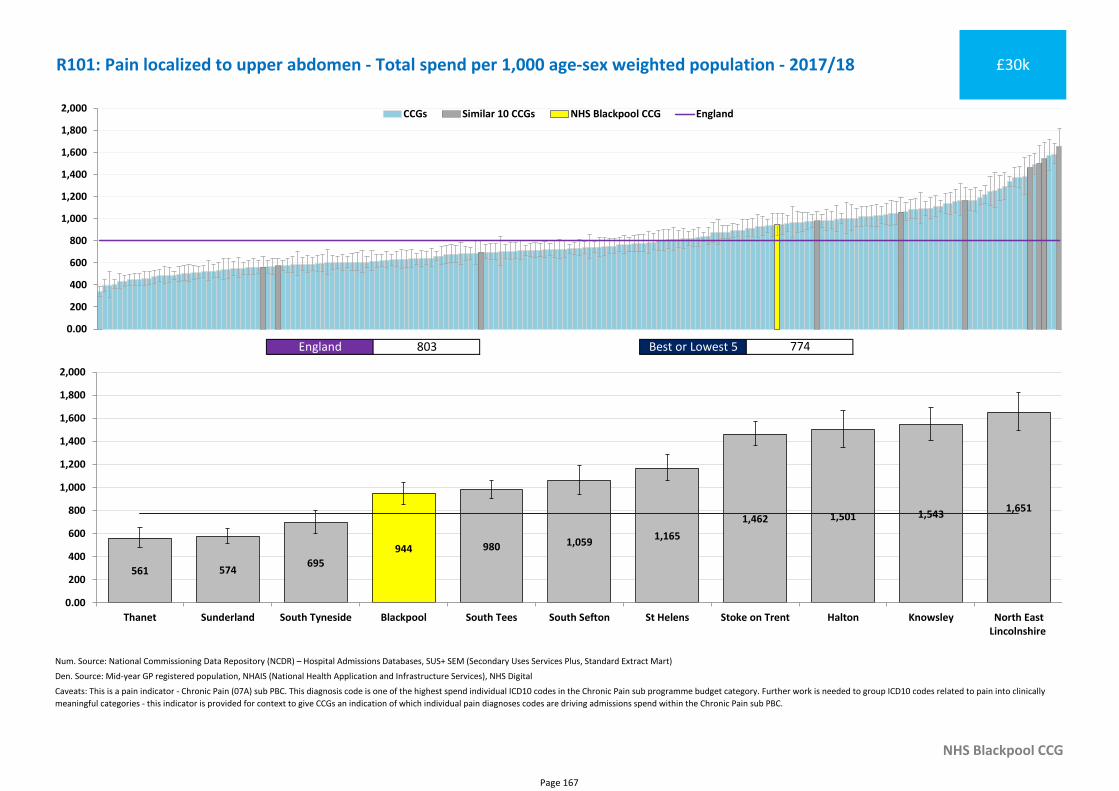
Num. Source: National Commissioning Data Repository (NCDR) – Hospital Admissions Databases, SUS+ SEM (Secondary Uses Services Plus, Standard Extract Mart)
Den. Source: Mid-year GP registered population, NHAIS (National Health Application and Infrastructure Services), NHS Digital
NHS Blackpool CCG
Caveats: This is a pain indicator - Chronic Pain (07A) sub PBC. This diagnosis code is one of the highest spend individual ICD10 codes in the Chronic Pain sub programme budget category. Further work is needed to group ICD10 codes related to pain into clinically
meaningful categories - this indicator is provided for context to give CCGs an indication of which individual pain diagnoses codes are driving admissions spend within the Chronic Pain sub PBC.
R101: Pain localized to upper abdomen - Total spend per 1,000 age-sex weighted population - 2017/18 £30k
England 803 Best or Lowest 5 774
0.00
200
400
600
800
1,000
1,200
1,400
1,600
1,800
2,000 CCGs Similar 10 CCGs NHS Blackpool CCG England
944
561 574695
980 1,0591,165
1,462 1,501 1,5431,651
0.00
200
400
600
800
1,000
1,200
1,400
1,600
1,800
2,000
Thanet Sunderland South Tyneside Blackpool South Tees South Sefton St Helens Stoke on Trent Halton Knowsley North EastLincolnshire
Page 167
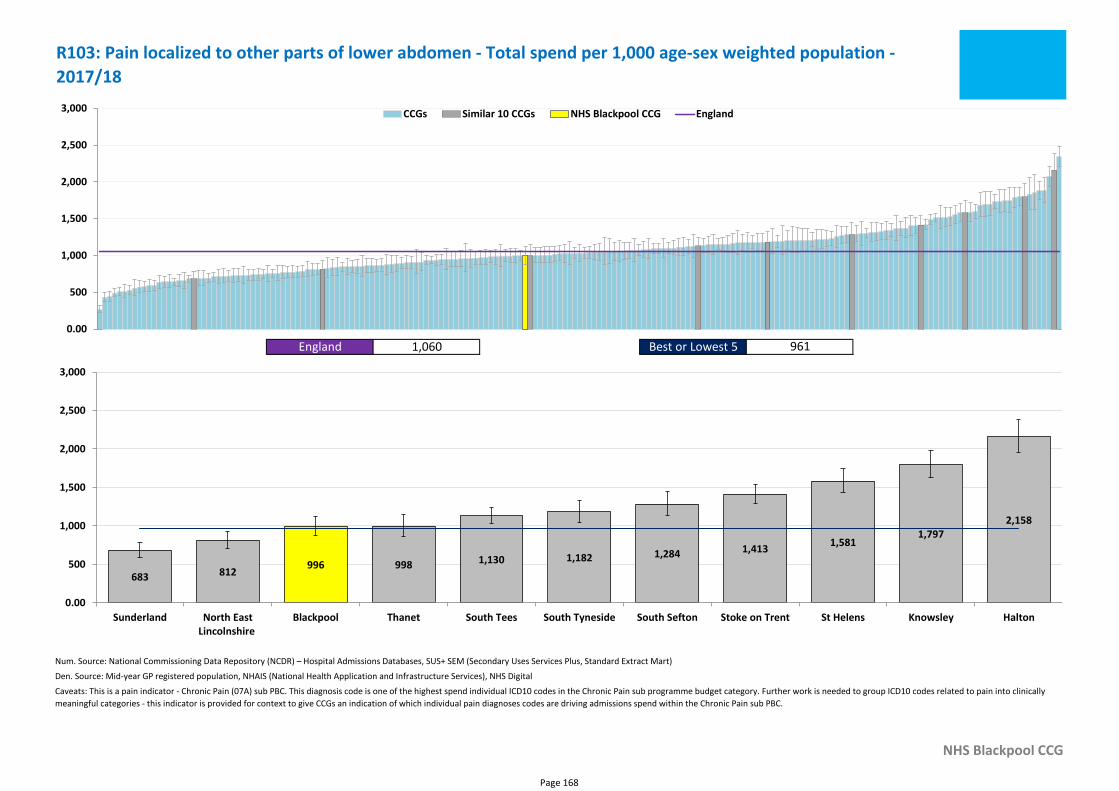
Num. Source: National Commissioning Data Repository (NCDR) – Hospital Admissions Databases, SUS+ SEM (Secondary Uses Services Plus, Standard Extract Mart)
Den. Source: Mid-year GP registered population, NHAIS (National Health Application and Infrastructure Services), NHS Digital
NHS Blackpool CCG
Caveats: This is a pain indicator - Chronic Pain (07A) sub PBC. This diagnosis code is one of the highest spend individual ICD10 codes in the Chronic Pain sub programme budget category. Further work is needed to group ICD10 codes related to pain into clinically
meaningful categories - this indicator is provided for context to give CCGs an indication of which individual pain diagnoses codes are driving admissions spend within the Chronic Pain sub PBC.
R103: Pain localized to other parts of lower abdomen - Total spend per 1,000 age-sex weighted population -
2017/18
England 1,060 Best or Lowest 5 961
0.00
500
1,000
1,500
2,000
2,500
3,000 CCGs Similar 10 CCGs NHS Blackpool CCG England
996683 812
998 1,130 1,182 1,284 1,4131,581
1,7972,158
0.00
500
1,000
1,500
2,000
2,500
3,000
Sunderland North EastLincolnshire
Blackpool Thanet South Tees South Tyneside South Sefton Stoke on Trent St Helens Knowsley Halton
Page 168
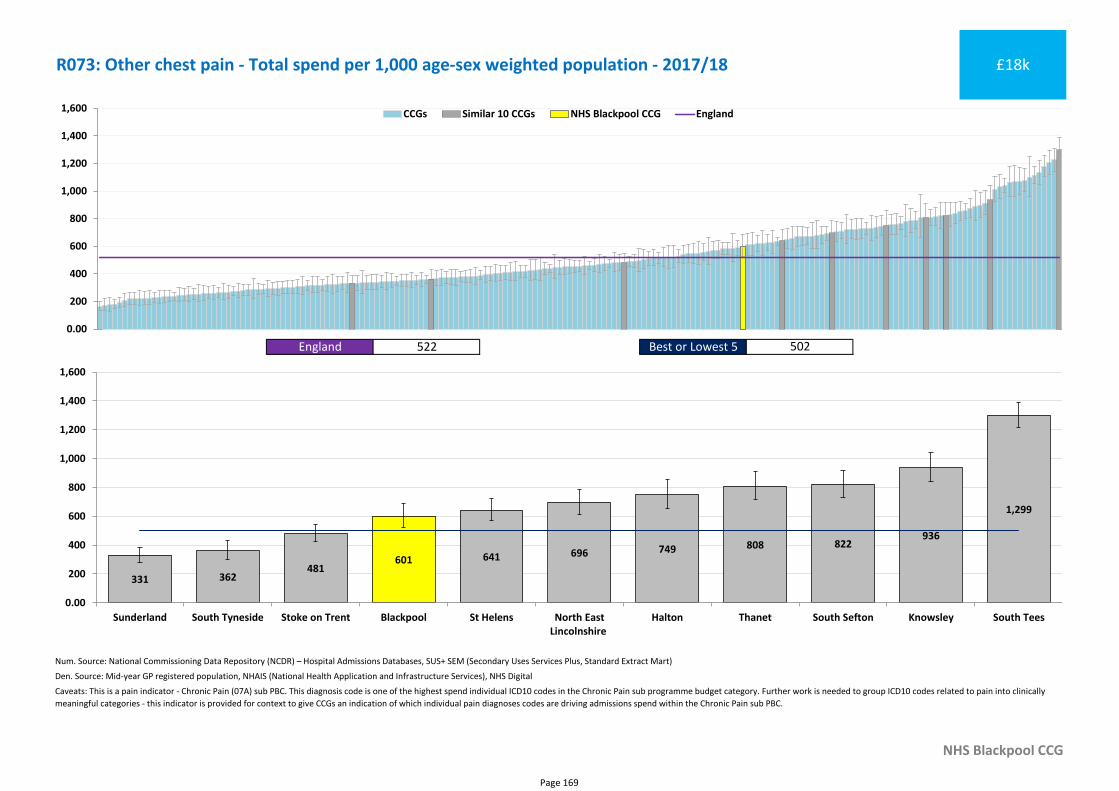
Num. Source: National Commissioning Data Repository (NCDR) – Hospital Admissions Databases, SUS+ SEM (Secondary Uses Services Plus, Standard Extract Mart)
Den. Source: Mid-year GP registered population, NHAIS (National Health Application and Infrastructure Services), NHS Digital
NHS Blackpool CCG
Caveats: This is a pain indicator - Chronic Pain (07A) sub PBC. This diagnosis code is one of the highest spend individual ICD10 codes in the Chronic Pain sub programme budget category. Further work is needed to group ICD10 codes related to pain into clinically
meaningful categories - this indicator is provided for context to give CCGs an indication of which individual pain diagnoses codes are driving admissions spend within the Chronic Pain sub PBC.
R073: Other chest pain - Total spend per 1,000 age-sex weighted population - 2017/18 £18k
England 522 Best or Lowest 5 502
0.00
200
400
600
800
1,000
1,200
1,400
1,600 CCGs Similar 10 CCGs NHS Blackpool CCG England
601
331 362481
641 696 749 808 822936
1,299
0.00
200
400
600
800
1,000
1,200
1,400
1,600
Sunderland South Tyneside Stoke on Trent Blackpool St Helens North EastLincolnshire
Halton Thanet South Sefton Knowsley South Tees
Page 169
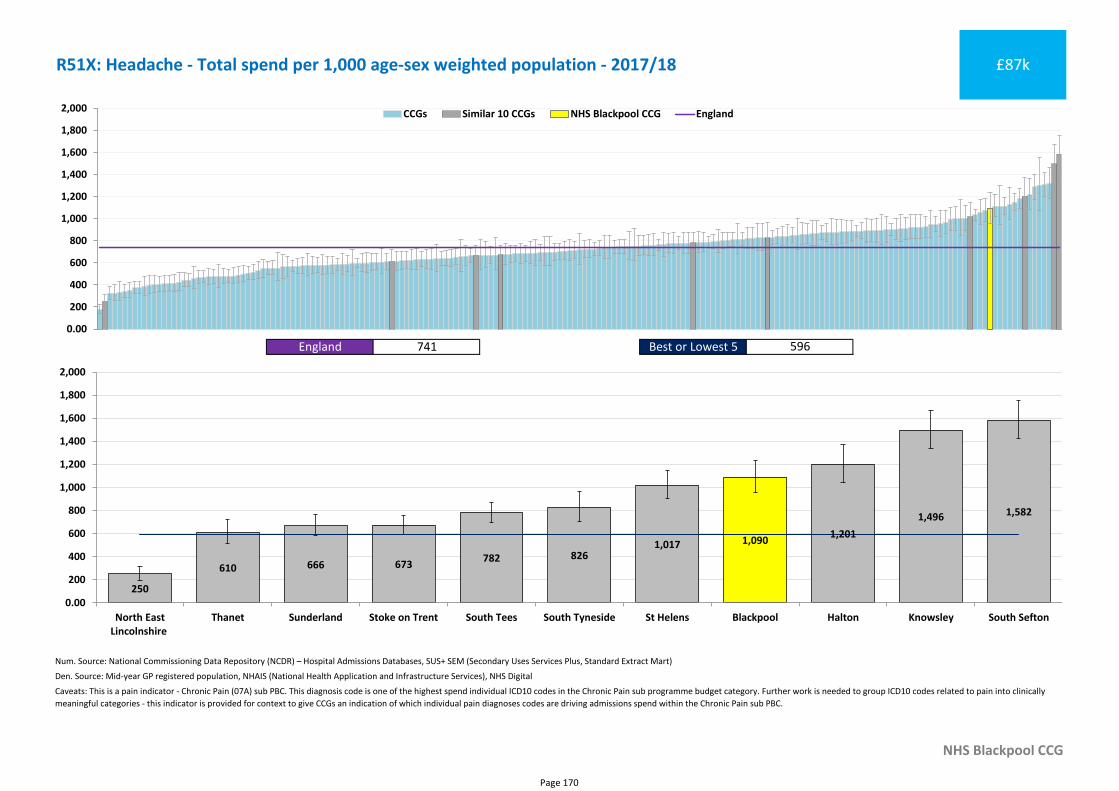
Num. Source: National Commissioning Data Repository (NCDR) – Hospital Admissions Databases, SUS+ SEM (Secondary Uses Services Plus, Standard Extract Mart)
Den. Source: Mid-year GP registered population, NHAIS (National Health Application and Infrastructure Services), NHS Digital
NHS Blackpool CCG
Caveats: This is a pain indicator - Chronic Pain (07A) sub PBC. This diagnosis code is one of the highest spend individual ICD10 codes in the Chronic Pain sub programme budget category. Further work is needed to group ICD10 codes related to pain into clinically
meaningful categories - this indicator is provided for context to give CCGs an indication of which individual pain diagnoses codes are driving admissions spend within the Chronic Pain sub PBC.
R51X: Headache - Total spend per 1,000 age-sex weighted population - 2017/18 £87k
England 741 Best or Lowest 5 596
0.00
200
400
600
800
1,000
1,200
1,400
1,600
1,800
2,000 CCGs Similar 10 CCGs NHS Blackpool CCG England
1,090
250
610 666 673782 826
1,0171,201
1,496 1,582
0.00
200
400
600
800
1,000
1,200
1,400
1,600
1,800
2,000
North EastLincolnshire
Thanet Sunderland Stoke on Trent South Tees South Tyneside St Helens Blackpool Halton Knowsley South Sefton
Page 170
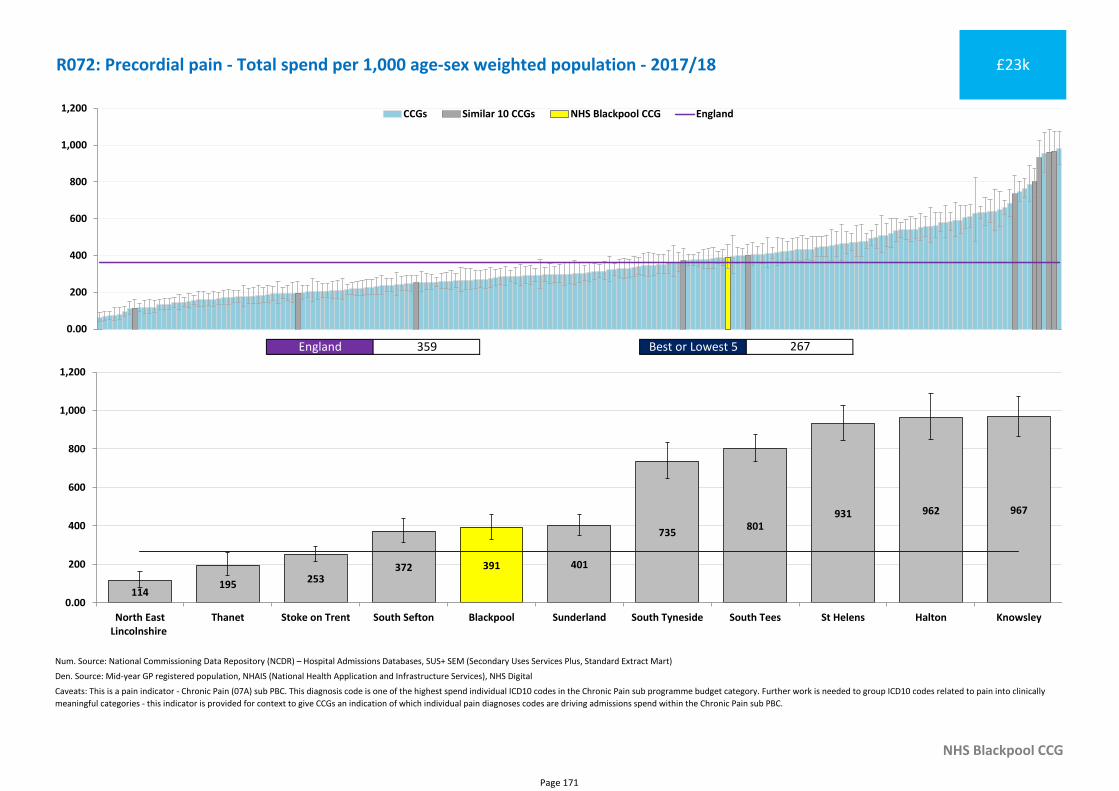
Num. Source: National Commissioning Data Repository (NCDR) – Hospital Admissions Databases, SUS+ SEM (Secondary Uses Services Plus, Standard Extract Mart)
Den. Source: Mid-year GP registered population, NHAIS (National Health Application and Infrastructure Services), NHS Digital
NHS Blackpool CCG
Caveats: This is a pain indicator - Chronic Pain (07A) sub PBC. This diagnosis code is one of the highest spend individual ICD10 codes in the Chronic Pain sub programme budget category. Further work is needed to group ICD10 codes related to pain into clinically
meaningful categories - this indicator is provided for context to give CCGs an indication of which individual pain diagnoses codes are driving admissions spend within the Chronic Pain sub PBC.
R072: Precordial pain - Total spend per 1,000 age-sex weighted population - 2017/18 £23k
England 359 Best or Lowest 5 267
0.00
200
400
600
800
1,000
1,200 CCGs Similar 10 CCGs NHS Blackpool CCG England
391
114195 253
372 401
735801
931 962 967
0.00
200
400
600
800
1,000
1,200
North EastLincolnshire
Thanet Stoke on Trent South Sefton Blackpool Sunderland South Tyneside South Tees St Helens Halton Knowsley
Page 171
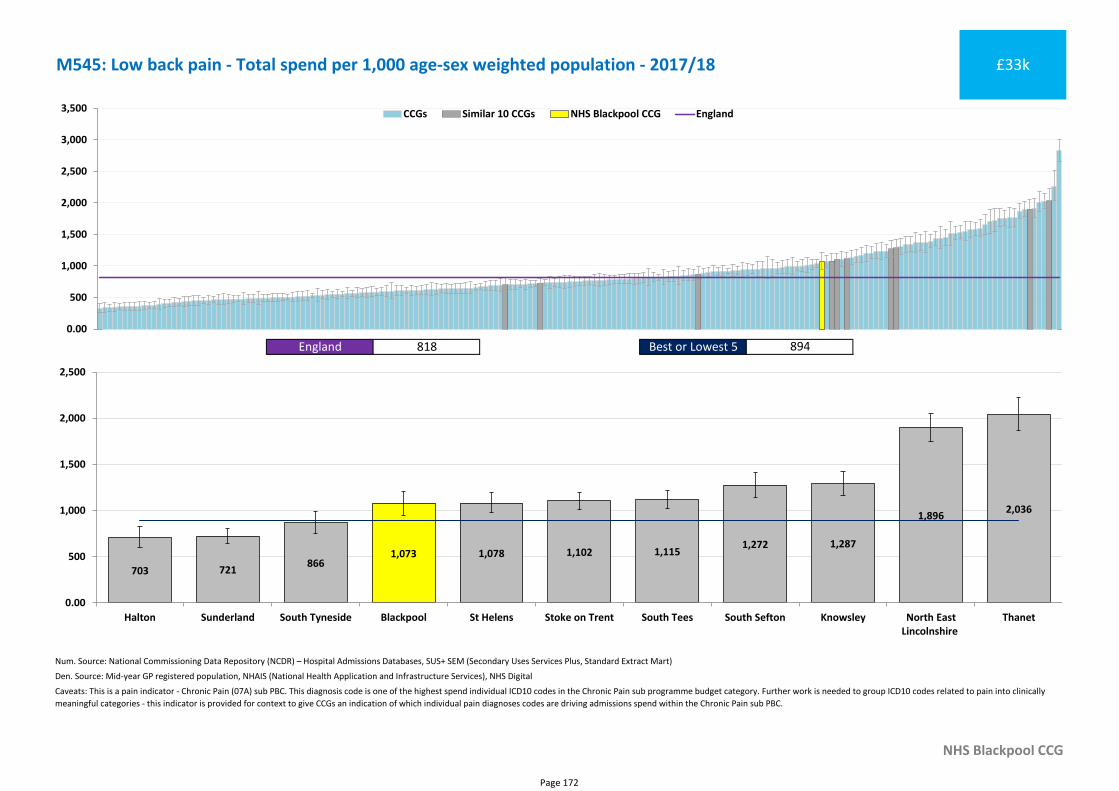
Num. Source: National Commissioning Data Repository (NCDR) – Hospital Admissions Databases, SUS+ SEM (Secondary Uses Services Plus, Standard Extract Mart)
Den. Source: Mid-year GP registered population, NHAIS (National Health Application and Infrastructure Services), NHS Digital
NHS Blackpool CCG
Caveats: This is a pain indicator - Chronic Pain (07A) sub PBC. This diagnosis code is one of the highest spend individual ICD10 codes in the Chronic Pain sub programme budget category. Further work is needed to group ICD10 codes related to pain into clinically
meaningful categories - this indicator is provided for context to give CCGs an indication of which individual pain diagnoses codes are driving admissions spend within the Chronic Pain sub PBC.
M545: Low back pain - Total spend per 1,000 age-sex weighted population - 2017/18 £33k
England 818 Best or Lowest 5 894
0.00
500
1,000
1,500
2,000
2,500
3,000
3,500 CCGs Similar 10 CCGs NHS Blackpool CCG England
1,073
703 721866
1,078 1,102 1,1151,272 1,287
1,8962,036
0.00
500
1,000
1,500
2,000
2,500
Halton Sunderland South Tyneside Blackpool St Helens Stoke on Trent South Tees South Sefton Knowsley North EastLincolnshire
Thanet
Page 172
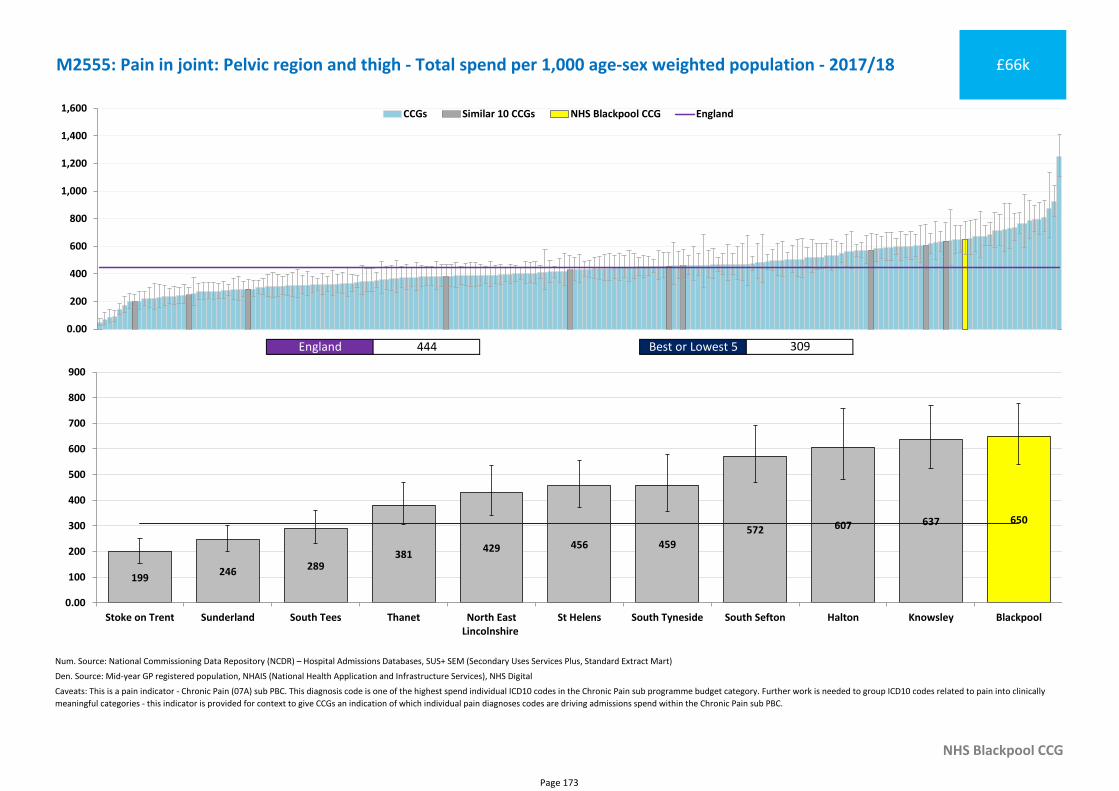
Num. Source: National Commissioning Data Repository (NCDR) – Hospital Admissions Databases, SUS+ SEM (Secondary Uses Services Plus, Standard Extract Mart)
Den. Source: Mid-year GP registered population, NHAIS (National Health Application and Infrastructure Services), NHS Digital
NHS Blackpool CCG
Caveats: This is a pain indicator - Chronic Pain (07A) sub PBC. This diagnosis code is one of the highest spend individual ICD10 codes in the Chronic Pain sub programme budget category. Further work is needed to group ICD10 codes related to pain into clinically
meaningful categories - this indicator is provided for context to give CCGs an indication of which individual pain diagnoses codes are driving admissions spend within the Chronic Pain sub PBC.
M2555: Pain in joint: Pelvic region and thigh - Total spend per 1,000 age-sex weighted population - 2017/18 £66k
England 444 Best or Lowest 5 309
0.00
200
400
600
800
1,000
1,200
1,400
1,600 CCGs Similar 10 CCGs NHS Blackpool CCG England
650
199246 289
381429 456 459
572 607 637
0.00
100
200
300
400
500
600
700
800
900
Stoke on Trent Sunderland South Tees Thanet North EastLincolnshire
St Helens South Tyneside South Sefton Halton Knowsley Blackpool
Page 173
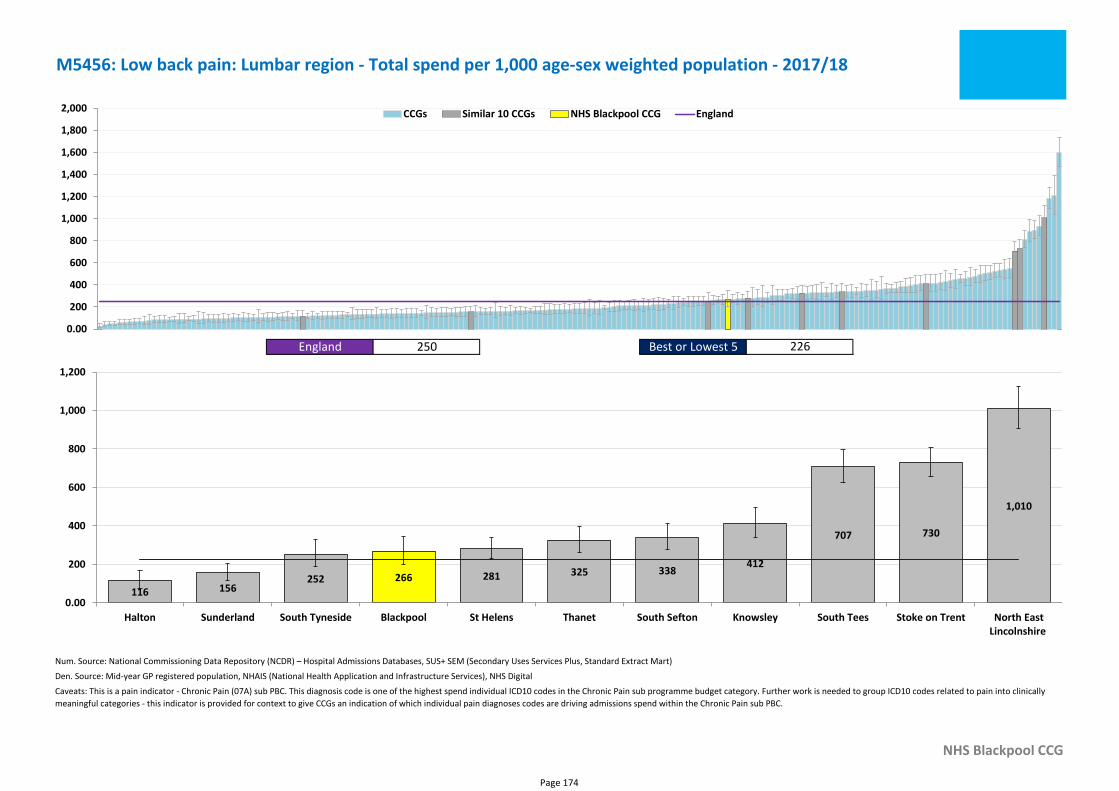
Num. Source: National Commissioning Data Repository (NCDR) – Hospital Admissions Databases, SUS+ SEM (Secondary Uses Services Plus, Standard Extract Mart)
Den. Source: Mid-year GP registered population, NHAIS (National Health Application and Infrastructure Services), NHS Digital
NHS Blackpool CCG
Caveats: This is a pain indicator - Chronic Pain (07A) sub PBC. This diagnosis code is one of the highest spend individual ICD10 codes in the Chronic Pain sub programme budget category. Further work is needed to group ICD10 codes related to pain into clinically
meaningful categories - this indicator is provided for context to give CCGs an indication of which individual pain diagnoses codes are driving admissions spend within the Chronic Pain sub PBC.
M5456: Low back pain: Lumbar region - Total spend per 1,000 age-sex weighted population - 2017/18
England 250 Best or Lowest 5 226
0.00
200
400
600
800
1,000
1,200
1,400
1,600
1,800
2,000 CCGs Similar 10 CCGs NHS Blackpool CCG England
266
116 156252 281 325 338
412
707 730
1,010
0.00
200
400
600
800
1,000
1,200
Halton Sunderland South Tyneside Blackpool St Helens Thanet South Sefton Knowsley South Tees Stoke on Trent North EastLincolnshire
Page 174
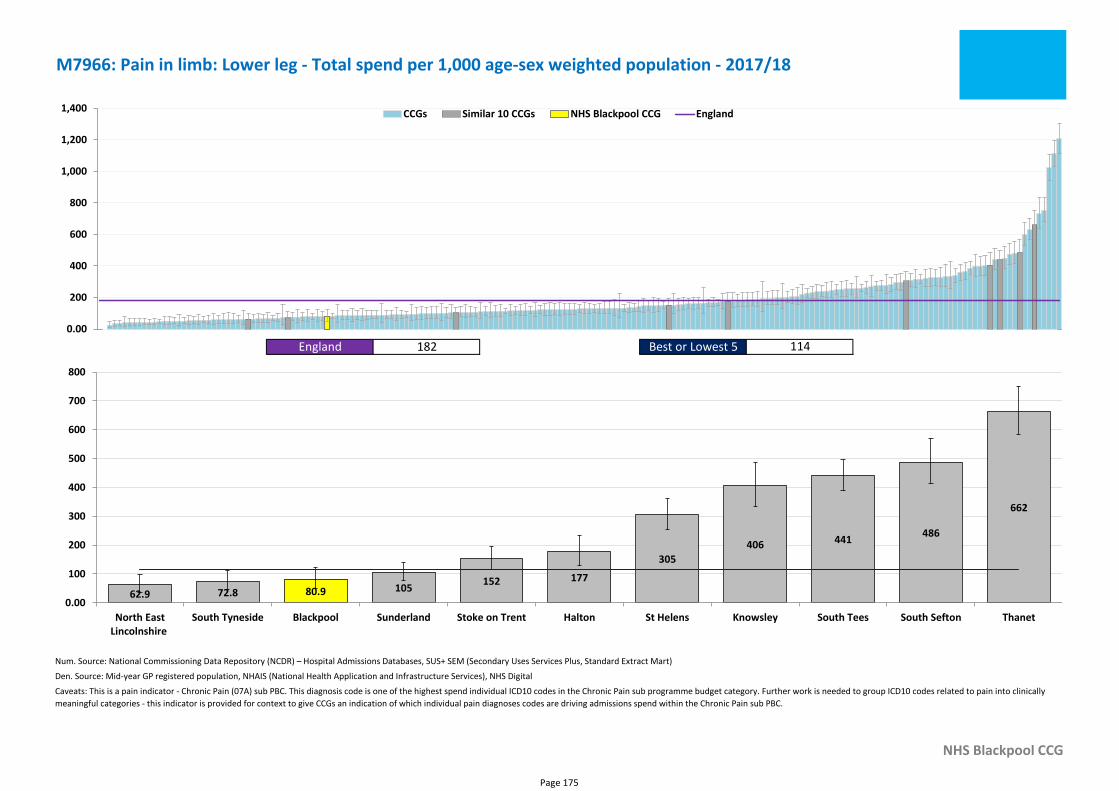
Num. Source: National Commissioning Data Repository (NCDR) – Hospital Admissions Databases, SUS+ SEM (Secondary Uses Services Plus, Standard Extract Mart)
Den. Source: Mid-year GP registered population, NHAIS (National Health Application and Infrastructure Services), NHS Digital
NHS Blackpool CCG
Caveats: This is a pain indicator - Chronic Pain (07A) sub PBC. This diagnosis code is one of the highest spend individual ICD10 codes in the Chronic Pain sub programme budget category. Further work is needed to group ICD10 codes related to pain into clinically
meaningful categories - this indicator is provided for context to give CCGs an indication of which individual pain diagnoses codes are driving admissions spend within the Chronic Pain sub PBC.
M7966: Pain in limb: Lower leg - Total spend per 1,000 age-sex weighted population - 2017/18
England 182 Best or Lowest 5 114
0.00
200
400
600
800
1,000
1,200
1,400 CCGs Similar 10 CCGs NHS Blackpool CCG England
80.962.9 72.8 105152 177
305
406 441486
662
0.00
100
200
300
400
500
600
700
800
North EastLincolnshire
South Tyneside Blackpool Sunderland Stoke on Trent Halton St Helens Knowsley South Tees South Sefton Thanet
Page 175
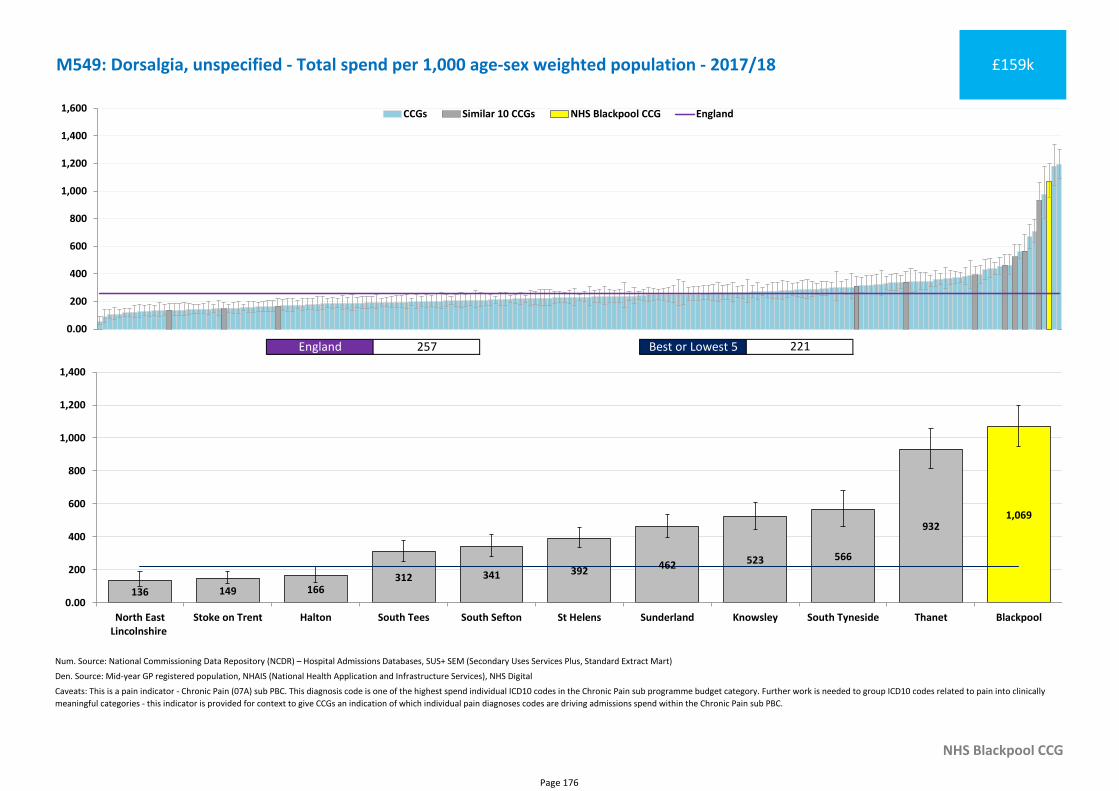
Num. Source: National Commissioning Data Repository (NCDR) – Hospital Admissions Databases, SUS+ SEM (Secondary Uses Services Plus, Standard Extract Mart)
Den. Source: Mid-year GP registered population, NHAIS (National Health Application and Infrastructure Services), NHS Digital
NHS Blackpool CCG
Caveats: This is a pain indicator - Chronic Pain (07A) sub PBC. This diagnosis code is one of the highest spend individual ICD10 codes in the Chronic Pain sub programme budget category. Further work is needed to group ICD10 codes related to pain into clinically
meaningful categories - this indicator is provided for context to give CCGs an indication of which individual pain diagnoses codes are driving admissions spend within the Chronic Pain sub PBC.
M549: Dorsalgia, unspecified - Total spend per 1,000 age-sex weighted population - 2017/18 £159k
England 257 Best or Lowest 5 221
0.00
200
400
600
800
1,000
1,200
1,400
1,600 CCGs Similar 10 CCGs NHS Blackpool CCG England
1,069
136 149 166312 341 392
462 523 566
932
0.00
200
400
600
800
1,000
1,200
1,400
North EastLincolnshire
Stoke on Trent Halton South Tees South Sefton St Helens Sunderland Knowsley South Tyneside Thanet Blackpool
Page 176
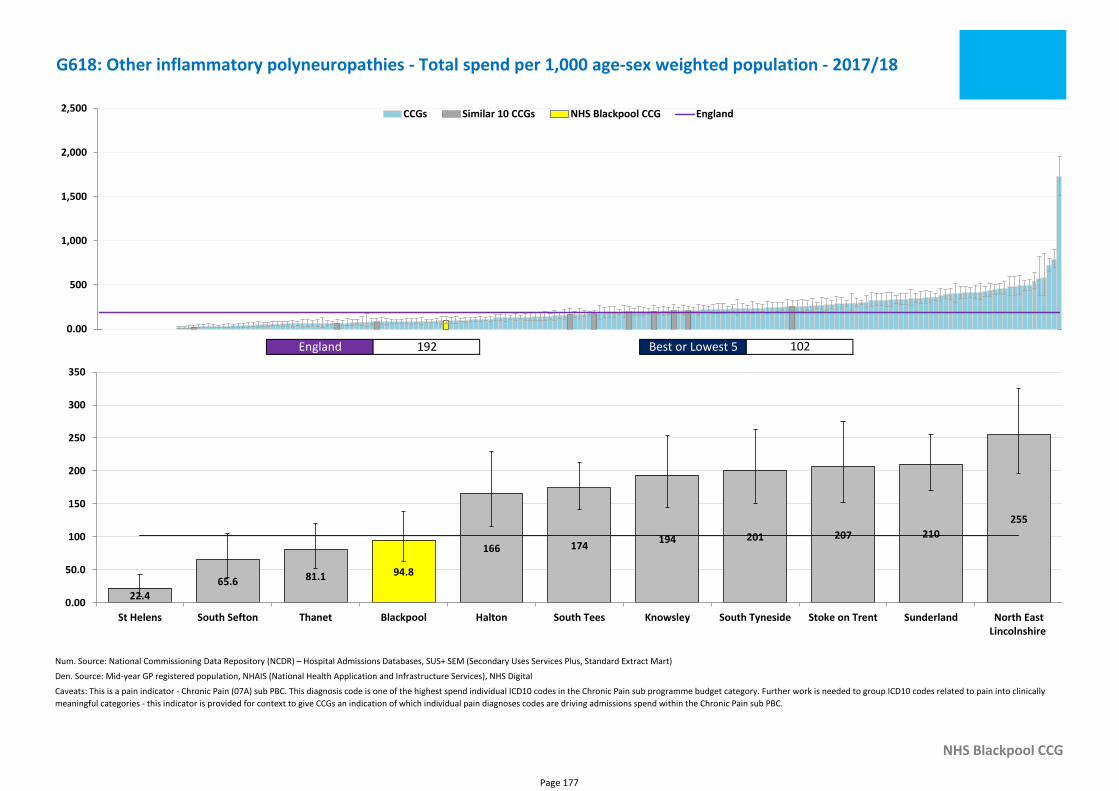
Num. Source: National Commissioning Data Repository (NCDR) – Hospital Admissions Databases, SUS+ SEM (Secondary Uses Services Plus, Standard Extract Mart)
Den. Source: Mid-year GP registered population, NHAIS (National Health Application and Infrastructure Services), NHS Digital
NHS Blackpool CCG
Caveats: This is a pain indicator - Chronic Pain (07A) sub PBC. This diagnosis code is one of the highest spend individual ICD10 codes in the Chronic Pain sub programme budget category. Further work is needed to group ICD10 codes related to pain into clinically
meaningful categories - this indicator is provided for context to give CCGs an indication of which individual pain diagnoses codes are driving admissions spend within the Chronic Pain sub PBC.
G618: Other inflammatory polyneuropathies - Total spend per 1,000 age-sex weighted population - 2017/18
England 192 Best or Lowest 5 102
0.00
500
1,000
1,500
2,000
2,500 CCGs Similar 10 CCGs NHS Blackpool CCG England
94.8
22.4
65.6 81.1
166 174194 201 207 210
255
0.00
50.0
100
150
200
250
300
350
St Helens South Sefton Thanet Blackpool Halton South Tees Knowsley South Tyneside Stoke on Trent Sunderland North EastLincolnshire
Page 177
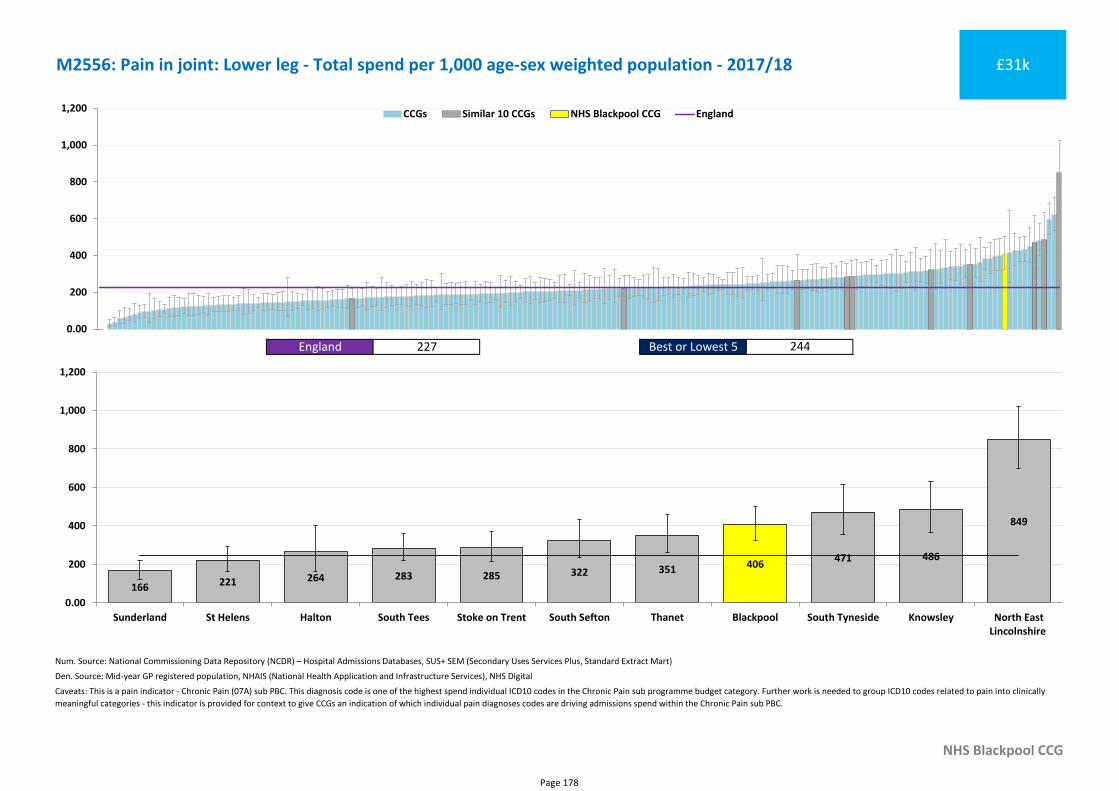
Num. Source: National Commissioning Data Repository (NCDR) – Hospital Admissions Databases, SUS+ SEM (Secondary Uses Services Plus, Standard Extract Mart)
Den. Source: Mid-year GP registered population, NHAIS (National Health Application and Infrastructure Services), NHS Digital
NHS Blackpool CCG
Caveats: This is a pain indicator - Chronic Pain (07A) sub PBC. This diagnosis code is one of the highest spend individual ICD10 codes in the Chronic Pain sub programme budget category. Further work is needed to group ICD10 codes related to pain into clinically
meaningful categories - this indicator is provided for context to give CCGs an indication of which individual pain diagnoses codes are driving admissions spend within the Chronic Pain sub PBC.
M2556: Pain in joint: Lower leg - Total spend per 1,000 age-sex weighted population - 2017/18 £31k
England 227 Best or Lowest 5 244
0.00
200
400
600
800
1,000
1,200 CCGs Similar 10 CCGs NHS Blackpool CCG England
406
166 221 264 283 285 322 351471 486
849
0.00
200
400
600
800
1,000
1,200
Sunderland St Helens Halton South Tees Stoke on Trent South Sefton Thanet Blackpool South Tyneside Knowsley North EastLincolnshire
Page 178
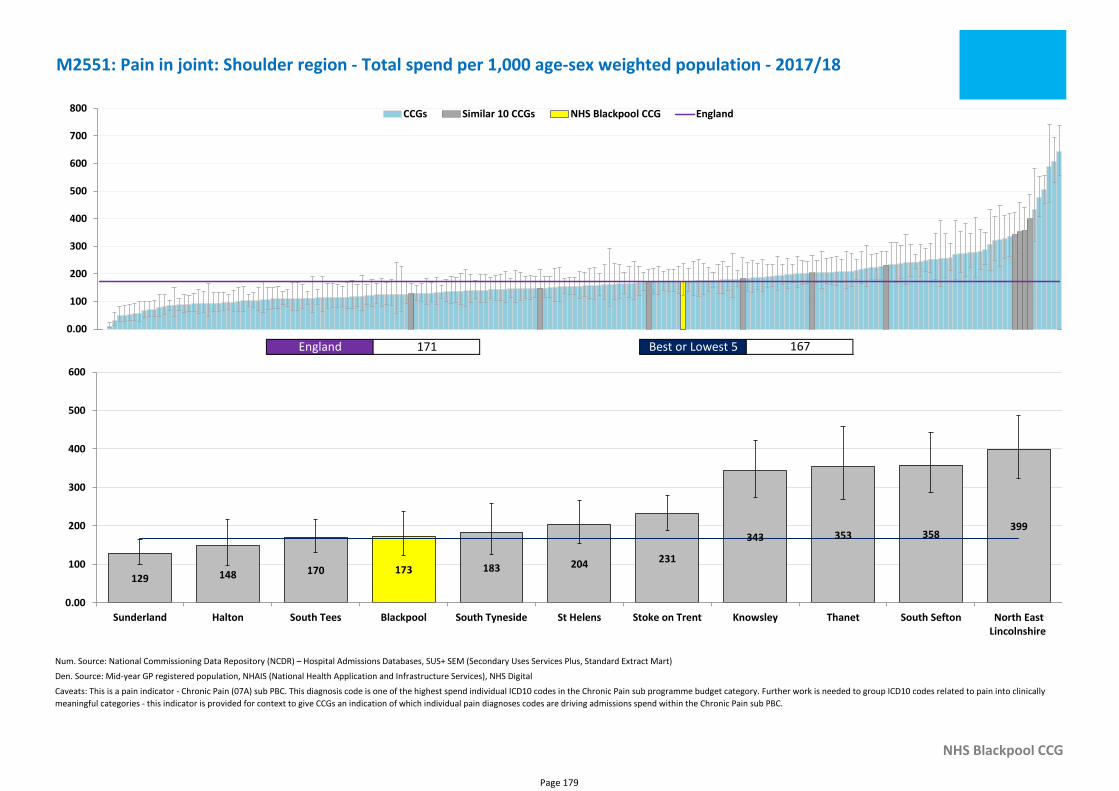
Num. Source: National Commissioning Data Repository (NCDR) – Hospital Admissions Databases, SUS+ SEM (Secondary Uses Services Plus, Standard Extract Mart)
Den. Source: Mid-year GP registered population, NHAIS (National Health Application and Infrastructure Services), NHS Digital
NHS Blackpool CCG
Caveats: This is a pain indicator - Chronic Pain (07A) sub PBC. This diagnosis code is one of the highest spend individual ICD10 codes in the Chronic Pain sub programme budget category. Further work is needed to group ICD10 codes related to pain into clinically
meaningful categories - this indicator is provided for context to give CCGs an indication of which individual pain diagnoses codes are driving admissions spend within the Chronic Pain sub PBC.
M2551: Pain in joint: Shoulder region - Total spend per 1,000 age-sex weighted population - 2017/18
England 171 Best or Lowest 5 167
0.00
100
200
300
400
500
600
700
800 CCGs Similar 10 CCGs NHS Blackpool CCG England
173129 148 170 183 204 231
343 353 358399
0.00
100
200
300
400
500
600
Sunderland Halton South Tees Blackpool South Tyneside St Helens Stoke on Trent Knowsley Thanet South Sefton North EastLincolnshire
Page 179
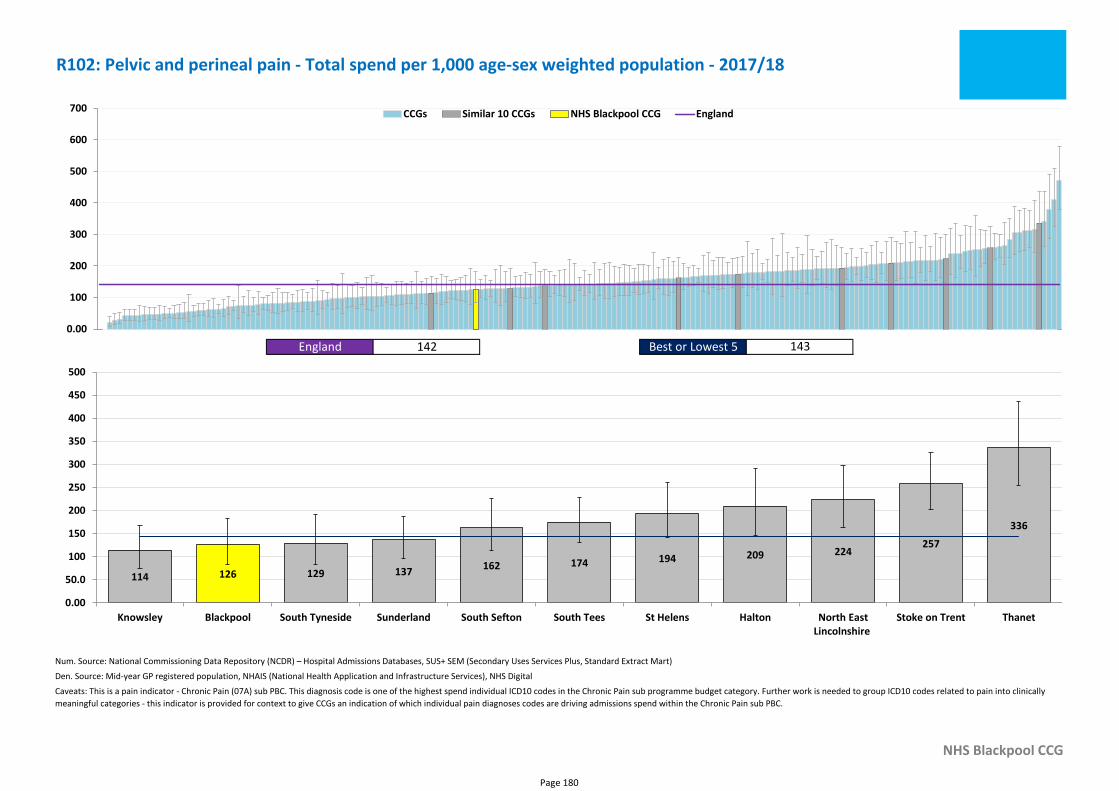
Num. Source: National Commissioning Data Repository (NCDR) – Hospital Admissions Databases, SUS+ SEM (Secondary Uses Services Plus, Standard Extract Mart)
Den. Source: Mid-year GP registered population, NHAIS (National Health Application and Infrastructure Services), NHS Digital
NHS Blackpool CCG
Caveats: This is a pain indicator - Chronic Pain (07A) sub PBC. This diagnosis code is one of the highest spend individual ICD10 codes in the Chronic Pain sub programme budget category. Further work is needed to group ICD10 codes related to pain into clinically
meaningful categories - this indicator is provided for context to give CCGs an indication of which individual pain diagnoses codes are driving admissions spend within the Chronic Pain sub PBC.
R102: Pelvic and perineal pain - Total spend per 1,000 age-sex weighted population - 2017/18
England 142 Best or Lowest 5 143
0.00
100
200
300
400
500
600
700 CCGs Similar 10 CCGs NHS Blackpool CCG England
126114 129 137162 174 194 209 224
257
336
0.00
50.0
100
150
200
250
300
350
400
450
500
Knowsley Blackpool South Tyneside Sunderland South Sefton South Tees St Helens Halton North EastLincolnshire
Stoke on Trent Thanet
Page 180

Section 3b - Secondary Care
• Total bed days
• Elective bed days
• Non-elective bed days
Page 181
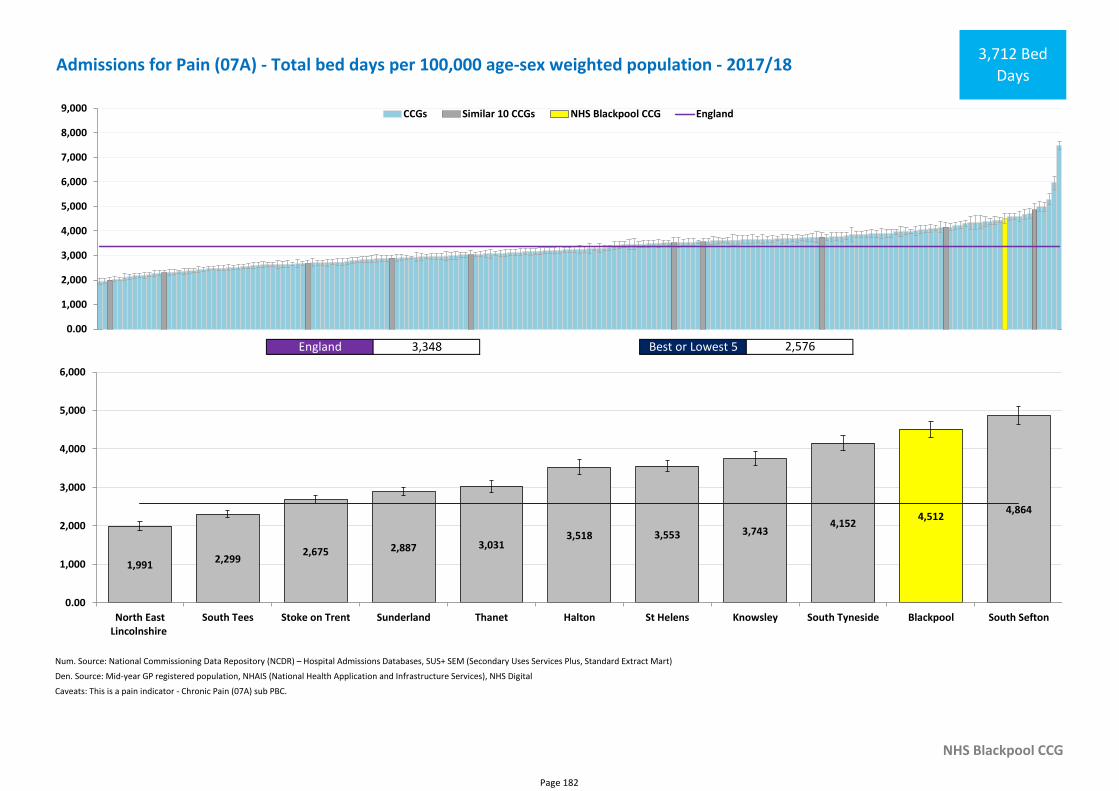
Num. Source: National Commissioning Data Repository (NCDR) – Hospital Admissions Databases, SUS+ SEM (Secondary Uses Services Plus, Standard Extract Mart)
Den. Source: Mid-year GP registered population, NHAIS (National Health Application and Infrastructure Services), NHS Digital
NHS Blackpool CCG
Caveats: This is a pain indicator - Chronic Pain (07A) sub PBC.
Admissions for Pain (07A) - Total bed days per 100,000 age-sex weighted population - 2017/183,712 Bed
Days
England 3,348 Best or Lowest 5 2,576
0.00
1,000
2,000
3,000
4,000
5,000
6,000
7,000
8,000
9,000 CCGs Similar 10 CCGs NHS Blackpool CCG England
4,512
1,9912,299
2,675 2,887 3,0313,518 3,553 3,743
4,1524,864
0.00
1,000
2,000
3,000
4,000
5,000
6,000
North EastLincolnshire
South Tees Stoke on Trent Sunderland Thanet Halton St Helens Knowsley South Tyneside Blackpool South Sefton
Page 182
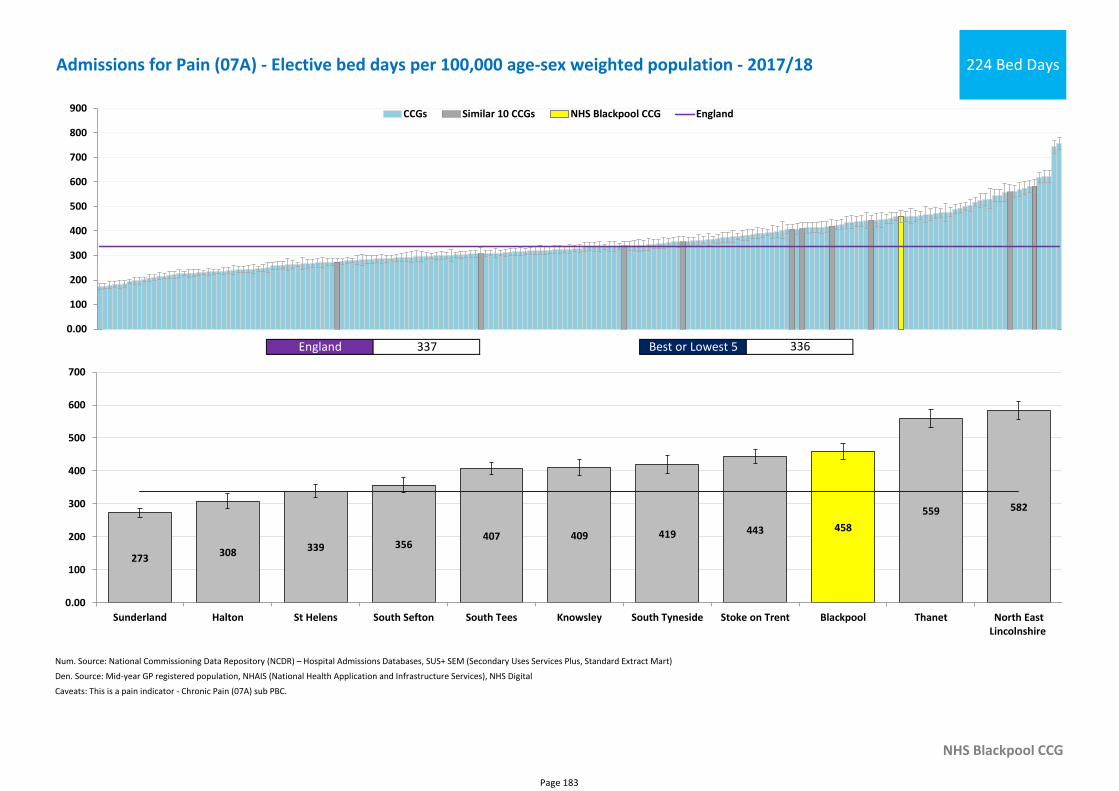
Num. Source: National Commissioning Data Repository (NCDR) – Hospital Admissions Databases, SUS+ SEM (Secondary Uses Services Plus, Standard Extract Mart)
Den. Source: Mid-year GP registered population, NHAIS (National Health Application and Infrastructure Services), NHS Digital
NHS Blackpool CCG
Caveats: This is a pain indicator - Chronic Pain (07A) sub PBC.
Admissions for Pain (07A) - Elective bed days per 100,000 age-sex weighted population - 2017/18 224 Bed Days
England 337 Best or Lowest 5 336
0.00
100
200
300
400
500
600
700
800
900 CCGs Similar 10 CCGs NHS Blackpool CCG England
458
273308 339 356
407 409 419 443
559 582
0.00
100
200
300
400
500
600
700
Sunderland Halton St Helens South Sefton South Tees Knowsley South Tyneside Stoke on Trent Blackpool Thanet North EastLincolnshire
Page 183
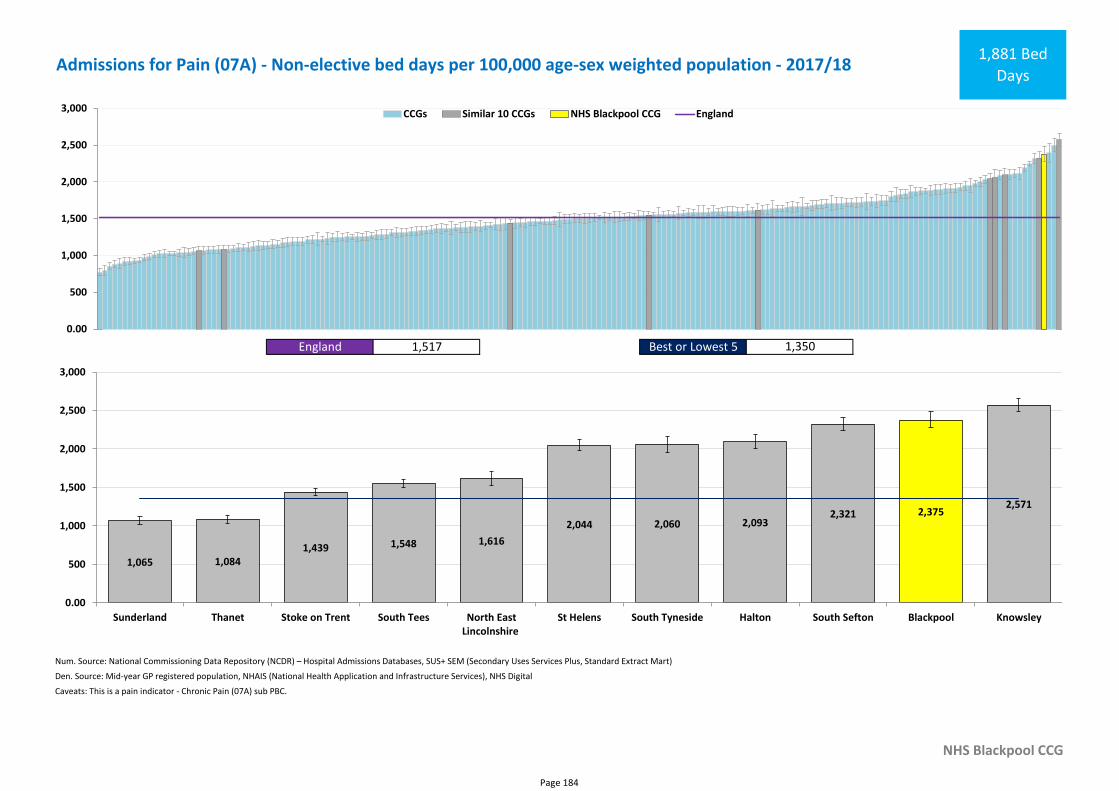
Num. Source: National Commissioning Data Repository (NCDR) – Hospital Admissions Databases, SUS+ SEM (Secondary Uses Services Plus, Standard Extract Mart)
Den. Source: Mid-year GP registered population, NHAIS (National Health Application and Infrastructure Services), NHS Digital
NHS Blackpool CCG
Caveats: This is a pain indicator - Chronic Pain (07A) sub PBC.
Admissions for Pain (07A) - Non-elective bed days per 100,000 age-sex weighted population - 2017/181,881 Bed
Days
England 1,517 Best or Lowest 5 1,350
0.00
500
1,000
1,500
2,000
2,500
3,000 CCGs Similar 10 CCGs NHS Blackpool CCG England
2,375
1,065 1,0841,439 1,548 1,616
2,044 2,060 2,0932,321
2,571
0.00
500
1,000
1,500
2,000
2,500
3,000
Sunderland Thanet Stoke on Trent South Tees North EastLincolnshire
St Helens South Tyneside Halton South Sefton Blackpool Knowsley
Page 184
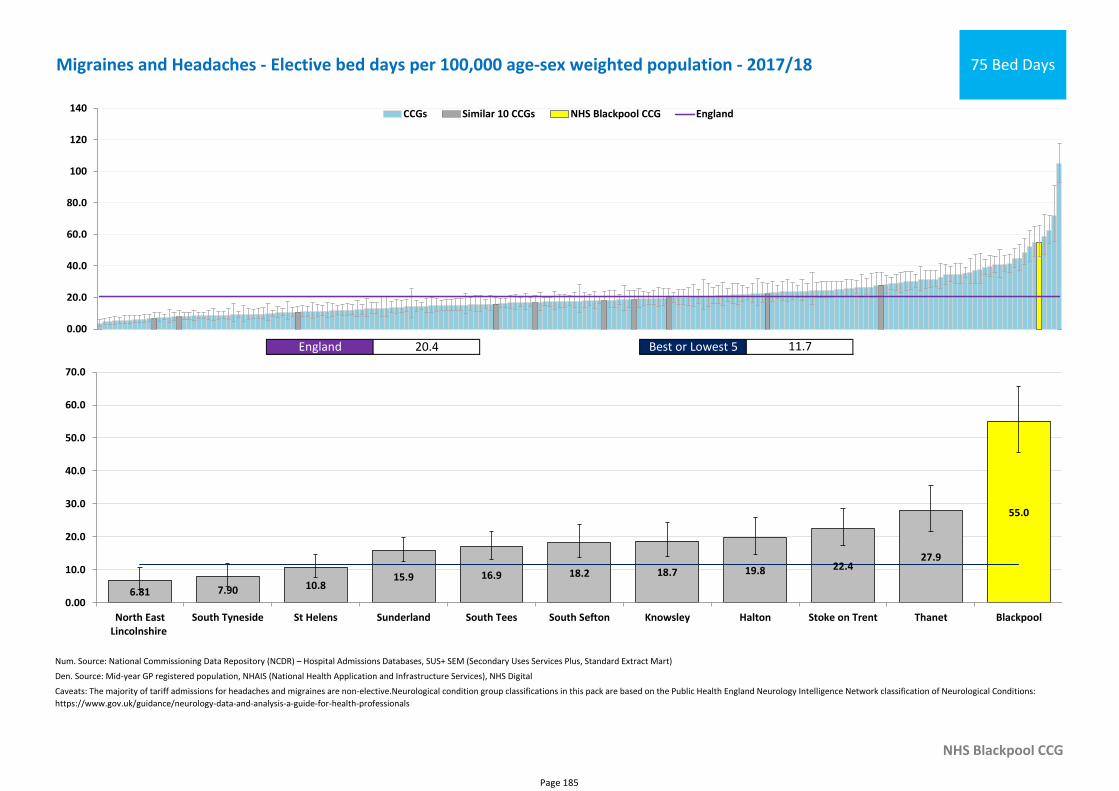
Num. Source: National Commissioning Data Repository (NCDR) – Hospital Admissions Databases, SUS+ SEM (Secondary Uses Services Plus, Standard Extract Mart)
Den. Source: Mid-year GP registered population, NHAIS (National Health Application and Infrastructure Services), NHS Digital
NHS Blackpool CCG
Caveats: The majority of tariff admissions for headaches and migraines are non-elective.Neurological condition group classifications in this pack are based on the Public Health England Neurology Intelligence Network classification of Neurological Conditions:
https://www.gov.uk/guidance/neurology-data-and-analysis-a-guide-for-health-professionals
Migraines and Headaches - Elective bed days per 100,000 age-sex weighted population - 2017/18 75 Bed Days
England 20.4 Best or Lowest 5 11.7
0.00
20.0
40.0
60.0
80.0
100
120
140 CCGs Similar 10 CCGs NHS Blackpool CCG England
55.0
6.81 7.90 10.815.9 16.9 18.2 18.7 19.8 22.4
27.9
0.00
10.0
20.0
30.0
40.0
50.0
60.0
70.0
North EastLincolnshire
South Tyneside St Helens Sunderland South Tees South Sefton Knowsley Halton Stoke on Trent Thanet Blackpool
Page 185
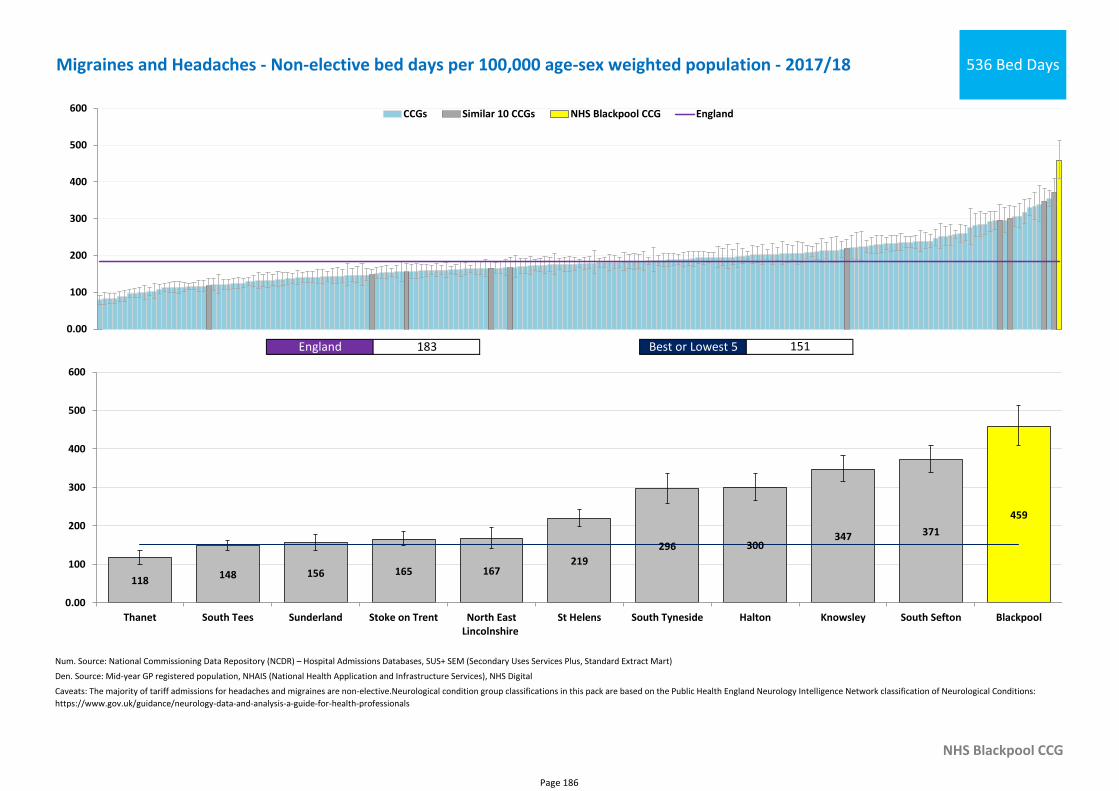
Num. Source: National Commissioning Data Repository (NCDR) – Hospital Admissions Databases, SUS+ SEM (Secondary Uses Services Plus, Standard Extract Mart)
Den. Source: Mid-year GP registered population, NHAIS (National Health Application and Infrastructure Services), NHS Digital
NHS Blackpool CCG
Caveats: The majority of tariff admissions for headaches and migraines are non-elective.Neurological condition group classifications in this pack are based on the Public Health England Neurology Intelligence Network classification of Neurological Conditions:
https://www.gov.uk/guidance/neurology-data-and-analysis-a-guide-for-health-professionals
Migraines and Headaches - Non-elective bed days per 100,000 age-sex weighted population - 2017/18 536 Bed Days
England 183 Best or Lowest 5 151
0.00
100
200
300
400
500
600 CCGs Similar 10 CCGs NHS Blackpool CCG England
459
118148 156 165 167
219
296 300347 371
0.00
100
200
300
400
500
600
Thanet South Tees Sunderland Stoke on Trent North EastLincolnshire
St Helens South Tyneside Halton Knowsley South Sefton Blackpool
Page 186
Section 3c - Secondary Care
• Outpatients
Page 187
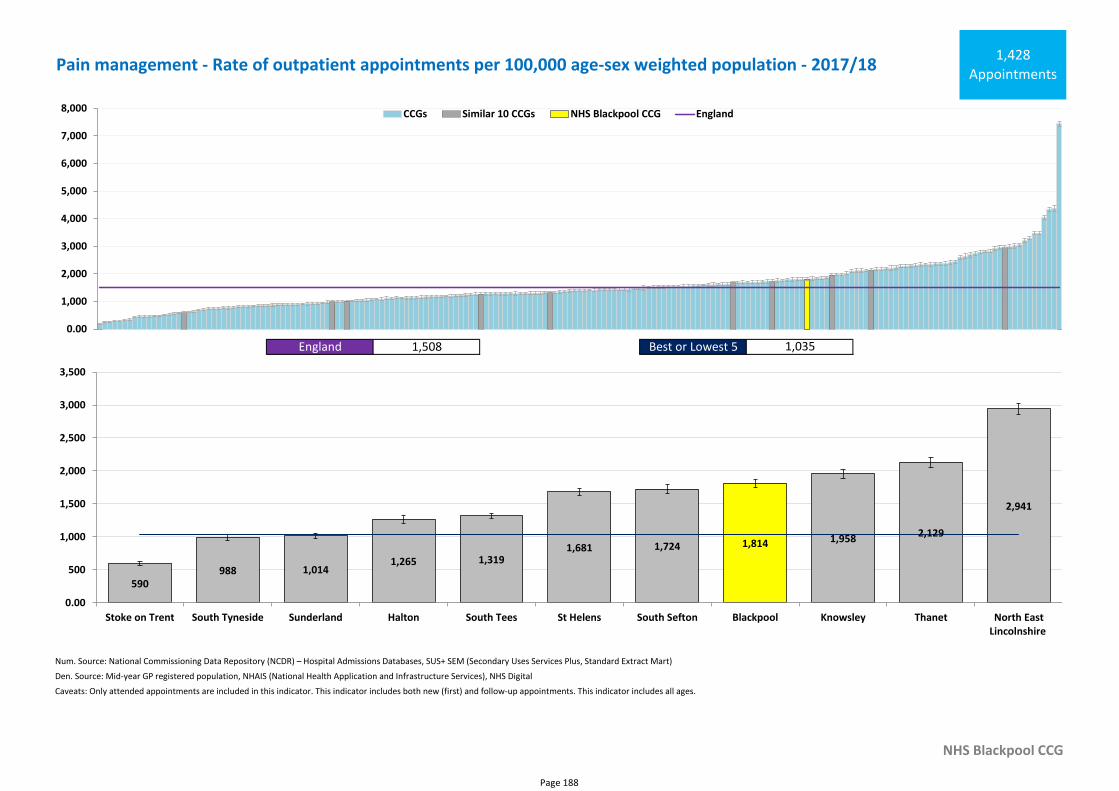
Num. Source: National Commissioning Data Repository (NCDR) – Hospital Admissions Databases, SUS+ SEM (Secondary Uses Services Plus, Standard Extract Mart)
Den. Source: Mid-year GP registered population, NHAIS (National Health Application and Infrastructure Services), NHS Digital
NHS Blackpool CCG
Caveats: Only attended appointments are included in this indicator. This indicator includes both new (first) and follow-up appointments. This indicator includes all ages.
Pain management - Rate of outpatient appointments per 100,000 age-sex weighted population - 2017/181,428
Appointments
England 1,508 Best or Lowest 5 1,035
0.00
1,000
2,000
3,000
4,000
5,000
6,000
7,000
8,000 CCGs Similar 10 CCGs NHS Blackpool CCG England
1,814
590988 1,014
1,265 1,3191,681 1,724
1,958 2,129
2,941
0.00
500
1,000
1,500
2,000
2,500
3,000
3,500
Stoke on Trent South Tyneside Sunderland Halton South Tees St Helens South Sefton Blackpool Knowsley Thanet North EastLincolnshire
Page 188
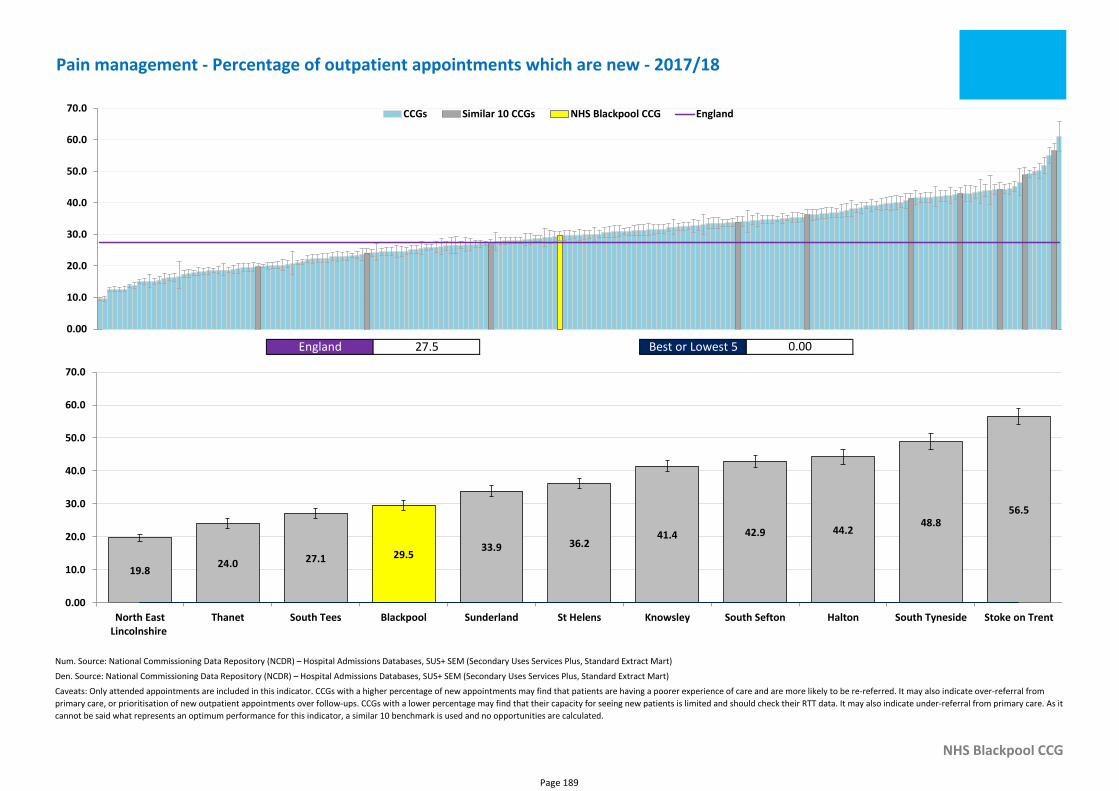
Num. Source: National Commissioning Data Repository (NCDR) – Hospital Admissions Databases, SUS+ SEM (Secondary Uses Services Plus, Standard Extract Mart)
Den. Source: National Commissioning Data Repository (NCDR) – Hospital Admissions Databases, SUS+ SEM (Secondary Uses Services Plus, Standard Extract Mart)
NHS Blackpool CCG
Caveats: Only attended appointments are included in this indicator. CCGs with a higher percentage of new appointments may find that patients are having a poorer experience of care and are more likely to be re-referred. It may also indicate over-referral from
primary care, or prioritisation of new outpatient appointments over follow-ups. CCGs with a lower percentage may find that their capacity for seeing new patients is limited and should check their RTT data. It may also indicate under-referral from primary care. As it
cannot be said what represents an optimum performance for this indicator, a similar 10 benchmark is used and no opportunities are calculated.
Pain management - Percentage of outpatient appointments which are new - 2017/18
England 27.5 Best or Lowest 5 0.00
0.00
10.0
20.0
30.0
40.0
50.0
60.0
70.0 CCGs Similar 10 CCGs NHS Blackpool CCG England
29.5
19.824.0 27.1
33.9 36.241.4 42.9 44.2
48.856.5
0.00
10.0
20.0
30.0
40.0
50.0
60.0
70.0
North EastLincolnshire
Thanet South Tees Blackpool Sunderland St Helens Knowsley South Sefton Halton South Tyneside Stoke on Trent
Page 189

Section 4 - Procedures
Page 190
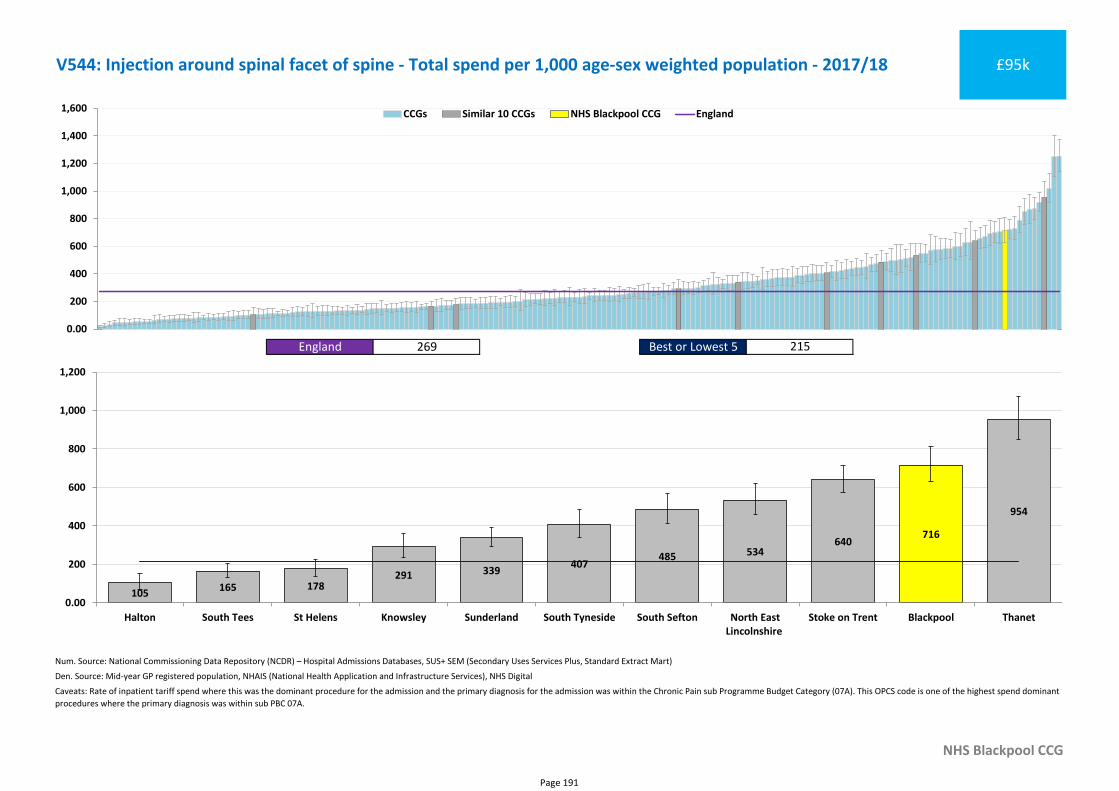
Num. Source: National Commissioning Data Repository (NCDR) – Hospital Admissions Databases, SUS+ SEM (Secondary Uses Services Plus, Standard Extract Mart)
Den. Source: Mid-year GP registered population, NHAIS (National Health Application and Infrastructure Services), NHS Digital
NHS Blackpool CCG
Caveats: Rate of inpatient tariff spend where this was the dominant procedure for the admission and the primary diagnosis for the admission was within the Chronic Pain sub Programme Budget Category (07A). This OPCS code is one of the highest spend dominant
procedures where the primary diagnosis was within sub PBC 07A.
V544: Injection around spinal facet of spine - Total spend per 1,000 age-sex weighted population - 2017/18 £95k
England 269 Best or Lowest 5 215
0.00
200
400
600
800
1,000
1,200
1,400
1,600 CCGs Similar 10 CCGs NHS Blackpool CCG England
716
105165 178
291 339407
485 534640
954
0.00
200
400
600
800
1,000
1,200
Halton South Tees St Helens Knowsley Sunderland South Tyneside South Sefton North EastLincolnshire
Stoke on Trent Blackpool Thanet
Page 191
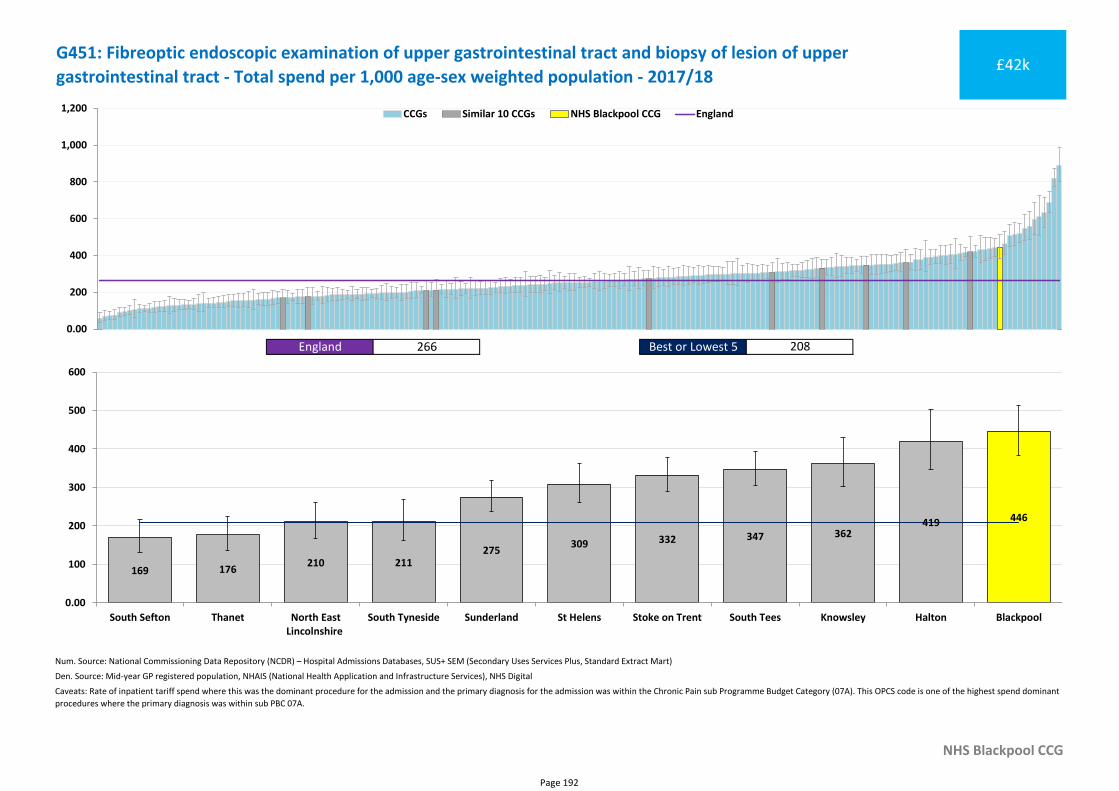
Num. Source: National Commissioning Data Repository (NCDR) – Hospital Admissions Databases, SUS+ SEM (Secondary Uses Services Plus, Standard Extract Mart)
Den. Source: Mid-year GP registered population, NHAIS (National Health Application and Infrastructure Services), NHS Digital
NHS Blackpool CCG
Caveats: Rate of inpatient tariff spend where this was the dominant procedure for the admission and the primary diagnosis for the admission was within the Chronic Pain sub Programme Budget Category (07A). This OPCS code is one of the highest spend dominant
procedures where the primary diagnosis was within sub PBC 07A.
G451: Fibreoptic endoscopic examination of upper gastrointestinal tract and biopsy of lesion of upper
gastrointestinal tract - Total spend per 1,000 age-sex weighted population - 2017/18£42k
England 266 Best or Lowest 5 208
0.00
200
400
600
800
1,000
1,200 CCGs Similar 10 CCGs NHS Blackpool CCG England
446
169 176210 211
275309 332 347 362
419
0.00
100
200
300
400
500
600
South Sefton Thanet North EastLincolnshire
South Tyneside Sunderland St Helens Stoke on Trent South Tees Knowsley Halton Blackpool
Page 192
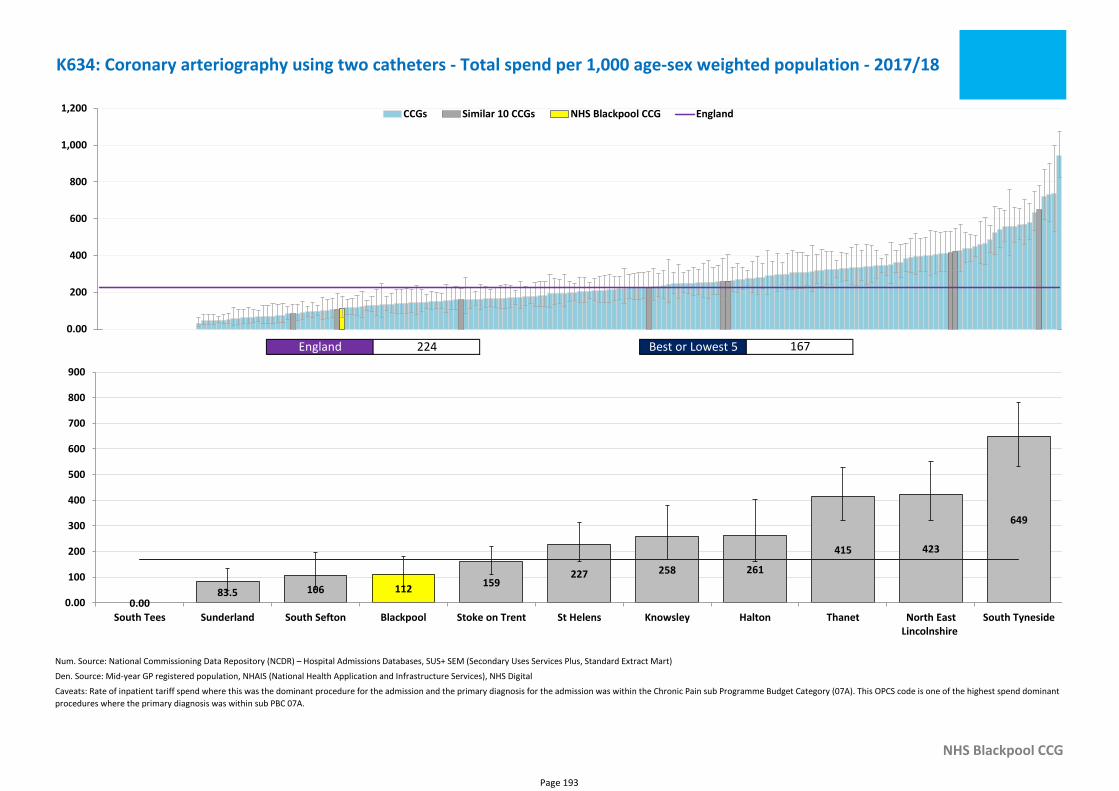
Num. Source: National Commissioning Data Repository (NCDR) – Hospital Admissions Databases, SUS+ SEM (Secondary Uses Services Plus, Standard Extract Mart)
Den. Source: Mid-year GP registered population, NHAIS (National Health Application and Infrastructure Services), NHS Digital
NHS Blackpool CCG
Caveats: Rate of inpatient tariff spend where this was the dominant procedure for the admission and the primary diagnosis for the admission was within the Chronic Pain sub Programme Budget Category (07A). This OPCS code is one of the highest spend dominant
procedures where the primary diagnosis was within sub PBC 07A.
K634: Coronary arteriography using two catheters - Total spend per 1,000 age-sex weighted population - 2017/18
England 224 Best or Lowest 5 167
0.00
200
400
600
800
1,000
1,200 CCGs Similar 10 CCGs NHS Blackpool CCG England
112
0.0083.5 106
159227 258 261
415 423
649
0.00
100
200
300
400
500
600
700
800
900
South Tees Sunderland South Sefton Blackpool Stoke on Trent St Helens Knowsley Halton Thanet North EastLincolnshire
South Tyneside
Page 193
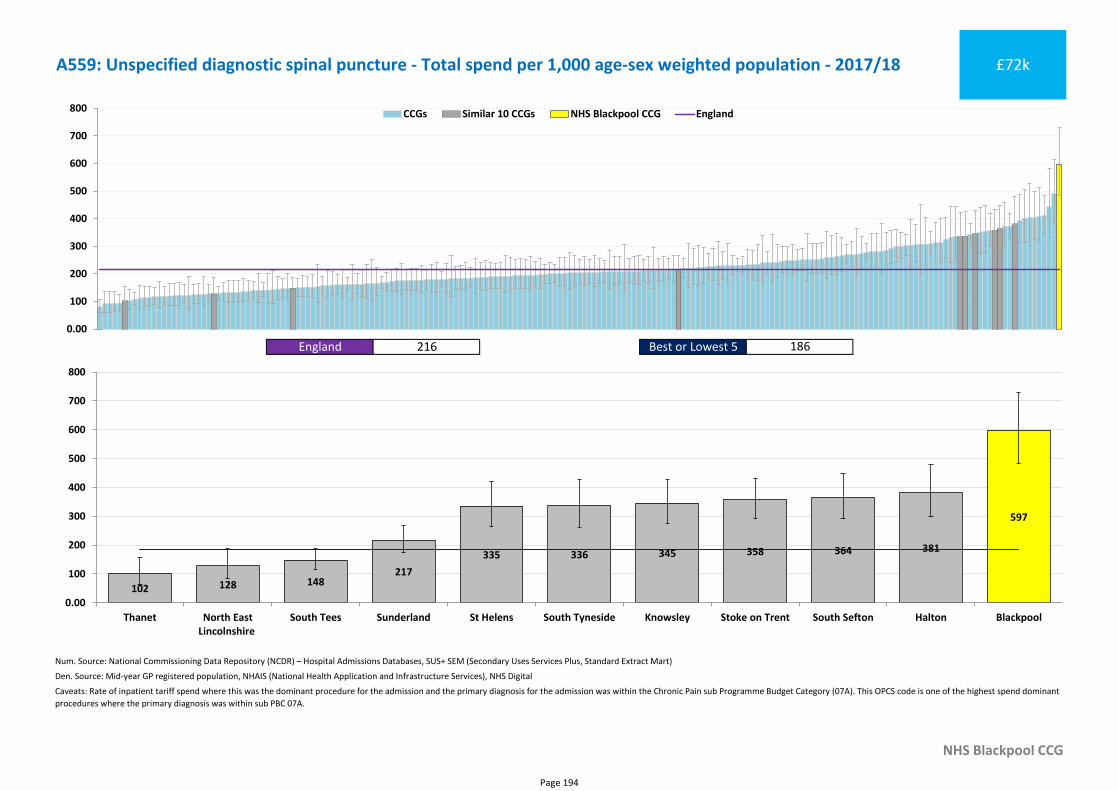
Num. Source: National Commissioning Data Repository (NCDR) – Hospital Admissions Databases, SUS+ SEM (Secondary Uses Services Plus, Standard Extract Mart)
Den. Source: Mid-year GP registered population, NHAIS (National Health Application and Infrastructure Services), NHS Digital
NHS Blackpool CCG
Caveats: Rate of inpatient tariff spend where this was the dominant procedure for the admission and the primary diagnosis for the admission was within the Chronic Pain sub Programme Budget Category (07A). This OPCS code is one of the highest spend dominant
procedures where the primary diagnosis was within sub PBC 07A.
A559: Unspecified diagnostic spinal puncture - Total spend per 1,000 age-sex weighted population - 2017/18 £72k
England 216 Best or Lowest 5 186
0.00
100
200
300
400
500
600
700
800 CCGs Similar 10 CCGs NHS Blackpool CCG England
597
102 128 148217
335 336 345 358 364 381
0.00
100
200
300
400
500
600
700
800
Thanet North EastLincolnshire
South Tees Sunderland St Helens South Tyneside Knowsley Stoke on Trent South Sefton Halton Blackpool
Page 194
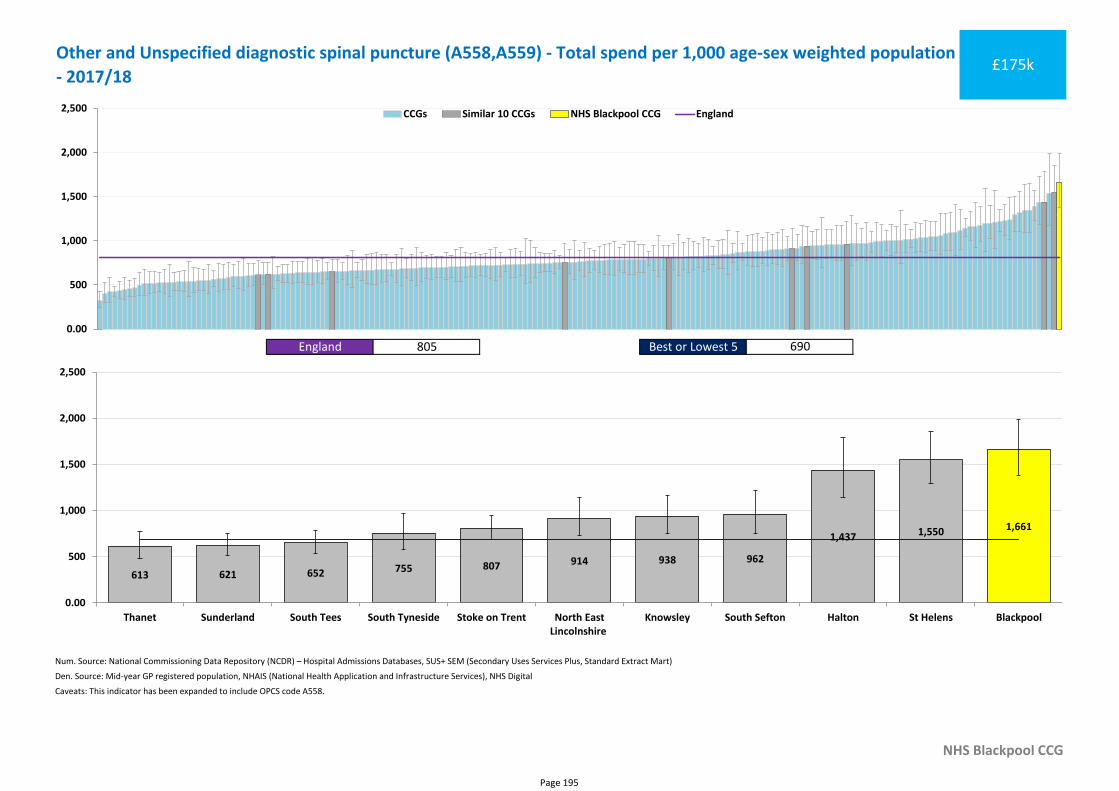
Num. Source: National Commissioning Data Repository (NCDR) – Hospital Admissions Databases, SUS+ SEM (Secondary Uses Services Plus, Standard Extract Mart)
Den. Source: Mid-year GP registered population, NHAIS (National Health Application and Infrastructure Services), NHS Digital
NHS Blackpool CCG
Caveats: This indicator has been expanded to include OPCS code A558.
Other and Unspecified diagnostic spinal puncture (A558,A559) - Total spend per 1,000 age-sex weighted population
- 2017/18£175k
England 805 Best or Lowest 5 690
0.00
500
1,000
1,500
2,000
2,500 CCGs Similar 10 CCGs NHS Blackpool CCG England
1,661
613 621 652 755 807 914 938 962
1,437 1,550
0.00
500
1,000
1,500
2,000
2,500
Thanet Sunderland South Tees South Tyneside Stoke on Trent North EastLincolnshire
Knowsley South Sefton Halton St Helens Blackpool
Page 195
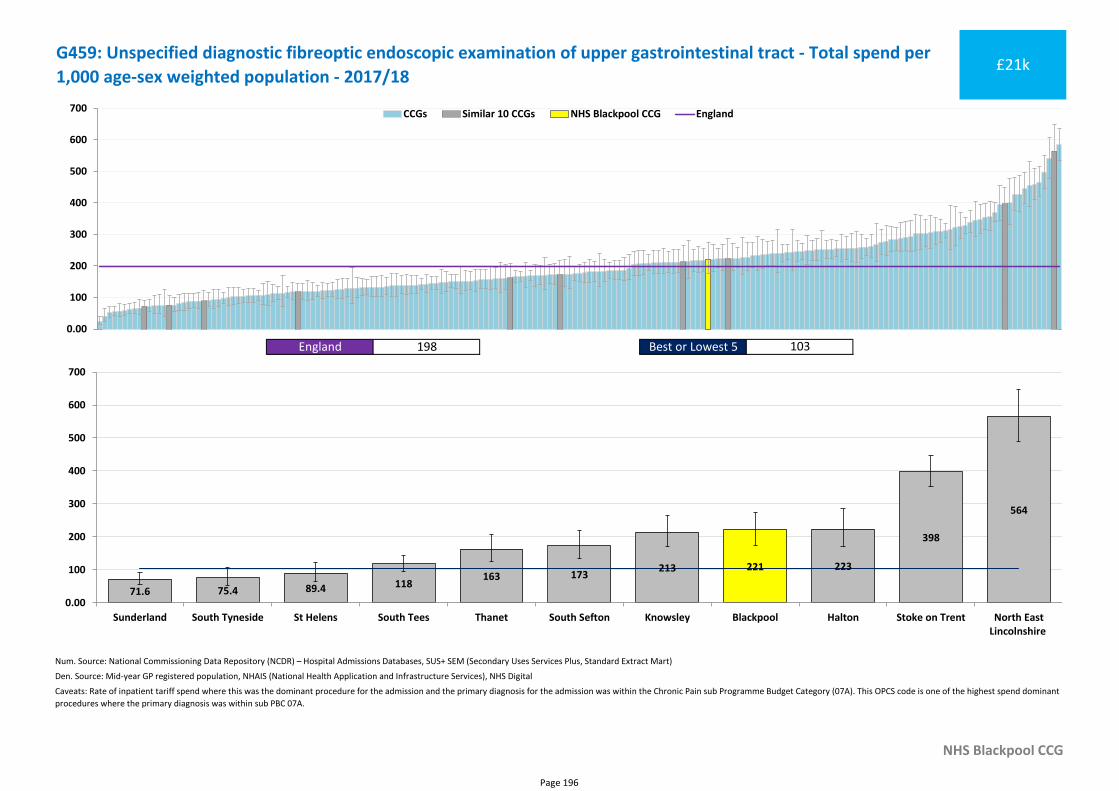
Num. Source: National Commissioning Data Repository (NCDR) – Hospital Admissions Databases, SUS+ SEM (Secondary Uses Services Plus, Standard Extract Mart)
Den. Source: Mid-year GP registered population, NHAIS (National Health Application and Infrastructure Services), NHS Digital
NHS Blackpool CCG
Caveats: Rate of inpatient tariff spend where this was the dominant procedure for the admission and the primary diagnosis for the admission was within the Chronic Pain sub Programme Budget Category (07A). This OPCS code is one of the highest spend dominant
procedures where the primary diagnosis was within sub PBC 07A.
G459: Unspecified diagnostic fibreoptic endoscopic examination of upper gastrointestinal tract - Total spend per
1,000 age-sex weighted population - 2017/18£21k
England 198 Best or Lowest 5 103
0.00
100
200
300
400
500
600
700 CCGs Similar 10 CCGs NHS Blackpool CCG England
221
71.6 75.4 89.4 118163 173
213 223
398
564
0.00
100
200
300
400
500
600
700
Sunderland South Tyneside St Helens South Tees Thanet South Sefton Knowsley Blackpool Halton Stoke on Trent North EastLincolnshire
Page 196
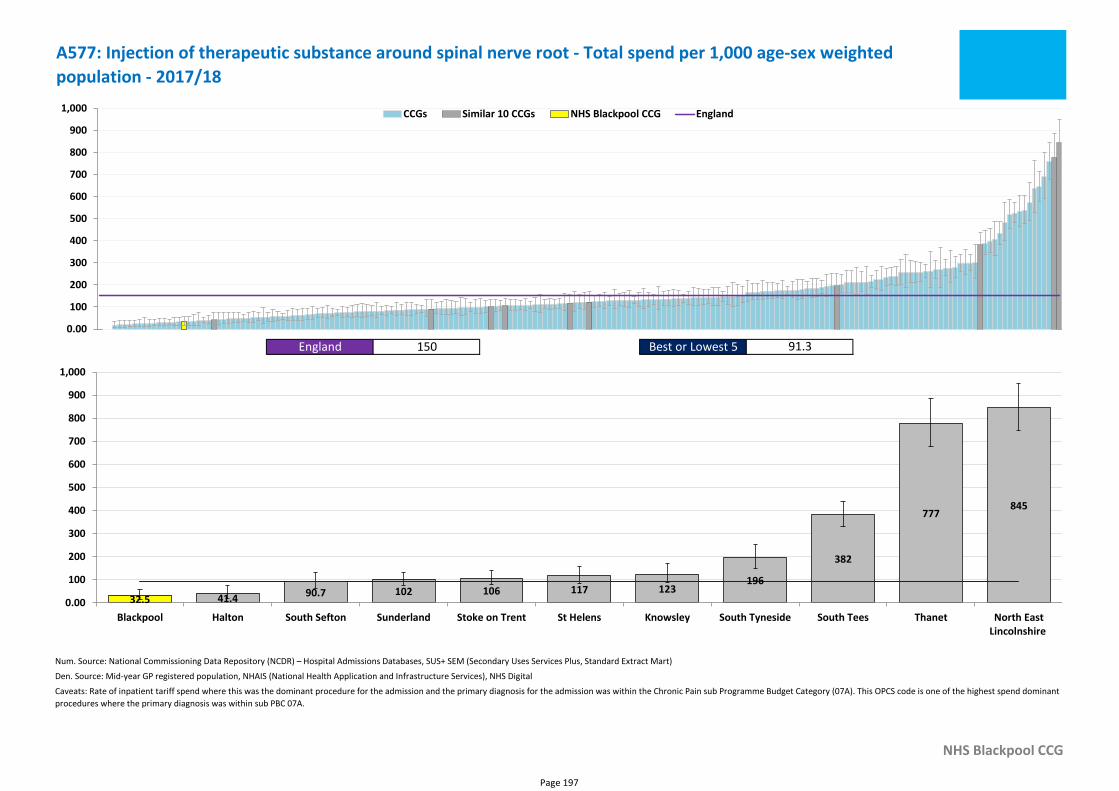
Num. Source: National Commissioning Data Repository (NCDR) – Hospital Admissions Databases, SUS+ SEM (Secondary Uses Services Plus, Standard Extract Mart)
Den. Source: Mid-year GP registered population, NHAIS (National Health Application and Infrastructure Services), NHS Digital
NHS Blackpool CCG
Caveats: Rate of inpatient tariff spend where this was the dominant procedure for the admission and the primary diagnosis for the admission was within the Chronic Pain sub Programme Budget Category (07A). This OPCS code is one of the highest spend dominant
procedures where the primary diagnosis was within sub PBC 07A.
A577: Injection of therapeutic substance around spinal nerve root - Total spend per 1,000 age-sex weighted
population - 2017/18
England 150 Best or Lowest 5 91.3
0.00
100
200
300
400
500
600
700
800
900
1,000 CCGs Similar 10 CCGs NHS Blackpool CCG England
32.5 41.4 90.7 102 106 117 123196
382
777845
0.00
100
200
300
400
500
600
700
800
900
1,000
Blackpool Halton South Sefton Sunderland Stoke on Trent St Helens Knowsley South Tyneside South Tees Thanet North EastLincolnshire
Page 197
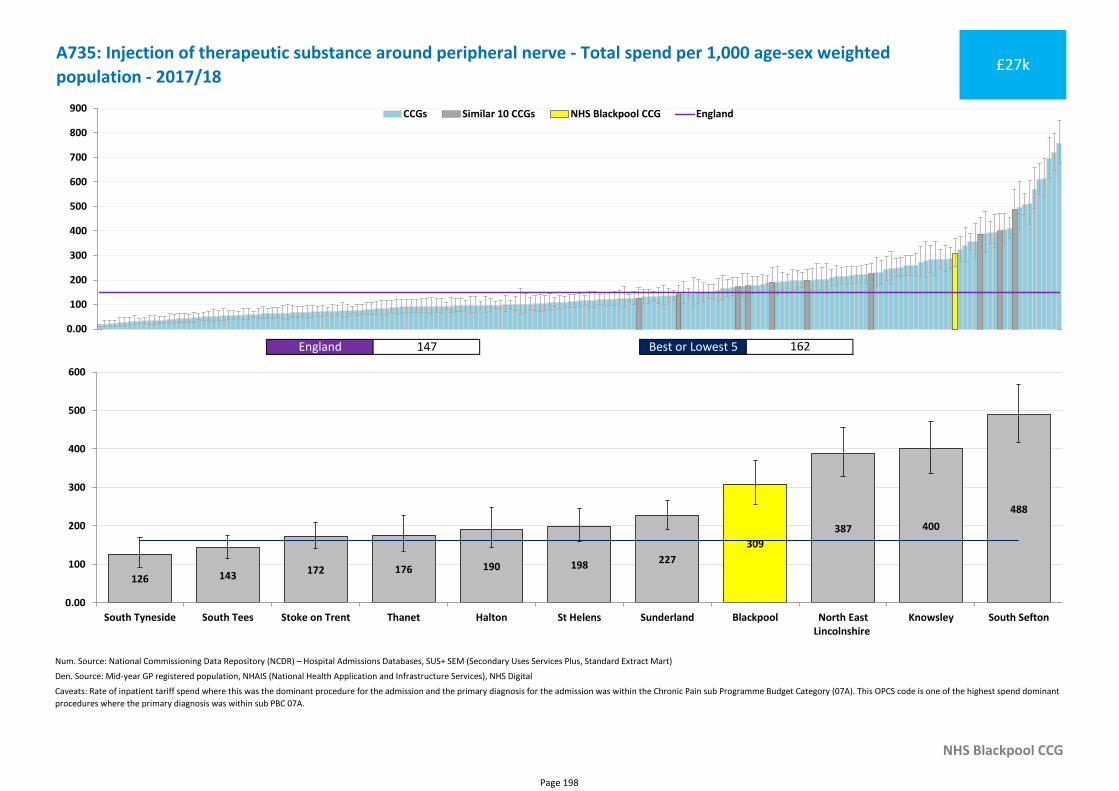
Num. Source: National Commissioning Data Repository (NCDR) – Hospital Admissions Databases, SUS+ SEM (Secondary Uses Services Plus, Standard Extract Mart)
Den. Source: Mid-year GP registered population, NHAIS (National Health Application and Infrastructure Services), NHS Digital
NHS Blackpool CCG
Caveats: Rate of inpatient tariff spend where this was the dominant procedure for the admission and the primary diagnosis for the admission was within the Chronic Pain sub Programme Budget Category (07A). This OPCS code is one of the highest spend dominant
procedures where the primary diagnosis was within sub PBC 07A.
A735: Injection of therapeutic substance around peripheral nerve - Total spend per 1,000 age-sex weighted
population - 2017/18£27k
England 147 Best or Lowest 5 162
0.00
100
200
300
400
500
600
700
800
900 CCGs Similar 10 CCGs NHS Blackpool CCG England
309
126 143 172 176 190 198 227
387 400
488
0.00
100
200
300
400
500
600
South Tyneside South Tees Stoke on Trent Thanet Halton St Helens Sunderland Blackpool North EastLincolnshire
Knowsley South Sefton
Page 198
Part III - Programme Budgeting
Page 199
Programme Budgeting Expenditure Dataset: Charts for Neurological Problems
This pack includes the following indicators derived from the CCG Programme Budgeting Dataset:
• Aggregate expenditure on care settings recommended for benchmarking• Outpatient expenditure (for attendances and procedures in scope of national tariff) • Inpatient expenditure (for all elective and non-elective admissions in scope of national tariff)• Inpatient expenditure on elective admissions (in scope of national tariff)• Inpatient expenditure on non-elective admissions (in scope of national tariff)
The programme budgeting dataset provides an analysis of CCG’s total expenditure by 23 programmes of care, which are based on disease classifications known as Programme Budgeting Categories (PBCs). Neurological problems is PBC 07.
The dataset contains programme level expenditure data as reported by CCGs, rather than taken from central datasets. This means that it includes adjustments for local variations to national prices, contract penalties and best practice tariffs not processed through the Secondary Uses Service (SUS).
The data therefore provide a useful opportunity for triangulation against SUS indicators derived from the National Commissioning Data Repository (NCDR), which are calculated using activity combined with national prices.
Page 200
Programme Budgeting Expenditure Dataset: OverviewThe CCG programme budgeting dataset provides information on CCG spend by ‘care setting’ as well as by condition. Examples of care settings include primary care prescribing, elective admissions, outpatient attendances etc. The programme budgeting dataset included 13 care settings in 2017/18.
Within the programme budgeting benchmarking tool the care settings are classified as either ‘care settings recommended for benchmarking’ or ‘other care settings’. ‘Care settings recommended for benchmarking’ are those in which expenditure can be reliably compared, as the underlying data sources and calculation methodologies are consistent across organisations. The ‘other care settings’ are not recommended for benchmarking as any variation may be due to differences in data source or calculation methodology.
The aim of the dataset is to eventually provide health condition group level expenditure which can be used for benchmarking across the whole care pathway.
Page 201
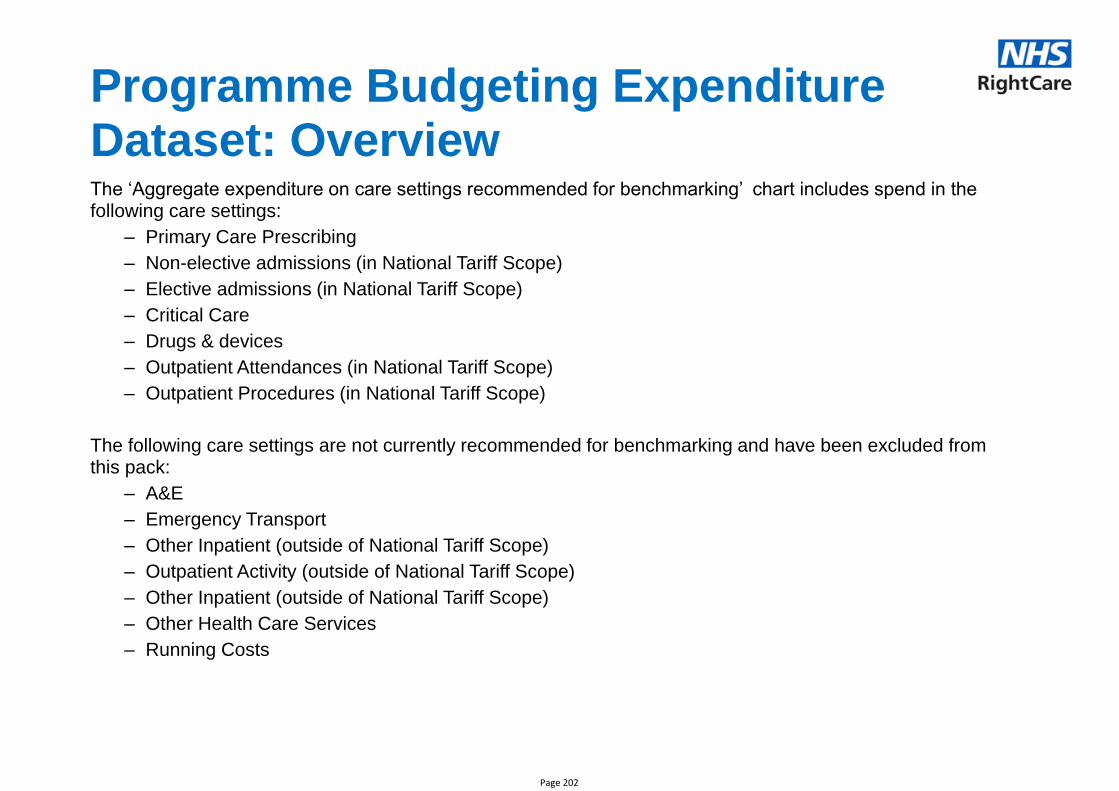
Programme Budgeting Expenditure Dataset: OverviewThe ‘Aggregate expenditure on care settings recommended for benchmarking’ chart includes spend in the following care settings:
– Primary Care Prescribing
– Non-elective admissions (in National Tariff Scope)
– Elective admissions (in National Tariff Scope)
– Critical Care
– Drugs & devices
– Outpatient Attendances (in National Tariff Scope)
– Outpatient Procedures (in National Tariff Scope)
The following care settings are not currently recommended for benchmarking and have been excluded from this pack:
– A&E
– Emergency Transport
– Other Inpatient (outside of National Tariff Scope)
– Outpatient Activity (outside of National Tariff Scope)
– Other Inpatient (outside of National Tariff Scope)
– Other Health Care Services
– Running Costs
Page 202
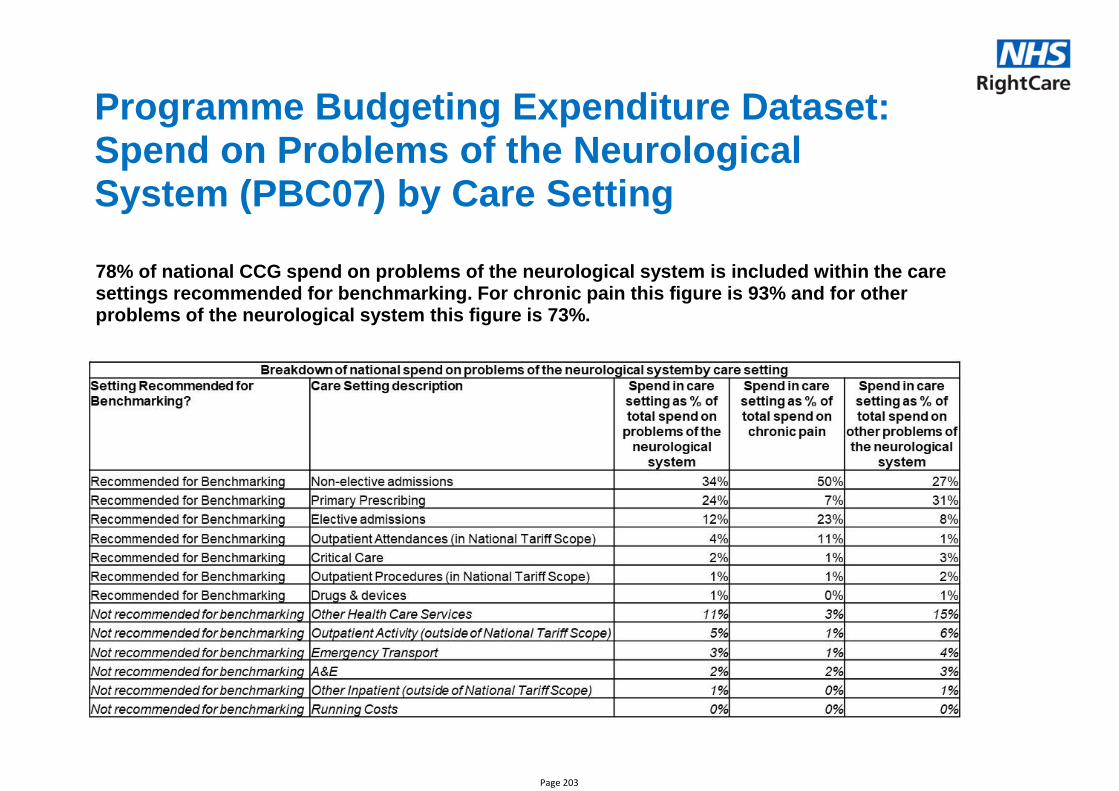
Programme Budgeting Expenditure Dataset: Spend on Problems of the Neurological System (PBC07) by Care Setting
78% of national CCG spend on problems of the neurological system is included within the care settings recommended for benchmarking. For chronic pain this figure is 93% and for other problems of the neurological system this figure is 73%.
Page 203
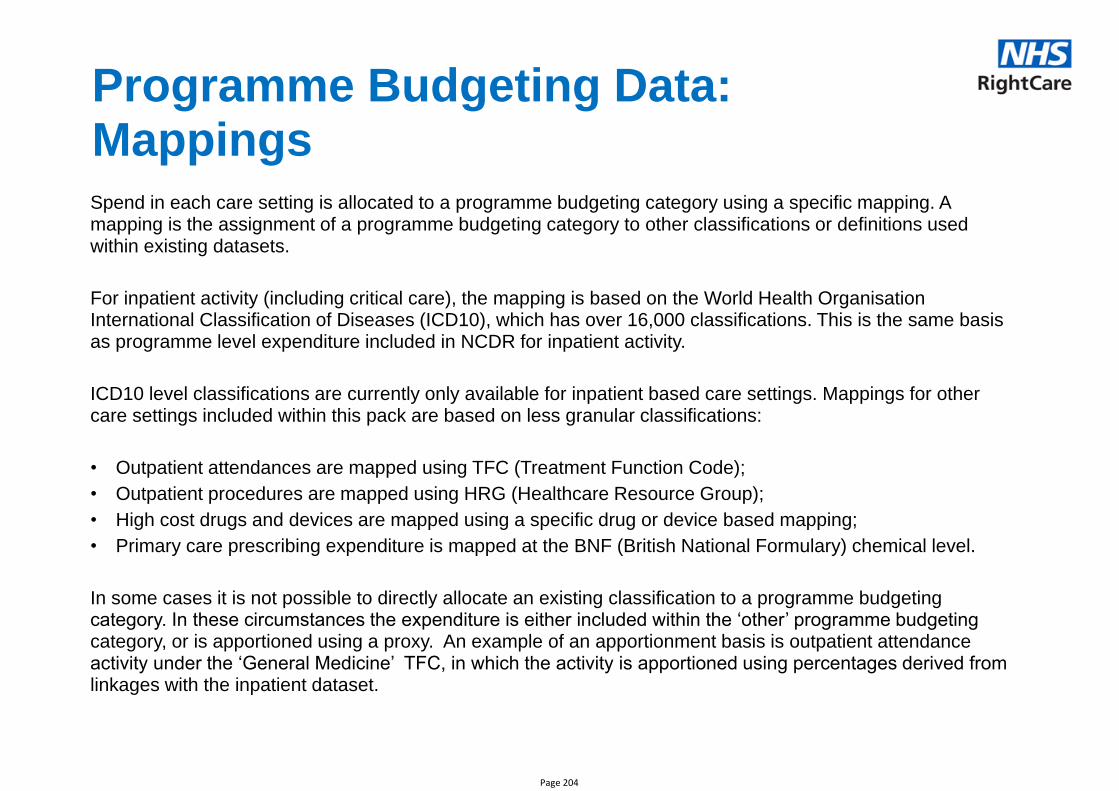
Programme Budgeting Data: MappingsSpend in each care setting is allocated to a programme budgeting category using a specific mapping. A mapping is the assignment of a programme budgeting category to other classifications or definitions used within existing datasets.
For inpatient activity (including critical care), the mapping is based on the World Health Organisation International Classification of Diseases (ICD10), which has over 16,000 classifications. This is the same basis as programme level expenditure included in NCDR for inpatient activity.
ICD10 level classifications are currently only available for inpatient based care settings. Mappings for other care settings included within this pack are based on less granular classifications:
• Outpatient attendances are mapped using TFC (Treatment Function Code);
• Outpatient procedures are mapped using HRG (Healthcare Resource Group);
• High cost drugs and devices are mapped using a specific drug or device based mapping;
• Primary care prescribing expenditure is mapped at the BNF (British National Formulary) chemical level.
In some cases it is not possible to directly allocate an existing classification to a programme budgeting category. In these circumstances the expenditure is either included within the ‘other’ programme budgeting category, or is apportioned using a proxy. An example of an apportionment basis is outpatient attendance activity under the ‘General Medicine’ TFC, in which the activity is apportioned using percentages derived from linkages with the inpatient dataset.
Page 204
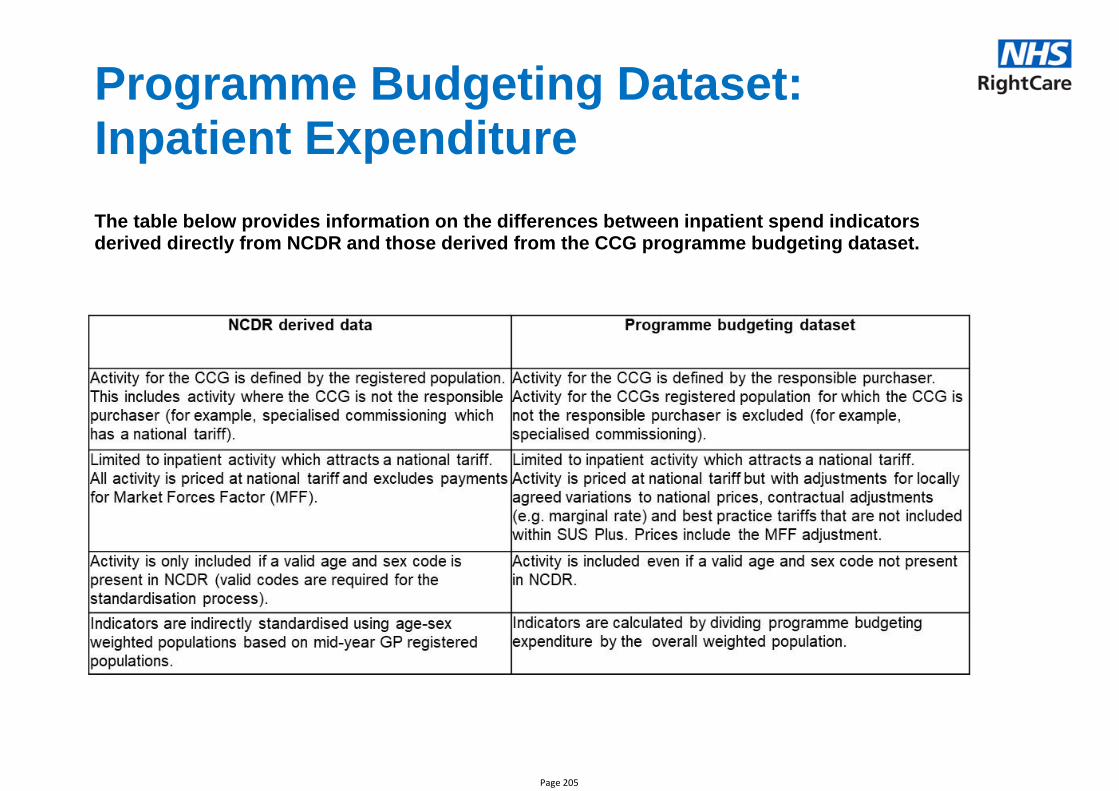
Programme Budgeting Dataset: Inpatient Expenditure
The table below provides information on the differences between inpatient spend indicators derived directly from NCDR and those derived from the CCG programme budgeting dataset.
Page 205
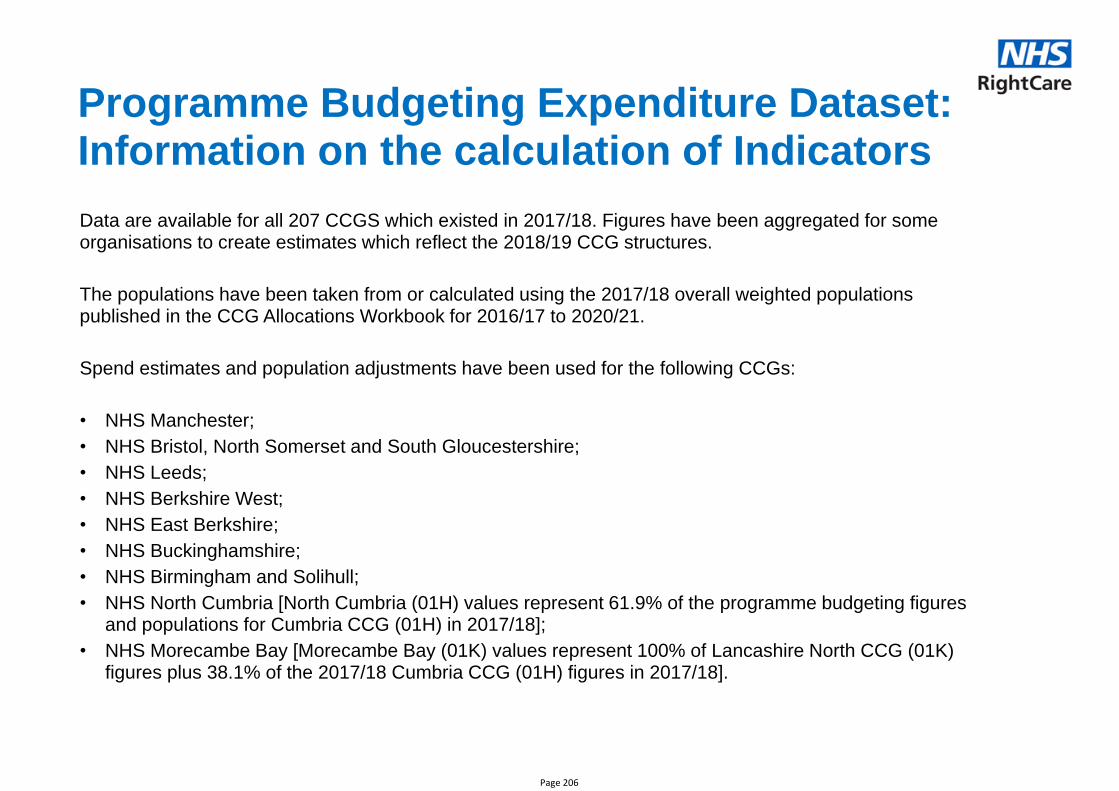
Programme Budgeting Expenditure Dataset: Information on the calculation of Indicators
Data are available for all 207 CCGS which existed in 2017/18. Figures have been aggregated for some organisations to create estimates which reflect the 2018/19 CCG structures.
The populations have been taken from or calculated using the 2017/18 overall weighted populations published in the CCG Allocations Workbook for 2016/17 to 2020/21.
Spend estimates and population adjustments have been used for the following CCGs:
• NHS Manchester;
• NHS Bristol, North Somerset and South Gloucestershire;
• NHS Leeds;
• NHS Berkshire West;
• NHS East Berkshire;
• NHS Buckinghamshire;
• NHS Birmingham and Solihull;
• NHS North Cumbria [North Cumbria (01H) values represent 61.9% of the programme budgeting figures and populations for Cumbria CCG (01H) in 2017/18];
• NHS Morecambe Bay [Morecambe Bay (01K) values represent 100% of Lancashire North CCG (01K) figures plus 38.1% of the 2017/18 Cumbria CCG (01H) figures in 2017/18].
Page 206
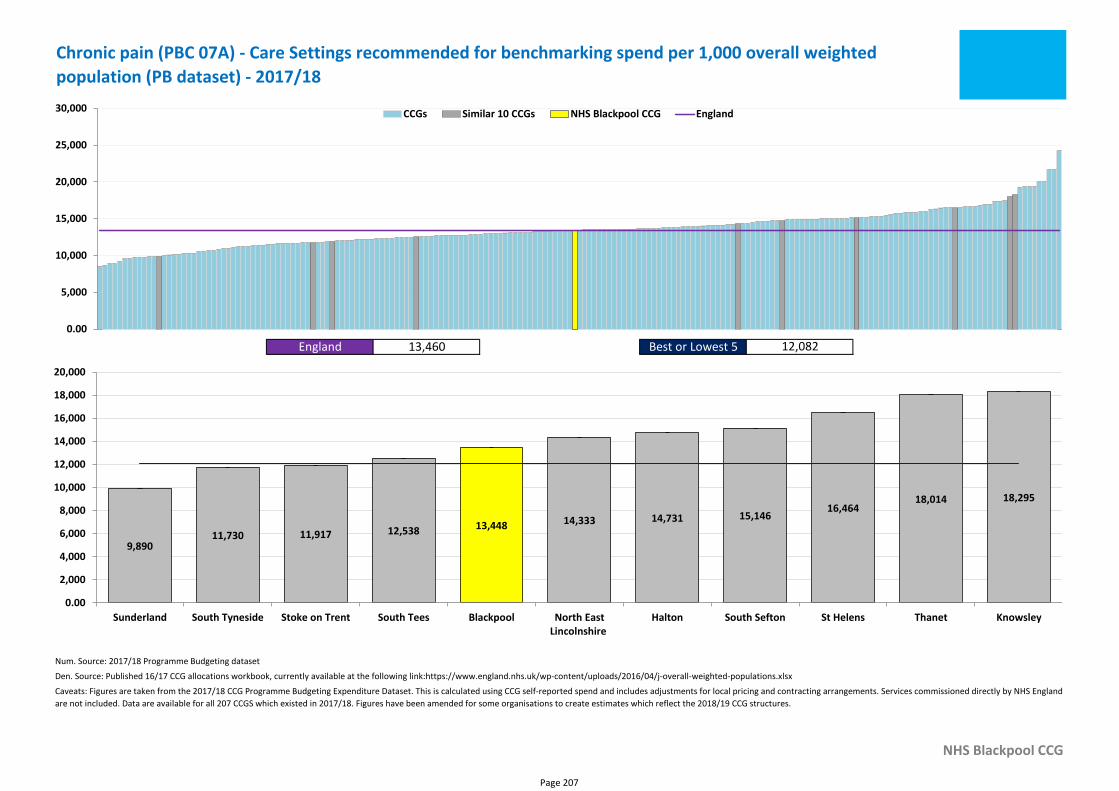
Num. Source: 2017/18 Programme Budgeting dataset
Den. Source: Published 16/17 CCG allocations workbook, currently available at the following link:https://www.england.nhs.uk/wp-content/uploads/2016/04/j-overall-weighted-populations.xlsx
NHS Blackpool CCG
Caveats: Figures are taken from the 2017/18 CCG Programme Budgeting Expenditure Dataset. This is calculated using CCG self-reported spend and includes adjustments for local pricing and contracting arrangements. Services commissioned directly by NHS England
are not included. Data are available for all 207 CCGS which existed in 2017/18. Figures have been amended for some organisations to create estimates which reflect the 2018/19 CCG structures.
Chronic pain (PBC 07A) - Care Settings recommended for benchmarking spend per 1,000 overall weighted
population (PB dataset) - 2017/18
England 13,460 Best or Lowest 5 12,082
0.00
5,000
10,000
15,000
20,000
25,000
30,000 CCGs Similar 10 CCGs NHS Blackpool CCG England
13,448
9,89011,730 11,917 12,538
14,333 14,731 15,14616,464
18,014 18,295
0.00
2,000
4,000
6,000
8,000
10,000
12,000
14,000
16,000
18,000
20,000
Sunderland South Tyneside Stoke on Trent South Tees Blackpool North EastLincolnshire
Halton South Sefton St Helens Thanet Knowsley
Page 207
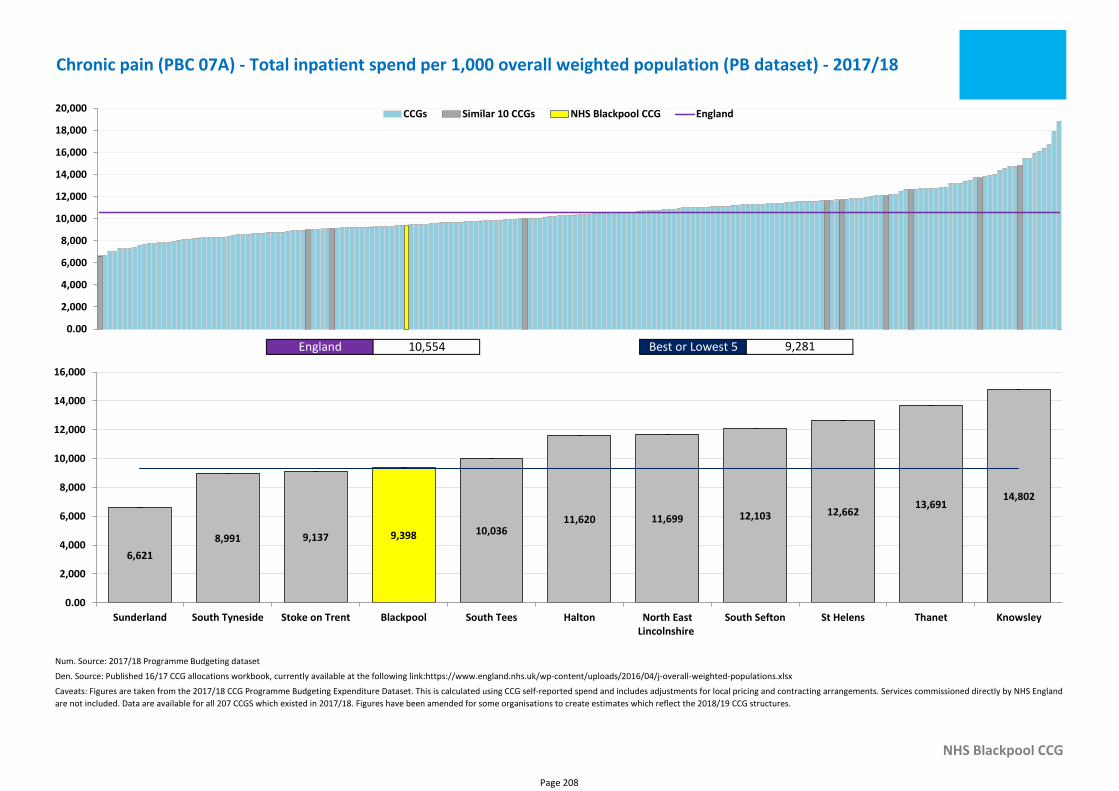
Num. Source: 2017/18 Programme Budgeting dataset
Den. Source: Published 16/17 CCG allocations workbook, currently available at the following link:https://www.england.nhs.uk/wp-content/uploads/2016/04/j-overall-weighted-populations.xlsx
NHS Blackpool CCG
Caveats: Figures are taken from the 2017/18 CCG Programme Budgeting Expenditure Dataset. This is calculated using CCG self-reported spend and includes adjustments for local pricing and contracting arrangements. Services commissioned directly by NHS England
are not included. Data are available for all 207 CCGS which existed in 2017/18. Figures have been amended for some organisations to create estimates which reflect the 2018/19 CCG structures.
Chronic pain (PBC 07A) - Total inpatient spend per 1,000 overall weighted population (PB dataset) - 2017/18
England 10,554 Best or Lowest 5 9,281
0.00
2,000
4,000
6,000
8,000
10,000
12,000
14,000
16,000
18,000
20,000 CCGs Similar 10 CCGs NHS Blackpool CCG England
9,398
6,621
8,991 9,13710,036
11,620 11,699 12,103 12,66213,691
14,802
0.00
2,000
4,000
6,000
8,000
10,000
12,000
14,000
16,000
Sunderland South Tyneside Stoke on Trent Blackpool South Tees Halton North EastLincolnshire
South Sefton St Helens Thanet Knowsley
Page 208
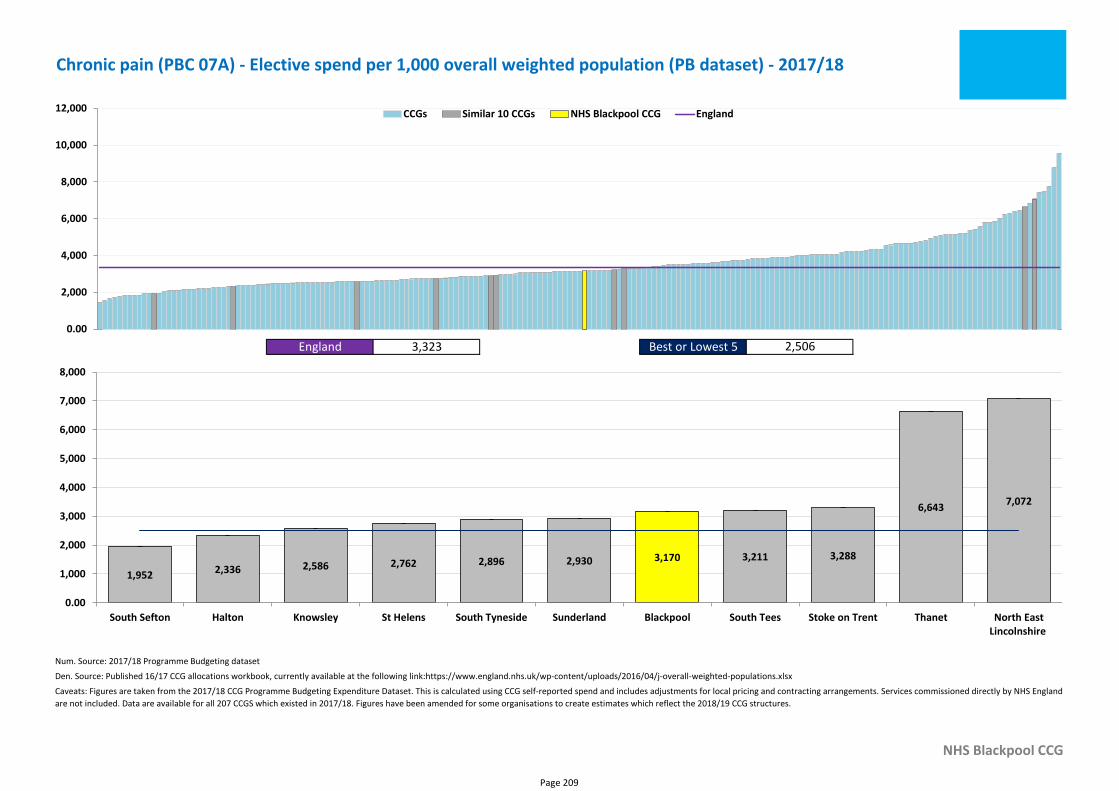
Num. Source: 2017/18 Programme Budgeting dataset
Den. Source: Published 16/17 CCG allocations workbook, currently available at the following link:https://www.england.nhs.uk/wp-content/uploads/2016/04/j-overall-weighted-populations.xlsx
NHS Blackpool CCG
Caveats: Figures are taken from the 2017/18 CCG Programme Budgeting Expenditure Dataset. This is calculated using CCG self-reported spend and includes adjustments for local pricing and contracting arrangements. Services commissioned directly by NHS England
are not included. Data are available for all 207 CCGS which existed in 2017/18. Figures have been amended for some organisations to create estimates which reflect the 2018/19 CCG structures.
Chronic pain (PBC 07A) - Elective spend per 1,000 overall weighted population (PB dataset) - 2017/18
England 3,323 Best or Lowest 5 2,506
0.00
2,000
4,000
6,000
8,000
10,000
12,000 CCGs Similar 10 CCGs NHS Blackpool CCG England
3,170
1,952 2,336 2,586 2,762 2,896 2,930 3,211 3,288
6,6437,072
0.00
1,000
2,000
3,000
4,000
5,000
6,000
7,000
8,000
South Sefton Halton Knowsley St Helens South Tyneside Sunderland Blackpool South Tees Stoke on Trent Thanet North EastLincolnshire
Page 209
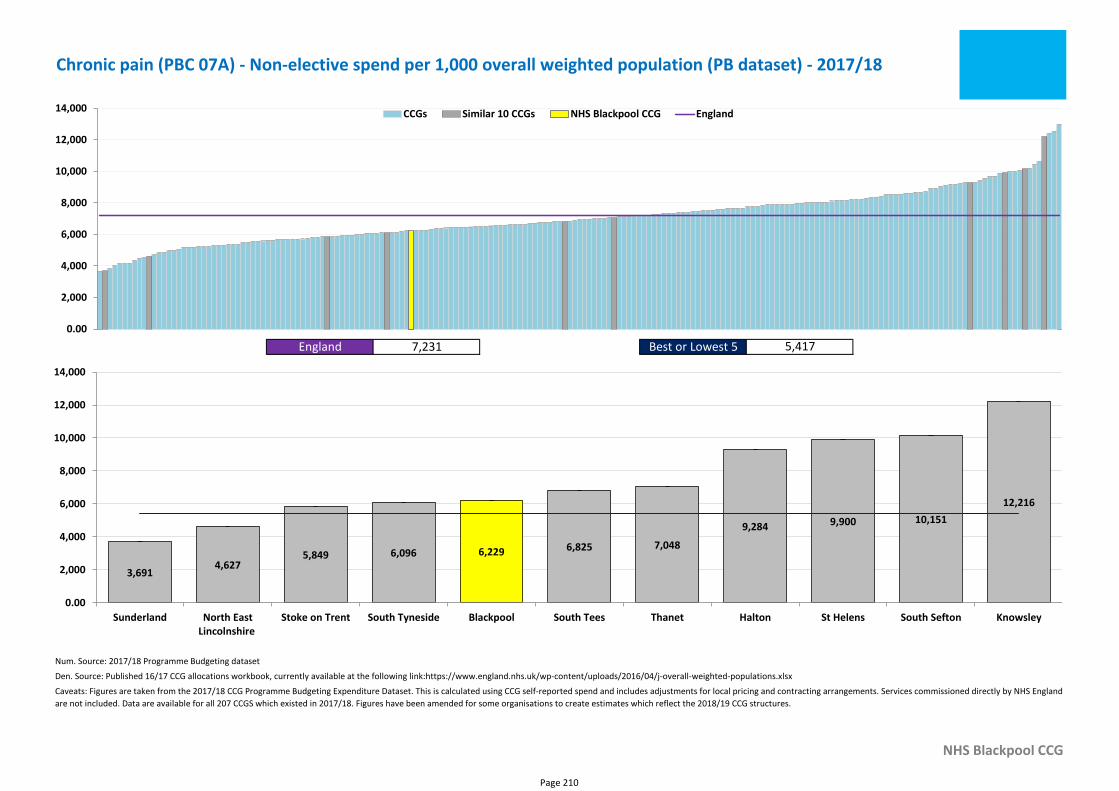
Num. Source: 2017/18 Programme Budgeting dataset
Den. Source: Published 16/17 CCG allocations workbook, currently available at the following link:https://www.england.nhs.uk/wp-content/uploads/2016/04/j-overall-weighted-populations.xlsx
NHS Blackpool CCG
Caveats: Figures are taken from the 2017/18 CCG Programme Budgeting Expenditure Dataset. This is calculated using CCG self-reported spend and includes adjustments for local pricing and contracting arrangements. Services commissioned directly by NHS England
are not included. Data are available for all 207 CCGS which existed in 2017/18. Figures have been amended for some organisations to create estimates which reflect the 2018/19 CCG structures.
Chronic pain (PBC 07A) - Non-elective spend per 1,000 overall weighted population (PB dataset) - 2017/18
England 7,231 Best or Lowest 5 5,417
0.00
2,000
4,000
6,000
8,000
10,000
12,000
14,000 CCGs Similar 10 CCGs NHS Blackpool CCG England
6,229
3,6914,627
5,849 6,0966,825 7,048
9,284 9,900 10,151
12,216
0.00
2,000
4,000
6,000
8,000
10,000
12,000
14,000
Sunderland North EastLincolnshire
Stoke on Trent South Tyneside Blackpool South Tees Thanet Halton St Helens South Sefton Knowsley
Page 210
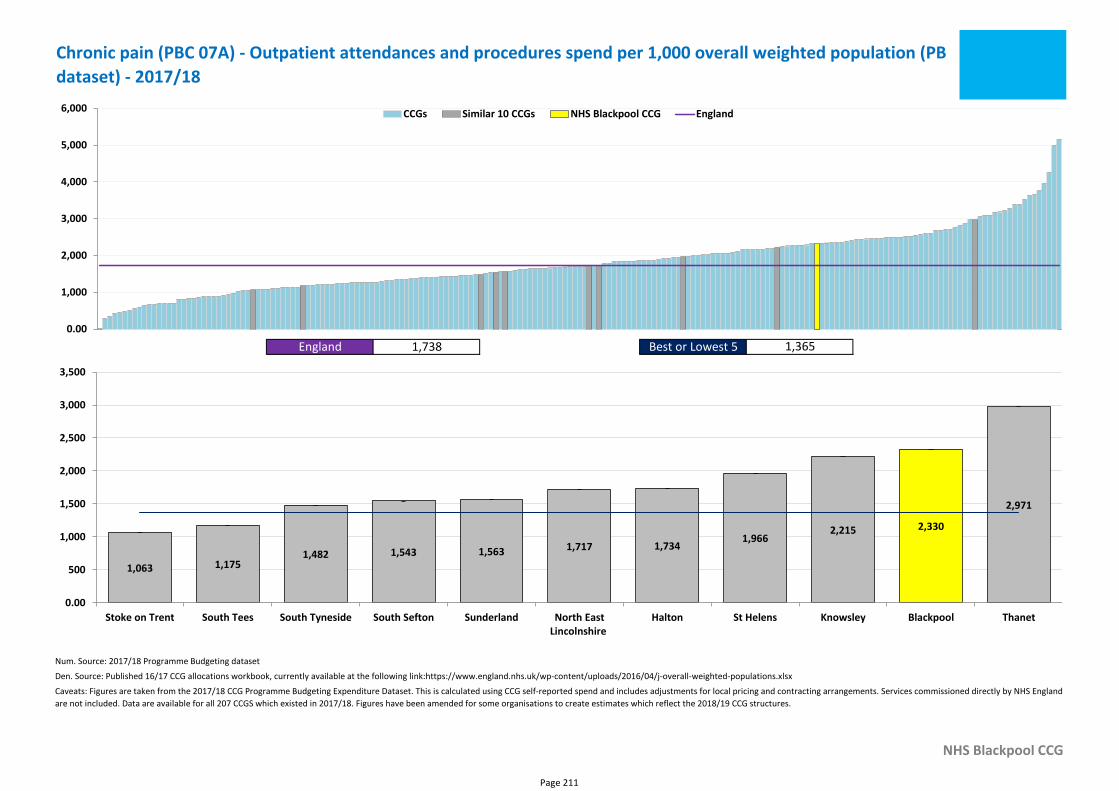
Num. Source: 2017/18 Programme Budgeting dataset
Den. Source: Published 16/17 CCG allocations workbook, currently available at the following link:https://www.england.nhs.uk/wp-content/uploads/2016/04/j-overall-weighted-populations.xlsx
NHS Blackpool CCG
Caveats: Figures are taken from the 2017/18 CCG Programme Budgeting Expenditure Dataset. This is calculated using CCG self-reported spend and includes adjustments for local pricing and contracting arrangements. Services commissioned directly by NHS England
are not included. Data are available for all 207 CCGS which existed in 2017/18. Figures have been amended for some organisations to create estimates which reflect the 2018/19 CCG structures.
Chronic pain (PBC 07A) - Outpatient attendances and procedures spend per 1,000 overall weighted population (PB
dataset) - 2017/18
England 1,738 Best or Lowest 5 1,365
0.00
1,000
2,000
3,000
4,000
5,000
6,000 CCGs Similar 10 CCGs NHS Blackpool CCG England
2,330
1,063 1,1751,482 1,543 1,563 1,717 1,734
1,9662,215
2,971
0.00
500
1,000
1,500
2,000
2,500
3,000
3,500
Stoke on Trent South Tees South Tyneside South Sefton Sunderland North EastLincolnshire
Halton St Helens Knowsley Blackpool Thanet
Page 211
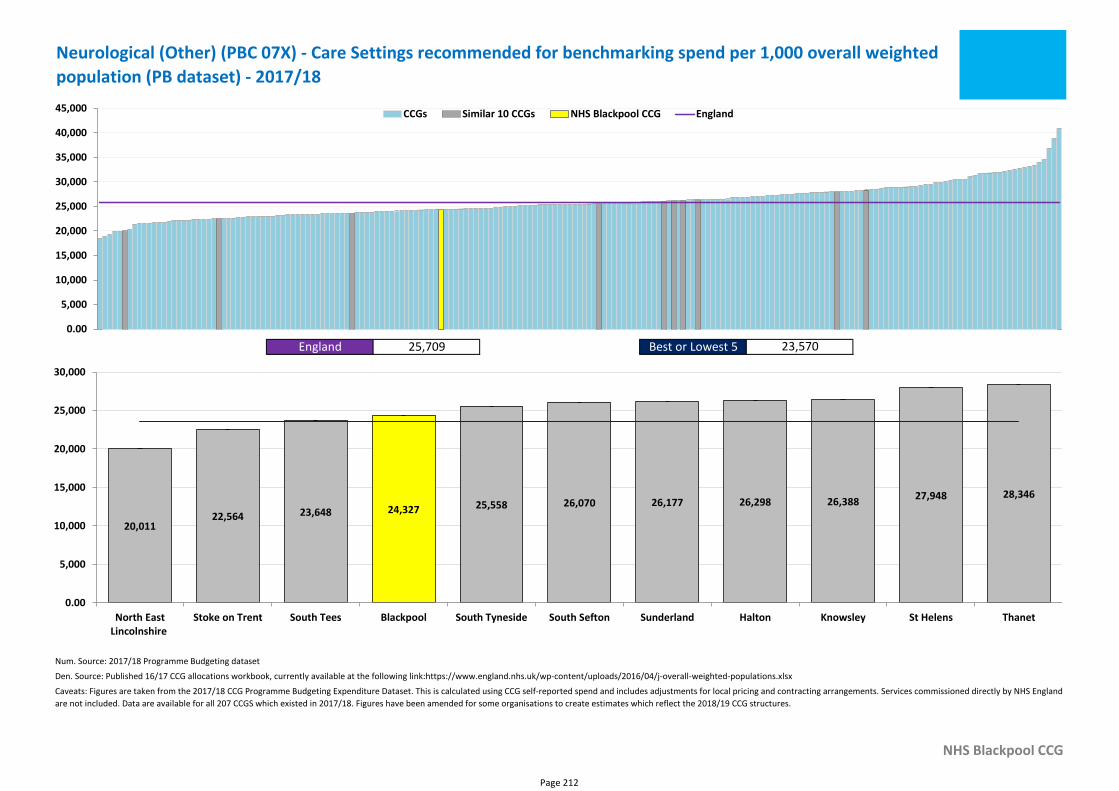
Num. Source: 2017/18 Programme Budgeting dataset
Den. Source: Published 16/17 CCG allocations workbook, currently available at the following link:https://www.england.nhs.uk/wp-content/uploads/2016/04/j-overall-weighted-populations.xlsx
NHS Blackpool CCG
Caveats: Figures are taken from the 2017/18 CCG Programme Budgeting Expenditure Dataset. This is calculated using CCG self-reported spend and includes adjustments for local pricing and contracting arrangements. Services commissioned directly by NHS England
are not included. Data are available for all 207 CCGS which existed in 2017/18. Figures have been amended for some organisations to create estimates which reflect the 2018/19 CCG structures.
Neurological (Other) (PBC 07X) - Care Settings recommended for benchmarking spend per 1,000 overall weighted
population (PB dataset) - 2017/18
England 25,709 Best or Lowest 5 23,570
0.00
5,000
10,000
15,000
20,000
25,000
30,000
35,000
40,000
45,000 CCGs Similar 10 CCGs NHS Blackpool CCG England
24,327
20,01122,564 23,648
25,558 26,070 26,177 26,298 26,38827,948 28,346
0.00
5,000
10,000
15,000
20,000
25,000
30,000
North EastLincolnshire
Stoke on Trent South Tees Blackpool South Tyneside South Sefton Sunderland Halton Knowsley St Helens Thanet
Page 212
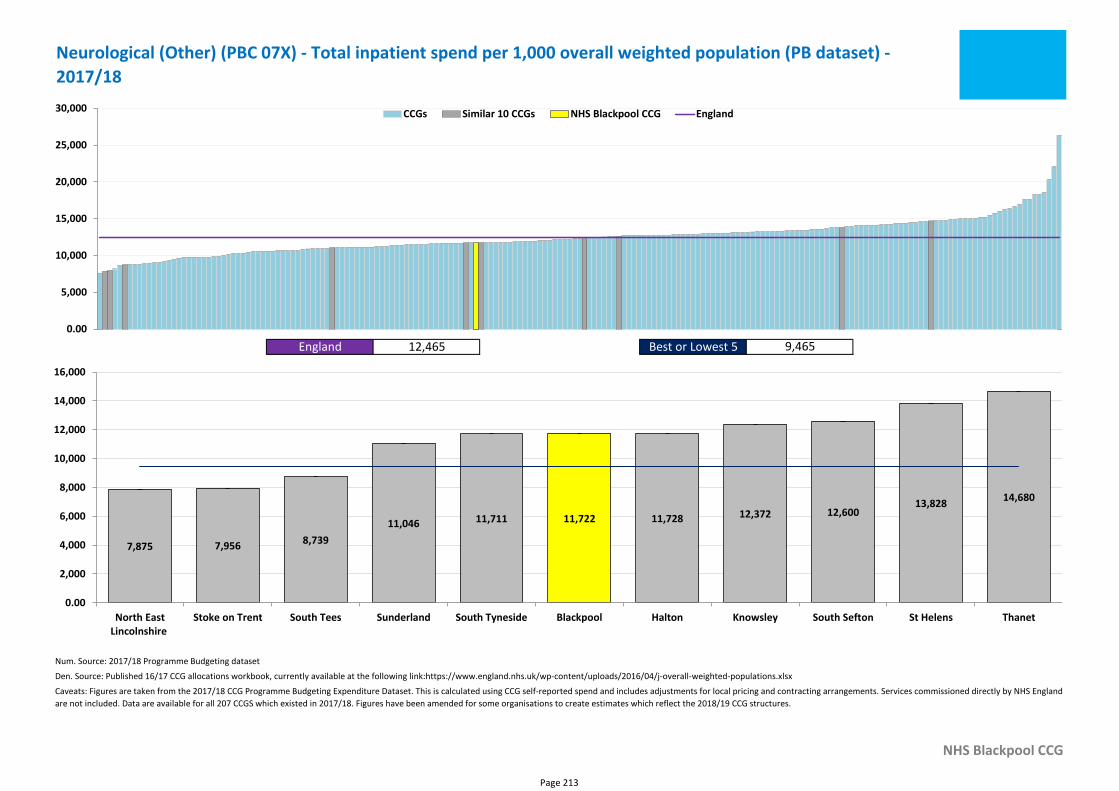
Num. Source: 2017/18 Programme Budgeting dataset
Den. Source: Published 16/17 CCG allocations workbook, currently available at the following link:https://www.england.nhs.uk/wp-content/uploads/2016/04/j-overall-weighted-populations.xlsx
NHS Blackpool CCG
Caveats: Figures are taken from the 2017/18 CCG Programme Budgeting Expenditure Dataset. This is calculated using CCG self-reported spend and includes adjustments for local pricing and contracting arrangements. Services commissioned directly by NHS England
are not included. Data are available for all 207 CCGS which existed in 2017/18. Figures have been amended for some organisations to create estimates which reflect the 2018/19 CCG structures.
Neurological (Other) (PBC 07X) - Total inpatient spend per 1,000 overall weighted population (PB dataset) -
2017/18
England 12,465 Best or Lowest 5 9,465
0.00
5,000
10,000
15,000
20,000
25,000
30,000 CCGs Similar 10 CCGs NHS Blackpool CCG England
11,722
7,875 7,956 8,739
11,046 11,711 11,728 12,372 12,60013,828
14,680
0.00
2,000
4,000
6,000
8,000
10,000
12,000
14,000
16,000
North EastLincolnshire
Stoke on Trent South Tees Sunderland South Tyneside Blackpool Halton Knowsley South Sefton St Helens Thanet
Page 213
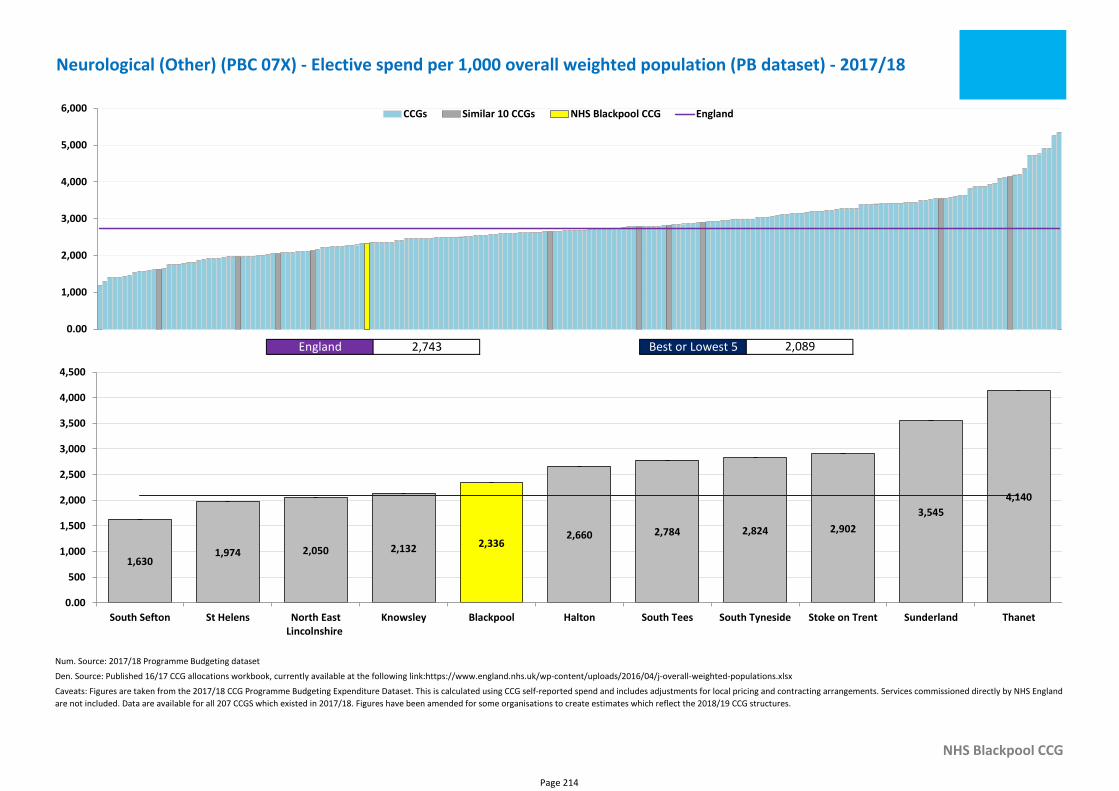
Num. Source: 2017/18 Programme Budgeting dataset
Den. Source: Published 16/17 CCG allocations workbook, currently available at the following link:https://www.england.nhs.uk/wp-content/uploads/2016/04/j-overall-weighted-populations.xlsx
NHS Blackpool CCG
Caveats: Figures are taken from the 2017/18 CCG Programme Budgeting Expenditure Dataset. This is calculated using CCG self-reported spend and includes adjustments for local pricing and contracting arrangements. Services commissioned directly by NHS England
are not included. Data are available for all 207 CCGS which existed in 2017/18. Figures have been amended for some organisations to create estimates which reflect the 2018/19 CCG structures.
Neurological (Other) (PBC 07X) - Elective spend per 1,000 overall weighted population (PB dataset) - 2017/18
England 2,743 Best or Lowest 5 2,089
0.00
1,000
2,000
3,000
4,000
5,000
6,000 CCGs Similar 10 CCGs NHS Blackpool CCG England
2,336
1,6301,974 2,050 2,132
2,660 2,784 2,824 2,902
3,545
4,140
0.00
500
1,000
1,500
2,000
2,500
3,000
3,500
4,000
4,500
South Sefton St Helens North EastLincolnshire
Knowsley Blackpool Halton South Tees South Tyneside Stoke on Trent Sunderland Thanet
Page 214
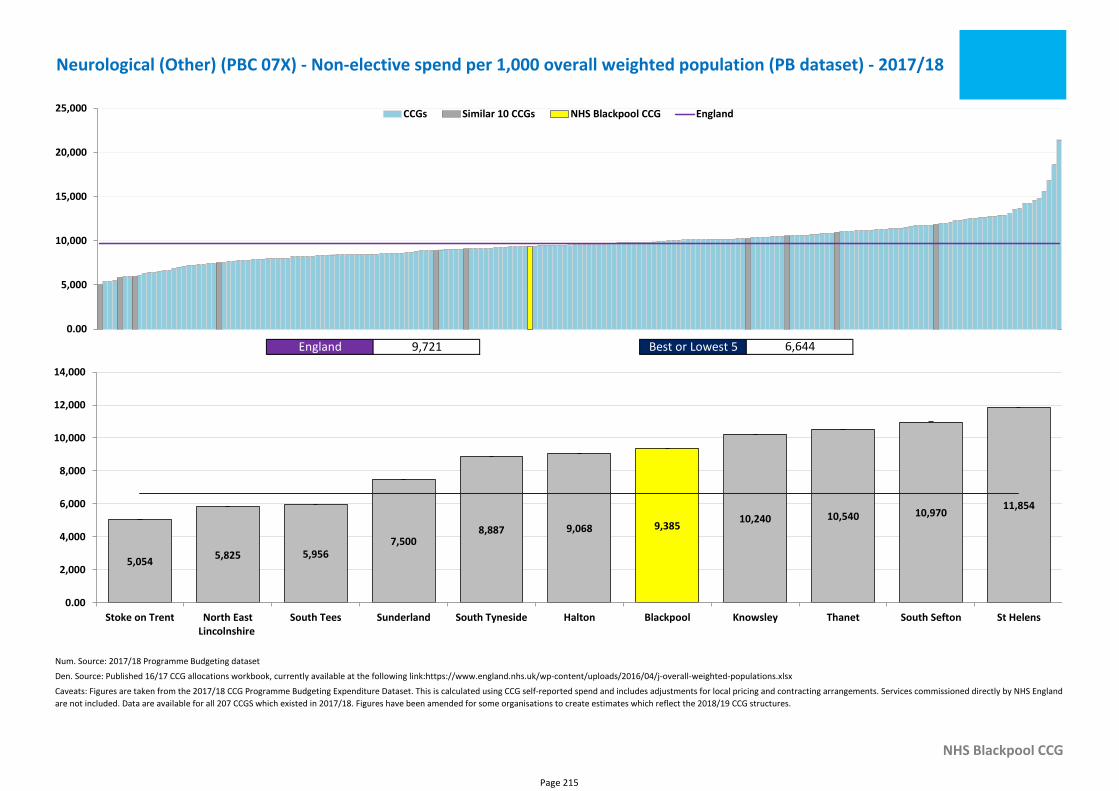
Num. Source: 2017/18 Programme Budgeting dataset
Den. Source: Published 16/17 CCG allocations workbook, currently available at the following link:https://www.england.nhs.uk/wp-content/uploads/2016/04/j-overall-weighted-populations.xlsx
NHS Blackpool CCG
Caveats: Figures are taken from the 2017/18 CCG Programme Budgeting Expenditure Dataset. This is calculated using CCG self-reported spend and includes adjustments for local pricing and contracting arrangements. Services commissioned directly by NHS England
are not included. Data are available for all 207 CCGS which existed in 2017/18. Figures have been amended for some organisations to create estimates which reflect the 2018/19 CCG structures.
Neurological (Other) (PBC 07X) - Non-elective spend per 1,000 overall weighted population (PB dataset) - 2017/18
England 9,721 Best or Lowest 5 6,644
0.00
5,000
10,000
15,000
20,000
25,000 CCGs Similar 10 CCGs NHS Blackpool CCG England
9,385
5,0545,825 5,956
7,5008,887 9,068
10,240 10,540 10,97011,854
0.00
2,000
4,000
6,000
8,000
10,000
12,000
14,000
Stoke on Trent North EastLincolnshire
South Tees Sunderland South Tyneside Halton Blackpool Knowsley Thanet South Sefton St Helens
Page 215
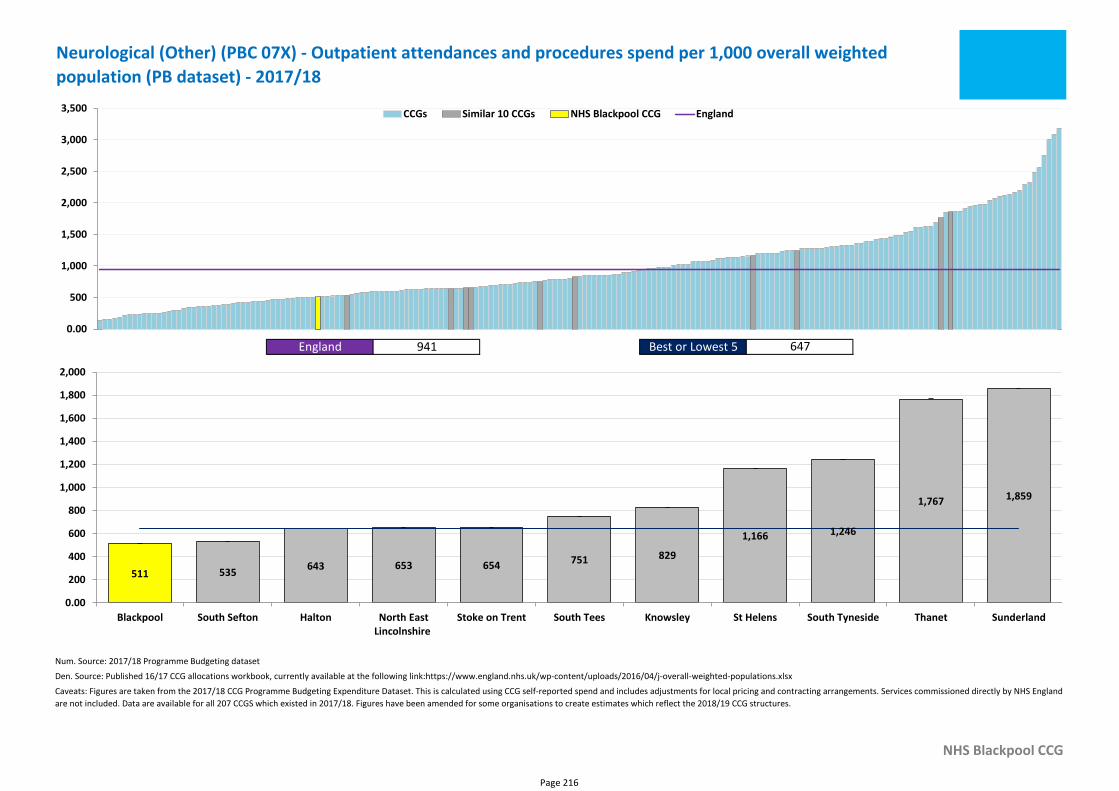
Num. Source: 2017/18 Programme Budgeting dataset
Den. Source: Published 16/17 CCG allocations workbook, currently available at the following link:https://www.england.nhs.uk/wp-content/uploads/2016/04/j-overall-weighted-populations.xlsx
NHS Blackpool CCG
Caveats: Figures are taken from the 2017/18 CCG Programme Budgeting Expenditure Dataset. This is calculated using CCG self-reported spend and includes adjustments for local pricing and contracting arrangements. Services commissioned directly by NHS England
are not included. Data are available for all 207 CCGS which existed in 2017/18. Figures have been amended for some organisations to create estimates which reflect the 2018/19 CCG structures.
Neurological (Other) (PBC 07X) - Outpatient attendances and procedures spend per 1,000 overall weighted
population (PB dataset) - 2017/18
England 941 Best or Lowest 5 647
0.00
500
1,000
1,500
2,000
2,500
3,000
3,500 CCGs Similar 10 CCGs NHS Blackpool CCG England
511 535643 653 654 751 829
1,166 1,246
1,767 1,859
0.00
200
400
600
800
1,000
1,200
1,400
1,600
1,800
2,000
Blackpool South Sefton Halton North EastLincolnshire
Stoke on Trent South Tees Knowsley St Helens South Tyneside Thanet Sunderland
Page 216
Additional Information
Page 217
Commissioners can take the following actions now:
• Identify the key opportunities for improvement within the pathways included in
the neurology focus pack for your population and compare with current reform
activity and improvement plans
• Engage with clinicians and other local stakeholders, including public health
teams in local authorities and commissioning support organisations and
explore the opportunities along the pathways further using local data
• Revisit the Intelligence section of the NHS RightCare website regularly as
new content is added
• Always consider risk factor reduction (e.g. older people living in income
deprived households) as an opportunity to improve population health and
reduce disease prevalence
• Discuss the opportunities highlighted in this pack as part of the STP planning
process and consider STP wide action where appropriate
• Speak to your NHS RightCare Delivery Partner about other practical steps for
Next steps and actions
Page 218