nhs diagnostic waiting times and activity data · pdf filenhs diagnostic waiting times and...
TRANSCRIPT

1
NHS Diagnostic Waiting Times and Activity Data

2
NHS Diagnostic Waiting Times and Activity Data
May 2015 Monthly Report Version number: 1 First published: 8th July 2015 Prepared by: NHS England Analytical Services (Operations)
3
Contents Contents ..................................................................................................................... 3
1 Executive summary ............................................................................................. 4
1.1 National Statistics .......................................................................................... 5
2 May 2015 Key Findings ....................................................................................... 6
3 National Trends ................................................................................................... 7
3.1 6+ Week Waits .............................................................................................. 7 3.2 Total Waiting List ........................................................................................... 8 3.3 Median Waiting Time ..................................................................................... 9
3.4 Total Activity .................................................................................................. 9
4 May 2015 Data .................................................................................................. 11
4.1 6+ Week Waits ............................................................................................ 11 4.2 Total Waiting List ......................................................................................... 14 4.3 Median Waiting Times ................................................................................. 15
4.4 Total Activity ................................................................................................ 15
5 Annex ................................................................................................................ 17
5.1 Methodology ................................................................................................ 17
5.2 Data Revision .............................................................................................. 17 5.3 Data Availability ........................................................................................... 17 5.4 Glossary ...................................................................................................... 17
5.5 Feedback welcomed .................................................................................... 18 5.6 Additional Information .................................................................................. 18
4
1 Executive summary This report presents a monthly summary of diagnostic waiting times and activity across the NHS in England. This monthly report is part of a routine series of publications produced by NHS England. The data presented in this report measures the current waiting times of patients still waiting for any of 15 key diagnostic tests or procedures at the month end. This data is split by number of weeks waiting, and by test. The waiting times reported are for those patients who have been referred for a test, but whose test had not taken place by the end of the reporting period. Referrals may be from a variety of sources including GPs. One of the main measurements covered in this report is the number and proportion of patients waiting six weeks or longer for a diagnostic test, from time of referral. This six week diagnostic wait was initially introduced as a ‘milestone’ from March 2008 towards achieving the standard Referral to Treatment wait of 18 weeks by December 2008, but diagnostic waiting times now form part of the 2013/14 NHS Constitution. This gives patients the legal right to treatment within 18 weeks of referral (18 week RTT) and as part of this, pledges that patients should not be required to wait 6 weeks or longer for a diagnostic test. NHS England’s planning guidance states that there is a threshold of 99% for this pledge. The financial penalty for non-delivery of the standard is set out in the NHS Standard Contract 2015/16. The 15 key diagnostic tests included in this report are: Imaging
• Magnetic Resonance Imaging (MRI) • Computerised Tomography (CT) • Non-obstetric Ultrasound • Barium Enema • Dual-Energy X-Ray Absorptiometry (DEXA) Scan
Physiological Measurements
• Audiology Assessments • Echocardiography • Electrophysiology • Neurophysiology – peripheral neurophysiology • Respiratory Physiology – sleep studies • Urodynamics – pressures & flows
Endoscopy
• Gastroscopy • Colonoscopy • Flexible Sigmoidoscopy • Cystoscopy
5
For detailed descriptions of each diagnostic test please see the collection guidance document. Some of the key terms used throughout this report are outlined below:
6+ Waits A count of the number of patients waiting 6 weeks or longer for a diagnostic test at month end from referral.
Activity A count of the number of diagnostic tests undertaken during the month.
Diagnostic Test A test or procedure of which the primary function is to identify a patient’s disease or condition to allow a medical diagnosis to be made.
Waiting List A count of the number of patients that are waiting for a diagnostic test at the end of the month.
A more comprehensive glossary is available in the Annex. All England figures quoted are commissioner based. Commissioner based returns reflect data for patients for whom English commissioners are responsible.
1.1 National Statistics
The UK Statistics Authority has designated these statistics as National Statistics, in accordance with the Statistics and Registration Service Act 2007 and signifying compliance with the Code of Practice for Official Statistics. Designation can be broadly interpreted to mean that the statistics:
• meet identified user needs; • are well explained and readily accessible; • are produced according to sound methods; and • are managed impartially and objectively in the public interest.
Once statistics have been designated as National Statistics it is a statutory requirement that the Code of Practice shall continue to be observed.
6
2 May 2015 Key Findings
The total number of patients waiting 6 weeks or longer from referral for one of the 15 key diagnostic tests at the end of May 2015 was 15,100. This was 1.8% of the total number of patients waiting at the end of the month.
Nationally, the operational standard of less than 1% of patients waiting 6 weeks or longer was not met this month.
Compared with May 2014 the total number of patients waiting 6 weeks or longer at the end of the month decreased by 3,600, while the proportion of patients waiting 6 weeks or longer fell by 0.5 percentage points.
In the last twelve months, the proportion of patients waiting 6 weeks or longer at the end of a month has varied between 1.2% (in November 2014) and 2.4% (in January 2015).
At the end of May 2015, the test with the smallest proportion of patients waiting 6 weeks or longer was Electrophysiology, with 0.1% of patients waiting 6 weeks or longer. The test with the highest proportion was Flexi Sigmoidoscopy, with 8.6% of patients waiting 6 weeks or longer.
An alternative measure of diagnostic waiting times is the average (median) waiting time. The estimated average time that a patient had been waiting for a diagnostic test was 2.1 weeks at the end of May 2015.
There were 835,400 patients waiting for a key diagnostic test at the end of May 2015. This is an increase of 40,300 from May 2014. In the last twelve months the total number of patients waiting for a diagnostic test has continued to increase with an average monthly increase of 0.4%.
A total of 1,585,900 diagnostic tests were undertaken in May 2015. This is an increase of 42,100 from May 2014. In the last twelve months activity has continued to increase with an average monthly increase of 0.2% (or 0.7% when adjusted for the number of working days).
Princess Alexandra Hospital NHS Trust failed to submit any diagnostic data this month, due to issues with their Patient Administration System.
7
3 National Trends
This section analyses trends in monthly diagnostic waiting times and activity data that has been collected since January 2006.
3.1 6+ Week Waits
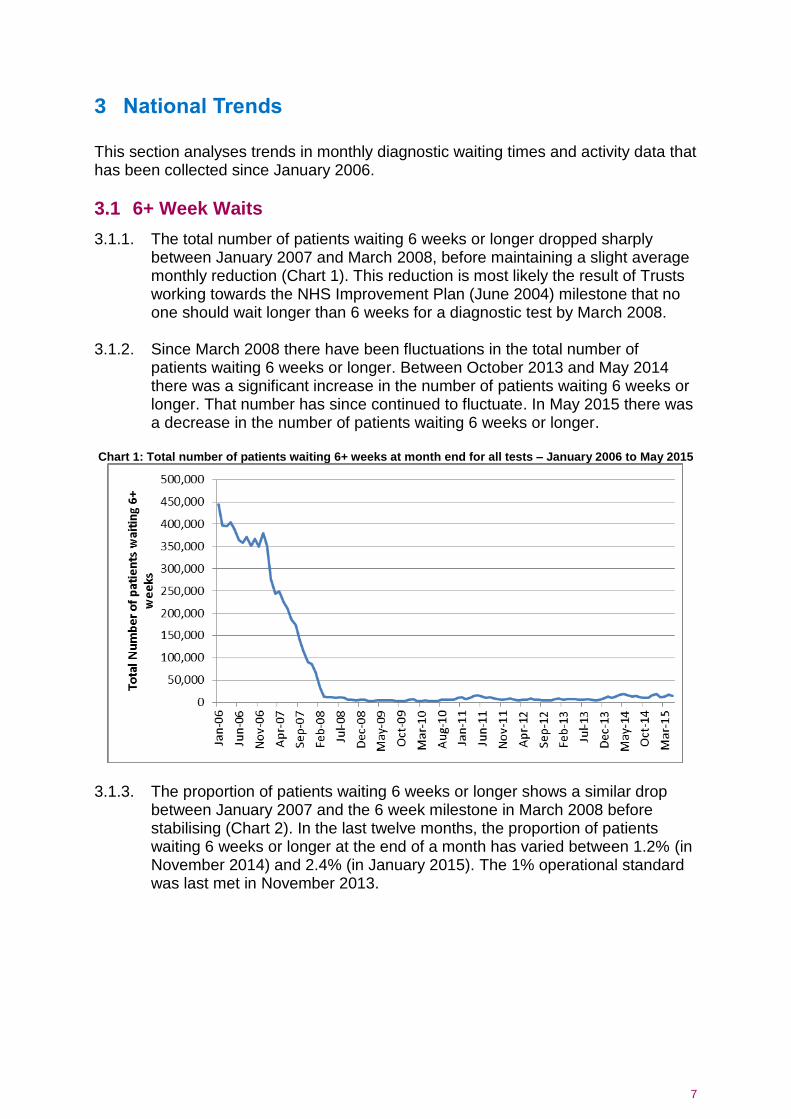
3.1.1. The total number of patients waiting 6 weeks or longer dropped sharply between January 2007 and March 2008, before maintaining a slight average monthly reduction (Chart 1). This reduction is most likely the result of Trusts working towards the NHS Improvement Plan (June 2004) milestone that no one should wait longer than 6 weeks for a diagnostic test by March 2008.
3.1.2. Since March 2008 there have been fluctuations in the total number of patients waiting 6 weeks or longer. Between October 2013 and May 2014 there was a significant increase in the number of patients waiting 6 weeks or longer. That number has since continued to fluctuate. In May 2015 there was a decrease in the number of patients waiting 6 weeks or longer.
Chart 1: Total number of patients waiting 6+ weeks at month end for all tests – January 2006 to May 2015
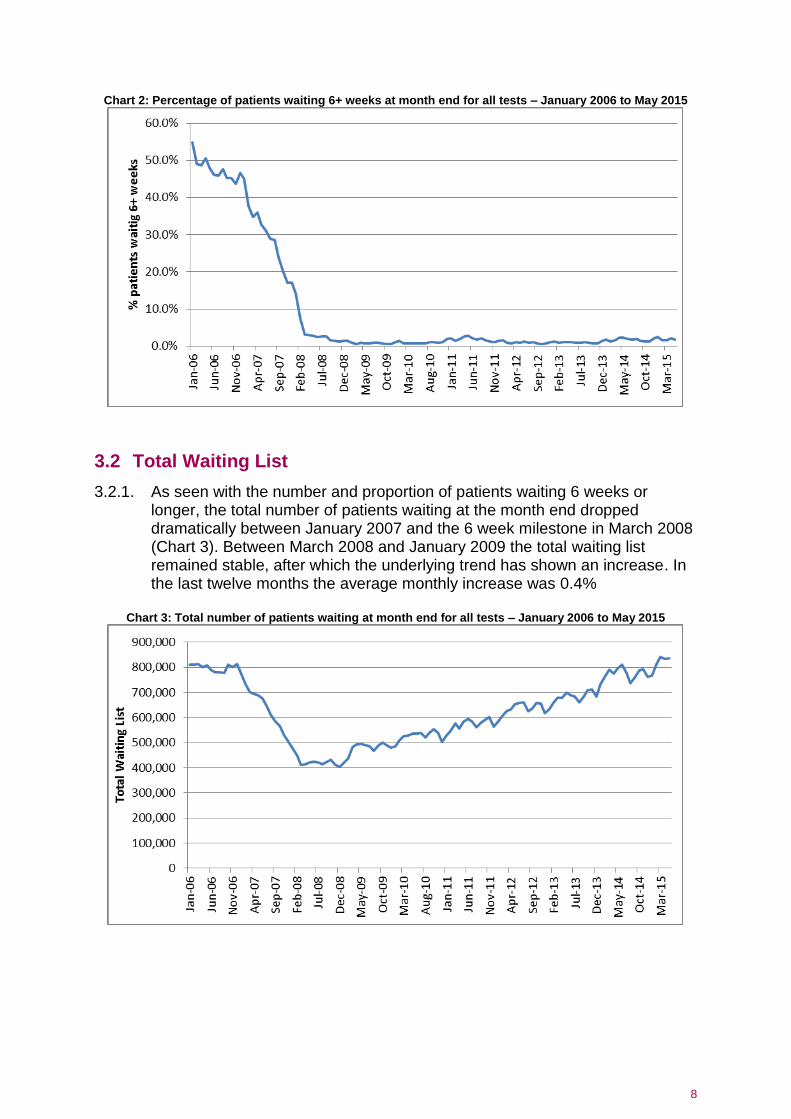
3.1.3. The proportion of patients waiting 6 weeks or longer shows a similar drop between January 2007 and the 6 week milestone in March 2008 before stabilising (Chart 2). In the last twelve months, the proportion of patients waiting 6 weeks or longer at the end of a month has varied between 1.2% (in November 2014) and 2.4% (in January 2015). The 1% operational standard was last met in November 2013.
8
Chart 2: Percentage of patients waiting 6+ weeks at month end for all tests – January 2006 to May 2015
3.2 Total Waiting List
3.2.1. As seen with the number and proportion of patients waiting 6 weeks or longer, the total number of patients waiting at the month end dropped dramatically between January 2007 and the 6 week milestone in March 2008 (Chart 3). Between March 2008 and January 2009 the total waiting list remained stable, after which the underlying trend has shown an increase. In the last twelve months the average monthly increase was 0.4%
Chart 3: Total number of patients waiting at month end for all tests – January 2006 to May 2015
9
3.3 Median Waiting Time
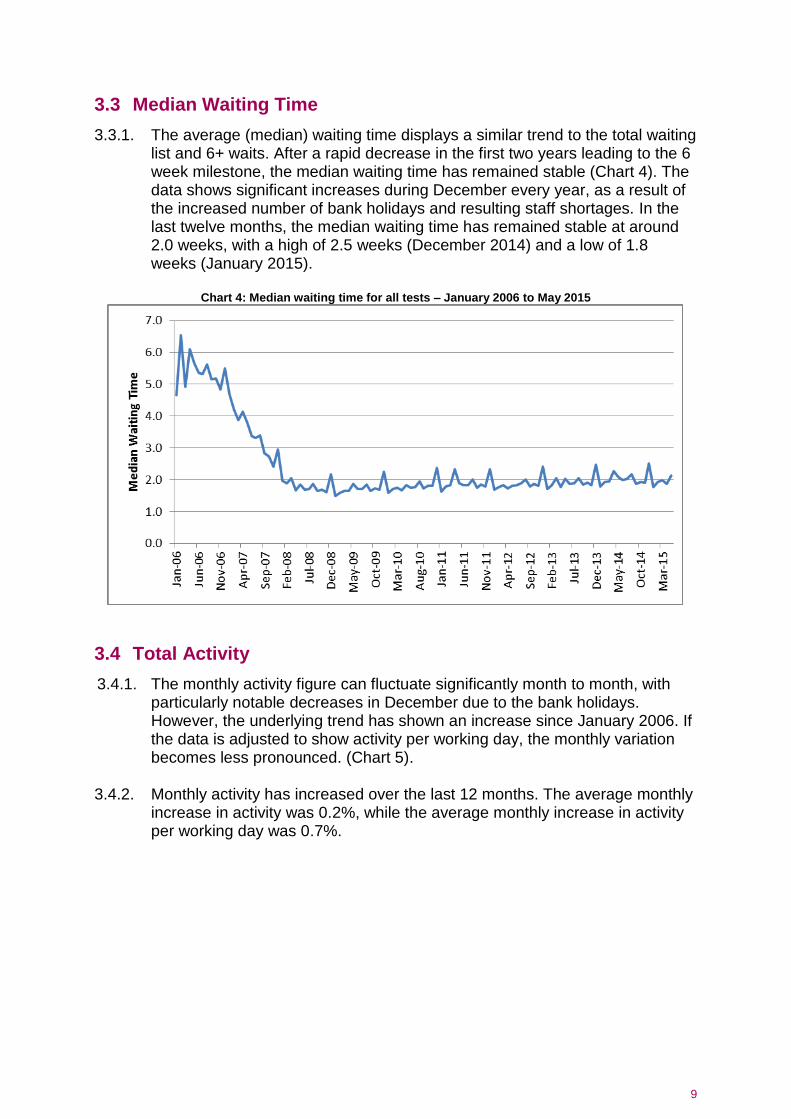
3.3.1. The average (median) waiting time displays a similar trend to the total waiting list and 6+ waits. After a rapid decrease in the first two years leading to the 6 week milestone, the median waiting time has remained stable (Chart 4). The data shows significant increases during December every year, as a result of the increased number of bank holidays and resulting staff shortages. In the last twelve months, the median waiting time has remained stable at around 2.0 weeks, with a high of 2.5 weeks (December 2014) and a low of 1.8 weeks (January 2015).
Chart 4: Median waiting time for all tests – January 2006 to May 2015
3.4 Total Activity
3.4.1. The monthly activity figure can fluctuate significantly month to month, with particularly notable decreases in December due to the bank holidays. However, the underlying trend has shown an increase since January 2006. If the data is adjusted to show activity per working day, the monthly variation becomes less pronounced. (Chart 5).
3.4.2. Monthly activity has increased over the last 12 months. The average monthly increase in activity was 0.2%, while the average monthly increase in activity per working day was 0.7%.
10
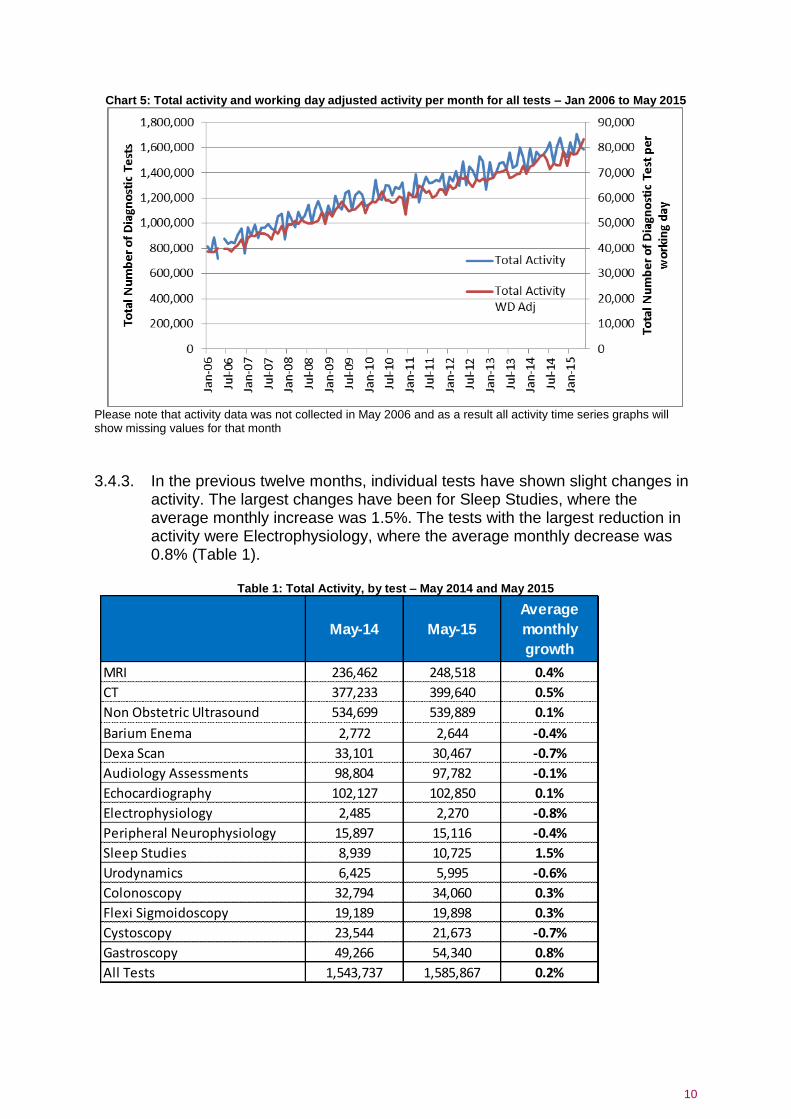
Chart 5: Total activity and working day adjusted activity per month for all tests – Jan 2006 to May 2015
Please note that activity data was not collected in May 2006 and as a result all activity time series graphs will show missing values for that month 3.4.3. In the previous twelve months, individual tests have shown slight changes in
activity. The largest changes have been for Sleep Studies, where the average monthly increase was 1.5%. The tests with the largest reduction in activity were Electrophysiology, where the average monthly decrease was 0.8% (Table 1).
Table 1: Total Activity, by test – May 2014 and May 2015
May-14 May-15
Average
monthly
growth
MRI 236,462 248,518 0.4%
CT 377,233 399,640 0.5%
Non Obstetric Ultrasound 534,699 539,889 0.1%
Barium Enema 2,772 2,644 -0.4%
Dexa Scan 33,101 30,467 -0.7%
Audiology Assessments 98,804 97,782 -0.1%
Echocardiography 102,127 102,850 0.1%
Electrophysiology 2,485 2,270 -0.8%
Peripheral Neurophysiology 15,897 15,116 -0.4%
Sleep Studies 8,939 10,725 1.5%
Urodynamics 6,425 5,995 -0.6%
Colonoscopy 32,794 34,060 0.3%
Flexi Sigmoidoscopy 19,189 19,898 0.3%
Cystoscopy 23,544 21,673 -0.7%
Gastroscopy 49,266 54,340 0.8%
All Tests 1,543,737 1,585,867 0.2%
11
4 May 2015 Data This section analyses the May 2015 diagnostic waiting times and activity data, and includes comparisons between tests, area teams, providers and commissioners.
4.1 6+ Week Waits
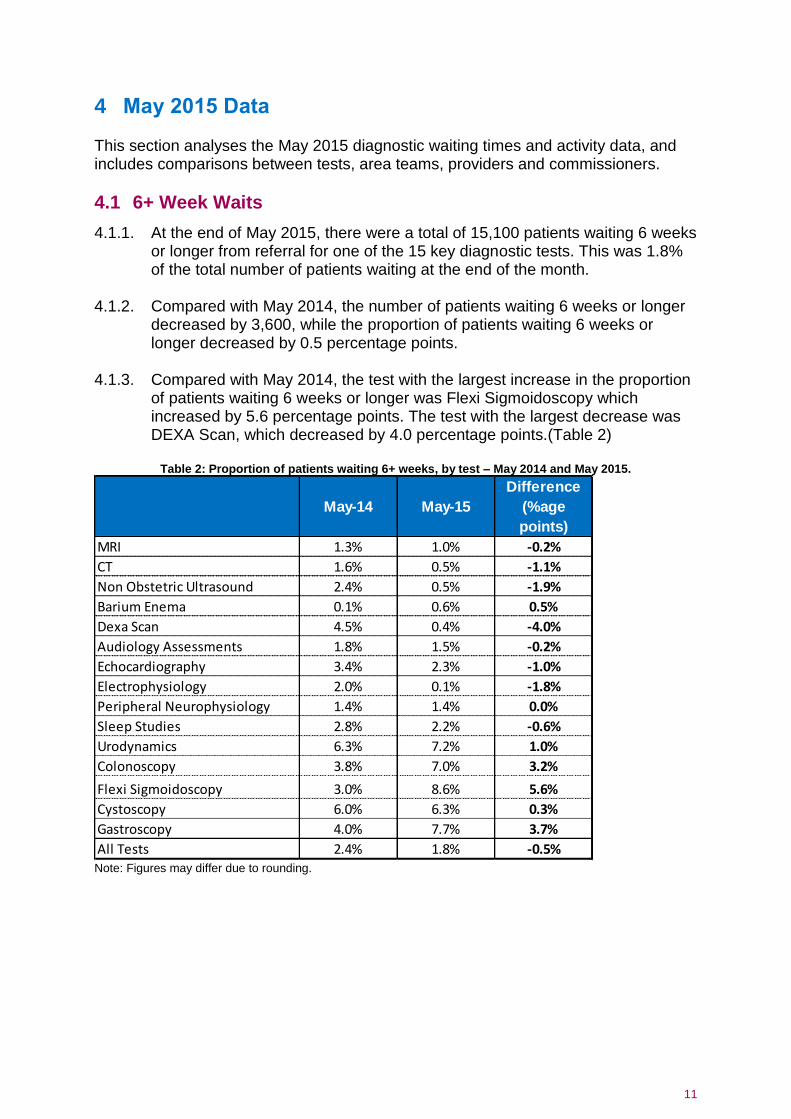
4.1.1. At the end of May 2015, there were a total of 15,100 patients waiting 6 weeks or longer from referral for one of the 15 key diagnostic tests. This was 1.8% of the total number of patients waiting at the end of the month.
4.1.2. Compared with May 2014, the number of patients waiting 6 weeks or longer decreased by 3,600, while the proportion of patients waiting 6 weeks or longer decreased by 0.5 percentage points.
4.1.3. Compared with May 2014, the test with the largest increase in the proportion
of patients waiting 6 weeks or longer was Flexi Sigmoidoscopy which increased by 5.6 percentage points. The test with the largest decrease was DEXA Scan, which decreased by 4.0 percentage points.(Table 2)
Table 2: Proportion of patients waiting 6+ weeks, by test – May 2014 and May 2015.
Note: Figures may differ due to rounding.
May-14 May-15
Difference
(%age
points)
MRI 1.3% 1.0% -0.2%
CT 1.6% 0.5% -1.1%
Non Obstetric Ultrasound 2.4% 0.5% -1.9%
Barium Enema 0.1% 0.6% 0.5%
Dexa Scan 4.5% 0.4% -4.0%
Audiology Assessments 1.8% 1.5% -0.2%
Echocardiography 3.4% 2.3% -1.0%
Electrophysiology 2.0% 0.1% -1.8%
Peripheral Neurophysiology 1.4% 1.4% 0.0%
Sleep Studies 2.8% 2.2% -0.6%
Urodynamics 6.3% 7.2% 1.0%
Colonoscopy 3.8% 7.0% 3.2%
Flexi Sigmoidoscopy 3.0% 8.6% 5.6%
Cystoscopy 6.0% 6.3% 0.3%
Gastroscopy 4.0% 7.7% 3.7%
All Tests 2.4% 1.8% -0.5%
12
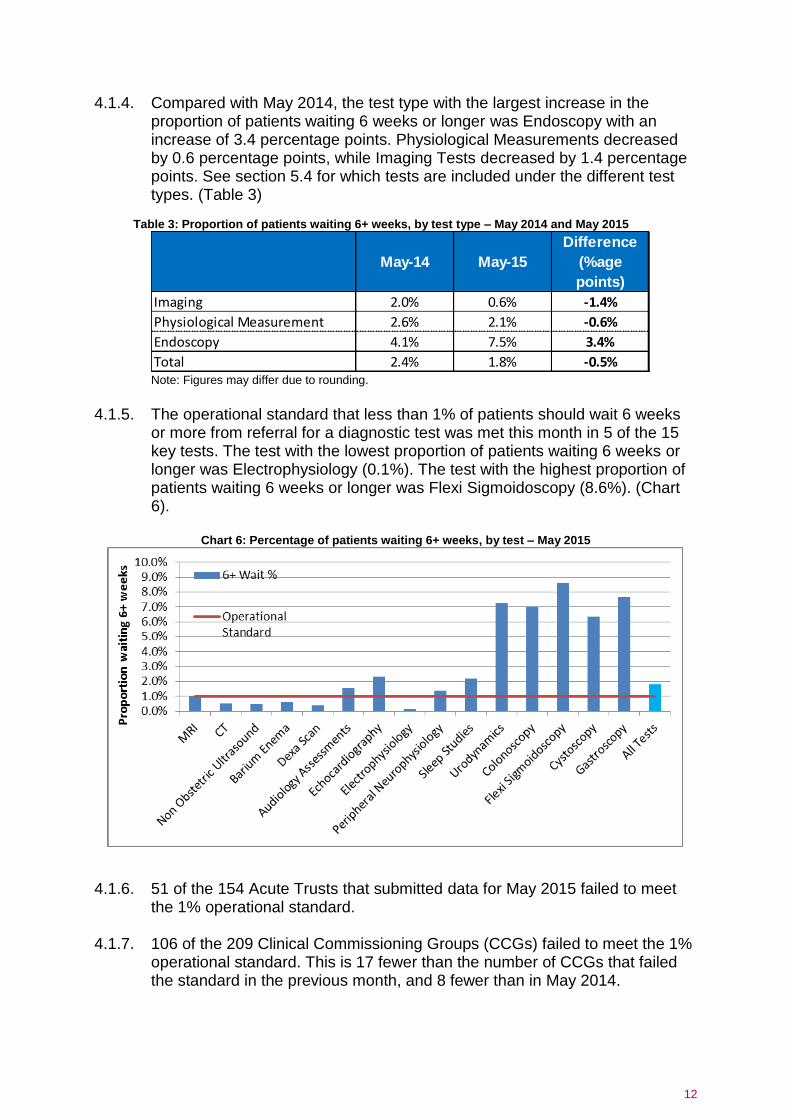
4.1.4. Compared with May 2014, the test type with the largest increase in the proportion of patients waiting 6 weeks or longer was Endoscopy with an increase of 3.4 percentage points. Physiological Measurements decreased by 0.6 percentage points, while Imaging Tests decreased by 1.4 percentage points. See section 5.4 for which tests are included under the different test types. (Table 3)
Table 3: Proportion of patients waiting 6+ weeks, by test type – May 2014 and May 2015
Note: Figures may differ due to rounding.
4.1.5. The operational standard that less than 1% of patients should wait 6 weeks
or more from referral for a diagnostic test was met this month in 5 of the 15 key tests. The test with the lowest proportion of patients waiting 6 weeks or longer was Electrophysiology (0.1%). The test with the highest proportion of patients waiting 6 weeks or longer was Flexi Sigmoidoscopy (8.6%). (Chart 6).
Chart 6: Percentage of patients waiting 6+ weeks, by test – May 2015
4.1.6. 51 of the 154 Acute Trusts that submitted data for May 2015 failed to meet the 1% operational standard.
4.1.7. 106 of the 209 Clinical Commissioning Groups (CCGs) failed to meet the 1%
operational standard. This is 17 fewer than the number of CCGs that failed the standard in the previous month, and 8 fewer than in May 2014.
May-14 May-15
Difference
(%age
points)
Imaging 2.0% 0.6% -1.4%
Physiological Measurement 2.6% 2.1% -0.6%
Endoscopy 4.1% 7.5% 3.4%
Total 2.4% 1.8% -0.5%
13
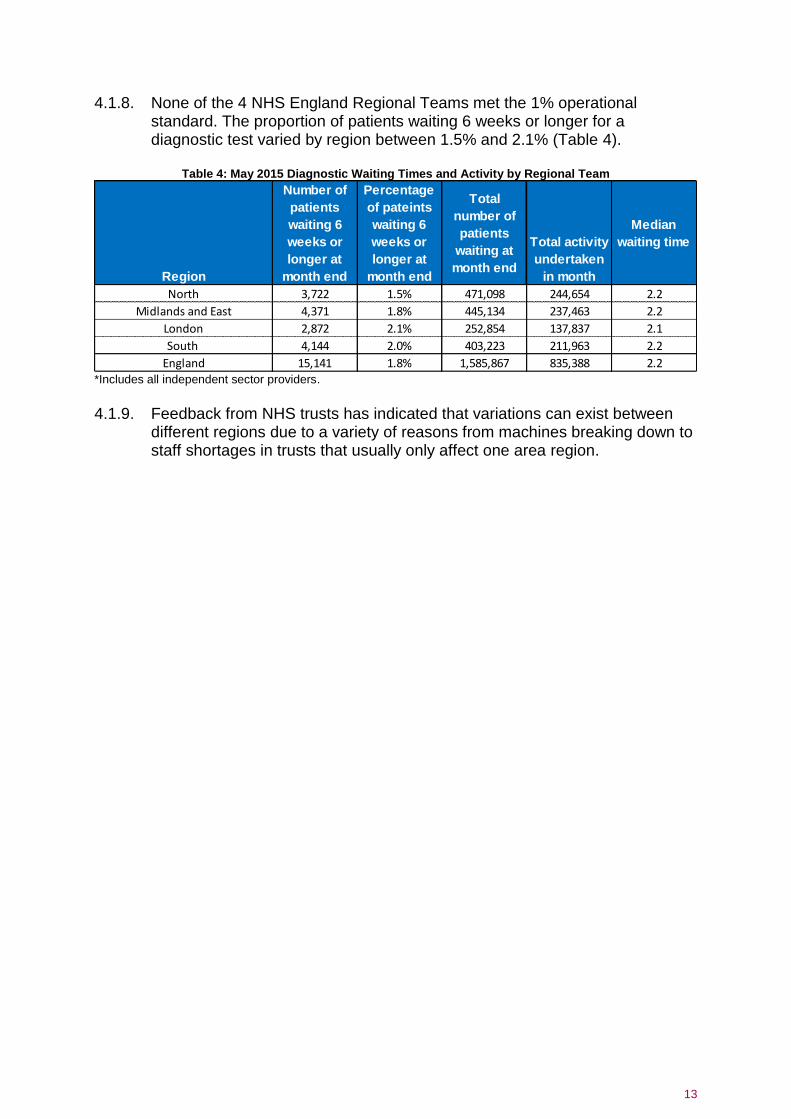
4.1.8. None of the 4 NHS England Regional Teams met the 1% operational standard. The proportion of patients waiting 6 weeks or longer for a diagnostic test varied by region between 1.5% and 2.1% (Table 4).
Table 4: May 2015 Diagnostic Waiting Times and Activity by Regional Team
*Includes all independent sector providers.
4.1.9. Feedback from NHS trusts has indicated that variations can exist between
different regions due to a variety of reasons from machines breaking down to staff shortages in trusts that usually only affect one area region.
Region
Number of
patients
waiting 6
weeks or
longer at
month end
Percentage
of pateints
waiting 6
weeks or
longer at
month end
Total
number of
patients
waiting at
month end
Total activity
undertaken
in month
Median
waiting time
North 3,722 1.5% 471,098 244,654 2.2
Midlands and East 4,371 1.8% 445,134 237,463 2.2
London 2,872 2.1% 252,854 137,837 2.1
South 4,144 2.0% 403,223 211,963 2.2
England 15,141 1.8% 1,585,867 835,388 2.2
14
4.2 Total Waiting List
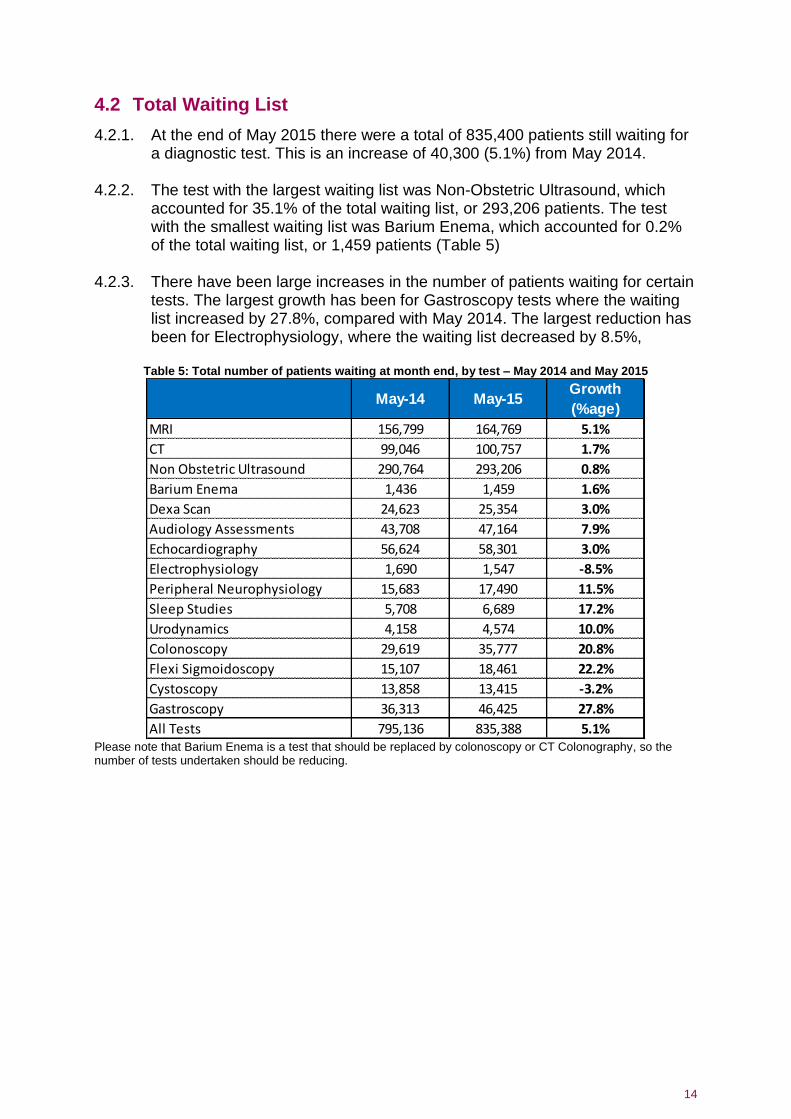
4.2.1. At the end of May 2015 there were a total of 835,400 patients still waiting for a diagnostic test. This is an increase of 40,300 (5.1%) from May 2014.
4.2.2. The test with the largest waiting list was Non-Obstetric Ultrasound, which
accounted for 35.1% of the total waiting list, or 293,206 patients. The test with the smallest waiting list was Barium Enema, which accounted for 0.2% of the total waiting list, or 1,459 patients (Table 5)
4.2.3. There have been large increases in the number of patients waiting for certain
tests. The largest growth has been for Gastroscopy tests where the waiting list increased by 27.8%, compared with May 2014. The largest reduction has been for Electrophysiology, where the waiting list decreased by 8.5%,
Table 5: Total number of patients waiting at month end, by test – May 2014 and May 2015
Please note that Barium Enema is a test that should be replaced by colonoscopy or CT Colonography, so the number of tests undertaken should be reducing.
May-14 May-15Growth
(%age)
MRI 156,799 164,769 5.1%
CT 99,046 100,757 1.7%
Non Obstetric Ultrasound 290,764 293,206 0.8%
Barium Enema 1,436 1,459 1.6%
Dexa Scan 24,623 25,354 3.0%
Audiology Assessments 43,708 47,164 7.9%
Echocardiography 56,624 58,301 3.0%
Electrophysiology 1,690 1,547 -8.5%
Peripheral Neurophysiology 15,683 17,490 11.5%
Sleep Studies 5,708 6,689 17.2%
Urodynamics 4,158 4,574 10.0%
Colonoscopy 29,619 35,777 20.8%
Flexi Sigmoidoscopy 15,107 18,461 22.2%
Cystoscopy 13,858 13,415 -3.2%
Gastroscopy 36,313 46,425 27.8%
All Tests 795,136 835,388 5.1%

15
4.3 Median Waiting Times
4.3.1. At the end of May 2015 the estimated median waiting time for all 15 diagnostic tests was 2.1 weeks from time of referral. This is an increase from the previous month, where the median was 1.9 weeks. The test with the shortest median waiting time was Barium Enemas at 1.7 weeks. There were five tests with the longest median waiting time at 2.5 weeks. Those tests were Echocardiography, Peripheral Neurophysiology, Urodynamics, Flexi Sigmoidoscopy and Gastroscopy (Chart 7).
Chart 7: Median waiting time by test – May 2015
4.4 Total Activity
4.4.1. In total 1,585,900 of the 15 key diagnostic tests were performed during May 2015. This is an increase of 42,100 (2.7%) from May 2014. The number of tests per working day has increased by 8.1% compared to the same month last year (Table 6).
4.4.2. The test with the highest activity was Non-Obstetric Ultrasound with 539,889 tests taking place. This accounted for 34.0% of all activity in May 2015. The test with the lowest activity was Electrophysiology with 2,270 tests taking place. This accounted for or 0.1% of all activity this month.

16
Table 6: Total Activity & Growth by test
Please note that Barium Enema is a test that should be replaced by colonoscopy or CT Colonography, so the number of tests undertaken should be reducing.
May-15 May-14 YTD 15/16 YTD 14/15Growth May
15 vs May 14
Growth YTD
15/16 vs YTD
14/15
Adjusted
Growth May
15 vs May 14
Adjusted
Growth YTD
15/16 vs YTD
14/15
MRI 248,518 236,462 493,227 468,325 5.1% 5.3% 10.6% 8.0%
CT 399,640 377,233 796,932 748,608 5.9% 6.5% 11.5% 9.2%
Non Obstetric Ultrasound 539,889 534,699 1,091,174 1,067,387 1.0% 2.2% 6.3% 4.8%
Barium Enema 2,644 2,772 5,461 5,643 -4.6% -3.2% 0.4% -0.7%
Dexa Scan 30,467 33,101 64,673 66,303 -8.0% -2.5% -3.1% 0.0%
Audiology Assessments 97,782 98,804 200,144 198,074 -1.0% 1.0% 4.2% 3.6%
Echocardiography 102,850 102,127 210,234 202,542 0.7% 3.8% 6.0% 6.5%
Electrophysiology 2,270 2,485 4,763 5,104 -8.7% -6.7% -3.8% -4.3%
Peripheral Neurophysiology 15,116 15,897 31,291 31,130 -4.9% 0.5% 0.1% 3.1%
Sleep Studies 10,725 8,939 21,239 18,186 20.0% 16.8% 26.3% 19.8%
Urodynamics 5,995 6,425 12,517 13,056 -6.7% -4.1% -1.8% -1.7%
Colonoscopy 34,060 32,794 68,087 64,533 3.9% 5.5% 9.3% 8.2%
Flexi Sigmoidoscopy 19,898 19,189 39,850 38,221 3.7% 4.3% 9.2% 6.9%
Cystoscopy 21,673 23,544 44,796 47,596 -7.9% -5.9% -3.1% -3.5%
Gastroscopy 54,340 49,266 111,017 99,476 10.3% 11.6% 16.1% 14.5%
All Tests 1,585,867 1,543,737 3,195,405 3,074,184 2.7% 3.9% 8.1% 6.6%

17
5 Annex
5.1 Methodology
6.1.1. NHS England compiles diagnostic waiting time and activity data through a
central return. Data collected includes: • The number of patients waiting at the month end, split by test and week. • Total activity classified as either; Waiting List tests (excluding planned),
Planned tests, or Unscheduled tests. 6.1.2. Providers submit data to NHS England via Unify2 where it checked and signed
off by commissioners. For further details on how the data is collected and the Unify2 system, please refer to the Data Quality and Methodology Statement.
5.2 Data Revision
6.2.1. Revisions to published figures are released on a six-monthly basis and in accordance with the NHS England Analytical Services (Operations) team’s revision policy. For more information on the revision policy please refer to the Unify2 Revisions Policy Document.
5.3 Data Availability
6.3.1. Monthly diagnostic waiting time and activity data is published on a monthly timetable. The next publication of this report and accompanying data will be 13th August 2015. A full calendar of all statistical publications can be found here.
6.3.2. In addition to monthly publication, diagnostic waiting time and activity data is
also published in a quarterly census and annual report. 6.3.3. Quarterly census data can be found here. 6.3.4. Annual Imaging and Radiodiagnostics data can be found here.
5.4 Glossary
Area Team A geographical area of NHS England with direct commissioning responsibilities for GP services, dental services, pharmacy, and certain aspects of optical services. Clinical Commissioning Group (CCG) A group of GP practices, which working with other healthcare professionals and in partnership with local communities and local authorities, commission NHS services for patients with in their local communities. Endoscopy A categorisation of diagnostic tests that include; Colonoscopy; Flexi sigmoidoscopy; Cystoscopy and Gastroscopy.
18
Imaging A categorisation of diagnostic tests that include; Magnetic Resonance Imaging (MRI); Computed Tomography (CT); Non-obstetric ultrasound; Barium Enema and DEXA Scan. Median Waiting Time A measurement of the average time a patient is required to wait for a diagnostic test. The median is the middle value when waiting times are put in numerical order. 50% of patients will wait less than the median. The median is the preferred measurement of average waiting time as it is less susceptible to extreme values than the mean. Physiological Measurement A categorisation of diagnostic tests that include; Audiology Assessments; Echocardiology; Electrophysiology: Peripheral Neurophysiology; Sleep Studies and Urodynamics. Provider An organisation that provides NHS treatment or care, for example, an NHS Acute Trust, Mental Health Trust, Community provider, or an Independent Sector organisation.
5.5 Feedback welcomed
We welcome feedback on the content and presentation of statistics within this report and those published on the NHS England website. If you have any comments on this, or any other issues regarding these statistics, then please email [email protected] Alternatively, we welcome your comments via our user feedback form. Feedback about the user’s experiences of using these statistics is available here.
5.6 Additional Information
Full details of diagnostics data for individual organisations are available here. For press enquiries please contact the NHS England media team on 0113 825 0958 or 0113 825 0959. Email enquiries should be directed to [email protected] The Government Statistical Service (GSS) statistician responsible for producing these data is: Chris Gibbins NHS Operations NHS England Room 5E24, Quarry House, Quarry Hill, Leeds LS2 7UE Email: [email protected]