nhf finance conference 2015
TRANSCRIPT

Successful places
with homes and jobs
A NATIONAL
AGENCY
WORKING
LOCALLY
Global Accounts
and the sector’s
risk profile 2014
Mick Warner, Deputy Director
Regulatory Operations
18 March 2015

The sector’s Global
Accounts 2014

Financial highlights 1
Turnover up by 5% to £15.6 billion
Operating costs up by 4.5% to £10.6 billion
Operating margin 26.5%, up from 25.9%
Management costs per unit increased by 4%
Routine and planned maintenance per unit spend up by 2.3%
Total major repairs costs per unit fell by 7.7%
Effective interest rate slightly down at 4.7%

Financial highlights 2
EBITDA MRI interest cover 153.7% (2013 138%)
EBITDA MRI interest cover (SHL) 145.3% (2013 129.7%)
Retained surplus of £2.4 billion, an increase of £0.4 billion
Total NBV of fixed assets up by £5.6 billion to £82 billion
Total financing of £59.3 billion, up 6.4% from 2013
Gearing 93.8% (2013 92.9%)
Debt per unit £22,474 (2013 £21,313)

The key messages
A sector that remains financially robust in aggregate
Retained surplus of £2.4 billion
Impact of favourable macro-economic conditions
Growing maturity of the stock transfer sub-sector
73% of reserves invested in fixed assets
£5.6 billion of debt raised in the year

Surpluses from property sales
146
85
199
128
251
222
0
100
200
300
400
500
600
700
2014 2013
Surp
lus
on
th
e s
ale
of
fixe
d a
sse
ts (
£m
)
Shared ownership staircasing Sales to other RPs Other sales of housing properties
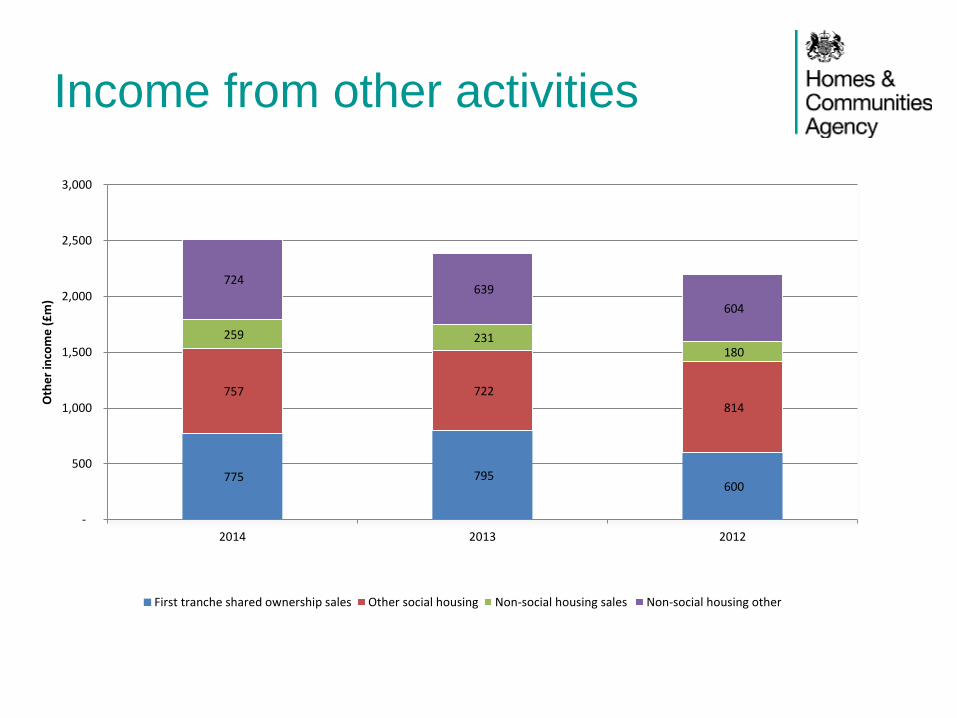
Income from other activities
775 795 600
757 722
814
259 231 180
724 639
604
-
500
1,000
1,500
2,000
2,500
3,000
2014 2013 2012
Oth
er
inco
me
(£
m)
First tranche shared ownership sales Other social housing Non-social housing sales Non-social housing other
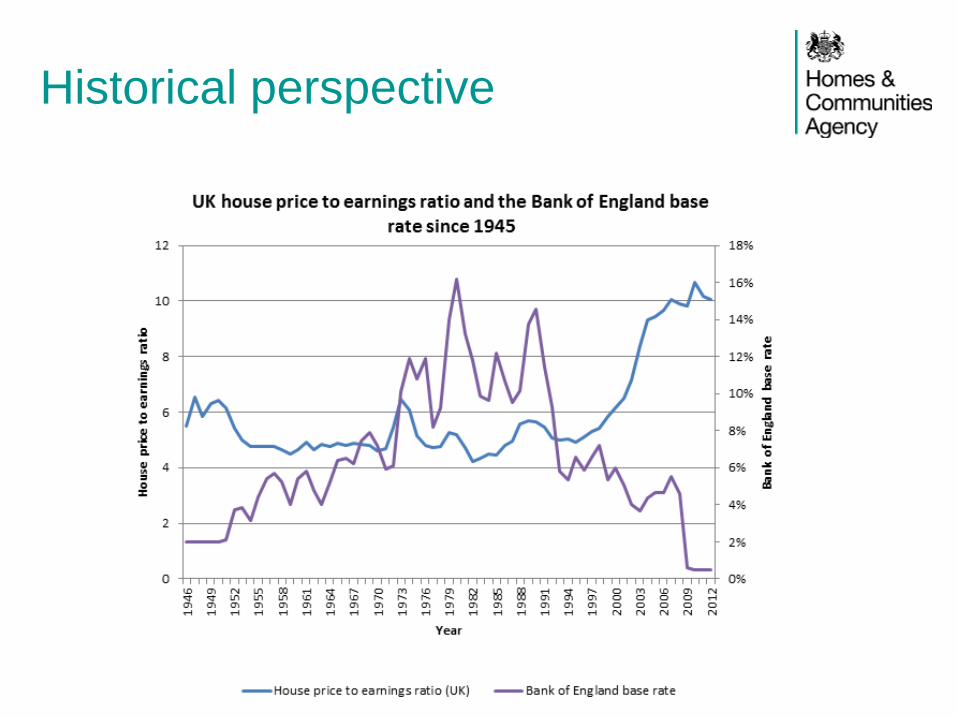
Historical perspective
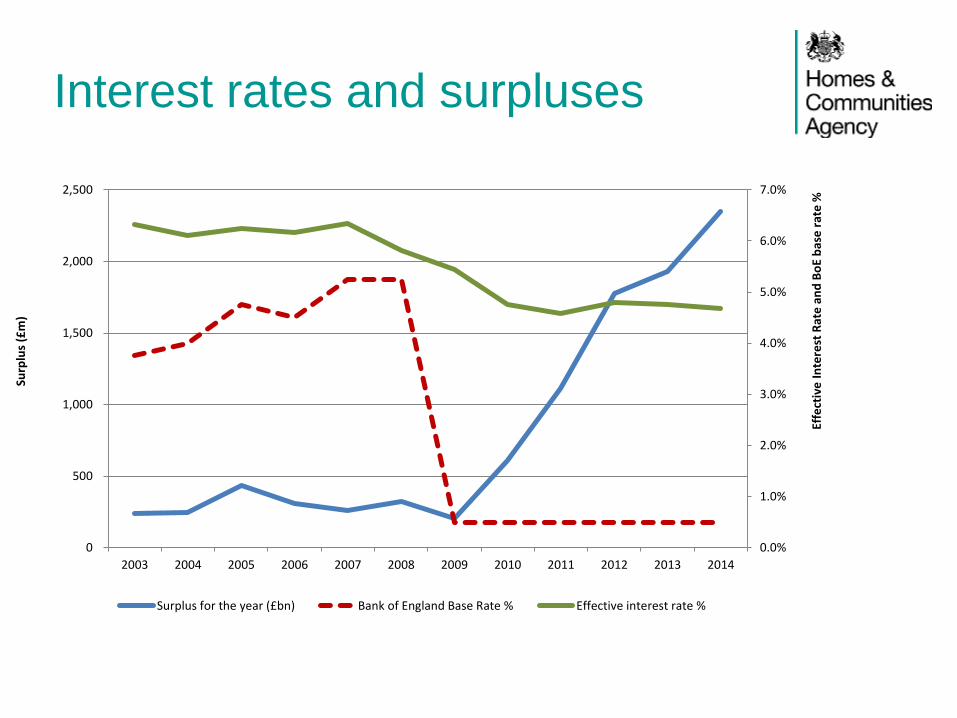
Interest rates and surpluses
0.0%
1.0%
2.0%
3.0%
4.0%
5.0%
6.0%
7.0%
0
500
1,000
1,500
2,000
2,500
2003 2004 2005 2006 2007 2008 2009 2010 2011 2012 2013 2014
Effe
ctiv
e I
nte
rest
Rat
e a
nd
Bo
E b
ase
rat
e %
Surp
lus
(£m
)
Surplus for the year (£bn) Bank of England Base Rate % Effective interest rate %
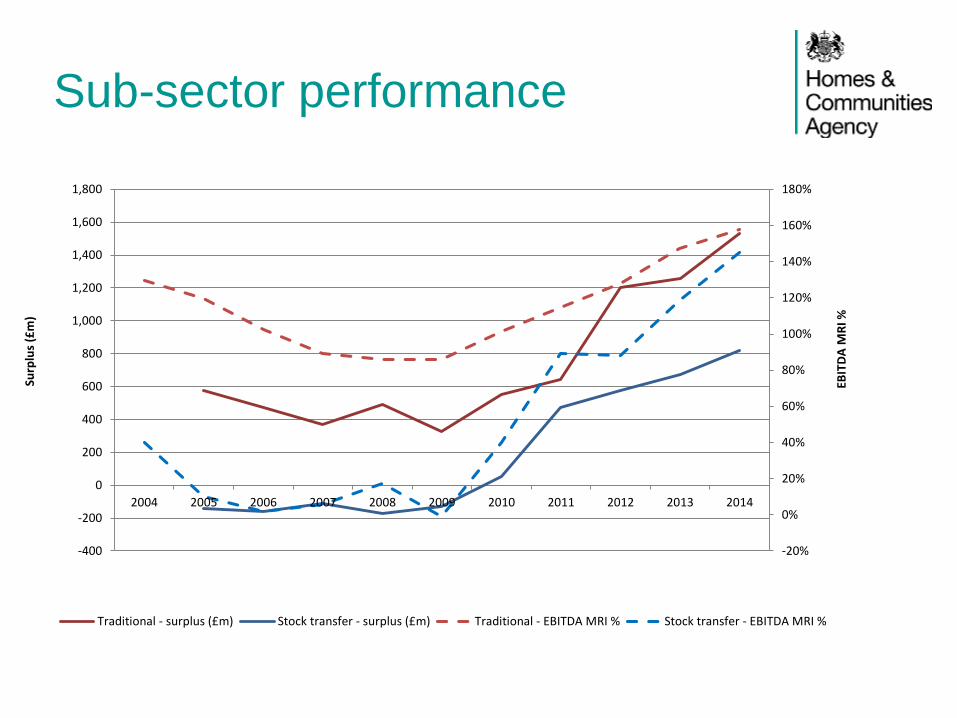
Sub-sector performance
-20%
0%
20%
40%
60%
80%
100%
120%
140%
160%
180%
-400
-200
0
200
400
600
800
1,000
1,200
1,400
1,600
1,800
2004 2005 2006 2007 2008 2009 2010 2011 2012 2013 2014
EBIT
DA
MR
I %
Surp
lus
(£m
)
Traditional - surplus (£m) Stock transfer - surplus (£m) Traditional - EBITDA MRI % Stock transfer - EBITDA MRI %

Operational performance
Indicator (%) 2014 2013 2012
Voids 1.8 1.7 1.8
Bad debts 1.0 0.9 0.8
Current tenant arrears 4.7 4.8 4.8
The sector’s risk profile

Sector risk profile – the
operating context
• Board responsibility to ensure effective governance
including arrangements for managing risk
• Revised Regulatory Framework from 1st April
• The political agenda and potential policy changes
• Level of public scrutiny
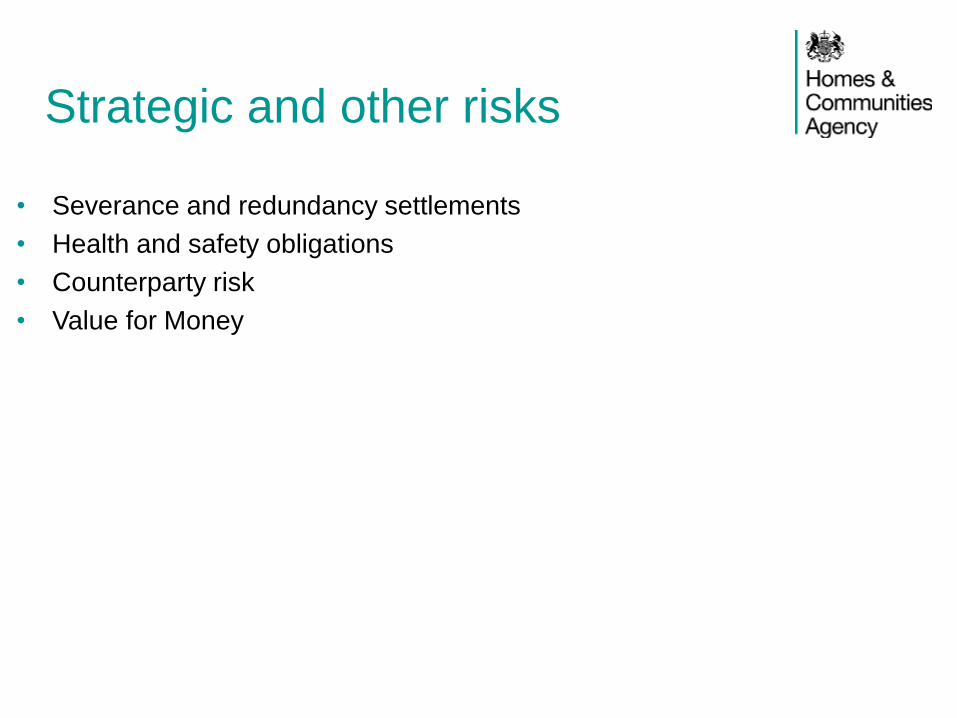
Strategic and other risks
• Severance and redundancy settlements
• Health and safety obligations
• Counterparty risk
• Value for Money
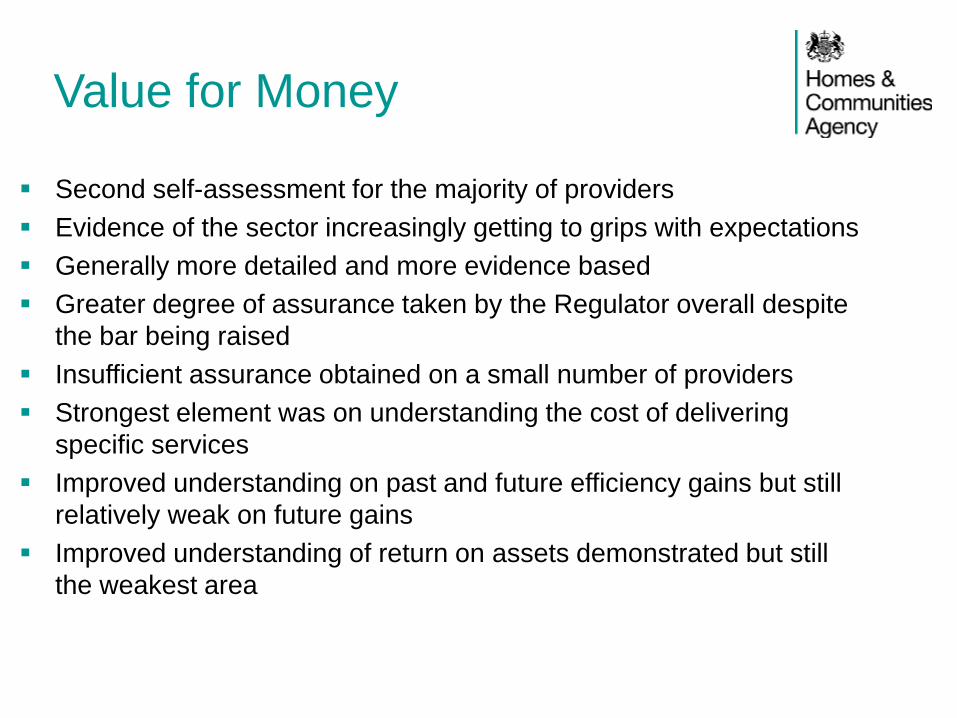
Value for Money
Second self-assessment for the majority of providers
Evidence of the sector increasingly getting to grips with expectations
Generally more detailed and more evidence based
Greater degree of assurance taken by the Regulator overall despite
the bar being raised
Insufficient assurance obtained on a small number of providers
Strongest element was on understanding the cost of delivering
specific services
Improved understanding on past and future efficiency gains but still
relatively weak on future gains
Improved understanding of return on assets demonstrated but still
the weakest area

Key financial risks
Asset-related risks – development, diversification,
exposure to the housing market, maintaining existing stock
Liability-related risks – existing debt, new debt, mark to
market exposure, bond finance, accounting issues
Income-related risks – exposure to rental markets, welfare
reform, supported housing
Cost-related risks – pension costs, differential inflation
rates, other business costs

The sector’s financial
forecasts
Surpluses
All figures £m 2015 2016 2017 2018 2019
Turnover 17,692 19,617 20,680 21,401 21,872
Operating Expenditure (13,209) (14,419) (14,984) (15,418) (15,561)
Operating surplus 4,483 5,198 5,696 5,983 6,311
Profit/(loss) on the sale of fixed assets 293 290 265 269 277
Surplus before interest and Tax (SBIT) 4,777 5,487 5,962 6,252 6,588
Interest and Other finance costs (2,775) (3,041) (3,274) (3,513) (3,756)
Surplus for the year before tax 2,002 2,446 2,687 2,739 2,832
Tax (13) (16) (18) (19) (24)
Surplus for the year 1,989 2,430 2,669 2,719 2,808

Operating margins
10%
15%
20%
25%
30%
35%
2015 2016 2017 2018 2019
Op
era
tin
g m
argi
n (
%)
Overall operating margin Social housing activity
First tranche shared ownership sales Properties developed for sale
Other non-social housing activity

Development of new homes
0
10,000
20,000
30,000
40,000
50,000
60,000
70,000
80,000
2015 2016 2017 2018 2019
Nu
mb
er
of
ne
w p
rop
ert
ies
General needs LCHO Other social Market rent Outright sales

Funding of new homes
0
10,000
20,000
30,000
40,000
50,000
60,000
70,000
80,000
0
2,000
4,000
6,000
8,000
10,000
12,000
2015 2016 2017 2018 2019
Ne
w p
rop
ert
ies
Spe
nd
on
ne
w p
roip
ert
ies
(£m
)
Movement in Debt Movement in Grant Current Asset Sales Other Resources Total new units

Sales income
0
500
1,000
1,500
2,000
2,500
3,000
3,500
4,000
4,500
2015 2016 2017 2018 2019
Sale
s re
ven
ue
(£
m)
1st tranche shared ownership sales Properties developed for sale Fixed asset sales