ngo kinh luan chemical industry natural rubber industry
TRANSCRIPT

Ngo Kinh Luan
Analyst
Chemical industry
Email: [email protected]
www.fpts.com.vn
FPT Securities Joint Stock Company, HCMC
Branch
29-31 Nguyen Cong Tru St, District1, HCMC,
Vietnam
Tel: (84) – 8 6290 8686
NATURAL RUBBER INDUSTRY
REPORT 2013
May 2013

NATURAL RUBBER INDUSTRY
09/05/2011
09/05/2011
www.fpts.com.vn
Report summary
Total global natural rubber production reached the amount of 11.4 mil tonnes increased by 3.97% compared with 2011. Global natural rubber consumption in 2012 was 10.9 mil tonnes, went up by 0.23% compared with 2011. Tapping productivity was 1.1 ton/hectare.
According to the statistics of Association of Natural Rubber Producing Countries (ANRPC) and Vietnam Rubber Group (VRG), in 2012, the exploitation of Vietnam was 863,600 tonnes, stood at the 5
th place of the
world. Besides that, Vietnam ranked 4th position in the world for the natural rubber export volume (1.02 mil
tonnes in 2012) and 2nd
for the natural rubber tapping productivity. In 2012, Vietnam average tapping productivity was 1.71 ton/hectare, lower than India (1.82 ton/hectare), significantly higher than the global average level of 1.1 ton/hectare.
In the domestic extent, Binh Phuoc and Binh Duong are 2 provinces that have largest arceage for rubber plantation, account for 22% and 18%, respectively, of total rubber area in Vietnam. The next provinces are Tay Ninh with 11%, Dong Nai with 6%.
Rubber consumption in domestic market was 15-18% of exploitation output, equivalent to 150,000 ton/year.
Rubber export: in 2012, Vietnam exported 1.02 mil tonnes of natural rubber, valued 2.85 bil USD, gained by
25% in terms of quantity and 11.7% in value. The import volume was about 302,000 tonnes dropped by
16.6% compared with 2011. The main import market is Cambodia (account for 59%) and main export market
is China (account for 40%). The export volume of listed companies of natural rubber industry accounts for a
very small portion of total industry from 3%-4%, about 28-30 thousand tonnes.
2013 industry outlook For the world: in 2013, rubber supply is expected to exceed demand about 179,000 tonnes, the long-term rubber price is also expected to drop. For Vietnam: the export volume is expected to reach 1 mil tonnes in 2013, slightly reduce compared with 1.02 mil tonnes in 2012. The import tax reduction for rubber of China and the increase in import and prospective tire industry development of India will boost the natural rubber export in 2013. The domestic demand will increase from 2013 onward since the radial tire plant operation of Casumina and Da Nang Rubber Company will start at the end of this year. In addition, VRG has invested in upgrading the productivity of VRG Khai Hoan Gloves Manufacturing Plant from 1.2 bil to 3.2 bil units/year, it will raise the domestic demand.
Strategy for industry development VRG has proposed the Government to boost Vietnam rubber area from 800,000 hectares to 1 mil hectares in 2015, raise the rubber planning in Northern Region from 50,000 hectares to 100,000 hectares in 2020. The Prime Minister signed the Decision No. 1782/QĐ-TTg approving the VRG restructure plan. In long-term orientation, the main function of rubber industry firms will focus on: (1) Planting and processing rubber, (2) Producing and processing wood, (3) Developing industrial park on rubber acreage.
Stocks of natural rubber company are divided into 2 groups. In which, 1st group includes: PHR, DPR, TRC
are seen as 3 companies having highest ROE and ROA (average ROE is 35% and ROA is 21%), this group has the best and the most stable profit margin. The 2
nd group includes: HRC and TNC with smaller scale in
terms of equity, total assets and rubber area. Besides that, these 2 companies have lower profit margin with ROE from 15-25% and ROA from 13-17%. With small scale and old rubber area, it results to lower efficiency of HRC and TNC than 3 other companies. In general, companies in natural rubber industry operate relatively well, healthy financial status, high dividend but quite low liquidity; they are appropriate for value investing.
The business results in 1st quarter of 2013 of almost companies in natural rubber industry are significantly
lower than the same period of 2012 (total revenue down by 33%, profit before tax down by 56%) due to lower consumption and lower selling price (output down by 24% and price down by 10-14%).

NATURAL RUBBER INDUSTRY
09/05/2011
09/05/2011
1
www.fpts.com.vn
Recommendation:
PHR: is the largest company among 5 companies listed in natural rubber industry at present, in 2008-2012 period, the average sales growth rate was 19.4%/year, average ROE was 35.5%/year. According to 2013 business plan, forward EPS is 4,800 VND, with the price on June 12
th, 2013 of
29,800VND the forward P/E of 2013 is 6.2 times. Dividend in 2012 was 30% in cash and that of 2013 is expected to be 30%. DPR: In 2008-2012 period, DPR had average sales growth rate about 17%/year, average ROE of 32.1%. It has had the highest profit margin in 5 listed natural rubber companies. EPS in the two recent years reached the highest level, 2011 was 18,663 VND and 2012 was 12,552 VND, this is a suitable stock for investment. According to business plan in 2013, forward EPS is 11,000 VND, with the price on June 12
th, 2013 of 50,000
VND, the forward P/E of 2013 is 4.5 times. The dividend in 2012 was 40% in cash and that of 2013 is expected to be 30%. TRC: is the 3
rd highest sales growth rate in listed natural companies, following PHR and DPR in 2008-2012
period with average sales growth rate of 14%/year, average ROE of 35%/year. According to 2013 business plan, forward EPS is 7,600 VND, with the price on June 12
th, 2013 of 49,000
VND, the forward P/E of 2013 is 6.4 times. The dividend in 2012 was 35% in cash, that of 2013 is expected
to be 30%.
With the currently declining rubber price, it shows that 2013 will be a difficult year for companies in
natural rubber industry. The investment recommendation is given for long-term basis, and limited for
short-term in this year.
Investors using this report should mention that the assessments are based on subjective opinions of FPTS
analysts. Investors take their own responsibility on investment decisions. Please read carefully the disclaimer
at the end of this report.

NATURAL RUBBER INDUSTRY
09/05/2011
09/05/2011
2
www.fpts.com.vn
CONTENTS
I. NATURAL RUBBER INDUSTRY OVERVIEW ...................................................................... 4
1. Global natural rubber industry .................................................................................... 4
2. Domestic natural rubber industry ............................................................................... 5
2.1 The position of Vietnam natural rubber industry. ...................................................... 5
2.2 Scale and dispersion structure of Vietnam natural rubber ........................................ 7
2.3 Output, natural rubber tapping productivity in Vietnam ............................................. 9
2.4 The natural rubber import-export situation of Vietnam .............................................11
II. 2013 NATURAL RUBBER INDUSTRY OUTLOOK..............................................................14
III. SITUATION OF LISTED NATURAL RUBBER COMPANIES ..............................................16
1. Operating scale ............................................................................................................16
1.1 Listed companies in the industry .............................................................................16
1.2 Rubber area, tapping volume of companies year by year .......................................17
2. Rubber area structure of listed companies ...............................................................19
3. Product structure of listed companies .......................................................................20
4. Business plan and 2013 outlook of typical companies .............................................21
APPENDIX

NATURAL RUBBER INDUSTRY
09/05/2011
09/05/2011
3
www.fpts.com.vn
ABBREVIATION CATALOGUE
PHR : Phuoc Hoa Rubber Joint Stock Company
DPR : Dong Phu Rubber Joint Stock Company
TRC : Tay Ninh Rubber Joint Stock Company
HRC : Hoa Binh Rubber Joint Stock Company
TNC : Thong Nhat Rubber Joint Stock Company
JSC : Join Stock Company
LTD : Limited
VRG : Vietnam Rubber Group
MARD : The Ministry of Agriculture and Rural Development
Net profit before tax : Net PBT
Net profit after tax : Net PAT
AGROINFO : Information Center for Vietnam Agriculture and Rural Development
IRSG : International Rubber Study Group
ANRPC : Association of Natural Rubber Producing Countries
GSO : General Statistics Office

NATURAL RUBBER INDUSTRY
09/05/2011
09/05/2011
4
www.fpts.com.vn
I. NATURAL RUBBER INDUSTRY OVERVIEW
1. Global natural rubber industry
In 2012, total natural rubber production was 11.4 mil tonnes, increase by 3.97% yoy. In which,
Asia accounted for major portion with about 93% of the global production, the following
continents were Africa (4-5%), Latin America (2.5-3%).
According to the statistics of IRSG, the global natural rubber consumption in 2012 was 10.9 mil
tonnes, went up by 0.23% yoy. Asia had the highest natural rubber consumption in the world,
about 69.7% of the global demand, the next one was Europe (13.5%), North America (10.7%).
The 4 leaders of natural rubber production includes: Thailand, Indonesia, Malaysia, Vietnam
keeps about 82% of total production output in the world; the group with highest global
consumption includes: China (33.5%), US (9.5%), India (8.7%), Japan (6.6%), Malaysia (4.6%).
For China, the five-year average consumption volume was 32% of total natural rubber
consumption in the world and accounted up to 25% of global import. The top 4 natural rubber
exporters are: Thailand (2.8 mil tonnes), Indonesia (2.45 mil tonnes), Malaysia (1.31 mil tonnes)
and Vietnam (1.02 mil tonnes), account for about 87% of global natural rubber export volume.
Global distribution in terms of consumption
Source: Agroinfo, FPTS
Unit: Mil tonnes
Global natural rubber production and consumption
2000-2012
Global distribution in terms of production

NATURAL RUBBER INDUSTRY
09/05/2011
09/05/2011
5
www.fpts.com.vn
The average growth rate of plantation area in 2000-2011 period was 3.8%/year. Total natural rubber area in the world to 2012 was 9.56 mil hectares. The average volume growth rate in 2000-2012 period was 4.2%/year. The 2012 volume was 11.41 mil tonnes, increased by 4.6% compared with 2011. The tapping productivity from 2007 up to now has been dropped from 1.23 ton/hectare down to 1.14 ton/hectare. This is the lowest level in the last 6 years.
2. Domestic natural rubber industry
2.1 The position of Vietnam natural rubber industry.
To the end of 2012, Vietnam ranked the 5th in the word for the natural rubber tapping volume with
the portion of 7.6%, equivalent to 863,600 tonnes and ranked the 4th for the natural rubber export
in the world, accounted for 10.3% of the global market share, equivalent to 1.02 mil tonnes. Four
countries including: Thailand, Indonesia, Malaysia, Vietnam account for 87% of total global natural
rubber export volume. In addition, these four countries also account for 73% of total global natural
rubber production, in which: Thailand (3.55 mil tonnes), Indonesia (3.00 mil tonnes), Malaysia (0.95
mil tonnes), India (0.904 mil tonnes) and Vietnam (0.86 mil tonnes).
Global volume and tapping capacity in
2000-2012 period
Global natural rubber area in 2000-2011 period
Top 5 countries in terms of production volume
Source: Agroinfo, FPTS
Top 4 countries in terms of export volume
Source: Agroinfo, FPTS

NATURAL RUBBER INDUSTRY
09/05/2011
09/05/2011
6
www.fpts.com.vn
Top 5 countries of tapping volume at the end of 2012
Indicators Thailand Indonesia Malaysia India Vietnam
Total area (hectare) (*) 2,756,000 3,456,000 1,048,000 737,000 910,500
Tapping volume (tonnes)
3,500,000 3,000,000 950,000 904,000 863,600
Average productivity (ton/hectare)
1.72 1.16 1.47 1.82 1.71
In the last 2 years, Vietnam reached to the 5th
position of global rubber area, in particular, in
2012, rubber area of these countries were as
following: Thailand (2.756 mil hectares),
Indonesia (3.456 mil hectares), China (1.07 mil
hectares), Malaysia (1.048 mil hectares),
Vietnam (0.91 mil hectares), India (0.737 mil
hectares).
At the end of 2012, according to the statistics of
ANRPC and VRG, Vietnam ranked the 5th for
the global natural rubber tapping volume, with
863,600 tonnes. Moreover, Vietnam had the
highest growth rate in terms of volume and area
in the world, the average growth rates in 2000-
2012 period were 9.5%/year in production and
6.8%/year in area, respectively. According to the
end of 2012’s data, tapping volume of these
countries were as following: Thailand (3.5 mil
tonnes), Indonesia (3.0 mil tonnes), Malaysia
(0.95 mil tonnes), Vietnam (0.86 mil tonnes) and
India (0.904 mil tonnes).
About the tapping volume, Vietnam is still lower
than 4 above countries. But in terms of tapping
productivity, Vietnam ranks the 2nd in the world,
the 2012’s rubber yield was 1.71 ton/hectare,
the leader was India with 1.82 ton/hectare. The
recent 5-year average of Vietnam was 1.70
ton/hectare, in which, India was 1.82
ton/hectare, Thailand was 1.68 ton/hectare,
Indonesia was 1 ton/hectare and Malaysia was
1.46 ton/hectare.
National rubber area in 2000-2012 period
National exploitation output in 2000-2012
period
National tapping productivity in 2000-2012
period
Source: Agroinfo, IRSG, ANRPC
(*) Except for Vietnam (31/12/2012), other countries’ data is updated at the end of
February 2012
To
n/h
ecta
re

NATURAL RUBBER INDUSTRY
09/05/2011
09/05/2011
7
www.fpts.com.vn
In the top four countries with highest natural
rubber export volume in 2007-2012 period,
Vietnam and Malaysia were two countries with
high export growth level, in particular: Malaysia
was 12.1%/year, Vietnam was 7.5%/year, that of
Thailand was 2.8%/year and Indonesia was
0.3%/year.
One noteworthy point of Indonesia and Malaysia is the most of their rubber area focusing on small
regions (smallholder farming), in particular, 85% rubber area in Indonesia belongs to minor
production area; this rate of Malaysia is 93%. According to the survey, this rate of Vietnam is more
balanced, in particular, the major holder farming (Government Company, JSC of VRG) accounts
for 44.36%, that of smallholder farming is 49.28% and private sector is 6.36%. With current plant
for rubber area expansion, in the future, the area for major holder farming will quickly surpass the
smallholder farm to obtain the highest portion in Vietnam.
2.2 Scale and dispersion structure of Vietnam natural rubber
Total rubber area and rubber tapping area in Vietnam
in 2005-2012 period
Source: GSO
Natural rubber export volume of Thailand, Malaysia,
Indonesia and Vietnam in 2007-2012 period

NATURAL RUBBER INDUSTRY
09/05/2011
09/05/2011
8
www.fpts.com.vn
Rubber area dispersion in terms of region
According to the regulation in Decision No. 750/QĐ-TTG and No. 124/QĐ-TTg of Prime Minister
to 2015 and 2020 vision, total domestic rubber acreage will be stable at the level of 800,000
hectares. However, to the end of 2012, according to the statistics of MARD, total area planned
for rubber plantation was 910,500 hectares, surpassed the planning for 2015. In which, rubber
tapping area accounted for about 55.55%, equivalent to 505,800 hectares. Total volume to the
end of 2012 was 863,600 tonnes, average productivity was 1.71 ton/hectare, slightly lower than
the 1.72 ton/hectare level of 2011.
The probability that Vietnam will have more than 1 mil hectares of rubber in 2015-2020 period is
very high. Accordingly, the South-eastern Region will be 390,000 hectares, the Highland Region
will be 280,000 hectares and the Southern Central Coast will be 40,000 hectares, the Northern
Central Region will be 80,000 hectares, and provinces in North-western Region will be 50,000
hectares and 200,000 hectares in Laos and Cambodia.
Regarding mainly key provinces, Binh Phuoc and Binh Duong are currently having the largest
area for rubber plantation. In which, Binh Phuoc accounts for 22% of total country area and 36%
of total area of the South-eastern Region. Binh Duong accounts for about 18%, the next
provinces are Tay Minh 10%, Gia Lai 11%, Dong Nai 6% of total country area.
Source: Decision No. 750/QĐ-TTg of Prime Minister and GSO, MARD
Rubber area in 2010-2012 period
Source : FPTS’s gathering
Rubber area dispersion in Vietnam Rubber area dispersion in key provinces
Unit: hectare

NATURAL RUBBER INDUSTRY
09/05/2011
09/05/2011
9
www.fpts.com.vn
According to planning data of VRG, to the end of 2012, the South-eastern Region will have the
largest rubber area in Vietnam. Total VRG rubber area will be 358,000 hectares, 273,000
hectares domestically planted and about 85,000 hectares abroad. To the end of 2012, total
rubber area of listed companies only accounted for about 6% of total country area and
accounted for 15% of total VRG area (including area planted overseas).
2.3 Output, natural rubber tapping productivity in Vietnam
In the last 12 years, Vietnam rubber area grew
relatively well, averaged at about 6.8%/year
from 413,000 hectares in 2000 to 910,500
hectares in 2012.
To 2012, Vietnam rubber exploitation output
was 863,600 tonnes, up 6.4% yoy. Average
output growth rate in 2000-2012 period was
9.5%/year.
In 2000, Vietnam rubber tapping productivity
was only 1.25 ton/hectare, to 2012, this level
grew to 1.71 ton/hectare. This number has
been stable in the last 3 years and at the
highest level in the last 10 years. It was the
second highest figure in the world, only after
India, that of India was 1.82 ton/hectare, and it
was approximately the same with Thailand level
of 1.72 ton/hectare, significantly outstripped the
global average level and higher than two
leaders in natural rubber production, Malaysia
(1.47 ton/hectare) and Indonesia (1.16
ton/hectare).
At present, in terms of exploitation volume,
listed companies are only accounting for about
6% of total domestic volume, 19% of VRG
(267,000 tonnes). Dong Nai Rubber General
Company is currently the biggest company with
volume of 35,000 tonnes. Total exploitation
volume of listed companies in 2012 was 51,038
Output, natural rubber tapping productivity
in Vietnam in 2000-2012 period
Source: Agroinfo
The exploitation volume in 2010-2012 period
Unit: Ton
Unit: ton

NATURAL RUBBER INDUSTRY
09/05/2011
09/05/2011
10
www.fpts.com.vn
tonnes, in which Phuoc Hoa JSC had the
highest number of 19,954 tonnes. More than
77.15% of total domestic exploitation belongs to
other subsidiaries in VRG, smallholder farming
and private companies.
In terms of key regions, Tay Ninh has the
highest tapping productivity in Vietnam with the
level of 2.10 tonnes/hectare, following by Binh
Phuoc with 1.98 ton/hectare and Binh Duong
with 1.85 ton/hectare.
In order to obtain this achievement, VRG and
Vietnam Rubber Association have made effort
continuously. The overall planning of the rubber
plantation area throughout the country
accompanies with advanced plantation method
and new plant hybridization, they have resulted
to the leading position of Vietnam in terms of
productivity among the top natural rubber
producing countries in the world.
The Vietnam rubber consumption position
in the recent years
In 2008-2012 period, the natural rubber
consumption growth rate averaged at about
11%/year, average consumption was about
132,000 tonnes/year, the average
consumption/exploitation ratio was about 17-
18%. In particular, it was 100,000 tonnes in
2008 and up to 150,000 tonnes in 2012.
The uses of natural rubber in Vietnam are
primarily for tire, medical glove, pillow,…
Additionally, natural rubber consumption is
mainly contributed by temporary import and re-
export activity.
The low domestic consumption is the result of
small domestic production scale, rubber export
companies focus on export to achieve higher
efficiency and profit level. The current
consumption is reflected by the trading form
among commercial companies in Vietnam,
afterward, these companies also export. In fact,
in consumption structure of listed companies,
The exploitation and consumption volume in
2002-2012 period
Tapping productivity in key regions
Unit:Ton/hectare
Unit: Thousand tonnes
Source: Agroinfo, FPTS

NATURAL RUBBER INDUSTRY
09/05/2011
09/05/2011
11
www.fpts.com.vn
there is about 40-50% for domestic
consumption but eventually this amount is
exported through commercial companies.
Therefore, the natural rubber supply actually
outnumbers the domestic demand very
significantly, average level of about 5-6 times in
the last 3 years.
2.4 The natural rubber import-export situation of Vietnam
2.4.1 The import situation
In 2012, the natural rubber import volume was
about 302,000 tonnes, decreased by 16.6%
compared with 2011; import value was 803.29
mil USD, dropped by 14.9% yoy. Every year,
the rubber import portion still maintains at high
level due to compensation for some materials
for domestic production that are inadequate or
not produced such as: RSS, Skim, CSR10…
Besides that, the temporary import and re-
export activity has boosted the import volume.
As the estimate in total of import volume, it is
about 60% for temporary import and re-export
activity and 40% for domestic consumption.
This shows that the actual domestic
consumption/exploitation ratio is relatively
modest, about 17-18%.
In 2012, Vietnam imported natural rubber from
more than 40 countries around the world,
mostly from: Cambodia, Thailand, Myanmar,
Laos and Korea.
From 2010 till now, Cambodia is the largest
rubber supplier of Vietnam, about 59% in terms
of quantity and 60% in terms of value. The next
one is Thailand with 17% in terms of quantity
and 18% in terms of value. They have
geographical advantage and appealing price for
import.
The import volume and value in
2010-2012 period
Source: General Department of Customs
Import market portion in terms of
quantity - 2012
Import market portion in terms of
value - 2012
Th
ousand
to
nn
es
Th
ousand
dolla
rs

NATURAL RUBBER INDUSTRY
09/05/2011
09/05/2011
12
www.fpts.com.vn
2.4.2 The export situation
Rubber is one of three major agricultural
products for export in Vietnam. In 2011,
rubber accounted for 24% of total
agricultural product export value.
The average natural rubber export growth
rate of Vietnam in 5 years was 11.9% in
terms of volume and 15.5% in terms of
value.
In 2012, according to the Statistics
Department, Vietnam’s natural rubber export
volume was 1.02 mil tonnes, valued 2.85 bil
USD; increase by 25% in volume and
declined by 11.7% in value yoy. Export
surplus in 2012 was 721,000 tonnes, valued
2.05 bil USD; increased 57.8% in volume
and decreased 13.6% in value. The cause
was over 16.6% decrease in importing
natural rubber. The higher volume was not
enough to offset for the decrease in rubber
price. In particular, the average export price
reduced by 29% compared with 2011, from
3,961 USD/ton to 2,795 USD/ton.
If we just consider the listed companies,
their export volume accounts for a very
small portion of total industry, from 3%-4%
equivalent to 28-30 thousand tonnes. About
three largest listed companies: PHR, DPR,
TRC, their export volume in 2012 dropped
by only 0.5% but export revenue dropped by
up to 29% compared yoy, it was the result of
rapid decrease last year.
The main exporters of Vietnam are: China,
Malaysia, Taiwan, Korea, German, India,
U.S....In which, China is the largest market
accounting for about 40% of total natural
rubber export value of Vietnam in 2012. Last
year, natural rubber export to it was 408
thousand tonnes, valued 1.17 bil USD,
reduced by 19% in terms of volume and
39% in terms of value compared with 2011.
Portion of rubber and major commodities
export in 2011
Volume and value of natural rubber
export in 2010-2012 period
Th
ousand
dolla
rs
Th
ousand
to
nn
es

NATURAL RUBBER INDUSTRY
09/05/2011
09/05/2011
13
www.fpts.com.vn
Although, China is major market and highly
potential, Vietnamese companies have
attempted to diversify the export market to
reduce the excessive dependence on China
to limit the risk of selling price fluctuation
and export order. In particular, in 2011,
Chinese market accounted for 60% of total
Vietnam natural rubber export value but in
2012 this number was only 40-41% both in
volume and value. This is a beneficial
direction for natural rubber exporters; it will
enable the natural rubber trading activity
and product from rubber to be more stable
and better development.
In terms of volume, Vietnam accounts for a
relatively large portion in natural rubber
import structure of countries in the area and
in the world, in particular: India (11-15%),
China (8.6%), Korea (10%), Malaysia (7%)
and US (2%).
About listed natural rubber companies, in
recent years, these companies often did not
directly export to China but through to the
sales to domestic commercial companies
and they exported to China. Therefore,
these companies only bear the indirect
affect from China. The major export markets
for these listed companies are Europe and
some Asian countries (except for China).
Besides that, they also have found major
customers with high credibility in other
potential overseas market to expand their
export market, to limit the risk for their
products.
Source: General Department of Customs
Export portion in terms of volume
in 2012
Export portion in terms of value
in 2012

NATURAL RUBBER INDUSTRY
09/05/2011
09/05/2011
14
www.fpts.com.vn
II. 2013 NATURAL RUBBER INDUSTRY OUTLOOK
1. Industry outlook
For the world: the natural rubber output in 2013 is expected to grow slowly due to the
oversupply along with weak demand. According to the forecast of IRSG, the expected global
rubber output will be 11.77 mil tonnes and demand will be 11.59 mil tonnes, oversupply will
be 179,000 tonnes. However, the Governments from Thailand, Indonesia and Malaysia also
agreed to reduce the export volume of 300,000 tonnes to constraint the decrease in price of
this product, this action will prevent from the oversupply situation in 2013.
The forecast on exploitation volume growth rate in 2013 of major rubber producers in the
world: Thailand increase by 3.4%, Indonesia decrease by 8.9%, Malaysia increase by 6.5%,
India increase by 3.8%, Vietnam increase by 10% (for VRG).
At present, to April 2013, the total natural rubber inventory at two general warehouses:
Shanghai and Qingdao of China was 480,000 tonnes, at the 3-year highest level, accounted
for more than 16% of import in 2013. With high inventory as well as import rubber demand for
China automobile tire manufacturing is expected to grow by only 0.9% in 2013, additionally,
the pressure from Chinese Yuan appreciation to reduce export surplus, European sovereign
debt crisis does not have improvement sign, they will constraint the increase of rubber price
in the near future. According to industry specialists, in 2013, the rubber price will reduce in
the first half year and will endure the decrease in the next period if there is no sign of
recovery from major economies like: US, China and Japan.
Natural rubber price movement in 2008-2012 period
Source: FPTS’s gathering

NATURAL RUBBER INDUSTRY
09/05/2011
09/05/2011
15
www.fpts.com.vn
For Vietnam:
About export:
The forecast on China import demand (the biggest export market of Vietnam) shows that
there will be a slight growth of 0.9%. In the meanwhile, as the cautious estimate of MARD,
the natural rubber export in 2013 will be approximately 1 mil tonnes, slightly lower than 1.02
mil tonnes of 2012.
Furthermore, on December 17th, 2012, the Chinese Ministry of Finance stated that it will cut
back the tax on natural rubber import in 2013. This is a good signal for domestic
manufacturing and trading companies in 2013.
Besides that, for India (the 3rd largest natural rubber importer of Vietnam), the 17% depreciation of Rupee will encourage the India tire export industry, it will grow by from 8-10% in 2013. Consequently, it will lift up the demand for import natural rubber for manufacturing, it is estimated that India will in need of about 225,000 tonnes in 2013, increase by 9.7% compared with 2012.
However, the drop in rubber price is one of the barriers of domestic rubber companies. The
natural rubber price is forecast to be in downtrend in the first half of this year. The recovery in
the rest of the year is still no answer, but the majority of specialists and research agencies
suppose that rubber price will be decrease in long term. Therefore, the growth of natural
rubber industry in the next period will depend on the volume growth.
About the domestic market:
According to the latest data, the domestic demand in the last 3 years accounted for about 17-
18% of total domestic supply. This rate will be improved from 2013 when Da Nang Rubber
JSC and Casumina launch two entire-steel radial tire plants. Besides that, in 2012, VRG has
invested in upgrading the productivity of VRG Khai Hoan Glove Manufacturing Plant from 1.2
bil to 3.2 bil units/year, this will be promising for the higher domestic demand in the near
future.
2. The development strategy
In 2013, VRG will exploit the first 600 hectares of rubber in Cambodia. To the end of 2012, VRG planted 63,000 hectares of rubber in Cambodia. It plans to complete 100,000 hectares in 2014.
To 2015, it is expected to have stable rubber area of 800,000 hectares, the productivity will be 1.2 mil ton/year. Nevertheless, to the end of 2012, total Vietnam rubber area was 910,500 hectares, higher than the 2015 plan figure. As a result, VRG is proposing the Government for a higher adjustment to 1 mil hectares in 2015. In 2020-2030 period, the rubber volume of Vietnam is expected to be about 1-1.1 mil ton/year, account for about 10% of global volume, it will be a favourable advantage of Vietnam natural rubber industry.
The Government has had the plan to expand the rubber area to the Northern provinces. According to the plan, to 2020, there will be 50,000 hectares of rubber area planted in the North-western provinces. After many years of implementation, at present, MARD announces that the North-western provinces have 19,707 hectares of rubber planted, that fulfils 39% the plan. In which, Son La has 6,664 hectares, Dien Bien has 3,468 hectares, Lai Chau has 8,986 hectares. In the demand of development and the land support from farmers of the Northern mountainous area, MARD has asked the Prime Minister for the

NATURAL RUBBER INDUSTRY
09/05/2011
09/05/2011
16
www.fpts.com.vn
adjustment for the rubber development plan in the North-western Region from 50,000 hectares to 100,000 hectares to 2020.
On November 23rd, 2012, the Prime Minister signed the Decision No. 1782/QĐ-TTg regarding the Vietnam Rubber Group Restructure Plan. Accordingly, it is planned to withdraw capital from the investment outside of core industry in 2012-2020 period. For long-term orientation, the main activities of companies in industry will focus on: (1) Rubber plantation and processing, (2) Wood production and processing, (3) Industrial park development on rubber planting area. According to the capital withdraw plan, it will partial affect the listed companies. In particular, PHR will on the 2012-2015 road map to withdraw capital from the hydropower and other industry sectors such as: Gruco Gon River Hydropower, VRG Ngoc Linh Hydropower, VRG Sai Gon Investment JSC. HRC and DPR also withdrawal from Viet Long Investment Fund, TRC has planned to withdraw capital from Rubber Commercial Services and Tourism JSC, VRG Infrastructure Investment Ltd Company... Furthermore, in the future, the major companies in industry being in the form of Single Member Ltd Company will be equitized to attract investment and improve the competition in industry.
According to the plan, VRG will keep 100% capital of 22 Single Member Ltd Companies; hold more than 50% of 18 JSC; less than 50% of 20 other companies.
In general, this capital withdrawal plan will be a strategic step for long-term development of
entire industry. This will foster financial capital and human resources concentration for the whole
industry to improve the strength and core business for future sustainable development.
III. SITUATION OF LISTED COMPANY IN NATURAL RUBBER INDUSTRY
1. Operating scale
1.1 Listed companies in the industry:
Indicators on March 31st
, 2013 PHR DPR TRC HRC TNC
Stock exchange HOSE HOSE HOSE HOSE HOSE
Chartered capital (mil VND) 813,000 430,000 300,000 172,610 192,500
Total assets (mil VND) 3,101,131 2,821,172 1,484,791 656,835 379,867
Owners’ equity (mil VND) 2,024,148 2,179,990 1,308,986 484,351 329,669
Outstanding shares (shares) 78,490,047 43,000,000 29,125,000 17,260,976 19,250,000

NATURAL RUBBER INDUSTRY
09/05/2011
09/05/2011
17
www.fpts.com.vn
Name
Dec 31st
,2012 Rubber area
(hectares)
Tapping area
(hectares)
Productivity (Ton/hectare)
Tapping output
(Tonnes)
Phuoc Hoa Rubber Joint Stock Company - PHR
22,489 11,000 2.00 19,954
Dong Phu Rubber Joint Stock Company – DPR
15,925 7,121 2.30 16,368
Tay Ninh Rubber Joint Stock Company – TRC
7,300 5,407 2.15 11,602
Hoa Binh Rubber Joint Stock Company – HRC
5,101 1,812 0.88 1,700
Thong Nhat Rubber Joint Stock Company – TNC
2,075 1,298 1.09 1,414
1.2 Rubber area, tapping volume of companies year by year
Source: FPTS’s gathering
Area
Tapping volume
Unit: hectare
Unit: ton
The rubber acreage of almost
companies increased in 2012. The
main factor for year by year area
growth is the rubber plantation in
Laos and Cambodia. In specific, in
2012, PHR added 2,278 hectares
in KamphongThom - Cambodia;
DPR added 1,300 hectares in
Kratie - Cambodia; TRC added
473 hectares in SiemRiep -
Cambodia, HRC is currently
replanting in large scale, resulting
to significant fall in tapping area, it
is only 2,241 hectares at present,
TNC in 2012 maintained the
productive area of 1,344 hectares.
NATURAL RUBBER INDUSTRY
09/05/2011
09/05/2011
18
www.fpts.com.vn
Source: FPTS’s gathering
Unit: t
on/h
ecta
re
Unit: h
ecta
re
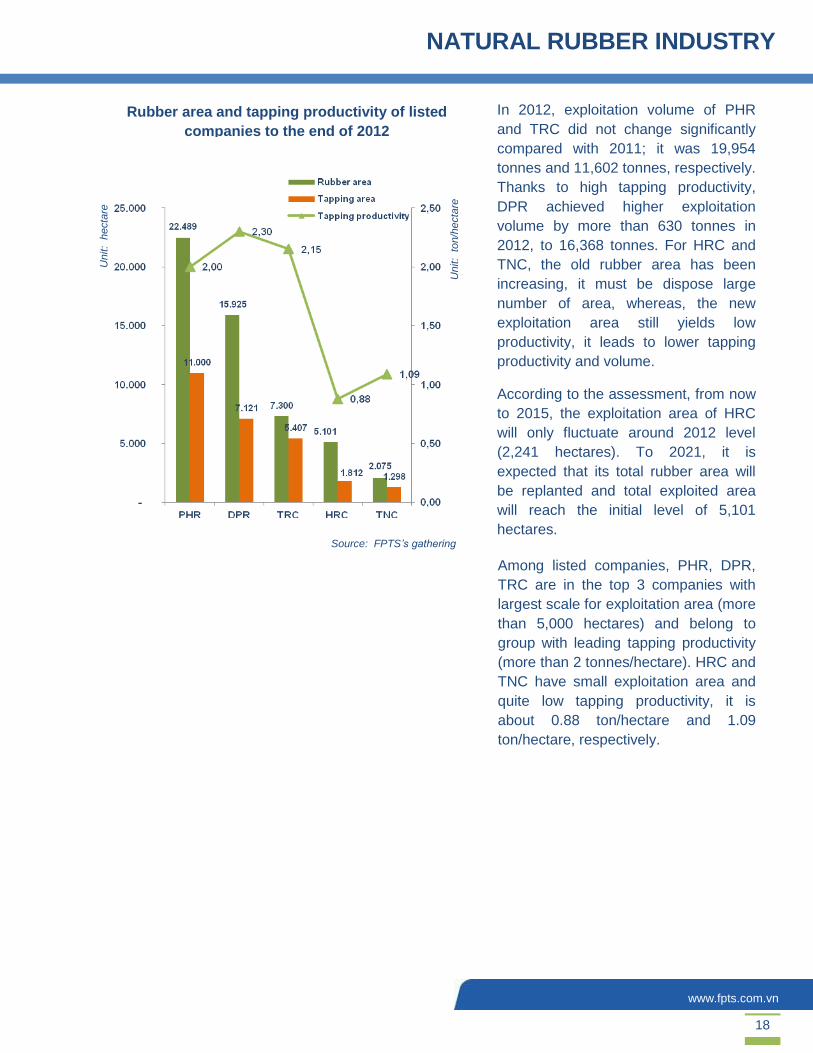
Rubber area and tapping productivity of listed
companies to the end of 2012
Among listed companies, PHR, DPR,
TRC are in the top 3 companies with
largest scale for exploitation area (more
than 5,000 hectares) and belong to
group with leading tapping productivity
(more than 2 tonnes/hectare). HRC and
TNC have small exploitation area and
quite low tapping productivity, it is
about 0.88 ton/hectare and 1.09
ton/hectare, respectively.
In 2012, exploitation volume of PHR
and TRC did not change significantly
compared with 2011; it was 19,954
tonnes and 11,602 tonnes, respectively.
Thanks to high tapping productivity,
DPR achieved higher exploitation
volume by more than 630 tonnes in
2012, to 16,368 tonnes. For HRC and
TNC, the old rubber area has been
increasing, it must be dispose large
number of area, whereas, the new
exploitation area still yields low
productivity, it leads to lower tapping
productivity and volume.
According to the assessment, from now
to 2015, the exploitation area of HRC
will only fluctuate around 2012 level
(2,241 hectares). To 2021, it is
expected that its total rubber area will
be replanted and total exploited area
will reach the initial level of 5,101
hectares.

NATURAL RUBBER INDUSTRY
09/05/2011
09/05/2011
19
www.fpts.com.vn
2. Rubber area structure of listed companies
At present, among listed companies, HRC has highest portion of old rubber area, HRC has up
to 50% of rubber area more than 24 years old and is currently replanting about 47% by new
area. It leads to lower exploitation efficiency and lift the exploitation expense of HRC in
comparison with other companies in the industry.
PHR currently has 22% of rubber area more than 25 years old, 42% of area from 11-25 years
old but it is compensated by about 29% of area in basic construction stage to replace old area.
DPR has 15% of rubber area more than 25 years old, however it has up to 70% of area in the
period of yielding high productivity. TRC has 13% of area more than 25 years old and 71% of
area in energetic period with high ability to produce latex. TNC has about 18% of area more
than 25 years old, 39% from 11-25 years old and it is replanting in large rate with more than
32% of area from 0-6 years old.
DPR
a DPR
TRC PHR
a DPR
HRC
a DPR
TNC
a DPR
Source: Listed company data, FPTS’s gathering

NATURAL RUBBER INDUSTRY
09/05/2011
09/05/2011
20
www.fpts.com.vn
3. Product structure of listed companies
The product structure of listed companies in natural rubber industry implies that almost the
companies produce SVR and Latex. In which, SVR dominates; this is also the advantageous
product of Vietnam. In the structure of natural rubber product export, this product accounts for
roughly 75-80%. PHR and HRC mainly focus on high value SVR CV50, 60; DPR focuses on
SVR3L, SVR10, 20; TRC has the strength in Latex and TNC has RSS which creating
competitive advantage over the rest listed companies.
PHR
TRC DPR
Source: Listed company data and VRG
HRC
PHR
TNC

NATURAL RUBBER INDUSTRY
09/05/2011
09/05/2011
21
www.fpts.com.vn
4. Business plan and 2013 outlook of typical companies
Indicators Unit PHR DPR TRC
Market price (12/06/2013) VND/share 29,800 50,000 49,000
Average 3-month trading volume Share/day 67,171 15,614 2,580
Gross profit margin % 29.48 39.96 32.42
Net PBT margin % 33.96 42.52 42.59
2012 ROE % 31.78 26.39 28.60
2013E EPS VND/share 4,800 11,000 7,600
P/E forward Times 6.2 4.5 6.4
Source : Listed companies’ consolidated financial statement
and FPTS’s gathering
PHR
PHR is the largest company among 5 listed natural rubber companies with average revenue
growth rate of 19.4% in 2008-2012 period, average ROE of 35.5%/year. With large scale of
rubber area and large portion of high-value and diverse products, it has created competitive
advantage over other listed companies. One noteworthy point about PHR is that the corporate
tax rate imposed on PHR is 25% while other companies such as DPR, TRC are granted with the
tax rate of 15% and reduced by 50% (according to the provision of Circular No. 134/2007/TT-
BTC issued by the Ministry of Finance on November 23rd, 2011 about equitization of State
enterprises). This undermines the operating efficiency of PHR compared with other companies
in industry.
According to the 2013 business plan: consumption volume will decrease by 17%,
revenue will decrease by 20%, Net PBT will decrease by 32% compared with 2012 result.
Expected dividend is 30%.
According to 2013 plan, PHR sets the consumption of about 26,000 tonnes of rubber, decrease
by 17% compared with 2012. This substantial drop is caused by the reason that the company
will exploit new rubber area with low productivity in first period; average tapping productivity is
2013 Plan Unit PHR DPR TRC
Total area Hectare 22,733 16,907 7,773
Tapping area Hectare 10,636 7,121 5,011
%FY2012 100% 100% 93%
Consumption Tonnes 26,000 20,000 12,602
%FY2012 83% 104% 91%
Average selling price Mil
VND/Ton 62 62 62
%FY2012 95% 97% 100%
Revenue Bil VND 1,857 1,434 901.3
%FY2012 80% 103,6% 98%
Net PBT Bil VND 504 515 256.9
%FY2012 68% 87% 67%

NATURAL RUBBER INDUSTRY
09/05/2011
09/05/2011
22
www.fpts.com.vn
estimated to be only 1.84 ton/hectare compared with 2 tonnes/hectare of 2012. With the
temporary selling price appointed by VRG of 62 mil VND, reduced by 20% compared with 2012,
Net PBT is forecast to be 504 bil VND, reduced by 32% compared with 2012. At the moment,
PHR has signed about 60% of orders for 2013.
1st quarter of 2013 business result: net sales was 331.6 bil VND, accomplished 17.8% of
2013 plan; Net PBT was 65.69 bil VND, accomplished 13% of 2013 plan, reduced by 71%
compared with the same period of 2012. Average selling price in 1st quarter of 2013 was 62.3
mil VND/ton.
Revenue and profit figures plummeted compared with the same period of 2012 due to: (1) 2,327 tonnes reduction in consumption; (2) 10.36 mil VND/ton reduction in selling price; (3) 119.64 hectares reduction in rubber disposal area. If the price maintains at present level, it will accomplish and even exceed the 2013 plan set by Annual General Meeting’s decision.
Rubber plantation plan
KamthongThom Project: to 2013, it is expected to plant the last 300 hectares to achieve the
plan of 7,600 hectares of rubber area. At the end of 2014, the first 500 hectares will be tapped
(planted in 2009).
Daklak Project: PHR only planted 113 hectares. In 2013, it is expected to plant 1,000 hectares
additionally and complete 8,000 hectares to 2017.
2012 ROE was 31.78%, the highest of 5 listed companies.
According to the 2013 business plan, forward EPS is 4,800 VND, as the price of 29,800
VND on June 12th, 2013 the forward P/E will be 6.2 times. Under the rapid decrease in
rubber price circumstance at present, it is recommended for long-term investment, and
limiting short-term investment in this year.
DPR
In 2008-2012 period, DPR had the average sales growth rate of 17%/year, average ROE of 32.1%/year. In terms of profit to sales ratio, DPR has the most effective business result among 5 listed
companies. The EPS of 2 recent years were very high, they were 18,663 VND and 12,552 VND
in 2011 and 2012, respectively, this is good stock for investment.
According to 2013 plan: consumption volume increase by 4%, sales increase by 3.6%
and Net PBT will be equal 87% of 2012 result. Expected dividend is 30%.
According to 2013 plan, tapping area of DPR will unchanged, consumption output is expected
to be 20,000 tonnes, 4% higher than 2012 result and sales target is 1,434 bil VND, increase by
3.6% compared with 2012. Net PBT will be 515 bil VND, down by 13% compared with 2012.
1st quarter of 2013 business result: it got 228 bil VND of net revenue, accomplished 15.9%
of 2013 plan, 24% lower than the same period last year. Net PBT was 78.3 bil VND,
accomplished 15.2% of 2013 plan, reduced by 31% compared with same period of 2012.
Sales and profit figures lower than the same period were caused by low consumption in 1st
quarter, more than 660 tonnes (down by 24%), selling price reduced by more than 8.4 mil
VND/ton compared with 1st quarter of 2012.

NATURAL RUBBER INDUSTRY
09/05/2011
09/05/2011
23
www.fpts.com.vn
Rubber plantation project:
Dong Phu Kratie Project: to 2013, DPR plans to plant the last 300 hectares, completes 6,500
hectares of rubber area. At the end of 2014, it will exploit the first 1,100 hectares (planted in
2009).
Daknong Project: 946 hectares already planted. In 2013, it will plant 54 hectares more. At the
end of 2013, it will exploit 180 hectares (planted in 2007).
According to 2013 business plan, forward EPS is 11,000 VND; as the price on June 12th,
2013 of 50,000VND then the 2013 forward P/E is 4.5 times. Under the rapid decrease in
rubber price circumstance at present, it is recommended for long-term investment, and
limiting short-term investment in this year.
TRC
TRC is the listed company ranking the 3rd for sales growth rate after PHR and DPR in 2008-2012 period, sales growth rate was 14%/year. Average ROE was 35%/year.
2013 plan: consumption volume will go down by 9%; sales down by 12% and Net PBT
down by 33% compared with 2012. Expected dividend is 30%.
In this year, TRC will dispose the old rubber area, exploitation area will be decrease by about
500 hectares, it will lead to the lower output in 2013 as well as the lower selling price, down to
62 mil VND/ton, according to the plan and direction of VRG. TRC has set a relatively cautious
target.
1st quarter of 2013 business result: net sales was 183.8 bil VND, accomplished 20% of 2013
plan, decrease by 27% compared with the same period; Net PBT was 54.5 bil VND, completed
21% of 2013 plan, decrease by 7% compared with same period. Sales and profit went down as
the result of consumption dropped by more than 402 tonnes and selling price fell by about 7 mil
VND/ton compared with 2012.
Rubber plantation project: at present, TRC is fully drawing attention to the Tay Ninh Rubber
Siem Riep Project in Cambodia with total area of 7,600 hectares. In comparison with TRC’s
5,407 hectares currently exploited in Vietnam over total rubber area of 7,300 hectares, this
project plays a critical role in the long-term development of TRC. At the moment, 100% land of
this project has been granted by Cambodia Government, but it is awaiting the investment
license from Vietnam Government. Therefore, the company is facing the trouble of transferring
direct capital investment from Vietnam to Cambodia. However, according to the plan, to 2015,
7,250 hectares of rubber will be completely planted. Until now, there has been 473 hectares of
rubber planted, in 2013, the company is on schedule to plant 2,000 hectares more.
According to 2013 business plan, forward EPS is 7,600VND, as the market price on June
12th, 2013 of 49,000VND, then the 2013 forward P/E is 6.4 times. Under the rapid decrease
in rubber price circumstance at present, it is recommended for long-term investment,
and limiting short-term investment in this year.

NATURAL RUBBER INDUSTRY
09/05/2011
09/05/2011
24
www.fpts.com.vn
Liquidity of listed natural rubber company shares in 3 months
(Average volume over one trading session)
Source: FPTS’s gathering
Table of financial indicators of listed companies in natural rubber industry
P/E – P/B of companies compared with industry average ratio
Unit:Share/day

NATURAL RUBBER INDUSTRY
09/05/2011
09/05/2011
25
www.fpts.com.vn
APPENDIX
Year Total area Tapping Area Volume Tapping
productivity
2000 413,000 232,000 291,000 1.25
2001 416,000 241,000 313,000 1.30
2002 429,000 243,000 298,000 1.23
2003 441,000 267,000 364,000 1.36
2004 454,000 301,000 419,000 1.39
2005 483,000 334,000 482,000 1.44
2006 522,000 356,000 555,000 1.56
2007 556,000 373,000 602,000 1.61
2008 631,000 399,000 660,000 1.65
2009 678,000 422,000 724,000 1.72
2010 749,000 439,000 752,000 1.71
2011 834,000 472,000 812,000 1.72
2012 910,500 505,800 863,600 1.707
References
Ministry of Agriculture and Rural Development
Vietnam Rubber Group - VRG
Specialized information of Vietnam Rubber Group
Agroinfo statistics
IRSG statistics
Materials from International Rubber Conference in China
Material from Natural rubber market report of Industry and Commerce information Center of Ministry of Industry and Commerce
General Department of Customs data
General Statistics Office data
Data from websites: Thitruongcaosu.net, Tocom, AFET, Malaysian Rubber Board, Indexmundi, Thuvienphapluat và website doanh nghiệp.
Other materials
Vietnam natural rubber statistics
Source: Agroinfo

NATURAL RUBBER INDUSTRY
09/05/2011
09/05/2011
26
www.fpts.com.vn
5-year business result of listed companies in industry
PHR 2008 2009 2010 2011 2012 Average/CAGR
Revenue 1,091,577 1,067,844 2,030,099 2,583,186 2,218,195 19.38%
Gross profit 354,260 282,903 709,436 1,021,833 653,981 20.60%
Gross profit margin 32.45% 26.49% 34.95% 39.56% 29.48% 33.61%
Net PBT 388,939 351,095 661,578 1,003,389 753,204 17.97%
Net PBT margin 35.63% 32.88% 32.59% 38.84% 33.96% 35.12%
ROA 16.81% 14.48% 24.11% 30.65% 19.44% 21.06%
ROE 28.71% 28.71% 28.71% 28.71% 31.78% 35.54%
DPR 2008 2009 2010 2011 2012 Average/CAGR
Revenue 728,795 648,310 1,028,421 1,837,202 1,384,643 17.40%
Gross profit 252,024 233,460 463,062 866,224 553,307 21.73%
Gross profit margin 34.58% 36.01% 45.03% 47.15% 39.96% 42.08%
Net PBT 234,044 220,723 433,410 871,211 588,719 25.94%
Net PBT margin 32.11% 34.05% 42.14% 47.42% 42.52% 41.73%
ROA 21.48% 18.40% 27.00% 39.11% 20.56% 23.66%
ROE 36.67% 28.59% 38.37% 51.19% 26.39% 32.11%
TRC 2008 2009 2010 2011 2012 Average/CAGR
Revenue 549,115 440,353 757,982 1,195,284 915,510 13.60%
Gross profit 206,499 150,558 325,501 494,546 296,806 9.50%
Gross profit margin 37.61% 34.19% 42.94% 41.37% 32.42% 38.20%
Net PBT 198,220 162,510 304,993 568,058 389,933 18.43%
Net PBT margin 36.10% 36.90% 40.24% 47.52% 42.59% 42.08%
ROA 26.83% 21.12% 29.75% 40.78% 23.57% 27.27%
ROE 42.18% 28.25% 39.98% 54.38% 28.60% 34.73%
HRC 2008 2009 2010 2011 2012 Average/CAGR
Revenue 289,976 202,645 411,801 688,411 494,477 14.27%
Gross profit 98,951 50,816 105,668 134,112 40,139 -20.19%
Gross profit margin 34.12% 25.08% 25.66% 19.48% 8.12% 20.59%
Net PBT 88,025 71,523 106,512 142,537 110,502 5.85%
Net PBT margin 30.36% 35.29% 25.86% 20.71% 22.35% 24.87%
ROA 22.15% 15.88% 20.28% 22.83% 13.91% 17.88%
ROE 26.95% 19.37% 24.68% 29.55% 18.88% 22.97%
TNC (*) 2008 2009 2010 2011 2012 Average/CAGR
Revenue 181,765 171,590 181,156 144,666 191,088 3.65%
Gross profit 13,782 38,944 62,068 70,499 55,042 12.22%
Gross profit margin 7.58% 22.70% 34.26% 48.73% 28.80% 32.91%
Net PBT 8,393 34,402 60,427 82,403 79,429 32.17%
Net PBT margin 4.62% 20.05% 33.36% 56.96% 41.57% 37.28%
ROA 3.10% 11.06% 17.98% 22.10% 19.44% 17.21%
ROE 3.90% 12.80% 20.11% 24.80% 22.04% 19.40%
Source:Listed companies’ audited financial statements (*) Growth rate data of TNC was taken from 2009 to 2012 because in 2008,
there was an extraordinary change due to the economic recession.

NATURAL RUBBER INDUSTRY
09/05/2011
09/05/2011
27
www.fpts.com.vn
Disclaimers
The information and statements contained herein, including any expression of opinion, are based upon sources believed to be reliable but their accuracy, completeness or correctness is not guaranteed.
Expressions of opinion herein were arrived at after due and careful consideration and they were based upon the best information then known to us, and in our opinion are fair and reasonable in the circumstances prevailing at the time. Expressions of opinion contained herein are subject to change without notice.
This document is not and should not be construed as, an offer or the solicitation of an offer to buy or sell any securities. FPTS and other related companies and/or their officers, directors and employees may have positions and may have affect transactions in securities of companies mentioned herein and may also perform or seek to perform investment banking services for these companies.
No person is authorized to give any information or to make any representation not contained in this document and any information or representation not contained in this document must not be relied upon as having been authorized by or on behalf of FPTS. This document is private circulation only and is not for publication in the press or elsewhere.
FPTS accepts no liabilities whatsoever for any direct or consequential loss arising from any use of this document or its contents. The use of any information, statements forecasts and projection contained herein shall be at the sole discretion and risk of the users. This document is confidential and is intended solely for the use of its recipient. Any duplication or redistribution of this document is prohibited.
At the time of writing this analytic report, FPTS hold 4 shares of this enterprise and FPTS’ analysts do not hold.
The information related to other stocks or other information related this stock can be viewed at
https://ezsearch.fpts.com.vn or will be provided upon official request
Copyright © 2010 FPT Securities Corporation
FPT Securities Joint-stock
company
Head office
Floor 2 – Tower 71 Nguyen Chi
Thanh,
Dong Đa district, Hanoi, Vietnam
Phone: (84.4) 3 773 7070 / 271
7171
Fax: (84.4) 3 773 9058
FPT Securities Joint-stock
company
Ho Chi Minh city branch
29-31 Nguyen Cong Tru, Nguyen
Thai Binh ward, HCMC, Vietnam
Phone: (84.8) 6 290 8686
Fax: (84.8) 6 291 0607
FPT Securities Joint-stock
company
Da Nang branch
124 Nguyen Thi Minh Khai, Hai Châu
district, Da Nang city, Vietnam
Phone: (84.511) 3553 666
Fax: (84.511) 3553 888