nga-west2 gmpe average site coefficients for use in … · · 2015-06-22nga-west2 gmpe average...
TRANSCRIPT

NGA-West2 GMPE Average Site Coefficients for Use in Earthquake-Resistant Design
By Roger D. Borcherdt
Open-File Report 2015–1116
U.S. Department of the Interior U.S. Geological Survey

U.S. Department of the Interior SALLY JEWELL, Secretary
U.S. Geological Survey Suzette M. Kimball, Acting Director
U.S. Geological Survey, Reston, Virginia: 2015
For more information on the USGS—the Federal source for science about the Earth, its natural and living resources, natural hazards, and the environment—visit http://www.usgs.gov/ or call 1–888–ASK–USGS (1–888–275–8747).
For an overview of USGS information products, including maps, imagery, and publications, visit http://www.usgs.gov/pubprod/.
Any use of trade, firm, or product names is for descriptive purposes only and does not imply endorsement by the U.S. Government.
Although this information product, for the most part, is in the public domain, it also may contain copyrighted materials as noted in the text. Permission to reproduce copyrighted items must be secured from the copyright owner.
Suggested citation: Borcherdt, R.D., 2015, NGA-West2 GMPE average site coefficients for use in earthquake-resistant design: U.S. Geological Survey Open-File Report 2015–1116, 27 p., http://dx.doi.org/10.3133/ofr20151116.
ISSN 2331-1258 (online)

iii
Acknowledgments
This study was motivated by the NGA-West2 project coordinated by the Pacific Earthquake Engineering Research Center and by discussions with members of the Provision Update Committee for ASCE/SEI 7-16. Special acknowledgments are due to all of the NGA-West2 project participants and the developers for the GMPEs. Special notes of thanks are due Dr. Charles Kircher and Dr. Sanaz Rezaeian for their generous contributions and many keen insights. Dr. Kircher kindly provided his Excel calculations and preprints of his results. Dr. Rezaeian kindly provided independent MATLAB estimates of the spectral amplifications versus period for each GMPE. Emel Seyhan’s excellent Excel compilation of the NGA-W2 GMPEs on the Pacific Earthquake Engineering Research Center web site is gratefully acknowledged. Suggestions by PUC members and review comments provided by Dr. Kircher, Dr. Sanaz Rezaeian, Dr. Mehmet Celebi, and Mr. Keith Knudsen are sincerely appreciated.
iv
Contents
Acknowledgments ....................................................................................................................................................... iii Contents ..................................................................................................................................................................... iv NGA-West2 GMPE Average Site Coefficients for Use in Earthquake-Resistant Design ............................................ 1 Abstract ...................................................................................................................................................................... 1 Introduction ................................................................................................................................................................. 1 NGA-West2 Site Coefficients ...................................................................................................................................... 2 NGA-W2 Amplification as a Function of Period .......................................................................................................... 4 Comparison of NGA-W2 and NGA-W1 Amplification Factors with NEHRP Coefficients ............................................ 4 NGA-W2 Scaling Factors to Reduce Conservatism in Design Spectra and to Scale Site Amplification Coefficients to Other Reference Site Conditions ....................................................................................................... 12 Implications of NGA-W2 for ASCE 7-10 (NEHRP) Site Coefficients ......................................................................... 18 Comparison of NGA-W2 Coefficients with Those Proposed for ASCE 7-16 ............................................................. 19 Conclusions .............................................................................................................................................................. 24 References Cited ...................................................................................................................................................... 25
Figures 1. Graphs showing NGA-W2 and NGA-W1 spectral amplifications with respect to site class B for site class E at
PGA levels of 0.1 g and 0.4 g together with corresponding average short-period and mid-period spectral amplifications ................................................................................................................................................. 5
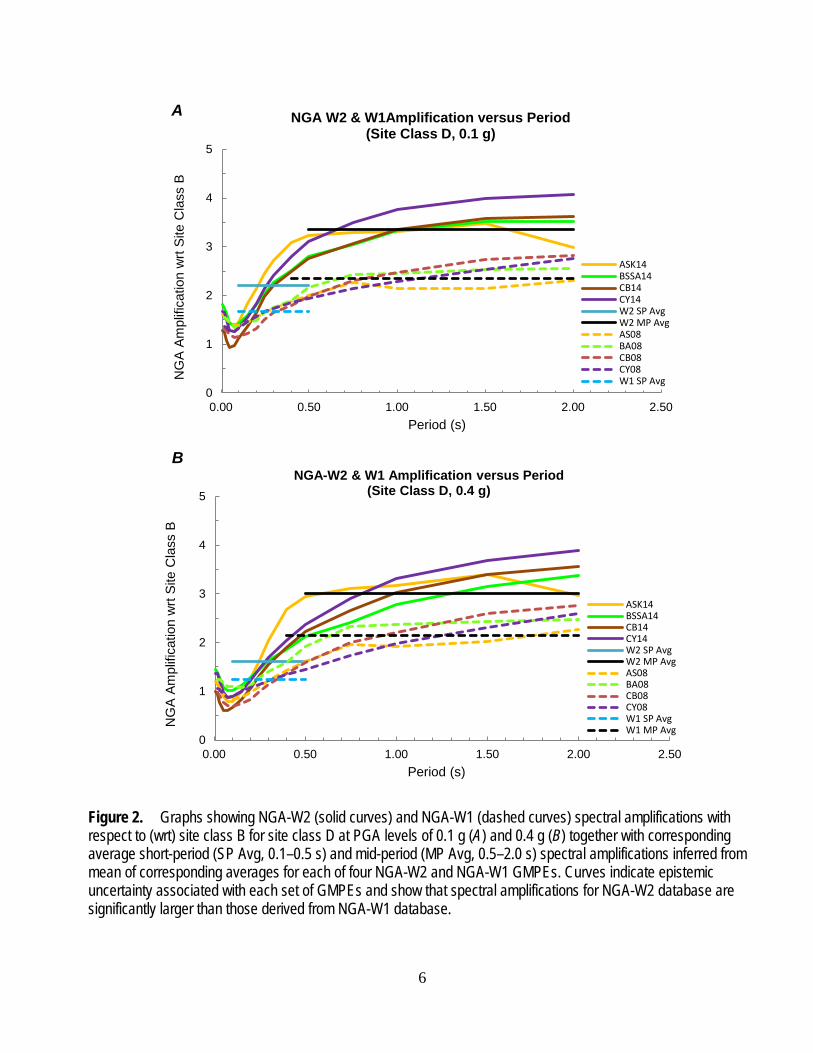
2. Graphs showing NGA-W2 and NGA-W1 spectral amplifications with respect to site class B for site class D at PGA levels of 0.1 g and 0.4 g together with corresponding average short-period and mid-period spectral amplifications ................................................................................................................................................. 6
3. Graphs showing NGA-W2 and NGA-W1 spectral amplifications with respect to site class B for site class C at PGA levels of 0.1 g and 0.4 g together with corresponding average short-period and mid-period spectral amplifications ................................................................................................................................................. 7
4. Graphs showing short-period and mid-period average amplification values for site class E for each NGA-W2 GMPE, NGA-W2 Avg, and 95 percent NGA-W2 limits (W2 Avg +2 SD), NGA-W1 Avg, W2 SA @ 0.2 s , 1.0 s, and NEHRP site coefficients as a function of PGA ........................................................................................ 8
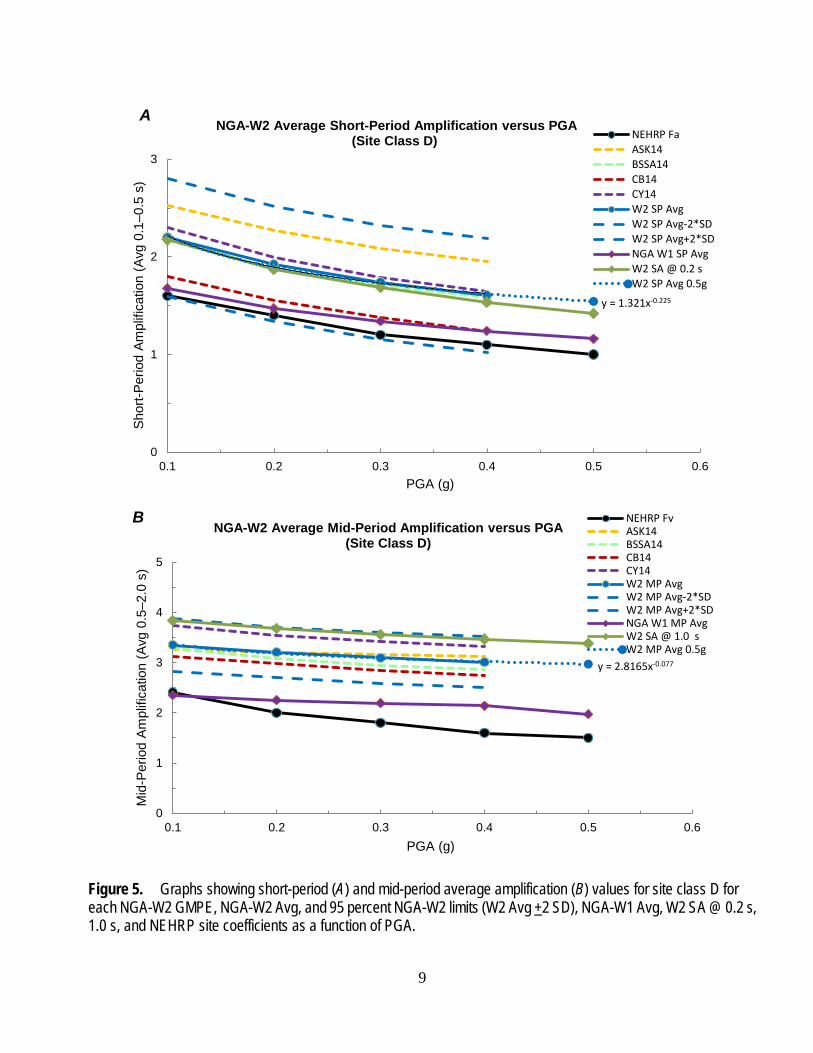
5. Graphs showing short-period and mid-period average amplification values for site class D for each NGA-W2 GMPE, NGA-W2 Avg, and 95 percent NGA-W2 limits (W2 Avg +2 SD), NGA-W1 Avg, W2 SA @ 0.2 s , 1.0 s, and NEHRP site coefficients as a function of PGA ........................................................................................ 9
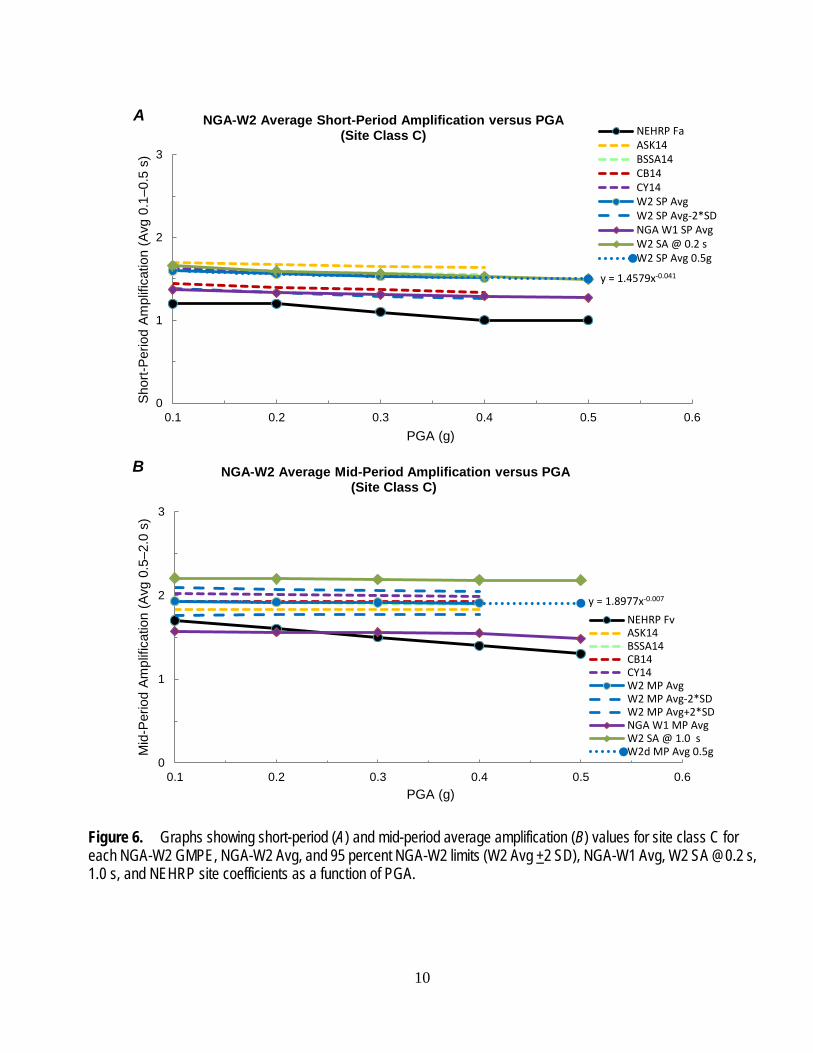
6. Graphs showing short-period and mid-period average amplification values for site class C for each NGA-W2 GMPE, NGA-W2 Avg, and 95 percent NGA-W2 limits (W2 Avg +2 SD), NGA-W1 Avg, W2 SA @ 0.2, 1.0 s, and NEHRP site coefficients as a function of PGA ...................................................................................... 10
7. Graphs showing short-period coefficients and mid-period coefficients at PGA=0.1 g as a function of vS30 for each NGA-W2 GMPE, NGA-W2 Avg, NGA-W2 Avg +2 SD, and NEHRP Fa and Fv site coefficients......... 13
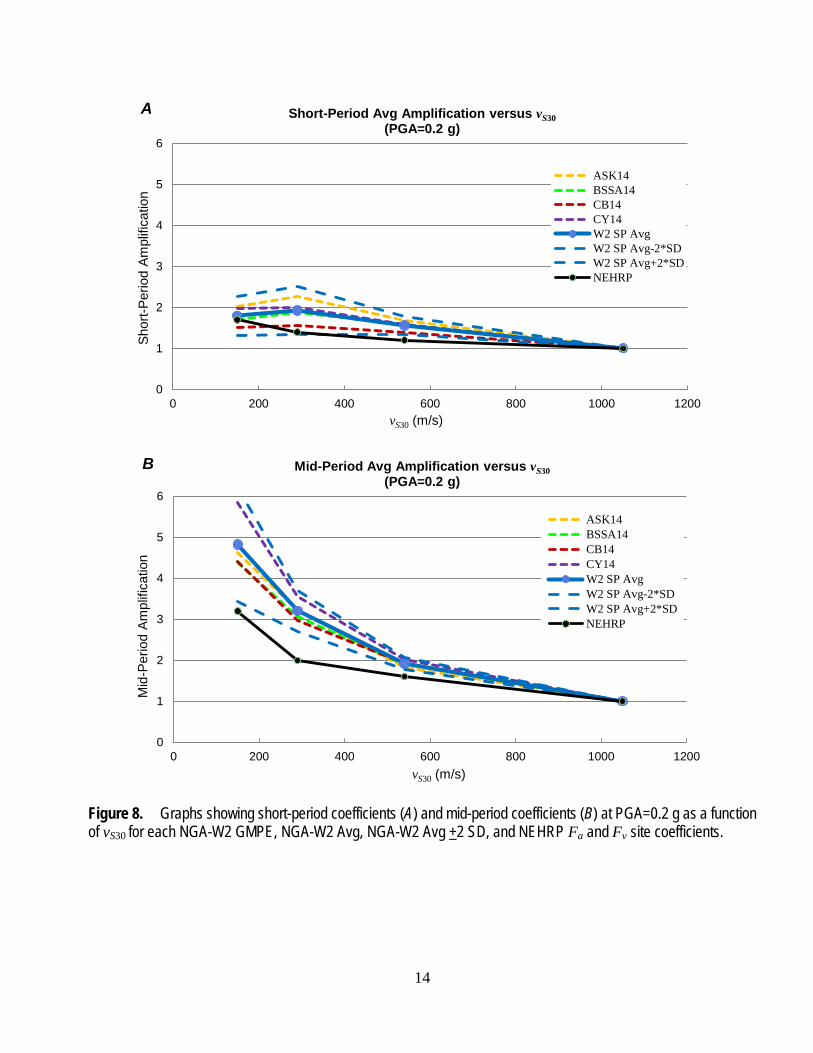
8. Graphs showing short-period coefficients and mid-period coefficients at PGA=0.2 g as a function of vS30 for each NGA-W2 GMPE, NGA-W2 Avg, NGA-W2 Avg +2 SD, and NEHRP Fa and Fv site coefficients......... 14
9. Graphs showing short-period coefficients and mid-period coefficients at PGA=0.4 g as a function of vS30 for each NGA-W2 GMPE, NGA-W2 Avg, NGA-W2 Avg +2 SD, and NEHRP Fa and Fv site coefficients......... 15
v
10. Graphs showing short-period and mid-period average amplification values as a function of PGA for site class E for each NGA-W2 GMPE, NGA-W2 Avg coefficients, 95 percent NGA-W2 limits (NGA-W2 Avg +2 SD), NEHRP site coefficients, SS14/1050 factors, and SS14/760 factors ........................................................... 20
11. Graphs showing short-period and mid-period average amplification values as a function of PGA for site class D for each NGA-W2 GMPE, NGA-W2 Avg coefficients, 95 percent NGA-W2 limits (NGA-W2 Avg +2 SD), NEHRP site coefficients, SS14/1050 coefficients, and SS14/760 coefficients ............................................. 21
12. Graphs showing short-period and mid-period average amplification values as a function of PGA for site class C for each NGA-W2 GMPE, NGA-W2 Avg coefficients, 95 percent NGA-W2 limits (NGA-W2 Avg +2 SD), NEHRP site coefficients, SS14/1050 coefficients, and SS14/760 coefficients ............................................. 22
13. Graphs showing short-period and mid-period average amplification values as a function of PGA for site class B for NGA-W2 Avg, SS14 /760, SS14/1050 SP, and MP coefficients ......................................................... 23
Tables 1. Percent difference average NGA-W2 coefficients exceed average NGA-W1 coefficients ........................... 11 2. Average NGA-W2 SP and MP Avg spectral amplifications and standard deviations for vS30=760 m/s and 900
m/s as inferred with respect to 1,050 m/s .................................................................................................... 16 3. Mean NGA-W2 SP and MP scale factors as inferred from table 2 ............................................................... 16 4. NGA-W2 SP and MP Avg site coefficients referenced to vS30=1,050 m/s .................................................... 16 5. NGA-W2 SP and MP Avg site coefficients referenced to vS30=900 m/s ....................................................... 17 6a. NGA-W2 SP Avg site coefficients referenced to vS30=760 m/s in parentheses and corresponding Fa site
coefficients adopted in table 11.4-1 ASCE/SEI 7-10 .................................................................................... 17 6b. NGA-W2 MP Avg site coefficients referenced to vS30=760 m/s in parentheses and corresponding Fv site
coefficients adopted in table 11.4-2, ASCE/SEI 7-10 ................................................................................... 17 7. Percent difference between NGA-W2 Avg/760 short- and mid-period coefficients and those proposed for
ASCE 7-16 (SS14/760) ................................................................................................................................ 19

1
NGA-West2 GMPE Average Site Coefficients for Use in Earthquake-Resistant Design
By Roger D. Borcherdt
Abstract Site coefficients corresponding to those in tables 11.4–1 and 11.4–2 of Minimum Design Loads
for Buildings and Other Structures published by the American Society of Civil Engineers (Standard ASCE/SEI 7-10) are derived from four of the Next Generation Attenuation West2 (NGA-W2) Ground-Motion Prediction Equations (GMPEs). The resulting coefficients are compared with those derived by other researchers and those derived from the NGA-West1 database. The derivation of the NGA-W2 average site coefficients provides a simple procedure to update site coefficients with each update in the Maximum Considered Earthquake Response MCER maps. The simple procedure yields average site coefficients consistent with those derived for site-specific design purposes. The NGA-W2 GMPEs provide simple scale factors to reduce conservatism in current simplified design procedures.1
Introduction The Next Generation Attenuation West2 (NGA-W2) project, coordinated by the Pacific
Earthquake Engineering Research Center, has resulted in major advancements in the estimation of earthquake ground motions for purposes of earthquake-resistant design (Bozorgnia and others, 2014). These advancements include development of an extensive international strong-motion database (Ancheta and others, 2014) and a corresponding set of Ground-Motion Prediction Equations (GMPEs) developed by teams of researchers (Gregor and others, 2014). The NGA-W2 GMPEs have been used to revise the Maximum Considered Earthquake Response (MCER) maps for a uniform ground condition (Petersen and others, 2014) for a future version of the US building codes to be published by the American Society of Civil Engineering (ASCE Standard ASCE/SEI 7-16).
This paper provides rigorous estimates of site coefficients implied directly by the updated NGA-W2 database and four of the NGA-W2 GMPEs used to derive the recent MCER maps (Petersen and others, 2014). The paper provides a simple procedure for deriving the site coefficients from the average spectral amplifications, implied as a function of period by each Ground-Motion Prediction Equation (GMPE). The procedure is intended to provide coefficients that can be easily derived by consultants for independent site-specific estimates of site response. Simple and robust scale factors, derived from the NGA-W2 GMPEs, allow a reduction in conservatism associated with current simplified design procedures.
The NGA-W2 Average (Avg) coefficients derived herein are compared with those derived from the NGA-West1 (NGA-W1) database using similar procedures (Borcherdt, 2014a,b). They are also
1Keywords: site coefficients; building code; soil response; next generation attenuation, site class
2
compared to similar NGA-W2 Avg coefficients derived using MATLAB codes by Rezaeian (written commun., 2015; Rezaeian and others, 2014) and those derived at 0.2 s and 1.0 s by Kircher and others (written commun., 2014). The coefficients are compared with those recently proposed for ASCE 7-16.
The NGA-W2 Avg scale factors are derived and recommended for use in procedures to estimate simplified design spectra. The scale factors may be interpreted as factors to reduce conservatism associated with specifying base input motion levels at a vS30 value more typical of rock sites in site class B or alternatively they may be interpreted as scale factors for normalization of the site coefficients to a lower reference vS30 value. The procedure to develop the site coefficients and the scale factors is intended as a simple procedure that can be used with each update in the MCER maps and corresponding update of the site coefficients.
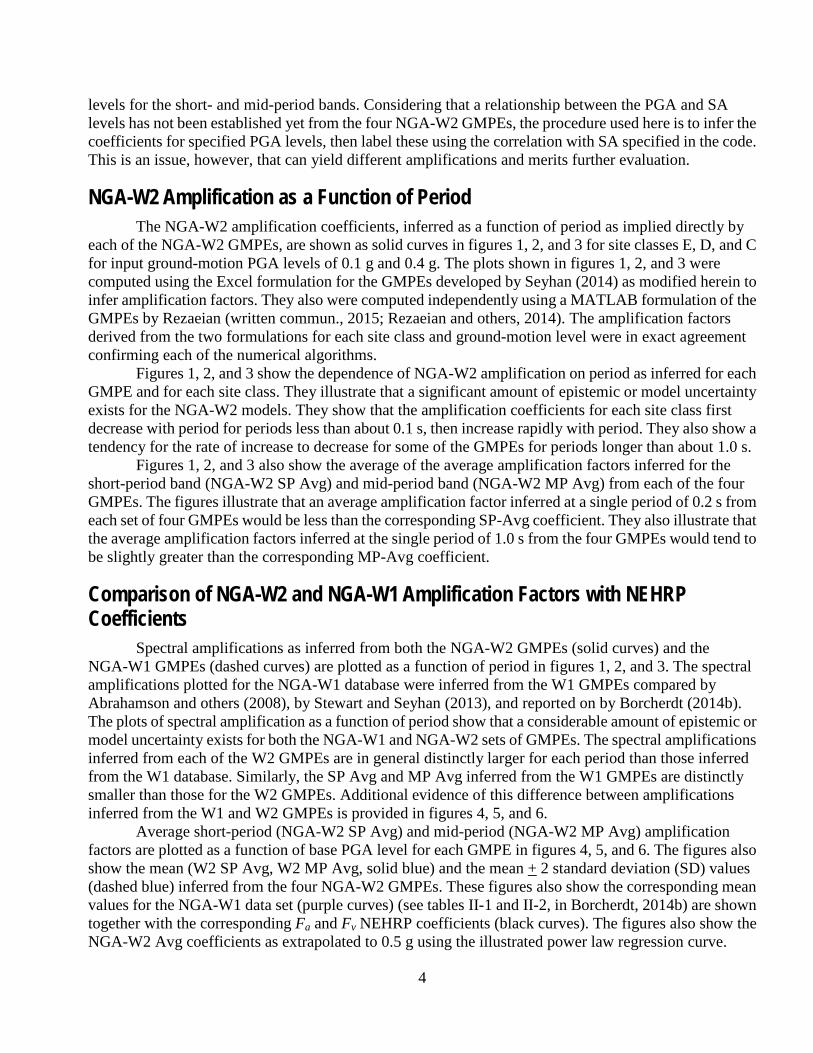
NGA-West2 Site Coefficients The Next Generation Attenuation (NGA) Ground-Motion Prediction Equations (GMPEs), based
on the NGA-W2 database, were used to update the MCER maps for ASCE/SEI 7-16. Four of these equations, ASK14 (Abrahamson, Silva, and Kamai, 2014), BSSA14, (Boore and others, 2014), CB14 (Campbell and Bozorgnia, 2014), and CY14 (Chiou and Youngs, 2014) are used here to derive NGA-W2 site coefficients. The I14 GMPE (Idriss, 2014) was not used to infer the site coefficients, because the I14 vS30 model does not account for site classes with soft-soil conditions.
Spectral amplifications are derived as a function of period for site classes B, C, D, and E for peak ground acceleration (PGA) levels of 0.1 g, 0.2 g, 0.3 g, and 0.4 g for each GMPE for M6, 7, and 8 events. The amplifications for each period were calculated using default parameters for sediment depth (Z1 and Z2.5) and other model parameters for the California region as provided by Seyhan (2014). For consistency with the concept of simplified site classes as specified in terms of vS30, each site class is represented by the vS30 value at the corresponding midpoint value of the vS30 interval that defines the site class. The spectral amplifications were inferred with respect to the reference site class B for corresponding PGA levels of 0.1 g, 0.2 g, 0.3 g, and 0.4 g also determined at the midpoint of site class B. Short-period (SP) and mid-period (MP) coefficients were derived from the spectral amplifications for each GMPE by computing the average spectral amplification at equally-spaced period values in the short-period band (0.1–0.5 s) and the mid-period band (0.5–2.0 s). These average amplification coefficients were inferred directly from each GMPE for site class B (vS30=1,050 m/s) PGA levels of 0.1 g, 0.2 g, 0.3 g, and 0.4 g for site classes E, D, C, and B as represented by the midpoint vS30 values of 150 m/s, 290 m/s, 540 m/s, and 1,050 m/s, respectively (Borcherdt, 1992; 1994). The coefficients at 0.5 g were extrapolated using a power law fit to the NGA-W2 SP and MP coefficients at 01 g, 0.2 g, 0.3 g, and 0.4 g. Scaling factors are derived to scale the inferred NGA-W2 coefficients to other reference vS30 values, including 760 m/s.
An important issue concerns the correct procedure to infer the spectral amplifications for the site classes. A detailed justification of the procedure used here is provided in Borcherdt (2014a,b). The procedure is similar to that used to derive the initial NEHRP (National Earthquake Hazard Reduction Program) site coefficients (Borcherdt, 1992; 1994; Dobry and others, 2000) as adopted in the 1994 and in several subsequent code provisions. In brief, the short-period coefficients (Fa) and the mid-period coefficients (Fv) were intended to be average spectral factors that could be multiplied by corresponding short- and mid-period band spectral estimates on rock to obtain a two-band simplified design spectrum for sites on other classes of site conditions. Site classes (A–E) were defined unambiguously, in terms of vS30 intervals implied by detailed correlations between geotechnical physical properties, measured shear velocities, and empirical spectral amplifications observed at more than 200 sites in the San Francisco and Los Angeles regions (Borcherdt, 1970; Borcherdt and Gibbs, 1976; Fumal, 1978; Borcherdt, 1994; Rogers and others, 1984; Borcherdt, 2012). To account for nonlinearity in the response of the site classes,

3
the corresponding site class amplification factors were inferred from numerical models for PGA levels of 0.2–0.4 g with respect to a reference rock site condition (site class B) assumed to have a linear response at all PGA levels (Seed, 1992; Dobry and others, 1992). Empirical correlations between average spectral amplifications and vS30 imply that the average amplification for each site class is best represented by the amplification at a vS30 value near or at the midpoint of the vS30 interval for each site class, including the reference rock site class B with unity amplification at vS30~1,050 m/s (Borcherdt, 1992; 1994).
Changes in code terminology and in GMPE databases have led to suggestions and opportunities to modify some aspects of the procedures. Some of these suggestions include: (1) compute spectral amplifications with respect to the boundary between site classes C and B (vS30=760 m/s) for ground-motion levels specified at the midpoint (vS30~1,050 m/s) of site class B; (2) infer site coefficients from a single NGA GMPE, for example, SS14; (3) compute spectral amplifications with respect to the boundary between site classes C and B (vS30=760 m/s) for ground-motion levels specified at the boundary (vS30~760 m/s); (4) use median vS30 values to represent the spectral amplifications for each site class instead of a value near the midpoint; (5) infer spectral amplification factors only at periods of 0.2 s and 1.0 s corresponding to the periods for the spectral estimates used for the MCER maps instead of using averages for the short- and mid-period bands; (6) infer the short-period spectral amplification factors at spectral accelerations for 0.2 s at levels of 𝑆𝑠=0.25, 0.50, 0.75, 1.0, 1.25, and 1.50; infer the mid-period spectral amplifications at spectral accelerations for the mid-period band of 𝑆1=0.1, 0.2, 0.3, 0.4, 0.5 g.
Implications of these suggestions are explored in more detail for the NGA-W2 dataset in subsequent sections and briefly summarized here.
Suggestions (1) and (2) lead to significant reductions in the site coefficients and the need to adjust the site coefficients to larger values based on lack of data arguments (Stewart and Seyhan, 2013). The resulting adjusted coefficients are no longer referenced to vS30=760 m/s and are not consistent with the coefficients and associated epistemic uncertainty implied by averages of four of the NGA-W2 GMPEs.
Suggestion (3) leads to coefficients which are significantly less than those inferred with respect to vS30~1,050 m/s, but when scaled with W2, implied scale factors are comparable to those derived with respect to vS30~1,050 m/s.
Suggestion (4) to use the median vS30 value to represent the site classes is shown to yield results that differ from those implied by the midpoint value by only a few percent for site class E, D, and C, but use of the median value for site class B will be shown to imply a change of 10 to 13 percent in the site class B coefficient, which, if used as the reference ground condition, implies a similar change in each of the other site-class coefficients. Considering that the site class vS30 intervals are defined by independent evidence and that median values can be biased by procedures used to infer vS30, representation of the site classes by the midpoint vS30 value is preferred and used here.
Suggestions (5) and (6) evolved from changes in terminology used in the codes to specify the reference ground-motion levels in terms of spectral accelerations instead of PGA. This change was implemented by changing the terminology for the reference ground motion from levels of PGA=0.1,…, 0.5 g to corresponding levels of spectral acceleration (SA), SA=𝑆𝑠=0.25,…, 1.25 for the short-period factor, Fa, and to levels of SA=𝑆1=0.1, …, 0.5 for the mid-period factor, Fv, without changes in the values for the Fa and Fv factors. These changes in terminology were implemented to make the code terminology for specification of ground-motion levels for site classes consistent with that for the MCER maps. It will be shown in the next section that the amplification factors, inferred at 0.2 s, are a few percent less than those inferred as the average over the short-period band. Similarly, those inferred at 1.0 s tend to be slightly greater that those inferred as the average over the mid-period band. Preliminary evaluations based on the NGA-W2 GMPEs indicate that the coefficients inferred with respect to a single specified PGA level for both coefficients may differ significantly from those inferred for the corresponding specified SA
4
levels for the short- and mid-period bands. Considering that a relationship between the PGA and SA levels has not been established yet from the four NGA-W2 GMPEs, the procedure used here is to infer the coefficients for specified PGA levels, then label these using the correlation with SA specified in the code. This is an issue, however, that can yield different amplifications and merits further evaluation.
NGA-W2 Amplification as a Function of Period The NGA-W2 amplification coefficients, inferred as a function of period as implied directly by
each of the NGA-W2 GMPEs, are shown as solid curves in figures 1, 2, and 3 for site classes E, D, and C for input ground-motion PGA levels of 0.1 g and 0.4 g. The plots shown in figures 1, 2, and 3 were computed using the Excel formulation for the GMPEs developed by Seyhan (2014) as modified herein to infer amplification factors. They also were computed independently using a MATLAB formulation of the GMPEs by Rezaeian (written commun., 2015; Rezaeian and others, 2014). The amplification factors derived from the two formulations for each site class and ground-motion level were in exact agreement confirming each of the numerical algorithms.
Figures 1, 2, and 3 show the dependence of NGA-W2 amplification on period as inferred for each GMPE and for each site class. They illustrate that a significant amount of epistemic or model uncertainty exists for the NGA-W2 models. They show that the amplification coefficients for each site class first decrease with period for periods less than about 0.1 s, then increase rapidly with period. They also show a tendency for the rate of increase to decrease for some of the GMPEs for periods longer than about 1.0 s.
Figures 1, 2, and 3 also show the average of the average amplification factors inferred for the short-period band (NGA-W2 SP Avg) and mid-period band (NGA-W2 MP Avg) from each of the four GMPEs. The figures illustrate that an average amplification factor inferred at a single period of 0.2 s from each set of four GMPEs would be less than the corresponding SP-Avg coefficient. They also illustrate that the average amplification factors inferred at the single period of 1.0 s from the four GMPEs would tend to be slightly greater than the corresponding MP-Avg coefficient.
Comparison of NGA-W2 and NGA-W1 Amplification Factors with NEHRP Coefficients
Spectral amplifications as inferred from both the NGA-W2 GMPEs (solid curves) and the NGA-W1 GMPEs (dashed curves) are plotted as a function of period in figures 1, 2, and 3. The spectral amplifications plotted for the NGA-W1 database were inferred from the W1 GMPEs compared by Abrahamson and others (2008), by Stewart and Seyhan (2013), and reported on by Borcherdt (2014b). The plots of spectral amplification as a function of period show that a considerable amount of epistemic or model uncertainty exists for both the NGA-W1 and NGA-W2 sets of GMPEs. The spectral amplifications inferred from each of the W2 GMPEs are in general distinctly larger for each period than those inferred from the W1 database. Similarly, the SP Avg and MP Avg inferred from the W1 GMPEs are distinctly smaller than those for the W2 GMPEs. Additional evidence of this difference between amplifications inferred from the W1 and W2 GMPEs is provided in figures 4, 5, and 6.
Average short-period (NGA-W2 SP Avg) and mid-period (NGA-W2 MP Avg) amplification factors are plotted as a function of base PGA level for each GMPE in figures 4, 5, and 6. The figures also show the mean (W2 SP Avg, W2 MP Avg, solid blue) and the mean + 2 standard deviation (SD) values (dashed blue) inferred from the four NGA-W2 GMPEs. These figures also show the corresponding mean values for the NGA-W1 data set (purple curves) (see tables II-1 and II-2, in Borcherdt, 2014b) are shown together with the corresponding Fa and Fv NEHRP coefficients (black curves). The figures also show the NGA-W2 Avg coefficients as extrapolated to 0.5 g using the illustrated power law regression curve.

5
Figure 1. Graphs showing NGA-W2 (solid curves) and NGA-W1 (dashed curves) spectral amplifications with respect to (wrt) site class B for site class E at PGA levels of 0.1 g (A) and 0.4 g (B) together with corresponding average short-period (SP Avg, 0.1–0.5 s) and mid-period (MP Avg, 0.5–2.0 s) spectral amplifications inferred from mean of corresponding averages for each of the four NGA-W2 and NGA-W1 GMPEs. Curves indicate epistemic uncertainty associated with each set of GMPEs and show that spectral amplifications for NGA-W2 database are significantly larger than those derived from NGA-W1 database.
0
1
2
3
4
5
6
7
8
9
0.00 0.50 1.00 1.50 2.00 2.50
NG
A Am
plifi
catio
n w
rt Si
te C
lass
B
Period (s)
ASK14BSSA14CB14CY14W2 SP AvgW2 MP AvgAS08BA08CB08CY08W1 SP AvgW1 MP Avg
NGA-W2 & W1 Amplification versus Period (Site Class E, 0.1 g)
0
1
2
3
4
5
6
7
8
9
0.00 0.50 1.00 1.50 2.00 2.50
NG
A Am
plifi
catio
n w
rt Si
te C
lass
B
Period (s)
ASK14BSSA14CB14CY14W2 SP AvgW2 MP AvgAS08BA08CB08CY08W1 SP AvgW1 MP Avg
NGA-W2 & W1 Amplification versus Period (Site Class E, 0.4 g)
A
B
6
Figure 2. Graphs showing NGA-W2 (solid curves) and NGA-W1 (dashed curves) spectral amplifications with respect to (wrt) site class B for site class D at PGA levels of 0.1 g (A) and 0.4 g (B) together with corresponding average short-period (SP Avg, 0.1–0.5 s) and mid-period (MP Avg, 0.5–2.0 s) spectral amplifications inferred from mean of corresponding averages for each of four NGA-W2 and NGA-W1 GMPEs. Curves indicate epistemic uncertainty associated with each set of GMPEs and show that spectral amplifications for NGA-W2 database are significantly larger than those derived from NGA-W1 database.
0
1
2
3
4
5
0.00 0.50 1.00 1.50 2.00 2.50
NG
A Am
plifi
catio
n w
rt Si
te C
lass
B
Period (s)
ASK14BSSA14CB14CY14W2 SP AvgW2 MP AvgAS08BA08CB08CY08W1 SP Avg
NGA Amplification versus Period (Site Class D, 0.1g)
NGA W2 & W1Amplification versus Period (Site Class D, 0.1 g)
0
1
2
3
4
5
0.00 0.50 1.00 1.50 2.00 2.50
NG
A Am
plifi
catio
n w
rt Si
te C
lass
B
Period (s)
ASK14BSSA14CB14CY14W2 SP AvgW2 MP AvgAS08BA08CB08CY08W1 SP AvgW1 MP Avg
NGA-W2 & W1 Amplification versus Period (Site Class D, 0.4 g)
B
A

7
Figure 3. Graphs showing NGA-W2 (solid curves) and NGA-W1 (dashed curves) spectral amplifications with respect to (wrt) site class B for site class C at PGA levels of 0.1 g (A) and 0.4 g (B) together with corresponding average short-period (SP Avg, 0.1–0.5 s) and mid-period (MP Avg, 0.5–2.0 s) spectral amplifications inferred from mean of corresponding averages for each of four NGA-W2 and NGA-W1 GMPEs. Curves indicate epistemic uncertainty associated with each set of GMPEs and show that spectral amplifications for NGA-W2 database are significantly larger than those derived from NGA-W1 database.
0
1
2
3
0.00 0.50 1.00 1.50 2.00 2.50
Ampl
ifica
tion
wrt
Site
Cla
ss B
Period (s)
ASK14BSSA14CB14CY14W2 SP AvgW2 MP AvgAS08BA08CB08CY08W1 SP AvgW1 MP Avg
NGA-W2 & W1 Amplification versus Period (Site Class C, 0.1 g)
0
1
2
3
0.00 0.50 1.00 1.50 2.00 2.50
Ampl
ifica
tion
wrt
Site
Cla
ss B
Period (s)
ASK14BSSA14CB14CY14W2 SP AvgW2 MP AvgAS08BA08CB08CY08W1 SP AvgW1 MP Avg
NGA-W2 & W1 Amplification versus Period (Site Class C, 0.4 g)
B
A

8
Figure 4. Graphs showing short-period (A) and mid-period average amplification (B) values for site class E for each NGA-W2 GMPE, NGA-W2 Avg, and 95 percent NGA-W2 limits (W2 Avg +2 SD), NGA-W1 Avg, W2 SA @ 0.2 s, 1.0 s, and NEHRP site coefficients as a function of PGA.
y = 0.6598x-0.605
0
1
2
3
4
0.1 0.2 0.3 0.4 0.5 0.6
Shor
t-Per
iod
Ampl
ifica
tion
(Avg
0.1
–0.5
s)
PGA (g)
NEHRP FaASK14BSSA14CB14CY14W2 SP AvgW2 SP Avg-2*SDW2 SP Avg+2*SDNGA W1 SP AvgW2 SA @ 0.2 sW2 SP 0.5g
NGA-W2 Average Short-Period Amplification versus PGA (Site Class E)
y = 3.2042x-0.244
0
1
2
3
4
5
6
7
8
0.1 0.2 0.3 0.4 0.5 0.6
Mid
-Per
iod
Ampl
ifica
tion
(Avg
0.5
–2.0
s)
PGA (g)
NEHRP FvASK14BSSA14CB14CY14W2 MP AvgW2 MP Avg-2*SDW2 MP Avg+2*SDNGA W1 MP AvgW2 SA @ 1.0 sW2 MP 0.5g
NGA-W2 Average Mid-Period Amplification versus PGA (Site Class E)
B
A
9
Figure 5. Graphs showing short-period (A) and mid-period average amplification (B) values for site class D for each NGA-W2 GMPE, NGA-W2 Avg, and 95 percent NGA-W2 limits (W2 Avg +2 SD), NGA-W1 Avg, W2 SA @ 0.2 s, 1.0 s, and NEHRP site coefficients as a function of PGA.
y = 1.321x-0.225
0
1
2
3
0.1 0.2 0.3 0.4 0.5 0.6
Shor
t-Per
iod
Ampl
ifica
tion
(Avg
0.1
–0.5
s)
PGA (g)
NEHRP FaASK14BSSA14CB14CY14W2 SP AvgW2 SP Avg-2*SDW2 SP Avg+2*SDNGA W1 SP AvgW2 SA @ 0.2 sW2 SP Avg 0.5g
NGA-W2 Average Short-Period Amplification versus PGA (Site Class D)
y = 2.8165x-0.077
0
1
2
3
4
5
0.1 0.2 0.3 0.4 0.5 0.6
Mid
-Per
iod
Ampl
ifica
tion
(Avg
0.5
–2.0
s)
PGA (g)
NEHRP FvASK14BSSA14CB14CY14W2 MP AvgW2 MP Avg-2*SDW2 MP Avg+2*SDNGA W1 MP AvgW2 SA @ 1.0 sW2 MP Avg 0.5g
NGA-W2 Average Mid-Period Amplification versus PGA (Site Class D)
A
B
10
Figure 6. Graphs showing short-period (A) and mid-period average amplification (B) values for site class C for each NGA-W2 GMPE, NGA-W2 Avg, and 95 percent NGA-W2 limits (W2 Avg +2 SD), NGA-W1 Avg, W2 SA @0.2 s, 1.0 s, and NEHRP site coefficients as a function of PGA.
y = 1.4579x-0.041
0
1
2
3
0.1 0.2 0.3 0.4 0.5 0.6
Shor
t-Per
iod
Ampl
ifica
tion
(Avg
0.1
–0.5
s)
PGA (g)
NEHRP FaASK14BSSA14CB14CY14W2 SP AvgW2 SP Avg-2*SDNGA W1 SP AvgW2 SA @ 0.2 sW2 SP Avg 0.5g
NGA-W2 Average Short-Period Amplification versus PGA (Site Class C)
y = 1.8977x-0.007
0
1
2
3
0.1 0.2 0.3 0.4 0.5 0.6
Mid
-Per
iod
Ampl
ifica
tion
(Avg
0.5
–2.0
s)
PGA (g)
NEHRP FvASK14BSSA14CB14CY14W2 MP AvgW2 MP Avg-2*SDW2 MP Avg+2*SDNGA W1 MP AvgW2 SA @ 1.0 sW2d MP Avg 0.5g
NGA-W2 Average Mid-Period Amplification versus PGA (Site Class C)
A
B

11
Superimposed on figures 4, 5, and 6, are amplification factors (olive green curves) inferred by Kircher and others (written commun., 2014,) at periods of 0.2 s (W2 [email protected] s/1,050) and 1.0 s (W2 [email protected] s) from the geometric mean of the response spectra for the various site classes referenced to vS30=762 m/s for magnitude and distance parameters yielding (𝑆𝑠, 𝑆1) pairs of (0.25, 0.1), ... (1.25, 0.5) at a site condition of vS30=762 m/s. For comparison with the coefficients derived here, the Kircher and others coefficients are scaled to yield unity amplification at the midpoint (1,050 m/s) of site class B (solid olive curves). The dependence of the W2 [email protected] s/1,050 factors (Kircher and others, written commun., 2014) on amplitude of ground motion is in good agreement with the W2 SP Avg factors (solid blue curves). The factors at 1.0 s (W2 [email protected] s) are consistently about 5 to 10 percent larger than the corresponding W2 MP Avg coefficient. The consistency in the two sets of factors helps confirm the calculations used in each procedure.
Figures 4, 5, and 6 show that, for each site class, the NGA-W1 factors (solid purple curves) are significantly less than the NGA-W2 amplification factors inferred herein and those inferred for the NGA-W2 data set by Kircher and others. The amplification factors, as plotted in figures 1, 2, and 3 by Rezaeian (written commun., 2015; Rezaeian and others, 2014) using MATLAB formulations for both the NGA-W1 and NGA-W2 GMPEs used to prepare the 2008 and 2014 MCER maps (not shown), also indicate that the W2 factors are significantly larger than the W1 factors. This difference also is apparent in plots of median Pseudo Spectral Acceleration (PSA) estimates as a function of period provided by the NGA developers based on their 2008 and 2014 GMPEs (see, for example, fig. 10, Campbell and Bozorgnia, 2014; figs. 6 and 7, Abrahamson and others, 2014).
The percent difference between the coefficients inferred from the NGA-W2 database and those from the NGA-W1 database using the same procedures (Borcherdt, 2014b) are summarized in table 1. The percent differences vary from 14 to 28 percent for the short-period band and from 19 to 42 percent for the mid-period band. These large increases in the amplification factors have significant implications and merit further evaluation depending on intended application of the NGA-W2 coefficients.
Table 1. Percent difference average NGA-W2 coefficients exceed average NGA-W1 coefficients.
vS30 (m/s) / PGA (g) 0.1 0.2 0.3 0.4 SP Coefficient Percent Differences
1,050 0 0 0 0 540 14 15 14 15 290 24 24 23 23 150 28 27 26 25
MP Coefficient Percent Differences 1,050 0 0 0 0
540 19 19 19 19 290 30 30 29 29 150 39 41 42 42
The significant difference between the amplification factors implied by the NGA-W2 GMPEs and
those implied by the NGA-W1 GMPEs is expected to primarily result from changes in the NGA-W2 GMPE models associated with linear and nonlinear shallow site response (vS30) and changes to account for sediment depth. Any increases in the W2 amplification coefficients associated with the larger amount of data in the NGA-W2 database could possibly be expected for site class E, but not for other site classes

12
well populated with W1 data. Additional evaluation is needed to better understand the significant increases in site coefficients implied by the recent soil response models used in the NGA-W2 GMPEs and their implications for future changes in building codes.
Figures 7, 8, and 9 provide corresponding plots of the NGA-W2 coefficients as a function of average shear velocity (�̅�𝑠 or vS30) for PGA levels of 0.1 g, 0.3 g, and 0.4 g at the midpoint of site class B. With the exception of the short-period coefficient (W2 SP Avg) for site class E, the figures illustrate that W2 coefficients for site classes are significantly greater than the corresponding NEHRP coefficients.
NGA-W2 Scaling Factors to Reduce Conservatism in Design Spectra and to Scale Site Amplification Coefficients to Other Reference Site Conditions
Following adoption of the NEHRP site coefficients in the 1994 edition of the code provisions (BSSC, 1994), revised sets of seismic hazard and MCER type design maps were adopted in the 1997 and subsequent editions of the code provisions. The �̅�𝑠(vS30) value chosen to specify the site condition for the subsequent MCER maps was �̅�𝑠=760 m/s. This value was chosen in 1997 (Frankel and others, 1997) because it was considered then as a conservative but typical value to represent firm rock sites (Frankel, written commun., 2012). Subsequent compilation of the NGA-W2 database shows that the median value for rock sites in site class B is near 913 m/s (Stewart and Seyhan, 2013). Hence, a vS30 value near 900 m/s is more representative of a typical firm rock condition than is 760 m/s.
Considering that the concept of simplified site classes as defined in terms of vS30 implies that the site classes be represented by the midpoint of each site class and referenced to the midpoint of the reference site class B with unity amplification (Borcherdt, 1992; 1994), choice of vS30=760 m/s for the MCER maps implies that estimates of simplified design spectra as defined in ASCE/SEI 7-10 are conservative. This conservatism can be reduced by specifying the vS30 value for the maps at a vS30 value more typical of firm to hard rock sites that comprise site class B, for example vS30=900 m/s. A simple procedure in lieu of changing the maps is to apply a simple scaling factor to estimates of simplified design spectra. The NGA-W2 GMPEs permit the rigorous derivation of such scale factors to allow the MCER motions to represent other ground conditions, such as those corresponding to vS30=900 m/s or vS30=760 m/s.
Considering that the simplified design spectra as defined in ASCE/SEI 7-10 are the product of the MCER motions and the site coefficients in tables 11.4.1 and 11.42 of ASCE/SEI 7-10, a scale factor chosen to scale the MCER input motions may also be regarded as a factor to scale the site coefficients to a different reference ground condition. Corresponding scale factors and site-class amplification coefficients for reference ground conditions of 1,050 m/s, 900 m/s, and 760 m/s are provided in tables 2–6.
Table 2 provides estimates of the average NGA-W2 short-period (SP) and mid-period (MP) spectral amplifications inferred at 760 m/s and 900 m/s with respect to the reference site condition of vS30=1,050 m/s for PGA=0.1–0.4g. Table 2 shows the W2 SP Avg and W2 MP Avg values are nearly constant as a function of reference PGA level with the estimates for 900 m/s showing the least variation. The corresponding standard deviations (SD) inferred from the four NGA-W2 Avg estimates indicate the epistemic or model uncertainty in the 900 m/s estimates is small and about 50 to 60 percent less than that for 760 m/s. The table shows that the scale factors show little or no dependence on PGA level. Hence for purposes of maintaining a simplified procedure, the mean of the scale factors derived at each PGA level, as shown in the right hand column of table 3, provides a robust estimate of the desired scale factors. A summary of the mean scaling factors for the short- and mid-period bands, as derived from the reciprocal of the corresponding values in table 2, are provided in table 3.

13
Figure 7. Graphs showing short-period coefficients (A) and mid-period coefficients (B) at PGA=0.1 g as a function of vS30 for each NGA-W2 GMPE, NGA-W2 Avg, NGA-W2 Avg +2 SD, and NEHRP Fa and Fv site coefficients.
0
1
2
3
4
5
6
0 200 400 600 800 1000 1200
Shor
t-Per
iod
Ampl
ifica
tion
vS30 (m/s)
Short-Period Avg. Amplification versus Vs30 (PGA=0.1 g)
ASK14BSSA14CB14CY14W2 SP AvgW2 SP Avg-2*SDW2 SP Avg+2*SDNEHRP
0
1
2
3
4
5
6
0 200 400 600 800 1000 1200
Mid
-Per
iod
Ampl
ifica
tion
vS30 (m/s)
Mid-Period Avg. Amplification versus Vs30 (PGA=0.1 g)
ASK14BSSA14CB14CY14W2 SP AvgW2 SP Avg-2*SDW2 SP Avg+2*SDNEHRP
A
B
14
Figure 8. Graphs showing short-period coefficients (A) and mid-period coefficients (B) at PGA=0.2 g as a function of vS30 for each NGA-W2 GMPE, NGA-W2 Avg, NGA-W2 Avg +2 SD, and NEHRP Fa and Fv site coefficients.
0
1
2
3
4
5
6
0 200 400 600 800 1000 1200
Shor
t-Per
iod
Ampl
ifica
tion
vS30 (m/s)
Short-Period Avg Amplification versus vS30 (PGA=0.2 g)
ASK14BSSA14CB14CY14W2 SP AvgW2 SP Avg-2*SDW2 SP Avg+2*SDNEHRP
0
1
2
3
4
5
6
0 200 400 600 800 1000 1200
Mid
-Per
iod
Ampl
ifica
tion
vS30 (m/s)
Mid-Period Avg Amplification versus vS30 (PGA=0.2 g)
ASK14BSSA14CB14CY14W2 SP AvgW2 SP Avg-2*SDW2 SP Avg+2*SDNEHRP
A
B

15
Figure 9. Graphs showing short-period coefficients (A) and mid-period coefficients (B) at PGA=0.4 g as a function of vS30 for each NGA-W2 GMPE, NGA-W2 Avg, NGA-W2 Avg +2 SD, and NEHRP Fa and Fv site coefficients.
0
1
2
3
4
5
6
0 200 400 600 800 1000 1200
Shor
t-Per
iod
Ampl
ifica
tion
vS30 (m/s)
Short-Period Avg Amplification versus vS30 (PGA=0.4 g)
ASK14BSSA14CB14CY14W2 SP AvgW2 SP Avg-2*SDW2 SP Avg+2*SDNEHRP
0
1
2
3
4
5
6
0 200 400 600 800 1000 1200
Mid
-Per
iod
Ampl
ifica
tion
vS30 (m/s)
Mid-Period Avg Amplification versus vS30 (PGA=0.4 g)
ASK14BSSA14CB14CY14W2 SP AvgW2 SP Avg-2*SDW2 SP Avg+2*SDNEHRP
A
B

16
Table 2. Average NGA-W2 SP and MP Avg spectral amplifications and standard deviations for vS30=760 m/s and 900 m/s as inferred with respect to 1,050 m/s.
PGA 0.1 g 0.2 g 0.3 g 0.4 g Mean W2 Avg
vS30 (m/s) W2 SP Avg SD W2 SP
Avg SD W2 SP Avg SD W2 SP
Avg SD SP Avg 760 1.27 0.05 1.26 0.05 1.25 0.05 1.25 0.06 1.26 900 1.12 0.02 1.11 0.02 1.12 0.02 1.12 0.02 1.12
vS30 (m/s) W2 MP Avg SD W2 MP
Avg SD W2 MP Avg SD W2 MP
Avg SD MP Avg 760 1.37 0.04 1.37 0.04 1.37 0.04 1.37 0.04 1.37 900 1.15 0.03 1.15 0.03 1.15 0.03 1.12 0.03 1.15
Table 3. Mean NGA-W2 SP and MP scale factors as inferred from table 2. Ratio Mean W2 Avg W2 SP Avg W2 MP Avg
W2 Avg 900/W2 Avg 1,050 0.90 0.87 W2 Avg 760/W2 Avg 1,050 0.80 0.73
W2 Avg 760/W2 Avg 900 0.89 0.84
Table 4. NGA-W2 SP and MP Avg site coefficients referenced to vS30=1,050 m/s. Site Class/PGA 0.1 g 0.2 g 0.3 g 0.4 g 0.5 g
SP Avg site coefficients A 0.80 0.80 0.80 0.80 0.80 B 1.00 1.00 1.00 1.00 1.00 C 1.60 1.56 1.53 1.51 1.50 D 2.20 1.92 1.74 1.60 1.54 E 2.61 1.80 1.38 1.12 1.00
MP Avg site coefficients A 0.80 0.80 0.80 0.80 0.80
B 1.00 1.00 1.00 1.00 1.00
C 1.93 1.92 1.91 1.91 1.91
D 3.35 3.20 3.10 3.01 2.97
E 5.57 4.82 4.32 3.96 3.79

17
Table 5. NGA-W2 SP and MP Avg site coefficients referenced to vS30=900 m/s. Site Class/PGA 0.1 g 0.2 g 0.3 g 0.4 g 0.5 g
SP Avg Site coefficients A 0.71 0.72 0.72 0.72 0.72 B 0.89 0.90 0.90 0.90 0.90 C 1.43 1.41 1.37 1.35 1.34 D 1.96 1.74 1.56 1.44 1.38 E 2.33 1.62 1.24 1.00 0.90
MP Avg site coefficients A 0.69 0.69 0.69 0.69 0.69 B 0.87 0.87 0.87 0.87 0.87 C 1.67 1.66 1.66 1.66 1.65 D 2.90 2.78 2.68 2.61 2.58 E 4.83 4.18 3.75 3.43 3.29
Table 6a. NGA-W2 SP Avg site coefficients referenced to vS30=760 m/s in parentheses and corresponding Fa site coefficients adopted in table 11.4-1 ASCE/SEI 7-10.
Site Class 𝑺𝒔<0.25 𝑺𝒔=0.50 𝑺𝒔=0.75 𝑺𝒔=1.00 𝑺𝒔>1.25
A (0.63) 0.8 (0.64) 0.8 (0.64) 0.8 (0.64) 0.8 (0.64) 0.8
B (0.79) 1 (0.79) 1 (0.80) 1 (0.80) 1 (0.80) 1 C (1.26) 1.2 (1.24) 1.2 (1.22) 1.1 (1.21) 1.0 (1.20) 1.0 D (1.74) 1.6 (1.53) 1.4 (1.39) 1.2 (1.28) 1.1 (1.23) 1.0 E (2.06) 2.5 (1.43) 1.7 (1.10) 1.2 (0.89) 0.9 (0.80) 0.9 F see section 11.4.7
Use straight-line interpolation for intermediate values of 𝑆𝑠. Use straight-line interpolation for intermediate values of vS30 using site class mid-point value for vS30 from chapter 20.
Table 6b. NGA-W2 MP Avg site coefficients referenced to vS30=760 m/s in parentheses and corresponding Fv site coefficients adopted in table 11.4-2, ASCE/SEI 7-10.
Site Class 𝑺𝟏<0.1 𝑺𝟏=0.20 𝑺𝟏=0.30 𝑺𝟏=0.40 𝑺𝟏>0.50 A (0.58) 0.8 (0.58) 0.8 (0.59) 0.8 (0.59) 0.8 (0.59) 0.8 B (0.73) 1 (0.73) 1 (0.73) 1 (0.73) 1 (0.73) 1 C (1.41) 1.7 (1.40) 1.6 (1.40) 1.5 (1.40) 1.4 (1.40) 1.3 D (2.45) 2.4 (2.34) 2.0 (2.26) 1.8 (2.20) 1.6 (2.17) 1.5 E (4.07) 3.5 (3.53) 3.2 (3.16) 2.8 (2.90) 2.4 (2.78) 2.4 F see section 11.4.7
Use straight-line interpolation for intermediate values of 𝑆1. Use straight-line interpolation for intermediate values of vS30 using site class mid-point value for vS30 from chapter 20.

18
Table 3 shows that average scaling factors applied to reduce the MCER short- and mid-period motions to that at the midpoint of site class B (1,050 m/s) or equivalently average scale factors applied to reduce the NGA-W2 Avg site coefficients to that at 760 m/s would imply that the resultant design spectra would be reduced by 20 percent in the short-period band and 27 percent in the mid-period band. Table 3 shows the corresponding average scale factors to reduce the MCER short- and mid-period motions to a more typical rock condition of 900 m/s would imply reductions of 11 and 16 percent, respectively.
Tables 4, 5, and 6 provide NGA-W2 Avg site coefficients for reference ground conditions specified by vS30=1,050 m/s, 900 m/s, and 760 m/s as inferred using the scale factors specified in table 2 for various PGA levels. The tables show that referencing the SP W2 site coefficients to 900 m/s and 760 m/s reduces the corresponding SP coefficients referenced to 1,050 m/s by average percentages of 10 and 20 percent, respectively. Corresponding average reductions in the MP coefficients are 13 and 27 percent, respectively.
Applying scale factors to reference either the MCER motions to 900 m/s or the W2 Avg site coefficients in table 4 to 900 m/s reduces some of the conservatism in the design spectral estimates, but not all. Applying scale factors to reference the MCER motions and the W2 Avg site coefficients to the same reference ground condition eliminates all conservatism in design spectral estimates. Using the scale factors to reference both the MCER motions and the W2 Avg coefficients to either 760 m/s or 900 m/s will yield the same design spectral estimate.
Implications of NGA-W2 for ASCE 7-10 (NEHRP) Site Coefficients With the exception of the NEHRP Fa site coefficients at 0.1 g and 0.2 g for site class E (vS30=150
m/s), figures 4–9 and table 4 show that the NGA-W2 Avg amplification coefficients referenced to vS30=1,050 m/s are significantly greater than the NEHRP coefficients and the corresponding coefficients inferred from the NGA-W1 database. Similar conclusions derived by Kircher (2015) based on results derived independently suggest further evaluation of the W2 results derived using default sediment depth parameters for each of the NGA-W2 GMPEs may be needed. If further evaluation establishes that the NGA-W2 results derived using the default parameters are justified, tables 4–6 provide alternatives for consideration in future versions of the codes depending on the consensus of the engineering community. Table 6 provides W2 SP Avg and W2 MP Avg coefficients in parentheses as scaled to a reference site condition of 760 m/s in the format of tables 11.4.-1 and 11.4-2 of ASCE 7-10 together with the corresponding NEHRP coefficients as adopted in ASCE 7-10.
The procedures used here to derive the NGA-W2 Avg site coefficients as normalized to 760 m/s, 900 m/s, and 1,050 m/s are intended to be consistent with the concepts of unambiguous site classes and a simplified design spectrum as adopted in ASCE/SEI 7-10 (2010). The procedures capture the full epistemic or model uncertainty associated with the NGA-W2 GMPEs.
Tables 4–6 imply that if site coefficients are desired as a continuous function of site conditions as specified by (�̅�𝑠) as opposed to discrete values as specified for the five site classes, then the site coefficients should be inferred by straight-line interpolation using the site coefficients as specified at the midpoint of each site class interval. Linear interpolation provides a simple, but reasonably good approximation for the coefficients at intermediate values of �̅�𝑠. It also has the advantage that no additional inconsistencies are introduced between adopted site coefficients and those implied directly by simple averages of the values predicted by the four NGA-W2 GMPEs. This simple procedure ensures that site coefficients predicted continuously will agree exactly with those tabulated at the midpoint �̅�𝑠 value for each site class. It ensures that the proposed NGA-W2 site coefficients are consistent with the MCER maps.
19
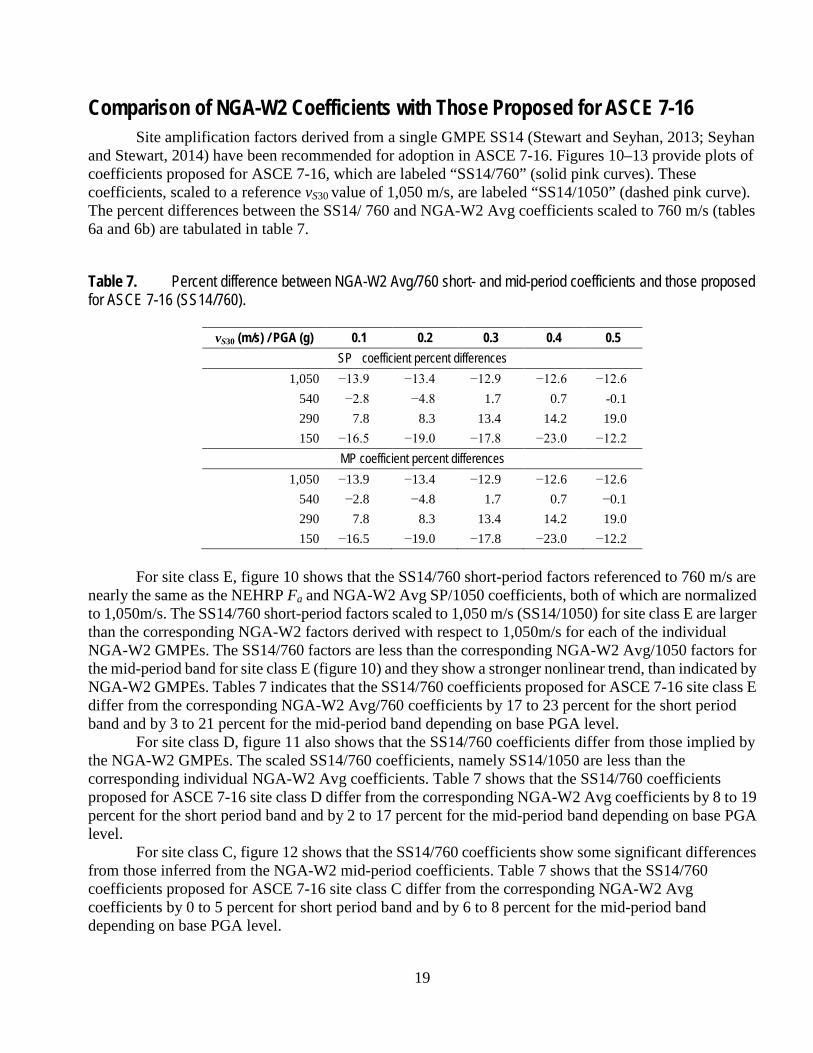
Comparison of NGA-W2 Coefficients with Those Proposed for ASCE 7-16 Site amplification factors derived from a single GMPE SS14 (Stewart and Seyhan, 2013; Seyhan
and Stewart, 2014) have been recommended for adoption in ASCE 7-16. Figures 10–13 provide plots of coefficients proposed for ASCE 7-16, which are labeled “SS14/760” (solid pink curves). These coefficients, scaled to a reference vS30 value of 1,050 m/s, are labeled “SS14/1050” (dashed pink curve). The percent differences between the SS14/ 760 and NGA-W2 Avg coefficients scaled to 760 m/s (tables 6a and 6b) are tabulated in table 7.
Table 7. Percent difference between NGA-W2 Avg/760 short- and mid-period coefficients and those proposed for ASCE 7-16 (SS14/760).
vS30 (m/s) / PGA (g) 0.1 0.2 0.3 0.4 0.5 SP coefficient percent differences
1,050 −13.9 −13.4 −12.9 −12.6 −12.6 540 −2.8 −4.8 1.7 0.7 -0.1 290 7.8 8.3 13.4 14.2 19.0 150 −16.5 −19.0 −17.8 −23.0 −12.2
MP coefficient percent differences 1,050 −13.9 −13.4 −12.9 −12.6 −12.6
540 −2.8 −4.8 1.7 0.7 −0.1 290 7.8 8.3 13.4 14.2 19.0 150 −16.5 −19.0 −17.8 −23.0 −12.2
For site class E, figure 10 shows that the SS14/760 short-period factors referenced to 760 m/s are
nearly the same as the NEHRP Fa and NGA-W2 Avg SP/1050 coefficients, both of which are normalized to 1,050m/s. The SS14/760 short-period factors scaled to 1,050 m/s (SS14/1050) for site class E are larger than the corresponding NGA-W2 factors derived with respect to 1,050m/s for each of the individual NGA-W2 GMPEs. The SS14/760 factors are less than the corresponding NGA-W2 Avg/1050 factors for the mid-period band for site class E (figure 10) and they show a stronger nonlinear trend, than indicated by NGA-W2 GMPEs. Tables 7 indicates that the SS14/760 coefficients proposed for ASCE 7-16 site class E differ from the corresponding NGA-W2 Avg/760 coefficients by 17 to 23 percent for the short period band and by 3 to 21 percent for the mid-period band depending on base PGA level.
For site class D, figure 11 also shows that the SS14/760 coefficients differ from those implied by the NGA-W2 GMPEs. The scaled SS14/760 coefficients, namely SS14/1050 are less than the corresponding individual NGA-W2 Avg coefficients. Table 7 shows that the SS14/760 coefficients proposed for ASCE 7-16 site class D differ from the corresponding NGA-W2 Avg coefficients by 8 to 19 percent for the short period band and by 2 to 17 percent for the mid-period band depending on base PGA level.
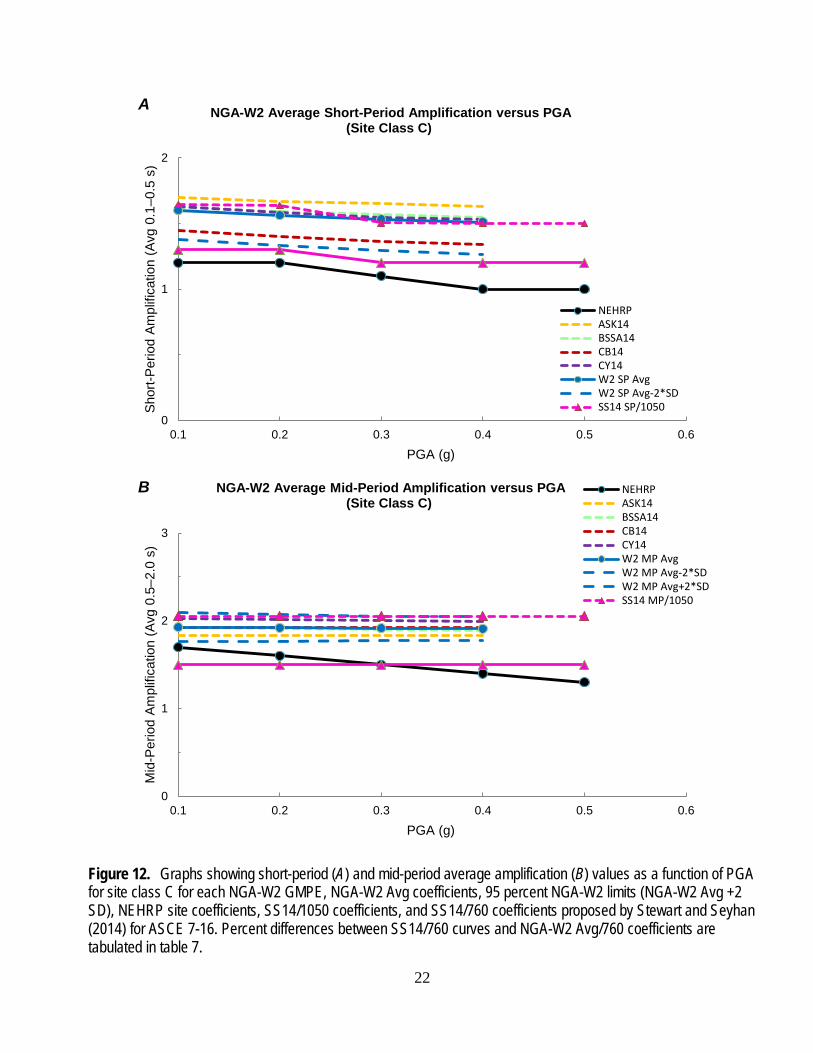
For site class C, figure 12 shows that the SS14/760 coefficients show some significant differences from those inferred from the NGA-W2 mid-period coefficients. Table 7 shows that the SS14/760 coefficients proposed for ASCE 7-16 site class C differ from the corresponding NGA-W2 Avg coefficients by 0 to 5 percent for short period band and by 6 to 8 percent for the mid-period band depending on base PGA level.

20
Figure 10. Graphs showing short-period (A) and mid-period average amplification (B) values as a function of PGA for site class E for each NGA-W2 GMPE, NGA-W2 Avg coefficients, 95 percent NGA-W2 limits (NGA-W2 Avg +2 SD), NEHRP site coefficients, SS14/1050 factors, and SS14/760 factors proposed by Stewart and Seyhan, (2014) for ASCE 7-16. Curves show that SS14 results differ significantly from NGA-W2 Avg coefficients for site class E.
0
1
2
3
4
0.1 0.2 0.3 0.4 0.5 0.6
Shor
t-Per
iod
Ampl
ifica
tion
(Avg
0.1
–0.5
s)
PGA (g)
NEHRPASK14BSSA14CB14CY14W2 SP AvgW2 SP Avg-2*SDW2 SP Avg+2*SDSS14 SP/760SS14 SP/1050
NGA-W2 Average Short-Period Amplification versus PGA (Site Class E)
0
1
2
3
4
5
6
7
8
0.1 0.2 0.3 0.4 0.5 0.6
Mid
-Per
iod
Ampl
ifica
tion
(Avg
0.5
–2.0
s)
PGA (g)
NEHRPASK14BSSA14CB14CY14W2 MP AvgW2 MP Avg-2*SDW2 MP Avg+2*SDSS14 MP/760SS14 MP/1050
NGA-W2 Average Mid-Period Amplification versus PGA (Site Class E)
B
A

21
Figure 11. Graphs showing short-period (A) and mid-period average amplification (B) values as a function of PGA for site class D for each NGA-W2 GMPE, NGA-W2 Avg coefficients, 95 percent NGA-W2 limits (NGA-W2 Avg +2 SD), NEHRP site coefficients, SS14/1050 coefficients, and SS14/760 coefficients proposed by Stewart and Seyhan, (2014) for ASCE 7-16. Percent differences between SS14/760 curves and NGA-W2 Avg/760 coefficients are tabulated in table 7.
0
1
2
3
0.1 0.2 0.3 0.4 0.5 0.6Shor
t-Per
iod
Ampl
ifica
tion
(Avg
0.1
–0.5
s)
PGA (g)
NEHRPASK14BSSA14CB14CY14W2 SP AvgW2 SP Avg-2*SDW2 SP Avg+2*SDSS14 SP/1050SS14 SP/760
NGA-W2 Average Short-Period Amplification versus PGA (Site Class D)
0
1
2
3
4
0.1 0.2 0.3 0.4 0.5 0.6
Mid
-Per
iod
Ampl
ifica
tion
(Avg
0.5
–2.0
s)
PGA (g)
NEHRPASK14BSSA14CB14CY14W2 MP AvgW2 MP Avg-2*SDW2 MP Avg+2*SDSS14 MP/1050SS14 MP/760
NGA-W2 Average Mid-Period Amplification versus PGA (Site Class D)
B
A
22
Figure 12. Graphs showing short-period (A) and mid-period average amplification (B) values as a function of PGA for site class C for each NGA-W2 GMPE, NGA-W2 Avg coefficients, 95 percent NGA-W2 limits (NGA-W2 Avg +2 SD), NEHRP site coefficients, SS14/1050 coefficients, and SS14/760 coefficients proposed by Stewart and Seyhan (2014) for ASCE 7-16. Percent differences between SS14/760 curves and NGA-W2 Avg/760 coefficients are tabulated in table 7.
0
1
2
0.1 0.2 0.3 0.4 0.5 0.6
Shor
t-Per
iod
Ampl
ifica
tion
(Avg
0.1
–0.5
s)
PGA (g)
NEHRPASK14BSSA14CB14CY14W2 SP AvgW2 SP Avg-2*SDSS14 SP/1050
NGA-W2 Average Short-Period Amplification versus PGA (Site Class C)
0
1
2
3
0.1 0.2 0.3 0.4 0.5 0.6
Mid
-Per
iod
Ampl
ifica
tion
(Avg
0.5
–2.0
s)
PGA (g)
NEHRPASK14BSSA14CB14CY14W2 MP AvgW2 MP Avg-2*SDW2 MP Avg+2*SDSS14 MP/1050
NGA-W2 Average Mid-Period Amplification versus PGA (Site Class C)
A
B

23
Figure 13. Graphs showing short-period (A) and mid-period average amplification (B) values as a function of PGA for site class B for NGA-W2 Avg, SS14 /760, SS14/1050 SP, and MP coefficients proposed by Stewart and Seyhan, (2014) for ASCE 7-16. Percent differences between the SS14/760 curves and the NGA-W2 Avg/760 coefficients are tabulated in table 7.
0.5
1.0
1.5
0.1 0.2 0.3 0.4 0.5 0.6
Shor
t-Per
iod
Ampl
ifica
tion
(Avg
0.1
–0.5
s)
PGA (g)
NEHRPW2 SP AvgSS14 SP/1050SS14 SP/760
NGA-W2 Average Short-Period Amplification versus PGA (Site Class B)
0.5
1.0
1.5
0.1 0.2 0.3 0.4 0.5 0.6
Mid
-Per
iod
Ampl
ifica
tion
(Avg
0.5
–2.0
s)
PGA (g)
NEHRPW2 MP AvgSS14 MP/1050SS14 MP/760
NGA-W2 Average Mid-Period Amplification versus PGA (Site Class B)
B
A
24
For site class B, figure 13 shows that the SS14/1050 coefficients differ significantly from the corresponding NGA-W2 Avg coefficients. Table 7 shows that the SS14/760 coefficients proposed for ASCE 7-16 site class B differ from the corresponding NGA-W2 Avg coefficients scaled to 760 m/s (tables 6a and 6b) by 9 percent for the short-period band and by 13 to 14 percent for the mid-period band depending on base PGA level.
Conclusions A detailed evaluation of the implications of NGA-W2 Avg site coefficients for possible
modification of the corresponding NEHRP site coefficients as adopted in US building codes (ASCE/SEI 7-10, 2010) is provided herein. The NGA-W2 Avg coefficients are inferred using procedures that are intended to be consistent with the simplified design spectra and the simplified unambiguous site classes having a reference site class with unity amplification as adopted in ASCE/SEI 7-10 (2010). The proposed coefficients derived from the average of the short- and mid-period amplifications derived from each NGA-W2 GMPE capture the full epistemic or model uncertainty associated with the NGA-W2 GMPEs. The procedure used to derive the coefficients is suggested as a simple procedure that can be applied each time the MCER maps are updated, so as to maintain consistency between the maps and the GMPEs used to derive the site coefficients. The NGA-W2 Avg coefficients are consistent with those previously reviewed and adopted in numerous versions of the codes.
The site coefficients inferred from the GMPEs for the NGA-W2 database using default parameters for sediment depth (Z1 and Z2) are significantly larger than those inferred using a similar procedure applied to the GMPEs developed from the NGA-W1 database. These results are consistent with independent results derived by Kircher (2015), Rezaeian (written commun., 2015), and those shown in figures of Campbell and Bozorgnia (2014) and Abrahamson and others (2014). The reasons for this increase merit further investigation.
The NGA-W2 GMPEs are used to develop scaling factors that can be applied to scale the MCER motions or the NGA-W2 site coefficients to other reference ground conditions. The scale factors, applied to scale either the MCER motions or the W2 site coefficients to a reference condition of 900 m/s, reduce some, but not all of the conservatism in current design spectral estimates. The scale factors applied to convert both the MCER motions and the W2 coefficients to the same reference ground condition eliminate current conservatism in design spectral estimates. Tables 4, 5, and 6 provide NGA-W2 site coefficients referenced to 1,050 m/s, 900 m/s, and 760 m/s.
Site coefficients proposed for ASCE 7-16 are compared in detail with those inferred from each of the NGA-W2 GMPEs and the NGA-W2 Avg coefficients. Percent differences between the coefficients proposed for ASCE 7-16 and the corresponding NGA-W2 Avg coefficients scaled to 760 m/s (tables 6a and 6b) are shown to be significant as summarized in table 7.
25
References Cited Abrahamson, N., Atkinson, G., Boore, D., Bozorgnia, Y., Campbell, K., Chiou, B., Idriss, I.M., Silva, W.,
Youngs, R., 2008, Comparisons of the NGA ground-motion relations: Earthquake Spectra, v. 24, no.1, p. 45–66, doi:10.1193/1.2924363.
Abrahamson, N.A., Silva, W.J., and Kamai, R., 2014, Summary of the ASK14 ground-motion relation for active crustal regions: Earthquake Spectra, v. 30, p. 1025–1055.
American Society of Civil Engineers (ASCE), 2010, Minimum Design Loads for Buildings and Other Structures (7-10), (ASCE Standard ASCE/SEI 7-10): American Society of Civil Engineers, USA, 650 p.
Ancheta, T.D., Darragh, R.B., Stewart, J.P., Seyhan, E., Silva, W.J., Chiou, B.S.-J., Wooddell, K.E., Graves, R.W., Kottke, A.R., Boore, D.M., Kishida, T., and Donahue, J.L., 2014, NGA-West2 Database: Earthquake Spectra, v. 30, no. 3, p. 989–1005.
Boore, D.M., Stewart, J.P., Seyhan, E., and Atkinson, G.A., 2014, NGA-West2 equations for predicting PGA, PGV, and 5% damped PSA for shallow crustal earthquakes: Earthquake Spectra, v. 30, no. 3, p. 1057–1085.
Borcherdt, R.D., 1970, Effects of local geology on ground motion near San Francisco Bay: Bulletin of the Seismological Society of America, v. 60, no. 1, p. 29–61.
Borcherdt, R.D., 1992, Simplified site classes and empirical amplification factors for site dependent code provisions, in Martin, G.R., ed., Proceedings of the 1992 NCEER/SEAOC/BSSC Workshop on Site Response During Earthquakes and Seismic Code Provisions, University of Southern California, Los Angeles, November 18–20, 1992: National Center for Earthquake Engineering Research Special Publication NCEER-94-SP01, Buffalo, NY.
Borcherdt, R.D., 1994, Estimates of site-dependent response spectra for design (Methodology and Justification): Earthquake Spectra, v. 10, no. 4, p. 617–653.
Borcherdt, R.D., 2002, Empirical evidence for site coefficients in building-code provisions: Earthquake Spectra, v. 18, no. 2, p. 189–217, doi:10.1193/1.1486243.
Borcherdt, R.D., 2012, Vs30—A site-characterization parameter for use in building codes, simplified earthquake resistant design, GMPEs, and ShakeMaps, in Proceedings of the 15th World Conference of Earthquake Engineering, Lisbon, Portugal.
Borcherdt, R.D., 2014a, Implications of NGA for NEHRP site coefficients: U.S. Geological Survey Open-File Report 2012–1269, 29 p. [Also available at http://pubs.usgs.gov/of/2012/1269/.]
Borcherdt, R.D., 2014b, Implications of next generation attenuation ground-motion prediction equations for site coefficients used in earthquake resistant design: Earthquake Engineering & Structural Dynamics, v. 43, no. 9, p. 1343–1360, doi:10.1002/eqe.2400.
Borcherdt, R.D., and Gibbs, J.F. 1976, Effects of local geological conditions in the San Francisco Bay region on ground motions and the intensities of the 1906 earthquake: Bulletin of the Seismological Society of America, v. 66, no. 2, p. 467–500.
Bozorgnia, Y., Abrahamson, N.A., Al Atik, L., Ancheta, T.D., Atkinson, G.M., Baker, J.W., Baltay, A., Boore, D.M., Campbell, K.W., Chiou, B.S.-J., Darragh, R., Day, S., Donahue, J., Graves, R.W., Gregor, N., Hanks, T., Idriss, I.M., Kamai, R., Kishida, T., Kottke, A., Mahin, S.A., Rezaeian, S., Rowshandel, B., Seyhan, E., Shahi, S., Shantz, T., Silva, W., Spudich, P., Stewart, J.P., Watson-Lamprey, J., Wooddell, K., and Youngs, R., 2014, NGA-West2 research project: Earthquake Spectra, v. 30, no. 3, p. 973–987.
Building Seismic Safety Council (BSSC), 1994, NEHR Recommended Provisions for the Development of Seismic Regulations for New Buildings: Federal Emergency Management Agency (FEMA), Washington, D.C., 199 p. [Also available at https://www.nibs.org/?page=bssc_1994pubs.]

26
Building Seismic Safety Council (BSSC), 2009, NEHRP Recommended Seismic Provisions for New Buildings and Other Structures, FEMA P-750 2009 Edition: Federal Emergency Management Agency (FEMA), Washington, D.C., 388 p. [Also available at https://www.nibs.org/?page=bssc_2009pubs.]
Campbell, K.W., and Bozorgnia, Y., 2014, NGA-West2 ground motion model for the average horizontal components of PGA, PGV, and 5% damped linear acceleration response spectra: Earthquake Spectra, v. 30, no. 3, p. 1087–1115.
Chiou, B.S.-J. , and Youngs, R.R., 2014, Update of the Chiou and Youngs NGA model for the average horizontal component of peak ground motion and response spectra: Earthquake Spectra, v. 30, no. 3, p. 1117–1153.
Dobry, R., Borcherdt, R.D., Crouse, C.B., Idriss, I.M., Joyner, W.B., Martin, G., Power, M.S., Rinne, E.E, Seed, R.B., 2000, New site coefficients and site classification system used in recent building seismic code provisions (1994/1997 NEHRP and 1997 UBC): Earthquake Spectra, v. 16, no. 1, p. 41–67.
Dobry R., Martin, G.M., Parra, E., Bhattacharyya, A., 1992, Development of site-dependent ratios of elastic response spectra (RRS) and site categories for building seismic codes, in Martin, G.R., ed., Proceedings of the 1992 NCEER/SEAOC/BSSC Workshop on Site Response During Earthquakes and Seismic Code Provisions, University of Southern California, Los Angeles, November 18–20, 1992: National Center for Earthquake Engineering Research Special Publication NCEER-94-SP01, Buffalo, NY.
Frankel, A.D., Mueller, C.S., Barnhard, T.P., Perkins, D.M., Leyendecker, E.V., Dickman, N.C., Hanson, S.L., and Hoper, M.G., 1997, Seismic-hazard maps for the coterminous United States: U.S. Geological Survey Open-File Report 97-131, 12 sheets, scale 1:7,000,000. [Also available at http://pubs.er.usgs.gov/publication/ofr97131.]
Fumal, T.E., 1978, Correlations between seismic wave velocities and physical properties of geologic materials in the San Francisco Bay region, California: U.S. Geological Survey Open-File Report 78-1067, 52 p., 1 sheet, scale 1:250,000. [Also available at http://pubs.er.usgs.gov/publication/ ofr781067.]
Gregor, N., Abrahamson, N.A., Atkinson, G.M., Boore, D.M., Bozorgnia, Y., Campbell, K.W., Chiou, B.S.-J., Idriss, I.M., Kamai, R., Seyhan, E., Silva, W., Stewart, J.P., and Youngs, R., 2014, Comparison of NGA-West2 GMPEs: Earthquake Spectra, v. 30, no. 3, p. 1179–1197.
Idriss, I.M., 2014, An NGA-West2 empirical model for estimating the horizontal spectral values generated by shallow crustal earthquakes: Earthquake Spectra, v. 30, no. 3, p. 1155–1177.
Kamai, R., Abrahamson, N.A., and Silva, W.J., 2014, Nonlinear horizontal site amplification for constraining the NGA-West2 GMPEs: Earthquake Spectra, v. 30, no. 3, p. 1223–1240.
Kircher & Associates, Consulting Engineers, C.A., 2015, Investigation of an identified shortcoming in the seismic design procedures of ASCE 7-10 and development of recommended improvements for ASCE 7-16: Building Seismic Safety Council report, March 15, 2015, 105 p. [Also available at http://c.ymcdn.com/sites/www.nibs.org/resource/resmgr/BSSC2/Seismic_Factor_Study.pdf.]
Petersen, M.D., Moschetti, M.P., Powers, P.M., Mueller, C.S., Haller, K.M., Frankel, A.D., Zeng, Yuehua, Rezaeian, Sanaz, Harmsen, S.C., Boyd, O.S., Field, Ned, Chen, Rui, Rukstales, K.S., Luco, Nico, Wheeler, R.L., Williams, R.A., and Olsen, A.H., 2014, Documentation for the 2014 update of the United States national seismic hazard maps: U.S. Geological Survey Open-File Report 2014–1091, 243 p. [Also available at http://pubs.usgs.gov/of/2014/1091/.]
Rezaeian, S., Petersen, M.D., Moschetti, M.P., Powers, P., Harmsen, S.C., and Frankel, A.D., 2014, Implementation of NGA-West2 ground motion models in the 2014 U.S. national seismic hazard maps: Earthquake Spectra, v. 30, no. 3, p. 1319–1333.
27
Rogers, A.M., Borcherdt, R.D., Covington, A.M., and Perkins, D.M., 1984, A comparative ground response study near Los Angeles using recordings of Nevada Nuclear Tests and the 1971 San Fernando earthquake: Bulletin of the Seismological Society of America, v. 74, no. 5, p. 1925–1949.
Seed, R.B., 1992, Proposed Site classifications and relative response spectral ratios, in Martin, G.R., ed., Proceedings of the 1992 NCEER/SEAOC/BSSC Workshop on Site Response During Earthquakes and Seismic Code Provisions, University of Southern California, Los Angeles, November 18–20, 1992: National Center for Earthquake Engineering Research Special Publication NCEER-94-SP01, Buffalo, NY.
Seyhan, E., 2014, Weighted Average of 2014 NGA West-2 GMPEs, Excel file: NGAW2_GMPE_Spreadsheets_v5.6_070514, Pacific Earthquake Engineering Center. [Also available at http://peer.berkeley.edu/ngawest2/databases/.]
Seyhan, E., and Stewart, J.P., 2014, Semi-empirical nonlinear site amplification from NGA-West2 data and simulations: Earthquake Spectra, v. 30, no. 3, p. 1241–1256.
Stewart, J.P., and Seyhan, E., 2013, Semi-Empirical Nonlinear Site Amplification and its Application in NEHRP Site Factors, PEER Report No. 2013/13: Pacific Earthquake Engineering Research Center, University of California, Berkeley, CA, 59 p. [Also available at http://peer.berkeley.edu/publications/ peer_reports/reports_2013/webPEER-2013-13-Stewart.pdf.]