nextor - isr.umd.edu · 3 6. conclusion..48 references 53 appendix a: planned discussion subjects...
TRANSCRIPT

Institute of Transportation Studies
University of California at Berkeley
The Role of Intelligent Transportation Systems (ITS) inIntermodal Air Cargo Operations
H.-S. Jacob TsaoAsim Rizwan
WORKING PAPER
UCB-ITS-WP-2000-3
NATIONAL CENTER OF EXCELLENCE FOR
NEXTORAVIATION OPERATIONS RESEARCH
NEXTOR Working Paper WP-99-3
October 2000

2
Intermodal Air Cargo Operations And The Role of IntelligentTransportation Systems (ITS)
TABLE OF CONTENTS
1. Background .4
1.1 Study Objectives ..4
1.2 Study Approach and Scope .5
1.3 Organization of Report ... 7
2. Overview of the Air Cargo Industry ..8
2.1 Role of the Air Cargo Industry in Goods Movement 8
2.2 Air Freight in California 11
2.3 Overview of Site Visits 14
2.4 Integrated Air-Express Forwarding ..15
2.5 Performance Measures for Air Cargo Operations .. 19
3. Public-Sector Innovation Opportunities for Solving The Problems and Issues
Faced By The Integrated Air-Express Forwarders In The State ..21
3.1 Issues, Problems And Possible Solutions Suggested By The Operator ... .21
3.2 Other Public-Sector Innovation Opportunities ..24
4. The Role of ITS in the Air Cargo Industry ... .27
4.1 Current Success Stories of ITS in Air Cargo Operations . ...28
4.2 Possible Future Roles of ITS and Other Advanced Technologies in Integrated
Air-express Forwarding .33
4.3 Role of the Government in Deployment of ITS for the Air Cargo
Industry .39
5. Lessons Learned from the Integrated Air-Express Industry in the Areas of ITS
Deployment and the Intermodal Services . ...41
5.1 ITS Deployment ...42
5.2 Intermodal Transportation Services ... .46

3
6. Conclusion ..48
References 53
Appendix A: Planned Discussion Subjects During Site Visits .55
Appendix B: Site-visit Report - Airborne Express, Mather Airport (Sacramento) .58
Appendix C: Site-visit Report - Federal Express, San Ramon Dispatch Center For The
Dispatching Operations In The San Francisco Bay Area ..62
Appendix D: Site-visit Report - Federal Express, Oakland Regional Hub ..69
Appendix E: Site-visit Report - UPS Western Region Hub At Ontario International Airport:
Highlights Of Visit On May 4, 2000 71
Appendix F: Site-visit Report - Southern California Logistics Airport: Highlights Of Visit On
May 4, 2000 ... 73
Appendix G: Site-visit Report - Northwest Airlines: Highlights Of Visit On May 5,
2000 .75
Appendix H: Site-visit Report - Nippon Cargo Airlines: Highlights Of Visit On May 5,
2000 ....77
Appendix I: Salient Features Of Integrated Air-Express Forwarding ..78
Appendix J: The Ground Operations Of Integrated Air-Express Forwarding And Their Salient
Features ..85
Appendix K: The Airport Operations Of Integrated Air-Express Forwarding And Their Salient
Features ..90
Appendix L: Performance Measures For Air Cargo Movement ..95
Appendix M: Performance Measures Of The Public Sector On Intermodal Ground
Operations .98
Appendix N: Performance Measures Of The Integrators Services .. .101
Appendix O: Specific Issues And Problems Faced By The Operators In The State And Public-
Sector Innovation Opportunities .104
Appendix P: ITS Technologies In Use Or Being Tested For Trucking And The Ground
Operations Of Air Cargo Movement . ..110
Appendix Q: A Brief Introduction To E-Commerce .120

4
1. BACKGROUND
If California were a nation, it would be the seventh largest economy in the world. Efficient goods
movement is crucial to California s economy. To support continued growth of the state s
economy, Caltrans developed a strategic plan entitled Statewide Goods Movement Strategy [8].
This strategy was prepared as a response to a recommendation of the 1993 California
Transportation Plan. Caltrans also developed a strategic plan for developing and implementing
Transportation System Performance Measures [9]. These two strategic plans constitute the
1998 California Transportation Plan.
California s aviation system is a critical component of the state s overall transportation system.
In preparation for the 1998 California Transportation Plan, the New technology and Research
Program of Caltrans contracted with the Institute of Transportation Studies at University of
California at Berkeley to conduct two studies: (a) to study the state s air freight industry and (b)
to develop a framework and a set of performance measures for the state s aviation system. Both
studies were based on literature survey, and have been completed. The findings have been
documented in two white papers, [37] and [24] respectively. This research is an extension to
those two studies, particularly the air freight study. The purposes of the air freight study were
to (i) gain a broader understanding of the state s air cargo industry and the role of air cargo in
California s goods movement, (ii) assess the importance of air cargo to the state s economy, (iii)
begin identification of issues hindering efficient air cargo movement in the state, and (iv) explore
possible state roles for resolving the issues.
1.1 STUDY OBJECTIVES
This research serves three main purposes:
1. Investigate how the public sector (state, cities, counties or airports) in the state of California
can assist the air cargo industry in providing more efficient service to businesses and the
general public of California. In particular, support and enable efficiency improvement for the
state s air cargo industry through innovations in operations, either technology-based
innovations (particularly the Intelligent Transportation Systems (ITS) technologies) or other
more conventional means. This complements past studies on issues and opportunities
related to efficient operations of the freight industry as a whole, e.g., [1,23].
2. Learn from the air cargo industry s efficient intermodal operations about intermodal freight
and passenger transportation in general. This complements past studies on issues and
opportunities related to intermodal freight operations, e.g., [13].
3. Learn from the industry s technology deployment efforts for the purpose of developing
strategies for deploying ITS technologies in the general freight industry and in the overall
transportation industry.

5
1.2 STUDY SCOPE AND APPROACH:
To achieve the three objectives, we focused on the operations of the integrated air express
industry in the state of California and adopted a two-prong approach. We state and justify the
focus first and then the two-prong approach.
1. Focus on California
As demonstrated in The Role of Air Cargo in California s Goods Movement [37] through
many statistics, air cargo is much more important for California than for the nation as a
whole. Most of the studies reported in the existing literature regarding issues faced by the
air-cargo industry and the companion innovation opportunities pertain to the industry at the
national level. The urgency or applicability of many issues varies at the state level, and hence
cannot be assessed at the national level. The particular importance of air cargo for California
warrants a focus on the state.
2. Focus on a key segment of the air cargo industry - integrated air express industry, e.g.,
FedEx, UPS, Airborne Express, etc.:
All air cargo services, integrated air express or not, invariably involve multiple modes of
transportation. The qualifier integrated refers end-to-end transportation services between
the sender and the receiver of freight that are characterized by a definite delivery date and
time and are achieved by well-coordinated operations among multiple transportation modes.
Although the term intermodal transportation often refers to efficient interface between two
transportation modes, it has also been used to refer to efficient transportation from one end
to the other through a number of transportation modes. Integrated freight transportation,
as being provided by the integrated air express industry, can be viewed as the ultimate form
of intermodal freight transportation. Studying this particular segment of the air freight
industry should reveal the most about intermodal freight than studying any another segment
of the air freight industry.
In addition, by studying the main differences in operations between the integrated air express
industry and the rest of the air freight industry, one may learn lessons about how to design
intermodal passenger services and the associated feasibility issues. Note that it is difficult to
extrapolate what is learned in the context of freight transportation to lessons for the context
of passenger transportation. However, the difference in operations between the integrated air
express industry and the rest of the air freight industry may shed light on the difference
between intermodal passenger transportation services and the conventional ones.
Since the freight industry is large and complex, promoting Intelligent Transportation Systems
(ITS) technologies among all freight operators as one single step may be difficult. An
alternative is to promote them in multiple steps, with a small but influential segment as the
initial target. The segment of integrated air express requires the highest efficiency among all

6
air freight operators, and hence would need and welcome the most innovations in the public
sector. The efficiency requirements as well as the high competitiveness of the market have
made these operators forerunners as well as good models of technology adoption. (In fact,
these operations have been bench-mark models of operational efficiency for a variety of other
industries.)
3. Focus on operations (including ground operations and intermodal-transfer operations) , but
not just on those operations that the public sector actions may have impact on.
The air freight industry, like the freight industry as a whole, is a customer of public-sector
transportation facility providers like Caltrans. A clear understanding of the transportation-
related needs of the air freight industry is the beginning of a long process toward achieving
customer satisfaction, i.e., quality of the services provided by the public sector. A clear
understanding of all the air freight operations, regardless whether the public sector may play
any role or not, would help the public sector assess from the customer s perspective the
relative importance and urgency of those issues whose resolution warrants public-sector
roles.
Out of many air cargo operators operations, we focused on ground operations and
intermodal-transfer operations at an airport. Intermodal-transfer operations include all those
operations taking place between unloading of air cargo from an aircraft to loading the cargo
onto a truck for local delivery, e.g., sorting, loading, unloading, U.S. Customs clearance,
warehousing at an airport, etc. Related issues include surface traffic congestion at or near the
airports and traffic congestion experienced while cargo is being transported from the customer
to the airport or from the airport to the customer.
In addition to these operations, we also studied the cargo operations at the multi-tenant
facilities at an airport. Since typically an airport authority leases out its facilities,
particularly space in the form of part or the entirety of a building, and does not provide
shared facilities like (shared) refrigerated storage space, it does not play an essential role in
the integrator s day-to-day operations. Therefore, such multi-tenant facilities will not be a
focal point of this report.
We adopted the following two-prong approach:
1. Adopt a quality-oriented approach - linking customer satisfaction with detailed operations
through performance measures
The quality movement taking place in the U.S. during the past two decades and in parts of
the rest of the world after World War II was triggered by the competition in the market place
of consumer products, most notably the automobile industry. In the private sector, product
or service quality has long been well recognized as a primary distinguishing characteristics of
a company. The public sector provides services as well as infrastructure (products), and has
seen its own version of quality movement. At the state level, performance measures and

7
performance-based evaluation are becoming an important part of the transportation planning
process.
A major consensus resulting from the quality movement is that quality is customer
satisfaction. In fact, AT&T, which conducts extensive day-to-day production and service
operations for both civilian and military clients, has adopted customer satisfaction as the
corporate definition of quality. Three business units of AT&T won the Malcolm Baldrige
National Quality Award in the past ten years.- AT&T Consumer Communications Service in
1994; AT&T Network Systems Group in 1992 in the Manufacturing category; AT&T
Universal Card Services for the Service category in 1992. FedEx won the 1990 Award in the
Service category.
Linking customer satisfaction to detailed operations through performance measures has been a
common thread among all quests for quality. Therefore, this linking can be used to facilitate
the understanding of the operations of the integrated air express industry.
Other customers of the overall transportation system in the context of air freight include not
only those industries and businesses that the air freight industry supports directly or
indirectly but also the general public indirectly. This report focuses on the direct customer -
the air freight operators.
Although we focus on the direct customer in this report, one needs to bear in mind that the
ultimate customer is the general public and serving the air freight industry is actually serving
the general public. However, the public sector should remain impartial in developing ways
to enable or support efficiency improvement for air freight operations in the sense that no
preferential treatments or competitive advantages are given to any particular integrator. This
is particularly important when public-private partnership is involved.
2. Conduct site visits:
Existing literature on the air freight or integrated air express industries tends to address issues
generic to the industries. However, to help identify and resolve issues faced by California
operators and to help promote intermodal operations and ITS deployment in California, real
issues faced by California operators and the companion innovation opportunities must be
clearly understood. Such an understanding can be achieved only by site visits to
representative operators and by maintaining a dialog with them.
1.3 ORGANIZATION OF THE REPORT
This report documents our research findings. It is organized as follows. Section 2 provides
describes a brief description of the air cargo industry, a concise discussion of air freight in
California, a summary of our field trips, and a discussion of the operations involved in integrated
air-express forwarding. Since our focus is on the fast-growing and vibrant segment of integrated

8
air-express forwarding within the air cargo industry, we provide a description of the distinction
between the industry of integrated air-express forwarding and its non-integrated counterpart as
well as a brief description of air cargo operations and their salient features, based on our
understanding gained through visits to air cargo facilities in both Northern and Southern
California. The air cargo industry, particularly the integrated air express industry, distinguishes
itself by its operational efficiency. Together with the stiff competition, performance measures
and their tracking become pivotal in the day-to-day operations and strategic planning for the
operators. Section 2 also addresses the performance measures for the air cargo industry.
Section 3 summarizes the issues and problems faced by the integrated air-express forwarders in
California as well as possible public-sector innovation opportunities, also based on our
understanding gained through visits to air cargo facilities in both Northern and Southern
California. To optimize the efficiency, the operators have been early adopters for advanced
technologies, and this is expected to continue. Section 4 discusses the high-impacting
technologies, particularly ITS technologies, that are currently used by some of the leading
operators or are being planned for deployment. (A brief review of relevant ITS technologies is
provided in Appendix P for those readers that may not be familiar with ITS technologies.)
Section 5 summarizes the lessons learned from the industry about technology deployment and
intermodalism. Concluding remarks are given in Section 6.
2. OVERVIEW OF THE AIR CARGO INDUSTRY
2.1 THE ROLE OF THE AIR CARGO INDUSTRY IN GOODS MOVEMENT
Air cargo has been broadly classified into three categories: air mail, air express and air freight. Air
mail refers to the letters and packages transported by air by the world s governmental postal
services. Note that such letters and packages include those that are sent through the overnight
express services offered by the US Postal Services. The rest of the goods carried by aircraft is
referred to as either air express or air freight. They consist predominantly of high-value, time-
sensitive or time-definite goods, e.g., electronic equipment, emergency shipments, overnight
packages, etc.
The distinction between air express and air freight is not as clear as the distinction between them
and air mail. Today, air express refers to small packages that usually have a higher priority of
carriage than air freight. These small packages typically weigh less than 100 lbs, and the higher
priority is typically manifested by a delivery deadline, e.g., UPS Next Day Early AM (8:30)
service. Services whose delivery is guaranteed by a specific time has been referred to as time-
definite services. Overnight air express is an important part of air express. For a detailed
historical account of these terms and their current meanings, the reader is referred to [15]. For a
concise glossary, see[32]. Air express services are typically operated by integrated operators, i.e.,
those operators who use primarily their own trucks and aircraft (or those owned by their
partners or allied organizations) to pick up the freight from the sender, transport it through the
air and other modes, and deliver the freight to the receiver. These integrated operators are often

9
referred to as integrated air-express forwarders. For ease of discussion, we will refer to these
integrated air-express forwarders simply as integrated forwarders or integrators in the rest of
this report.
Sections 2 of The Role of Air Cargo in California s Goods Movement [37] describes the air
cargo industry as a whole. This section supplements that document with a brief discussion of
the development of the air express industry in the U.S.. Section 2.1.1 provides a brief history of
the industry, and Section 2.1.2 discusses the distinguishing features of this industry from the rest
of the air cargo industry.
2.1.1 Evolution of the U.S. Integrated Air-Express Industry
The industry originated in the 1970 s as a response to the needs of shippers for more reliable,
door-to-door and overnight delivery. Such services were enabled by (a) hub-and-spoke network
configuration with the hubs located at non-congested airports, (b) total control of the entire
shipment by a single party, and (c) night-time all-cargo flights.
The integrated air-express forwarding industry began with the birth of Federal Express (FedEx)
and was started in 1973 by Frederick Smith based on the thesis for his master s degree. Initially,
the company lost approximately $1 million per month. But, FedEx turned profit in 1976. Its
success invited much competition, and several large transportation companies ventured into the
business of integrated air-express during the 1980 s. Several factors, including deregulation of air
transportation in 1977, operating efficiency achieved through adaptation of advanced
technologies and other means, just-in-time manufacturing, streamlining of enterprise supply chain
management, etc., led to the continuing and fast growth of the whole industry.
This industry has experienced tremendous growth in recent years. FedEx in 1983 became the
first company in the US to reach $1billion in revenue in 10 years. It has steadily grown to a
$13.3 billion company by May 1998, with an average annual growth of $1billion for the past few
years. For a more detailed analysis of the growth of the whole industry, the reader is referred to
[37,6,32].
Except for Federal Express, the major air express companies originated in other related
transportation business and gradually expanded or transitioned into integrated air express service
providers. The evolution of the major integrated forwarders is summarized below. The
discussion of the individual companies is in ascending order of their entry into the integrated air-
express industry.
• Federal Express began operations as an integrated air express service in 1973 with a fleet of
eight small aircraft. By 1980, it served virtually entire U.S. with its national hub located in
memphis. It is also responsible for many of the innovations characterizing the integrated air-
express industry. Federal Express targeted small package shipments until the monopoly by
the U.S. Postal Service on letters ended in 1979. After the deregulation, Federal Express was
allowed by law to promote its overnight letter service. In 1989, it acquired The Flying Tiger

10
Line, the largest all-cargo air carrier in the world at that time, and moved into heavy-weight air
freight.
• Airborne Express began operations as a freight forwarder based in California in 1946 and
entered the overnight air express market in 1979. It became an integrated forwarder when it
acquired its own aircraft fleet and opened its national hub at Willminton, Ohio in 1980.
• Emery was a heavy-weight air freight forwarder before it entered integrated air express
forwarding with its own fleet in 1981. In 1987, Emery acquired Purolator Courier
Corporation, but was not able to integrate successfully Purolator s overnight letter operations
with its own heavy-weight operations. In 1989, Consolidated Freightways, the then third
largest U.S. trucking firm, acquired the financially weakened Emery and operated the air
express-air freight firm as Emery Worldwide.
• United Parcel Service (UPS) started out as a ground transportation company and was the
largest ground carrier and an integrated air-express forwarder in the U.S. when it entered
overnight express in 1982. By 1988, it was the largest U.S. transportation company in
annual revenues. In mid 1990, it employed 62,000 drivers and delivered approximately 10
million packages per day. By 1998, it delivered approximately 12 million packages per day,
approximately 1.5 million of which involve air transportation. UPS began its air operations,
with a national hub located in Louisville, Kentucky, by shipping primarily financial
documents, including checks to be cleared overnight, between major financial centers. It
expanded into small and then heavier packages after they began using their own dedicated
fleets in 1984 and no longer had to rely on individual couriers checking their shipments as
baggage on passenger flights.
• DHL, named after its three founders, began as an international air courier, focusing on
shipment of financial documents. It was split in two in 1972: a U.S. company called DHL
Corporation and a Hong-Kong based firm called DHL International; the two companies are
linked through an operating agreement. DHL acquired its own aircraft fleet and a hub in Ohio
in 1983.
• TNT is a subsidiary of the world s largest freight transportation company Thomas
Nationwide Transport of Australia and operates under the name of TNT Skypak in the U.S..
It focused on shipping documents and small parcels until it began targeting heavier shipments
in 1990. Because it is owned by a foreign firm, it is prohibited by U.S. law from owning more
than 25% of a U.S. airline. Consequently, it relies on other carriers to provide U.S. airlift. To
expand it U.S. operations, it acquired an 18% interest in Airborne during 1987. However, it
was not able to purchase control of Airborne again due to the U.S. law limiting foreign
ownership of U.S. airline.
2.1.2 The Distinguishing Features of U.S. Air Express Services

11
Before integrated air-express forwarding became available, shippers replied on airlines or air cargo
forwarders for expedited or emergency shipments. Typically, a shipment consists of multiple
segments and is handled by multiple parties. The integrated air-express industry introduced
numerous service features that distinguished its services from the traditional air-freight services.
These service features include:
• User-friendly documentation and communications systems to automate much of the process,
including routing (both on the ground and in the air), tracing of enroute shipments and billing.
• Single vendor handling and control of shipments, critical services for meeting shippers needs.
• Late afternoon pickups, nighttime transport, and early-morning delivery.
• Time-definite and reliable delivery, ranging from same0day to third-day with greater emphasis
on speed.
• Widespread geographical coverage to most addresses in the U.S. at competitive prices.
• Lower prices than scheduled airlines for smaller shipments such a documents and lightweight
parcels.
• Uniform pricing, usually based on weight and not related to distance.
• A trend toward heavier weight and larger shipments in order to increase utilization rates and
expand beyond the document market.
For more details about these service features, the reader is referred to Development of the U.S.
Air Express Industry: 1970 — 1990, [30]. These service features are enabled by efficient
operations, and salient features of integrated air-express operations will be the subject of Section
2.4.
2.2 AIR FREIGHT IN CALIFORNIA
Timely delivery of high-value goods has been an important element of many manufacturing and
service operations in California (e.g., the manufacturing of high-tech products in Silicon Valley
and their world-wide distribution). Therefore, the air cargo industry is a vital part of the state s
economy. Continued ability of the state s air cargo industry to serve the other industries in the
state is essential to the prosperity of California.
Demand for air cargo among the West Coast, the rest of the nation and the world has been
forecast to continue to grow rapidly; much of the demand would be cargo passing through
California airports, rather than originating from or destined for California airports. In
anticipation of traffic congestion at major California airports, many airports in the other states of
the West Coast have attempted to lure traffic away from California s airports. The economic
impact may be significant. The state s ability to capitalize on the forecast growth of air cargo
routes between Pacific-Rim countries in Asia and North America is also essential to the state s
economy. However, future demand on California s air cargo system may continue to outpace
the future supply of the system s capacity.
Findings of the air freight study reported in The Role of Air Cargo in California s Goods
Movement [37] include:

12
• Fast Growth of Air Cargo in California: That study reported that the growth of air cargo
at the top ten airports in California has been very fast. Seven out of the ten airports enjoyed
a growth rate higher than 50% in the five years between 1991 and 1996; four out of the seven
experienced more than doubling of the total air cargo tonnage. The ten airports had a
combined growth rate of higher than 50% in those 5 years.
• The State s Heavy and Valuable Air Cargo Traffic and Its Role in Exporting: Los
Angeles International Airport was ranked as the second largest cargo airport in the World in
1996 by Airports Council International, outranked by only Memphis - the biggest hub for
Federal Express. Three out of the top twelve cargo airports in the U.S. are in California, with
a combined tonnage of more than 3 million in 1996. Table 1 below shows the total air cargo
tonnage of the twelve top U.S. cargo airports and the airports ranks among the U.S. and the
world s airports.
Table 1. Total Air Cargo Tonnage at 12 Top U.S. Cargo Airports in 1996
U.S. Airports Total Tonnage Rank in the World Rank in the U.S.
Memphis 1,933,846 1 1
Los Angeles 1,719,449 2 2
Miami 1,709,906 3 3
New York (JFK) 1,636,497 4 4
Louisville 1,368,520 8 5
Chicago 1,259,858 10 6
Newark 958,267 15 7
Atlanta 800,181 16 8
Dallas/Fort Worth 774,947 19 9
Dayton 767,255 20 10
San Francisco 711,877 21 11
Oakland 615,298 23 12
Source: Airports Council International, Worldwide Airport Traffic Report
Note that Memphis, Louisville, and Dayton International Airports are the national hubs of
FedEx, UPS and DHL, respectively.
Table 2 below shows the total tonnage of cargo enplaned or deplaned at top ten California
cargo airports in 1996 as well as the growth rate from 1991 and 1995.
Table 2: Total Weight of Cargo Enplaned or Deplaned at CA Airports
CA Airports 96 Total Tons Change from 95 Change from 91
Los Angeles 1,719,449 7.7% 50.6%
San Francisco 711,877 2.2 % 17.5%
Ontario 396,485 13.0% 54.7%

13
Oakland 615,298 11.7% 143.3%
San Jose 91,798 -0.5% 18.9%
San Diego 92,980 5.0% 93.0%
Sacramento 65,426 -4.6% 110.9%
Long Beach 27,392 12.6% 10.1%
Burbank 37,751 10.8% 114.0%
Orange County 19,822 22.1% 688.2%
Total 3,778,278 8.6% 53.7%
Source: Airports Council International, Worldwide Airport Traffic Report
It is clear from the Table 2 that the growth of air cargo at the top ten cargo airports in
California has been very fast. Seven out of the ten airports experienced a growth rate higher
than 50% in the five years between 1991 and 1996; four out of the seven experienced more
than doubling of the total air cargo tonnage. The ten airports had a combined growth rate of
higher than 50% in those 5 years.
The 1993 Commodity Flow Survey (of primarily the manufacturing industries) estimated
that in 1992, 21.4% ($30 Billion) of the non-parcel domestic air cargo, in value, originating in
the U.S. originated in California. The California World Trade Commission estimated that in
1986, close to 70% ($16.7 Billion) of California s exports, in value, was shipped by air.
Although accurate estimates of such percentages for recent years are not available,
percentages higher than 70% have been reported. . In addition, six of the top twenty U.S.
exporting metropolitan areas in 1996 are in California, with the San Jose metropolitan area
ranked the first in the U.S. The high percentages, the fast increase in the percentage and the
high export value achieved by the six California metropolitan areas attest undoubtedly to the
critical role of air cargo for California s economy.
• Significance of Passenger and Aircraft Traffic in the State s Aviation System: . In
1996, Los Angeles and San Francisco International Airports were ranked as the fourth and the
seventh largest passenger airports in the world, respectively. In terms of the total number of
landing and take-off operations, Los Angeles International Airport was ranked number three
in the world. Perhaps quite surprisingly, although Oakland, Long Beach and Orange County
Airports have not been considered to be major passenger airports in the State, they are
actually ranked number 10, 12 and 14 in the world in terms of the number of landing and take-
off operations (resulting partially from general aviation and cargo operations). In each of the
three categories (air cargo, air passengers and aircraft operations), California has by far the
busiest traffic among all fifty states of the U.S.
• Relative Value of Air Cargo with Respect to All Trucked Goods: Based on the 1993
Commodity Flow Survey, it was estimated that, in California, air cargo is on average
approximately 37 times as valuable as trucked goods.

14
• Role of Air Cargo in Goods Movement Is Much More Important to California than tothe Nation: While the total value of commodity originating from California accounted for
10.4% of the total value of commodity originating in the U.S., total value of non-parcel air
cargo originating in the State accounted for 21.4% of its U.S. counterpart. Note that the air
cargo percentage is more than double the overall percentage. In fact, the relative importance is
even higher in terms of the weight. (These estimates are based on The 1993 Commodity
Flow Survey.)
• A Large Number of Issues in Movement of Air Cargo: Twenty seven issues were
identified and briefly described. They were also placed in the context of air cargo operations
or in the context of the interaction between California s air cargo activities and its economy,
transportation systems and environment. Many possible governments roles were also
identified.
• A Multitude of Research Needs: Ten categories of research needs were identified. The first
of the ten categories is to improve the understanding of air cargo operations and planning;
much of this research was motivated by this category of research needs.
2.3 OVERVIEW OF SITE VISITS
To understand the industry of integrated air-express forwarding in California and its needs, we
visited four sites in Northern California and another four sites in Southern California. These eight
sites are:
• Northern California
• Federal Express - East Bay and West Bay Dispatch Centers
• Federal Express - Oakland Regional Hub
• Airborne Express at Mather Airport (Sacramento)
• Oakland International Airport - Airport Air Cargo Operations
• Southern California
• UPS Western Regional Hub at Ontario International Airport
• Los Angeles International Airport - Northwestern Airlines (Cargo Operations)
• Los Angeles International Airport - Nippon Cargo Airlines
• Southern California Logistics Airport (previously George Air Force Base) at
Victorville
To achieve a balanced understanding, we arranged our visits in such a way that all of the
following aspects of the industry can be revealed:
• geographical area: Northern and Southern California
• sector: private vs. public
• type of integrated carrier: integrated vs. non-integrated air cargo carrier
• market segment: domestic vs. international

15
• business origin: air-express vs. ground
Table 3 summarizes the sites visited and the relevant characteristics.
Appendix A contains the planned discussion subjects for the visits. See the Appendices B, C, D,
E, F, G and H for the trip reports.
Major findings will be discussed in the rest of this report. We summarize our findings regarding
the operations of integrated air-express forwarding in the rest of Section 2, i.e., in Section 2.4 and
Section 2.5. Issues and problems faced by the industry as well as possible solutions, some of
which are suggested by some of the managers we visited with, are the subject of Section 3.
Section 4 focuses on the role of ITS in integrated air-express forwarding. Major lessons learned
regarding ITS deployment and intermodal services are the subject of Section 5.
Table 3: Summary of Site Visits
Site GeographicalArea
Sector ForwarderType
MarketSegment
BusinessOrigin
FedExDispatch
Northern Forwarder Integrated Domestic
and Inter.
Air
FedExOakland Hub
Northern Forwarder Integrated Domestic
and Inter.
Air
AirborneSacramento
Northern Forwarder Integrated Domestic
and Inter.
Ground
OaklandInternational
Northern Airport N/A N/A N/A
UPS Ontario Southern Forwarder Integrated Domestic
and Inter.
Ground
LAWA-Northwestern
Southern Forwarder Non-integrated Domestic
and Inter.
Air
LAWA-Nippon Cargo
Southern Forwarder Non-integrated Inter. Only Air
SCLA Southern Airport N/A N/A N/A
2.4 INTEGRATED AIR-EXPRESS FORWARDING
Salient features of the services provided by the integrated air-express forwarders have been
summarized in Section 2.1. This section focuses on the salient features of the operations of
integrated air-express forwarding with respect to the operations of the general air freight industry.
(Some of these features are also service features.) These features provide lessons not only for the
rest of the air freight industry but also for developing intermodal passenger services.

16
Integrators operations can be grouped into two categories - the ground and airport/airspace
operations. Since airspace operations are tightly controlled by command and control located in
airports (and in some cases in off-airport locations), we refer to airport/airspace operations
simply as airport operations. Although usually the two categories of operations are rather
distinct and are under separate command and control, due to the very nature of the integrated air-
express forwarding business, the two are well coordinated.
Among the differences between the two categories of operations is the difference between the
kinds of external disturbances the business is subject to. The airport operations are subject to
airport/airspace congestion, airport curfew and noise regulations, possible preferential treatment
of passenger aircraft over freight aircraft, etc. while the ground operations have to contend with
traffic congestion in surface transportation systems.
Section 2.4.1 summarizes the salient features shared by both the ground and airport/airspace
operations while Sections 2.4.2 and 2.4.3 address the nature and features of the ground and
airport/airspace operations, respectively.
2.4.1 Salient Features of the Operations of Integrated Air-Express Forwarding
Salient features of the operations of integrated air-express forwarding include:
• time-definiteness, whether or not overnight, at an acceptable cost: Time-definiteness refers to
the stipulation of a delivery deadline, beyond which penalty against the forwarder, e.g.,
money-back guarantee, is imposed as part of the service contract.)
• Tightness of the integrators . A tight operation refers to the fact that a short delay of one
task may propagate and cause many downstream tasks to be also delayed, often much more
seriously. For example, if a flight arrives at a destination airport late, the large trucks
transporting the freight to the individual distribution centers for local delivery may as a result
leave the airport late, and may consequently be affected by the onslaught of morning
commute traffic. A short delay may actually lead to a much longer delay if the trucks are
caught in traffic congestion.
• customer satisfaction in the simple forms of timely delivery (via contractual obligation) and
affordable charges (and damage-free delivery): The simplicity is in contrast with the
complexity of gauging the levels of satisfaction of the customers of public-sector
transportation facility providers, e.g., Caltrans.
• timely delivery necessitating efficient transportation (fast yet affordable), which necessitates
close tracking of freight movement
• timely delivery necessitating efficient intermodal transportation, which necessitates close
tracking of freight movement across of all modes involved: Through the close tracking of
freight movement, what has been referred to as freight in-transit visibility is achieved.

17
• efficient (fast yet affordable) intermodal freight transportation and tracking: hot bed for
advanced technologies
• synergistic opportunities and requirements for technology adoption: benefiting both freight
transportation and freight tracking (although tracking efficiency often cited as the main
impetus, perhaps for marketing reasons)
• intensive industrial engineering activities supporting operations and technology adoption
decisions: performance measures and analytical and simulation modeling for predicting
performance improvement
• accountability of performance: The employees are held accountable for the performance of
their operations, not only for the current operational efficiency but also for anticipating
future efficiency issues and for proposing their resolutions.
• continuous incremental improvement due to competition and based on profit reinvestment
• transportation systems - a major source of external disturbances: This is in contrast with the
close monitoring and tight control of operations within the integrators own facilities, e.g., the
sorting operations at a hub.
• integrated, intermodal hub-and-spoke air transportation systems and use of trucks for hauls
between cities to the extent possible.
These features are discussed in more detail in Appendix I. For a historical account for the
development of the U.S. air express industry up to 1990, the reader is referred to [30]. Analla
and Helms [2] provided a brief introduction to the worldwide express small package industry.
2.4.2 Salient Features of the Integrators Ground Operations
Many consider FedEx as an airline, but the cost of ground operations exceeds those of air
operations by 150 percent [36]. Salient features of the integrators ground operations include
the following. The integrators
• monitor closely the performance of truck routes for local delivery;
• monitor closely the performance of drivers and other delivery workers;
• define the operational procedures precisely and clearly for efficiency maximization;
• anticipate external disturbances, most notably the traffic congestion in the airspace and on
the ground, and maintain the ability to counter the disturbances with dynamic and flexible
operations;
• use computer software developed by company R&D staff for off-line route planning but
perform real-time dispatching manually (by human dispatchers and without computer
intelligence);

18
• anticipate possible higher-than-expected demand, e.g., during holiday seasons, and
possible delays;
• analyze options in detail and carefully in expanding or relocating existing facilities (As of
1997, FedEx had approximately 630 primary and 100 secondary distribution stations in
the U.S.. Approximately 100 such stations are relocated, split or consolidated every
year.);
• must coordinate operations spanning not only the more conventional modes of
transportation like aviation and trucking modes but also the walking mode (Delivery truck
drivers spend a significant amount of time inside client buildings, in suburbs as well as in
down areas.);
• adopt technologies to satisfy their concrete and specific needs (For example, to win
competitive edges over their customers, UPS and FedEx announced their plan, within
approximately one month of each other, to provide their customer with instant delivery
information by adopting digital wireless communication technologies between the driver
(not the truck) and the dispatch center.);
• tailor technologies to maximize operational efficiency (For example, in the absence of
driver-to-dispatch wireless communication capability, the driver, upon return to the
delivery truck, simply drops the hand-held scanner into a slot on the dashboard of the
truck, and the information contained in the scanner is transmitted to the dispatch center
automatically. Any key stroke performed by the driver for establishing communication
or for transmitting the information, if required, will cost the company $1.7 million
annually.);
Details of the ground operations and their salient features are provided in Appendix J.
2.4.3 Salient Features of the Integrators Airport Operations
A large portion of the expedited cargo market in the U.S. is served by air transportation.
According to The Colographic Group, a Marietta, Georgia-based research and consulting firm,
35.8 % of the annual 4.66 billion shipments within the U.S. domestic expedited market now is
transported by air (with local pick-up and delivery by truck). The total value of these air
shipments equals 51 percent of the total value of the expedited cargo market: some $ 35.48 billion
out of a 69.56 billion market. Although the majority of the shipments move completely on the
ground, many of them are nevertheless consolidated at and routed through on- or near-airport
facilities.
Salient features of the integrators airport operations include:
• To ensure the availability of aircraft for transporting freight between a hub and a spoke,
one aircraft is typically dedicated to one particular hub-spoke pair. As a result, one
aircraft typically fly one round trip per day between the pair; double-tripping is rare.

19
This is drastically different from the operations of passenger aircraft, whose ground time
is intentionally kept at a minimum. In the passenger airline business, there is a saying
that an aircraft is not making any money when it is on the ground.
• When one or more aircraft of an integrator s fleet is unavailable for scheduled flight
because of unexpected mechanical problems, a spare aircraft located at strategic
locations may be called upon to substitute for the down aircraft. In any event, it may
take hours for a regional hub aircraft schedulers to figure out how to adjust the routine
operations so as to meet the delivery deadlines at minimum cost.
• The integrators not only track the performance of their individual operations; their
employees have to explain why delays occur and how they can be avoided in the future.
• They define the operational procedures precisely and clearly. For example, if the weight
balancing during loading is not properly, the loaded freight may have to be unloaded to
correct earlier mistakes. This will lead to slip of schedule.
• They perform internal audits to ensure adherence to the precisely and clearly defined
procedures in order to minimize rework.
• The sorting operations adopt the state-of-the-art technologies. The operational
conditions of all major machinery are closed monitored, with video camera, on-line
computerized monitoring systems with graphical user interface, or other technologies.
• They closely monitor (a) the containers, (b) the packages and (c) the aircraft, all with
advanced computer and information technologies.
• With their tracking technologies, there is complete electronic linking of packages to
containers to aircraft, trucks/vans, eventually their drivers and other delivery workers, e.g,
foot couriers, and their customers.
Details of the airport operations and their salient features, based on our site visits, are provided
in Appendix K.
2.5 PERFORMANCE MEASURES FOR AIR CARGO OPERATIONS
One of the salient features of the integrators operations is that their customers satisfaction level
can be captured by a small number of metrics. Many internal performance measures have been
developed to link the efficiency of individual operations to these metrics. Through the use of
these internal performance measures and close monitoring of their operational performance (with
the assistance of advanced technologies), they are able to assess their current performance.
Another salient feature is the extensive use of industrial engineering techniques and computer
simulation to suggest and evaluate possible system improvements, in terms of the quality of
service perceived by their customers (i.e., the small number of metrics).
20
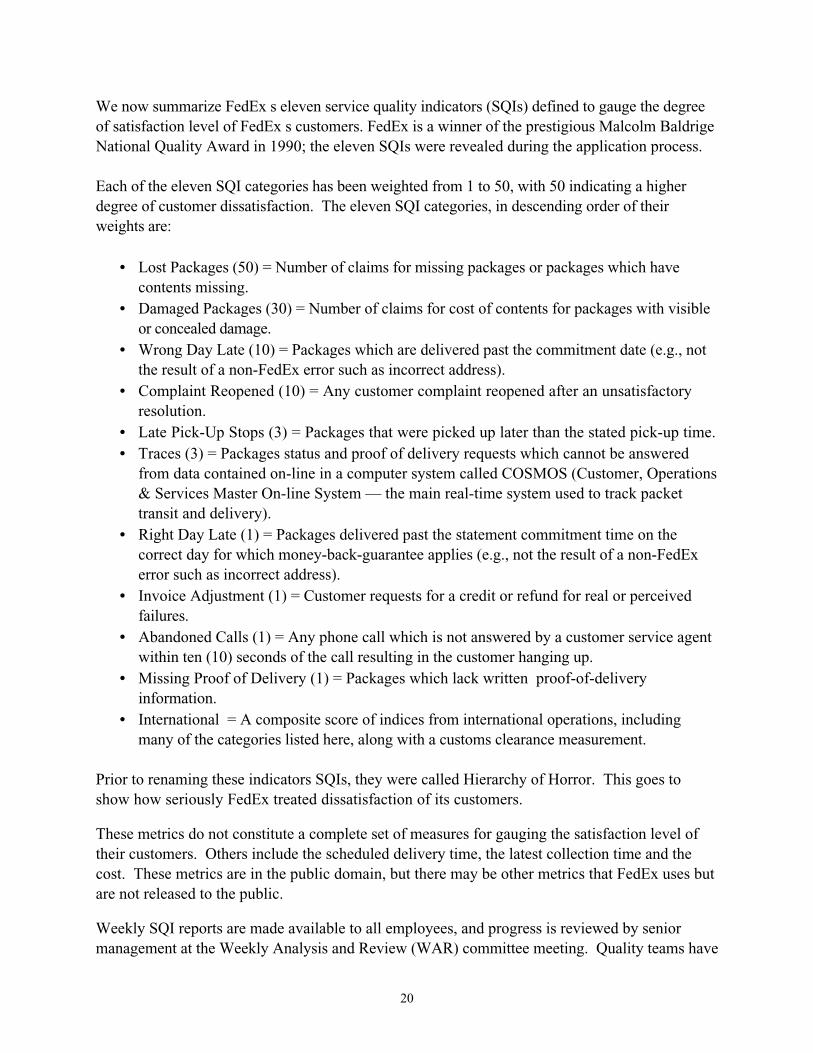
We now summarize FedEx s eleven service quality indicators (SQIs) defined to gauge the degree
of satisfaction level of FedEx s customers. FedEx is a winner of the prestigious Malcolm Baldrige
National Quality Award in 1990; the eleven SQIs were revealed during the application process.
Each of the eleven SQI categories has been weighted from 1 to 50, with 50 indicating a higher
degree of customer dissatisfaction. The eleven SQI categories, in descending order of their
weights are:
• Lost Packages (50) = Number of claims for missing packages or packages which have
contents missing.
• Damaged Packages (30) = Number of claims for cost of contents for packages with visible
or concealed damage.
• Wrong Day Late (10) = Packages which are delivered past the commitment date (e.g., not
the result of a non-FedEx error such as incorrect address).
• Complaint Reopened (10) = Any customer complaint reopened after an unsatisfactory
resolution.
• Late Pick-Up Stops (3) = Packages that were picked up later than the stated pick-up time.
• Traces (3) = Packages status and proof of delivery requests which cannot be answered
from data contained on-line in a computer system called COSMOS (Customer, Operations
& Services Master On-line System — the main real-time system used to track packet
transit and delivery).
• Right Day Late (1) = Packages delivered past the statement commitment time on the
correct day for which money-back-guarantee applies (e.g., not the result of a non-FedEx
error such as incorrect address).
• Invoice Adjustment (1) = Customer requests for a credit or refund for real or perceived
failures.
• Abandoned Calls (1) = Any phone call which is not answered by a customer service agent
within ten (10) seconds of the call resulting in the customer hanging up.
• Missing Proof of Delivery (1) = Packages which lack written proof-of-delivery
information.
• International = A composite score of indices from international operations, including
many of the categories listed here, along with a customs clearance measurement.
Prior to renaming these indicators SQIs, they were called Hierarchy of Horror. This goes to
show how seriously FedEx treated dissatisfaction of its customers. These metrics do not constitute a complete set of measures for gauging the satisfaction level of
their customers. Others include the scheduled delivery time, the latest collection time and the
cost. These metrics are in the public domain, but there may be other metrics that FedEx uses but
are not released to the public. Weekly SQI reports are made available to all employees, and progress is reviewed by senior
management at the Weekly Analysis and Review (WAR) committee meeting. Quality teams have

21
been formed to identify and eliminate root causes for any performance deficiencies or
unsatisfactory trends. The SQI goal-setting process is tied to FedEx s Management by
Objectives (MBO) incentive program.
Many internal performance measures have developed, and, based on these customer-satisfaction
metrics, the corresponding performance goals have been set. The performance measures used by
the integrators to determine the effectiveness of its day-to-day operations include: completion of
time standards for certain tasks (e.g., 27 minutes time standard for unloading a DC-8 at Emery
Worldwide), pieces per person-hour, sort operations at specified times, on-time aircraft
departures, on-time arrivals, and service levels provided to the customer.
Appendix L summarizes a general methodology adopted for developing performance measures, a
set of criteria for performance measure selection, and two different performance perspectives:
integrators perspective on performance of infrastructure providers vs. the perspective of the
customer of the integrators on the integrators performance.
Appendix M provides various performance measures for gauging the performance of the
transportation infrastructure providers in supporting air freight, particularly from the perspective
of the integrators. Appendix N addresses the performance measures of the integrators from the
perspective of the integrators customers.
A primary criterion for selecting performance measures is the measurability with available data.
The adoption of advanced technologies by the integrated forwarders not only helps improving
the efficiency of their operations but also help measure their operational performance.
3. PUBLIC-SECTOR INNOVATION OPPORTUNITIES FOR SOLVING THE
PROBLEMS AND ISSUES FACED BY THE INTEGRATED AIR-EXPRESS
FORWARDERS IN THE STATE
Twenty six operational issues faced by the integrators and other air cargo operators in the U.S.
have been identified and placed in the context of air cargo operators activities in The Role of
Air Cargo in California s Goods Movement [37]. That research attempted to understand the
state s air cargo industry as a whole and puts the state s air cargo industry in the much bigger
context of the nation s air cargo industry and even the world s air cargo industry. The approach
adopted in that study was a top-down one. This research adopts a complementary approach — a
bottom-up approach, which studies the day-to-day operations as well as strategic planning at a
number of key and representative air cargo facilities in California.
Section 3.1 summarizes the issues, problems and possible solutions suggested by the facility
managers that we met with during the site visits. Section 2 discusses other issues and possible
solutions.
3.1 ISSUES, PROBLEMS AND POSSIBLE SOLUTIONS SUGGESTED BY THEOPERATORS

22
In this section, we summarize key issues and needs that were suggested by some managers of the
integrators facilities that we visited. These reflect issues and needs that are on the minds of
those who are charged with the responsibility of not only the current efficiency of the
integrators day-to-day operations but also the efficiency of their future operations.
A primary objective of this study is to investigate how the public sector (state, city, counties or
airports) can assist the air cargo industry in providing more efficient service to California
businesses and the general public. The issues and needs to be summarized in this section could be
promising innovation opportunities for the state s public sector.
Before summarizing the issues and needs, it may be worth pointing out that the severe impact of
capacity shortage at busy (California) airports or nearby terminal airspace on cargo movement
commonly warned about in the literature has not been raised by the managers we visited with.
One reason could be that we have been focusing on the integrators, and that they relied primarily
on their own aircraft for airborne freight movement and the most time-sensitive flights (i.e., those
serving overnight delivery as opposed to those serving two-day or less speedy services) occur
primarily during off-peak hours. Since non-integrators tend to rely on the belly cargo space
aboard passenger aircraft, they may regard airport or airspace congestion as a more serious issue,
currently or in the future.
Although airport or airspace congestion is not regarded as a serious issue by the relevant facility
managers, some managers did complain that the FAA consistently gives higher priority to
passenger flights over cargo flights during flow control prompted by inclement weather or other
flow-reducing events.
The issues and opportunities suggested are:
• Management of Traffic Congestion and Traffic Information
• Traffic congestion and the need for congestion management: Traffic congestion on
freeways and city streets is the number-one concern of the integrators.
• On interstate and state highways: e.g., I-880 in the San Francisco Bay Area. As
mentioned earlier, there exist flights originating from San Jose International
Airport with the final destination of the Oakland International Airport (for
connection to flights out of the latter airport), with the explicit objective of
avoiding the congestion on I-880. Note that I-880 is not considered the freeway
that is experiencing the worst congestion in the San Francisco Bay Area.
• At bridges and railway crossings: We hate bridges. Said the FedEx dispatch
managers we visited with. To avoid the congestion at bridges toll plazas, drivers
of its vans are often accompanied by a fellow FedEx employee so that their travel
across the bridges can be considered a carpool . Note that the fellow employee
serves no other purposes than to meet the carpool requirement.

23
• At or near the access points to the cargo area of airports, e.g., relieving the impact
of a busy train track at the gate of the cargo yard of the Los Angeles International
Airport (trains to and from the busy Port of Long Beach), addressing inadequate
truck parking during peak hours at the same cargo area, etc.
• The possibility of increasing the capacity of some Bay Area freeways by double-
decking (subject to earthquake safety of course): The FedEx dispatch managers of the
San Francisco Bay Area are very concerned about the fast-worsening of the traffic
congestion on the Bay Area s freeways. Knowing the lack of right-of-way for
conventional freeway expansion, they suggested the consideration of double-decking
of freeways.
• The need for traffic information via radio, Internet or specialized traffic providing
services like TravInfo: The FedEx dispatch managers claim that they constantly
monitor the traffic condition and react to non-recurrent congestion accordingly. In the
absence of congestion relief, the next best thing is to obtain accurate and real-time
traffic information. However, in addition to incident information, they need much
more, e.g., information about travel speed and time-till-clearance, etc..
• Fair or Preferential Treatment for Trucks
• The possibility of allowing trucks to use High-Occupancy and Toll (HOT) lanes. If
safety is a concern, then consider use of HOT lanes by at least vans or small trucks
for a fee (to achieve minimum safety concern). When delays to large trucks carrying
freight from an airport to local distribution centers are anticipated (due to either
airspace congestion or traffic congestion on the ground, small trucks and delivery vans
are often sent directly to the airport to pick up the freight for local delivery. The
FedEx managers indicated an interest in using HOT lanes in such and other situations
if HOT lanes are available.
• The possibility of truck-lane designation: The FedEx managers are very curious about
the current status of work on truck-lane designation in the San Francisco Bay Area.
FedEx s large trucks carry large volumes of time-definite freight from airports to local
distribution centers. Delays to their travel can propagate and the effects can multiply.
• Some Creative Solutions
• The possibility of incorporating other means of transportation like fast ferries, barges,
hovercraft along with trucks in the ground portion of the movement of air cargo in
the Bay Area. The FedEx managers expressed strong interest in exploring the
possibility of using hoverdraft to transport air freight directly from its hub in
Oakland International Airport (by the bay) to its distribution centers in the Bay Area
over the Bay water. ( Hovercraft may be much faster than ferries and barges, and
may not require as much infrastructure.)
• The possible use of dedicated cars or space on passenger trains on urban rapid train
systems (like BART) or light rail systems for the ground portion of air cargo

24
movement. This further demonstrates the integrators serious attempts to seek
possible ways for overcoming anticipated impediments to efficient transportation of
their freight.
• Communication between Transportation Infrastructure Providers (and Land-Use
Planners) and Freight Operators/Planners
• Connection of freight operations/planning to city and other land-use planning
processes: benefiting selection of facility location. As mentioned earlier, a significant
proportion of the integrators local distribution centers are relocated, split and
consolidated to react to changes in customer demand, traffic conditions, etc..
Determination of facility locations is a recurrent and critical issue. Communication
between the public-sector planning agencies and the integrators local planners is
critical for the decision-making process.
• The possibility of designating truck corridors to facilitate air cargo operators longer-
term planning functions
Details of these issues and opportunities are provided in Appendix O. The suggestions made by
the managers demonstrate the need of the industry to anticipate future impediments for the
continued success of their industry and to seek all possible ways to remove or avoid the possible
impediments.
We have had some preliminary discussions about the feasibility of the two creative solutions
with BART and the Bay Area Water Transit Task Force. The discussions are summarized also
in Appendix O. In short, BART seems uninterested in providing freight services for several
reasons. However, the Bay Area Water Transit Task Force is very interested in the concept of
transporting freight over the San Francisco Bay.
The managers made other suggestions, but those are beyond the jurisdiction of the state
government, and hence are omitted. For example, they suggested for the FAA to balance the
priority between passenger and freight services in the National Airspace System. They claimed
that currently the FAA gives passenger flights the highest priority in dealing with congestion in
the National Airspace System and suggested the FAA accommodate the needs of the integrators
all-cargo flights during major air traffic congestion.
3.2 OTHER PUBLIC-SECTOR INNOVATION OPPORTUNITIES
• Regional redistribution of air freight (among multiple airports in a region):
Congestion at the Los Angeles International Airport (LAX) and the San Francisco
International Airport (SFO) is expected to worsen rapidly, despite some current expansion
projects. One way to relieve the current congestion and to alleviate future congestion is to
redistribute the cargo activities from the congested airports in a region to those in that same
region that have space to grow.

25
Air freight is carried by three different arrangements and hence are handled by three different
types of operators: integrated air-express forwarders (like FedEx), all-cargo aircraft (like
Nippon Cargo Airlines and Northwest all-cargo aircraft) and passenger aircraft (e.g., the belly
of a passenger aircraft).
Some integrated forwarders have already moved off or at least have already tried to move off
from the congested airports in a region. For example, UPS chose the Ontario International
Airport to serve as its western regional hub, away from the already congested airports in the
Los Angeles metropolitan area. FedEx chose Oakland as its western regional hub.
All-cargo aircraft operators and belly-cargo operators compete with each other for business.
(Some airlines carry cargo in the belly of passenger aircraft and also on their all-cargo aircraft,
e.g., United and Northwest.) Since the belly-operators rely on passenger aircraft for their
cargo operations, the issue of cargo redistribution cannot be tackled alone. In fact, the belly
cargo business is by and large secondary to its passenger counterpart, and the freight capacity
of the belly of an aircraft (subject to availability after the higher priority items like passenger
luggage has been loaded) is a revenue generator. As long as there is belly-capacity, the cost is
competitive with respect to what the integrators or trucking companies charge, and the
congestion at the airport is not too severe, the space will be used. Therefore, the
redistribution issue must be resolved in the larger context of passenger traffic.
All-cargo flights do not have to go where passengers want to go, and hence have more
flexibility in their destinations. However, they must have enough business at the alternative
(less-busy) airport in the region. The migration problem may involve a chicken-and-egg
problem, and hence could be difficult to solve. But, efficient connectivity among regional
airports through non-air modes may help the migration. With such efficient connectivity,
belly cargo arriving at a busy airport can be efficiently transferred to all-cargo flights at the
alternative airport and vice versa. This will help build up demand for the use of the
alternative airport, and help solve the chicken-and-egg problem. Such problems may be
solved for the Los Angeles Metropolitan Area as well as the San Francisco Metropolitan
Area, where busy international gateway airports like Los Angeles International Airport and
San Francisco International Airport may seek to move some of their freight traffic to other
airports in the region, if efficient freight connectivity exists. For the case of San Francisco
Bay Area, such a possible efficient freight connectivity among the three major international
airports in the region may be feasible if a fast water freight-transportation system can be
built. In fact, according to Ron Cowan of Bay Area Water Transit Initiative, he proposed
such a system concept two years ago, as part of an overall passenger-freight transportation
system over the San Francisco Bay.
This could be an opportunity for realizing regional redistribution for air cargo. One additional
issue to deal with is the participation by forwarders in the redistribution. This is because a
vast majority of the cargo carried on passenger aircraft or on all-cargo flights operated by non-

26
integrated air freight forwarders is fed by freight forwarders, and their operations would need
to adapt to the redistributed freight flows.
• Participate in the feasibility study, authorization, and planning of passenger andfreight transportation over the San Francisco Bay. (This actually helps with theabove.)
Severe traffic congestion on the Bay Area freeways is well known. It is particularly
detrimental to the integrated air-express industry. In fact, there exist flights originating in San
Jose International Airport with Oakland International Airport as the final destination, simply
to avoid the traffic congestion on Interstate 880. During our discussion with the top two
managers in charge of dispatching FedEx delivery trucks in the Bay Area, they indicated that
they heard of the concept of using hovercraft in the Bay to transport freight and were
curious about its current status. They also expressed interest in pursuing this and other
creative solutions to deal with the fast worsening traffic congestion. With such hovercraft
or fast boats transporting freight between the Oakland Regional Hub and 20 local distribution
centers in the bay Area , FedEx could, according to the two managers, avoid much of the
traffic congestion on Bay Area freeways and perhaps more importantly the area bridges.
This concept actually complements the concept of connecting efficiently major airports in the
San Francisco Bay Area for the purpose of redistribution of cargo activities, as summarized
above.
Given the fast worsening traffic congestion in the San Francisco Bay Area, the creation of a
completely new mode of freight transportation holds much potential for more efficient goods
movement in the bay Area. The effect of traffic congestion on FedEx s operations can be
revealed somewhat from the following example. FedEx s large trucks (called CTVs) begin to
leave the Oakland International Airport at around 1:00 AM and continue until early morning.
Currently, the last departure of CTVs is scheduled at 6:30 AM. If the actual departure time
is beyond 6:30, adjustments to regular routes must be made. If the actual departure time is
beyond 6:50, the current staffing may have trouble handling the regular traffic without
sacrificing the service quality. It is estimated that, if the actual departure time is later than
7:10 AM, 11 routes will need to be added to each station that is affected due to the extra
travel time caused by traffic congestion. It is also estimated that, in such a case, 8 stations
will be affected. Since each route is staffed by one driver and equipped with one dedicated
truck, approximately 90 drivers and trucks will be required. Note that what really matters is
the arrival times of the large trucks at the 20 distribution centers. The arrivals of the large
trucks may be late due to congestion on the freeways even though their departures from the
airport ramps were on time.
Caltrans is in the unique position to proactively participate in the feasibility study of a water
transportation system that accommodates both passenger and freight.

27
Note that fast boats and hovercraft involve advanced technologies and can be viewed as a
component of the Intelligent Transportation Systems.
FedEx managers would also like to explore the possibility of using Bay Area Rapid Transit
(BART) cars to transport time-definite freight. However, our initial contact with BART
officials seems to indicate that this idea may not be very practical because (i) the system was
created with a charter to serve only passengers and hence (ii) the system was designed to
serve only passengers, making accommodating freight transportation difficult from both the
technical as well as political perspectives. This seems to indicate the importance of
considering freight at the outset of the political and technical processes leading to the
implementation of a new transportation system like the freight/passenger transportation
system over the San Francisco Bay. From the pure political point of view, offering much
needed support for the authorization of the Bay Area Water Transit Authority at this point
in time may earn much more influence regarding implementation of intermodal freight
transportation in the Bay Area than otherwise.
Currently, more than a dozen passenger ferries serve the San Francisco Bay Area, and are
operated by a variety of public and private organizations. More than half of these ferries use
high-speed (up to 34 knots) boats, with capacity of 250 to 400 passengers. Bay Area
Council [5] reports about the commuter ferry lines (excluding tour ferry routes) that
Berthing capacity, however, is limited, with only 14 locations available, and connections to
mass transit also are limited. Current research on utilizing the Bay for transportation is
conducted primarily by two organizations. The Metropolitan Transportation Commission
(MTC), which is currently responsible for administering ferry routes, called for expansion of
current services by adding five new vessels but recommended that adding new ferry services
be a lower priority than other improvements to the system [33]. Bay Area Council (BAC)
promotes a bolder vision, calling for a world-class system of 125 high-speed and cargo ferries
with 42 terminals, including airport and cargo facilities. However, the BAC proposal seems
to give little consideration to air pollution [19].
Both fast ferryboat and its air pollution mitigation involve advanced transportation
technologies. Facility locations and operations of the services may also be worthy subjects
of research for Caltrans. The ferry expansion proposed for the San Francisco Bay Area
receives much attention in the ferry community. Farrell and Corbett [19] stated that The
Bay Area is the site of the highest-stake debate on ferry system expansion in the country, a
debate that is framing many of the most important research questions.
• Others. Many innovation possibilities exist. In addition to those addressed earlier in this
report, new concepts continue to emerge, e.g., allowing zero-emission freight vehicles to use
the HOV lanes. Other possible opportunities include feasibility and impact studies of
carrying freight on the proposed high-speed trains in California.

28
4. THE ROLE OF ITS AND ADVANCED TECHNOLOGIES IN THE AIR
CARGO INDUSTRY
As pointed out earlier, although the air freight industry is a hot bed for technological adoption,
the industry adopts technologies to satisfy their specific needs and does not adopt some other
technologies for clear reasons. Some of the technologies that the industry has adopted happen to
be ITS technologies. It seems that ITS technologies have been adopted not because of the
promotion of the ITS community but resulting from the industry s drive to improve its
operational efficiency for market expansion or for competition.
Take the Automatic Vehicle Location (AVL) technology for example. Since the drivers of
delivery trucks as well as the dispatchers are very familiar with their delivery areas and the
drivers maintain frequent communication with the dispatchers (at least every time after returning
to the truck from a delivery), the location of a truck is either known approximately or can be
found out easily with the existing communication capability between the truck driver and the
dispatcher. Therefore, AVL has not been adopted to help improve he efficiency of local delivery.
(But, it has been adopted for tracking long-haul trucking.) This may change in the future if the
real-time routing capability of FedEx s Courier Route Planner (CRP) system can be further
developed to satisfy the real-time needs of the dispatchers and gain their acceptance because
AVL is likely the only viable source of real-time information for that capability.
This section attempts to summarize and organize several high-impacting advanced technologies
for the air freight industry. Technologies like bar-coding are no longer considered as advanced, at
least not for the purpose of this report. Communication technologies are a well-known category
of high-impacting technologies. We will briefly mention them and refer the reader to Appendix P
and reports that are easily obtainable, but will not address them in detail. We will discuss those
technologies and their applications that are not well-known to those outside of the industry of
integrated air-express forwarding.
In particular, we discuss automatic identification, communication, vehicle positioning and
Geographical Information System (GIS) technologies in Section 4.1. The air cargo industry has
benefited much and can benefit much more from the internet. The industry has also begun to
implement robotics technology to improve their sorting operations at hubs. The implementation
of these technologies is at its initial stages, and the true impact of their implementation cannot be
evaluated at this point. We will discuss these efforts and their possible future roles in the air
freight industry in Section 4.2. Section 4.3 addresses possible government roles in future
deployment of ITS technologies.
4.1 CURRENT SUCCESS STORIES OF ITS TECHNOLOGIES IN AIR CARGO
Many technologies have been successfully adopted by the industry of integrated air-express
forwarding. We focus on those related to the Commercial Vehicle Operations (CVO), i.e., those
related to the efficient movement of trucks carrying air cargo. Some non-ITS technologies that

29
will likely have a high impact on the industry s operational efficiency will be discussed in Section
4.2.
Fast delivery together with affordability necessitate efficient transportation of freight. To ensure
that an item will be delivered on time, the location of the item in the whole delivery system must
be precisely and accurately tracked. This necessitates efficient identification of individual freight
items, individual containers and individual vehicles. We discuss automatic identification
technologies in Section 4.1.1.
In addition to the automatic identification technologies, automatic positioning technologies are
required for real-time tracking of individual freight items, containers and vehicles. Automatic
positioning is usually enabled by communication technologies. When a freight item is picked up
from a customer site or is dropped off by a customer, it needs to be entered into the integrator s
computer tracking system through communication technologies so that the demand on the
system s resources, in terms of origin, destination and other critical attributes of the item, can be
precisely and accurately assessed. Moreover, without such freight tracking, the integrators
cannot determine if the transportation of a particular item needs to be expedited or not. Such
expedition is particularly important when the integrators operations experience unplanned
disturbance. Section 4.1.2 discusses communication and automatic positioning technologies.
Tracking of freight items, containers and vehicles is critical but passive in the sense that it does
not provide guidance as to what to do with individual freight items, containers or vehicles. Such
guidance can be provided by automatic routing and scheduling, which can be performed
efficiently with geographical information systems (GIS). Section 4.1.3 discusses GIS
technologies and their applications to automatic truck routing and scheduling. All the
technologies to be discussed in this Section (Section 4.1) have been successfully implemented in
integrated air-express forwarding. Moreover, these technologies have been trickling down to non-
integrated freight forwarding business.
4.1.1 Automatic Identification Technologies
Automatic Identification of Freight Items: Bar Codes
One-dimensional bar codes consist of an array of parallel narrow rectangular bars and spaces that
represent single characters in a particular symbology and are arranged in a particular order as
defined in the symbology. Bar codes are printed, scanned, decoded and transferred to a host
computer. The technology relieves the user of the tedious and error-prone task of reading a label
and transcribing the information manually onto a form or key-entering it into a computer. One-
dimensional bar codes are extensively used in transportation for identifying equipment.
Two dimensional bar codes carry larger amounts of data and can be used for personal
identification (e.g. photograph) or a bill of lading. Other forms of two-dimensional bar codes are
used by express shippers for high speed sorting of small packages.
Automated Vehicle Identification (AVI)

30
An AVI system is an electronic system that enables the identification of a vehicle through the use
of a reader system and a transponder tag mounted on the vehicle. Automatic vehicle identification
is becoming a popular system for both commercial vehicle operators, including air cargo
operators, and for electronic toll collection.
Automatic Equipment Identification (AEI), Including Automatic Container Identification
Automatic equipment identification is very similar in technology and operations to automatic
vehicle identification (AVI). As with vehicle identification, this system utilizes an on-board
transponder that communicates with a roadside or station receiver. Where an AVI system may be
used for toll-collection or for expediting the processing of paperwork, an AEI system will be
used primarily for a check of a container s contents and for the establishment of a real-time
inventory system.
An AEI system used in conjunction with a geographic information system of the terminal, e.g., a
sorting facility of an integrator, would allow for real-time determination of a container’s location.
An inventory clerk in a mobile inventory vehicle would be able to send out a radio query that
would enable the container to be located on the facility.
4.1.2 Communication and Positioning Technologies
Equipment (Container) Positioning System: Radio Frequency (RF) technology
Automated equipment identification (AEI) relies on radio signals between passive tags mounted on
the equipment and active interrogators. The technology was first marketed in the mid-1980’s and
has been used extensively in warehousing and manufacturing applications. With improved
reliability, durability and effectiveness, it has gained acceptance at terminals to manage traffic
flow through gates and to track yard equipment for improved cycle time and productivity, and is
now widely used in airports, seaports and rail terminals.
Vehicle Positioning Systems: Automatic Vehicle Location (AVL)
As will become clear later, a primary source of disturbance to the integrators operations is the
variability of the level of service in the transportation systems, either in the air or on the ground.
Another major source of variability is the demand. Numerous routing decisions and scheduling
decisions are routinely made real-time to accommodate such variability and to ensure fast and on-
time delivery. Critical input to the decision-making processes include the precise and accurate
locations of the vehicles involved.
An automatic vehicle location system is an electronic system that delivers real-time vehicle
positioning and monitoring of individual vehicles. This system allows drivers, dispatchers,
shippers and receivers to track a truck continuously from pickup to delivery. The two major
AVL technologies on the market today, dead reckoning and communication determination

31
systems, can locate a truck within one hundred feet. Dead reckoning AVL uses a magnetic
compass and wheel odometers to track distance and direction from a known stating point.
Communication-determination AVL systems use either radio towers or satellite communications.
In a tower system, the vehicle’s position is determined by using multilateration of the radio
signals. The satellite system is similar in operation but has a much greater range. In some systems
the vehicle transmits its location back to a control center by using inertial or dead-reckoning
systems. Most AVL systems plot the truck s path and current location against an electronic
road map displayed on a video screen in the truck cab.
Because communication between the dispatchers and the deliver-truck drivers is frequent, there is
no need for vehicle positioning technologies like Automatic Vehicle Location (AVL) technology.
However, such technologies are useful for tracking the location of a long-haul truck. For example,
FedEx uses AVL technology to track the long-haul trucks it hires for transporting freight between
cities, for the purpose of ascertaining whether the hired trucks could safely achieve the contract
agreements.
Communications Systems: Four Major Technologies For Freight Transportation
Communication technologies enable not only automatic vehicle tracking but also many other
important functions. The following four technologies provide the motor carrier industry with a
range of commercial services that did not exist a decade ago:
• mobile satellite communications,
• networked mobile radio,
• cellular telephones, and
• electronic data interchange.
The first three involve mobile communication while the last one is also used for communication
between stationary parties. It should not be not surprising that electronic data interchange has
been extensively used for decades.
Mobile satellite communications now cover North America. Although most satellite services
provide digital data transmission only, voice services are coming onto the market, giving long-haul
carriers another communications option. The transmission of freight tracking information
involves advanced communication technologies, particularly wireless communication. Wireless
communication through satellite between the dispatchers and the drivers has been used by some
integrated forwarders, e.g., FedEx, for many years, and has just been explored by some others,
e.g., Airborne Express.
Networked mobile radio and cellular telephone likewise have extended coverage for local and
regional fleets. Conventional two-way land mobile radio has limited range, typically about 40
miles, and is heavily over-subscribed in metropolitan areas. However, by sharing frequencies and
32
networking transmission towers by telephone lines, mobile radio services now provide
metropolitan and corridor coverage for over 30 percent of the United States.
Cellular telephone companies provide similar coverage. Cells, each covering an area with a radius of
about 16 miles, are interconnected by a central switching station that automatically reroutes calls
as trucks move from cell to cell within the system. The capacity of mobile radio and cellular
telephone services will increase, and the cost will decrease sharply over the next decade.
A recent survey of approximately 700 motor carriers, including both for-hire and private fleets,
found that about half of the surveyed fleets were using mobile communications systems. These
systems included conventional two-way radio, digital text communications, wide-area pagers, and
satellite communication links. Proportions of fleets having adopted these technologies were
similar among local, regional, and national carriers; and between for-hire carriers and private fleets.
Electronic Data Interchange (EDI) has been the key to computer-to-computer communications. EDI
standards define the sequence and format for packaging and transmitting data, making it possible
for shippers and carriers to exchange bills of lading, invoices, and other business documents
electronically. EDI has a significant contribution to efficient customs clearance for imports and
exports via air freight. Typically, import/export declaration information arrives at the port
customs agency well before the arrival of the actual freight with the help of EDI so that the
paperwork can be completed by the time the freight actually arrives.
Unique Communications Requirements for the Integrators and Recent Innovations
The very nature of integrated air-express forwarding involves multi-modal transportation, and the
modes include air transportation, trucking and walking. Note that a significant amount of
delivery in the downtown of a metropolitan area is made on foot. Even for delivery in suburban
business parks, the driver of a delivery vehicle spends a significant amount of time delivering
packages inside buildings and hence is away from the communication devices installed on the
vehicle. This actually plays a significant role in the integrators technology requirements and
adoption. The need of the dispatchers to communicate with foot-couriers motivated their
adoption of hand-held wireless digital communication device, which can function in the absence
of a vehicle.
Recently, UPS decided to equip its delivery drivers with hand-held scanners with wireless
communication capability so that they can notify the tracking system of a completed delivery a
few seconds after the delivery. Before the deployment of the capability, the customer could get
the delivery confirmation information on average approximately 30 minutes after the delivery.
FedEx announced a similar plan shortly after the UPS announcement. These companies attempt
to use the technology as an competitive edge. This wireless communication enables direct
communication between the dispatchers and the drivers, not only the trucks.
Advanced communication and positioning technologies and their impact on the freight industry as
a whole, not just the air freight industry, have also received much research attention recently.
The reader is referred to [35] for a detailed discussion. Garrison, when asked by the authors of
this report about which of the promising technologies summarized in his report [35] had

33
eventually been successfully deployed so far in the general freight industry, indicated that all of
them had been. One exception could be the Iridium system advanced by Motorola, although it
may still be a viable technology.
The most accurate AVL technology consists of Global Position System (GPS) and Geographical
Information Systems (GIS). Although the vast majority of integrators trucks are used for local
delivery and do not need AVL technologies, GIS is actually being used routinely by some
integrators to construct their local delivery routes. We discuss this use of GIS in the next
subsection.
4.1.3 Geographical Information Systems (GIS)
A Geographical Information System (GIS) is a computer system capable of efficiently storing,
retrieving and displaying a set of points, lines and polygons that together provide a geographical
representation of places on the earth s surface. Functions typically found in a GIS system
include geocoding, address matching, street labeling, edge matching, spatial querying capabilities
and limited optimization functions (e.g., shortest path search, etc.).
Availability of fast and powerful computer together with the availability of geographical data
triggered the recent growth in GIS systems. During the 1990 census, the U.S. census Bureau
developed the Topologically Integrated Geographic Encoding and Referencing (TIGER) files,
which captured 14 million street segments and significantly more information about these
segments. That effort spawned several private companies like Navigation technologies
(NavTech), GDT and Etak, which have been enhancing the TIGER files and keeping the data
current for several years.
As of 1997, GIS applications at FedEx include: Courier Route Planner (CRP), Facility Location
Model (FLM) and Pick-up And Routing Assisted Dispatch Information SystEm (PARADISE).
More applications would be explored.
A station at FedEd is a location where couriers begin and end their pick-up and delivery routes.
Each station serves an area consisting of a set of USPS 5-digit ZIP codes. The station manager,
working with industrial engineers, is responsible for constructing delivery and pick-up routes that
cover the service area at minimal cost. In recent years, the integrators have introduced many new
services of different grades, and route optimization has become more and more complex. CRP
was developed to provide FedEx station operations with a GIS tool to help optimally and
efficiently (a) restructure courier routes and (b) manage daily volume fluctuations. Prior to the
availability of CRP at FedEx, region-wide route restructuring was required every three years to
accommodate changes in the demand and the operating environment, but had been a very labor-
intensive effort. CRP reduced the effort from three weeks to three days; the ease of such
restructuring enabled FedEx to more dynamically restructure its routes more often and improve
its operational efficiency.

34
As of 1997, FedEx had 630 primary and 100 secondary stations in the U.S.. Approximately 100
stations are relocated, atomized or consolidated every year, and there FedEx must optimize its
station locations. Facility Location Model (FLM) had been developed, based on GIS and
optimization techniques. Pick-up And Routing Assisted Dispatch Information SystEm
(PARADISE) had also been developed to display real-time pick-up stops against a geographic
display for use in U.S. dispatch operations and to perform intelligent pick-up assignments taking
advantage of all available spatial information. As mentioned earlier, the dispatchers we visited
with indicated that they do not use PARADISE for real-time dispatching because real-time
adjustments are mostly due to unexpected changes in the operating environment, e.g., non-
recurrent traffic delay or unexpected volume and location of demand, and such changes are
difficult to anticipate and be programmed into CRP. Human adaptability and flexibility tends to
be best suited for the resolution of such situations.
Real-time routing and dispatching software solves two of the motor carrier’s most time-
consuming and difficult operational problems: (a) connecting pickup and delivery points to
minimize the time and cost in routing trucks through them and (b) matching the assignment of
freight and drivers to trucks to minimize cost. With automatic positioning technologies and the
GIS technologies, real-time routing and scheduling can be automated. Its effectiveness is yet to
be demonstrated in the future. This leads to the discussion of possible future role of ITS in the
next subsection, i.e., Section 4.2.
4.2 POSSIBLE FUTURE ROLES OF ITS AND OTHER ADVANCED TECHNOLOGIESIN INTEGRATED AIR-EXPRESS FORWARDING
Most of the issues and public-sector innovation opportunities we identified through discussions
with air cargo managers in California have to do with traffic congestion on the surface
transportation systems. Details can be found in Appendix O. Section 4.2.1 addresses possible
future roles of ITS technologies in improving the efficiency of integrators operations.
The recent surge in popularity of internet and e-commerce is expected to have a fundamental
impact on air cargo. The integrated air-express forwarding industry has already heavily used the
internet for its customers to obtain information regarding the forwarders services and perhaps
more importantly the status of delivery. The non-integrated segment of the air cargo industry
has recently begun to use internet to enhance their operations, particularly to compete with
integrated air-express forwarders. Section 4.2.2 discusses e-commerce and internet and its impact
on the air cargo industry. Section 4.2.3 briefly summarizes a recent effort by UPS to modernize
its hub operations through the robotics technologies.
4.2.1 Possible Future Roles of ITS in Integrated Air-Express Forwarding
Each and every piece of freight carried by the integrated air-express forwarders has a deadline,
owing to the very nature of the business. Although the industry has employed state-of-the-art

35
technologies to improve their operations within their own facilities, e.g., sorting and freight
tracking, the transportation systems, either the surface or airspace systems, are the primary
source of disturbances to their operations. Although the travel time varies, the deadlines remain
the same.
Recall that the first salient feature of the industry as stated in Section 2.4.1 is time-definiteness
at an acceptable cost. To ensure time-definiteness at an acceptable cost, the industry needs
travel-time reliability and seeks to curtail growth in travel time. Therefore, it is not surprising
that the industry cares perhaps more than any other industry about obtaining precise and
accurate traffic information, about congestion relief, and about alternative modes of urban freight
transportation to improve travel-time reliability and to curtail travel-time growth. We address
these three aspects as follows:
• Obtaining Precise and Accurate Traffic Information
• direct user: The direct user is not the driver but the dispatcher, because the
information is only one of multiple inputs to the routing and scheduling tasks of
dispatchers. Also, human interface is with dispatchers, not drivers. The first point is
explained further as follows. The primary customer is the dispatcher, not the driver,
but traffic ISPs (traffic information service providers) tend to focus on in-vehicle
systems as the primary product. The drivers need to and do keep constant
communication with their dispatchers to accommodate unscheduled pick-ups and to
dynamically react to unexpected situations. Therefore, it is the job of the dispatchers
to determine the routes and to coordinate among the drivers. Traffic information is
only one input to the dispatching and routing/scheduling process. In short, what the
driver needs is dispatch guidance, not just route guidance. Currently, at least in the SF
Bay Area, dispatchers of FedEx do not use computer tools for real-time dispatching,
although such tools (with unspecified capabilities) are provided by the FedEx
headquarters (industrial engineering and operations research group). Real-time route
guidance requires real-time traffic conditions, including not just the accident/incident
information but also the speed and travel time data. Integration of the real-time
information into FedEx real-time route guidance computer tools requires cooperation
between the public-sector and the tools developers at FedEx headquarters, directly or
via the information service providers.
• geographical scope: not only freeways and bridges but also arterials, to facilitate local
delivery
• information delivery: real-time
• information contents: incident, time till incident clearance, travel time, speed, even
short-term forecasts
• receiver of automated information transfer: dispatch software (Currently, dispatchers
do not use company-provided real-time routing-scheduling software to deal with
traffic incident and other unplanned activities, e.g., breakdown of delivery vehicles.)
• Reduction of Travel Time and Congestion Relief on Highways and Arterials or Near
Terminals

36
• Electronic Toll Collection (ETC): The dispatchers are anxious about its wide-spread
implementation.
• High Occupancy and Toll (HOT) lanes to deal with recurrent congestion as well as
non-recurrent congestion: HOT lanes may be considered and used by the industry as
express lane at least to make up lost time during non-recurrent congestion. Note that
it is a common practice of an integrator to put an employee on a delivery van or light
truck as the passenger so as to be qualified to use HOV lanes.
• Freeway Capacity Expansion: Unlike passenger transportation where public transit
has been regarded by some a better (or even the only) solution than capacity
expansion against highway congestion, there is no equivalent of public transit for
goods movement. Capacity expansion is regarded as the only solution for efficient
goods movement on highways. Double-decking was suggested by top FedEx dispatch
managers, subject to seismic considerations of course.
• Truck Lanes: HOV lanes provide incentive for solo automobile drivers to carpool
because it reduces travel time; they have the potential of reducing automobile traffic in
congested areas. However, to make deliveries with the same deadlines in midst of
more congested highways and arterials, more trucks are needed, and the higher volume
of truck traffic creates more congestion. This is a vicious cycle. Provision of trucks
lanes may also help induce higher freight occupancy.
• Others: traffic flow management near airports, e.g., the busy rail line crossing the main
and only entrance to the cargo area of the Los Angeles International Airport,
inadequate parking space for trucks at Los Angeles International Airport, etc.
• More Forward-looking Solutions: e.g., automated highway systems for trucks
• Alternative modes of urban freight transportation
• Water Transportation over the San Francisco Bay: speed boats, hovercraft or fast
barges and ferries.
• Urban Rail Transit: BART, light-rail,
• Other Modes: Helicopters have been used in New York City to transport urgent
freight from the region s airports to areas in the city with heavy traffic congestion.
Tiltrotor may be useful for avoiding the mode change between a winged aircraft and
a helicopter.
4.2.2 Internet And E-Commerce
E-commerce is by no means a recent phenomenon, although the term has been coined or at least
has become a popular term recently. This section (Section 4.2.2) seeks to provide an
understanding of the concept of e-commerce, group e-commerce activities into several categories
and identify those categories that have already impacted or are likely to impact the air freight
industry, and finally discuss the current or future impact.
E-commerce has been regarded by many as a revolution. It has occurred so rapidly that few
public-domain data sources exist that can be used to gauge its existing impact on the air freight

37
industry. Moreover, many expect that the revolution will continue to occur very rapidly. This
makes any sort of prediction a difficult task. We focus on qualitative understanding of e-
commerce, rather than quantitative, and its impact.
By all accounts, e-commerce must have a significant impact on the integrators business.
However, a quantitative analysis of the impact requires proprietary data or integrators reports
released to the public domain. In the absence of both at this point, we focus our discussion on
the impact of e-commerce on the non-integrators. Rather than quantitative analysis, we focus on
how e-commerce has impacted their operations. This operational focus is consistent with the
theme of this research. Although the focus of this research is on the integrators, it would be
desirable to also study the efficiency-improvement and technology-deployment activities
considered most important by the non-integrators. E-commerce is clearly one such activity, if
not the most important considered by the non-integrators.
Section 4.2.1.1 explores potential impact of e-commerce and internet on the society as a whole
and the air freight industry. Section 4.2.1.2 summarizes how the non-integrators have been
attempting to improve their operational efficiency with e-commerce. Appendix Q explores
briefly the concept of e-commerce.
4.2.2.1 The Impact of E-Commerce
The excerpt from An Introduction to Electronic Commerce published by the European
Commission [17] describes the general potential impact of e-commerce quite eloquently:
The impact of electronic commerce will be pervasive, both on companies and on
society as a whole. For those companies that fully exploit it’s potential, electronic
commerce offers the possibility of breakpoint changes - changes that so radically
alter customer expectations that they re-define the market or create entirely new
markets. All other companies, including those that try to ignore the new
technologies, will then be impacted by these changes in markets and customer
expectations. Equally, individual members of society will be presented with
entirely new ways of purchasing goods, accessing information and services, and
interacting with branches of government. Choice will be greatly extended, and
restrictions of geography and time eliminated. The overall impact on lifestyle
could well be comparable to, say, that of the growth in car ownership or the
spread of the telephone.
The potential impact of e-commerce on freight transportation can be partially assessed through
its impact on the business supply chain. The following excerpt from the same source describes
The potential of e-commerce to shorten or eradicate supply chains / rapid response to needs :
Electronic commerce often allows traditional supply chains to be shortened
dramatically. There are many established examples where goods are shipped

38
directly from the manufacturer to the end consumer, by-passing the traditional
staging posts of wholesaler’s warehouse, retailer’s warehouse and retail outlet.
(Typically the contribution of electronic commerce is not in making such direct
distribution feasible - since it could also be achieved using paper catalogues and
telephone or postal ordering - but rather in making it practical in terms of both
cost and time delays.)
The extreme example arises in the case of products and services that can be
delivered electronically, when the supply chain can be eradicated entirely. This
has massive implications for the entertainment industries (film, video, music,
magazines, newspapers), for the information and "edutainment" industries
(including all forms of publishing), and for companies concerned with the
development and distribution of computer software.
At this point, there seems to exist little credible data on the impact of E-commerce on freight
transportation. There exist some demographic data about internet users. Rosenbaum [34] of
Indiana University offers an on-line course on electronic commerce and has gathered some data on
internet demographics.
CommerceNet.com (or, equivalently commerce.net) and Nielson Media Research conducted an
internet user survey and published on-line some concrete results about top internet purchasing
categories. The survey defines shopping as researching and comparing the price and features of
products and services online, regardless whether or not an actual online purchase was made.
However, online purchase is defined as a complete financial transaction performed electronically
over the internet. They estimated that 55 million people on-line; 28 million people make
purchases online. Of the 28 million online purchasers, 9 million purchase online at least once a
month, and 1 million purchase at least once a week.
The top shopping categories are: cars and car parts (18.2 million), books (12.6 M), computers
(12.4 M), clothing (11.6 M), CD s and videos (11.4 M). The top purchasing categories are
books (9.2 M), CD s and videos (7.2 M), computers (5.4 M), clothing (4.5 M), software (4.0
M). Note that most of these involve small packages. Therefore, integrators are natural
transportation providers, and air freight is a good candidate for the transportation.
4.2.2.2 Non-integrators and E-Commerce
By its very nature, air freight involves intermodal transportation. However, based on our study
of the integrators operations, it seems that what makes efficient intermodal air-freight movement
difficult is not the intermodal nature of air freight, but the inter-company or inter-institution
nature. (The same perhaps can be said of the intermodal passenger transportation services.) Both
integrated and non-integrated air freight carriers transport freight across different modes but the
integrators do it with higher efficiency. The coordination required for efficient intermodal
operations can be achieved more easily if all the required operations are managed under one
company or one institution.

39
4.2.2.2.1 Impact on Forwarders
The integrators have attracted much of their business from the non-integrators [40], and the non-
integrators have been trying diligently to improve their operational efficiency and tracking
systems. The integrators have established long ago and used all along their own private
telecommunications/computer networks to improve their operational efficiency, including freight
transportation and status tracking. In response to the popularity of the internet, they have used
it to facilitate their customers access to their tracking information system.
The non-integrators are fighting back by learning from their integrator counterparts. They have
begun to use Electronic Data Interchange (EDI) through private networks to facilitate the
efficiency of their operations as well as to track the movement of their freight. Due to the very
nature of their being not integrated, many issues and concerns remain [7]. However, they now
have the internet on their side because using internet is much less expensive than using private
networks. They have also begun to use internet for their customers to track the status of their
freight.
Perhaps due to the unprecedented threat to their business and perhaps also due to unprecedented
opportunities in their fight for survival offered by the internet, non-integrator participants of two
recent conferences on e-commerce and air freight have expressed much enthusiasm about the use
of EDI and particularly the internet to improve their operations (First Conferences Ltd., 1999).
Although the scope of the two conferences spans all modes and spans the public and private
sectors, most presentations and the panel discussions seem applicable to the air freight industry.
A major issue regarding ubiquitous EDI capability, which is based on private telecommunication
networks, across all non-integrator companies involved in the shipment of air freight is that some
of the companies are very small and cannot afford the technologies.
Another major issue is that, among those companies that have been using EDI technologies, use
of different vendor application software (e.g., SAP, PeopleSoft, Microsoft, etc.) and companion
lack of standards makes data exchange among these companies difficult. However, software that
resolves the differences is being developed, and efforts to create standards are underway.
Yet another issue is the difference in communications protocols used by different vendors, e.g.,
TCP/IP, Sync 32.70, SNA, X25, etc.. Supporting interface between proprietary interfaces is
possible but is extremely expensive.
These problems associated with conducting EDI over private networks and the availability of the
internet led to exploration of the internet as the primary medium for EDI. A group of
representatives from several different major vendors (including SUN Micro, IBM, Microsoft,
etc.) has been working together since Nov. 1999 to build a new public-domain web-based
standard in 15 months, based on the existing vendor products of Edifact and XML. XML has
been developed by Microsoft to facilitate the recognition of and search for information from a

40
wide range of databases. Because of the uniqueness of the freight industry, a new standard
tcXML (transport and commerce XML) has been called for by some freight experts to facilitate
the freight-forwarding business, particularly the non-integrated part of the business.
Note that this standard is developed for the internet, rather than for the more expensive private
networks. Many in the industry regard internet-based EDI as the future for the industry. Some
even use the phrase Make history or be history to emphasize the opportunities offered by the
internet and also the urgency to capitalize on the opportunities.
4.2.2.2.2 Emergence of Brokerage Companies
The industry has already utilized the internet to improve the efficiency in not only their
operations but also in matching shipper demands with freight-forwarding supplies. For example,
Cargoweb.com and Celarix.com provide the matching service for freight forwarding across all
modes while Eraterequest.com specializes in the matching service for ocean freight. These
services help increase the load factor, i.e., help fill the aircraft, trucks or vessels, etc.. They also
help the shipper find capacity to satisfy their needs as well as help them hunt for bargains.
(Internet brokerage firms for industries other than the freight industry include Commerce.net
(commercenet.com), which is a non-profit consortium with over six hundred member companies
(including FedEx, etc), industry.net, etc..
4.2.2.2.3 Impact on Airlines
So far, we have addressed the operations of air freight forwarders. Airlines play a pivotal role in
non-integrated air freight forwarding. Most airlines have a website, and these sites offer
product/service descriptions and possibly a shipment tracking function. United Airlines (United
Cargo) launched an interactive website on 4/19/99. Its functions include online reservation, online
reservation confirmation, cargo based flight routing information, tracking information, etc..
4.2.2.2.4 Impact on the Public Sector
The public sector also plays an important role in freight forwarding. The non-integrators have
long felt the pressure from their integrator counterparts, and they are now exerting pressure on
the transportation authorities, particularly airport or seaport authorities and customs officials, to
improve the efficiency of public-sector operations. Operational efficiency at airport, seaport,
customs, etc. can be greatly enhanced if relevant cargo information can be made available in a
consistent electronic format (without divulging proprietary or competitive information).
4.2.3 Robotics Technologies for Automated Sorting at Hubs.
It is well-known that sorting at a hub continues to be labor intensive. However, UPS is in the
process of implementing Hub 2000, a $963 M company-wide project seeking to automate its
current manual sorting with robots and optical sensing. After the completion, the personnel
requirement for sorting at a hub is expected to be reduced by one order of magnitude. For

41
example, a hub currently employing 100 sorting workers for its peak operations may require only
10 if the attempt is successful.
4.3 ROLE OF GOVERMENT IN DEPLOYMENT OF ITS FOR THE AIR CARGO INDUSTRY
The Champion Role for Many Specific ITS Endeavors
The public-sector certainly can and perhaps should play the role of a champion for promoting
each and every one of the ITS and other advanced technologies summarized in Section 4.2.1,
specifically:
• Advanced Traveler Information Systems (ATIS)
• Electronic Toll Collection (ETC)
• High Occupancy And Toll (HOT) lanes
• freeway capacity expansion
• truck lanes
• traffic flow management near airports
• water transportation over the San Francisco bay
• use of urban rail systems for freight transportation
• investigation of new modes of freight transportation
The General Role of a Facilitator
It is clear that the integrators are constantly seeking advanced but proven technologies to improve their
operations. Some of the technologies adopted by them happen to be ITS technologies. The fact that
they have been early adopters of ITS technologies in the transportation community seems to suggest
that they are self-motivated and do not need persuasion by the public sector. However, the
government is needed to play a facilitator role in general to facilitate sharing of information, forming
consensus across different segments of the freight industry or across different companies about the
industry s needs.
The Role of an Observer and Listener
To be part of a solution, the public sector needs to understand the issues and problems faced by the
industry and their relative severity. To do so, it needs to continually keep abreast of the industry s
activities and trends, not just those that it may have a role to play but also those that it may not have a
role to play at all. Occasional visits to the operators to listen to their issues would help the
understanding process; periodic dialogs with them would help identify public-sector innovation
opportunities for more efficient air freight movement.
The integrators constantly seek advanced technologies to improve their operations. With the extensive
support of their industrial engineers, they are able to evaluate accurately the cost and benefit of
proposed technologies for themselves. If the value added by a technology is considered cost-effective by
their industrial engineers, the technologies have a higher likelihood of deployment by the integrators, and,

42
since the rest of the air freight industry tends to follow the lead of the integrators, the technologies have a
higher likelihood of being adopted by the rest of the air freight industry. Listening to the integrators
evaluation of a proposed public-sector ITS endeavor may help identify weaknesses and strengths of the
proposal. Despite their desperate needs for traffic information, the integrators have not actively
participated in public projects on traveler information like TravInfo; they have also not participated in
activities like Summit for a California Traveler Information Marketplace (Caltrans, 2000). Possible
reasons for their absence in these projects or activities include: (i) they are not aware of the projects; (ii)
they do not find the value added by the information worth the effort; (iii) they are uncertain about the
value-added, and hold a wait-and-see attitude, etc.
If they are aware of the public-sector endeavors but do not find the value added by the information
worthy of the effort, a question is what the likelihood of other freight operators considering the
information worthy. Also, if, despite the support of their industrial engineers, they are uncertain about
the worthiness, a question is what the likelihood of other freight operators ascertaining the worthiness.
Other Roles
Other roles of the public-sector and related issues have been made clear in the literature. For example,
the public-sector needs to foster standards for weigh-in-motion and electronic credentialing so that a
truck operator and an integrator can conveniently install one electronic tag that can be used across all
states in the U.S., rather than having to deal with one state at a time.
5. LESSONS LEARNED IN THE AREA OF ITS DEPLOYMENT AND THE AIR
CARGO INDUSTRY
A major objective of this research has been to (a) observe how the integrators improved their
operations (and revolutionalized the air freight industry) through successful adoption of advanced
technologies and other means, and (b) suggest how the ITS community should deploy ITS
technologies. Another has been to observe their intermodal operations and suggest ways to
encourage or develop intermodal operations, freight or passenger.
Making inferences about matters involving the public-sector and/or passenger transportation
based on observations made about a private freight industry requires some rigorous reasoning. A
factor contributing to the success of integrated air-express forwarding may or may not contribute
toward the success of the corresponding passenger service. If so, it may not contribute as much
as it does for integrated air-express forwarding.
Who the customers are for a private-sector business is usually clear. However, public-sector
organizations often have a broad customer base and many stakeholders. A private-sector
organization is usually driven by profit for the stockholders or other private owners while a
public-sector one is often driven by political processes. Governmental jurisdiction is usually
restricted to a geographical area, and private business usually knows of such geographical
boundaries. Mergers are common in the business world, but rarely heard in the public sector.

43
With the differences in sector and in objects of transportation in mind, we draw lessons from the
industry of integrated air-express forwarding.
This section documents lessons learned from the operations of the integrators regarding (i)
deployment of ITS technologies in the general freight industry and (ii) deployment of ITS
technologies in the general surface transportation community. Such ITS deployment lessons are
the subject of Section 5.1. This section also documents lessons learned about intermodal
transportation services, including freight and passenger services. They are the subject of Section
5.2.
5.1 LESSONS LEARNED REGARDING ITS DEPLOYMENT
Based on our observations, we believe that, if technology deployment means selecting
appropriate technologies and adopting them for widespread application, then it is easier to
deploy technologies in the integrated air-express industry than in the society at large. In this
section, we point out factors that make technology deployment easier in that industry. For
illustration purposes, we contrast the relative ease of technology deployment in that industry
with Caltrans task of deployment ITS technologies in California. Specific technologies may be
used to further illustrate the contrast when needed.
Section 5.1.1 discusses factors that affect the complexity of deploying ITS Technologies. We
believe that, in general, deploying ITS technologies in the society is more complex than adopting
advanced technologies in the integrated air-express industry. For one thing, there exist few
external stakeholders in that industry s deployment of advanced technologies. Section 5.1.2
addresses a general methodology for evaluating ITS operating concepts. Section 5.1.3 illustrates,
with further examples, the fact that the integrators are early adopters of ITS or other advanced
technologies.
5.1.1 Factors Contributing the Ease of Deploying ITS Technologies
Clear understanding of customer needs. FedEx s eleven Service Quality Indicators (SQIs)
and their weights clearly indicate the industry s, at least FedEx s, desire to understand their
customers needs. However, they also reflect the fact that the quality of the services provided
by the industry can be captured by a small number of quality indices. An organization like
Caltrans has many different types of customers. Therefore, quantifying their customers
satisfaction requires numerous performance measures, and, perhaps more importantly, the
relative importance of the different customer types is not easy to assess.
Clear needs for technologies to achieve time-definiteness and cost reduction. Recall that
the first salient feature noted about the operations of the industry in Section 2.4 is time-
definiteness at an acceptable cost. These intrinsic needs plus the competition necessitate

44
efficient transportation as well as efficient tracking of their freight, and hence motivate active
search and adoption of advanced technologies.
Close monitoring of current performance of its freight transportation system and clearunderstanding of problem areas. Numerous internal performance measures have been
developed; data have been collected accordingly and routinely to monitor operational efficiency.
When the efficiency of individual operations deteriorates, the management is alerted and counter-
measures, including adoption of advanced technology, are sought.
Clear operating concepts as solutions to problems. Before a technology is deployed, it is
typically evaluated by systems engineering techniques, e.g., time-motion studies, computer
simulation, cost-and-benefit analysis.
Application of mature technologies. For example, the most recent wireless data
communication technology supporting dispatcher-to-driver communication recently adopted first
by UPS and one month later by FedEx was a mature technology at the time of adoption that
required only adaptation to the industry, rather than sophisticated research. Many of the ITS
services require further research at the technology level and the operating concept level.
Traceability of technology adoption to specific problems. After operational inefficiencies
have been identified as a result of the close monitoring mentioned out earlier in this section,
advanced technologies may be adopted to help improve the efficiency. The linkage between the
inefficiencies and the technologies adopted to overcome the inefficiencies enables the traceability
of technology adoption back to the operational problems.
Profit margin necessitate incremental improvement; this often leads to simplicity andhence clarity of the operating concepts involving new technologies. For example, the AM
delivery services have been improved from 10:00 delivery time to 9:00 Am to 8:30 AM and now
8:00AM delivery time. Another example of incremental improvement is the improvement from
dispatcher-to-truck (real-time and voice-data) communication to dispatcher-to-driver
communication.
Few external stakeholders, and single chain of command within the company. The major
external stakeholders are the industry s customers, which the industry conducts frequent market
research, customer survey, etc. and hence knows well.
Close monitoring of current performance and detailed cost-and-benefit study, e.g.,through detailed simulation, of new technologies. The performance is not only monitored at
the microscopic level, e.g., the performance of a particular delivery route or a particular driver,
but also monitored at the corporate level. Consider the following example. After a truck driver
delivered a package, he or she enters some codes into the hand-held tracker while walking back to
the truck. Upon return to the truck, the driver simply drops the tracker into a slot, and the
design of the slot and the tracker is such that once the tracker slides into the bottom of the slot
by gravity, wireless communication is activated from the truck to the integrator s tracking

45
information system, and the codes entered by the driver moments ago are uploaded on the
system. Based on FedEx s own estimates, increasing on-road stops by 0.01 per hour can save
FedEx $1.1 million per year. Moreover, an additional keystroke per package would cost $1.7
million per year (Thomas, 1997). Automating the process of activating wireless communication
between a truck and the tracking information system saves operating costs and improves
operational efficiency.
Small incremental steps toward a grand vision. For example, the ultimate goal of tracking
freight within the FedEx system is to enable real-time display of the location of any freight item
in the system (called in-transit visibility). In particular, a goal is to be able to reveal real-time the
precise and accurate location of the freight item, e.g., at a particular point on a freeway. Guided
by this vision, intermediate steps toward the realization of such goals have been developed and
implemented. Some of the intermediate steps have been mentioned earlier.
Competition. Many believe that the quality movement that has occurred in the past two
decades in the U.S. was triggered by competition for the U.S. automobile market with foreign
auto makers. Technologies like robotics have been adopted to improve product quality.
Competition also spurred the technology adoption in the industry of integrated air-express
forwarding. A recent example is the announcement by UPS that it would equip its drivers hand-
held trackers with wireless communication capability so that the drivers can transmit the tracking
information a few seconds after a package is delivered and signed by the recipient. (Prior to this,
the information cannot be transmitted until the driver goes back to the truck, and the receipt
information can be retrieved by the customer after, on average, 30 minutes of actual delivery.)
The integrated air-express forwarding industry has gotten so competitive that shaving minutes off
from the delay in getting the receipt information to the customer becomes an important marketing
tool. FedEx announced shortly after the UPS announcement a similar plan to enable almost real-
time reporting of package status.
Precise and accurate understanding of the current demand. Due to the close tracking of
individual freight, particularly the origin, destination, type, volume, weight, etc., of the freight
items, the demand for an integrator s services can be precisely and accurately tracked. Due to
many factors, including privacy concerns, the origins and destinations of people s trips are far
from being clear. This makes the transportation planning process difficult and the validity of its
results unclear or even questionable. This also makes the process of evaluating the cost and
benefit of an ITS technology and the companion operating concept difficult and the validity of
the results unclear. Unlike the freight, human drivers can make their own decisions and go their
own ways, which introduces another dimension of uncertainties for the cost-and-benefit analysis.
5.1.2 How to Evaluate ITS Operating Concepts In General
We address the evaluation techniques in three parts:

46
• Evaluation of an operating concept with respect to a set of operating scenarios and a set of
measures of effectiveness (MOEs).
• For every major stakeholder, comparison of multiple concepts.
• Select one or more operating concepts that can be supported by all major stakeholders.
(Such selected concepts may not the most preferable ones for any of the major
stakeholders. This technique is suggested by the discipline of social decision analysis.)
Evaluation of an Operating Concept with respect to a Set of Operating Scenarios and aSet of MOEs
Evaluation of an operating concept involves the following two major steps:
• Evaluate the completeness of an operating concept.
• Evaluate an complete operating concept.
A decision-oriented development/deployment framework has been developed [38] to help
anticipate, recognize and organize ITS design and deployment issues. Given the issues
anticipated, an operating concept cannot be considered as complete if some of the issues are not
addressed by the concept. Therefore, the framework can be used to evaluate the completeness of
an operating concept. A complete operating concept cannot be considered feasible or promising
if some of the issues are not satisfactorily resolved. Therefore, the framework can also be used to
assess the feasibility of a complete operating concept. Evaluating an operating concept involves
the following steps:
• Develop realistic and representative operating scenarios, e.g., realistic demand levels in a
generic metropolitan area.
• Develop a complete set of major measures of effectiveness, i.e., those MOEs that at least
one of the major stakeholder groups are concerned about.
• Estimate all the MOEs, quantitative or qualitative, for all operating scenarios. (This step
requires various methods and computer tools.)
For each complete operating concept, the evaluation result for one operating concept is a matrix
with one dimension being the operating scenarios and the other being the estimated measures of
effectiveness. (This matrix will be referred to as the operating-scenario-MOE matrix for
convenience of discussion.)
For each Major Stakeholder, Comparison of Multiple Operating Concepts.
The feasibility and desirability of any particular operational concept must be evaluated from the
perspective of every major stakeholder. The task of evaluating multiple operating concepts on
behalf of every stakeholder involves the comparison of multiple operating-scenario-MOE
matrices using the stakeholder s value function or preferences.
Selection of One or More Operating Concepts

47
Different stakeholders may have different preferences. The selection of one or more operating
concepts will eventually be a political decision to be fought for by the major stakeholders. The
discipline of Social Decision Analysis calls for the selection of the operating concept that is
acceptable to all or most major stakeholders, although the concept may not be the most
preferable one for any of the major stakeholders.
5.1.3 Target the Industry as Early Adopters of ITS Technologies
Due to the time-definite nature of the business and the need to reduce cost, either for attacking
new customers or for luring customers from competitors, the integrators are constantly seeking
advanced technologies to improve their operations. However, as we pointed out earlier, they
adopt technologies for solving specific problems and do not adopt some other technologies for
good reasons. Only a clear understanding of their operations and perhaps that of their entire
business would enable proper selection of ITS technologies for early adoption by the integrated
air-express forwarding industry.
As mentioned earlier, the conventional (non-integrated) freight forwarders have long been losing
market share to the integrators, and are under pressure of their own customers to improve the
efficiency of their operations as well as to offer in-transit visibility of freight (i.e., close
tracking of freight and convenient provision of tracking information). In addition, some of the
integrators have acquired (conventional) trucking companies and begun to equip the trucks with
communications and freight tracking technologies previously found only in integrators
operations. This further puts pressure on the conventional freight industry to speed up their
adoption of advanced technologies. For example, FDX (i.e., the holding company of FedEx)
acquired Viking recently, and has begun to equip Viking trucks with communication and tracking
technologies, which FedEx has found indispensable in integrated air-express forwarding.
Targeting the integrators for ITS deployment may have long-term effects on the whole freight
industry in general.
We now give two further examples to demonstrate the integrators propensity to try new
technologies in general. Such propensity makes the industry excellent target as early adopter of
ITS technologies. UPS delivery fleet, at least the fleet serving its Western Regional Hub at the
Ontario International Airports, currently uses natural gas, a low-emission fuel. It also shares its
fueling station at the hub with and sells the fuel to its neighbors. Federal Express and Pratt-
Whiney developed a Hush Kit which allows re-engining on Stage II noisy aircraft (e.g.,
Boeing 727s) and moves their classification to the acceptable Stage III, e.g., Boeing 747s. The
FAA approved the Hush Kit, and FedEx has been selling it to other airlines. These companies
seem to be sensitive to environmental issues too, and seem to want to be a progressive corporate
citizen.
5.2 LESSONS LEARNED REGARDING INTERMODAL SERVICES
A fundamental distinction between freight forwarding service and the conventional modal services
(e.g., trucking alone, air transportation alone, etc.) is that freight forwarding is a multi-modal

48
service. The shipper has a contract with a forwarder, and the forwarder deals with the individual
modal service providers. Individual modal service providers usually do not coordinate their
operations with one another, except to pass the freight from one to another along the chain of
forwarding. The forwarder does the routing and scheduling to optimize the forwarding process.
Perhaps the most fundamental difference between integrated air-express forwarding and the
conventional air freight forwarding is that the former provides an end-to-end service that is time-
definite at an acceptable and competitive cost. (Recall the first salient feature of the industry
stated in Section 2.4.) The end-to-end part is actually not critical because the shipper using the
conventional forwarding service has only one contact point for the entire shipment process,
usually the forwarder hired by the shipper. What is critical is that the contractual obligation on
the part of the forwarder to deliver the freight by a specified deadline at an acceptable cost.
The key distinction between the operations of integrated air-express forwarding and those of
conventional air freight forwarding is the coordination among all the transportation modes
involved. This coordination is made easy for integrated air-express forwarders by having the
entire shipping process (i.e., all modes of transportation involved) controlled by one authority.
As the demand grows and involve many origins and destinations, the efficiency achievable by the
single authority is optimized by the hub-and-spoke system; the optimization potential is highest
when the system is designed by and for one single company or a single alliance of companies.
A Sequence of Functional-Expansion Steps for Freight Services and ImprovementsToward Time-Definite Intermodal Services
In integrated air-express forwarding, the following sequence of key functional-expansion steps are
achieved:
• (Conventional) Multiple Modal (Freight-forwarding) Services
• End-to-end Freight Forwarding (i.e., connecting multiple modal services to achieve end-to-end
transportation)
• Integrated (or Single-control) Freight Forwarding (i.e., coordinating multiple modal services to
achieve time-definiteness at economic cost)
• Single-company (or Single-Alliance) Integrated (Freight) Forwarding (i.e., fully optimized
network with sufficient demand).
This sequence of steps can be used to guide the current modal service providers to improve their
operations and to move toward intermodal operations. However, the achievable degree of
intermodality hinges upon not only technology but also organizational arrangement.
A analogy can be drawn between intermodal freight and public transit services, and some lessons
can also be drawn accordingly. Note however that the hierarchy stated above involves a
centralization process, and that the governmental structure has been a decentralized one and will
likely remain to be a decentralized one. This analogy is explained as follows.

49
Time-definite Intermodal Transit Service
One can draw some lessons from the integrated air-express industry for public transportation.
The vast majority of current public-transit services are modal services, and the end-to-end trip is
planned by individual users. In other words, the user performs end-to-end forwarding of
themselves by using connected but non-coordinated public-transit services.
An analogy of integrated (single-control) freight forwarding in public transit is time-definite (end-
to-end) transit services between origin-destination pairs across multiple modes of transportation.
(Such services may be called time-definite end-to-end multi-modal transit services or simply
time-definite intermodal transit services.) The time-definiteness in this context is subject to more
realistic definition. (The differentiater is the close coordination among the providers of multiple
transportation modes.) Given the decentralized nature of public-transit agencies, the exact
analogue of Single-company (or Single-Alliance) Freight Forwarding (i.e., single-agency
intermodal transit service) may or may not be achievable for optimal efficiency.
However, note that, like the integrated air-express service, such time-definite transit service will
likely be more expensive than the conventional modal services combined. In other words, the
higher performance can only be bought with a higher price. However, the value-of-time for the
customers of such premium services may be much higher than those of conventional transit
services, just like the fact that the integrators forward high-value and time-definite goods. (Recall
that the freight aircraft of the integrators are typically flown for one single round trip per day to
maximize their availability.)
The demand for such services is uncertain and requires further study. Note that the success of
the integrators depended also on the explosive demand for their service, resulting from
streamlining of enterprise supply chain, just-in-time manufacturing, proliferation of machine
parts, deregulation, etc.. As the industry of integrated air-express forwarding, such services
should grow adaptively, according to the rate of market penetration. If the services turned out to
be profitable, the technologies and services can be transferred to the private sector, or the services
can remain non-profit.) In a way, such a service already exists. The airport shuttles providing
home-to-airport (end-to-end) services do have an element of time-definiteness, as well as some
sort of hub-and-spoke or other network structure.
Creation and Integration of New Freight Transportation Modes - Water FreightTransportation in the SF Bay Area, etc.
The time-definite nature of the business of integrated air-express forwarding forces the integrators
to anticipate impediments to timely and efficient transportation of their freight and to seek
innovative ways of achieve time-definiteness at an economic cost. Use of hovercraft , fast
ferries, barges, helicopters, tiltrotors, urban rapid (rail or light rail) transit systems, etc., for
freight transportation in urban areas has been either contemplated or even used for integrated air-
express forwarding in congested urban areas.

50
The new possible freight transportation modes may best be integrated with similar passenger
services, e.g., combining freight and passenger services over the SF Bay. The fact that many
airlines have found that belly cargo can generate higher return than passenger traffic may indicate
the potential of freight service on, for example, passenger ferry services. (The privately-operated
passenger ferry service between Richmond and San Francisco will be terminated in September
2000 because it is not economically self-sustainable.)
6. CONCLUSION AND RECOMMENDATIONS
Through site visits and literature review, we achieved a basic understanding of the operations of
integrated air-express forwarding. Many salient features of those operations have been identified.
The industry is known for the quality of its delivery service, in terms of on-time delivery, real-
time or close to real-time tracking of freight items, real-time or close-to-real-time provision of
freight status, etc..
Factors Used to Explain the Integrators Propensity to Adopt New technologies
We used several factors to explain why the industry has been a leader of technology adoption in
the freight industry, including
• the time-definite nature of the business;
• the tightness of its operations, in the sense that a short delay of one task may propagate
and cause many downstream tasks to be also delayed, perhaps much more seriously;
• the desire to minimize the operating cost (to attract new users of air-express services, to gain
an edge over the competitors, or simply to avoid the refund obligations in case of late
delivery);
• its quality emphasis, particularly the industry s ability to track its operational performance
and link the performance measures with customer satisfaction;
• the fact that the level of customer satisfaction can be and has been quantified by a small
number of metrics.
Many issues and public-sector innovation opportunities have been identified; many possible
public-sector roles have been recommended.
The Integrators Number One Concern: Traffic Congestion in Metropolitan Areas
The number-one concern of the industry is traffic congestion in metropolitan areas. In a large
metropolitan area, transporting freight between airports and individual customers typically
involves a two-tier structure: transporting freight between airports and local distribution centers
and transporting freight between local distribution centers and individual customers. The former
is typically performed by few large trucks while the latter by a large number of delivery vans or
small trucks. When the large trucks are expected to be delayed, either because of anticipated
congestion on freeways or late arrival of an aircraft, a large number of small vans are sent to the

51
airports to pick up the freight directly. From the perspective of the industry, congestion directly
drives up the cost of their operations.
Despite the very tight operations of the integrators, much of their operations are affected by
factors out of their control. Major exogenous disturbances include the delays due to recurrent or
non-recurrent congestion in transportation systems, including the National Air Space System, the
airports, and the highways and surface streets near or away from the airports. Such exogenous
disturbances are extremely harmful for the integrators time-definite services. The Bay Area
dispatch managers we visited with gave the following example.
Large trucks begin to leave the Oakland International Airport at around 1:00 AM and continue
until early morning. Currently, the last departure of such trucks is scheduled at 6:30 AM. If the
actual departure time is beyond 6:30, adjustments to regular routes must be made. If the actual
departure time is beyond 6:50, the current staffing may have trouble handling the regular traffic
without sacrificing the service quality. It is estimated that, if the actual departure time is later
than 7:10 AM, 11 routes will need to be added to each station that is affected due to the extra
travel time caused by traffic congestion. It is also estimated that, in such a case, 8 stations will be
affected. Note that each route is staffed by one driver and equipped with one dedicated truck.
A Vicious Cycle - More Congestion, More Freight Vehicles Needed and Hence Even MoreCongestion
A much more important lesson for the public sector is perhaps the following vicious cycle.
Given that a freight operator has a set of deliveries to make, traffic congestion forces the
operators to send more vehicles on the road and hence exacerbates the congestion problem.
Unlike people movement where public transit or HOV lanes offer an alternative for solo-driving
and hence a way to alleviate traffic congestion, the freight operators do not have any alternative
other than to send more vehicles on the road. The integrators reaction to traffic congestion may
be particularly acute, but it illustrates well the vicious cycle in the freight industry. This vicious
cycle adds to the reasons for considering dedication of HOT lanes or even truck lanes in freight
corridors. A quantitative study of the effect of the vicious cycle may be a worthy subject for
future research.
A General But Critical Public-sector Role: What is a Way out of the Effect of TrafficCongestion for Freight Transportation?
Unlike people movement, for which HOV lanes and public transit provide a way out of the effect
of traffic congestion, freight transportation suffers as much from the traffic congestion on
highways and surface streets but sees no relief in sight. This is clearly one of the most critical
issue facing the entire industry of integrated air-express freight forwarding.

52
Recommended Specific Public-sector Innovations and Roles
In addition to the obvious solution of highway capacity expansion, recommended public-sector
innovation roles include:
• designation of high-occupancy and toll lanes (HOT lanes) and permit the industry s delivery
vans and trucks to use these lanes;
• provision of traffic information, including not just incident information but also accurate real-
time information about travel speed, time till incident clearance, etc., to the industry s
dispatchers (not directly to the drivers);
• designation of truck lanes on freight corridors;
• study of the feasibility of using the San Francisco Bay for freight transportation, including
transporting freight directly between the Area s bay-side airports and the many local
distribution centers of the industry in the Bay Area;
• study of the feasibility of using urban train systems like BART and light-rail systems for
transportation of time-sensitive freight.
Many possible future roles of ITS in the integrated air-express industry exist. The industry will
likely look to the public sector to play the role of a champion for the deployment of many ITS
technologies.
Lessons Learned on ITS Deployment
Through our study of the integrated air-express industry, we have learned many lessons about
ITS deployment. Factors facilitating ITS deployment have been identified, and a framework for
evaluating the deployability of an ITS operating concept briefly discussed. The factors include
• clear understanding of customer needs,
• clear needs for technologies to achieve time-definiteness and cost reduction,
• close monitoring of current performance of its freight transportation system and clear
understanding of problem areas,
• clear operating concepts as solutions to problems,
• application of mature technologies,
• traceability of technology adoption to specific problems,
• profit margin necessitate incremental improvement; this often leads to simplicity and hence
clarity of the operating concepts involving new technologies,
• few external stakeholders, and single chain of command within the company,
• close monitoring of current performance and detailed cost-and-benefit study, e.g., through
detailed simulation, of new technologies,
• small incremental steps toward a grand vision,

53
• competition,
• precise and accurate understanding of the current demand.
The integrators, through their success, not only put pressure on the conventional freight industry
to speed up their adoption of advanced technologies, but also actually speed up the adoption
through knowledge sharing among sister companies. For example, FDX (i.e., the holding
company of FedEx) acquired Viking recently, and has begun to equip Viking trucks with
communication and tracking technologies, which FedEx has found indispensable in integrated air-
express forwarding.
ITS community s targeting the integrators for ITS deployment may have long-term effects on the
whole freight industry in general.
Lessons Learned on Intermodal Freight and Passenger Services
We have also learned many lessons about provision of intermodal freight or passenger
transportation services. In integrated air-express forwarding, the following sequence of key
functional-expansion steps are achieved.
• (Conventional) Multiple Modal (Freight-forwarding) Services
• End-to-end Freight Forwarding (i.e., connecting multiple modal services to achieve end-to-end
transportation)
• Integrated (or Single-control) Freight Forwarding (i.e., coordinating multiple modal services to
achieve time-definiteness at economic cost)
• Single-company (or Single-Alliance) Integrated (Freight) Forwarding (i.e., fully optimized
network with sufficient demand).
This sequence can be used to guide the current modal service providers to improve their
operations and to move toward intermodal operations. However, the achievable degree of
intermodality hinges upon not only technology but also organizational arrangement.
One can also draw some lessons from the integrated air-express industry for (ground) public
transportation. The vast majority of current public-transit services are modal services, and the
end-to-end trip is planned by individual users. In other words, the user performs end-to-end
forwarding of themselves by using connected but non-coordinated public-transit services. An
analogy to the integrated air-express freight forwarding service in public transportation is time-
definite intermodal transit service. Note however that the hierarchy stated above involves a
centralization process, and that the governmental structure has been a decentralized one and will
likely remain so.
Air freight in California has been growing at an approximate annual rate of 10% [37], which is
significantly higher than the national growth rate. The integrators have been at the forefront of
technology adoption, to anticipate continued fast growth or possible future impediments to their

54
operational efficiency or to gain competitive edges. It is likely that they will continue to
constantly look for innovative technologies or other solutions within their control as well as to
look to the public sector for vigorous championship for those innovations that can be achieved
only by or with the public sector. In the presence of the fast growth and amid the integrators
vigorous innovative activities, a major question is what can the public sector offer in response.

55
REFERENCES
[1] American Trucking Associations Foundation, Assessment of Intelligent Transportation
Systems/Commercial Vehicle Operation User Services, Federal Highway Administration, U.S.
DOT, 1996.
[2] Analla, B.P. and Helms, M.M., Worldwide Express Small Package Industry,
Transportation Quarterly, Vol. 50, No. 1, pp. 51 — 64, Winter 1996.
[3] Aylward, A. D., Intelligent Transportation Systems and Intermodal Freight Transportation,
December, 1996.
[4] Bahar B. Norris Intermodal Performance Standards: A Primer for Transportation Planning
Practitioners, Volpe National Transportation System Center July 1994
[5] Bay Area Council, Charting the Course: Bay Area Water Transit Initiative Action Plan. 1999.
http://bacqube.bayareacouncil.org/ppi/tpt/4lv_wtil.html .
[6] Boeing Commercial Airplane Group, 1996/1997 World Air Cargo Forecast, Boeing
Commercial Airplane Group, Seattle, Washington, 1997.
[7] Button, K.J., and Owens, C.A., Transport and Information Systems: A Case Study of EDI
Deployment by the Air Cargo Industry, International Journal of Transport Economics, Vol.
XXVI, No. 1, pp. 3 — 21, 1999.
[8] Caltrans, 1998 California Transportation Plan — Statewide Goods Movement Strategy,
California Department of Transportation, Sacramento, California, 1998.
[9] Caltrans, 1998 California Transportation Plan — Transportation System Performance
Measures, California Department of Transportation, Sacramento, California, 1998.
[10] Caltrans, Summary of Summit for a California Traveler Information Marketplace, held on
March 20 — 21, 2000.
[11] Cambridge Systematics, Inc. Intelligent Transportation Systems for Motor Carriers: Win,
Place, and Show, March, 1996, Cambridge, Massachusetts.
[12] Cambridge Systematics National Transportation System Performance Measures: Final
Report, April 1996.
[13] Cambridge Systemactics, Challenges and Opportunities for an ITS Intermodal Freight
Program, Federal Highway Administration, U.S. Department of Transportation, Washington,
D.C., 1999.
[14] Carlin, G.A., The Use of ITS Systems to Improve Commercial Operations (CVO)-Port
Intermodal Freight Operations, August, 1995.
[15] Clarke, William, Air Cargo - The Past and the Promise, Air World, Vol. 41, No. 3, 1989,
pp. 22-27.
[16] Czerniak, R., Gaiser, S., and Gerard, D. The Use of Intermodal Performance Measures by
State Departments of Transportation, Department of Geography, New Mexico State University,
Las Cruces NM.
[17] European Commission, An Introduction to Electronic Commerce, European Commission,
1997 (last updated on 2 July 1998), http://www.ispo.cec.be/Ecommerce/answers/what.html.
[18] FAA, A Feasibility Study of Regional Air-Cargo Airports (Including a Case Study of a
Regional Air-Cargo Center for the Washington, D.C. area, USDOT, August 1991.
[19] Farrell, A. and Corbett, J.J., Meeting Environmental Challenges for Ferries, TR News,
July-August 2000, No. 209 (Ferries in the 21st Century), Transportation Research Board.

56
[20] First Conferences Ltd., Electronic Commerce for Freight Transportation USA, June 2-3,
1999, New Orleans. (www.firstconf.com/freight/past.html)
[21] First Conferences Ltd., Electronic Commerce for Freight Transportation Europe,
November 16-18 1999, Barcelona. (www.firstconf.com/freight/past.html)
[22] Gogan, J.L., The Web s Impact on Selling Techniques: Historical Perspective and early
Observation, International Journal of Electronic Commerce, Vol. 1. No. 2, pp 89-108, 1997.
[23] Golob, T.F. and Regan, A.C., Freight Industry Attitudes Towards Policies to Reduce
Congestion, Transportation Research Part E, Vol. 36, 2000, pp. 55-77.
[24] Gosling, G., Aviation System Performance Measures, UCB-ITS-NOXTOR Working Paper
WP-99-1, Institute of Transportation Studies, University of California, Berkeley, 1998.
[25] Greefeld, K.T., The network Effect, Time Magazine, April 10, 2000.
[26] Hall, R.W. and Chris Intihar, Commercial Vehicle Operations in Intermodal Transportation
Management Centres March, 1997.
[27] Hancock, M.L., Maze, T.H., and Waggoner, K., Multi-State Applications of Intelligent
Transportation Systems for Commercial Vehicle Operation, Transportation Quarterly, Vol. 50,
No.1, 1996, pp. 125-131.
[28] Kaliski, J., ITS Data for Freight Planning,December, 1997.
[29] Kimbrough, S.O. and Lee, R.M., Formal Aspects of Electronic Commerce: Research Issues
and Challenges, International Journal of Electronic Commerce, Vol. 1, No. 4, pp. 11-30, 1997.
[30] Ligon, G.C., Development of the U.S. Air Express Industry: 1970 — 1990, Transportation
Quarterly, Vol. 46, No. 2, pp. 279 — 294, April, 1992.
[31] McPhee, L. and Lieb, J., "1999 CommerceNet/Nielsen Demographics of the Internet
Overview Report", http://www.commercenet.com/about/membership/rrsample.html.
[32] MergeGlobal, Inc., World Air Freight Industry: Analysis and Forecast, Arlington, Virginia,
1997.
[33] Metropolitan Transportation Commission, San Francisco Bay Area Regional Ferry Plan
Update. Oakland, California, 1999.
[34] Rosenbaum, H., Online Course - The Information Industry: Electronic Commerce,
http://www.slis.indiana.edu/hrosenba/www/L561/syll/ syll4.html .
[35] Scapinakis, D.A. and Garrison, W.L., Communications and Positioning Systems in the
Motor Carrier Industry, PATH Research Report UCB-ITS-PRR-91-10, Institute of
Transportation Studies, University of California, Berkeley, 1991.
[36] Thomas, C, An Introduction to Operations Research and Spatial Applications at FedEx,
Proceedings of AGIFORS Thirty Seventh Annual Symposium, September, 1997.
[37] Tsao, H.-S.J., The Role of Air Cargo in California s Goods Movement, UCB-ITS-
NEXTOR Research Report RR-98-5, Institute of Transportation Studies, University of
California, Berkeley, 1998.
[38] Tsao, H.-S.J., A Framework for Evaluating Strategies for Deploying Intelligent
transportation Systems, to appear in the ITS Journal.
[39] U.S. Department of Transportation, IVHS Architecture development program, Interim
Status Report, April 1994.
[40] White Paper, How the integrated carriers changed an industry, Traffic Management,
August, 1991.

57
[41] Zwass, V., Electronic commerce: Structures and Issues, International Journal of Electronic
Commerce, Vol. 1 No.1, pp. 3-23, 1996.

58
APPENDIX A: PLANNED DISCUSSION SUBJECTS DURING SITE VISITS
This appendix consists of two parts. The first part summarizes the discussion subjects during
visits to an integrated air-express forwarder; the second summarizes the subjects during visits to
air carriers, i.e., non-integrated air-express forwarders.
DISCUSSION SUBJECTS DURING A VISIT TO AN INEGRATED AIR-EXPRESSFORWARDER (INTEGRATOR)
Subjects are grouped into three categories:
1. Quality of the service provided by Caltrans and other providers of surface transportation
infrastructure,
2. Lessons learned by the Integrator in deploying technologies in its truck fleet,
3. Possible concrete joint efforts.
Individual subjects, grouped under the three categories, include the following:
1. Quality of the Service provided by Caltrans and other providers of surfacetransportation infrastructure
• Customer Expectations (Needs): What the Integrator expects from Caltrans and other
providers of surface transportation infrastructure.
• Quality Characteristics (Performance Measures): Those that relate to the ground portion
of air cargo movement.
• performance measures of the Integrator that directly depend on the efficiency of its
truck fleet s movement on highways and city streets
• performance measures used by Integrator that describe the level of service provided
by the surface transportation infrastructure
• Goods Movement Issues:
• issues from the perspective of an express air cargo forwarder
• their relative importance, in context of the Integrator s overall operations
• Suggestions:
• How could Caltrans or other agencies help?
2. Lessons learned in deploying technologies in the Integrator s truck fleet
• Major technologies currently used for efficient goods movement on the ground

59
• Reasons behind deployment successes or failures.
3. Possible concrete joint efforts:
• Level of the Integrator s interest in linkage to local traffic information centers operated by
Caltrans or other related agencies
• Other possibilities
DISCUSSION SUBJECTS DURING A VISIT TO AN AIR CARGO CARRIER
Subjects are grouped into three categories:
1. The most important issues for the carrier, not necessarily those that Caltrans may play a
role in their resolution.
2. Quality of the service provided by the airport, Caltrans and other public sector service
providers,
3. Lessons learned by the carrier in deploying technologies in its operations.
Individual subjects, grouped under the three categories, include the following:
1. The most important issues for the carrier, not necessarily those that Caltrans mayplay a role in their resolution.
• Flight delays caused by congestion in the air space, weather, etc?
• Delays incurred at the airport due to congestion at the airport, etc.?
• Failures of flight connection due to the delays?
• Failures of connection to other modes of transportation, e.g., trucking, rail, etc.?
• Inability to forecast accurately cargo capacity? (not applicable to all cargo carriers)
• Inadequate shared facilities at the airport, e.g., refrigeration, agriculture inspection, customs
agents, etc.
• Electronic Data Interchange?
• Competition from the integrated air express forwarders like FedEx?
• Customers demand of real-time freight tracking information across all cargo or passenger
airlines, or across all modes of transportation?
2. Quality of the Service provided by the airport, Caltrans and other public-sectorservice providers
• Customer Expectations (Needs): What the carrier expects from the airport, Caltrans, and
other public agencies.

60
• Quality Characteristics (Performance Measures): Those that relate to air cargo
movement.
• performance measures of the carrier that directly depend on the efficiency of its
airport operations
• performance measures used by the carrier that describe the level of service provided
by the airport, Caltrans and other public agencies
• Goods Movement Issues:
• issues from the perspective of the carrier
• their relative importance, in context of the carrier s overall operations
• Suggestions:
• How could Caltrans or other public agencies help?
3. Lessons learned in deploying technologies in the carrier s operations
• Major technologies currently used for efficient goods movement
• Reasons behind deployment successes or failures.

61
APPENDIX B: SITE-VISIT REPORT - AIRBORNE EXPRESS, MATHER AIRPORT(SACRAMENTO, 6/14/99)
SUMMARY
1. GENERAL INTRODUCTION TO AIRBORNE EXPRESS
2. AIRBORNE EXPRESS OPERATIONS
3. ENABLING TECHNOLOGIES
4. AIRBORNE EXPRESS SERVICES OF CALIFORNIA AIRPORTS
5. AIRBORNE EXPRESS OPERATIONS AT MATHER
6. TRANSPORTATION ISSUES AND NEEDS
1. GENERAL INTRODUCTION TO AIRBORNE EXPRESS
• 1,000,000 packages per day
• over 200 countries
• two coupled domestic airport operations systems:
• national hub system: Willmington, Ohio as the national hub
• regional hubs: e.g., Fresno
• a private airport (unique in the business) with two runways
• 104 aircraft
• service categories:
• transportation of packages
• logistics provider
• including warehousing
• same-day domestic delivery if request is received before 2AM
• single (round) trip per aircraft per day, although double tripping is attempted, to ensure
punctual operations
• maintenance: 99.8% availability DC- 8 (highest for the aircraft model), also to ensure
punctual operations
• 40,000 person-hours for converting a passenger aircraft to a freight aircraft
• reasons behind express air cargo growth:

62
• time-sensitive or time-definiteness: e.g., just-in-time (to reduce inventory costs; even
for car makers), build-to-order, to lessen shipment time,
• high-value: e.g., security (to reduce exposure to theft, e.g., theater movies, for which
Airborne Express has 75% market share, or damage)
2. AIRBORNE EXPRESS OPERATIONS:
• tightly knitted
• two major categories:
• transportation of packages or goods
• package or goods tracking
• sorting done primarily at the national hub; local resorting possibly needed but only for
mixed containers
• special platforms and conveyer belts designed for efficient loading/unloading of the 1,100
lb. Containers; tracks installed on the main cabin of aircraft with locking devices
• analyzed in detail by industrial engineers
• many performance measures
• We measure everything.
• Enabled by technology
• Field Productivity Reporting System, based on information collected with hand-held
digital scanners, e.g., % of routes that were not on time for a given day
• GPS tracking for leased trucks serving inter-city ground transportation for realistic
travel time estimates, speed, miles driven, miles per gallon, etc. for safety and
efficiency purposes.
• basis for many operations decisions, e.g., re-design of routes, work load analysis,
driver evaluation, etc.
3. ENABLING TECHNOLOGIES
• The more we provide, the more the customer wants.
• Scanner:
• bar-code reader
• $75 kit for transmitting data over regular phone line
• communication with dispatchers: radio

63
• information technology: collection, transmission and analysis too
• GPS tracking for leased inter-city trucks
• new technologies under investigation: digital dispatch
• console on the truck (a Vancouver, Canada company) with safety issues considered,
e.g., operational only when the truck is parked
• $200-400 range per truck
• digital satellite data communication
• shows, among other things, location of next stop, time needed to get there, etc.
• (current UPS technology: digital communication to and from truck; $1200-2400 console
per truck; 3 cents per minute cellular charge)
• deployment decision: gut feeling first, but followed by detailed and rigorous IE analysis
4. AIRBORNE EXPRESS SERVICES OF CALIFORNIA AIRPORTS
• MHR (Mather): 1 DC-8 per day
• OAK: 2 flights
• SFO: 1 flight
• LAX: 2 flights
• Ontario: 1 flight
• San Diego: 1 flight
• Fresno: 1 flight
5. AIRBORNE EXPRESS OPERATIONS AT MATHER
• stage-3 1968 DC-8 (with a hush-kit )
• 6:05 arrival at MHR (from ILN at 4:23)
• 108 1,100 lb. containers per day
• load factor: 75% outbound; 120% inbound (including containers trucked in from the Bay
Area)
• 35% delivery to local Sacramento area; the rest to Chico, Redding, Ukiah, etc.
• 80-90% repeat business every day for Sacramento

64
• 60 routes for Sacramento on average; handled by 2 dispatchers (30 each)
• busiest period: 5 - 6 PM
6. TRANSPORTATION ISSUES AND NEEDS
• HOT lane: use of HOV lanes by vans or small trucks for a fee (minimum safety concern)
• traffic information: dispatchers currently listening to traffic information on radio (KFBK);
information integrated and filtered by TMCs, e.g., incident information provided by
TravInfo in the Bay Area, would be helpful. (Predicted travel time would be useful, but
the technology is in general not mature enough.)
• connection to the city planning process: benefiting selection of facility location
• other possible solutions: not suggested by Airborne Express
• truck corridor to facilitate air cargo operators longer-term planning functions
Note: Airborne Express at Mather seems, not surprisingly, to accept the status quo of the
current transportation systems, particularly the congestion on the surface transportation
systems, and has not expressed any strong demand for congestion reduction. It seems to seek to
get around the congestion problems as much as possible by optimally locating its facilities and
adjusting its routes. For example, in determining the location of its major facilities, e.g., relocating
their Sacramento International facility to Mather Airport, they considered many factors,
including
• maximizing the number of alternative routes for accessing freeways
• avoiding train tracks
• considering the # of stoplights on city streets
• considering the direction of commute traffic to avoid congestion

65
APPENDIX C: SITE-VISIT REPORT - FEDERAL EXPRESS, SAN RAMON DISPATCHCENTER FOR THE DISPATCHING OPERAIOTNS IN THE S.F. BAY AREA (6/16/99)
SUMMARY
1. GENERAL INTRODUCTION TO FEDERAL EXPRESS (FedEx)
2. FEDERAL EXPRESS OPERATIONS
3. ENABLING TECHNOLOGIES
4. FEDERAL EXPRESS SERVICES AT BAY AREA AIRPORTS
5. TRANSPORTATION ISSUES AND NEEDS
6. GLOSSARY
1. GENERAL INTRODUCTION TO FEDERAL EXPRESS
Size of Operations and Capacity
• World’s largest express transportation company, which began operations in April 1973
based on the founder s thesis for his master s degree.
• Headquarters: Memphis, TN
• Revenues: $13.3 billion (FedEx s fiscal year 1998)
• Employees: More than 145,000 worldwide
• Countries Served: 210
• Airports Served: 366 worldwide
• Aircraft Fleet:
Total Aircraft: 625 worldwide
• 26 McDonnell Douglas MD-11s (33 on order)
• 30 Airbus A300s (6 on order)
• 39 Airbus A310s
• 74 McDonnell Douglas DC-10s (21 on order)
• 163 Boeing 727s
• 261 Cessna 208s
• 32 Fokker F-27s

66
• 0 Ayres LM 200 (50 on order)
• Global Lift Capacity: Approximately 20.6 million pounds daily
• Vehicle Fleet: More than 42,800 worldwide
• World Service Centers: Approximately 1,400 worldwide
• Drop Boxes: Approximately 44,400
• Average Number of Electronic Transmissions: Approximately 63 million daily
• Distance Driven Per Day: More than 2.7 million miles (United States only)
• FedEx Powerships: More than 100,000 (See the Appendix at the end of Appendix C for
the definition of Powership.)
• FedEx Ships & interNetShips: More than 1.6 million (See the Appendix at the of
Appendix C for the definition of FedEx Ship and FedEx interNetShip.)
• FedEx Ship Sites: More than 2,400 (See the Appendix at the end of Appendix C for the
definition of Ship Site.)
• Authorized Shipcenters: More than 7,400 (See the Appendix at the end of Appendix C
for the definition of Shipcenter.)
Service Categories
• Same Day (Packages up to 150 lbs. only)
• Next Day Morning (Packages up to 150 lbs. only)
• Next Day Afternoon
• 2nd Day
• 3rd Day
• Earlier service by 8 am provided to those within 15 miles from airport ramp
Volume of Demand
• Average Package Volume: More than 3.2 million daily worldwide
• Average Call Volume: More than 500,000 customer calls daily
2. FEDERAL EXPRESS OPERATIONS:

67
• Express package distribution; acquired Flying Tigers a couple of years ago and have been
in business of transporting bulk freight.
• Sorting done both at national hub and local overlays like Oakland (West Coast) so that
local packages do not travel long distances.
• 3 different type of containers are used for various purposes
• Next day delivery before 10:30 (70% of FedEx s business) is the driving force behind all
operations and planning; PM operations, as opposed to AM operations, are the driver for
ground operations, at least for the Bay Area.
• Move 2-day mail during non-peak time.
• Container transport vehicles (CTV) are used to distribute packages from the airport
ramps to local stations where they are shifted to smaller trucks or vans or handed to foot
couriers who have designated routes for delivery.
• Package pickup route planning is done with Regular and On-Call customers in mind.
Regular customers are those who generate a certain volume every day and have arranged a
regular pick-up time while the latter has to call to arrange a pick-up. Approximately 55
% of the packages is generated by Regular customers.
• performance measures
• We measure everything.
• Package density of a container is the major measure.
• Stops/hr, miles/stop and stops per FTE (full time equivalent) are also kept track of
for measuring productivity.
• Travel times for each length of the route are estimated and then compared with the
actual values and modified if needed (usually done if the difference is more than 4
minutes)
• Basis for many operations decisions, e.g., re-design of routes, work load analysis,
driver evaluation, etc.
• Also analyze drop box locations and routes
• Fuel consumption.
3. ENABLING TECHNOLOGIES
Current Technologies

68
• Courier Route Planner (CRP) is used, but for off-line planning purposes. Although real-
time optimization software (Route Optimizer) is available, it may not be used. (It is not
used in the Bay Area; all real-time dispatching is done completely manually.)
• Cell phones are used by CTV dispatchers to communicate with CTVs. But, the
technology is not being used for local delivery.
• Digitally Assisted Dispatch (DAD) is used by drivers or couriers to facilitate their work.
• A DAD is often called a Tracker because the primary function is to facilitate the
tracking of packages. A DAD is equipped with a hand-held bar-code reader or
scanner.
• After a delivery or a pick-up is made, the scanner is used to record the package ID and
other information about the stop.
• When the driver returns to the truck, he or she puts the DAD into a cradle, and the
information is transmitted via radio to the local dispatch center. (See MONARCH
below.)
• Dispatchers can send text messages to the drivers via DAD and vice versa. But, the
driver can retrieve the messages only after the DAD unit is put in the cradle.
• Voice communication between drivers and dispatchers: radio
• MONARCH, A roaming radio system is being used which allows data and voice to be
transmitted at the same time
• Internet sites, e.g., KPIX of the Bay Area, are used to check traffic updates.
Technologies Being Tested, Developed or Planned
• GPS tracking of truck locations is being tested in Memphis by their Technology Group
with the ultimate aim of providing the customer with even street location of in-transit
packages on a city map. The automatic truck location (AVL) system being tested is
Qualcomm. (DAD reporting only tells the position of the truck at the last reporting; the
driver may not use DAD when arriving at a new stop.)
• Often, the dispatcher needs to reach the driver or courier directly to coordinate operations
with near-by routes or to inform the them of a pick-up. DAD technology is not
sufficient because it cannot reach the driver directly and the driver may be away from the
truck or an extended amount of time. (Foot couriers may not even work out of a truck.)
AVL is not useful for contacting the driver when he or she is away from the truck.
• Wireless inquiry by the customer, into package status and other more static information,
is being developed. This technology will enable the customer to reach FedEx through
wireless communication and make inquiry into the status of a package and other
information like rates and drop-off locations.

69
• Wireless digital comm. between the dispatch the courier directly, not just the truck, is
being planned. Planned deployment of this technology seems to be primarily motivated
to provide to the customer real-time status information about package delivery. With the
current technology, the information will not be transmitted to the local dispatch until the
driver has returned to the truck. This technology can also improve the efficiency of the
goods movement, not just tracking of goods movement.
4. FEDERAL EXPRESS SERVICES OF BAY AREA AIRPORTS
• FedEx predominantly uses Oakland Airport as its West Coast overlay (hub) with very
few flights going into either San Francisco or San Jose, the reason being that Oakland has
no curfew. Absence of curfew enables late night / early morning flight operations. SJ is
outbound only because of curfew. SFO is in & outbound.
• Small airplanes are used to deliver packages to satellite cities like Fresno, Monterey etc.
• The CTVs are large trucks and are operated out of San Leandro to serve all three major
area airports: OAK, SFO and San Jose.
• 10 stations on West Bay; 10 on East Bay. A station is where couriers report to work and
the local delivery trucks ( bread trucks ) and vans are parked when not in use.
• In general, there is one dispatcher per station, with exceptions. In the South Bay, four
stations use one dispatch group. Some stations have more than one dispatcher. A
dispatcher or dispatch group may have 35 - 120 delivery trucks.
• One aircraft is dedicated to freight destined for SFO. However, since OAK is a regional
hub, freight destined for San Francisco may be shipped first to OAK and then transferred
to centers in San Francisco. OAK is a destination for FedEx flights not only from the
national hub at Memphis and the regional cities it serves but also from other large cities in
the nation from and to which there exists sufficient demand.
• CTVs begin to leave the Oakland International Airport at around 1:00 AM and continue
until early morning. Currently, the last departure of CTVs is scheduled at 6:30 AM. If
the actual departure time is beyond 6:30, adjustments to regular routes must be made. If
the actual departure time is beyond 6:50, the current staffing may have trouble handling
the regular traffic without sacrificing the service quality. It is estimated that, if the actual
departure time is later than 7:10 AM, 11 routes will need to be added to each station that
is affected due to the extra travel time caused by traffic congestion. It is also estimated
that, in such a case, 8 stations will be affected. Note that each route is staffed by one
driver and equipped with one dedicated truck. When long delays of truck departures from
airport ramps are anticipated, small vans are dispatched to the airport to directly pick up
the packages.
• They hate bridges and try to avoid using the bridges. In some urgent situations, they
would add a person to the crew of a vehicle without dual wheels or send such a

70
vehicle/crew so as to be eligible for using carpool lanes. Recall that, when the arrivals of
some aircraft or the departures of some CTVs are expected to be late, vans or smaller
trucks are dispatched by the centers to pick up packages at the airports. Also recall that
packages destined for San Francisco may arrive at OAK, rather than SFO. Therefore, in
such cases, vans or smaller trucks dispatched for such purposes need to cross Bay Area
bridges.
5. TRANSPORTATION ISSUES AND NEEDS
• Traffic congestion on I-880 is particularly detrimental; State Highway 101is also quite
congested.
• To improve passage over bridges is a basic issue for FedEx s Bay Area operations.
• To get knowledge about the traffic conditions is very important. They already use radio,
television (e.g., KPIX) and CHP as information sources and do not seem particularly
interested in a link to TravInfo. This may of course change when realize the detailed
functionality of TravInfo.
• They seem interested in the concept of High-Occupancy and Toll (HOT) lanes. The
trucks that may benefit the most from HOT lanes are the CTV. Since they are allowed to
use only the two right-most lanes on freeways, safety issues are likely to prevent CTVs
use of HOT lanes. However, vans may benefit much from HOT lanes because they are
often sent to airports to pick up packages directly when delays at airports are
anticipated..
• They are curious about possible barge services that may facilitate their goods movement.
• they also asked about the status of the hovercraft concept.
• They also like to explore the use of BART for delivering their packages.
• They are curious if there is any plan to double-deck some Bay Area freeways.
6. GLOSSARY
Powership
These are centers equipped with FedEx PowerShip 2¤ which includes all the hardware and
software you need to automate your entire shipping process and to help you process shipments
faster, with fewer errors and less paperwork. FedEx PowerShip 2 is ideal for medium to large
shipping departments or mailrooms that ship 10 to 100 packages per day. FedEx PowerShip 2 is
recommended for organizations that ship 10 or more packages per day, or for Government
Services that ship 25 or more packages per week. FedEx PowerShip 2 is currently available only
in the United States.

71
FedEx Ship and interNetShip
FedEx Ship, the software that made shipping as easy as point, click, and ship. It can enter
shipment information, print a shipping label, schedule a pickup, or track deliveries. FedEx Ship
is currently available in the United States, Canada, Puerto Rico, Japan, Hong Kong, Australia,
Taiwan, Singapore, China, New Zealand and Malaysia.
FedEx interNetShip is a FedEx¤ shipping application that is accessible online via the World
Wide Web (WWW) portion of the Internet. FedEx interNetShip allows a shipper in over 50
countries to print out a bar-coded label on plain paper using a laser printer and ship domestically
(within the United States and Canada only) or internationally to more than 170 countries around
the world.
ShipSite
FedEx ShipSite¤ is a place where one can drop off FedEx packages (up to 20" x 12" x 6") and
pick up FedEx shipping materials, too. These usually comprise of self service boxes at places like
Kinko s, OfficeMax and Staples.
FedEx Authorized ShipCenter¤(FASC)
FedEx provides selected retail packing and shipping centers with special support. In return, the
center formally agrees to cooperate with FedEx in serving the consumer market. After execution
of an appropriate agreement, the packing and shipping retailer may be able to obtain supplies for
use in shipping via FedEx¤ delivery service, and assistance by members of national retail service
representatives.

72
APPENDIX D: SITE-VISIT REPORT - FEDERAL EXPRESS, OAKLAND REGIONALHUB
A visit was arranged to the FedEx Facility at Oakland Airport on 29th
July, 1999 to observe their
PM Operations. Three Tour guides were assigned to the visiting group which comprised of
people from University of California, Berkeley and California Department of Transportation.
The FedEx Facility at Oakland Airport is separate from the other air cargo building where space
has been leased out to the other air cargo service providers. It has a gross covered area of around
194,000 sq. ft. and is their West Coast hub, hence plays a very important role in serving this side
of the country. But still is small as compared to their super hub at Memphis which covers 2.4
million sq. ft.
History
Started at a loss in 1973 under the banner of People Service Profit (PSP) by an entrepreneur who
had a vision of overnight package delivery market, FedEx was the first company to break the one
billion profit mark within its first ten years of inception. One of the main reasons for that being
their ground breaking technology usage like Digitally Assisted Dispatch or Tracking equipment
which is admitted by their rivals too. Currently FedEx serves around 211 countries and has the
most extensive air ground transportation system.
Operations
At the Oakland Facility one of the five different types of operations might be going on. They are
• PM Sort (Small) 6 pm — 9:30 pm
• West Coast Operations Sort 9:30 pm — 1:30 am
• AM Sort 2am — 8 am
• Day Sort 8am — 5 pm
• Weekend Operations (Saturday & Sunday)
Due to the time difference between the two sides of the country, incoming packages are usually
on time apart from weather delays, but outgoing package operations have to be right on the spot.
All the operations are timed i.e. the whole operation has been divided into small tasks which have
been timed and person doing that task is expected to do it in a certain time. For example a sorter
working alone on small packages is supposed to go through 70 packages/minute while two people
working in tandem on big packages are supposed to maintain a sorting rate of 22 package/min.
This way the delays are minimized and identified immediately if occurring at a regular basis.
Routing and Planning

73
As Oakland is the West Coast Hub, it has a Global Office Control Centre (GOCC). Here we
were introduced to the flight planners whose job is to keep track of all the aircraft, their
maintenance schedules and weather conditions in different parts and then come up with an
optimized routing plan. When asked about usage of routing software, we were told that it is
available but not used a lot, although the Technology Department in Memphis is working on
developing something new. Although such software are used for system recovery plans. Oakland
has about 15 incoming and 14 outgoing daily flights which is comparable to their regional hub at
Newark. Indy has 45 incoming and outgoing flights in total.
One interesting point which came up during discussion was the question that, How does FedEx
handle expanded markets ? . The answer was to first change the type of aircraft serving that
market, then maybe doing an in-depth study of the prevailing trends and increase point to point
flights. And only as a last resort, add new planes which eventually means buying new planes.
Operations Interface After GOCC we were taken to the control room where all the sorting operation is monitored with
the help of video cameras. In addition to that all the incoming and outgoing flights were also being
tracked. Any problems like stuck packages on the belt etc. were identified and located
immediately by the supervisor on the screens and were rectified.
Sorting is done with the help of fast moving conveyor belts. The whole process is illustrated in
Fig 1. Packages over 75 lbs are handled separately. There are also two belts for the automatic
laser scanners (MSDS) which measure the dimensions of the package. One for package less than
50 lbs and the other for those heavier than 50 lbs. These dimensions are later used to trigger a
divertor to push the package down the proper slide to the secondary belt at the right time. Any
cargo which is too heavy, too bulky or contains hazardous materials is deemed non conveyable
and is moved separately through the sort process. Hazardous material packages are only handled
by specially trained people.
Cargo Handling Equipment
After sorting, all the packages and small boxes are put into designated containers. These
containers are then weighed and handed over to the load master who is trained to place them in
the aircraft. They are taken to the aircraft with the help of tugs. Most of this part of building had
rollerized floor to ease the movements of the containers.
FedEx use three different types of containers, they have different shapes to fit in different parts
of the aircraft e.g: belly and hence have different weight capacities ranging from 1500 lbs — 10,000
lbs. Most of them have see through plastic hence it can be easily seen whether there is more
space in the container or not. After every flight these containers are checked for their
airworthiness and if some damage is done, they might be downgraded to ground use only.
Intransit Visibility

74
FedEx has been the leader in information technology usage and it is no different now as they
incorporate Internet and other media into their tracking system. Barcode labels are affixed on each
package or box and after being loaded onto the container it is known which package went in
which container.

75
APPENDIX E: SITE-VISIT REPORT - UPS WESTERN REGION HUB AT ONTARIOINTERNATIONAL AIRPORT: HIGHLIGHTS OF VISIT ON MAY 4, 2000
General Description of the Facility
• Importance: The western hub of UPS covering area to the west of Mississippi. (Louiville is
the national and eastern hub of UPS U.S. operations.) In addition to these two regional hubs,
UPS has several gateways , e.g., San Francisco. These gateways also serve small airports
nearby. The distinction between a hub and a gateway in the terminology of UPS is in the
amount of traffic it serves. (These gateways can be considered as (smaller) hubs, in the
conventional sense.)
• Size: 140 acres, next to the Ontario International Airport
• History: Built in 1992 at a cost of $50M
• UPS selected Ontario as its western hub over Oakland, primarily due to the adverse weather
conditions (i.e., fog) at Oakland.
Fleet:
• UPS owns 15 Boeing 757 and 23 Being 767. It leases Boeing 747 and DC 10. It also arranges
short-term leases for Boeing 757 (for a couple of weeks) to deal with occasional large volume.
• Last year, UPS purchased Air Bus 300 series in an effort to become self-sufficient in terms of
capacity.
• UPS uses Ameriflight prop plane for feeder flights to and from small airports in Southern
California. On a work day, it uses 10 - 17 small feeder planes, e.g., Beech 99, Navaho,
Metroliner, etc. The flight time for these small feeder planes is at most 1 hour and 10
minutes.
Operations:
• Service Grades:
• 4-6 ground;
• 3-day select (which may take only two days);
• 2-day; next-day ( including AM and PM);
• next-day Early AM (8.30AM). (Many law firms, mortgage companies, etc. use Next-
Day Early AM services to ship documents to other areas in the Southern California
region.) They also offer charter services. Doing business in approximately 200 counties;
On-site customs agents
• Major Activities:
• sorting for outbound traffic 7:00 PM - 2:30 AM;
• west-coast next-day sort begins at 10:00PM.

76
• Sorting for inbound traffic begins at 3:00 AM with the last flight from Louiville arriving at
4:24.
• Miscellaneous sorting at 3:00 PM.
• 7-10% of its airbills (over the whole network) are transported completely on the ground; they
are almost all 3-day select services over the weekend.
• Containers:
• LD9 - smallest, used on Boeing 767; M1 - largest, used on Boeing 747; A2 - newest,
transparent and light).
• It uses pallets (cookie sheets) too, not just containers. In fact, 70% of its cargo is placed
on pallets. On large aircraft like Boeing 747, almost all cargo is placed on pallets.
• Miscellaneous:
• 30% of all cargo are packages that are small enough to go through a regular coat hanger;
sorting for such packages is often called hanger sorting. Hanger-sorting arrival cargo for
distribution to Southern California and nearby region is performed very efficiently; one
person can sort 1200 items per hour.
Technologies Recently Adopted or Planned:
• To audit customers reported weight and volume (for safety and other purposes), UPS
bought 4 machines that can accurately estimate both the weight and size of a piece of cargo.
The machine costs $100,000, but the investment paid for itself in only one month.
• Aircraft turn-around time is 45 minutes for Boeing 757, 30 for Boeing 727 and 60 for DC8.
Therefore, any technology that can help reduce the turn-around time would be very helpful.
UPS is investigating the possibility of adopting some type of moving platform to reduce the
turn-around time. (FedEx is already using this technology. UPS began air cargo operations in
1983 but became an airline in 1985. Unlike FedEx, which began as an airline, UPS had to
learn airline operations and adjust its ground shipping operations to integrate with its airline
operations.

77
APPENDIX F: SITE-VISIT REPORT - SOUTHERN CALIFORNIA LOGISTICSAIRPORT: HIGHLIGHTS OF VISIT ON MAY 4, 2000
General Description of the Facility
• Location: 50 miles northeast of Los Angeles County; 45 miles north of Ontario International
Airport; 3 miles off I-15.
• Size: 5,000 acres
• Runways: 2 10,000 ft run ways, one 9,000 ft runway
• One hanger: adequate for DC 10, but the tail of B747 is too high for the hanger.
• Many fighter-plane facilities
• Ramp structure: 18-inch concrete ramps
• Ramp space: 1,000,000 sq. ft ramp
• Capable of performing A-D checks (by Pemco and Southern California Aviation)
• Many base housing units are available but unused because of the depressed local rental
market.
• Good weather - 360 clear flying days
History:
• Construction began in 1941, and airport opened in 1942 as an Army Airport.
• The George Air Force Base was closed in 1989.
• Initially, the plan was to convert the air base into a cargo airport. But, the direction changed,
and the current plan is to develop this airport into a multi-modal logistics hub.
Development Goal:
• Multi-modal logistics hub:
• highway trucking
• rail to seaports and inland
• fully certified part 139 commercial airport
• lower real-estate cost; lower labor cost
• break bulk for ocean freight
• free trade zone: 1,800 acres
• Air: Under the management of Stirling Airports International
• Rail: SCLA enlisted Burlington Northern and Santa Fe Railway Company (BNSF) to
provide rail services for manufacturing and distribution companies located at SCLA.
• Third Party Logistics: SCLA enlisted Redwood Systems, a wholely-owned subsidiary of
Consolidated Freightways, to provide SCLA users with freight forwarding and third-party
logistics.
• Preliminary development plan has been completed.
• No passenger traffic potential

78
• Will focus on cargo: non-scheduled or scheduled all cargo flights
• Caltrans has made the commitment to improve access to I-15 and Route 395.
• Selling points:
• goods movement corridor
• all modes, with customs
• no capacity and airspace constraints
• agility: little environmental concerns; private-public partnership
• Some forecasts: 45% increase in Southern California population (16% in Northern California);
Cargo for Southern California airports is forecast to grow from 3.0 million tons to 9.0 million
tons over the next twenty years. (SCAG 1998 regional Transportation Plan)
• The developers and the Victorville officials are very hopeful.
• ($1.5B appropriated for the development of the airport?)
Current Activities:
• SwissGlobalCargo - a joint venture of Panalpina (an integrated forwarder and one of the
world s leading cargo service providers) and SAirLogistics (the cargo arm of Swissair parent
company SAirGroup) - commenced scheduled service on Oct. 25, 1999, with one rotation per
week plus charter operations with a 747-200F freighter importing approximately 100 tons of
electronic and computer equipment as well as wearing apparel from Hong Kong and South
China into the U.S..
• Freight tonnage: 120 tons inbound per week; investigating opportunities to build outbound
freight
• Contract for maintaining Delta aircraft
• Converting passenger planes to cargo planes
• Grew from 0 to 32,000 operations in one year with 12 all-cargo flights and a revenue of
$1.3M.
• Passenger traffic: 7,000 passengers per month for personnel transportation to and from Fort
Erwin nearby.
• Rent airport facilities to businesses as incubator for the logistics center.

79
APPENDIX G: SITE-VISIT REPORT - NORTHWEST AIRLINES: HIGHLIGHTS OFVISIT ON MAY 5, 2000
Northwest Cargo Fleet:• freighter: 10 all-cargo aircraft; bought 2 in the past 2 years
• passenger aircraft (belly capacity)
Daily Activities at LAX:• freighter: 1 flight for Pacific Rim
• passenger: 18 flights for Pacific Rim; 5 flights for Hawaii.
Facility:• Buildings built by Northwest on airport property.
• Buildings must be turned over to the airport after 25 years.
Selling Points vs. Other Airlines or Integrators• anything heavy
• connectivity to Asia and Europe
• reliability
Technologies:
• use ETV (Elevated Transport Vehicle) to lift and shelf containers; $850,000 (excluding the
racks)
• No barcoding; not really needed
International services to Pacific Rim:• Select 100 - must arrive by agree-upon arrival time
• Select 300 - general 2 or 3 days
• Select 700 - near future; subject to space availability
• (No spot-rate services to fill the space .)
Domestic General Rates (Tariff): (in U.S. Dollars)
Continental U.S. Hawaii Alaska
1 - 50 lb 63 89 79
51-70 lb 83 119 109
71-100 lb 120 139 129
• Domestic Specific Air Service guarantees space on a domestic flight, but with a charge of
170% of the general tariff.
• 10,000 lb weight can be guaranteed at the price of $2.5 - 3 per kilo. At this expensive price,
passengers will be bumped to accommodate the freight.

80
Business Growth:• 1999: 184,000,000 lb; additional 20,000,000 U.S. Mail
• 1998: affected by a strike
• 1997: 164,000,000 lb.
• Return Rate: 6.5%-7.5% (vs. 4-5% for passenger business)
Operations:• busiest: 8:30 PM - midnight for the take-off time at 2:30AM for the freighter plane bound for
Asia
• Loading priority: passenger bags, U.S. Mail, air freight. When cargo must be bumped, live
tropical fish and agricultural items tend not to be bumped.
• weight forecast performed by the dispatchers located in Memphis 2 - 3 hours before
departure time; weight balance etc. also performed by the dispatchers.
Issues:• No truck space at busy times
• Train track immediately outside of the gate of the cargo terminal.
• Approximately 10 trains per day. The track mainly serves Long Beach seaport, whose
business has been booming. (These trains do not go through the Alameda Corridor.)
• Aircraft parking space assigned by the Tower may be far from Northwest s cargo facility.
This reduces the efficiency significantly.
Cargo types: (percentage is not clear.)
• computers,
• parts,
• agriculture (e.g., asparagus, flowers, pineapples from Hanalulu.),
• etc.

81
APPENDIX H: SITE-VISIT REPORT - NIPPON CARGO AIRLINES: HIGHLIGHTS OFVISIT ON MAY 5, 2000
NIPPON CARGO AIRLINES
Northwest Cargo Fleet:• freighter: 9 B747-200Fs
• no passenger aircraft
• Hub: Narita International Airport near Tokyo, Japan.
Daily Activities at LAX:• freighter: 5 flights for Pacific Rim per week
Technologies:
• No ETV (Elevated Transport Vehicle) to lift and shelf containers; $850,000 (excluding the
racks)
• No barcoding; not really needed, according to the top manager at the facility.
FUNDAMENTALS OF FORWARDING
What freight forwarders do and how they do it.
Freight forwarders solicit freight business from different shippers. They consolidate the freight
before transporting it to air carriers. The complete shipment is actually arranged by the first
major carrier on the shipment route. The forwarder will transport the freight to the cargo duck of
the air carrier at the origin airport. The major carrier arranges the next legs of transportation,
and transport the freight to the operator of the next leg. To the air carriers, these forwarders, not
the upstream shippers, are the customers. Although individual shippers can deal directly with
air carriers, the vast majority of an air carrier s business is with forwarders.
How the freight forwarders make money.The unit, i.e., per kilo or per pound, charge for the air carriers freight service depends on the
volume. The high the volume, the lower the unit charge. The rates the forwarders charge are
lower than what the carriers would have charged the individual shippers had the shippers deal
directly with the air carriers, and the difference between the their charges and the air carriers
charges is the primary source of their income.

82
APPENDIX I: SALIENT FEATURES OF INTEGRATED AIR-EXPRESS FORWARDING
This appendix provides details for the salient features of the operations of integrated air-express
forwarding, particularly the first ten of the following.
1. Time-definiteness, Whether or Not Overnight, at an Acceptable Cost
2. Customer Satisfaction in the Simple Forms of Timely Delivery (via Contractual Obligation)
and Affordable Charges (and Damage-free Delivery)
3. Timely Delivery Necessitating Efficient Transportation (Fast Yet Affordable), which
Necessitates Close Tracking of Freight Movement
4. Timely Delivery Necessitating Efficient Intermodal Transportation, which Necessitates Close
Intermodal Tracking of Freight Movement
5. Efficient (Fast yet Affordable) Intermodal Freight Transportation and Monitoring: Hot Bed
for Advanced Technologies
6. Synergistic Opportunities and Requirements for Technology Adoption: Benefiting Both
Freight Transportation and Freight Tracking (Although Tracking Efficiency Often Cited as
the Main Impetus, Perhaps for Marketing Reasons)
7. Intensive Industrial Engineering Supporting Operations and Technology Adoption Decisions:
Performance Measures and Analytical and Simulation Modeling for Predicting Performance
Improvement
8. Accountability of Performance
9. Continuous Incremental Improvement Due to Competition and Based on Profit Reinvestment
10. Transportation Systems: A Major Source of Exogenous Disturbances
11. Integrated, intermodal hub-and-spoke air transportation systems and use of trucks for hauls
between cities to the extent possible.
1 Time-definiteness, Whether Or Not Overnight, at an Acceptable Cost
Although initially the primary services provided by air-express are overnight or next-day delivery
services and they thrived on such services, a significant amount of their current business in recent
year has been the second-day or third-day delivery or other grades of services. On one hand, the
majority of their current business remains to be overnight or next-day delivery. Therefore, fast
delivery remains to be a primary selling point for the integrators. On the other hand, regardless
of the service grade, a common feature is time-definiteness, i.e., the delivery of the freight by a
specified date and time. Therefore, reliability is another primary selling point for the whole
industry.
We note that although the operations performed for a particular item of freight depend on the
service grade, the planning tasks of the integrators remain to be driven primarily by the overnight
delivery services. The availability of transportation infrastructure provided by the public sector
that is sufficiently efficient to enable the integrators to meet their contractual obligations
continues to be a primary concern of the integrators. from the public-sector providers of the
systems.

83
2 Customer Satisfaction in the Simple Forms of Fast Delivery, On-Time Delivery (viaContractual Obligation), Affordable Charges and Tracking (and Damage-free Delivery)
The level of satisfaction experienced by a customer of the integrators is a function of four simple
criteria: fast delivery, on-time delivery, affordability and intactness (FOAI). In the language of
the recent quality movement, these are called subjective quality characteristics, with the qualifier
subjective referring to the level of quality (or customer satisfaction) perceived by the customer.
These subjective quality characteristics must be translated into objective quality characteristics
for the personnel of the service provider to monitor and improve their internal operations.
Typically, it is difficult to develop a complete set of subjective quality characteristics. However,
in the case of integrated air-express forwarding, the simple set of four quality characteristics
captures the performance of an integrator, in the minds of the customer, quite well. Concrete
and simple measures can be and have been developed by the integrators to measure the customer
quality characteristics. FedEx has been using eleven such subjective quality characteristics called
Service Quality Indicators (SQIs) to measure the corporation s performance, as it is perceived by
its customers. The relative importance of the measures has also been quantified as relative
weights. The eleven SQIs and their relative weights are summarized in Section 2.5. The
concreteness and the simplicity of the measures enables precise measurement and allows accurate
measurement, with the aid of technology, of the integrators service quality.
Recently, the customer of the integrators have demonstrated a strong desire to know where their
freight items have been delivered on time, and the integrators have tried to provide tracking
information to the customer as precise, accurate and soon as possible.
Since the intactness of a piece of freight has not been a big issue, we will focus on fast-delivery,
on-time delivery, affordability and tracking, i.e., FOAT, in the rest of this document. In addition,
intactness seems to be controlled completed by the integrators and the public sector seems to
play no role at all. Note that the public sector plays important roles only in fast delivery, on-
time delivery and affordability but not in tracking of freight movement, although the real-time
information provided by the FAA via the Internet regarding the location of an aircraft in the
National Airspace System is an integral part of an integrator s tracking system.
3 Fast and Affordable Delivery Necessitating Efficient Transportation and On-TimeDelivery Necessitating Close Tracking of Freight Movement
Fast delivery together with affordability necessitate efficient transportation of freight. To ensure
that an item will be delivered on time, the whereabouts of the item in the whole delivery system
must be precisely and accurately tracked. Without such tracking, the integrators cannot
determine if the transportation of a particular item needs to be expedited or not. Such expedition
is particularly important when the integrators operations experience unplanned disturbance.
As will become clear later, a primary source of disturbance to the integrators operations is the
variability of the level of service in the transportation systems, either in the air or on the ground.

84
Another major source of variability is the demand. Numerous routing decisions and scheduling
decisions are routinely made real-time to accommodate such variability and to ensure fast and on-
time delivery. Critical input to the decision-making processes include the precise and accurate
location of the items involved. Therefore, tracking of freight movement is a critical element of the
integrators operations.
As mentioned earlier, the customer of the integrators also desire detailed tracking information.
Additional hardware and software are needed for provision of the information to the customer.
Note that tracking of freight movement is necessary for the integrators internal operations
regardless of the customer s desire for information about the location of the freight.
4 Fast and Affordable Delivery Necessitating Efficient Intermodal Transportation; On-Time Delivery Necessitating Close Intermodal Tracking of Freight Movement
The very nature of integrated air-express forwarding involves multi-modal transportation, and the
modes include air transportation, trucking and walking. Note that a significant amount of
delivery in the downtown of a metropolitan area is made on foot. Even for delivery in suburban
business parks, the driver of a delivery vehicle spends a significant amount of time delivering
packages inside buildings and hence is away from the communication devices installed on the
vehicle. This actually plays a significant role in the integrators technology requirements and
adoption. The need of the dispatchers to communicate with foot-couriers motivated their
adoption of hand-held wireless digital communication device, which can function in the absence
of a vehicle.
Fast and affordable delivery necessitates efficient transportation not only within each mode but
also across different modes. Moreover, close tracking of freight movement must also be
performed across different modes.
5 Efficient (Fast yet Affordable) Intermodal Freight Transportation and Monitoring: HotBed for Advanced Technologies and Traceability
It should be clear that the requirements for efficient intermodal freight transportation and for
efficient intermodal tracking of freight movement make the integrated air-express forwarding
industry a natural hot bed for technology adoption, including ITS and other technologies.
However, note that the integrators adopt some technologies for very specific reasons, and do not
adopt other technologies also for good reasons.
For example, they adopted the hand-held communication device mentioned above to enable
communication between a driver and the dispatcher, which enables more efficient delivery as well
as pick-up. Such communication enables combining of two trips into the same building, one for
delivery and one for subsequent pick-up. It is critical when a disturbance to the routine
operations occurs and coordination with the dispatcher and other drivers is necessary.

85
Another example is FedEx s use of Geographical Information System (GIS) to optimize off-line
or real-time its truck routes. In the late 1960s, the U.S. government began an initiative to map the
entire U.S.. The result accomplished by the U.S Census Bureau through the 1970 Census was
the release of the 1970 Dual Independent Map Coding (DIME), which contained block
information and street segment. The DIME files were updated in the 1980 census. FedEx
explored the possibility of using GIS to improve its operational efficiency as early as 1976 and
again in 1987. Both attempts were halted because of the inconsistent map quality and the fact
that the data were being updated every 10 years. FedEx finally succeeded in its third attempt
with the 1990 census. This goes to show that integrators consistently look for advanced
technologies to help improve its operational efficiency.
6 Synergistic Opportunities and Requirements for Technology Adoption: BenefitingBoth Freight Transportation and Freight Tracking
The ability of dispatchers to communicate with truck/van drivers or other delivery workers
enables both efficient transportation of freight and real-time freight tracking. Communication
between dispatchers and trucks and that between dispatchers and drivers, who may be away
form the trucks for an extended period of time, have different requirements. Separate
technologies have been developed for the two types of communication. However, synergy
opportunity exists to combine the two functions into one single communication technology. The
resulting technology may not be optimal for either of the two types of communication.
However, it is optimal in the sense that it meets both requirements at the same time.
Although efficiency of freight tracking has often been cited as the main impetus for adopting
advanced communication technologies that enables real-time communication between the
dispatchers and the drivers or other delivery workers, perhaps for marketing reasons, the
communication technologies also further enable efficient transportation of freight.
7 Intensive Industrial Engineering Supporting Operations and Technology AdoptionDecisions: Performance Measures and Analytical and Simulation Modeling forPredicting Performance Improvement
The adoption of ITS or other technologies results entirely from the specific needs or
opportunities to improve the quality of the integrators services. A common answer by the
personnel of the integrators to the question of what performance do you measure? is We
measure everything. The truth of this answer is evident during our site visits. Example
performance measures include:
• Package density of a container is a major performance measure for the air portion of air
cargo movement .
• Stops/hr, miles/stop and stops per FTE (full time equivalent) are also kept track of for
measuring productivity.

86
• Travel times for all segments of a route are estimated and then compared with the actual
values and modified if needed (usually done if the difference is more than 4 minutes).
• Also analyze drop box locations and routes.
• Fuel consumption.
These and a large number of other performance measures have been derived from the eleven SQIs
mentioned earlier and form the basis for many operations decisions, e.g., re-design of routes,
work load analysis, driver evaluation, etc.
A decision to adopt a specific technology has always been preceded by rigorous cost-benefit
analysis performed by personnel specializing in industrial engineering based on a large number of
current and predicted objective (internal) performance measures. In other words, one can tracethe adoption of any technology to specific subjective quality characteristics/measures through
specific objective quality characteristics/measures.
8 Accountability of Performance
Equipped with detailed information regarding air cargo operations obtained through close
monitoring, performance issues, including operational inefficiency or anomalies can be more
easily identified. The air cargo industry in general adopts a two-prone approach to resolving
these performance issues: institutional and engineering accountability of performance.
First of all, the operational unit is held accountable for any performance problem occurring in its
operations. As mentioned earlier, a common answer to the question of What do you measure?
is We measure everything. A common answer to the follow-on question of What happens if
the performance does not meet the requirement [e.g., the occurrence of operational delay]? is
We have to explain everything. This accountability encourages the personnel to prevent and
anticipate possible performance issues from happening.
Often issues of operational efficiency can not be resolved or anticipated by the operational unit
alone. The industry clearly recognizes the importance of industrial engineering, and provides
technical support for the operational unit in monitoring its performance, identifying trends,
anticipating issues, proposing solutions. A FedEx industrial engineer indicated that, in the Bay
area at least, FedEx assigns One industrial engineer for every three stations to monitor and
support its ground operations.
9 Continuous Incremental Improvement Due to Competition and Based on ProfitReinvestment.
Efficiency improvement has been a continuous and incremental process, partly motivated by the
desire to reduce cost for attracting more business (including packages and customers) and partly
due to competition. It is commonplace for an integrator to announce a plan to adopt a
technology after another integrator announced a similar plan.

87
A recent example is the announcement by UPS that it would equip its drivers hand-held trackers
with wireless communication capability so that the drivers can transmit the tracking information
a few seconds after a package is delivered and signed by the recipient. Prior to this, the
information cannot be transmitted until the driver goes back to the truck. The air-express
integrated forwarding industry has gotten so competitive that shaving minutes off from the delay
in getting the receipt information to the customer becomes an important marketing tool. FedEx
announced shortly after the UPS announcement a similar plan to enable almost real-time
reporting of package status.
Like other industries, there are leaders and followers in the air cargo industry in terms of
technology adoption. This does not mean that the followers do not have sufficient far sight.
Instead, all major integrators have sizable industrial engineering departments to carefully and
rigorously study the cost and benefits of technologies; a technology justifiable for one integrator
is not necessarily justifiable for another one. For example, for years, FedEx and UPS trucks have
been able to transmit tracking information directly from the trucks to the dispatch centers via
wireless communication. Airborne Express, however, still uses the public telephone system to
transmit the tracking information stored in the hand-held tracker , including a barcode reader and
other tracking hardware and software, using a special device coupling the tracker and the handset
at a public phone booth. Airborne is actually experimenting a wireless communication system
that transmits the tracking information from a truck back to the dispatch center via satellite.
According to a manager of Airborne Express, the cost and benefit analyses performed by the
different integrators and different conclusions reached by the different companies are likely the
result of the differences in market niche, existing fleet and other company-specific circumstances.
(FedEx and UPS have also used on-board console (computer) for years and Airborne Express has
recently been experimenting its use, in conjunction with the wireless communication capability.)
The adoption of leading technologies by the leaders often proves the technology and, perhaps
more importantly, drives the cost down; the followers then adopt the technologies to improve
their own operations.
10 Transportation Systems: A Major Source of Exogenous Disturbances
Despite the very tight operations of the integrators, much of their operations are affected by
factors out of their control. Major exogenous disturbances include the delays due to recurrent or
non-recurrent congestion in transportation systems, including the National Air Space System, the
airports, and the highways and surface streets near or away from the airports. Such exogenous
disturbances are extremely harmful for the integrators time-definite services. The Bay Area
dispatch managers gave the following example.
Large trucks begin to leave the Oakland International Airport at around 1:00 AM and continue
until early morning. Currently, the last departure of such trucks is scheduled at 6:30 AM. If the
actual departure time is beyond 6:30, adjustments to regular routes must be made. If the actual
departure time is beyond 6:50, the current staffing may have trouble handling the regular traffic

88
without sacrificing the service quality. It is estimated that, if the actual departure time is later
than 7:10 AM, 11 routes will need to be added to each station that is affected due to the extra
travel time caused by traffic congestion. It is also estimated that, in such a case, 8 stations will be
affected. Note that each route is staffed by one driver and equipped with one dedicated truck.
When long delays of truck departures from airport ramps are anticipated, small vans are
dispatched from individual distribution centers to the airport to pick up the packages directly.
Recurrent traffic congestion on highways and city streets is common in California metropolitan
areas and necessitates a larger fleet to compensate for the associated delay; non-recurrent
congestion occurs often and yet is difficult to predict. The integrators tend to live with the
congestion problem and adapt to it by obtaining traffic information at best as they can and by
adjusting their routes and schedule dynamically. They are in great need of accurate traffic
information and travel time estimates. FedEx dispatchers indicated that they watch TV traffic
reports, listen to radio traffic reports, examine Caltrans video camera images, and communicate
with their drivers to obtain such information and react to it real-time. Due to the complexity of
route/schedule adjustment, the dispatchers make adjustments manually without using any
computer software. (They do use computer software provided by their headquarters to help
optimize routes and schedules off-line for planning purposes only, but not for real-time
operations.)
Other disturbances include demand variability. However, some seasonal demand variability can
be predicted, and operations can be adjusted accordingly. Also, due to the close monitoring of
the freight, the actual demand, especially the additional demand, can be accurately estimated, and
adjustments can be planned and quickly implemented once the demand enters the integrator s
pick-up and delivery system, particularly the computer tracking system.

89
APPENDIX J: THE GROUND OPERATIONS OF INTEGRATED AIR-EXPRESSFORWARDING AND THEIR SALIENT FEATURES
Major ground operations are introduced in Section 1. Their salient features are discussed in
Section 2.
1 Integrators Cargo Operations on the Ground
We first describe the general nature of the integrators ground operations in Section 1.1 and then
focus on the freight transportation operations and the freight tracking operations in Sections 1.2
and 1.3 respectively.
1.1 Nature of Operations: Efficient Link Between the Customer and the Airport
Ground operations are performed to (a) pick up freight items from the stationary drop boxes and
random pick-up locations (in response to calls for pick-up at random) and then transport them
appropriate airports on or ahead of schedule and (b) to pick up freight items from the airports
and then deliver them to the customers at random locations before the delivery deadline. Note
that (a) and (b) may be and are performed by a truck/van simultaneously. But, the randomness
of either the pick-up locations or the drop-off locations makes efficient routing and scheduling of
the trucks/vans more difficult. Although the drop-off locations are random, the locations are
known at least one day prior to the delivery deadline. However, the pick-up locations may
become known very shortly before the pick-up deadline. Efficient combination of (a) and (b)
requires efficient communication among the customer service agents, the dispatchers and the
couriers. In downtown or other areas with large buildings, couriers are on foot most or all of the
time. The ability of dispatchers to communicate with such couriers directly (in addition tocommunicating with the trucks/vans) is critical for such operational efficiency.
The manager of Airborne Express - Sacramento indicated that most business is repeat business
and that, in his operations, approximately 80% of the everyday pick-ups and drop-offs is made
for regular customers. In other words, approximately 20% is made for random customers.Although, when compared to 80%, this percentage is small, it makes the routing and scheduling
of trucks/vans for local delivery certainly not routine work.
Fast worsening traffic congestion in the surface transportation systems, including recurrent and
non-recurrent congestion, as well as aircraft delays make the ground operations more and more
difficult and costly. To deal with recurrent ground traffic congestion, the integrators have to
expand their truck fleet (to serve the same level of demand); to counter non-recurrent ground
traffic , they have to reserve spare trucks ; to compensate for late arrival of aircraft, smaller
vans intended for local distribution have to be sent to appropriate (far away) airports to pick up
arrival freight directly. All these make the routing and scheduling more difficult and make theservices more costly.

90
An increasingly important customer demand is easy access to real-time tracking information.
Because of the wide-spread practice of just-in-time and similar operations, the information about
the predicted arrival time of expected freight items becomes an important input to the scheduling
process of the operations. As a result, tracking information becomes not only important to thesender, who cares about the timely delivery of the freight items as part of the contractualobligation, but also to the receiver, who cares about the as-early-as-possible receipt of the itemsto perhaps resume normal operations and about an accurate estimate of the arrival time to planfor the resumption of normal operations.
Responding to this demand, the integrators have invested in communications and information
technologies to improve the tracking of the whereabouts of their freight items and to allow instant
access of the tracking information by their customers.
1.2 Freight Transportation Operations
Major determinants of the organization of the operations in a city include not surprisingly the
size of the demand and the size of the city. There are no direct freight flights into cities that are
small and cannot serve as a hub for neighboring cities for obvious reasons, and the freight going to
those cities would be first trucked in from nearby cities that do have such direct freight flights.
Large cities would have direct freight flight into them.
Depending on the actual city size and the demand size, the airport used by an integrator may
serve as the only center of ground operations for the whole city. For example, both Airborne
Express airport and ground operations in Sacramento are centralized at the same Mather airport
cargo facility. (Airborne Express at Sacramento has recently opened up a remote distribution
center at an location far away from Mather airport, after detailed cost and benefit analysis.) The
number of dispatch centers in such a city depends on the city s size, the ability of dispatchers
and perhaps also on the limitation of a human being serving as a dispatcher. In Sacramento,
Airborne Express partitions the city into two dispatch zones, one on the west while the other on
the east side of the metropolitan area; each of the two zones is served by approximately 30 vans
and one dispatcher.
However, the FedEx ground operations in the San Francisco Bay Area has a two-tier structure.
To serve the area, the freight is first distributed to local distribution centers by large trucks;
smaller vans then further deliver the freight to the individual or corporate customers. There is no
direct delivery from the airport to the customers, except for some recently offered new services
which provide earlier delivery time and later pick-up or drop-off deadlines for customers located
near the airports used by the integrators for freight transportation. There are ten distribution
centers on East Bay and ten on the West bay. However, the dispatch function of several South
Bay centers are consolidated into one physical location. Each FedEx dispatcher in the San
Francisco Bay Area dispatches approximately 30 vans, which is similar to its Airborne-Express
counterpart in Sacramento.
91
Some details regarding individual integrators dispatch operations are given in Appendices B and
C. A list of subjects that was developed to guide the discussion with the facility managers of the
integrators during our site visits is given in Appendix A.
1.3 Tracking Operations
Integrated air-express freight forwarding industry is a highly competitive one, despite its fast
growth in recent years. Major overnight-delivery companies have in recent years competed
aggressively to offer the earliest next-day service. However, before-9-AM delivery is now
routinely available, and providing earlier delivery services becomes increasingly difficult because
of not only traffic congestion on the ground but also congestion in the airspace. These companies
are currently competing fiercely in how fast information about a freight item can be made
available to their customers.
UPS seems to be the current leader in this area. Prompted by its customer demand, e.g., the
receipt of more than 800,000 tracking inquiries via UPS Internet website per day and 120,000
customer-service calls inquiring delivery status, UPS announced in June 1999 that it would invest
$100 million over the next two years to speed up its electronic package-tracking system and it
has started to equip 50,000 drivers and delivery workers with electronic devices capable of
instantly transmitting data about a delivery to the company s tracking network. The new device
will replace the hand-held computers currently used in UPS delivery trucks, which cannot
transmit any data by themselves but can download the information to the communication device
installed on the truck for transmission. (In other words, with the current technology, the delivery
information cannot reach the company s tracking network until the driver has returned to the
truck and made the transmission.) The new device will make the delivery information available to
the customer seconds after the delivery via either Internet or customer-service calls,
approximately 30 minutes faster than the current system. As mentioned earlier, FedEx
announced a similar plan shortly after the UPS announcement.
Airborne Express trucks/vans are not currently equipped with wireless data communication
capability with its tracking computer systems, not to mention its drivers and delivery workers.
(The dispatch function is carried out via voice-communication technology.) However, Airborne
does recognize the importance of provision of tracking information. It uses the following very
inexpensive technology. Periodically, the driver goes to a public telephone and transmit the data
residing on the hand-held electronic tracker through the public phone system with the help of a
portable modem (to be fitted onto the handset of the telephone). As mentioned earlier, Airborne
is experimenting the installation of a computer and communication system on its trucks and vans.
However, there has been no announcement by Airborne as a response to UPS announcement of
its decision to equip its drivers with the capability of wireless data communication.
2 Salient Features of The Integrators Cargo Operations on the Ground
Salient features of the integrators ground operations include the following:

92
• Monitor closely the performance of routes, including routes between the airport and the
distribution stations and the routes from the distribution stations to the customers. They
keep detailed travel time data for these routes and adjust the routes, schedules, the
number of trucks serving the routes, etc.. In other words, they adapt to the worsening
traffic conditions and make sure that they meet their contractual obligations to their
customers. They claim that they have historical data on route travel time, although only
recent data are readily accessible and the rest are have been archived.
• Monitor closely the performance of drivers and delivery workers. With the technological
capability adopted to facilitate freight transportation and freight tracking, the integrators
can easily and closely monitor the performance of their drivers and other delivery
workers.
• The integrators define the operational procedures precisely and clearly for efficiency
maximization. For example, UPS drivers are instructed to hold their truck/van keys in a
particular way while leaving their vehicles to prevent lock-outs, to maximize their
efficiency in handling transactions with their customers, etc. These drivers have been
trained to interact with their customers in particular ways so as to minimize delays and to
maximize efficiency of pick-up or delivery at customer sites.
• Anticipate external disturbances and maintain the ability to counter the disturbances with
dynamic and flexible operations. For example, when the large trucks transporting freight
from the airport to the distribution stations may be delayed, small vans may be
dispatched to the airport to pick up directly the freight destined for the corresponding
distribution stations. Also, when such small vans may experience traffic congestion and
delays that may compromise delivery deadlines, an additional employee is assigned to
ride the small vans so that the vans can legally use HOV lanes. (This is actually a
common practice in FedEx s operations in the San Francisco Bay Area, particularly when
bridge crossing during or near peak commute hours is necessary.)
• Use computer software developed by company R&D staff for off-line route planning but
perform real-time dispatching manually (by human dispatchers and without computer
intelligence). FedEx developed Courier Route Planner (CRP) to provide FedEx station
operations with a GIS tool to help optimally and efficiently (a) restructure courier routes
and (b) manage daily volume fluctuations. Prior to the availability of CRP at FedEx,
region-wide route restructuring was required every three years to accommodate changes in
the demand and the operating environment, but had been a very labor-intensive effort. In
practice, such restructuring occurred less often than required. CRP reduced the effort
from three weeks to three days; the ease of such restructuring enabled FedEx to more
dynamically restructure its routes more often and improve its operational efficiency.
(Note that incremental and minor adjustment to truck routes occur continuously.)
However, the dispatchers we visited with indicated that they do not use computer tools
for real-time dispatching because real-time adjustments are mostly due to unexpected
changes in the operating environment, e.g., non-recurrent traffic delay or unexpected

93
volume and location of demand, and such changes are difficult to anticipate and be
programmed into CRP. Human adaptability and flexibility tends to be best suited for the
resolution of such situations. The application of GIS at FedEx and possibly other air
freight companies will be discussed in more detail later.
• Anticipate possible higher-than-expected demand and possible delays (using real-time
tracking data or other longer-term data) and adjust routine operations to accommodate the
deviations, including mobilization of additional resources, e.g., increasing work hours by
temporary staff, contracting freight movement with passenger airlines (with belly cargo
capacity).
• Analyze options in detail and carefully in expanding existing facilities, e.g., decision
between on-airport expansion vs. off-airport expansion, determination of location of off-
airport facilities. The accessibility to not just one major highway but multiple highways
is considered very important for the locating new or relocating existing distribution
stations. For example, major reasons why Airborne Express moved to Mather include the
fact that Mather has easy access to multiple freeways in the area. This is important
because Airborne does not want to be stranded at its central facility during any major
traffic accidents/incidents. In general, regional development plans and transportation
development plans are important input to the decision making process. For example, in
determining Airborne Express new central location in Fresno, the management considered
the long-term traffic condition as a major factor in its decision making.
• Intermodal operations span not only the more conventional modes of transportation like
aviation and trucking modes but also the walking mode.
• The integrators adopt technologies to satisfy their concrete and specific needs. For
example, they do not value the automatic vehicle location (AVL) technology as an
effective tool for local delivery trucks/vans, but do value it and use it for tracking long-
haul trucks. This is because the dispatcher usually knows where the trucks/vans are by
their frequent communication with the truck/van drivers. When the driver is away from
the truck/van, the vehicle s location can be easily inferred as the location at which the
driver reported during the previous conversation. (What the dispatchers really want is
the ability to communicate with drivers when they are away from their vehicle.)
However, the AVL is considered important and has actually been implemented on some
trucks operated by independent trucking companies and leased to FedEx because FedEx
wants to be able to verify whether the independent trucking companies can achieve or
have actually achieved with high success rate the travel time performance offered by the
companies and stipulated in the contracts.
• Tailor technologies to maximize operational efficiency. For example, after a truck driver
delivered a package, he or she enters some codes into the hand-held tracker while walking
back to the truck. Upon return to the truck, the driver simply drops the tracker into a
slot, and the design of the slot and the tracker is such that once the tracker slides into the
bottom of the slot by gravity, wireless communication is activated from the truck to the
integrator s tracking information system, and the codes entered by the driver moments

94
ago are uploaded on the system. Based on FedEx s own estimates, increasing on-road
stops by 0.01 per hour can save FedEx $1.1 million per year. Moreover, an additional
keystroke per package would cost $1.7 million per year (Thomas, 1997). Automating the
process of activating wireless communication between a truck and the tracking
information system saves operating costs and improves operational efficiency.

95
APPENDIX K: THE AIRPORT OPERATIONS OF INTEGRATED AIR-EXPRESSFORWARDING AND THEIR SALIENT FEATURES
Major airport operations are introduced in Section 1. Their salient features are discussed in
Section 2.
1 Integrators Cargo Operations at an Airport
Oakland International Airport serves as a regional hub for FedEx s operations in the Western
states and serves as the relay point for freight being transported among the cities in those states.
It, like San Francisco International Airport and San Jose International Airport, has direct flights
from and to Memphis, which serves as the national hub. We studied integrators hub as well as
non-hub operations. We studied FedEx s hub operations at the Oakland International Airport
and the non-hub operations of Airborne at Mather Airport. Appendices D and B summarize the
two site visits, respectively. We now summarize integrators airport operations, including
objectives of operations, four major types of airport operations, operations interface, aircraft,
employees and issues related to airport operations.
1.1 Objectives of Airport OperationsAll Airport Operations are geared toward:
- On-time departures
- On-time arrivals
- Time standards maintenance for certain tasks like sort completion or unloading a particular
type of aircraft
- Minimization of Missorts
1.2 Airport Operations
Feed
Packages are usually fed into the facility through a feeder truck or from an incoming cargo
container. Most of the carriers nowadays use see through containers which are specifically
contoured to fit different parts of the aircraft like Belly or the main body.
Sort
Depending on the weight of the packages, they are usually classified light or heavy cargo. It
depends on the limitation of the conveyor system, dimension and weight wise. Cargo containing
dangerous goods is usually handled separately. Fast moving conveyor belts are used to transport
the packages within the cargo facility. Cargo is sorted by destination which is visible on the bar
codes. Different companies use different letter combinations for cities but the scan and sort
technology has been widely adopted. After the sorting this cargo is placed into outgoing
containers.

96
Weighing
After being weighed and checked for airworthiness, motorized Dollies i.e. tugs are used to
transport these containers from the ramps to the master/K Loaders which are employed to put
them on the planes. Rollerized flooring is usually the norm in ramp areas, dollies and loader to
help the movement of containers.
Aircraft Loading
Aircraft loading is done carefully according to the weight of the containers under the supervision
of trained personnel. These load planners can be either on ramp or in a control center and in radio
contact with ramp personnel.
1. 3 Operations Interface
2 or 3 mini control centers are usually established in places where the volume of air cargo is huge.
The first one controls and oversees the initial sorting and loading of containers while the second
one manages the movement of airplanes. Somewhere in there is a crisis management team whose
sole responsibility is to cope with unforeseen circumstances like change in weather or equipment
breakdown (varying from a broken belt to a grounded aircraft).
1.4 Aircraft
Boeing 727, DC-10, DC-8, Boeing 757 and some Boeing 747 are used. Capacity distinction
between narrow and wide body aircraft are also significant a narrow-body 707 freighter
holds only as much cargo as the belly space available in a Boeing 747 configured for maximum
passenger seating. Narrow-body aircraft also require stricter limits on the dimensions of the
containers they can accommodate due to door size. Compartment dimensions and engine power.
1.5 Employees
Most of the employees used in the sorting and loading/unloading cargo are part time but have full
medical/dental insurance.
1.6 Issues
• How to decrease travel time to and from Airports
• Maintenance of present level of service even with the increased demand (i.e. maintain present
cut-off times for pickup of packages)
• How to handle increased volume on certain routes without buying new aircraft.
• % age of Air Cargo traveling by Ground. Over time shippers have come to realize that
expedited delivery no longer means delivery by air. According to The Colographic Group, a

97
Georgia-based research and consulting firm, 64.2 % of the 4.66 billion shipment within the
U.S domestic expedited market now move on the ground. The total value of these ground
shipments-both ground parcel delivery and less-than-truckload equals 49 percent of the total
value of the expedited cargo market: some $ 34.08 billion out of a 69.56 billion freight market.
Using trucks instead of planes can be more efficient for shipments under 500 miles because.
In most cases, the freight can go direct to the customer rather than working its way through a
hub system. As more trucking companies apply air-shipment standards to their ground
operations, they should become a more attractive option to shippers.
• Increased growth of express packages due to Internet sales (especially around Silicon valley)
• Managing & Globalization of Air Cargo Containers — They are also called Unit Load
Devices and are the building block of airfreight. Cargo doesn t move without them. Managing
one aircraft s worth of containers is among the most difficult logistical tasks a cargo-minded
airline undertakes. There are anywhere from 500,000 to a million ULDs on tarmacs and
aircraft around the world worth between $ 2 billion and $ 4 billion/ The most common kind of
ULD, LD-3s, cost roughly $ 3,000 per unit, with LD-7s and LD-9s costing upwards of $
7,000. A single aircraft is typically equipped with some seven sets of containers. With 10
containers per set, an airline is looking at a minimum of $ 210,000 per plane.
But weight and durability are as important as the cost of containers. Most containers are
made from aluminum to limit weight because airlines may end up spending big money for fuel
to fly the extra pounds over the life of a can. Fiberglass models are more impact resistant but
heavier. A boom in perishable shipments by air is raising demand for refrigerated containers,
adding another element to the ULD mix. These cost twice as much as their non-refrigerated
components. So selection of containers is also an important aspect of air cargo carriers and
airlines.
Another suggestion by American Airline is to develop a global ULD pool that would out
source the acquisition and maintenance costs of cargo containers to a third party. Under that
plan, airlines would just pay a daily rental fee per container. Once a trip is don, the container
goes back in the pool, regardless of where am airplane is located.
• Air Cargo 2000 Initiative- Its principle mandate is to create a universal technology platform
for more economical and faster adoption of next-generation technologies, e.g., the two-
dimensional barcode technology as part of the tracking tools.
The 2D barcodes look like a series of random ink drops on a paper, but they can carry more
information that the series of orderly lines that make up the traditional bar codes, including all
the air waybill information. The PDF417 (Portable Data Files), as 2D barcodes are also
known, are an electronic supplement to paper and are already being used in the LTL trucking
industry.
• Montreal Protocol Four, the portion of the international air trade treaty that deals with air
cargo traffic, attempts to address the antiquated nature of the 71-year-old Warsaw
Convention by allowing the use of electronic air waybills but there are certain ambiguities
which need to be addressed by national government with laws designed to facilitate adoption
of electronic commerce.
The convention requires the a paper air waybill that must be signed and handed over in
triplicate with the freight. Failure to comply with these requirements may result in damage

98
awards. The convention also requires that air carriers, forwarders and integrators must include
agreed stopping places on the bill of lading or risk losing their right to limit liability to $ 9.07
per pound. If a carrier losses its limits, damage awards generally exceed the limit by
thousands of dollars.
However the proposed Montreal Protocol Four states:
Any other means which would preserve a record of the carriage to be performed may, with
the consent of the consignor, be substituted for the delivery of an air waybill. If such other
means are used, the carrier shall, if so requested by the consignor, deliver to the consignor a
receipt for the cargo permitting identification of the consignment and access to the
information contained in the record preserved by such other means.
The United States has not adopted Montreal Protocol Four. And even if the Protocol were
adopted, U.S. courts could interpret its meaning at the time of drafting in 1976. Given that e-
mail, electronic commerce and the Internet were not contemplated in 1976, the Protocol may
not adequately resolve the issue at hand.
2 Salient Feature of Integrators Cargo Operations at an Airport
• Tightness of the integrators operations at an airport, e.g., one round trip per aircraft per
day for high availability. When asked about how tight their operations are, a manager of
FedEx s West Coast aircraft operations stated that On a scale of 0-10, the tightness of
the operations is between 8 and 10, with an average of 9. The integrators operations
hinge upon the availability of their equipment, particularly the aircraft. To maximize their
availability, the integrators dedicate their aircraft to the movement of freight and seldom
commit their aircraft for double-tripping. In other words, they typically dedicate an
aircraft for a single round trip between two airports. This is much unlike the typical
operations of a passenger airline, where maximizing utilization of aircraft is a major goal of
an airline because it reduces operating costs and generates revenue. To further increase
aircraft s availability, integrators invest heavily on aircraft maintenance. For example, the
availability of the DC-8 serving Airborne Express Mather facility is ranked the best in
the world. During the visit, the manager showed us a small aircraft part that is worth over
$30,000. The integrators also have spare aircraft or simply spares to counter any
unexpected unavailability of some aircraft on their regular fleet.
• The integrators often have down aircraft (i.e., aircraft needing repair and being
unsuitable for flight), and it may take hours for a regional hub aircraft schedulers to figure
out how to adjust the routine operations so as to meet the delivery deadlines at minimum
cost.
• They not only track the performance of their individual operations; their employee have
to explain why delays occur and how they can be avoided in the future.
• They define the operational procedures precisely and clearly. Their employees are
trained and are expected to adhere to them, e.g., checking if all the incoming containers
have been unloaded for sorting.

99
• They perform internal audits to ensure adherence to the precisely and clearly defined
procedures in order to minimize rework. Rework may take the form of retrieving a
package from a container that has already been loaded onto an aircraft. Such retrieval, if
necessary, may delay the departure of the aircraft.
• The sorting operations adopt the state-of-the-art technologies. For example, close-circuit
TV monitors are installed on key locations in the sorting facility to provide visual images
of the sorting operations; sensors are installed on key equipment to detect deviations
from normal operations; computer software and hardware are installed to indicate the
status of key equipment; when a piece of equipment is out of order, detailed configuration
of the equipment can be shown on a computer; through the sensors, the defective parts
can be identified, and through the computerized information about the availability and
whereabouts of the replacement parts, the parts can be retrieved and the equipment can
be repaired quickly. (However, much of the sorting function remains manual and labor-
intensive. As will be discussed later, UPS is in the process of completely automating this
manual sorting process with optic sensors and robotics, with a budget of $963 M.)
• They closely monitor (a) the containers (through barcoding and in-facility radio-frequency
communication), (b) the packages (through barcoding) and (c) the aircraft (through the
FAA s tracking of aircraft in the National Airspace System), all with advanced computer
and information technologies.
• With their tracking technologies, there is complete linking of packages to containers to
aircraft, trucks/vans, eventually their drivers and other delivery workers, e.g, foot
couriers, and their customers.
100
APPENDIX L: PERFORMANCE MEASURES FOR INTEGRATED AIR-EXPRESSFORWARDING Performance measurement is a standard management function that enables managers and other
stakeholders to understand how well their efforts meet their goals and objectives.
Benchmarking against the best practices in the same or different industries is a key strategy for
improving the product or service quality of an organization; a prerequisite for benchmarking is a
set of performance metrics and the data and processes needed for the actual measurement. The challenge lies in the development of suitable measures that can be used to indicate success or
failure, or to identify opportunities for improvement. To do this, a general framework has to be
established to determine what objectives one is trying to achieve, and from what perspective. In
this section, we describe a general methodology for developing performance measures for the
intermodal operations of the air freight industry, introduce some of the measures that are already
in use by the freight carriers, and then present some new performance measures derived from this
strategy.
In designing intermodal performance measures, the primary emphasis should be on modal
interconnectivity. Ideally these measures should be developed for three levels of intermodal
activity: network infrastructure, modal operations and terminals and transfer facilities [4].
Performance measures are crucial to evaluating intermodal system components, how intermodal
components are incorporated into the overall transportation system. They require the
specification of desired goals for the transportation system. To convert these goals to
performance measures, they need to be expressed in standardized units. The measurement of a
system s performance in relation to the attainment of specific goals is necessary to compare
alternative transportation improvement options or policies. Section 1 addresses a general methodology adopted for developing performance measures.
Section 2 provide a set of criteria for performance measure selection. Section 3 discusses two
different performance perspectives: integrators perspective on performance of infrastructure
providers vs. the perspective of the customer of the integrators on the integrators performance. 1 GENERAL METHODOLOGY ADOPTED FOR DEVELOPING PERFORMANCEMEASURES
Meyer and Mazur (1995) presented a performance-based planning framework that identified key
performance concepts for transportation system evaluation and provided examples of how each
might be defined at various stages of planning process. According to them, the standard pattern
should be
• setting of goals and objectives
• development of performance measures
• description of the data

101
• an explanation of the analytical methods required to estimate the performance.
Efficiency, Effectiveness and Externalities are three general categories of performance measures.
Efficiency relates, more or less, to transportation system performance. Effectiveness measures
how well the system provides for the needs of the user while Externalities represent the impacts
on the environment, economy and the community resulting from transportation system
investment and use. For our report we would focus mainly on the first two.
1.1 EFFECTIVENESS MEASURES
These are measures that describe how well transportation provides for the movement of goods or
people. It is primarily a user measure, since it deals with service and cost to the user, and the
user s satisfaction with the service. Effectiveness basically includes the following two
subcategories:
• Accessibility, which is the overall coverage and connectivity of the transportation system
in relation to modal options i.e. ability of businesses to reach their respective markets.
• Quality of Service, which can be anything from time required for a shipment to be
sent/received, transport cost to the user, and also the reliability of on-time delivery,
without damage or loss, and with flexibility in scheduling.
1.2 EFFICIENCY MEASURES
These measures deal with:
• the cost to supply the service to users,
• the efficiency that the system provides, in terms of connections and delay, and
• utilization efficiency, e.g., shipment load factors.
2 CRITERIA FOR PERFORMANCE MEASURE SELECTION The following criteria were suggested by the National transportation System Performance
Measures Report [12] as basic to any performance measurement framework and were kept in the
authors minds while selecting the measures to be presented later in this report.
• Simplicity: The clarity and ease of comprehension of the performance measures and their
lack of redundancy.
• Multidimensional: The degree to which the measure can be used:
- across time frames (past trends, forecasting),
- at different geographic scales
- at different scales of aggregation (sub-area, corridor, region etc.)
- to address multiple concerns,
- to address multimodal issues, and

102
- for policy, planning, programming and implementation purposes.
• Compatibility: How well the measure gauges progress towards goals and objectives.
• Objectivity: The measure s basis in statistical relationships, and the degree to which results
can be independently verified.
• Feasibility: Whether the measure can be supported with current data, the cost and effort
involved in collecting the data.
• Directness: Whether the measure is a surrogate for another measure, or is precisely what is
intended to be evaluated.
• When taken as a whole, will the measures allow us to:
- make valid cross-modal comparisons at an appropriate level of detail, and
- understand the trade-offs among transportation efficiency and other social, economic
and environmental considerations.
In short they should be capable of measuring transportation performance from the perspective of
how it is serving the customer , or user, that is, from the stand point of the opportunity to
make a trip and the quality of that experience, and not just the service level of a given mode,
facility, or trip segment.
3 TWO DIFFERENT PERFORMANCE PERSPECTIVES: INTEGRATORSPERSPECTIVE ON PERFORMANCE OF INFRASTURCTURE PROCIDERS VS. VIEWOF THE CUSTOMER OF THE INTEGRATORS ON THE INTEGRATORSPERFORMANCE
Performance measures are used ultimately to help satisfy the customers. Therefore, they cannot
be developed and selected without a clear reference to who the supplier is and who the customer
is. We discuss two sets of performance measures, each of which relates a service provider to its
customers.
The first set of performance measures addresses the performance of infrastructure provider from
the perspective of the integrators, with the integrators treated as the customer and the
department of transportation or other public-sector infrastructure providers as the service
provider. The second of performance measures address the level of service provided by the
integrators as perceived by the integrators customers, with the integrators treated as the service
providers while the general public as the customers. This provides us with the opportunity to
describe the system performance from two different perspectives. At a certain level, all three
parties (transportation system provider, the integrators and the general public) share a common
interest in an efficient and safe system.

103
APPENDIX M: PERFORMANCE MEASURES OF THE PUBLIC SECTOR ONINTERMODAL GROUND OPERATIONS
EFFECTIVENESS
1. TIME
a. Average travel time between facility and major destination by mode
b. Average travel time from facility to major highway network
c. Total travel time
d. Freight transfer time between modes
e. Custom delays (hrs per shipment)
f. Average door-to-door shipment time and cost, by commodity, mode and trip length
(short, medium, long)
g. Average point-to-point (not door-to-door) shipment time for select commodities and
origin-destination pairs.
2. ACCESSIBILITY
a. Numbers accessing facility
b. Truck delivery and loading interference with street traffic
3. CONNECTIVITY
a. Number of transfers per shipment
b. Time and distance of transfer time between modes in X minutes and Y feet
c. Delay of trucks at facility per VMT
d. Frequency and length of Delay
e. Average transfer time between modes
f. Number of intermodal transfers for select commodity movements and O/Ds
g.
4. RELIABILITY OF FACILITY
a. % of scheduled truck departures that do not leave within an acceptable time limit
b. % of airline and scheduled ground transportation arrival/departures not within
specified time limits
c. Time for delivery and unloading
d. %age delivered off-peak time
e. %age delay due to
- congestion
- construction detours or stoppages
- circuitry to avoid substandard facilities
- border crossings (customs)

104
5. OPERATIONAL STANDARDS AND PRODUCTIVITY
a. Line haul speed
b. %age on time performance
6. QUALITY OF SERVICE
a. Average variability in arrival time, by type of commodity and mode, and percent of
shipments which are late
b. Monetary losses due to:
- Security problems, including theft, sabotage
- Accidents and substandard facilities
- Delays due to insufficient carrier capacity
- Delays due to congestion
c. %age of shipments which are
- late by X hours or days by commodity
- delayed, lost or damaged because of facilities/equipment in unacceptable
condition
- delayed because of carrier capacity limitations
d. ratio of shipment cost to travel time for sample commodity shipments by
commodity, mode, and trip length (short, medium, long)
e. %age of trip time attributable to processing at intermodal terminals
f. Shipper satisfaction with service in terms of travel time, cost, on-time service,
schedule flexibility, loss and damage, quality of equipment, and handling
g. Damage claims against carriers by commodity type; value of goods lost/damaged in
shipment
EFFICIENCY
1. PERFORMANCE
a. Congestion level on access highways
b. Level of Service (LOS) on Access Roads
c. LOS at intersections serving the facility
d. Truck turnaround time at intermodal terminals
e. Traffic volume on access roads
f. Volume to capacity ratios
g. Average Dwell time
h. Average cargo transfer times
i. Price and time elasticities of demand by commodity and mode
j. Tons transferred per hour

105
k. Average speed of movement of each commodity, multimodal and by individual mode,
by trip length (S, M, L), for domestic and international markets
l. Average load factors, by commodity type and trip length
m. Sensitivity of load factors to quality and type of service demanded, structure of
industry and delineation of market
n. Total Delay as a portion of trip time for each grouping
o. Percent of local shipments which occur during peak travel periods
2. COST AND ECONOMIC EFFICIENCY
a. Cost per ton-mile by mode
b. Revenue per ton-mile by mode
c. Operating ratio
d. Average cost per trip
e. Average cost per ton mile
f. Average cost per mile
g. Additional costs per trip (user fees)
h. Cost or time savings resulting from application of emerging technologies
EXTRENAILITIES
1. SAFETY
a. Dollar value of property loss in accidents per 100,000 users of transfer points
b. Number of accidents per movement
c. Number of accidents per million VMT
d. Average accident cost (property, injury, death) per trip
e. Ton miles per accident
2. ENVIRONMENTAL PROTECTION
a. Emissions by pollutant, total, per ton/vehicle mile
b. Freight energy consumption per ton-mile or package-mile of movement, by modern
commodity, length of haul

106
APPENDIX N: PERFORMANCE MEASURES OF THE INTEGRATORS SERVICES
For Air freight the following attributes are often put forward regarding performance measurement
- Shipment Cost
- Shipment time
- Environment
- Reliability
- Convenience and flexibility
But we are concerned mostly with the intermodal transfer operations of the air freight industry,
with the aim of developing performance measures according to the strategy and criterion
explained above. Note that these performance measures do not distinguish the performance of
the integrators themselves from the performance of the infrastructure or its providers.
EFFECTIVENESS
1. TIME
a. Number of On-Time Aircraft Departures and Arrivals
b. Number of On-Time Pickups and Deliveries
c. Average total transit time per shipment
2. ACCESSIBILITY
a. %age of businesses within X miles or Y hours of the cargo airport
b. %age of population (as "markets") within X miles or Y hours of the cargo airport
c. %age of population residing within 10 minutes or 2 miles radius of pick and drop
facility
d. %age of businesses, by industry/commodity, which have satisfactory access to
preferred/relevant mode or to preferred suppliers/market
e. %age of package goods shippers within X miles of air cargo airports
f. %age of shipments (ton or package miles) to just in time industries
3. CONNECTIVITY
a. Number of transfers per shipment (directness of service)
b. Length of Haul
c. Percent of average annual daily traffic (AADT) trips that are truck trips on roadways
with poor levels of service
4. OPERATIONAL STANDARDS AND PRODUCTIVITY
a. Average Size and Weight of shipment

107
b. Frequency of shipments
c. Average trip distance on a delivery route
d. Average total miles scheduled
e. Average total trips scheduled
f. Number of truck trips within the region per outbound line haul trip
EFFICIENCY
1. TIME STANDARDS FOR CERTAIN TASKS
a. Pieces per Man-hour
b. Sort Completion Time
2. SERVICE LEVEL
a. Degree of automation like computerized billing and tracing services
b. Scheduling flexibility
c. Ability to handle special products
d. Suitability for commodity to be carried
e. Suitability for shipment sizes
f. Average wait time per stop
3. COST AND ECONOMIC EFFICIENCY
GENERAL
a. Average market share per city
b. Highway vehicle miles traveled per gallon of fuel
c. Cargo ton mile per gallon of fuel
d. Number of airplanes operated to serve target population in a city.
e. Vehicle cost as % of sales
f. Operations cost vs. budgeted cost
g. Total cost vs. standard cost
h. Labor cost vs. standard labor cost
LABOR AND EQUIPMENT
a. Fixed cost per vehicle
b. Cost per mile traveled
c. Cost per hour of labor
d. Percent earned hours vs. labor hours
e. Percent overtime hours vs. labor hours
f. Delivery cost per shipment
g. Number of truck trips without a loading per lie haul truck trip
h. Ratio of peak season average daily truck trip to average annual daily truck trips

108
i. Ratio of inbound average annual daily freight volume to outbound average annual daily
freight volume
j. Equipment hours used vs. base hours
EXTRENAILITIES
1. SAFETY
a. Injuries per 100 employees
b. Time loss events per 100 employees
c. Vehicle accidents per 100,000 miles
d. Number of claims filed
e. Dollar values of claims
f. Shipments delivered without coverage s, shortages or damages
2. CARRIER CLIENT RELATIONSHIP
a. Carrier cooperation with shipper s personnel
b. Carrier assistance in obtaining rate or classification changes
c. Carrier s leadership in offering more flexible rates
d. Freight damage experience with the carrier
e. Carrier representative knowledge of shipper needs
f. Freight loss experience with the carrier
g. Carrier attitude toward acceptance of small shipments
h. Carrier honoring shipper s routing requests
i. Carrier willingness to participate in freight consolidation practices
j. Courtesy of vehicle operators
k. Diversion and reconsignment privileges
l. Ease of claim settlement
m. Carrier response in emergency situations
Ability to handle expedited shipments

109
APPENDIX O: SPECIFIC ISSUES AND PROBLEMS FACED BY THE OPERATORS INTHE STATE AND PUBLIC-SECTOR INNOVATION OPPORTUNITIES
This appendix is partitioned into 7 sections. The first six address the following six categories of
issues and needs, respectively, and the last discusses the kind and, when appropriate, the
magnitude of effort involved. More precisely, the rest of this appendix is partitioned in the
following seven sections.
1. Traffic Congestion and Traffic Information
2. Fair or Preferential Treatment for Trucks
3. Communication between Planners and Freight Operators/Planners
4. Balance of Priority between Passenger and Freight Services in the National Airspace System
5. Possible Use of BART for Small-Package Freight
6. Water Transportation over SF Bay for Freight Movement
7. Preliminary Assessment of the Innovations
1 Traffic Congestion and Traffic Information
The facility managers considered the recurrent congestion problems on I-880 in the Bay Area
particularly detrimental to their operations; they also consider the congestion on Route 101 in the
Bay Area as serious. It was reported in [37] that a small number of flights originate in San Jose
International Airport but destine for Oakland International Airport just to avoid the traffic
congestion on I-880. In addition to complaint about the traffic congestion on interstate and state
highways, the managers expressed their concern about the congestion taking place recurrently at
all the Bay Area bridges. They are curious why Electronic Toll Collection has not been
implemented at all Bay Area bridges. (Although is not expected to reduce travel-time
significantly during peak-hour congestion, they considered ETC as useful for their operations.)
Congestion on surface streets and its management is clearly the most detrimental issue for the
industry.
Knowing that there is a general lack of real-estate for additional freeway right-of-way, the
managers suggest consideration of double-decking the Bay Area s freeways, subject to safety
consideration of course.
In the absence of a quick solution to the traffic congestion problems, the managers emphasized
their constant use of all sources of traffic information, including traffic information offered on
commercial radio, information gathered through their drivers observations, and video images
posted on internet websites (based on video cameras installed and operated by Calrtans and other
organizations, e.g., TV stations) and also emphasized their desperate need for accurate and real-
time traffic information. Needed traffic information goes beyond simply accident/incident
reports and includes travel-time estimates, time-till-incident-clearance estimates, etc.
Moreover, they tried also to avoid railroad crossings. Although they did not suggest a need for
any technology that would inform their dispatchers or drivers of accurate train crossing times and

110
the corresponding duration, such technology may be very desirable for on-time delivery to or
pick-up in port areas with mostly at-grade crossings, e.g., Port of Oakland.
2 Fair or Preferential Treatment for Trucks
The facility managers also suggested preferential treatments for their trucks, including the use of
High-Occupancy and Toll (HOT) lanes for not just passenger vehicles but also for commercial
vehicles. The roadway system is provided for both passenger and freight traffic after all.
Allowing single-occupancy passenger vehicles to use HOT lanes with a fee while disallowing
freight vehicles to use the lanes may signify an unjustified preferential treatment in favor of
passenger traffic.
Since HOT lanes are most often located in the center of a freeway, accommodating large trucks on
such lanes may pose safety hazards if the large trucks must first cross several lanes among
automobiles to access the HOT lanes. This is a legitimate concern. However, the vast majority
of air cargo carriers fleets are vans and small trucks, and allowing them on HOT lanes should not
pose any safety issues. Note that large buses are allowed on both HOV and HOT lanes.
They pointed out that their large trucks would benefit most from HOT lanes because those
trucks transport freight from airports to the integrators distribution centers mostly via
highways. Usually, the vans and smaller trucks are used for local distribution and do not use
freeways heavily. However, when aircraft are delayed or when highways suffer from excessive
non-recurrent delays, vans and small trucks are often sent to airports to pick up freight destined
for the corresponding delivery areas. These are situations where the integrators need unimpeded
freeway travel the most, and can benefit much from the use HOT lanes by vans and small trucks.
They also suggested revival of truck-lane studies for routes carrying heavy truck traffic.
3 Communication between Planners and Freight Operators/Planners
The integrators, like the infrastructure providers, need to conduct long-term planning. Among
different long-term planning tasks is selection of facility location, either for their local distribution
centers, stations for local delivery trucks or their large trucks (traveling among airports,
distribution centers or regional hubs). The integrators monitoring the planning process may
benefit such tasks of the integrators.
Communicating the integrators needs to city and other land-use planners may help the planners
determine the benefits of establishing a truck corridor and where to establish such possible
corridors. The integrators may benefit from the information regarding any possible plans of
designating such a corridor.
4 Balance of Priority between Passenger and Freight Services in the National AirspaceSystem

111
A FedEx s manager of the Global Operation Control Center at Oakland International Airport
indicated that the FAA tends to give passenger flights higher priority over freight flights during
major flow-reducing events in the National Airspace System, e.g., snow storms. For example,
when a hub airport is experiencing or is expected to experience a major snow storm, the airport
capacity, including arrival and departure, is significantly reduced. Flow-control in the form of
ground-hold is often implemented by the FAA to reduce the incoming flow to the airport.
Passenger flights tend to be given higher priority over freight flights. However, since passenger
flights tend to arrive and depart as complexes (or, in other words, banks of flights) and because
airlines are likely forced to delay all or most of the flights of a complex to maintain the integrity
of the complex, the impact of delaying a passenger flight into the congested airport tends not to
be significant as long as the flight is not one of the last arrival flights of a complex. However,
delaying a freight flight may have very significant downstream implications because of the
tightness of the integrators airport and ground operations.
Although not suggested by any member of the industry, it is possible that the safety standards
for freight flights could be less strict than their passenger-flight counterparts. This may enable
freight aircraft to become early adopters of some advanced technologies that can benefit the
industry as well as the FAA s effort of deploying the technologies.
5 Possible Use of BART for Small-Package Freight
The Marketing Department of BART has been contacted, and two discussions over the phone
took place. Dennis Machaun was the primary contact. He raised this innovation possibility in
that Department s staff meeting on 4/5/2000, and the subject was discussed at length. That
Department s initial feedback is negative for three primary reasons. First, the target dwell time
of a train at a BART station is 30 seconds; supporting freight activities may require the
lengthening of the dwell time. Second, BART was created to provide passenger transportation.
Although freight activities will bring in needed revenue, supporting this type of activities will
require modification of BART charter, which will require the approval of the Board of Directors
of BART. Third, although the trains can be made available between the hours of 1 and 4 AM at
night when no passenger services are needed, maintenance is usually scheduled during those
hours. Machaun indicated also that current BART cars have no space allocated for occupation
by freight and that if seats are sacrificed for freight transportation, incorporation of freight
activities will be hard to justify.
It appears that the Marketing Department is not very supportive of this particular innovation
possibility. However, this does not mean that BART will not support this possibility. The
Real Estate Department of BART has also been contacted, and we will discuss this possibility
with its personnel.
In any case, it would be good if we can approach them with an operational concept that avoids
the three major issues raised by BART s Marketing Department. An important observation is
that once the charter of a transportation agency is created and services provided accordingly,
modifying the charter and the services seems cumbersome. Moreover, once the transportation

112
vehicles of a transportation system have been designed and standardized for pure passenger
traffic movement, it is difficult to accommodate freight transportation in the system. This
observation, if true, could be an important lesson, especially for the establishment of a Bay Area
Water Transit Authority currently under study and to be voted in the near future. Possible use
of ferries, barges, and hovercraft for transportation of freight will be the subject of the following
subsection.
6 Water Transportation over SF Bay for Freight Movement
The Bay Area Water Transit Initiative (or Task Force) has been working to build support for the
creation of the Bay Area Water Transit Authority, featuring high-speed and environmentally-
friendly transportation over the Bay, through state legislation. A decision regarding its creation is
expected in June 2000. The chair of the Task Force is Ron Cowan, and it is expected that if the
Authority is created, he would be the chair of the Authority. Ron Cowan and his assistant Lisa
Clairmont have been contacted regarding the possibility of using ferries, barges and hovercraft for
freight transportation on the San Francisco Bay. The
Water transportation over SF Bay may have significant impact on several issues of importance to
the air freight industry, passenger airline industry, and the Aeronautics Program of Caltrans and
even Caltrans as a whole. The impact on the air freight industry spans the integrators and non-
integrators. After briefly summarizing our interaction with Ron Cowan in Subsection 6.1, we
address these possible impacts in the next three subsections, i.e., 6.2 through 6.4. Overall, it
seems that the proposed water transportation system has a significant potential in facilitating air
freight, and promoting intermodal transportation. Therefore, it seems to deserve the attention of
the Aeronautics Program of Caltrans as well as that of Caltrans as a whole.
6.1 Interaction with the Bay Area Water Transit Authority
Cowan stated that he actually proposed a concept of small parcel transportation network over
the Bay two years ago, and discussed the concept with John Martin and Chuck Foster, Executive
director of the Oakland Port Authority, with the participation of a private consulting firm. The
concept involves not only ferries but also the use of hovercraft because the use of hovercraft
would minimize dredging of the Bay and hence minimize environmental impact. The consulting
firm seems to have been performing a study of a freight network on the Bay for the two airport
authorities, independently of Cowan s effort in creating a network on the Bay for not only
passenger transportation but also freight movement.
Cowan is very interested in discussing the possibility of incorporating small-parcel freight into an
integrated water transportation system on the Bay, and encourages further communication among
his organization, Caltrans, integrators like FedEx, etc.. His belief in intermodal transportation is
consistent with the theme of this research.
More information regarding the Bay Area Water Transit Initiative can be found online at
www.bayareacouncil.org/watertransit.index.html.

113
6.2 Potential Impact on the Air Freight Industry
The current plan does include an air cargo component, which consists of water routes connecting
San Francisco International Airport, Oakland International Airport, San Francisco and San Jose
International Airport (with some facilities and routes on the ground). Although these routes may
facilitate the air freight movement from one airport to another or from an airport to a
metropolitan area, they may fall far short of the kind of distribution functions (from the airports
to the 20 distribution stations around the Bay) that the two FedEx Dispatching managers were
looking for and were proposing. Having said that, it is obvious that integrated air freight carriers
like FedEx would also benefit from these routes. For example, a major problem for FedEx is
bridge crossing for local distribution, and a ferry/hovercraft route connecting its regional hub at
the Oakland International Airport to San Francisco would definitely be welcome by FedEx. The
same is likely to be true for other integrators. In addition to local distribution, since such
integrators, e.g., FedEx, have flights into multiple international airports in the Bay Area, these
water routes would be able to facilitate their transshipment operations among the airports.
In addition to the integrators, the non-integrators would also benefit from the water
transportation systems. Given the integrated nature of the integrators operations, the non-
integrators can fight back in a small number of ways. One of the most important ways is to
increase the degree of connectivity of their operational networks. Note that the integrators
essentially build their own networks for maximum connectivity, subject to cost constraints of
course. (Another important way is to increase the visibility of their freight status by proving
tracking information efficiently.) Given the connectivity provided by the water transportation
system, the non-integrators may be able to realistically and economically connect airports to
airports or airports to customers in the Bay Area during the day-time hours, when the surface
roadways are subject to fast-growing recurrent and non-recurrent congestion problems.
This is actually good from a policy standpoint because if the concept of the water transportation
system benefits only the integrators, given the fierce competition between the integrators and
non-integrators, the promotion of the water transportation system by a public agency like
Caltrans may be considered partial for the integrators and against the non-integrators.
6.3 Impact on Regional Traffic - Air Traffic or Ground Access to Airports
The general impact of the water transportation on Bay Area s regional traffic is beyond the scope
of this research. The reader is referred to the official documents produced by the Initiative itself
or other sources.
A subject that has recent much attention recently is the re-distribution of air traffic among
regional airports. Both passenger and freight carriers have migrated toward the hub-and-spoke
operations, mostly for economic reasons. This has led to concentration of a carrier s operations
at one airport in a large metropolitan area. A high-speed connection among the three major
international airports may slow down the growth of the hub operations, and hence may

114
contribute to meaningful re-distribution of the area s air traffic as well as the traffic generated by
ground access to the airports.
The impact may be higher on air freight than on passenger traffic because passengers may not be
receptive to the idea of flight transfer through a ferry ride. However, this is not a problem for
freight as long as the mode changes and the water transportation are efficient and high-speed,
respectively.
6.4 Implications for Intermodal Freight Transportation, Including Highway Access
If the water transportation system is eventually built, it will add one more dimension of
opportunities as well as issues for intermodal transportation. Although the opportunities and
issues related to passenger transportation are beyond the scope of this research, it is obvious that
they deserve the attention of Caltrans. Although the new system s passengers may be connected
to other public-transit modes of transportation, the freight transfer may require highway access.
One lesson that we have learned, as mentioned earlier, is that if the charter of this new water
transportation system does not include freight transportation, it may be difficult to expand the
services provided by the system to include freight services once the system is built. Recall that
one reason that the Marketing Department of BART gave regarding the possible difficulties of
implementing the idea of using BART for moving small parcels is that BART was created solely
for passenger traffic.
Another lesson is that efficient intermodal transportation will not occur if no intermodal services are
offered, not to mention if no intermodal connectivity is provided.
7. Preliminary Assessment of the Innovations
The following table summarizes our preliminary assessment of ten innovations suggested by the facility
managers. The potential is assessed from the perspective of the integrators, and is assessed at three
levels — high. Medium and low. The time frame refers to the length of time required for the
implementation. If an innovation contains many possibilities and some can be implemented in the near
future or have already been implemented while others not, both short-term and long-term are noted.
Relevance to Caltrans is assessed at three levels — high, medium and low. Two types of critical effort are
indicated — Technical or Technological vs. Institutional. When both are critical, both are indicated, but
with the dominant one stated first.
Innovation Potential
Time Frame Relevance toCaltrans
Major Typeof Effort
Congestion Management High Long-term High Inst. & Tech.
Electronic Toll Collection Medium Short-term High Tech.
Rail Crossing Schedule Medium Short-term Low Tech. & Inst.
Traffic Information High Long- and Short-term High Tech. & Inst.

115
HOT Lane High Long-term High Inst. & Tech.
Truck Lane Medium Long-term High Inst.
Transportation on Bay High Long-term Low or High Inst. & Tech.
Urban Rail for Freight High Short-term Low Inst.
Coupling Planning Functions Medium Short-term Medium Inst.
Freight Urgency during Storms Medium Short-term Low Inst.

116
APPENDIX P: ITS TECHNOLOGIES IN USE OR BEING TESTED FOR TRUCKINGAND THE GROUND OPERATIONS OF AIR CARGO MOVEMENT
The aim of deploying Intelligent Transport Systems (ITS) Technologies is to improve safety,
reduce congestion, improve mobility and accessibility, reduce environmental impact and increase
energy efficiency, and improve economic productivity. There is no single answer to the set of
complex transportation problems facing the overall transportation industry.
This appendix describes the various advanced technologies already in use in the intermodal freight
transportation industry or would be in the future. We would restrict ourselves to the intermodal
operations for freight transportation. Information and communication technologies have
enormous potential for improving this modal interchange.
Candidate ITS systems that may have the potential to provide operational benefits to air freight
transportation can be grouped into categories of CVO - Airport Operations, CVO - Landside
Operations, Commercial Fleet and vehicle Management Systems, Travel and Management
Systems, Advanced vehicle Safety Systems, and Cargo Handling Operations. After listing
individual technologies within these categories, we will briefly address some issues and
opportunities associated with deploying ITS technologies.
CVO — AIRPORT OPERATIONS
• Automated Vehicle Identification (AVI)
An AVI system is an electronic system that enables the identification of vehicles through the
use of a reader system and a transponder tag mounted on the vehicle. Automatic vehicle
identification is becoming a popular system for both commercial vehicle operators and for
electronic toll collection.
• Automatic Equipment Identification (AEI)
Automatic equipment identification is very similar in technology and operations to automatic
vehicle identification (AVI). As with vehicle identification, this system utilizes an on-board
transponder that communicates with a roadside or station receiver. Where an AVI system
may be used for toll-collection or for expediting the processing of paperwork, an AEI system
will probably be used primarily for a check of the containers contents and for the
establishment of a real-time inventory system.
An AEI system used in conjunction with a geographic information system (GIS) of the
terminal would allow for real-time acquisition of a container’s location. An inventory clerk in
a mobile inventory vehicle would be able to send out a radio query that would enable the
container to be located on the facility,. When used in conjunction with a GIS system it would
allow for more efficient inventory control.
• Electronic Data Exchange (EDI)

117
Electronic data interchange (EDI) is a means of facilitating the flow of information between
the interested parties. EDI allows the users to electronically transfer the bill of lading, shipper
ID, consignee ID, buyer ID, cargo description, cargo weight, invoice number, any HAZMAT
information, and any government required documentation. EDI is considered a value-added-
data-service (VADS) that helps to reduce shipping costs and improve efficiency.
• Weigh —In- Motion (WIM)
A weigh-in-motion system is used to dynamically measure truck axle weights while the truck
is in motion, with accuracy of – 5 - 15 %, when compared to the statically measured weight.
Piezoelectric cable systems are the most common system currently in use, with fiber-optic
cable WIM systems likely to become the system of choice in the future. WIM systems
operate by measuring axle weights as the tires of the vehicle pass over the sensors. In general,
WIM systems can measure single and tandem axle weights, and when coupled with an
automatic vehicle detection, system can be used to aggregate gross vehicle weight.
WIM systems can increase terminal operational efficiency by elimination or reducing queues
of trucks as they enter or exit the terminal facility.
• Changeable Message Signs (CMS)
Real-time traffic information plays an increasingly important function in efforts to improve
operations, utilize existing facilities and improve highway safety. When used in a highway
setting, changeable message signs (CMSs) are used as traffic control devices for the regulation,
routing, and management of the traffic stream. They are used to effect the real time behavior
of motorists is order to improve traffic flow.
In a terminal setting, a CMS may be used to direct trucks upon entering the facility to the
correct lane for processing. It may also be used in its traditional format to deliver real-time
traffic information to the CVO operators so that they may select the best route to the
terminal, and for drivers leaving the facility so that they may avoid any incidents or congested
areas.
• Truck operator Smart Cards
These cards are similar to those that are designed for transit use, and can contain the truck
driver’s license, a photo ID, social security number, any HAZMAT qualification that the
driver may have, and the trucking company currently being represented. These cards would
be a read/write variety and would allow for updates by the trucking lines currently under
contract.
• Closed Circuit Television (CCTV)
CVO LANDSIDE OPERATIONS
• Real-Time Interface with Regional Advanced Traffic management Center (ATMC)and with local department of transportation.

118
An advanced traffic center will integrate the management of various roadway functions, such
as, ramp metering, arterial signal control, and changeable signs. An ATMC will collect, utilize
and disseminate real-time traffic data for a network of significant arterial streets and freeways
within the local highway system. An ATMC will also coordinate multi-modal information
between local public transit authorities, the state department of transportation, and the city
traffic department. A fully operational ATMC has been established in Los Angles.
• Commercial Vehicle Electronic Clearance
This service will enable transponder-equipped trucks to have their safety status, credentials,
and weight checked at mainline speeds. Vehicles that are safe and legal and have no
outstanding out-of-service citations will be allowed to pass the inspection/weigh facility
without delay.
• Automated Roadside safety Inspection
Automated roadside inspections will allow "real-time" access at the roadside to the safety
performance record of carriers, vehicles, and drivers. Such access will help determine which
vehicle or driver should be stopped for an inspection, as well as ensuring timely correction of
previously identified problems.
• Commercial Vehicle Administrative Processes
Electronically purchasing credentials would provide the carrier with the capability to
electronically purchase annual and temporary credentials via computer link. It will reduce
burdensome paperwork and processing time for both the state and the motor carriers.
For automated mileage and fuel reporting and auditing, this service would enable participating
interstate carries to electronically capture mileage, fuel purchased, trip and vehicle data by
state. It would also automatically determine mileage traveled and fuel purchased in each state,
for use by the carrier in preparing fuel tax and registration reports to the states.
• On-Board Safety Monitoring
On-board systems would monitor the safety status of a vehicle, cargo, and driver at mainline
speeds. Vehicle monitoring would include sensing and collecting data on the condition of
critical vehicle components such as brakes, tires and lights, and determining thresholds for
warning and countermeasures. Cargo monitoring would involve sensing unsafe conditions
relating to vehicle cargo, such as shifts in cargo while the vehicle is in operation. Driver
monitoring is envisioned to include the monitoring of driving time and alertness using non-
intrusive technology and the development of warning systems for the driver, the carrier, and
enforcement official. A warning of unsafe condition would first be provided tot he driver,
then to the carrier and roadside enforcement officials and would possibly prevent an accident
before it happens. This service would minimize driver and equipment related accidents for
participating carries.
• Hazardous Material Incident Notification

119
It enhances the safety of shipments of hazardous materials by providing enforcement and
response teams with timely, accurate information on cargo contents to enable them to react
properly in emergency situations. The system would focus on determining when an incident
involving a truck carrying hazardous material occurs, the nature and location of incident, and
the material or combination of materials involved so that the incident can be handled
properly.
COMMERCIAL FLEET & VEHICLE MANAGEMENT SYSTEMS
The availability of real-time traffic information and vehicle location for commercial vehicles
would help dispatchers to better manage fleet operations by helping their drivers to avoid
congested areas and would also improve the reliability and efficiency of carrier’s pickup-and-
delivery operations. The benefits from this service would be substantial for those intermodal and
time-sensitive fleets that can use these ITS technologies to make their operations more efficient
and reliable.
• Communication Systems
Four technologies-mobile satellite communications, networked mobile radio, cellular
telephones, and electronic data interchange — provide the motor carrier industry with a range
of commercial services that did not exist a decade ago. Mobile satellite communications now
cover North America. Although most satellite services are transmitting only digital data,
voice service is coming onto the market, giving long-haul carriers another communications
option. Networked mobile radio and cellular telephone likewise have extended coverage for
local and regional fleets. Conventional two-way land mobile radio has limited range, (typically
about 40 miles), and is heavily over subscribed in metropolitan areas. However, by sharing
frequencies and networking transmissions towers by telephone lines, mobile radio services
now provide metropolitan and corridor coverage for over 30 percent of the United States.
Cellular telephone companies provide similar coverage. Cells, each covering an area with a
radius of about 16 miles, are interconnected by a central switching station that automatically
reroutes calls as trucks move from cell to cell within the system. The capacity of mobile radio
and cellular telephone services will increase and cost will decrease sharply over the next
decade as service providers and users convert to digital radios and telephones.
A recent survey of approximately 700 motor carriers, including both for-hire and private
fleets, found that about half of the surveyed fleets were using mobile communications
systems. These systems included conventional two-way radio, digital text communications,
wide-area pagers, and satellite communication links. Market shares were similar among local,
regional, and national carriers; and between for-hire carriers and private fleets.
Electronic Data Interchange (EDI) has been the key to computer-to-computer
communications. EDI standards define the sequence and format for packaging and

120
transmitting data, making it possible for shippers and carriers to exchange bills of lading,
invoices, and other business documents electronically.
• Electronic Trip Recorders / Onboard Computers
Trip recorders originated as mechanical tachographs that recorded engine and vehicle speed
over the course of a trip. Today s trip recorders automatically monitors and records
information on performance of the vehicle or the driver. This might include speed, fuel
consumption, braking pattern etc. Used by large or private fleets; carriers with national or
regional operations.
• Routing And Dispatch Software
Routing and dispatching software solves two of the motor carrier’s most time-consuming
puzzles: connecting the dots to minimize the time and cost in routing trucks between pickup
and delivery points; and the matching game to optimize the assignment of freight and drivers
to trucks. There are two types of software available.
- Static Routing and Dispatching Software
Computes most direct route between an origin and a destination, enabling carriers to
maximize fleet efficiency. Useful for carriers operating on fixed routes with the same
customers.
- Dynamic Routing and Dispatching Software
Uses real-time congestion and shipment volume information and a link between the
carrier s terminal, dispatch office, and vehicles. Carriers operating large numbers of
vehicles over variable routes; national fleets.
• Automatic Vehicle Location (AVL)
An automatic vehicle location system is an electronic system that delivers real-time vehicle
positioning and monitoring of individual vehicles. This system allows drivers, dispatchers,
shippers and receivers to track a truck continuously from pickup to delivery. The two major
AVL technologies on the market today, dead reckoning and communication determination
systems, can locate a truck within one hundred feet. Dead reckoning AVL uses a magnetic
compass and wheel odometers to track distance and direction from a known stating point.
Communication-determination AVL systems use either radio towers or satellite
communications. In a tower system, the vehicle’s position is determined by using
multilateration of the radio signals. The satellite system is similar in operation but has a much
greater range. In some systems the vehicle transmits its location back to a control center by
using inertial or dead-reckoning systems. Most AVL systems plot the truck s path and
current location against an electronic road map displayed on a video screen in the truck cab.
• Applications Of ITS for Fleet Management
121
The most frequent motor carrier applications of these technologies are planning the next load,
tracking the current load, optimizing cross-dock operations and managing fuel consumption
and driving habits.
TRAVEL AND TRAFFIC MANAGEMENT
• Pre Trip Travel Information
Real-time information on accidents, road congestion, alternate routes, traffic speeds along
given routes, event schedules and weather information. Based on this the dispatcher can select
the best departure time and route.
• Enroute Driver Information
Driver advisories are similar to pre-trip planning information, but are provided once the
vehicle is on the road. Driver advisories convey information about traffic conditions,
incidents, construction and weather. This information allows a driver to select the best route.
• Route Guidance
It provides a suggested route to reach a specified destination. Early route guidance systems
will be based on static information about the roadway network. When fully deployed, route
guidance systems will provide travelers with directions to their destinations based on real-
time information about the transportation system. The route guidance service will consider
traffic conditions, status and schedule of transit systems, and road closures in developing the
best route. Directions will generally consist of simple instructions on turns or other upcoming
maneuvers.
• Incident Management
Enhances existing capabilities for detecting incidents and taking the appropriate actions in
response to them. The service will help officials quickly and accurately identify a variety of
incidents, and to implement a response which minimizes the effects of these incidents on the
movement of people and goods.
• Traffic Control
Integrates and adaptively controls the freeway and surface street systems to improve the
flow of traffic. Minimize congestion while maximizing the movement of people and goods.
ADVANCED VEHICLE SAFETY SYSTEMS
• Longitudinal Collision Avoidance

122
Helps reduce the number and severity of collisions. It includes the sensing of potential or
impending collision, prompting a driver’s avoidance actions and temporarily controlling the
vehicle.
• Lateral Collision Avoidance
Provides crash warnings and controls for lane changes and road departures. It will reduce the
number of lateral collisions involving two or more vehicles, or crashes involving a single
vehicle leaving the roadway.
• Intersection Collision Avoidance
Warns drivers of imminent collisions when approaching or crossing an intersection that has
traffic control (e.g. stop signs or traffic signals) This service also alerts the driver when the
right-of-way at the intersection is unclear or ambiguous.
• Vision Enhancement for Crash Avoidance
Improved visibility would allow the driver to avoid potential collisions with other vehicles or
obstacles in the roadway, as well as help the driver comply with traffic signs and signals.
This service requires in-vehicle equipment for sensing potential hazards, processing this
information and displaying it in a way that is useful to a driver.
• Safety Readiness
In-vehicle equipment could unobtrusively gauge a driver’s condition and provide a warning if
he or she is drowsy or otherwise impaired. This service could also internally monitor critical
components of an auto beyond the standard oil pressure and engine temperature lights.
Equipment within the vehicle could also detect unsafe road conditions, such as bridge icing
and standing water on a roadway, and provide a warning to the driver.
• Pre-Crash Restraint Deployment
Identifies the velocity, mass and direction of the vehicles and objects involved in a potential
crash and the number, location and major physical characteristics of any occupants.
Responses include tightening lap-shoulder belts, arming and deploying airbags at an optimal
pressure, and deploying roll bars.
• Automated Vehicle Operation
Automated vehicle operations are long term objectives of ITS technologies which would
provide vast improvements in safety by creating a nearly accident free driving environment.
ITS IN CARGO HANDLING OPERATIONS
• IN-TRANSIT VISIBILITY: CARGO AND EQUIPMENT TRACKINGTECHNOLOGIES

123
Global transportation and logistics are rapidly being transformed by the ability to use
communication technology to identify and monitor cargo and equipment in real-time virtually
anywhere in the world. These technologies have been applied to both to line haul activities
and to intermodal transfer operations. The most prominent technology applications include
- Radio Frequency (RF) technology
The use of passive back scatter for automated equipment identification (AEI) relies on
radio signals between passive tags and active interrogators. The technology was first
marketed in the mid-1980’s and is widely used in the port and rail industries. This
technology has been used extensively in warehousing and manufacturing applications and
with improved reliability, durability and effectiveness it has gained acceptance at terminals
to manage traffic flow through gates and to track yard equipment for improved cycle time
and productivity.
- BarCodes
One dimensional bar codes are arrays of parallel narrow rectangular bars and spaces which
represent single characters in a particular symbology and are arranged in a particular order
as defined in the symbology. Bar codes are printed, scanned decoded and transferred to a
host computer. The technology relieves the user of the tedious and error prone task of
reading a label and transcribing the information manually onto a form or key-entering it into
a computer. Bar codes are extensively used in transportation for identifying equipment,
Two dimensional bar codes use multiple dots of other arrays that carry larger amounts of
data and can be used for personal identification (e.g. photograph) or a bill of lading. Other
forms of two dimensional bar codes are used by express shippers for high speed sorting of
small packages.
- Smart Cards
They are integrated circuit cards the size and shape of a credit card which contain an
electronic chip allowing them to process as well as store information, currently in the 2 K
to 8 K range. Smart cards can contain read-only memory, read/write memory, or a
combination. Smart cards are increasingly used in freight transportation as part of gate
transaction to identify the driver and trucking company. Other application include toll and
gas payment and related transactions and by extension, vehicle tracking.
- Satellite-Based Location Determination and Communication technologies
They are used for location determination and navigation. They provide global coverage and
unprecedented accuracy. Applications range from aviation to maritime navigation to vehicle
and cargo tracking which provides one and two way digital communications between truck
dispatcher and driver. Following are the different satellite which can and are being used for
navigation purposes.
a) Global Position Satellites (GPS) are a department of defense owned
constellation of 24 satellites which enable position determination for location and

124
navigation with global coverage and, if differential GOS is used, with unprecedented
accuracy.
b) Geosynchronous Orbital Satellites are used to relay positional data on cargo
or equipment movement for inventory control and security.
c) Low Earth Orbit Satellites (LEOs) promise in the near future to substantially
lower cost while providing similar functions as Geosynchronous orbital satellites.
• INFORMATION EXCHANGE AND COMMUNICATION TECHNOLOGIES
- Electronic Data Interchange (EDI)
A specific, and particularly important, aspect of electronic commerce is Electronic Data
Interchange (EDI) - the transfer of data between business partners using very specific
industry standards, data sets, and protocols. In 1979 the American National Standards
Institute (ANSI) accredited the X 12 Standards Committee to develop standard industry
formats. It released the first official EDI standard, ANSI X 12 in 1983. International
standards were introduced in 1987 when the United Nations Commission on Western
Europe formally adopted EDI for Administration, Commerce and Transport (EDIFACT)
as a standard. EDIFACT’s role is similar to ANSI X 12 but with wider jurisdiction.
While EDIFACT and ANSI X 12 are not directly compatible in terms of transaction sets
and software, translation software can be used to convert on eprotocol to the other. While
carriers involved primarily in US domestic trade continue to use ANSI X 12 standards,
those working in international commerce are moving to adopt international standards
developed using EDIFACT formats. Currently documents prepared in ANSI X 12 formats
are more numerous, however this swill change as international trading partnerships expand
and demand grows.
- Automated Broker Interface (ABI) and Automated Manifest System (AMS)
Introduction of these two systems facilitated electronic filing of the cargo manifest, bill of lading,
vessel arrival times, "in-bond" movement, status notifications, and a variety of other
information of value to shippers and other participants in the system.
Customs initial use of information technology was based on a proprietary EDI format.
However major freight carriers insisted on the use of ANSI X 12 transaction sets and new
X 12 transaction sets were created for Customs applications. The US Custom Service is
now supporting X12 on a permanent basis and also supports several EDIFACT format
transactions. It is committed to supporting both standards.
The Automated Manifest System (AMS) network has been in place of more than ten years.
Today there are more than 2000 participants in Custom’s Automated Broker Interface
(ABI) System. Custom automation has resulted in quicker freight release time, since
electronically transmitted cargo information can be reviewed and status notifications
provided up to five days in advance of cargo arrival in the United States.
ITS ISSUES AND OPPURTUNITIES

125
• Lack of Electronic Communication Standards
As agencies begin sharing information across modes or jurisdictional boundaries, they will
need standards to ensure efficient exchange of information. For example, electronic data
interchange (EDI) systems currently are being applied with two sets of standards: the
American National Standards Institute s (ANSI) ASC X 12 standard covers most domestic
transactions, and the ISO s EDI for Administration, Commerce and transportation
(EDIFACT) standard covers most international transactions. Similarly, despite progress by
the U.S DOT and standards development organizations, DSRC systems deployed at weigh
stations, toll plazas and intermodal terminal agates often are not interoperable. The ITS
program needs to make freight data standards a part of future standards-setting activities and
link them to the standards being developed through the CVISN and North American Trade
Automated Prototype (NATAP) programs.
• Institutional Issues
Improving the collection and use of freight data will require the development of new
institutional relationships: between public agencies and private sector carriers and shippers;
between DOT modal administrations; and between jurisdictions. In many areas, a lead agency
may be designated to marshal data collection activities and avoid duplication of efforts. In
addition, efforts must be undertaken to increase the participation of private sector
stakeholders.
Institutional barriers and opportunities elated to multi-state applications of ITS for
commercial vehicle operations (CVO) have been documented in [27].
• Data Privacy And Use Concerns
Concerns over data security, access, and use remains a stumbling block for many shippers
and carriers. Carriers and shippers are concerned that sensitive data will be provided to
competitors, or that the government will take advantage of more widespread information on
truck travel times and routes to implement new taxes (e.g. a national weight-distance tax).
Increase enforcement for speeding and other traffic violation, or track hazardous materials
concerns. Public agencies must develop data access and use policies in conjunction with new
data collection methods.
• High Developmental Cost
Compared to most existing systems or techniques, the development of ITS require
significantly higher up-front development costs. Apart from using ITS systems for
congestion relief, safety improvements etc. they also provide high quality data at a much
lower long term cost.
• Data Analysis And Forecasting Methods
As public agencies improve their access to and use of freight data, they also will need to
enhance methodologies for analyzing and forecasting freight data. In many cases, ITS-
generated freight data, due to their level of detail on commodity, time-of-day, or spatial

126
distribution, may not be interpreted adequately by traditional travel demand and traffic
simulation models. State DOTs and MPOs may need to consider developing or upgrading
truck-trip tables, freight or goods movement models, and ITS-based traffic prediction,
control, and routing models. Planners also must receive training to interpret new data sources
and translate the findings into tangible projects.

127
APPENDIX Q: A BRIEF INTRODUCTION TO E-COMMERCE
Many different definitions of Electronic Commerce exist. The following definition given by the
European Commission [17] seems typical: "any form of business transaction in which the
parties interact electronically rather than by physical exchanges or direct physical contact".
According to such a definition, telemarketing, business communication conducted through FAX
and many other conventional forms of commerce can also be regarded as e-commerce. More
technology-intensive examples of e-commerce include Electronic Funds Transfer (EFT), which
was developed to optimize the transmission of electronic payments, and Electronic Data
Interchange (EDI), which allows companies to exchange business documents in a standardized
form. Both types of services began in the 1960s and have been offered on dedicated private
telecommunications networks.
Other definitions include:
- the sharing of business information, maintaining business relationships, and conducting
business transactions by means of telecommunications networks [41]
- the use of telematics-based systems (computer and communications systems) to support
the conduct of commerce [29].
Note that a key enabler of e-commerce is the telecommunications network. Although computers
are indispensable, commerce involving the use of computers alone (without the use of
communications network) does not constitute e-commerce. In fact, some argues that the fact that
Cisco, a 10-year-old company of San Jose, California making internet routers, emerges, after
surpassing Microsoft, as the world s most valuable company (in terms of stock-market
capitalization) signifies the fundamental transformation of the U.S. economy from a computer-
based economy to a communication-based economy - one in which you don t need PC power at
your fingertips any more because you can reach it instantly via the Web. [25].
In the past three years, e-commerce has received tremendous amount of attention and enjoyed
explosive growth, primarily due to the popularity of the internet. EFT and EDI can be
conducted on internet, and it costs less to conduct these two important types of e-commerce on
the internet. In fact, a different but less popular term of internet commerce or I-commerce has
been coined and in use.
.
We focus on the e-commerce conducted via the internet, and use e-commerce to actually mean I-
commerce. Although various types of internet services exist, they are all enabled by the
following fundamental logical functions, which are in turn enabled by advanced communications
and computer technologies.
• instant virtual meeting between two parties
• instant information exchange (including decisions)
• electronic computing on one end

128
• electronic computing on the other end
At least one of the two ends is a business, and the business may be equipped with high-power
computers. The customer on the other end can use the high-power computers of the business to
perform a variety of functions. Moreover, the business can interact with many customers or
even other businesses simultaneous to provide many services never conceived before.
A variety of specific services can be provided through these fundamental functions. In fact,
possibilities may be endless. An interesting question about e-commerce is what is possible with
electronic commerce. Although this possibilities question has been frequently asked in the
literature, e.g., [29], few attempts have been made to answer the question. In fact, given the
current infancy state of the e-commerce technologies and business models, it is actually
premature to answer this, inductively or deductively. Kimbrough and Lee [29] explored the
possibilities from a theoretical and linguistic perspective with the rationale that the possibilities
hinge upon how inquiry, comparison, negotiation, decision-making, learning, etc. can be
automated. Gogan [22] takes a pragmatic approach in exploring the possibilities and groups
web s based selling techniques in electronic catalog, virtual trade show, on-line consultation,
community of interest, on-line demo, on-line interaction, on-line assistance, community of
interest, etc..
Due to our focus on the impact of internet commerce on transportation, particularly air freight,
we focus on those internet activities with an intent to purchase or sell goods.
Actual and virtual meetings have their pros and cons. Although the senses of touch, feel and
smell cannot be used in virtual meetings, a vast amount of information can be prepared and
displayed in a well-organized manner. Although virtual meeting can be conducted regardless of
the physical distance of the two parties and any time of the day, trust between the two parties
may not be easy to establish and transaction security may not be easy to ensure.
What are being done or can be done during the virtual meeting can be analyzed in several different
dimensions, including:
• Pair type of the visitor of a website and website owner
• Purchase of information, services or hard goods
• Bulk freight or small packages.
1 Pair type of the visitor of a website and website owner.
Most researchers put either entity of the virtual meeting in two categories: business and
consumer. (European Commission considers three basic categories: business, consumer and
administration (i.e., government).) With the former categorization, there are four pair types - (1)
business-to-business (B-B, e.g., supply chain management of Fruit-of-the-loom with its over 50
distributors in the U.S.; e-steel.com; plasticsnet.com), (2) business-to-consumer (B-C, e.g.,

129
amazon.com, webvan.com, etc.), (3) consumer-to-business (C-B, e.g., priceline.com) and (4)
consumer-to-consumer (C-C, e.g., Ebay). (With the latter categorization, there exist nine
different pair types.) These four categories can further decomposed into finer subcategories. For
example, B-B e-commerce can be further decomposed into manufacturer-to-distributor, supplier-
to-manufacturer, etc..
2 Purchase of information, services or hard goods.
An example of purchasing information on the internet would be to run queries against a database
at a website. Many Application Service Providers (ASPs) have been operating on the internet.
Countless E-tailing internet businesses selling hard goods exist. There are now shopping malls all
over the Internet offering all kinds of consumer goods.
A service that can be provided electronically, particularly those that can be provided via internet,
has been called an E-service. HP defines an E-service as an electronic service available via the Net
that completes tasks, solves problems, or conducts transactions. An Application Service
Provider (ASP) is a service provider who makes applications available on a pay-per-use basis.
ASPs manage and maintain the applications at their own data center and make the applications
available via the Internet to subscribing businesses or consumers. ) Some of the services can be
provided online without generating any freight traffic, and even have the potential of reducing
automobile trips. Examples include the online tax preparation service at $9.95 provided by H&R
Block. Other E-services would generate freight traffic, e.g., iPrint.com, which allows its customer
to design their own professional print jobs online (e.g., cards, T-shirts, etc.) and can ship the
printed matters to the customer.
E-services can be used by individual consumers, businesses, and other e-services and can be
accessed via a wide range of information appliances. HP argues that E-tailing is Chapter 1 of e-
commerce while E-service is Chapter 2 of e-commerce - the future of e-commerce.
There could be a fine line in the future between information and hard goods. For example, CDs
and books may be purchased on the internet and immediately downloaded after online payment.
This may reduce the amount of demand for freight as well as air freight. XEROX is working hard
on its encryption technology to enable secure online selling of music and book, and in fact is
spawning the responsible division off as a subsidiary. Intertrust, a 200-employee start-up
company specializing in such encryption technologies, recently went public, and the company is
already valued at $2 B on the stock market. A recent 66-page novel by Steven King entitled
Riding the Bullet has been sold through the internet at $2.5 per copy. The novel would have
been priced at over $10 had it been sold in the traditional print fashion. The price reduction is
largely enabled by the elimination of the middleman. Barnes & Noble
(www.barnesandnoble.com) reported that 2.2 copies were downloaded very second of the first
24 hours since the novel went online. Time magazine (March 27, 2000) reported that, by the time
of publication, 500,000 people had downloaded the novel, with minimal amount of advertising.

130
There could also be a fine line between an ASP and a company selling hard goods. For example,
webvan.com sells and deliver groceries. However, like FedEx, it can provide delivery (especially
local delivery) as a service. For example, webvan.com is beginning to deliver tickets to its
customers as a service that has nothing to do with its grocery business. This will generate more
freight traffic, and may actually decrease traffic generated by passenger vehicles.
3 Bulk or Small Packages.
It is well known that e-commerce has already generated much small-package traffic. However,
bulk traffic has also been generated by the internet, perhaps at the expense of conventional bulk
shipping. For example, Plasticsnet.com is a brokerage company matching purchaser and seller of
plastics, and e-steel.com is its steel-industry counterpart. Such brokerage companies also serve
the function of credit verification.