next generation surfactants for improved chemical … library/research/oil-gas/enhanced oil... ·...
TRANSCRIPT

NEXT GENERATION SURFACTANTS
FOR IMPROVED CHEMICAL FLOODING TECHNOLOGY
FINAL REPORT
June 1, 2010 – May 31, 2012
Laura L Wesson, Prapas Lohateeraparp, Jeffrey H. Harwell, and Bor-Jier Shiau
October 2012
DE-FE0003537
University of Oklahoma Norman, OK 73019-0430

ii
DISCLAIMER
This report is prepared as an account of work sponsored by an agency of the United States Government. Neither the United States Government nor any agency thereof, nor any of their employees, makes any warranty, express or implied, or assumes any legal liability or responsibility for the accuracy, completeness, or usefulness of any information, apparatus, product, or process disclosed, or represents that its use would not infringe privately owned rights. Reference herein to any specific commercial product, process, or service by trade name, trademark, manufacturer, or otherwise does not necessarily constitute or imply its endorsement, recommendation, or favoring by the Unites States Government or any agency thereof. The views and opinions of authors expressed herein do not necessarily state or reflect those of the Unites States Government or any agency thereof.

iii
ABSTRACT
The principle objective of this project was to characterize and test current and next generation high performance surfactants for improved chemical flooding technology, focused on reservoirs in the Pennsylvanian-aged (Penn) sands. In order to meet this objective the characteristic curvatures (Cc) of twenty-eight anionic surfactants selected for evaluation for use in chemical flooding formulations were determined. The Cc values ranged from -6.90 to 2.55 with the majority having negative values. Crude oil samples from nine Penn sand reservoirs were analyzed for several properties pertinent to surfactant formulation for EOR application. These properties included equivalent alkane carbon numbers, total acid numbers, and viscosity. The brine samples from these same reservoirs were analyzed for several cations and for total dissolved solids. Surfactant formulations were successfully developed for eight reservoirs by the end of the project period. These formulations were comprised of a tertiary mixture of anionic surfactants. The identities of these surfactants are considered proprietary, but suffice to say the surfactants in each mixture were comprised of varying chemical structures. In addition to the successful development of surfactant formulations for EOR, there were also two successful single-well field tests conducted. There are many aspects that must be considered in the development and implementation of effective surfactant formulations. Taking into account these other aspects, there were four additional studies conducted during this project. These studies focused on the effect of the stability of surfactant formulations in the presence of polymers with an associated examination of polymer rheology, the effect of the presence of iron complexes in the brine on surfactant stability, the potential use of sacrificial agents in order to minimize the loss of surfactant to adsorption, and the effect of electrolytes on surfactant adsorption. In these last four studies the effects of such things as temperature, electrolyte concentration and the effect of different types of electrolytes were taken into consideration.

iv
TABLE OF CONTENTS
Executive Summary ........................................................................................... 1
Project Report .................................................................................................... 3
1. Determination of Surfactant Characteristic Curvature Values 1.1. Introduction ................................................................................................................. 3 1.2. Experimental ............................................................................................................... 4
1.2.1. Materials .......................................................................................................... 4 1.2.2. Methods............................................................................................................ 4
1.3. Results and Discussion ............................................................................................... 5 1.4. Conclusions................................................................................................................. 6
2. Surfactant Formulation for Enhanced Oil Recovery Chemical Flooding 2.1. Introduction ................................................................................................................. 6 2.2. Reservoir M Case Studies
2.2.1. Case Study 1 – Experimental ........................................................................... 7 2.2.1.1. Case Study 1 – Materials ..................................................................... 7 2.2.1.2. Case Study 1 – Methods ...................................................................... 7
2.2.2. Case Study 1 – Results and Discussion ........................................................... 8 2.2.3. Case Study 2 – Experimental ......................................................................... 12
2.2.3.1. Case Study 2 – Materials ................................................................... 12 2.2.3.2. Case Study 2 – Methods .................................................................... 12
2.2.4. Case Study 2 – Results and Discussion ......................................................... 14 2.2.5. Reservoir M Single-Well Field Test
2.2.5.1. Operating Procedures ......................................................................... 20 2.2.5.2. Results and Discussion ...................................................................... 21
2.3. Conclusions............................................................................................................... 25 3. Surfactant Stability in the Presence of Polymer
3.1. Introduction ............................................................................................................... 26 3.2. Experimental ............................................................................................................. 26
3.2.1. Materials ........................................................................................................ 26 3.2.2. Methods.......................................................................................................... 26
3.3. Results and Discussion ............................................................................................. 27 3.4. Conclusions............................................................................................................... 29

v
4. Surfactant Stability in the Presence of Iron 4.1. Introduction ............................................................................................................... 30 4.2. Experimental ............................................................................................................. 31
4.2.1. Materials ........................................................................................................ 31 4.2.2. Methods.......................................................................................................... 31
4.3. Results and Discussion ............................................................................................. 32 4.4. Conclusions............................................................................................................... 42
5. Evaluation of Potential Sacrificial Agents on Surfactant Adsorption 5.1. Introduction ............................................................................................................... 42 5.2. Experimental ............................................................................................................. 43
5.2.1. Materials ........................................................................................................ 43 5.2.2. Methods.......................................................................................................... 43
5.3. Results and Discussion ............................................................................................. 44 5.4. Conclusions............................................................................................................... 48
6. Effect of Inorganic Electrolytes on Surfactant Adsorption 6.1. Introduction ............................................................................................................... 49 6.2. Experimental ............................................................................................................. 50
6.2.1. Materials ........................................................................................................ 50 6.2.2. Methods.......................................................................................................... 51
6.3. Results and Discussion ............................................................................................. 51 6.4. Conclusions............................................................................................................... 56
Graphical Materials List ................................................................................. 59
References ......................................................................................................... 62
Bibliography ..................................................................................................... 65
List of Acronyms and Abbreviations ............................................................. 66
Appendix ........................................................................................................... 67
1
EXECUTIVE SUMMARY
The principle objective of this project was to characterize and test current and next generation high performance surfactants for improved chemical flooding technology, focused on reservoirs in the Pennsylvanian-aged (Penn) sands. This project involved the determination of the characteristic curvatures of 28 surfactants having a variety of chemical structures. These surfactants had been selected for their potential application in surfactant formulations for enhanced oil recovery efforts. In order to determine the characteristic curvatures, Winsor type salinity scans were conducted, and the optimum salinities associated with the three-phase or Type III regions were determined. With the optimum salinities and the hydrophilic-lipophilic difference relation, the characteristic curvatures were determined. For the surfactants tested 23 had (-) curvature values indicating the tendency of these surfactants to form micelles. The values of the characteristic curvatures for these surfactants ranged from -6.96 – -0.41. The remaining 5 surfactants had values ranging from 0.01 – 2.55. These surfactants tend to form reverse micelles as hence the (+) curvature values.
In addition to determining characteristic curvature values, stable surfactant formulations were developed for eight Pennsylvanian-aged sand reservoirs. For reservoir M whose crude oil was found to have an equivalent alkane carbon number (EACN) of 11.0 and in the corresponding brine a total dissolved solids content of 18 wt.%, the development of effective surfactant formulations for this reservoir was approached by two different methods (Case Studies 1 and 2) for surfactant selection while the evaluation involved in determining the optimal formulations relied on the same criteria and laboratory methodologies for both case studies. The optimal formulations were evaluated in one-dimensional sand-pack column tests and in core-flood tests both using Berea sandstone, reservoir crude oils and brines at reservoir temperatures. In Case Study 1 the initial surfactant mixture tested contained the co-solvent, isopropanol, which was found to be associated with the precipitation of iron from the brine. Several tertiary surfactant mixtures were formulated with the mixture consisting of the surfactants identified as AOT/W-7/PC-4 being selected for use in sand-pack column tests. While holding the total surfactant concentration at 0.38 wt. % but decreasing the polymer concentration from 2,000 to 1,000ppm, the residual oil recovery decreased from 46 to 32%, respectively. In a column test using 0.19 wt. % total surfactant and no polymer the residual oil recovery was only 14% indicating the necessity of the polymer.
In Case Study 2 the selection of potential surfactants for use in a surfactant formulation for reservoir M was based on the relationships described by the hydrophilic-lipophilic difference equation which relates surfactant characteristic curvatures to oil properties and salinities. Based on this equation, 4 anionic primary surfactants were selected for further testing along with 2 anionic co-surfactants. The identities of these surfactants are considered proprietary. The ratios of 0.2/0.04 wt. % and 0.2/0.06 wt. % AP12-3/PC-4 were found to be optimal for 14 and 17 wt. % NaCl, respectively. The surfactant formulations containing A45-4/PC-4 and A45-4/W-7 were also found to be stable, and sand-pack column tests were conducting using all three formulations with differing polymers. For the formulations tested, the residual oil recoveries ranged from 50.0 – 64.3 % with the greatest recoveries being accomplished using the AP12-3/PC-4, and A45-4/W-7 formulations. At the end of the project period core flood tests were being designed for this case study.

2
A single-well field test was conducted at reservoir M. This field test consisted of a single-well tracer test (SWTT) followed by a surfactant/polymer chemical flood and concluded with a second SWTT. The initial SWTT indicated a residual oil saturation of 25.2% while the post chemical flood tracer test indicated a Sor of 2.7%. This indicates a successful displacement of 70% of the water-flood residual oil saturation.
In the study involving the surfactant stability in the presence of polymer, three types of water-soluble polymers were tested with the optimal surfactant formulations developed for reservoir M in Case Study 2 described above. In synthetic brines most of the polymers did not affect the stability of the surfactant formulations at room temperature with the exception of the W-10/PC-4 surfactant mixture. As the temperature and salinity was increased the xanthan gum, scleroglucan and the HPAM –DP/RG 2535/1 and DP/RG 2535/4 proved to be stable is salinities up to 17 wt.% and temperatures up to 52°C. Also, there was a slight increase in the IFT’s of the systems, but the values were still below 10-2 mN/m. Comparing these same 3 polymers in terms of their shear viscosity at reservoir temperatures, it was determined that the xanthan gum provided the highest viscosity, and it along with scleroglucan exhibited non-Newtonian behavior. The HPAM polymer showed low viscosity for all permeabilities considered.
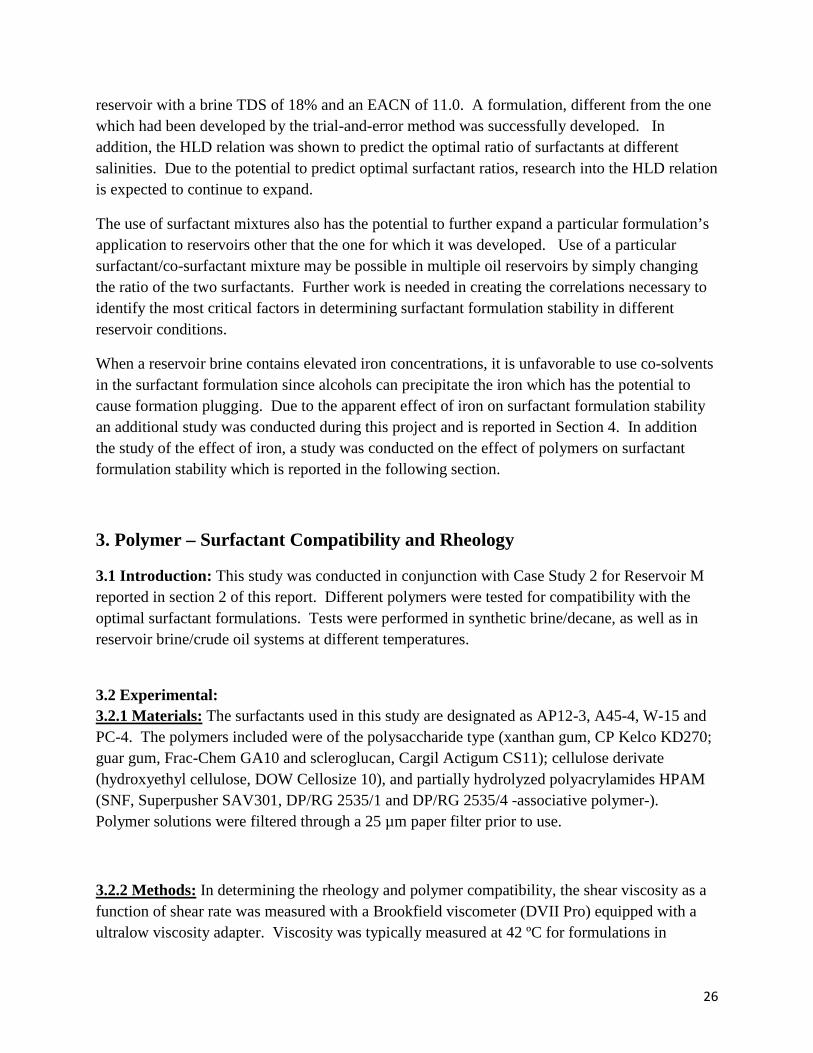
In the evaluation of the effect of iron on surfactant stability in high electrolyte concentrations, mimic reservoir M brines were created with and without iron. These mimic brines were then used to create surfactant/co-surfactant solutions to which citric or hydrochloric acid were added under both aerobic and anaerobic conditions. The resulting surfactant behaviors were identical between the aerobic and anaerobic conditions with the systems containing Alfoterra© 12-6s remaining stable while those containing Alfoterra© 12-34s being unstable as was indicated by the formation of viscous coacervate phases. Also the lack of iron precipitation did not change the behavior of the two primary surfactants. These qualitative observations confirm the surfactant stability is independent of the presence of iron.
An examination of potential sacrificial agents (Sa) for the purpose of minimizing surfactant loss to adsorption was conducted. In this study two surfactant/sacrificial agent systems were studied. In the study with the nonionic nonylphenol ethoxylated surfactant with the nonionic polyethylene glycol (PEG), it was determined that the PEG did not act as a sacrificial agent in adsorption studies on silica. In the study using the anionic sodium dodecyl sulfate (SDS) surfactant with the anionic polystyrene sulfonate (PSS) on alumina it was determined that control of the pH was critical and that the order of addition of the surfactant and Sa affected the amount of surfactant adsorbed. The greatest reduction in the SDS adsorption was seen for systems in which the SDS was added sequentially to the PSS-alumina system. There was a 50% reduction in the SDS adsorption at PSS concentrations of approximately 0.30 wt. %. It was concluded that PSS has the potential to act as a sacrificial agent, but additional testing is required.
A second study involving surfactant adsorption was conducted in order to evaluate the adsorption behaviors of polyethoxylated phenol nonionic surfactants onto silica in the presence of NaCl and LiI. It was determined that the addition of NaCl increases the adsorption of these surfactants relative to DI water while the addition of LiI acts to decrease the adsorption relative to DI water. This behavior is due to the salting-out and salting-in effects attributable to the NaCl and LiI, respectively. At the end of the project period, work was continuing on fitting the adsorption data to an adsorption model.

3
PROJECT REPORT
There are many existing oil reservoirs which have undergone primary and secondary (water flooding) production. It is known that up to two-thirds of the oil will remain in a reservoir after these production methods. According to the Oklahoma Geological Survey, the State’s original oil-in-place (OOIP) has been estimated to be 84 billion barrels of oil (BBO) with an expected ultimate recovery of about 18 BBO projected due to the complexity of reservoir geometries and poor reservoir management; leaving 68 BBO of “trapped” oil [Boyd, 2008]. Producing this residual oil requires interfacial tension (IFT) values of less than 10-2 mN/m [Rosen 2005]. Achieving these ultra-low values is possible through injection of surfactant solutions, but developing surfactant formulations stable in common reservoir brines is a challenge. In the current project surfactant formulations utilizing the ultra-low interfacial tensions obtainable with three-phase systems were developed for a total of six Pennsylvanian-aged sands oil reservoirs located in the state of Oklahoma. Both the trial and error method and with application of the Hydrophilic-Lipophilic Deviation (HLD) relation were used in the surfactant selections.
In addition to selecting surfactants capable of producing IFT values of less than 10-2 mN/m between the brine and the crude oil from the reservoirs examined in this project, studies were conducted on the selection of polymers which would not affect the stability of optimum surfactant formulations and could withstand the applied shear to which they could be subjected. Polymers are often required in order to increase the viscosity of the surfactant solution to a value similar to that of the residual crude oil. During the course of this project it was found that exposure of reservoir brine solutions to atmospheric oxygen would often result in precipitation of dissolved minerals. Methods of stabilizing the brines were investigated. Two final studies conducted during this project involved the proof-of-concept study investigating the potential use of sacrificial agents in minimizing/eliminating loss of surfactant due to adsorption and the study of the effect of inorganic electrolytes on the adsorption of ethoxylated alkyl phenol surfactants.
1. Characteristic Curvature 1.1 Introduction: Prior to application of the HLD relation in developing a surfactant formulation, the characteristic curvature (Cc) parameter as defined in the Hydrophilic Lipophilic Deviation (HLD) relation must be determined. The HLD relation for a mixture of two anionic surfactants at 25°C without alcohol described by Acosta [2008] was used in this project and is shown below in equation (1-1).
𝐻𝐿𝐷𝑚𝑖𝑥 = ln(𝑆) + 𝑋1�𝐶𝑐1 − 𝑘1 × 𝑁𝐶,𝑂� + 𝑋2�𝐶𝑐2 − 𝑘2 × 𝑁𝐶,𝑂� (1-1)
Where S is the salinity of the aqueous phase (g/100 ml), NC,O is the number of carbon atoms in a molecule of the oil. This is often represented by the alkane carbon number (ACN) if the oil is an alkane or by the equivalent alkane carbon number (EACN) for other types of oils. X1 and X2 are

4
the mole fractions of surfactants 1 and 2, respectively. Cc1 and Cc2 are the characteristic curvature values for the reference surfactant and the surfactant of interest, respectively. The constants k1 and k2 are characteristic of the type of hydrophilic groups and the type of electrolyte with typical values ranging from 0.1 - 0.2.
Throughout most of the project, the characteristic curvatures were determined using the assumption k1 = k2. With this assumption and knowing that at optimum salinity the HLD equals zero, equation (1) was simplified to the form shown in equation (1-2). Using this equation with the optimum salinities determined from traditional salinity scans using toluene; the values of Cc2 were determined and are shown in Table 2.
ln(S*/S*1) = X2 * (Cc1 – Cc2) (1-2) Where S* = optimum salinity of the mixture, S*1 = optimum salinity of the reference surfactant
When it was found that the assumption k1 = k2 was not appropriate for several surfactants being examined in this study, additional salinity scans were conducted with benzene in order to estimate k as defined in equation (1-3).
𝑘 = (𝑙𝑛𝑆1∗ − 𝑙𝑛𝑆2∗) (𝐸𝐴𝐶𝑁1 − 𝐸𝐴𝐶𝑁2)⁄ (1-3)
For this project the subscripts 1 and 2 refer to toluene and benzene, respectively. Since the EACN’s for these two oils are 1 and 0, the estimated value of k is simply determined from equation (1-4). With the value of k, equation (1-1) was used in the determination of the characteristic curvatures of select surfactants.
𝑘 = (𝑙𝑛𝑆1∗ − 𝑙𝑛𝑆2∗) (1-4)
1.2 Experimental: 1.2.1 Materials: The surfactants used throughout this study were all anionic, they include the alkyl sulfosuccinate surfactants (Aerosol OT and Aerosol MA-80), and both commercially available and experimental anionic surfactants with a variety of chemical structures. Their specific structures are considered proprietary information. Other materials used in this study included sodium chloride, benzene and toluene.
1.2.2 Methods: Determination of the characteristic curvatures was based on formulating middle phase microemulsions, also referred to as three-phase systems, using traditional salinity scans which are described in Bourrel and Schecter [1988]. The salinity scan systems were created using 5 mL of oil and 5 mL of an aqueous solution which contained a binary surfactant mixture, sodium chloride and water.

5
The method used in conducting the salinity scans for the purpose of determining Cc values was described by Acosta et al. [2008]. In this method the surfactant AMA is used as the reference surfactant and is designated as S1.in equations (1) and (2). This surfactant is known to form middle phase microemulsions without the presence of co-solvents or co-surfactants which makes it suitable for use as a reference surfactant. For each salinity scan the surfactant of interest, designated as S2, was added to the AMA in varying molar fractions while holding the total surfactant concentration constant at 0.1 wt. %. For each of the surfactant mixtures, salinity scans were performed in order to determine the optimum salinity, S*, of the mixture. After addition of all of the components, the vials were shaken once a day for 3 days and left for 2 weeks to equilibrate. The optimum salinity was visually determined by noting when the positions of the interfaces (oil/middle phase and water/middle phase) were equi-distant from the 5 mL mark. The optimum salinity is defined as the salinity at which there are equal volumes of oil and water solubilized in the middle phase.
1.3 Results and Discussion: The characteristic curvatures determined for the surfactants in this study based on the application of equation (2) with toluene are shown below in Table 1-1. A negative value of the Cc indicates the tendency of the surfactant to form micelles while a positive value indicates a tendency to form reverse micelles.
Table 1-1. Characteristic Curvatures Determined Using Toluene.
Surfactant Characteristic Curvature Surfactant Characteristic
Curvature PC-1 -6.90 W-1 -1.69 C 8c -1.59 W-2 0.01 C 10c -5.65 W-3 -5.46 C 12c -4.24 W-4 -6.34 C 14c -5.02 W-5 -3.95 C 16c -4.48 W-6 -4.89 AOT 2.55 W-7 -2.36 AMA -0.93 W-8 -1.33 PC-2 -0.93 W-9 -1.14 PC-3 -3.01 W-10 -0.41 PC-4 -6.96 W-11 -1.34
AP 12-3 -0.539 W-12 -1.61 A45-4 0.1 W-13 1.14 A45-8 1.42 SC-1 -5.50
As stated in the introduction during the course of this project, it was found that the assumption that k1 was equal to k2 may not be a valid assumption for all of the surfactants in this study. With this in mind the salinity scans were repeated using benzene in order to allow for the

6
determination of k2 and subsequently a refined value of the characteristic curvatures. The Cc values determined using benzene are shown in Table 1-2. Comparing the values obtained with toluene it can be seen the deviations range from 7% for PC-1 to 400% for W-2. At the project end work was continuing on this study.
Table 1-2. Characteristic Curvature determined using benzene.
Surfactant Characteristic Curvature
PC-1 -7.38 AP 12-3 -0.57
W-2 0.05 A45-8 1.91 W-11 -1.22 W-10 -0.36
1.4 Conclusions: The relationships defined in the HLD equation have been successfully applied in determining the characteristic curvature values for several anionic surfactants. The majority of these surfactants had a negative curvature value indicating a tendency for these surfactants to form micelles. The assumption of constant k values was shown to be invalid during the course of this study which necessitates repeating the salinity scans with a different oil phase, in this case benzene, in order to determine the k2 values and subsequently the Cc2 values. Repeating the salinity scans using benzene was in its initial stages at the end of the project period.
2. Surfactant Formulations for Enhanced Oil Recovery Application
2.1 Introduction - As stated in the introduction to the report, there are several aspects that must be considered in developing a surfactant based chemical formulation suitable for use in EOR applications. In this section the emphasis will be on Reservoir M. The work involved with reservoir M began with case study 1 which was based on the trial and error method of surfactant formulation development and its associated column and core flood tests. The discussion of this case study is followed by a description of the work on case study 2 which was based on the application of the HLD relation in the development of a surfactant formulation and the subsequent column tests. At the end of the project period the core flood tests were not complete. The discussion over work over this reservoir will conclude with a presentation of the single well test conducted. While this report focuses on the work associated with reservoir M, it is pointed out that over the course of this project surfactant formulations were developed for 7 additional

7
reservoirs. They are not included in this report due to the duplication of much of the methodologies involved and the proprietary nature of the components of the formulations.
Select properties of the crude oils and brines from Pennsylvanian-aged (Penn) sands reservoirs that were determined in this project are shown in Table 2-1. Please note: at the end of the project period the surfactant formulation development was still in progress for those reservoirs shown with an *. For other reservoirs (indicated with a **) work was terminated due to lease issues or reservoir conditions unfavorable to surfactant based chemical flooding. These conditions included low permeability of the reservoir and reservoir temperatures greater than 50°C.
Table 2-1. Crude oil and brine properties Reservoir EACN TAN (mg KOH/g) TDS (%)
M 11.0 0.398 18.0 F** 11.3 -- 13.0 S-F 8.5 0.20 18.0 W-P 9.8 0.10 26.0
A-B** 7.2 0.56 18.1 LMJ 9.2 0.26 20.0 L* 10.2 0.26 16.4
SE-H* 11.3 0.98 10.0
2.2 Reservoir M Case Studies
2.2.1 Case Study 1 – Experimental: 2.2.1.1 Materials: The surfactants in the development of surfactant formulation in Case Study 1 included both commercially available and experimental anionic surfactants with a variety of chemical structures. Their specific structures are considered proprietary information.
Berea sandstone, supplied by Berea Sandstone Cores, was used in the column tests and core floods. This sandstone is primarily sand-sized grains composed of quartz held together by silica. For the sandstone core samples there are several permeability ranges available which allow a certain degree of tailoring to the reservoir being studied. The permeability ranges available are < 50 mD, 50 – 100 mD, 100 -200 mD, 200 – 500 mD, 500 – 1000 mD, and > 1000 mD. The standard range is 100 – 200 mD. The sandstone used in the column tests was crushed in-house.
2.2.1.2 Methods: Phase Behavior Studies The microemulsion phase behavior studies involved traditional salinity scans. AOT and W-13 were selected to be the primary surfactants in the experiment due to their branched hydrophobe

8
structures. It has been shown that AOT and W-13 are able to create microemulsions with different hydrocarbon liquids and achieve low IFT’s with proper co-surfactant additions [Wu et al., 2002; Shiau, 2005; 2006; Hsu, 2006]. In addition, two petroleum sulfonate surfactants, S-1 and M-3, were also tested for their potentials to form microemulsions with crude oil. A 1:1 water/oil ratio was used for the microemulsion tests. With the targeted salinity, the optimum surfactant formulations were obtained by varying the surfactant/co-surfactant ratio in a binary surfactant mixture. The occurrence of a middle phase microemulsion was verified by visual observation. Once the equilibrated condition was achieved, IFT measurements were conducted for the samples. A co-solvent was also added to the binary surfactant system to promote microemulsion formation if necessary. Surfactant/co-surfactant or surfactant/co-surfactant/co-solvent formulations were evaluated using the following qualitative criteria:
• Solution stability: aqueous stability of surfactant and surfactant/polymer solutions at reservoir conditions (salinity and temperature) without precipitation and/or phase separation.
• Ultralow interfacial tension (IFT) of 10-2 mN/m or below. • Coalescence rate: how fast the emulsion brakes after mixing and form a microemulsion in
equilibrium with oil and/or brine. • Undesired phase: ideal microemulsion with low viscosity and the absence of gelation and
liquid crystal formation.
Precipitation and Phase Separation Studies Various concentrations of surfactant were prepared with either the simulated or reservoir brine and aged at reservoir temperatures for a minimum of a month and then checked for the presence of precipitate or the occurrence of phase separation. The presence of precipitate was determined visually based on the fact that surfactant crystals can reflect light. The occurrence of phase separation was also assessed by visual observation. Phase separation is confirmed to have taken place when two layers form in the solution [Shiau et al., 1995].
Interfacial Tension Measurements IFT measurements for decane samples were done at room temperature using a Model 6500 spinning drop tensiometer. Due to the opacity of the crude oil, IFT measurements are not possible for phase behavior systems in which oil is used.
2.2.2 Results and Discussion: Precipitation and Phase Separation Tests Before conducting the phase behavior tests for crude oil M, precipitation and phase separation tests were conducted with an AOT/W-7/IPA system using site brine M due to 18% total dissolved solids. Unfortunately, orange solid precipitation at the bottom and a liquid crystalline

9
phase on the top were observed in a series of tests at the reservoir temperature 46 °C (Figure 2-1). Increasing the co-surfactant (W-7) and alcohol (IPA) concentrations did not produce any improvement in the solution stability. It is suspected that the orange solid settling down at the bottom was iron precipitation since site brine M contains an elevated concentration of iron. In addition, the amount of iron precipitation increased when the IPA concentration was increased. This was confirmed by measuring the iron concentration in the brine before and after IPA addition. The iron concentration in the brine was reduced from 130 mg/L to 110 mg/L by adding 0.5 wt% IPA to the solution. Similar results were observed from the addition of other alcohols, such as DGBE, 2-butanol and tert-butanol. The use of co-solvents in brine M extensively devastated the stability of surfactant solution. On the other hand, while 1 % of W-7 stock solution prepared with brine containing 13% TDS (reservoir F) remained clear and homogenous at room temperature, while extensive surfactant phase separation was observed within 1 hour after the same solution was prepared using brine M. This could be due to the negative effect from the presence of iron in brine. The presence of precipitated ion in this brine sample and in several other reservoir brine samples listed in Table 2-1 led to a study on the effect of the presence of iron on surfactant solution stability which is presented in Section 4.
When a second co-surfactant, either PC-4 or SC-1, was introduced to the AOT/W-7 formulation there was an improvement in the solution stability. The solutions containing 1 wt% of PC-4 and SC-1 a high tolerance to salt and iron, as well as remaining clear and stable at 46 °C for up to about 1 month. Additionally, these two co- surfactants considerably minimized the iron precipitation and liquid crystal formation in brine M. For this ternary surfactant system, no apparent iron precipitation and surfactant phase separation were detected at 46 °C within a month.
Figure 2-1 Precipitation and phase separation of AOT/W-7/IPA system at 46 °C.
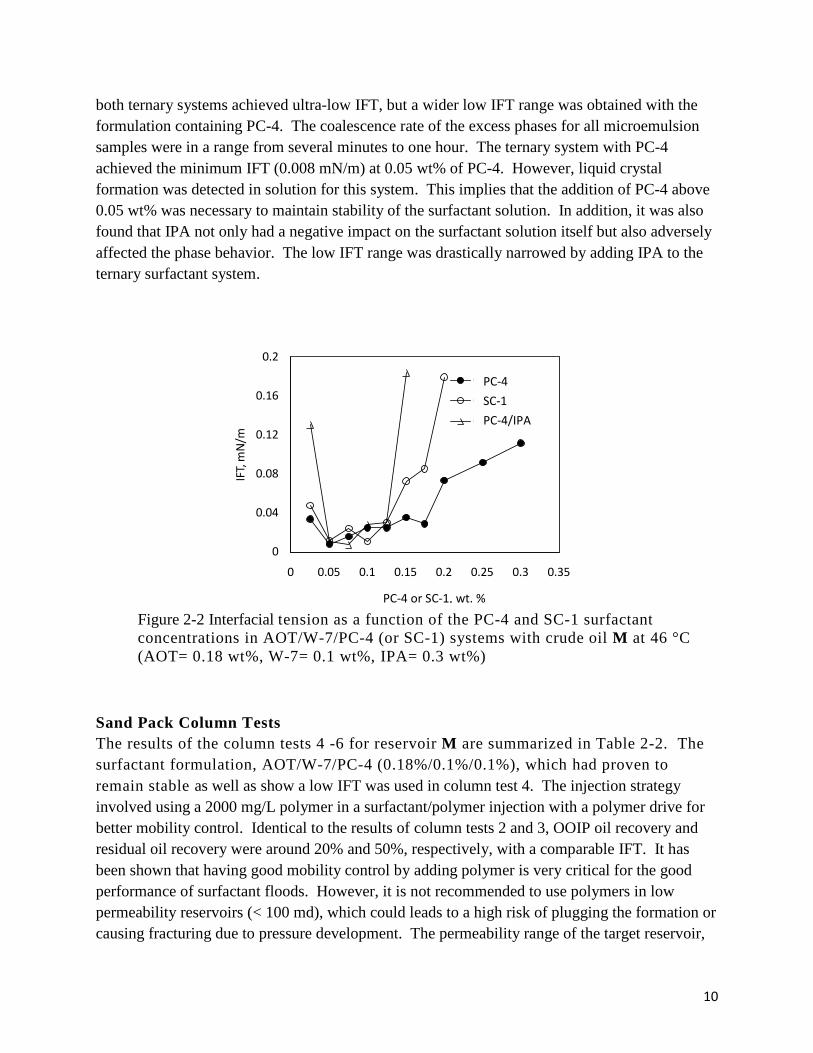
Phase Behavior Tests with Crude Oil Two ternary surfactant systems, AOT/W-7/PC-4 (or SC-1), were further investigated for their potential to create microemulsions with crude oil M using the site brine. Figure 2-2 shows that
10
both ternary systems achieved ultra-low IFT, but a wider low IFT range was obtained with the formulation containing PC-4. The coalescence rate of the excess phases for all microemulsion samples were in a range from several minutes to one hour. The ternary system with PC-4 achieved the minimum IFT (0.008 mN/m) at 0.05 wt% of PC-4. However, liquid crystal formation was detected in solution for this system. This implies that the addition of PC-4 above 0.05 wt% was necessary to maintain stability of the surfactant solution. In addition, it was also found that IPA not only had a negative impact on the surfactant solution itself but also adversely affected the phase behavior. The low IFT range was drastically narrowed by adding IPA to the ternary surfactant system.
Figure 2-2 Interfacial tension as a function of the PC-4 and SC-1 surfactant concentrations in AOT/W-7/PC-4 (or SC-1) systems with crude oil M at 46 °C (AOT= 0.18 wt%, W-7= 0.1 wt%, IPA= 0.3 wt%)
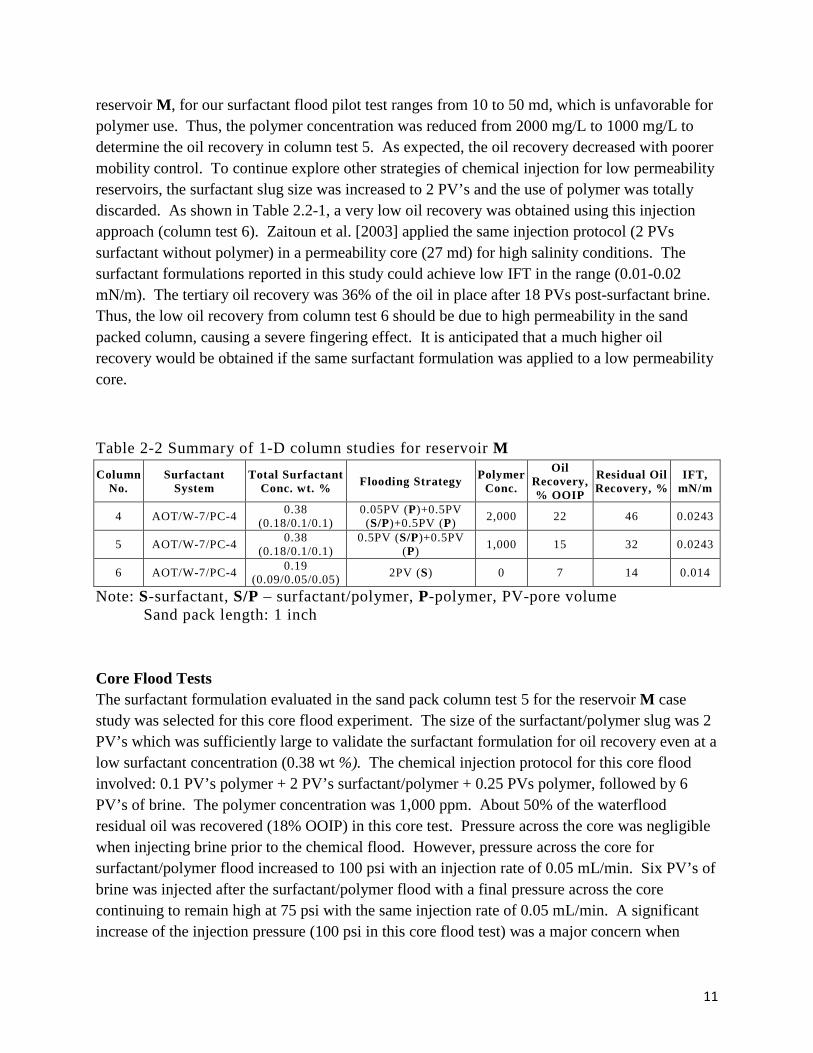
Sand Pack Column Tests The results of the column tests 4 -6 for reservoir M are summarized in Table 2-2. The surfactant formulation, AOT/W-7/PC-4 (0.18%/0.1%/0.1%), which had proven to remain stable as well as show a low IFT was used in column test 4. The injection strategy involved using a 2000 mg/L polymer in a surfactant/polymer injection with a polymer drive for better mobility control. Identical to the results of column tests 2 and 3, OOIP oil recovery and residual oil recovery were around 20% and 50%, respectively, with a comparable IFT. It has been shown that having good mobility control by adding polymer is very critical for the good performance of surfactant floods. However, it is not recommended to use polymers in low permeability reservoirs (< 100 md), which could leads to a high risk of plugging the formation or causing fracturing due to pressure development. The permeability range of the target reservoir,
0
0.04
0.08
0.12
0.16
0.2
0 0.05 0.1 0.15 0.2 0.25 0.3 0.35
IFT,
mN/
m
Calfax, wt%
Calfax DB45
Calfax 16L-35
Calfax DB-45/IPA
PC-4 SC-1 PC-4/IPA
PC-4 or SC-1, wt. %
11
reservoir M, for our surfactant flood pilot test ranges from 10 to 50 md, which is unfavorable for polymer use. Thus, the polymer concentration was reduced from 2000 mg/L to 1000 mg/L to determine the oil recovery in column test 5. As expected, the oil recovery decreased with poorer mobility control. To continue explore other strategies of chemical injection for low permeability reservoirs, the surfactant slug size was increased to 2 PV’s and the use of polymer was totally discarded. As shown in Table 2.2-1, a very low oil recovery was obtained using this injection approach (column test 6). Zaitoun et al. [2003] applied the same injection protocol (2 PVs surfactant without polymer) in a permeability core (27 md) for high salinity conditions. The surfactant formulations reported in this study could achieve low IFT in the range (0.01-0.02 mN/m). The tertiary oil recovery was 36% of the oil in place after 18 PVs post-surfactant brine. Thus, the low oil recovery from column test 6 should be due to high permeability in the sand packed column, causing a severe fingering effect. It is anticipated that a much higher oil recovery would be obtained if the same surfactant formulation was applied to a low permeability core.
Table 2-2 Summary of 1-D column studies for reservoir M Column
No. Surfactant
System Total Surfactant
Conc. wt. % Flooding Strategy Polymer Conc.
Oil Recovery, % OOIP
Residual Oil Recovery, %
IFT, mN/m
4 AOT/W-7/PC-4 0.38 (0.18/0.1/0.1)
0.05PV (P)+0.5PV (S/P)+0.5PV (P) 2,000 22 46 0.0243
5 AOT/W-7/PC-4 0.38 (0.18/0.1/0.1)
0.5PV (S/P)+0.5PV (P) 1,000 15 32 0.0243
6 AOT/W-7/PC-4 0.19 (0.09/0.05/0.05) 2PV (S) 0 7 14 0.014
Note: S-surfactant, S/P – surfactant/polymer, P-polymer, PV-pore volume Sand pack length: 1 inch
Core Flood Tests The surfactant formulation evaluated in the sand pack column test 5 for the reservoir M case study was selected for this core flood experiment. The size of the surfactant/polymer slug was 2 PV’s which was sufficiently large to validate the surfactant formulation for oil recovery even at a low surfactant concentration (0.38 wt %). The chemical injection protocol for this core flood involved: 0.1 PV’s polymer + 2 PV’s surfactant/polymer + 0.25 PVs polymer, followed by 6 PV’s of brine. The polymer concentration was 1,000 ppm. About 50% of the waterflood residual oil was recovered (18% OOIP) in this core test. Pressure across the core was negligible when injecting brine prior to the chemical flood. However, pressure across the core for surfactant/polymer flood increased to 100 psi with an injection rate of 0.05 mL/min. Six PV’s of brine was injected after the surfactant/polymer flood with a final pressure across the core continuing to remain high at 75 psi with the same injection rate of 0.05 mL/min. A significant increase of the injection pressure (100 psi in this core flood test) was a major concern when

12
considering applying a similar injection protocol in the reservoir. Thus, the need to explore other alternatives, such as an alternate polymers and/or novel injection protocols for application in low permeability reservoirs using surfactant formulation developed in this study.
2.2.3 Case Study 2 - Experimental: In the second study involving reservoir M, a second surfactant formulation was developed based on characteristic curvatures and the HLD equation. The resulting formulation was tested in sand pack column tests.
2.2.3.1 Materials: The primary surfactants in the formulations were anionic and are designated as AP12-3, W-10, W-14, W-15, W-16, W-17, A45-4, A45-8. This selection of surfactants consisted of a series of branched and linear/branched homologues. Secondary co-surfactants used included W-7 and PC-4. All surfactants were used as provided by their manufactures, without any further purification. Sodium chloride, calcium chloride and magnesium chloride (Sigma, purity>99%) were used to produce synthetic brines at different conditions
Preliminary phase behavior studies were carried out with solutions made in de-ionized water and decane as the oil phase. To study the performance of optimal formulations at reservoir conditions, brines and crude oils from reservoirs M and S-F were used. Brines were filtered through 1 µm glass fiber filters before using them. The physicochemical characteristics of reservoir brines and crude oils are provided in Table A-1 through A-3.
2.2.3.2 Methods: Characteristic Curvature of the Surfactants Characteristic curvature (Cc) values of the surfactants were used to predict the optimal salinities (S) of binary systems using the form of the HLD equation shown in equation 2-5 [Acosta et al. 2008]. Since the reservoir temperatures are not 25 °C, temperature effects must be taken into account.
𝐻𝐿𝐷𝑚𝑖𝑥 = ln(𝑆) + 𝑋1(𝐶𝑐1 − 𝑘1𝑥𝐸𝐴𝐶𝑁 − 𝛼1∆𝑇) + 𝑋2(𝐶𝑐2 − 𝑘2𝑥𝐸𝐴𝐶𝑁 − 𝛼2∆𝑇) (2-5)
where X1 and X2 represent the molar fractions of each surfactant in the mixture, and k1 and k2, are intrinsic constants for each surfactant. Values for the α1 and α2 parameters adjust for changes in temperature with respect to 25 ºC, as a reference. Acosta's method for measuring the Cc using a reference surfactant (sodium dihexyl sulfosuccinate), was applied in this work to measure the Cc of the most promising surfactants tested. Optimal salinities calculated for the surfactant mixtures developed, were compared against the experimental results obtained for both, formulations in DI water/decane, as well as formulations in reservoir brine/crude oil.

13
Phase Behavior, Stability and Interfacial Tension The surfactants were selected for this work as primary surfactants due to encouraging results obtained with some of these structures at moderate salinities in preliminary studies. One of the main objectives was to take advantage of the positive performance exhibited by these surfactants, by mixing them with highly hydrophilic co-surfactants (W-7 and PC-4) which would increase their solubility and optimal salinities [Shiau et al. 2012]. The use of the HLD equation takes into consideration the relative hydrophobic balance of the surfactant mixture in the solution, in order to calculate its optimal formulation, this is, a zero value for the HLD. According to Acosta et al. 2008 method, this optimum would correspond to an equal water and oil solubility for the surfactant system, and therefore, a near net zero-curvature for the bi-continuous microemulsion (Type III or IV).
A 1:1 water:oil ratio was used for the phase behavior tests. Using the target salinity, the optimal surfactant formulation was obtained by varying the surfactant/co-surfactant ratio in a binary surfactant mixture. The occurrence of a middle phase microemulsion was verified by visual observation. Phase behavior samples were left to equilibrate at reservoir temperatures for a month. Interfacial tension (IFT) was measured dynamically between decane and surfactant solutions at 42 ºC as reference temperature using a Grace 6500 spinning drop tensiometer. Tests performed with crude oil and brines were conducted at reservoir temperatures of 42°C (Reservoir S-F) and 46°C (Reservoir M). Surfactant/co-surfactant formulations were evaluated in terms of solution stability (no precipitation or phase separation), low interfacial tension (<10-2 mN/m), coalescence times of the microemulsion (less than a day), and absence of undesired viscous phases.
Surfactant aqueous solutions in synthetic or reservoir brines (no oil), were left to age at different temperatures, or at reservoir conditions for a minimum of one month. The occurrence of precipitate or phase separation was determined visually.
Sand-Pack Bed Studies Sand-pack bed tests were used to simulate one-dimensional reservoir flow at high permeability, and to screen potential SP formulations. Crushed Berea sandstone was sieved and dry packed into the vertically oriented jacked Kontes chromatography columns (2.5- cm diameter and 15-cm length). The porosity of the sand pack was determined to be 0.35. A flow-adaptor was used to adjust the length of the sand pack inside the column to 2 inches. The injected fluids flowed through the column from the bottom to the top and discharged into calibrated burettes. The columns were saturated with reservoir brine (3-4 PV), and then crude oil was injected (0.75 PV) at a rate of 0.3 mL/min. Water-flood is conducted by continuous brine injection until achieving residual oil saturation, typically between 20 to 30% oil saturation. After the water-flood, SP solution (0.5 PV) was injected at the same flow rate. The temperature of the jacked column was controlled by a flow-loop water bath.

14
2.2.4 Results and Discussion: Surfactant Formulation: All but the W-7 and PC-4 surfactants were screened in preliminary tests to determine their stability at different salinities and their optimal salinities when measured against decane. In general, it was found that surfactants with high content of linear carbon chains were less stable than their branched counterparts, leading to phase separation, precipitation and gel formation, even at concentrations below 0.2% and salinities of 2 wt.% (NaCl). Based on these preliminary results, four main surfactants were selected for further testing: AP 12-3, W-10, A45-4 and A45-8. For these surfactants, characteristic curvatures were obtained based on the Acosta et al. 2008 method. Cc values shown in Table 1-1 for the co-surfactants PC-4 and W-7 were used as in calculating the optimal salinities for binary surfactant mixtures.
Low interfacial tension and the presence of type III microemulsions with high oil solubilization have been widely correlated to improvements in oil mobilization at reservoir conditions [Novosad et al. 1982, Miller et al. 1991, Rosen et al. 2005, Iglauer et al. 20120, Shiau et al. 2012]. For the primary surfactants used in this case study the interfacial tensions and phase behaviors as functions of salinity show typical transitions from type I-type III-type II microemulsions (Figure 2-3). Optimal salinities were obtained from the minimum values of IFT, which corresponded to the type III microemulsion phase, characterized by the presence of a distinctive middle phase. Surfactants with short carbon chains (Figure 2-3a), showed significantly lower IFT than surfactants with longer chains (Figure 2-3b).

15
Figure 2-3. Interfacial tension as a function of salinity (NaCl) for (a) AP12-3, W-10, and W-14; (b) A45-4 and A45-8 surfactants. Total surfactant concentrations were 0.2 wt. %. Measured against decane at 42°C.
One of the main objectives of this work was to develop and test new SP formulations for chemical flooding at high salinities. However, optimal salinities for the primary surfactants studied are relatively low as shown in Figure 2.3. Based on previous studies and formulation approaches [Shiau et al 2012], mixtures of surfactants with different levels of hydrophobicity, as indicated by their Cc value, were considered in order to create systems with low ultra-low IFT’s and type III microemulsions at salinities up to 20 wt.%. For instance, mixtures of AP12-3 with PC-4 at different ratios were compared based on IFT’s and phase behaviors (Figure 2-4). For these mixtures, by changing the concentration of the co-surfactant, it is possible to design a surfactant formulation that could work at different salinities. Particularly, mixtures of 0.2/0.04 wt.% and 0.2/0.06 wt.% (AP12-3/PC-4) produce the minimum IFT’s at 14 and 17 w.t% NaCl salinity, respectively. The binary surfactant system was stable at 42 ºC, near the optimum ratios
AP12-3 W-10 W-14
A45-4 A45-8

16
and at higher co-surfactant ratios. However, for salinities over 10 wt. %, some precipitation was observed when the co-surfactant content was less than 10% of the total surfactant concentration. For all salinities studied, the optimum formulation was characterized by ultralow IFT (<10-2 mN/m), type III microemulsion phase behavior, no gel formation or undesired phase, and coalescence times below 48 h. The results suggest that the binary surfactant systems could be adapted for use in different salinity conditions by simply varying the surfactant ratio.
Figure 2-4. Interfacial tension as a function of co-surfactant (PC-4) concentration for systems with 0.2 wt.% AP12-3 9a) Salinities of 10 and 12 wt.%. (b) Salinities of 14 and 17 wt. %. IFT’s were measured against decane at 42°C.
As it has been pointed out above, surfactant formulation in high TDS reservoir brines continues to be a challenge due to the presence of divalent ions such as calcium and magnesium, which
PC-4 (wt. %)

17
affect the optimal formulation and the stability of surfactant systems. The optimal surfactant/co-surfactant concentration ratio is a critical factor in surfactant formulation development and depends on the salinity and hardness of the water used to formulate. To analyze the effect of divalent ions in a systematic fashion, the shift produced in the optimal co-surfactant to total surfactant concentration by the addition of divalent ions (Ca2+, Mg2+), was compared to the shift produced by the addition of NaCl at high TDS for two different surfactant mixtures (Figure 2-5). The results show that for NaCl, the optimal surfactant ratio follows a linear relationship with respect to the salt concentration. In fact, we have successfully used these linear fittings, to estimate the optimal formulation for any intermediate salinity. The zero (no co-surfactant) points, correspond to the optimal salinity of the individual primary surfactants.
Figure 2-5. Co-surfactant concentration ratio as a function of optimal salinity at 42°C for the surfactants mixtures shown. Round symbols represent the addition of CaCl2 and MgCl2 to a fixed 14 wt.% NaCl system. Solid lines represent linear fittings. The primary surfactant concentrations were fixed to 0.2 wt. %.
By keeping the total NaCl concentration constant at 14 wt.% and adding CaCl2 or MgCl2, the optimal formulations were obtained for synthetic brines with up to 170,000 wt.% TDS (up to 30,000 ppm CaCl2 or MgCl2). According to the results in Figure 2-5, at high salinities, there are not significant changes in the shift of the optimal surfactant ratio, by the presence of the divalent cations, with respect to the shift obtained by the addition of sodium chloride. The results contradict previous studies in the literature which clearly indicate that the addition of divalent cations significantly change the optimal salinity, or the optimal surfactant ratio, in comparison to systems with only NaCl [Bansal and Shah 1978a,b, Hirasaki 1982]. Some authors have
W-14/PC-4 A45-4/PC-4
Addition of Ca2+ or Mg 2+ to a 14% NaCl W-14/PC-4 system
Addition of Ca2+ or Mg 2+ to a 14% NaCl A45-4/PC-4 system

18
suggested that for solubilization in middle-phase microemulsions containing NaCl and CaCl2, the shift induced in the optimal salinity by 1 mole of CaCl2 is equivalent to the shift produced by 16 moles of NaCl [Chou and Shah, 1980].
Results shown in Figure 2-5 indicate that at high salinity, changes in the valence of the ion do not make significant differences in the overall effect of the salts on the optimal salinity for binary systems. It is hypothesized that there is a critical point at which all cations, monovalent and divalent, affect in the same way the optimal salinity (or optimal surfactant ratio), since the addition of new divalent cations to the middle phase reach appoint of saturation. Further research is needed to determine the saturation point at which the divalent cations become equivalent to monovalent cations and to find out if this is a surfactant dependent effect or a common saturation point.
Characteristic curvatures have proven to be useful design tools for the current surfactant formulation approach. The ability to predict optimal surfactant ratios for different salinities serves to reduce the time needed to find appropriate surfactant mixtures. Furthermore, calculated optimal salinities using the HLD equation and the values obtained experimentally are in good agreement (Figure 2-6). Empty symbols represent formulations in DI water, while grey solid symbols represent formulations prepared in reservoir brines M and S-F. Although there are deviations, especially with the reservoir brines, the values obtained by using the HLD equation and the Cc of the surfactants, provide relative accurate estimations of the optimal surfactant formulations with errors of 15% or less with respect to the experimental values.
Figure 2-6. Computed optimal salinities for mixtures of three primary surfactants (0.2 wt.% fixed) with the co-surfactant PC-4 versus experimental optimal salinity. The calculated values correspond to the optimum obtained using the Cc values of the surfactant/co-surfactant pairs in the HLD equation.
AP12-3/PC-4 A45-4/PC-4 W-10/PC-4

19
Stability of the surfactant system at high temperatures and high salinity is a key requirement for successful SP formulation design. In the course of this study, it was observed that the stability of the surfactant mixtures was compromised as the surfactant ratio was increased or decreased distant from the middle-phase optimum (Figure 2-7). Formulations with little or no co-surfactant, usually showed phase separation or precipitation as the temperature and salinity increased. AP12-3/PC-4 (Figure 2-7) and A45-4/PC-4 (not shown), showed the best performance in terms of stability in the aqueous solution at different temperatures and salinities. At salinities of 14 wt.% and lower, no phase separation was observed as the co-surfactant concentration was in excess. Phase boundaries at 10 and 12 wt.% NaCl were basically the same. However, when the salinity reaches 17 wt.%, separation was observed at both, low and high concentrations of PC-4 in the range of temperatures examined.
Figure 2-7. Stability and temperature effects on AP12-3/PC-4 mixtures. No phase separation was observed at high co-surfactant ratios for salinities below 14 wt. % in the range studies. The primary surfactant concentration was fixed at 0.2 wt.%.
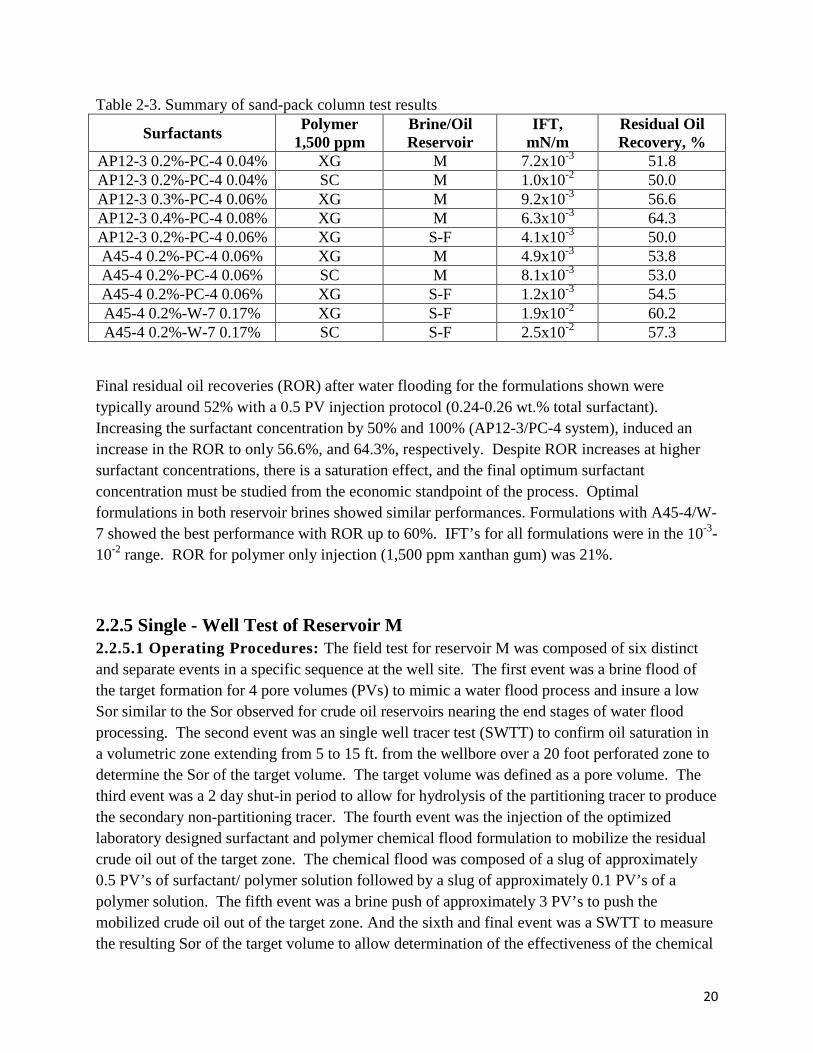
Sand-Pack and Core-Flood Tests: Sand-pack column tests were used to analyze the performance of the optimal stable SP formulations (Table 2-3). Surfactant formulation based on AP12-3/PC-4 and A45-4/PC-4 showed similar performance in the column tests when polymer was either xanthan gum or scleroglucan.
20
Table 2-3. Summary of sand-pack column test results
Surfactants Polymer 1,500 ppm
Brine/Oil Reservoir
IFT, mN/m
Residual Oil Recovery, %
AP12-3 0.2%-PC-4 0.04% XG M 7.2x10⁻³ 51.8 AP12-3 0.2%-PC-4 0.04% SC M 1.0x10⁻² 50.0 AP12-3 0.3%-PC-4 0.06% XG M 9.2x10⁻³ 56.6 AP12-3 0.4%-PC-4 0.08% XG M 6.3x10⁻³ 64.3 AP12-3 0.2%-PC-4 0.06% XG S-F 4.1x10⁻³ 50.0 A45-4 0.2%-PC-4 0.06% XG M 4.9x10⁻³ 53.8 A45-4 0.2%-PC-4 0.06% SC M 8.1x10⁻³ 53.0 A45-4 0.2%-PC-4 0.06% XG S-F 1.2x10⁻³ 54.5 A45-4 0.2%-W-7 0.17% XG S-F 1.9x10⁻² 60.2 A45-4 0.2%-W-7 0.17% SC S-F 2.5x10⁻² 57.3
Final residual oil recoveries (ROR) after water flooding for the formulations shown were typically around 52% with a 0.5 PV injection protocol (0.24-0.26 wt.% total surfactant). Increasing the surfactant concentration by 50% and 100% (AP12-3/PC-4 system), induced an increase in the ROR to only 56.6%, and 64.3%, respectively. Despite ROR increases at higher surfactant concentrations, there is a saturation effect, and the final optimum surfactant concentration must be studied from the economic standpoint of the process. Optimal formulations in both reservoir brines showed similar performances. Formulations with A45-4/W-7 showed the best performance with ROR up to 60%. IFT’s for all formulations were in the 10-3-10-2 range. ROR for polymer only injection (1,500 ppm xanthan gum) was 21%.
2.2.5 Single - Well Test of Reservoir M 2.2.5.1 Operating Procedures: The field test for reservoir M was composed of six distinct and separate events in a specific sequence at the well site. The first event was a brine flood of the target formation for 4 pore volumes (PVs) to mimic a water flood process and insure a low Sor similar to the Sor observed for crude oil reservoirs nearing the end stages of water flood processing. The second event was an single well tracer test (SWTT) to confirm oil saturation in a volumetric zone extending from 5 to 15 ft. from the wellbore over a 20 foot perforated zone to determine the Sor of the target volume. The target volume was defined as a pore volume. The third event was a 2 day shut-in period to allow for hydrolysis of the partitioning tracer to produce the secondary non-partitioning tracer. The fourth event was the injection of the optimized laboratory designed surfactant and polymer chemical flood formulation to mobilize the residual crude oil out of the target zone. The chemical flood was composed of a slug of approximately 0.5 PV’s of surfactant/ polymer solution followed by a slug of approximately 0.1 PV’s of a polymer solution. The fifth event was a brine push of approximately 3 PV’s to push the mobilized crude oil out of the target zone. And the sixth and final event was a SWTT to measure the resulting Sor of the target volume to allow determination of the effectiveness of the chemical

21
flood. The injection and production rate for this field study ranges from 150 to 170 barrels per day (B/D).
A SWTT can be characterized by four specific events. The first event is solution preparation and mixing of brine with partitioning and non-partitioning tracers. The second event is controlled injection of the brine and tracers into the target zone. The third event is the shut-in period. The fourth event is the pull-back of reservoir fluids and gas chromatography analysis of pull-back samples. The pull-back volume for this field test was 2 PV’s. The SWTT solutions were mixed in two 10,000 gallon steel tanks. Tank A contained approximately 23 barrels of brine, partitioning tracer and non-partitioning tracer. The non-partitioning tracer was methanol at a concentration of 5,000 ppm, and the partitioning tracer was ethyl formate at a concentration of 10,000 ppm. Tank B contained 117 barrels of reservoir brine and a non-partitioning tracer, propanol, at a concentration of 5,000 ppm. The contents in Tank A were injected first which was followed by injecting solution from Tank B using a triplex pump with an injection rate that was maintained between 150 - 170 B/D. After the shut-in of 2 days, the well was restarted in a production mode referred to as a “pull back”. During the pull back, brine production samples were collected at the wellhead every 10 minutes and were analyzed for tracer content by gas chromatography at the well site. The partitioning and non-partitioning concentration data from the gas chromatography analysis was used to determine a Beta value and then the Sor was calculated. A second SWTT was also conducted after the chemical flood and brine push injection to determine Sor due to the chemical flood and brine push mobilization of the crude oil out of the target zone.
The chemical flood solutions were made using 2 tanks, each with an 8 barrel capacity, and a 20 horse power centrifugal pump for mixing. One tank was used as a holding tank while the other tank was used for mixing. Surfactant plus polymer solution and the polymer solution were mixed and injected “on the fly”. The surfactant-polymer and polymer solutions were filtered through a string wound 50 micron filter located on the outlet of the triplex injection pump prior to injection in the well. The chemical flood was composed of 86 bbls of a surfactant plus polymer solution followed by 13 bbl slug of polymer. The surfactant plus polymer solution was comprised of 0.4 wt. % surfactant and 1,800 ppm of polymer. Immediately after the chemical flood injection was completed, 478 bbls of brine pusher were injected to move the mobilized crude oil out of the target zone to allow for the second SWTT.
2.2.5.2 Results and Discussion: Shown in Figures 2-8 and 2-9 are the normalized non-partitioning and partitioning tracer data for the SWTT and the chromatographic transformation of the normalized ethanol concentration to determine the Sor of the target zone prior to the chemical flood. Shown in Figures 2-10 and 2-11 are the normalized non partitioning and

22
partitioning data for the SWTT and the chromatographic transformation of the normalized ethanol concentration to determine the Sor of the target zone after the chemical flood of the target zone.
Figure 2-8. The normalized data from gas chromatography analysis of formation brine for ethanol and ethyl formate pre-chemical flood

23
Figure 2-9. The normalized data from gas chromatography analysis of formation brine for ethanol and ethyl formate with an overlay of the Chromatographic Transformation of the ethanol concentration data for determination of the Beta value of 1.21, and Sor value of 25.2%, pre-chemical flood.
Figure 2-10. The normalized data from gas chromatography analysis of formation brine for ethanol and ethyl formate post-chemical flood.

24
Figure 2-11. The normalized data from gas chromatography analysis of formation brine for ethanol and ethyl formate with an overlay of the Chromatographic Transformation of the normalized ethanol concentration data for determination of the Beta value of 0.1 and Sor value of 2.7%, post-chemical flood.
In Figure 2-8 there is a marked difference in the production volume where the maximum concentration of ethyl formate and ethanol are observed. The ethanol maximum concentration is observed at 10 barrels of production and the ethyl formate maximum concentration is observed at 50 barrels of production. This delay in observing the ethyl formate maximum normalized concentration relative to the ethanol maximum normalized concentration is a direct result of partitioning of the ethyl formate into the crude oil phase. Figure 2-9 shows the chromatographic transformation resulting in a Beta value of 1.2 or a Sor value of 25% prior to the chemical flood.
In Figure 2-10 there is no significant difference in the production volume where the maximum normalized concentration of ethyl formate and maximum normalized concentration of ethanol are observed. Both the ethanol normalized maximum concentration and ethyl formate normalized maximum concentration are observed at 10 barrels of production. There is no ethyl formate maximum normalized concentration delay relative to the ethanol maximum normalized concentration as is observed in the first SWTT before the chemical flood. The overlay of the maximum ethanol normalized concentration and maximum ethyl formate normalized concentration is a direct result of a lack of ethyl formate partitioning into the crude oil phase since the residual crude oil phase has been significantly decreased by mobilization. Figure 2-9 shows the chromatographic transformation resulting in a Beta value of 0.1 and a Sor value of 2.7% post chemical flood.

25
The selection of ethyl formate for the second SWTT is based on an estimate that the Sor would be approximately 11% which is based on packed bed and core flood studies. Generally, ethyl formate is not used for very low Sor values such as observed for this field study. Typically, ethyl formate is not used below a Sor of 7%; propyl formate is typically used for Sor values less than 7%. However, using ethyl formate for the SWTTs to determine the Sor before and after the chemical flood allows a direct unambiguous comparison.
Analysis of pre-surfactant/polymer and post-surfactant/polymer SWTT data shows that the chemical formulation that is investigated in the laboratory reduces the Sor from 25% to 7% in the field study. In other words, for this field study, at least 70% of the residual oil is successfully mobilized out of the target zone. The field study result confirms the effectiveness of the surfactant formulation observed in high salinity brine laboratory studies. It also confirms that the selected polymer at a concentration of 1800 ppm is capable of producing the desired viscosity for the favorable mobility ratio of the injecting fluid and is very effective in situations where the permeability is less than 200 mD. Viscosity measurements using Brookfield indicated 38 cP (shear rate= 14.7 1/sec) of 1,800 ppm polymer solution at reservoir conditions which was 7 times higher than the oil viscosity (5 cP). With filtering protocol, no significant loss of injection rate was observed during the surfactant/polymer injection test.
The crude oil recovery for the core flood experiment is approximately 50% and is significantly lower than the 70% crude oil recovery that is observed in the field study. The length of the core used for the core flood studies is typically 1.22 inches in length to minimize the pore volume, which has the positive impact of shorter overall run times for each experiment. However, there is likely a relationship between core length and the relevance to field study outcomes. The oil recovery results for core flood studies described here likely suffered entrance effects. Longer core lengths and therefore longer core flood run times are likely necessary to more adequately reflect the results observed in field studies.
2.3 Conclusions: Several surfactant formulations for use in EOR applications were developed during the course of this project, and based on observations and test results it can be concluded that effective surfactant formulations are comprised of a mixture of surfactants capable of producing ultra-low interfacial tensions and remaining stable in reservoir brines and at reservoir temperatures. To date, most of the formulations have been tertiary mixtures. The binary mixtures that have been developed have not been completely evaluated. The use of surfactant mixtures produces the most stable formulations. Traditionally surfactant formulations for use in EOR have been developed using trial-and-error methods which rely heavily on the experience of the developer.
In an effort to more efficiently develop surfactant formulations, the HLD equation and surfactant characteristic curvatures were applied in the development of a surfactant formulation for a
26
reservoir with a brine TDS of 18% and an EACN of 11.0. A formulation, different from the one which had been developed by the trial-and-error method was successfully developed. In addition, the HLD relation was shown to predict the optimal ratio of surfactants at different salinities. Due to the potential to predict optimal surfactant ratios, research into the HLD relation is expected to continue to expand.
The use of surfactant mixtures also has the potential to further expand a particular formulation’s application to reservoirs other that the one for which it was developed. Use of a particular surfactant/co-surfactant mixture may be possible in multiple oil reservoirs by simply changing the ratio of the two surfactants. Further work is needed in creating the correlations necessary to identify the most critical factors in determining surfactant formulation stability in different reservoir conditions.
When a reservoir brine contains elevated iron concentrations, it is unfavorable to use co-solvents in the surfactant formulation since alcohols can precipitate the iron which has the potential to cause formation plugging. Due to the apparent effect of iron on surfactant formulation stability an additional study was conducted during this project and is reported in Section 4. In addition the study of the effect of iron, a study was conducted on the effect of polymers on surfactant formulation stability which is reported in the following section.
3. Polymer – Surfactant Compatibility and Rheology
3.1 Introduction: This study was conducted in conjunction with Case Study 2 for Reservoir M reported in section 2 of this report. Different polymers were tested for compatibility with the optimal surfactant formulations. Tests were performed in synthetic brine/decane, as well as in reservoir brine/crude oil systems at different temperatures.
3.2 Experimental: 3.2.1 Materials: The surfactants used in this study are designated as AP12-3, A45-4, W-15 and PC-4. The polymers included were of the polysaccharide type (xanthan gum, CP Kelco KD270; guar gum, Frac-Chem GA10 and scleroglucan, Cargil Actigum CS11); cellulose derivate (hydroxyethyl cellulose, DOW Cellosize 10), and partially hydrolyzed polyacrylamides HPAM (SNF, Superpusher SAV301, DP/RG 2535/1 and DP/RG 2535/4 -associative polymer-). Polymer solutions were filtered through a 25 µm paper filter prior to use.
3.2.2 Methods: In determining the rheology and polymer compatibility, the shear viscosity as a function of shear rate was measured with a Brookfield viscometer (DVII Pro) equipped with a ultralow viscosity adapter. Viscosity was typically measured at 42 ºC for formulations in

27
synthetic brine, and at reservoir temperature, for formulations prepared in reservoir brine. Shear rate at reservoir conditions was estimated by using the semi-empirical equation developed by Hirasaki and Pope 1974, and adapted by Shen 2010:
𝛾𝑒𝑞 = 𝐶 �3𝑛+14𝑛
�𝑛/(𝑛−1)
� 𝑢𝑤�𝑘 𝑘𝑟𝑤𝑆𝑤𝜑/𝐹𝑘𝑟
� (3-1)
where C is a empirical constant estimated to be equal to 6 [Cannella et al. 1988]. The rheological constants, K (mPa·sn) and n (dimensionless), are the consistency index and the exponent, respectively; uw is the Darcy velocity (m/s) of the polymer containing water phase; k is the average permeability in m2; krw is the water phase relative permeability; Sw is water saturation (fraction); φ is porosity (fraction), and Fkr is the polymer permeability reduction factor, which was estimated to be in average equal to 2.5 - 5 based on data in the literature [Shen 2010].
3.3 Results and Discussion: Several water-soluble polymers from different classes (polysaccharides, celluloses and HPAMs) were tested for compatibility with optimal surfactant formulations at different temperatures and salinities (Table 3-1).
Table 3-1. Compatibility test for surfactant/polymer formulations Surfactant Temperature
10 wt. % NaCl 25 °C 33 °C 42 °C 52 °C AP12-3/PC-4
0.2/0.04 (wt.%) All stable All stable XG, SC and HPAM*
stable XG, SC and HPAM*
stable
W-10/PC-4 0.2/0.04
XG and SC stable
Phase separation Phase separation Phase separation
A45-4/PC-4
0.2/0.06 All stable All stable XG, SC and HPAM*
stable XG, SC and HPAM*
stable 14 wt.% NaCl 25 °C 33 °C 42 °C 52 °C
AP12-3/PC-4 0.2/0.04 (wt.%)
XG, SC and HPAM* stable
XG, SC and HPAM* stable
XG, SC and HPAM* stable
A45-4/PC-4
0.2/0.06 XG, SC and
HPAM* stable XG, SC and HPAM*
stable XG, SC and HPAM*
stable Brines M and S-F 25 °C 33 °C 42 °C 52 °C
AP12-3/PC-4 0.2/0.04 (wt.%)
-- -- XG, SC and HPAM* stable
XG, SC and HPAM* stable
A45-4/PC-4
0.2/0.06 -- -- XG, SC and HPAM*
stable XG, SC and HPAM*
stable All formulations were made with 1,500 ppm polymer *HPAM stable polymers included DP/RG 2535/1 AND DP/RG 2535/4
In synthetic brines, most of the polymers tested were stable with the surfactant formulations (AP12-3/PC-4 and A45-4/PC-4) at room temperature. However, W-15/PC-4 formulations with

28
polymers were not stable at the same condition. It is not completely understood why this surfactant mixture showed phase separation with the polymers when surfactants with similar structures such as the AP12-3 performed so well. As temperature and salinity increased only four polymers, xanthan gum, scleroglucan and HPAM DP/RG 2535/1 and HPRAM DP/RG 2535/4, proved to be stable with no phase-separation in salinities up to 17 wt.%, in reservoir brines, and at temperature up to 52 ºC.
Overall, the addition of polymer to a surfactant formulation increased the IFT slightly; however, IFT values were always below 10-2 mN/m for all the optimum formulations including those containing polymers. Furthermore, the stable formulations were characterized by having the same viscosity as solutions containing polymer alone at concentrations of 1,500 ppm, while the mixtures which proved to be unstable showed significant declines in viscosity; producing two well-defined phases: one rich in polymer (viscous phase) and another rich in surfactant.
Stable formulations suitable for use in column and core-flood tests were characterized and compared in terms of shear viscosity at reservoir conditions (Figure 3-1). All the polymers provided different viscosity profiles in the reservoir brines. Xanthan gum provided the highest viscosity due to its characteristic high molecular weight and expanded structure [Milas et al. 1990, Born et al. 2001]. Both polysaccharides showed non-Newtonian behavior, while the low molecular weight HPAM polymer showed low viscosity in the range of permeabilities studied. At low permeabilities (high shear rate), all polymers provided comparable performance. Note that these results do not account for the extensional nature of the flow in the porous media, which can induce an increase in the apparent viscosities at pore-level after a critical strain rate, whose value decreases with polymer concentration [Gonzalez et al. 2005].

29
Figure 3-1. Shear viscosity at 42°C, as a function of permeability for select polymers and their mixtures with the optimal AP12-3/PC-4 surfactant formulation. Polymer concentrations were fixed at 1,500 ppm. Solutions were made in reservoir M brine. The dashed lines represent the permeabilities (50 and 250 mD) selected for core flood tests.
Based on their rheology, the new developed SP formulations show a wide versatility in terms of their application at different permeabilities and temperatures. For instance, at high temperature and high permeability, a polymer such as scleroglucan would provide good thermal stability, while keeping a high viscosity [Kalpakci et al. 1990]. Xanthan gum would be a good candidate for lower temperatures and higher permeabilities (to avoid plugging); and finally, low molecular weight polymers such as the HPAM tested could be suitable for low permeability and low temperature reservoirs. Note that reservoir-specific SP formulation design would require the selection of an appropriate polymer and determination of its concentration which would be a function of reservoir conditions and the costs of all the chemicals involved.
3.4 Conclusions: Several water soluble polymers were tested for their compatibility with optimal surfactant formulations. Xanthan gum, scleroglucan and two low molecular weight HPAM were found to be highly effective at providing the required viscosity, while maintaining the stability of the SP mixtures at salinities up to 170,000 ppm, in reservoir brines (TDS up to 19%), and at temperatures up to 52 ºC. Work on this project will be continued with the conduction of core flood tests in order to evaluate the performance of the SP formulations developed.
Surfactants: AP12-3(0.2 wt.%) PC-4 (0.04 wt.%)

30
4. Effect of Iron on Surfactant Solution Stability
4.1 Introduction: During the course of this project several reservoir brines were found to contain a precipitated iron complex. These iron complexes were observed to form upon exposure to atmospheric oxygen while the brine samples were being held in storage. This study was undertaken in order to analyze iron interactions in surfactant formulations involving brines with high electrolyte concentrations.
Iron has a detrimental effect on the oil recovery because it may form complexes with hydroxide molecules of water, precipitate out of solution, and clog the well trapping the remaining oil in place. Dissolved iron occurs in solution in either the +2 or +3 oxidation state depending on the presence of oxygen. Typically at reservoir conditions, anaerobic environments dominate and iron is found as the +2 reduced state. Aerobic conditions oxidize iron and +3 oxidation state is found [Boyd, 2008]. Iron (III) precipitates at pH values above 1. In addition, iron (II) precipitates at pH values greater than 6. These reactions are shown in Figure 4-1.
Figure 4-1. Iron precipitation reactions [Crowe, 1985, McLeod, 1984]
Iron with a +3 oxidation state undergoes ionic exchange with hydroxide ions in aqueous solutions. The iron complex undergoes hydroxide ion exchange and the charge is reduced to +2, then +, then finally becomes neutral after three ion exchanges. Once the iron complex becomes neutral, it falls out of solution as a colloidal precipitate of iron (III) hydroxide[Cotton, 1980].
The solubility of ferrous and ferric hydroxide in solution is very low and gives insight as to the molecular interactions between iron ions and the water molecules that surround them. The solubility constant, Ksp, is a measure of the tendency of a substance to dissolve in another substance. The higher the solubility constant, the more a substance dissolves in solution. For ferrous hydroxide, the solubility constant is 4.87x10⁻¹⁷ and 2.79x10-39 for ferric hydroxide. These extremely low solubility values are indicative of complexes that form with water and precipitate out of solution and do not take place in the behavior within the bulk solution.
A qualitative observation of surfactant stability was first performed under various conditions in both aerobic and anaerobic environments using mimic brine to control the amount of electrolyte and iron concentration. While the project involved the use of two different mimic brines, the study involving the reservoir M mimic brine will be featured in this report as a complement of

31
the work presented in section 2 and due to the duplication of much of the results being presented in this section between the two mimic brines.
At the end of the project period a fundamental thermodynamic analysis of the activity coefficients and activity of the components within the mimic brines had been started in order to determine the factors that dominate the chemical potential of the brine. This portion of the study is not reported in this report. In addition to completing the thermodynamic analysis, plans for work beyond the project period include the conduction of iron hardness tolerance studies involving various amounts of iron, surfactant, and electrolyte concentrations.
4.2 Experimental: 4.2.1 Materials: Two synthetic brines were synthesized with de-ionized water for this study. The reservoir M mimic brine contained the following mineral components in the concentrations and from the sources listed. The suppliers are also indicated: sodium (46,000 mg/L, sodium chloride) from Fisher Scientific; Calcium (12,000 mg/L, calcium chloride dihydrate) from Acros Organics; and iron (150 mg/L, ferrous chloride tetrahydrate) from Fisher Scientific.
The primary surfactants were Alfoterra 12-34s (28.68% active) and Alfoterra 12-6s (31.3% active). The two co-surfactants were Novel© 23E7 Ethoxylate and Novel© 2426-100 Ethoxylate. All surfactants were supplied by Sasol.
Other materials used in this study were citric acid, anhydrous supplied by VWR and hydrochloric acid supplied by EMD™. The purities for both materials were shown as 100%.
4.2.2 Methods: The reservoir M mimic brines were prepared by adding constituent forms of calcium, iron, and sodium in amounts designated by water lab tests.
Additionally, two primary extended surfactants were used to compare surfactant stability with the mimic brine. Sasol chemical company develops Alfoterra© extended surfactants with various propylene oxide (PO) and ethylene oxide (EO) groups. These individual groups are often times labeled as “internal linkers” because they extend the length of the surfactant without sacrificing water solubility. The surfactant and corresponding film thickness increases. As a result, the solubility increases and the interfacial tension decreases because the surfactant has added flexibility for forming Type III aggregates. The propylene oxide group generally exhibits more hydrophobic behavior than that of the ethylene oxide group.
The stability of the surfactant was tested by mixing various weight percentages of primary surfactant, co-surfactant, and filling the remainder of the vial with mimic brine. The solution was then placed in its corresponding reservoir temperature oven and allowed to settle overnight (42⁰C for reservoir M brine). The following day, the vials were shaken and qualitatively

32
observed to determine whether the surfactant precipitated out of solution. The surfactant was qualitatively analyzed to determine if it was stable in the solution by swirling the solution and observing if a cloudy precipitate or phase separation formed. The iron complex did not require any swirling to determine whether it precipitated out of solution. Left in the oven, the iron complex precipitated with a burnt orange solid usually found on the bottom of the vial.
Additives in the form of citric acid and hydrochloric acid were used as treatment methods to control iron precipitation. As a result, the surfactant stability could be independently observed. Citric acid was used as a chelating agent, meaning that the acid formed stronger bonds with the iron than the hydroxyl groups on the water molecules. As a result, the iron did not precipitate out of solution. Hydrochloric acid was used the dissolve the iron in solution, eradicating any chance of iron precipitation.
Preparation of Solutions: Mimic Reservoir M Brine With and Without Iron Stock solutions of Alfoterra 12-34s and Alfoterra 12-6 s at 1 wt.% were made in both mimic brines with and without iron. The co-surfactant was made at 0.5 wt.% and the remainder was filled with mimic brine with and without the presence of iron.
Samples were then formulated from the prepared stock solutions. The primary surfactant was added in 0.5 wt.% and the co-surfactant composed 0.1 wt.% of the sample solution. The remainder was filled to 10 grams with the mimic brine with and without iron.
Mimic Brine Containing Citric Acid: It was imperative to maintain a pH of 4 when adding the citric acid based on the literature reviews. It was found that 100 parts per million of citric acid was needed to reach a pH of 4 within the bulk solution of the mimic brine. Two 250-mL solutions were created with the citric acid-one containing iron and one that did not. The two mimic brine solutions were then utilized to make the stock primary surfactant and co-surfactant solutions. The weight percentages were kept consistent between all samples as detailed in the above procedure.
Mimic Brine Containing Hydrochloric Acid: Hydrochloric acid was added till the solution reached a pH of 4, as consistent with the citric acid procedure. Two 250-mL solutions with constitute amounts of electrolyte and iron were added, followed by the addition of hydrochloric acid in order to dissolve the iron.

33
4.3 Results and Discussion:
Aerobic Condition: with and without Iron The results of the reservoir M mimic brine with and without iron are summarized in Table 4-1. Figure 4 details the qualitative results of the samples that contained mimic Miller 29 brine with no iron. The samples were pulled from the oven at 420C after being left overnight and then swirled in order to see if any surfactant had separated from the solution. When swirling the vial, if the surfactant separated from the bulk solution, an opaque, milky consistency would distribute throughout the vial. This phenomenon occurred when swirling the vials that utilized Alfoterra© 12-34s primary surfactants. The Alfoterra© 12-6s maintained homogeneity when swirled so this surfactant did not separate from solution. Figure 5 details the result when iron is in solution. The presence of a co-surfactant appeared to not affect the surfactant stability.
Table 4-1. Surfactant stability results of mimic reservoir M brine Alfoterra© 12-34s Alfoterra© 12-6s
No Iron in Brine Novel© 23E7 Unstable Stable Novel© 2426-100 Unstable Stable
Iron in Brine Novel© 23E7 Unstable Stable Novel© 2426-100 Unstable Stable
Figure 4-2. Mimic reservoir M brine with no iron

34
Figure 4-3. Mimic reservoir M brine with iron
Mimic Miller 29 Brine with and without Iron in the Presence of 100ppm Citric Acid The samples were made in the same way as the previous batch with the exception of the addition of 100ppm of Citric Acid used as a chelating agent. The vials were placed in the oven at 420C and left overnight. The following day, the samples were qualitatively observed for phase separation. The Alfoterra© 12-34s vials had phase separation in both the presence and absence of iron. Before shaking, a picture was taken detailing the phase separation at the top of the solution. Figure 4-4 details this non-homogeneity. Conversely, Alfoterra© 12-6s was homogeneous with and without the presence of iron.
Figure 4-4. Non-homogeneity of the Alfoterra© 12-34s at the top of the solution
Table 4-2 details the surfactant stability results with and without iron in the presence of citric acid. Figures 4-5 and 4-6 detail the qualitative results of the surfactant stability with and without iron.

35
Table 4-2. Surfactant stability results of mimic reservoir M brine with citric acid Alfoterra© 12-34s Alfoterra© 12-6s
No Iron in Brine Novel© 23E7 Unstable Stable Novel© 2426-100 Unstable Stable
Iron in Brine Novel© 23E7 Unstable Stable Novel© 2426-100 Unstable Stable
Figure 4-5. Mimic reservoir M brine without iron with citric acid
Figure 4-6. Mimic reservoir M brine with iron with citric acid
Mimic Miller 29 Brine with and without Iron in the Presence of Hydrochloric Acid The samples were made in the same way as the previous two batches except hydrochloric acid was added till a pH of 4 was obtained in order to dissolve the iron. The vials were placed in the oven at 420C and left overnight. The following day, the samples were qualitatively observed for phase separation. The behavior detailed in Figures 9 and 10 mirror the results found without any

36
additive and with the addition of hydrochloric acid. It is important to note that there are no orange undertones in solution because the iron has been dissolved by the hydrochloric acid.
Table 4-3. Surfactant stability results of mimic reservoir M brine with hydrochloric acid
Alfoterra© 12-34s Alfoterra© 12-6s No Iron in Brine Novel© 23E7 Unstable Stable
Novel© 2426-100 Unstable Stable Iron in Brine Novel© 23E7 Unstable Stable
Novel© 2426-100 Unstable Stable
Figure 4-7. Mimic reservoir M brine with no iron with hydrochloric acid
Figure 4-8. Mimic reservoir M brine with iron with hydrochloric acid

37
Anaerobic Experimentation The aerobic experiments detailed above were also performed anaerobically under the presence of nitrogen. These experiments took place in a glove box shown in Figures 4-9 and 4-10. All amounts of surfactant, co-surfactant, and mimic brine constituents were kept the same as in the aerobic experiments. Since water contains oxygen molecules, nitrogen was bubbled through the water to reduce the dissolved oxygen levels to less than 0.1 mg/L. All samples were made and sealed in the nitrogen enclosed environment as shown in Figure 4-11. The concentrations of both the stock surfactant and co-surfactants were consistent with the aerobic experimentation. The stock primary surfactant was 1 wt.% and the co-surfactant was 0.5 wt.%. The samples were also consistent in order to compare the iron precipitation in both environments. Each sample was composed of 0.5 wt.% of the primary Alfoterra surfactants and 0.1 wt.% of the ethoxylated alcohol co-surfactant.
Figure 4-9. Schematic of the nitrogen glove box for the anaerobic experimentation

38
Figure 4-10. Side view of the nitrogen glove box for the anaerobic experimentation
Figure 4-11. Stock solutions and samples were made in the nitrogen environment
Mimic Reservoir M Brine with and without Iron Samples were made in the same way as the aerobic experimentation except under a nitrogen environment with a sealed cap. The vials were then placed in the oven at 420C and left overnight. The following day, the samples were qualitatively observed for phase separation. The resulting behavior is detailed in Table 4-4 and shown qualitatively in Figures 4-12 and 4-13. These results mirror those found without any additive with and without iron.

39
Table 4-4. Surfactant stability results of mimic reservoir M brine Alfoterra© 12-34s Alfoterra© 12-6s
No Iron in Brine Novel© 23E7 Unstable Stable Novel© 2426-100 Unstable Stable
Iron in Brine Novel© 23E7 Unstable Stable Novel© 2426-100 Unstable Stable
Figure 4-12. Mimic reservoir M brine without iron
Figure 4-13. Mimic reservoir M brine with iron
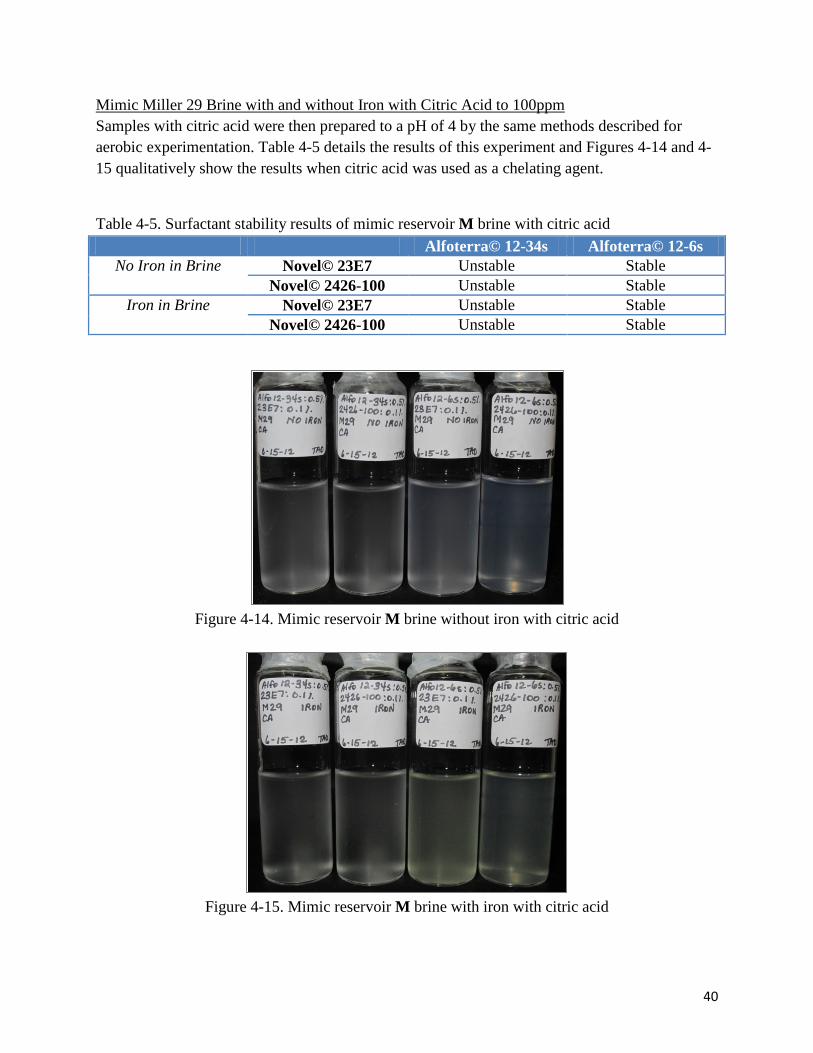
40
Mimic Miller 29 Brine with and without Iron with Citric Acid to 100ppm Samples with citric acid were then prepared to a pH of 4 by the same methods described for aerobic experimentation. Table 4-5 details the results of this experiment and Figures 4-14 and 4-15 qualitatively show the results when citric acid was used as a chelating agent.
Table 4-5. Surfactant stability results of mimic reservoir M brine with citric acid
Alfoterra© 12-34s Alfoterra© 12-6s No Iron in Brine Novel© 23E7 Unstable Stable
Novel© 2426-100 Unstable Stable Iron in Brine Novel© 23E7 Unstable Stable
Novel© 2426-100 Unstable Stable
Figure 4-14. Mimic reservoir M brine without iron with citric acid
Figure 4-15. Mimic reservoir M brine with iron with citric acid

41
Mimic Reservoir M Brine with Hydrochloric Acid Hydrochloric was added to the mimic brine until a pH of 4 was obtained in order to control the iron precipitation by dissolving the iron. The results are shown in Table 4-6 and qualitatively in Figures 4-16 and 4-17.
Table 4-6. Surfactant stability results of mimic reservoir brine with hydrochloric acid Alfoterra© 12-34s Alfoterra© 12-6s
No Iron in Brine Novel© 23E7 Unstable Stable Novel© 2426-100 Unstable Stable
Iron in Brine Novel© 23E7 Unstable Stable Novel© 2426-100 Unstable Stable
Figure 4-16. Mimic reservoir M brine without iron with hydrochloric acid
Figure 4-17. Mimic reservoir M brine with iron with hydrochloric acid

42
4.4 Conclusions: The qualitative observation of both aerobic and anaerobic systems provides insight into the molecular interactions between iron, the surfactant system, and electrolytes. In aerobic systems, by adding citric acid and hydrochloric acid to control the iron in the brine, the surfactant stability could be independently analyzed. The lack of iron precipitation did not change the behavior of the two Alfoterra© surfactants. The unstable surfactant, Alfoterra© 12-34s was nonhomogeneous and separated from the bulk solution in a viscous consistency at the top of the solution. Conversely, Alfoterra© 12-6s was stable in solution regardless of whether iron control was implemented or left in solution. These qualitative observations confirm that the surfactant stability is independent of the presence of iron. Both the ferrous and ferric iron precipitation is a result of the solubility constant, Ksp, in water.
Anaerobic experimentation mirrored the results of aerobic experimentation. By performing the experiments under a nitrogen environment, the iron oxidation reaction within the brine system could be minimized. Therefore, the surfactant stability could be independently analyzed. The results were precisely the same as the aerobic experimentation except for a visible lack of iron precipitation at the bottom of the vials. The stable surfactant, Alfoterra© 12-6s was homogeneous in solution, whereas the Alfoterra© 12-34s separated from solution in the form of a viscous coacervate at the top of the mimic brine. Anaerobic experimentation further confirmed that the surfactant stability is independent of the presence of iron.
Surfactant Adsorption Studies In the following two sections the details of two studies conducted during the project period are presented. They each focused on different aspects of surfactant adsorption. In the first study (section 5) the emphasis was on the prevention of surfactant adsorption by the use of sacrificial agents. The emphasis of the second study (section 6) was on the effect of inorganic electrolytes on surfactant adsorption.
5 Sacrificial Agents 5.1 Introduction: In chemical flooding surfactants are used to lower the interfacial tension between the aqueous and oil phases. This lowering of the interfacial tension is accomplished by the disturbance of the oil and water molecules located at the interfaces due to the arrangement of the surfactant molecules such that the hydrophilic head groups of the surfactants lie within the water phase of the interface while the hydrophobic tail groups extend into the oil phase. An effective chemical flood with surfactants requires that sufficient surfactant be available to act at the oil-water interfaces in order to promote the mobilization of the oil entrapped within the reservoir. Any surfactant lost to adsorption is not available to act at the oil-water interface. Any surfactant formulation and it corresponding injection strategy must account for this “lost”

43
surfactant thus adding to the cost of the tertiary recovery effort. The study involving sacrificial agents sought materials that would preferentially adsorbed onto
5.2 Experimental: 5.2.1 Materials: Two surfactants were used in this study. A nonylphenol ethoxylate nonionic surfactant (NP(EO)15) listed under the trade name of Tergitol NP-15 was purchased from Dow Chemical Company and was stated to be 100 wt% active. This surfactant is made up of a phenol group with an attached alkyl chain of a length of nine carbons and an attached chain of 15 polymerized ethoxylate monomers. The NP(EO)15 surfactant was used as received. The second surfactant was the anionic sodium dodecyl sulfate (SDS) produced by MP Biomedicals, LLC. The stated purity was ~99% and was used as received. This surfactant is comprised of a sulfate head group and a tail group of an alkyl chain length of 12 carbons.
There were three potential sacrificial agents studied. The nonionic polyethylene glycol (PEG) was supplied by Sigma-Aldrich and is produced by Aldrich Chemistry. The average monomer number of the PEG is 1000. Its stated purity is 100% and was used as received. PEG is a polymer of monomeric ethylene oxide. The anionic surfactant polystyrene sulfonate (PSS) was purchased from Sigma-Aldrich and produced by Aldrich Chemistry. The PSS has a average molecular weight of 70,000, was procured as a 30 wt.% solution in water, and was used as received. PSS is made up of polymerized sulfonated styrene units that include a benzene ring and a sulfate group.
The solids used were silica and alumina. The silica was procured from Evonik Industries under the trade name Aerosil 90. It contains >99.8 wt.% SiO2, has a specific surface area of 90±15 m2/g, and an average particle size of 20nm. The alumina used was procured from Evonik Industries under the trade name Aeroxide Alu C. It contains >99.8 wt% Al2O3, and has a specific surface area of 100±15 m2/g,
Other materials used during this study were ACS grade sodium chloride (from Acros) and HPLC grade methanol (from Fisher Scientific).
5.2.2 Methods: Surfactant and polymer solutions were prepared in 0.15 M NaCl which acted as a swamping electrolyte which acts to ensure the chemical potential of the surfactants can be considered independent of counter-ion concentration. Static adsorption systems were prepared in 15 mL tubes to which 0.50g of silica/alumina had been added. To this 10mL of surfactant/sacrificial agent solutions were added in the NP(EO)15/PEG study. The order of addition for the SDS/PSS study is discussed in the results section. The tubes were shaken until the solid was completely wetted, centrifuged for 45 minutes and placed in a 25°C water bath for five days and allowed to equilibrate. The aqueous supernatant was removed and diluted, as needed, for determination of the surfactant concentrations via both UV-Vis spectrophotometer (at a wavelength of 274nm) and High Performance Liquid Chromatography (HPLC) with a

44
conductivity detector. Any experimental method different from this is described with the specific study.
Adsorption isotherms were created for surfactant only and surfactant/sacrificial agent systems. The surfactant concentrations were varied in the same manner between the surfactant only and surfactant/sacrificial agent studies. Sacrificial agents were added to the solutions in a mass ratio of either 2:1 and/or 1:1 (surfactant: sacrificial agent). The method of introducing the sacrificial agent to the adsorption system was a parameter examined during the study.
5.3 Results and Discussion: In this study the adsorption behavior of 3 surfactant/sacrificial agents systems were determined. The NP(EO)15/PEG/silica study began with a kinetic study in order to determine the length of time required for the surfactant adsorption to reach equilibrium. As shown in Figures 5-1 and 5-2, equilibrium was essentially achieved in 24 hours with the initial concentration having little or no effect on the equilibration time.
Figure 5-1. Adsorption kinetics of NP(EO)15 on silica (initial concentration - 70,000 µM).
67000680006900070000710007200073000740007500076000
0 1 2 3 4 5 6 7
NP(
EO) 1
5 co
ncen
trat
ion,
µM
Time, days

45
Figure 5-2. Adsorption kinetics of NP(EO)15 on silica (initial concentration - 10,000 µM).
Adsorptions were carried out using initial surfactant concentrations of 4000, 8000, and 16,000 µM with and without PEG. The PEG was added in both 1:1 and 2:1 surfactant: PEG ratios. The addition of PEG as a sacrificial agent had no appreciable effect on the adsorption of the NP(EO)15 surfactant. If the surfactant adsorption had been reduced by the presence of the sacrificial agent the equilibrium adsorption of the NP(EO)15 in the presence of PEG should be less than the equilibrium adsorption of NP(EO)15 without the presence of PEG when at similar equilibrium concentrations. Figure 5-3 shows that some of the equilibrium adsorptions for the NP(EO)15/PEG systems are actually higher than the adsorption for the NP(EO)15 only system while others indicate that the adsorption was less than for the surfactant only system. This data implies that the PEG had very little, if any effect on the adsorption of the NP(EO)15 on silica.
0
2000
4000
6000
8000
10000
12000
0 1 2 3 4 5 6 7 8
NP(
EO) 1
5 con
cent
ratio
n, µ
M
Time, days
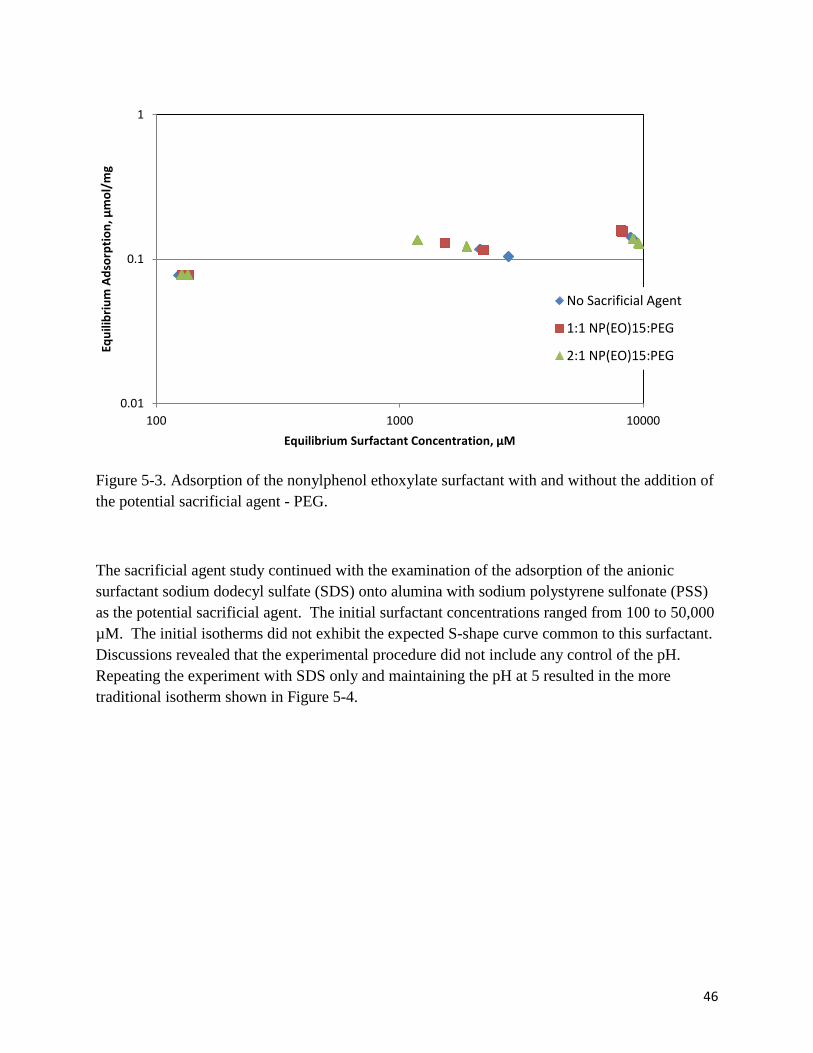
46
Figure 5-3. Adsorption of the nonylphenol ethoxylate surfactant with and without the addition of the potential sacrificial agent - PEG.
The sacrificial agent study continued with the examination of the adsorption of the anionic surfactant sodium dodecyl sulfate (SDS) onto alumina with sodium polystyrene sulfonate (PSS) as the potential sacrificial agent. The initial surfactant concentrations ranged from 100 to 50,000 µM. The initial isotherms did not exhibit the expected S-shape curve common to this surfactant. Discussions revealed that the experimental procedure did not include any control of the pH. Repeating the experiment with SDS only and maintaining the pH at 5 resulted in the more traditional isotherm shown in Figure 5-4.
0.01
0.1
1
100 1000 10000
Equi
libriu
m A
dsor
ptio
n, µ
mol
/mg
Equilibrium Surfactant Concentration, µM
No Sacrificial Agent
1:1 NP(EO)15:PEG
2:1 NP(EO)15:PEG

47
Figure 5-4. Adsorption of SDS onto alumina at pH 5.
For studies with PSS, the SDS concentration was held constant at 50,000µM while the PSS was introduced to the adsorption systems simultaneously and sequentially to the surfactant. The concentrations of the PSS was 0.15, 0.30, 0.45, 0.60, 0.75 wt. %. In sequential addition, the respective concentrations of PSS were added to the vials of alumina and the pH was adjusted to 5. The solutions were put in a water bath at 30 °C and left to equilibrate for 4 days. After 4 days, the SDS was added to each of the five solutions containing different concentrations of PSS. The solutions were again left to equilibrate in the water bath for an additional 4 days. After a total of 8 days, the solutions were centrifuged for at least 30 minutes at ambient temperature. The supernatant surfactant concentration was determined via high performance liquid chromatography.
In the simultaneous addition method, the SDS (50,000 µM) was added immediately after the addition of the PSS, after which the pH was adjusted to 5. The solutions were left to equilibrate for 8 days and then centrifuged and their supernatant was analyzed for the surfactant concentration.
The greatest reduction in the SDS adsorption was achieved with the sequential addition of the SDS to the PSS-alumina system (Figure 5-5). As the concentration of the PSS increased the amount of adsorbed surfactant decreased until the PSS concentration reached approximately 0.30 wt. % at which the SDS adsorption leveled off at approximately 2.0 µmol/m2. This is about a 50% reduction in the SDS adsorption.
0.01
0.10
1.00
10.00
1.00 10.00 100.00 1000.00 10000.00 100000.00
Adso
rptio
n of
SDS
(Γ, µ
mol
/m2 )
Equilibrium Concentration of SDS (μM)
Region IV Region III Region II Region I
CMC
CAC

48
Figure 5-5. Effect of PSS addition on the adsorption of SDS onto alumina.
5.4 Sacrificial Agents - Conclusions: For the NP(EO)15 – PEG adsorption on silica the PEG did not prove to be an effective sacrificial agent. It is proposed that since adsorption is driven, in part, by a concentration gradient, the much lower concentration of the PEG relative to the surfactant does not create a gradient capable of driving the PEG molecules to the surface before the surface is populated with the smaller but more abundant NP(EO)15 molecules. It is also possible that the expected hydrogen bonding between the silica surface and the PEG molecules did not occur. It had been proposed that the PEG molecules would bind to the surface sites using the oxygen atoms on each ethylene oxide monomer as a potential binding site to the surface using hydrogen bonds. However it is very likely that the hydrogen bonds were formed with the terminal –OH groups of the PEG molecules which would result in each 1000 monomer-long PEG molecule having only 2 viable bonding locations. If the PEG molecules are binding only on these 2 sites, this would result in insufficient surface coverage by the PEG which would leave the remaining surface sites available for surfactant adsorption.
For the SDS-PSS adsorption on alumina it found that control of the pH is critical to controlling the charge of the surface sites on the alumina. With control of the pH, the adsorption isotherm had the characteristic S-shape common to this surfactant. For the study on the effect of the use of PSS as a potential sacrificial agent, a single surfactant concentration was chosen. Two methods were examined for introducing the PSS and SDS. In the sequential method the SDS
0.00
0.50
1.00
1.50
2.00
2.50
3.00
3.50
4.00
4.50
0.00 0.10 0.20 0.30 0.40 0.50 0.60 0.70 0.80
Adso
rptio
n (µ
mol
/m2 )
PSS Concentration (wt.%)
Sequential PSSAddition
Adsorptionw/o PSS
SimultaneousPSS Addition

49
was added to the adsorption system in which PSS was already present. In the simultaneous method the SDS and PSS were added to the alumina at the same time. The greatest reduction in the SDS adsorption was achieved with the sequential addition of the SDS to the PSS-alumina system. As the concentration of the PSS increased the amount of adsorbed surfactant decreased until the PSS concentration reached approximately 0.30 wt. % at which the SDS adsorption was approximately 2.0 µmol/m2. This is about a 50% reduction in the SDS adsorption.
The proof-of concept study on the potential use of sacrificial agents indicates that the loss of surfactant to adsorption may be reduced through the application of preferentially adsorbing sacrificial agents. It is expected that continued research in this area will be closely tied to the continued research into surfactant adsorption in brines containing high total dissolved solids. The first of these studies has been conducted using polyethoxylated alkylphenol nonionic surfactants on silica has been conducted and is reported in the following section.
6. The Effect of Inorganic Electrolytes on Surfactant Adsorption 6.1 Introduction: Minimizing the loss of surfactant due to adsorption during a surfactant based chemical EOR flood is economically desirable. Anionic surfactants are often used in these floods, but the electrolyte composition and concentration of the brines in many reservoirs are not amenable to the use of many common anionic surfactants. [Lewis 1986] On the other hand, nonionic surfactants are potential candidates for use in enhanced oil recoveries by surfactant based chemical flooding of reservoirs with high TDS content because they are more soluble and tend to precipitate less than ionic surfactants. [Verkuyse, 1985]
Several studies [Somasundaran, 1991; Partyka, 1984; Lindheimer, 1989; Levitz, 1984; Denoyel, 1991] have determined adsorption isotherms for polyethoxylated nonionic surfactants on hydrophilic silica surfaces, and the majority of the surfactants chosen for study contained small to medium sized oxyethylenic groups, an EO number less than 20, with the exception of Partyka et al. [1984] and Somasundaran et al. [1991] have each developed an adsorption isotherm for a single ethoxylated phenol with an EO number of 40. Furthermore, none of the studies have thoroughly investigated the effect salinity has on the overall adsorption and shape of the adsorption isotherm, though Partyka et al. [1984] and Denoyel et al. [1991] have each published adsorption isotherms at moderate salt concentrations. A few generalizations about the adsorption of ethoxylated alkylphenols can be drawn from the previous studies. Most notably that the adsorption density is inversely proportional to the EO number of the surfactant. Thus the longer the oxyethylenic chain, the lower the adsorption density. Additionally, the area per ethylene oxide unit remains constant regardless of the size of the surfactant’s associated hydrophilic and hydrophobic portions, and the area per molecule is proportional to the square root of the number of EO groups, [Somasundaran, 1991 and Levitz, 1984] like at the air water interface. [Sedev, 2001]
50
The shape of the adsorption isotherm suggests a mechanism of adsorption that is highly dependent on the aggregation of surfactant molecules at the solid-liquid interface. Several studies have been conducted to determine the exact mechanism of adsorption. [Lindheimer, 1989; Levitz, 1984; Rutland, 1993; Levitz, 2004] A four part mechanism for adsorption of polyethoxylated alcohols with small EO numbers has been proposed in which at low surface coverage, less than 0.1, monomeric adsorption occurs. These adsorbed monomers act as nucleation sites for the adsorption of micelle-like aggregates, as the CMC is approached the aggregates fuse, and beyond the CMC a classic bilayer is formed. Other studies [Levitz, 1991; Kumar, 2004] demonstrated that adsorption isotherms for polyethoxylated alkylphenols, when normalized to the CMC and maximum adsorption, collapse to a single curve. Taken together these results suggest a consistent mechanism of adsorption, and a relationship between the adsorption at solid-liquid interface and bulk aggregation.
Most authors report the adsorption isotherms of surfactants with short EO chains follow the traditional Langmuirian isotherm. Though, it is important to note that the region representing monomeric adsorption is extremely abbreviated and most adsorption occurs near the critical micelle concentration. [Somasundaran, 1991; Partyka, 1984; Lindheimer, 1989; Levitz, 1984; Denoyel, 1991] This stepped L4 Langmuirian isotherm is characteristic of strong adsorbate-adsorbent interaction. [Paria, 2004] Several other isotherm models have been fitted to ethoxylated alkyl phenol adsorption data with varying success. There does not appear to be a model of adsorption that consistently fits the data best, though the Langmuir and Modified Langmuir tend to be the most successful. The specific adsorption conditions, including surfactant molecular structure, adsorbent, solvent, additive, and temperature, seem to have a large influence on the method of adsorption and thus the shape of the adsorption isotherm. [Shen, 2000; Gu, 1990; Sanchez-Martin, 2008; Ghiaci, 2007] However, Partyka et al. [1984] and Somasundaran et al. [1991] show that the adsorption isotherm for ethoxylated phenols with an EO number of 40 is fundamentally different, suggesting a different mechanism of adsorption than described previously. These adsorption isotherms show no distinct break characteristic of molecular aggregation on the solid-liquid interface, and a slope of less than one leading to the plateau, representing the CMC. Similar behavior has been observed for the adsorption of polyethoxylated alcohols on a hydrophobic silica surface and was shown to be described well by the Frumkin model. [Kumar, 2004]
6.2 Experimental: 6.2.1 Materials: The four polyethoxylated phenol nonionic surfactants used in this study were supplied by Huntsman Chemical, and Stepan Corporation. Table 6-1 provides a description of the surfactants.
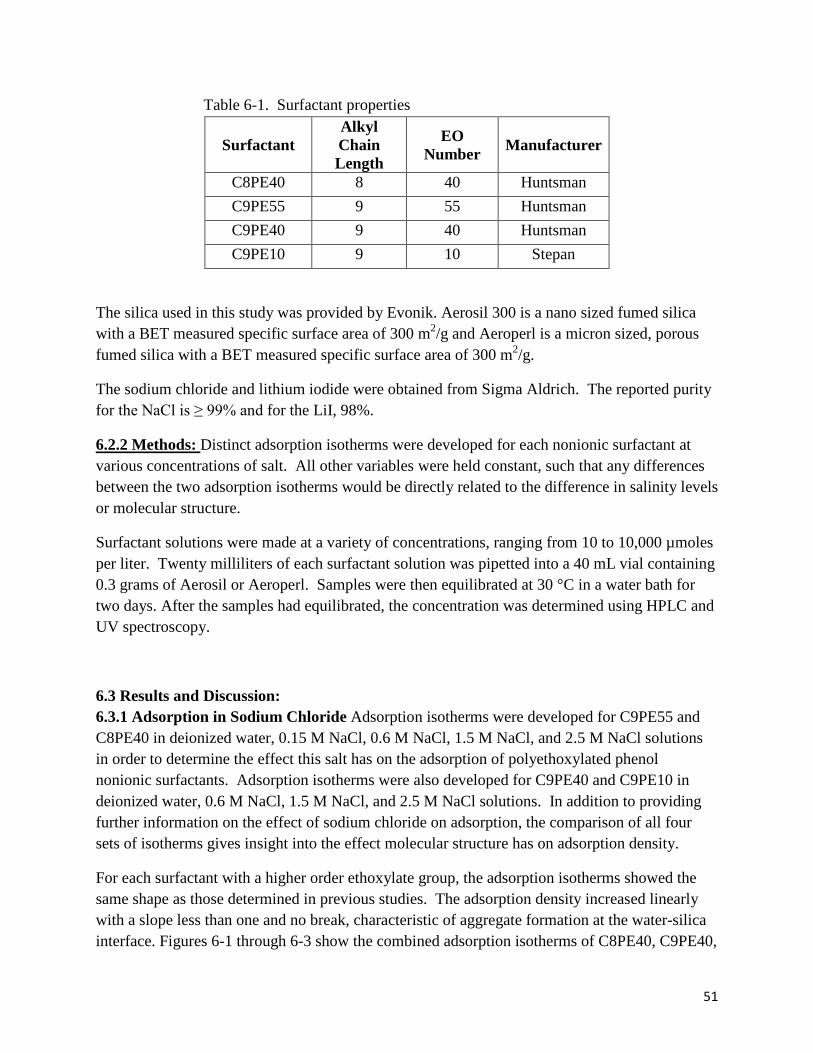
51
Table 6-1. Surfactant properties
Surfactant Alkyl Chain Length
EO Number Manufacturer
C8PE40 8 40 Huntsman C9PE55 9 55 Huntsman C9PE40 9 40 Huntsman C9PE10 9 10 Stepan
The silica used in this study was provided by Evonik. Aerosil 300 is a nano sized fumed silica with a BET measured specific surface area of 300 m2/g and Aeroperl is a micron sized, porous fumed silica with a BET measured specific surface area of 300 m2/g.
The sodium chloride and lithium iodide were obtained from Sigma Aldrich. The reported purity for the NaCl is ≥ 99% and for the LiI, 98%.
6.2.2 Methods: Distinct adsorption isotherms were developed for each nonionic surfactant at various concentrations of salt. All other variables were held constant, such that any differences between the two adsorption isotherms would be directly related to the difference in salinity levels or molecular structure.
Surfactant solutions were made at a variety of concentrations, ranging from 10 to 10,000 µmoles per liter. Twenty milliliters of each surfactant solution was pipetted into a 40 mL vial containing 0.3 grams of Aerosil or Aeroperl. Samples were then equilibrated at 30 °C in a water bath for two days. After the samples had equilibrated, the concentration was determined using HPLC and UV spectroscopy.
6.3 Results and Discussion: 6.3.1 Adsorption in Sodium Chloride Adsorption isotherms were developed for C9PE55 and C8PE40 in deionized water, 0.15 M NaCl, 0.6 M NaCl, 1.5 M NaCl, and 2.5 M NaCl solutions in order to determine the effect this salt has on the adsorption of polyethoxylated phenol nonionic surfactants. Adsorption isotherms were also developed for C9PE40 and C9PE10 in deionized water, 0.6 M NaCl, 1.5 M NaCl, and 2.5 M NaCl solutions. In addition to providing further information on the effect of sodium chloride on adsorption, the comparison of all four sets of isotherms gives insight into the effect molecular structure has on adsorption density.
For each surfactant with a higher order ethoxylate group, the adsorption isotherms showed the same shape as those determined in previous studies. The adsorption density increased linearly with a slope less than one and no break, characteristic of aggregate formation at the water-silica interface. Figures 6-1 through 6-3 show the combined adsorption isotherms of C8PE40, C9PE40,

52
and C9PE55 at all salt molarities. It is apparent that the increased salinity causes the total adsorption to increase, presumably due to the same electrolyte-surfactant interactions that cause the CMC and cloud point to lower.
Figure 6-1. C8PE40 adsorption in deionized water, 0.15M, 0.6M, 1.5M, and 2.5M NaCl at 30°C
0.01
0.1
10.1 1 10 100 1000 10000
Adso
rptio
n De
nsity
, µM
oles
/m2
Equilibrium Concentration, µM
0.15M NaCl 1.5 M NaCl Di Water 2.5 M NaCl 0.6 M NaCl

53
Figure 6-2. C9EO40 adsorption in deionized water. 0.6M, 1.5M, and 2.5M NaCl at 30°C
Figure 6-3. C9PE10 adsorption in deionized water, 0.15M, 0.6M, 1.5M and 2.5M NaCl at 30°C
0.1
11 10 100 1000
Adso
rptio
n De
nsity
, µM
oles
/m2
Equilibrium Concentration, µM
Di Water 0.6 M NaCl 1.5 M NaCl 2.5 M NaCl
0.1
11 10 100 1000 10000
Adso
rptio
n De
nstiy
, µM
oles
/m2
Equilibrium Concentration, µM
0.15 M NaCl 1.5 M NaCl Di Water 0.6 M NaCl 2.5 M NaCl
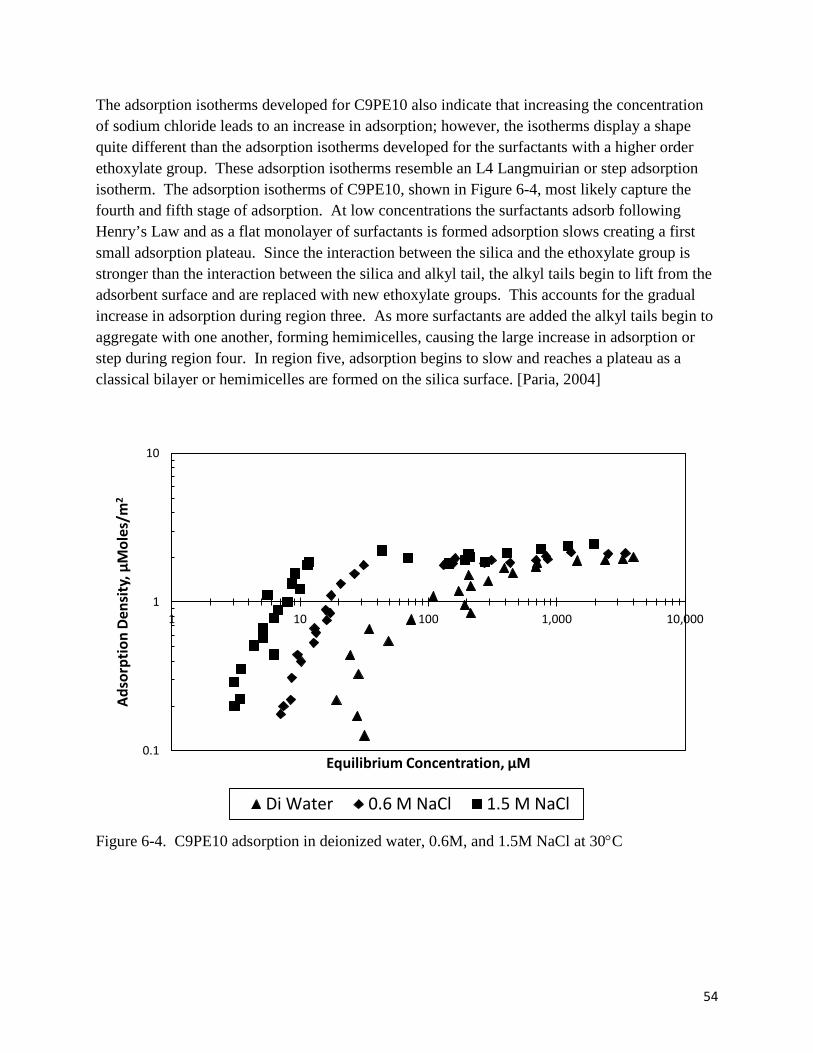
54
The adsorption isotherms developed for C9PE10 also indicate that increasing the concentration of sodium chloride leads to an increase in adsorption; however, the isotherms display a shape quite different than the adsorption isotherms developed for the surfactants with a higher order ethoxylate group. These adsorption isotherms resemble an L4 Langmuirian or step adsorption isotherm. The adsorption isotherms of C9PE10, shown in Figure 6-4, most likely capture the fourth and fifth stage of adsorption. At low concentrations the surfactants adsorb following Henry’s Law and as a flat monolayer of surfactants is formed adsorption slows creating a first small adsorption plateau. Since the interaction between the silica and the ethoxylate group is stronger than the interaction between the silica and alkyl tail, the alkyl tails begin to lift from the adsorbent surface and are replaced with new ethoxylate groups. This accounts for the gradual increase in adsorption during region three. As more surfactants are added the alkyl tails begin to aggregate with one another, forming hemimicelles, causing the large increase in adsorption or step during region four. In region five, adsorption begins to slow and reaches a plateau as a classical bilayer or hemimicelles are formed on the silica surface. [Paria, 2004]
Figure 6-4. C9PE10 adsorption in deionized water, 0.6M, and 1.5M NaCl at 30°C
0.1
1
10
1 10 100 1,000 10,000
Adso
rptio
n De
nsity
, µM
oles
/m2
Equilibrium Concentration, µM
Di Water 0.6 M NaCl 1.5 M NaCl

55
The difference between the adsorption isotherms in Figures 6-1 through 6-3 and Figure 6-4 would suggest the surfactants with higher order ethoxylate groups have a different adsorption mechanism. The shallow slope of the adsorption isotherms suggests a method of adsorption consistent with non-cooperative adsorption and the absence of the large increase in adsorption and second plateau, region four and five, would suggest the mechanism is not completely different, but rather an abbreviated version of the mechanism described in the preceding paragraph. Like with the C9PE10, the surfactants add to the silica surface until a monolayer is formed. Adsorption then begins to slow as the alkyl tails lift from the adsorbent surface; however, due to the large size of the ethoxylate groups the alkyl tails are not able to aggregate and form hemimicelles causing adsorption to cease after the formation of a surfactant monolayer.
6.3.2 Adsorption in Lithium Iodide: As discussed previously increasing the concentration of sodium chloride causes nonionic surfactants to become less soluble in water. This ‘salting out’ effect leads to a lowering of the critical micelle concentration, cloud point, and, as the data previously presented suggests, an increase in adsorption density. Both sodium and chloride are kosmotropic ions and thus cause the surfactant to become less soluble in water, but chaotropic ions and certain cations cause a general ‘salting in’ effect which has been shown to increase the critical micelle concentration and cloud point. Iodide ions are chaotropic and lithium ions are among the cations able of forming complexes with the ethoxylate group of the surfactants. In addition to increasing the critical micelle concentration and cloud point, Figure 6-5 shows that the presence of LiI decreases the amount of adsorption compared to adsorption in distilled water at the same temperature. This result suggests the surfactant-ion interactions play a significant role in determining the overall adsorption density. In terms of practical applications the brines encountered in enhanced oil recovery are composed of several ionic species in addition to sodium chloride. As mentioned earlier the contribution of constituent ions to the effect on cloud point is algebraically additive, which suggests the presence of polyvalent cations and kosmotropic ions would lead to an adsorption density less than predicted by a model using only sodium chloride.

56
Figure 6-5. C9PE55 adsorption in deionized water, 1.5M NaCl, and 1.5M LiI at 30°C
6.4 Conclusions: The results clearly indicate the addition of sodium chloride increases the adsorption of polyethoxylate phenols on silica relative to adsorption in deionized water and the adsorption density increases with increasing salt concentration. Additionally, it was demonstrated that the addition of lithium iodide decreases the adsorption density relative to deionized water. These results indicate that the ionic interactions responsible for the salting-in and salting-out effects seen with the CMC and cloud point play a significant role in the adsorption process. Thus kosmotropic ions will tend to increase the adsorption density, while chaotropic ions, lithium, and polyvalent cations will tend to decrease the adsorption density on silica. Since the salting in or salting out effects are algebraically additive, when considering practical applications such as enhanced oil recovery, in which the associated brines are composed of multiple constituent ions, the effect of each ion on increasing or decreasing adsorption density must be evaluated. For brines in which the major ionic constituent is sodium chloride with minor constituents such as calcium and magnesium, the total adsorption density would be less than predicted by the model using sodium chloride alone.
The surfactant-ion interactions responsible for shifts in the CMC and upper consulate temperature are also responsible for changes in the adsorption density of the surfactant on silica. This result suggests that the adsorption process is related to the solubility of and aggregation of surfactant in the bulk solution. Increasing the temperature of the surfactant solution leads to a dehydration of the ethoxylate head group, which leads to less availability for hydrogen bonding and decreases the solubility of the surfactant. This means that increasing the temperature at which the adsorption takes place will lead to an increase in the adsorption density. Figure 6-12 shows that adsorption occurring at 50 °C is greater than the adsorption that occurs at 30 °C.
0.1
11 10 100 1000
Adso
rptio
n De
nsity
, µM
ole/
m2
Equilibrium Concentration, µM
1.5 M NaCl Di Water 1.5 M LiI

57
Furthermore, since the mechanism by which increasing temperature decreases the solubility of a nonionic surfactant is the similar to the method by which kosmotropic ions decrease the solubility, by dehydration of the ethoxylate head group, and since the cloud point is almost solely dependent on the number of ethoxylate groups, for nonionic surfactants with large hydrophilic head groups, an equation relating the solubility effects of a given increase in temperature to a change in salt concentration can be developed using the cloud point data. The data collected suggests an increase in temperature of 20 °C is approximately equivalent to an increase of 0.89 moles of sodium chloride per liter of solution. Figure 6-12 shows that this relation provides an accurate prediction of adsorption at increased temperatures.
Figure 6-6. C9PE55 adsorption in deionized water at 50 °C and the predicted value
The ability to predict the adsorption density at a given salt concentration comes from the results of Figures 6-9 and 6-10 which show that the adsorption density is a function of the number of ethoxylate groups alone. The results of Figure 6-9 show that the adsorption densities of C9PE40 and C8PE40 are equal for the same salt concentration and Figure 6-10 shows that the area per ethoxylate group is consistent for all higher order ethoxylated surfactants studied at each salt concentration. Since adsorption density is proportional to the length of the ethoxylate group, is consistent for at a given salt concentration, and it is possible to relate temperature changes to equivalent changes in salt concentration, then it is possible to predict the adsorption density of a high order nonionic surfactant at a given salt concentration and temperature based on molecular structure.
0.1
1100 1000 10000
Adso
rptio
n De
nsity
, µm
oles
/m2
Equilibrium Concentration, µM
C9PE55, 50 Cl and Di Water 0.298 umoles/m^2

58
The results of this study also show that the presence of salt does not change the method of adsorption as previously suggested. For a given surfactant the adsorption isotherms developed at different salt concentrations collapse to a single curve when normalized. Furthermore the shape of the isotherm is fundamentally different than those developed for nonionic surfactants with low order ethoxylate groups or ionic surfactants. The adsorption isotherms increase linearly with concentration with a very shallow slope until the critical micelle concentration is reached, and there is no break in the curve indicating a critical admicelle concentration, suggesting a mechanism of competitive adsorption. This mechanism is most likely due to the large size of the polyethoxylate chains, which prevents admicelle formation. Therefore the adsorption density does not depend on the surfactant – surfactant interaction, but only on the size of the polyethoxylate chain and its interaction with the silica surface.
59
GRAPHICAL MATERIALS LIST
2. Surfactant Formulation for Enhanced Oil Recovery Chemical Flooding
Figure 2-1 Precipitation and phase separation of AOT/W-7/IPA system at 46 °C.
Figure 2-2 Interfacial tension as a function of the PC-4 and SC-1 surfactant concentrations in AOT/W-7/PC-4 (or SC-1) systems with crude oil M at 46 °C (AOT= 0.18 wt%, W-7= 0.1 wt%, IPA= 0.3 wt%) Figure 2-3. Interfacial tension as a function of salinity (NaCl) for (a) AP12-3, W-10, and W-14; (b) A45-4 and A45-8 surfactants. Total surfactant concentrations were 0.2 wt. %. Measured against decane at 42°C.
Figure 2-4. Interfacial tension as a function of co-surfactant (PC-4) concentration for systems with 0.2 wt.% AP12-3 9a) Salinities of 10 and 12 wt.%. (b) Salinities of 14 and 17 wt. %. IFT’s were measured against decane at 42°C.
Figure 2-5. Co-surfactant concentration ratio as a function of optimal salinity at 42°C for the surfactants mixtures shown. Round symbols represent the addition of CaCl2 and MgCl2 to a fixed 14 wt.% NaCl system. Solid lines represent linear fittings. The primary surfactant concentrations were fixed to 0.2 wt. %.
Figure 2-6. Computed optimal salinities for mixtures of three primary surfactants (0.2 wt.% fixed) with the co-surfactant PC-4 versus experimental optimal salinity. The calculated values correspond to the optimum obtained using the Cc values of the surfactant/co-surfactant pairs in the HLD equation.
Figure 2-7. Stability and temperature effects on AP12-3/PC-4 mixtures. No phase separation was observed at high co-surfactant ratios for salinities below 14 wt. % in the range studies. The primary surfactant concentration was fixed at 0.2 wt.%.
Figure 2-8. The normalized data from gas chromatography analysis of formation brine for ethanol and ethyl formate pre-chemical flood
Figure 2-9. The normalized data from gas chromatography analysis of formation brine for ethanol and ethyl formate with an overlay of the Chromatographic Transformation of the ethanol concentration data for determination of the Beta value of 1.21, and Sor value of 25.2%, pre-chemical flood
Figure 2-10. The normalized data from gas chromatography analysis of formation brine for ethanol and ethyl formate post-chemical flood.
Figure 2-11. The normalized data from gas chromatography analysis of formation brine for ethanol and ethyl formate with an overlay of the Chromatographic Transformation of the normalized ethanol concentration data for determination of the Beta value of 0.1 and Sor value of 2.7%, post-chemical flood
60
3. Surfactant Stability in the Presence of Polymer
Figure 3-1. Shear viscosity at 42°C, as a function of permeability for select polymers and their mixtures with the optimal AP12-3/PC-4 surfactant formulation. Polymer concentrations were fixed at 1,500 ppm. Solutions were made in reservoir M brine. The dashed lines represent the permeabilities (50 and 250 mD) selected for core flood tests.
4. Surfactant Stability in the Presence of Iron
Figure 4-1. Iron Precipitation Reactions
Figure 4-2. Mimic reservoir M brine with no iron
Figure 4-3. Mimic reservoir M brine with iron
Figure 4-4. Non-homogeneity of the Alfoterra© 12-34s at the top of the solution
Figure 4-5. Mimic reservoir M brine without iron with citric acid
Figure 4-6. Mimic reservoir M brine with iron with citric acid
Figure 4-7. Mimic reservoir M brine with no iron with hydrochloric acid
Figure 4-8. Mimic reservoir M brine with iron with hydrochloric acid
Figure 4-9. Schematic of the nitrogen glove box for the anaerobic experimentation
Figure 4-10. Side view of the nitrogen glove box for the anaerobic experimentation
Figure 4-11. Stock solutions and samples were made in the nitrogen environment
Figure 4-12. Mimic reservoir M brine without iron
Figure 4-13. Mimic reservoir M brine with iron
Figure 4-14. Mimic reservoir M brine without iron with citric acid
Figure 4-15. Mimic reservoir M brine with iron with citric acid
Figure 4-16. Mimic reservoir M brine without iron with hydrochloric acid
Figure 4-17. Mimic reservoir M brine with iron with hydrochloric acid

61
5. Evaluation of Potential Sacrificial Agents on Surfactant Adsorption
Figure 5-1. Adsorption kinetics of NP(EO)15 on silica (initial concentration - 70,000 µM).
Figure 5-2. Adsorption kinetics of NP(EO)15 on silica (initial concentration - 10,000 µM).
Figure 5-3. Adsorption of the nonylphenol ethoxylate surfactant with and without the addition of the potential sacrificial agent - PEG.
Figure 5-4. Adsorption of SDS onto alumina at pH 5.
Figure 5-5. Effect of PSS addition on the adsorption of SDS onto alumina.
6. Effect of Inorganic Electrolytes on Surfactant Adsorption
Figure 6-1. C8PE40 adsorption in deionized water, 0.15M, 0.6M, 1.5M, and 2.5M NaCl at 30°C
Figure 6-2. C9EO40 adsorption in deionized water. 0.6M, 1.5M, and 2.5M NaCl at 30°C
Figure 6-3. C9PE10 adsorption in deionized water, 0.15M, 0.6M, 1.5M and 2.5M NaCl at 30°C
Figure 6-4. C9PE10 adsorption in deionized water, 0.6M, and 1.5M NaCl at 30°C
Figure 6-5. C9PE55 adsorption in deionized water, 1.5M NaCl, and 1.5M LiI at 30°C
Figure 6-6. C9PE55 adsorption in deionized water at 50 °C and the predicted value

62
REFERENCES
Acosta, E.J., Yuan, J.S., Bhakta, A.S.; the Characteristic Curvature of Ionic Surfactants; J. Surfact. Deterg. (2008) 11:145-158.
Bansal, V.K., Shah, D.O., 1978b. The Effect of Divalent Cations (Ca++ and Mg++) on the Optimal Salinity and Talt tolerance of Petroleum Sulfonate and Ethoxylated Sulfonate Mixtures in Relation to Improved Oil Recovery. J. of the American Chem. Soc., 55, 367-370.
Born, K., Langendorff, V., Boulenguer, P., 2001. Xanthan. In: Biopolymers, Vol 5. Wiley, New York, pp 259-291.
Bourrel, M.; Schechter, R. (1988). Microemulsions and Related Systems. New York, NY: Marcel Dekker, Inc.
Boyd, D.T., Oklahoma: The Ultimate Oil Opportunity. Shale Shaker, Oklahoma Geological Survey, May-June 2008.
Cannella, W.J., Huh, C., Seright, R.S., 1988. Prediction of xanthan rheology in porous media. Paper SPE 18089 presented at the 63rd Annual Technical Conference and Exhibition, Houston, 2-5 October.
Cotton, F.A.; Wilkinson, G. (1980) Advanced Inorganic Chemistry (4th Ed.), John Wiley and Sons, NY p. 71, 757.
Crowe, C. W.: (1985) Evaluation of Agents for Preventing Precipitation of Ferric Hydroxide from Spent Treating Acid, J. Pet. Technol., 37(4) pp. 691-695.
Denoyel, R.; Rouquerol, J. J. Colloid Interface 1991, 143, 555-572.
Ghiaci, M.; Kalbasi, R.J.; Abbaspour, A. Colloids Surfaces.. 2007, 297, 105-113.
Gonzalez, J.M., Müller, A.J., Torres, M.F., Saez, A.E., 2005. The Role of Shear and Elongation in the Flow of Solutions of Semi-Flexible Polymers Through Porous Media. Rheol. Acta, 44, 396-405.
Gu, T,; Zhu, B. Colloids Surfaces. 1990, 44, 81-87.
Hirasaki, G.J., Pope, G.A., 1974. Analysis of factors influencing mobility and adsorption in the flow of polymer solution through porous media. SPE J. (August), 337-346.
Hirasaki, G.J., 1982. Interpretation of the change in optimal salinity with overall surfactant concentration. SPE Journal 10063, 971-982.
Hsu, T.P., M.S. Thesis, University of Oklahoma, (2006).

63
Iglauer, S., Wu, Y., Shuler, P., Tang Y., Goddard III, W.A., 2010. New surfactant classes for enhanced oil recovery and their tertiary oil recovery potential. J. of Petroleum Sci. and Eng. 71, 23-29.
Kalpakci,B., Jeans, Y.T., Magri, N.F., Padolewski, J.P., 1990. Thermal stability of scleroglucan at realistic reservoir conditions. SPE/DOE 20237. Seventh SPE Enhanced Oil Recovery Symposium, Tulsa, Oklahoma, 22-25 April.
Kumar, N.; Garoff, S.; Tilton, R.D. Langmuir 2004, 20, 4446-4451.
Levitz, P.; Van Damme, H.; Keravis, D. J. Phys. Chem. 1984, 88, 2228-2235.
Levitz, P. Langmuir 1991, 7, 1595-1608.
Lewis, S.J.; Verkruyse, S.A.; Salter, S.J. Selection of Nonionic Surfactants for Minimized Adsorption and Maximized Solubilization, Proceedings from the SPE Enhanced Oil Recovery Symposium, Tulsa, Oklahoma, USA, April 20-23, 1986; Society of Petroleum Engineers. 14910-MS.
Lindheimer, M.; Keh, E.; Zaini, S.; Partyka, S. J. Colloid Interface 1989, 138, 83-91.
McLeod, H. O. Jr.: (1984) Matrix Acidizing, J. Pet. Technol., 36(12) pp. 2055-69.
Millas, M., Rinaudo, M., 1990. Flow and viscoelastic properties of xanthan gum solutions. Macromolecules, 23, 2506-2511.
Miller, D.J., von Halasz, S.-P., Schmidff, M., Hoist, A., Pusch, G., 1991. Dual surfactant systems for enhanced oil recovery at high salinities. J. of Petroleum Sci. and Eng., 6, 63-72.
Novosad, J., Maini, B., and Batycky, J., 1982. A study of surfactant flooding at high salinity and hardness. JAOCS, 59, 10, 833-839.
Paria, S.; Khilar, K.C. Adv. Colloid Interface Sci. 2004, 110, 75-95.
Partyka, S.; Zaini, S.; Lindheimer, M.; Brun, B. Colloids and Surf 1984, 12, 255-270.
Rosen, M. J., Wang, H.; Shen, P.; Zhu, Y.; Ultralow Interfacial Tension for Enhanced Oil Recovery at Very Low Surfactant Concentrations, Langmuir (2005), 21: 3749-3756.
Rutland, M.W.; Senden, T.J. Langmuir 1993, 9, 412-418.
Sanchez-Martin, M.J.; Dorado, M.C.; del Hoyo, C.; Rodriguez-Cruz, M.S. J. Hazard Mater. 2008, 150, 115-123.
Sedev, S. Langmuir 2001, 17, 562-564.

64
Shen, J.J., 2010. Modern chemical enhanced oil recovery: Theory and practice. Chapter 5: Polymer flooding. GPP Elsevier, Boston, MA, USA.
Shen, Y. Chemosphere. 2000, 41, 711-716.
Shiau, B.J., Sabatini, D.A., and Harwell, J.H., 1995. “Properties of Food Grade (Edible) Surfactants Affecting Subsurface Remediation of Chlorinated Solvents.” Environmental Science and Technology, Vol. 29, No. 12. 2929-2935.
Shiau, B.J., “In-situ Surfactant and Chemical Oxidation Flushing for Complete Remediation of Contaminants and Method of Using Same.” U.S. Patent 6,913,419, July 5, 2005.
Shiau, B.J., Hsu, T-P., Lohateeraparp, P., Wan, W., Lin, Z., Roberts, B.L., 2012. Improved oil recovery by chemical flood from high salinity reservoirs. SPE 154260. SPE Improved Oil Recovery Symposium, Tulsa, Oklahoma, 14-18 April.
Somasundaran, P.; Snell, E.D.; Xu, Q. J. Colloid Interface 1991, 144, 165-173.
Taugbøl, K, Ly T. V., Austad, T; Chemical Flooding of oil Reservoirs 3. Dissociative Surfactant-Polymer Interaction with a Positive Effect on Oil Recovery, 1995, Colloids and Surfaces A: Physiochemical and Engineering Aspects, 103 (1995), 83-90.
Taylor, K.C.; Nasr-El-Din, H.A. Chemistry of Iron Control Chemicals Used in Acid Stimulation Treatments.
Verkuyse, L.A.; Salter, S.A. Potential Use of Nonionic Surfactants in Micellar Flooding, Proceedings from the SPE Oilfield and Geothermal Chemistry Symposium, Phoenix, Arizona, USA, March 9-11, 1985; Society of Petroleum Engineers. 13574-MS.
Wu, B., Cheng, H., Childs, J.D., and Sabatini, D.A. Surfactant-Enhanced Removal of Hydrophobic Oils from Source Zones, Physicochemical Groundwater Remediation, 2002, Ch11, 245-249.
Zaitoun, A., Fonseca, C., Berger, P., Bazin, B., and Monin, N. 2003. New Surfactant for Chemical Flood in High-Salinity Reservoir. Paper SPE 80237, presented at the International Symposium on Oilfield Chemistry Houston, Texas, 5-7 February.

65
BIBLIOGRAPHY
Dinger, T.A. Experimental Evaluation on the Effect of Iron Ions on Extended Surfactant Stability at High Total Electrolyte Concentration. Thesis, University of Oklahoma, 2012.
Hsu, T.-P. Improved Oil Recovery by Chemical Flood From High Temperature and High Salinity Reservoirs. Thesis, University of Oklahoma, 2010.
Rojas, M.R.; Raj, A.; Shiau, B.-J.; Harwell, J.H. Development of Novel Extended Surfactant-Polymer Formulations for Enhanced Oil Recovery from High Salinity Reservoirs. Draft.
Shiau, B-J.; Hsu, T-P; Lohateeraparp, P.; Wan, W.; Lin, Z.; Roberts, B.; Harwell, J.H. Improved Oil Recovery by Chemical Flood from High Salinity Reservoirs presented at the SPE Improved Oil Recovery Symposium, Tulsa, Oklahoma, USA, April 14-18, 2012; Society of Petroleum Engineers. SPE 154260-pp.
66
LIST OF ACRONYMS AND ABBREVIATIONS
BBO – billion barrels of oil
B/D – barrels per day
Cc – characteristic curvature
EO – ethylene oxide
EOR – enhanced oil recovery
HLD – hydrophilic-lipophilic difference
IFT – interfacial tension
OOIP – original oil in place
PO – propylene oxide
PV – pore volume
ROR – residual oil saturation
SP – surfactant/polymer
SWTT – single well tracer test
TDS – total dissolved solids

67
Appendix – Analysis Results for Reservoir Brine and Crude Oil Samples
Table A-1. Ion analysis results for reservoir brine samples Reservoir Calcium Iron Magnesium Potassium Sodium Sulfate
M 8422 149 1775 -- 42,800 -- F 7935 4.31 198 -- 48,785 --
S-F 6863 <2 1679 332 43,490 -- W-P 9790 <2 2410 955 80,520 -- A-B 8133 <2 1780 330 52,260 --
LMJ 9910 4.85 663.5 2352 59,750 1.76 L 8008 38.25 2051 587 43,290 2.14
SEH 5855 17.77 1429 161.3 21,790 3.29
Table A-2. Analysis results for reservoir brine samples
Reservoir TDS, wt. %
Density, g/mL
Conductivity, mS
Oxygen Reduction Potential,
mV
Dissolved Oxygen,
ppm
M 18 1.125 -- -- -- F 13 1.1 -- -- --
S-F 18 1.1 -- -- -- W-P 26 1.13 -- -- -- A-B 18.1 1.1 -- -- --
LMJ 20 -- -- -- -- L 16.4 1.16 160 132 1
SEH 10 1.1 111.4 136 1
Table A-3. Analysis results for reservoir crude oil samples
Reservoir Viscosity, cP
Density, g/mL
API gravity EACN TAN,
mg KOH/g M 5 0.87 31 11.0 0.398 F 7 0.9 26 11.3 --
S-F 3.9 0.82 41 8.5 0.20 W-P 4 0.82 41 9.8 0.10 A-B 3.7 0.81 43 7.2 0.56
LMJ -- 0.857 33.7 9.2 0.26 L 9 0.845 36 10.2 0.26
SEH 25 0.896 26 11.3 0.98 Note: -- is used to indicate tests results that were not available by the end of the project period.