next generation of employment services: appendices · web viewpeak bodies and industry...
TRANSCRIPT

Next generation of employment services: appendices
ContentsAppendix A: Short history of employment services...............................................................................3
Appendix B: A guide to jobactive...........................................................................................................4
Appendix C: Summary of complementary programs.............................................................................8
Appendix D: Common misconceptions of employment services.........................................................14
Appendix E: jobactive caseload data...................................................................................................16
Appendix F: Performance of jobactive (1 July 2015 to 31 May 2018)..................................................19
Appendix G – Labour Market data and information............................................................................27
Appendix H: International employment services.................................................................................37
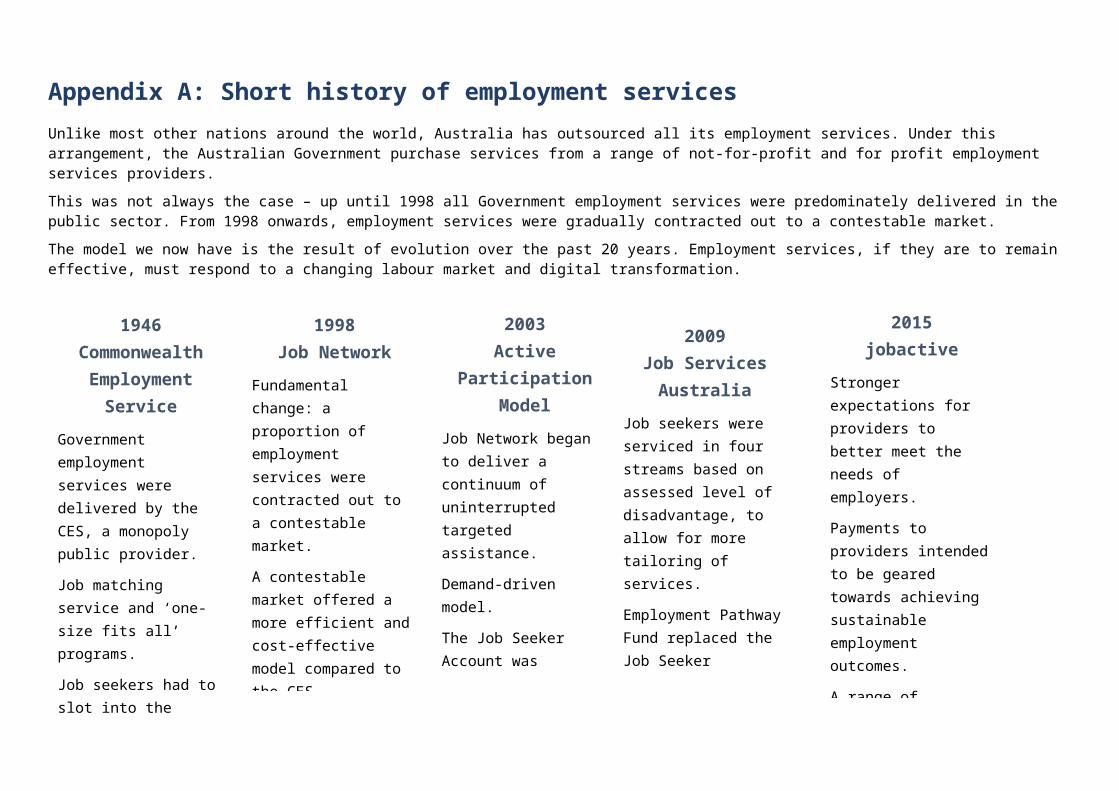
Appendix A: Short history of employment servicesUnlike most other nations around the world, Australia has outsourced all its employment services. Under this arrangement, the Australian Government purchase services from a range of not-for-profit and for profit employment services providers.
This was not always the case – up until 1998 all Government employment services were predominately delivered in the public sector. From 1998 onwards, employment services were gradually contracted out to a contestable market.
The model we now have is the result of evolution over the past 20 years. Employment services, if they are to remain effective, must respond to a changing labour market and digital transformation.
1946Commonwealth
Employment Service
Government employment services were delivered by the CES, a monopoly public provider.
Job matching service and ‘one-size fits all’ programs.
Job seekers had to slot into the programs and not the other way round.
The CES was considered unresponsive, inefficient and costly.
1998Job Network
Fundamental change: a proportion of employment services were contracted out to a contestable market.
A contestable market offered a more efficient and cost-effective model compared to the CES.
Tentative moves to services based on individual needs e.g. intensive assistance for the most disadvantaged.
2003Active Participation
Model
Job Network began to deliver a continuum of uninterrupted targeted assistance.
Demand-driven model.
The Job Seeker Account was introduced to assist with individual needs, e.g. training, work equipment, wage subsidies, etc.
2009Job Services Australia
Job seekers were serviced in four streams based on assessed level of disadvantage, to allow for more tailoring of services.
Employment Pathway Fund replaced the Job Seeker Account, providing funding to help job seekers with a range of specific needs.
2015jobactive
Stronger expectations for providers to better meet the needs of employers.
Payments to providers intended to be geared towards achieving sustainable employment outcomes.
A range of subsidies to assist employers to recruit and train job seekers.
Stronger emphasis on job seekers finding work and moving off welfare quickly.
Appendix B:A guide to jobactiveWhat is jobactive?
A network of non-government providers contracted by the Australian Government to deliver employment services to Australians.
Government funds employment services providers to help job seekers find work by:
o connecting them with job opportunitieso providing career and job search coaching o directing job seekers to activities that will increase their chance of finding worko investing in the job seeker to help them overcome the barriers they face o offering employers wage subsidies to hire them, ando offering a free recruitment service to employers.
Providers principally deliver services to people in receipt of income support to place them into work. People who don’t receive income support can also access employment services on a voluntary basis.
jobactive providers receive payments for successfully connecting job seekers with employment, on behalf of the Government.
Additionally, providers fulfil a compliance monitoring role to make sure people in receipt of income support comply with their mutual obligation requirements (below).
The jobactive service is free for job seekers and for employers seeking assistance of providers to fill vacancies.
All jobactive providers have access to the Employment Fund which can be used to pay for training or other assistance to help participants gain and keep employment. The Employment Fund focuses on work-related items, training and support that meet the needs of participants and employers.
Employment services were privatised under a contestable market model in 1998, initially through the Job Network and, since 2015, through jobactive. This model replaced the former Commonwealth Employment Services established in 1946 as the monopoly public provider.
The current arrangement can be described as a quasi-market model as the Government determines the price and mix of services that employment providers will deliver. This is designed to deliver sustainable and equitable employment service markets.
The Government regulates the number of providers that will operate in each employment region. Providers are selected through a competitive process and compete to service job seekers. Job seekers on welfare must use a jobactive provider but can choose the provider when registering for employment services.
The Government monitors providers’ performance (see ‘Star Ratings’ below) and may reallocate some of their market share to their competitors if their performance is poor.
Mutual obligation requirements
People in receipt of income support are required to demonstrate that they are actively looking for work and undertaking activities to improve their employment prospects.
People must look for, and be prepared to accept, work in a variety of fields, not just work that they prefer or are qualified to do.
Most people are required to apply for 20 jobs per month and report these to their jobactive provider. This is in addition to completing the other activities in their Job Plan.
The jobactive network
The network is made up of 42 jobactive employment services providers in over 1,700 locations across the country.
Providers are contracted to deliver services from one or more sites in an employment region.
There are currently 51 employment regions, with a range of between one and seven providers in each region.
The jobactive contract
jobactive commenced on 1 July 2015 and is scheduled to expire on 30 June 2020 (with re-arranged transition period built into the end of the contract).
The Australian Government has allocated $6.7 billion of funding for jobactive over five years (2015-2020).
jobactive is an uncapped demand driven service, which means that there is no limit to the number of job seekers who can be referred to it, or the number of outcomes providers can earn for placing people in employment.
How do jobactive providers get paid?
Providers receive two main types of payment to deliver employment services: administration fees and outcome payments.
These prices are fixed and are designed to incentivise providers to place the full range of job seekers into sustainable employment.
All payments recognise the additional costs in delivering services in regional areas through the application of a 25 per cent regional loading.
Outcome Payments are paid to providers when a job seeker has been placed in employment for a period of four, 12 and 26 weeks.
Payment rates are structured to reflect a job seekers’ stream and length of unemployment, with higher fees paid for placing job seekers with higher levels of disadvantage.
Job seeker streams
In connecting a job seeker to employment services, the Department of Human Services assesses the job seeker’s level of disadvantage using the Job Seeker Classification Instrument (JSCI) to help determine the type and level of assistance required.
The JSCI is comprised of up to 49 questions. Generally, a job seeker who has a higher level of disadvantage will answer more questions. Based on their responses, job seekers are placed into one of three Streams (A, B or C).
Stream A job seekers (approx. 39.2 per cent of job seekers) are the most job-ready. They will receive services to help them understand what employers want and how to navigate the local labour market, build a résumé, look for jobs and learn how to access self-help facilities.
Stream B job seekers (approx. 42.9 per cent of job seekers) need their jobactive provider to play a greater role to help them become job-ready and will be referred for case management support.
Stream C job seekers (approx. 16.4 per cent of job seekers) have a combination of work capacity and personal issues that need to be addressed so that they can take up and keep a job.
Work for the Dole
Job seekers in receipt of income support who have not found a job within 12 months of commencing with jobactive will generally start in Work for the Dole, or another approved activity, depending on their capacity.
Work for the Dole engages these job seekers in activities where they can gain skills and experience that give back to the community and can help them find a job. To keep receiving income support, job seekers must participate in Work for the Dole if they are in jobactive and have mutual obligation requirements.
Provider Performance – Star Ratings
Star Ratings assess the performance of jobactive providers to all users, while also accounting for differences in job seeker and labour market characteristics.
This means that a provider that achieved 5-stars is achieving significantly higher levels of expected outcomes for their job seekers in their labour market across the four aspects (see below) than a provider that achieved 1-star.
Providers are rewarded the highest scores (4-5 stars) for achieving:
o sustained (26 Week) employment outcomes for all job seekerso sustained employment outcomes for Indigenous job seekerso the active engagement of job seekers, including participation in Work for the Dole, ando achieving outcomes for the most disadvantaged job seekers in Streams B and C which
contribute 75 per cent towards the overall rating.
Star Ratings are publically available for individual provider sites. Of the 1688 sites across Australia which have a Star Rating (as at March 2018):
o 23 per cent are 5-staro 13 per cent are 4-star o 29 per cent are 3-staro 20 per cent are 2-star, and
o 15 per cent are 1-star.
(Note: there are 1716 Sites in Australia, 28 are new, and do not yet have a Star Rating).
Provider performance – workforce turnover rates
The National Employment Services Association (NESA) reports that employment services providers have a highly transient workforce. Nearly 70 per cent of providers have a turnover rate of above 30 per cent, with:
o 42.1 per cent of providers having an annual turnover rate of 40 per cent and over, ando 26.3 per cent having an annual turnover rate of between 30 to 40 per cent.
The average annual rate of turnover for employment services providers is 41.9 per cent.1 This average turnover rate is more than double the economy-wide average of 15.7 per cent.2
Appendix C:Summary of complementary programs The Department of Jobs and Small Business (the department) currently delivers the following complementary programs to help job seekers on their pathway to employment.
Career Transition Assistance
The Career Transition Assistance program, announced in the 2017–18 Budget, will provide older Australians with a voluntary short, intensive course consisting of skills assessments, exploration of suitable occupations, resilience strategies and digital skills.
A trial in five regions (Ballarat, VIC; Somerset, QLD; Central West, NSW; Adelaide South, SA; and Perth North, WA) to inform the program was already scheduled to start in July 2018. In response to positive community and stakeholder feedback, the Government has decided to bring forward the program’s national rollout by one year, to start from 1 July 2019.
Eligibility for the program will be extended to individuals registered with jobactive and aged 45 to 49 years old, beyond the current age bracket of 50 years and over. This will enable a much larger number of older Australians to benefit from targeted career transition assistance to extend their working lives and future job opportunities.
Empowering YOUth Initiatives
The Empowering YOUth Initiatives (EYI) assists vulnerable young people aged 15-24 who are long-term unemployed, or at risk of long-term unemployment, into employment or onto the pathway to employment. The program provides grants for a range of organisations to deliver new or different approaches that may help young people at any stage of their transition to employment.
The objectives for EYI are to:
identify innovative approaches that have the greatest potential to improve employment outcomes for young people at risk of long-term unemployment, and prevent long-term welfare dependency
promote learnings from EYI to enhance current and future youth services, and help more young people at risk of long-term unemployment to find and keep a job.
Contracting
EYI has funded 39 projects across Australia. Initiatives range from developing a gamification app, mobile careers information, working in a social enterprise, or getting hands on building skills on a practical training site (among other initiatives).
Harvest Labour Service and the National Harvest Labour Information Service
The Harvest Labour Service (HLS) was introduced in 1998 to address horticultural industry labour shortages. The department has contracted five organisations from 1 July 2015 until
June 2020 to deliver 20,750 places per annum through 15 sites across 11 areas. There is at least one harvest area in all states and territories, except for Tasmania and the ACT.
HLS aims to:
meet growers’ demand for harvest labour mobilise people outside a harvest area to help meet demand for labour, and connect people looking for harvest work, including job seekers on income support, with
harvest employers looking for employees.
The program also provides information regarding harvest-related work opportunities across Australia via its National Harvest Labour Information Service. Information on the National Harvest Labour Information Service (NHLIS): https://jobsearch.gov.au/harvest
Launch into Work
The Launch into Work program trials pre-employment projects that provide training, work experience and mentoring to support job seekers to increase their skills, experience and confidence. Projects are intended to train job seekers for specific roles within the organisation, and may be conducted in a variety of industries. Launch into Work projects support participants to:
move from welfare into paid work build the skills and experience required to overcome individual barriers to employment develop increased confidence and self-worth associated with engaging in meaningful work,
and gain the opportunity to have a career and plan for the future.
The following entity types may be eligible to apply:
Employers, including for profit, not-for-profit and state and local governments or councils. Peak bodies and industry associations can facilitate or lead a project, but must have
committed employers with job vacancies that are willing to participate in the co-design process and project delivery. The contracted organisation is responsible for the contract deliverables and outcomes.
Job seekers on the jobactive, Transition to Work and ParentsNext caseloads are eligible to participate.
National Work Experience Programme
The National Work Experience Programme places job seekers in work experience placements to gain experience and confidence, while demonstrating skills to potential employers. The program offers work experience and employment opportunities for job seekers by providing unpaid placements with businesses for up to four weeks, to a maximum of 25 hours per week. Businesses who offer participants ongoing employment after the placement may be eligible for a wage subsidy.
New Enterprise Incentive Scheme
The New Enterprise Incentive Scheme (NEIS) was established in 1985 to help eligible people start a business. There are 90 NEIS contracts across 51 employment regions that run from 1 July 2015 until June 2020.
NEIS provides:
accredited small business training personalised mentoring and support to help put business ideas into practice, and income support for up to 39 weeks and rental assistance for up to 26 weeks (if eligible).
Eligibility for NEIS has broadened to allow people who are not in employment, education or training – and people who are not in receipt of income support – to access the scheme (eligibility permitting).
Contracting
NEIS is delivered by a network of 21 providers nationally. A total of 8,600 NEIS places are available each financial year.
ParentsNext
ParentsNext is a pre-employment program which connects parents of young children to services in their local community to help them plan and prepare for employment. ParentsNext providers work with parents to help them to identify their education and employment goals, develop a pathway to achieve their goals and link them to activities and services in the local community. Parents may be eligible for ParentsNext if:
their youngest child is aged five years or under they have not had paid employment in the last six months, and they reside in a location where ParentsNext is being delivered.
Participation in ParentsNext may be compulsory as a condition of receiving welfare. Other parents may seek to voluntarily participate in the program if they meet the eligibility criteria.
Contracting
ParentsNext commenced on 4 April 2016 with 31 projects established across 10 Local Government Areas that are delivered by 25 contracted service providers. ParentsNext will be rolled out nationally to an additional 20 locations from 1 July 2018.
Structural Adjustment Programs and Stronger Transitions
The department provides labour market structural adjustment programs , on a case-by-case basis in exceptional circumstances to assist retrenched workers to find new employment quickly. These programs have been set up in response to large scale retrenchments and to provide retrenched workers with tailored assistance and access to intensive employment services.

Structural adjustment programs are currently or have recently been in place for workers in the automotive manufacturing industry, and workers who have lost their job from Queensland Nickel in North Queensland, BlueScope Steel in the Illawarra, Caterpillar Underground mining in North-West Tasmania, Arrium in Whyalla, Hazelwood mine and power station in the Latrobe Valley and Alinta Energy in South Australia.
Stronger Transitions
As part of lessons learnt from the structural adjustment program, the Government’s Stronger Transitions package of assistance from 1 July 2018 will provide immediate access to employment services for retrenched workers in Adelaide, Mandurah, North Queensland, North/North-West Tasmania and Melbourne North/West to the, including access to intensive, personalised support and comprehensive skills assessments.
From 1 July 2019, retrenched workers and their partners across Australia will receive immediate access to employment services before they become eligible for income support. This support will need to be incorporated into the new approach for delivering employment services in 2020.
Support for the transition of retrenched workers into future jobs
As part of the Government’s efforts to support workers to manage change, the Stronger Transitions package of assistance will help put retrenched workers on the pathway to finding new jobs and taking advantage of labour market opportunities across Australia.
The Government is partnering with business to help retrenched workers move into new employment. Services for workers may include career advice, training and recognition of prior learning, skills assessment, access to language, literacy and numeracy, resilience training, digital literacy and online job search support and resume writing. This support will be available from 1 July 2018, across Adelaide, Mandurah, North Queensland, North/North-West Tasmania and Melbourne North/West. The support will cease on 30 June 2020.
These retrenched workers in addition have immediate access to the Government’s Relocation Assistance To Take Up a Job Programme to better connect them to employment opportunities in other regions. They can also pursue small business opportunities through access to the New Enterprise Incentive Scheme three months prior to retrenchment.
More information on Stronger Transitions is at https://www.jobs.gov.au/stronger-transitions
Time to Work
The Time to Work Employment Service will assist Aboriginal and Torres Strait Islander prisoners to find employment and reintegrate into the community upon their release.
As part of the service, Aboriginal and Torres Strait Islander prisoners will receive:
a comprehensive assessment to identify any employability needs or barriers they might face
help to develop a transition plan that incorporates activities addressing and acknowledging these barriers, and
a facilitated transfer to an employment services provider, who will help them to find work once they leave prison.
To participate in the Time to Work, a prisoner must be:
a self-identifying Aboriginal or Torres Strait Islander over 18 years old, and sentenced and within three months of their release from prison.
Participation in the service is voluntary.
Transition to Work
Transition to Work (TtW) is for young people aged 15 to 21 years. The service targets early school leavers and young people who are experiencing difficulty transitioning from education to employment and who are at risk of long-term welfare dependency. It is also for young Aboriginal or Torres Strait Islander people who have been awarded a Year 12 certificate or Certificate III or higher.
TtW focuses on practical support and work experience to build skills, confidence and readiness for employment.
Young people receive intensive, pre-employment support to improve their work readiness and help them into work or education, including apprenticeships or traineeships.
Employers receive help to recruit young employees who meet their business needs, including a youth bonus wage subsidy of up to $10,000 over six months to help employers take on eligible new starters, and cover costs such as hiring or training expenses.
TtW providers have experience working with disengaged and disadvantaged young people, and strong links with employers, community services and schools in their local community.
Contracting
Only one TtW provider delivers services in a location within an Employment Region. There may be multiple TtW providers in an Employment Region.
Providers are allocated annual funded places receiving upfront payments per place, reflecting the number of participants they are expected to service. Providers are also eligible to receive
outcome payments if participants achieve employment or education outcomes, and will attract bonus outcome payments when they achieve a quarterly outcome benchmark.
Work for the Dole
Work for the Dole is a work experience program which places job seekers in work-like activities where they can gain skills, experience and confidence to move from welfare to work, while giving back to their community.
Work for the Dole activities can be hosted by not-for-profit organisations and government agencies. The program gives organisations an extra set of hands to help to undertake activities that would not normally be done. jobactive providers work with host organisations to identify suitable activities.
A job seeker’s jobactive provider will let them know when they need to take part in Work for the Dole. Job seekers who have mutual obligation requirements must participate in Work for the Dole or another approved activity for six months of each year after their first year on payment to keep receiving their income support. There are different hourly requirements based on a job seeker’s age, caring responsibilities and work capacity. Job seekers who do not have mutual obligation requirements can volunteer to participate in Work for the Dole.
Job seekers on income support who are participating in Work for the Dole can receive an income support supplement of $20.80 per fortnight.
Youth Jobs PaTH
Youth Jobs PaTH supports young people (aged 15-24 years) to gain employability skills and work experience. It supports employers to host internship placements and provides them with incentives when they take on a young person.
There are three elements of Youth Jobs PaTH—Prepare, Trial and Hire:
Prepare — employability skills training helps young people understand the expectations of employers in the recruitment process and in the workplace.
Trial — gives young people a chance to demonstrate their skills to businesses through an internship.
Hire — supports employers with the costs of recruitment through a wage subsidy up to $10,000.
Under PaTH, employment services providers check prospective businesses meets eligibility requirements to host an internship before a PaTH Internship Agreement is created. An eligible business must:
have a valid ABN have a reasonable prospect of employment, which means that the business:
o has a current vacancyo will likely have a vacancy following the internship, or

o has a regular pattern of recruitment for a position aligned with the participant’s interests, experience and qualifications.
Appendix D:Common misconceptions of employment services
Misconception Reality
jobactive should create jobs.
jobactive does not include public works programs or job creation packages. The Australian labour market experiences between four and five million job movements into and out of work every year, jobactive facilitates approximately six to eight per cent of those movements. jobactive aims to help job seekers find work by:
connecting them with job opportunities providing career and job search coaching directing them to activities that increase their chance of finding work assisting them to overcome personal barriers they face offering employers wage subsidies to hire them, and offering a free recruitment service to employers.
All job seekers in jobactive are unemployed.
Many job seekers in jobactive currently work part-time or casual jobs, but not enough to remove them from income support. Around 30 per cent of job seekers in jobactive declare income in any fortnight (likely working). Departmental interviews with job seekers suggest many job seekers opt to supplement their income support by working one (or more) part-time jobs. Many job seekers expressed concern at the difficulty of securing full-time work.
jobactive is for everyone who wants a job.
jobactive vacancies are freely listed online and any job seeker can enter jobactive as a volunteer. However around 99 per cent of job seekers in jobactive are income support recipients. While jobactive welcomes all job seekers, resources are usually targeted towards those who face multiple or complex barriers to work.
jobactive does not get many people jobs.
jobactive places roughly 1,100 job seekers per day into employment. Since its inception in July 2015, jobactive has placed over 1,000,000 people into work, with over 280,000 people remaining in work for longer than 26 weeks.
Disadvantaged job seekers do not find work in jobactive.
While many job seekers have complex barriers to employment, they are not unemployable. Since July 2015, over 135,000 Stream C job seekers (the highly disadvantaged) have been placed in a job.
Job seekers are unmotivated to find work.
Departmental and other research indicates that the majority of job seekers want to find work. The stigma of unemployment often compounds their difficulties when pursuing work. Many job seekers report they are eager to work but feel trapped by lack of experience, work ethic misconception or a chequered work history.
Misconception Reality
Job seekers get the dole without having to do anything in return.
People in receipt of income support are required to demonstrate that they are actively looking for work or are undertaking activities to improve their employment prospects. Most people are required to apply for 20 jobs per month and report these to their jobactive provider. This is in addition to completing the other activities (e.g. training) in their Job Plan. After 12 months in jobactive, job seekers are required to participate in an intensive activity. Those not working will generally start in training or Work for the Dole, or another approved activity depending on their circumstances.
Work for the Dole does not get anyone a job.
Departmental data shows that 28.4 per cent of job seekers were either part-time or full-time employed three months after participating in Work for the Dole. Comparatively, of the job seekers who undertook vocational training 36.2 per cent were employed three months later.
The unemployed get immediate access to the dole.
The unemployed do not get immediate access to welfare. Eligibility for payments is targeted through means testing, ensuring that assistance is directed to those with the greatest need. Job seekers who do not meet the means test may receive a partial payment or no payment at all. Recipients who are deemed to have the capacity to work are required to actively seek it.
Job seekers struggle to meet their participation requirements.
While there are job seekers who do not meet their participation requirements, almost all aim to meet them. Half of all reports for compliance failures confirmed by the Department of Human Services relate to less than two per cent of job seekers. Persistent non-compliance results in a range of penalties, for example losing income support payments for up to eight weeks.
jobactive providers performance is not monitored.
The department monitors all employment service providers’ performance. Through a system of star ratings, the department monitors high performers (5 star) for best practice and poorer performers (1-2 stars) for service reduction. Following a departmental review, underperforming sites (under 3 stars) can have their business share reduced or in extreme cases their contract terminated.
jobactive providers get paid even if a job seeker does not get a job.
Providers receive two main types of payment to deliver services, administration fees (which on their own are not designed to cover the cost of operating an employment services business) and outcome payments. Outcome payments are paid after a job seeker secures employment and are structured to reflect a job seekers’ length of unemployment, with higher fees payable for placing job seekers of higher disadvantage. Outcome payments form the majority of fees paid to providers.
Providers put forward candidates that are not a good fit for the role.
The current payment model pays providers more for placing disadvantaged job seekers. This gives a financial incentive to providers to send employers more disadvantaged job seekers. There is a risk this may lead some employers to conclude that jobactive providers do not always supply candidates that are the right fit to fill their vacancies.

Appendix E:jobactive caseload data3
Between 1 July 2015 and May 2018, over 2.0 million unique job seekers have utilised jobactive, with 673,780 people on the caseload as at 31 May 2018.
jobactive is delivered across Australia, with 35.2 per cent of the caseload located outside capital cities.
Key statistics as at 31 May 2018
Employment services cater for a diverse range of job seekers with differing needs. For example, 27.1 per cent (or 182,760) of job seekers identify as having a disability, 10.9 per cent (73,400) are Indigenous and 8.3 per cent (55,750) disclose having challenges with drugs and alcohol (see figure E.1). Over 186,000 job seekers (or 27.6 per cent) on the caseload are aged 50 years or over, while 126,170 (18.7 per cent) are young people (24 years and under).
Figure E.1: Current caseload by selected cohorts, 31 May 2018
Pre Release Prisoner
Refugees
Drug and Alcohol
Homeless
Indigenous
Ex-Offenders
Stronger Participation Incentive
Mental Health
Parents
Culturally and Linguistically Diverse
People with Disability
0 5 10 15 20 25 30
<1%
5.3%
8.3%
9.7%
10.9%
11.3%
11.9%
13.1%
17.5%
19.1%
27.1%
Job seekers can be recorded against multiple cohorts. For example, a job seeker can be both indigenous and a parent.
Current caseload673,780 Stream A39.2% Stream B42.9% Stream C16.4%
Female51.1% Regional35.2%

Figure E.2: Age composition of caseload
18.7% 11.1% 20.5% 22.0% 16.9% 10.7%
Under 24 years 25 - 29 years 30 - 39 years 40 - 49 years 50 - 59 years 60 years and over
Duration of unemployment4
Duration of unemployment refers to the length of time a job seeker has been registered for employment services5. As at 31 May 2018, almost two thirds of the caseload were long-term unemployed (LTU), that is, registered for at least 12 months. Around one in five job seekers have been on the caseload for over five years (see figure E.3).
Figure E.3: Caseload by duration of unemployment
35.1% 19.7% 26.1% 19.1%
Under 12 months 12 - 23 mths 24 - 59 mths 60 months or more
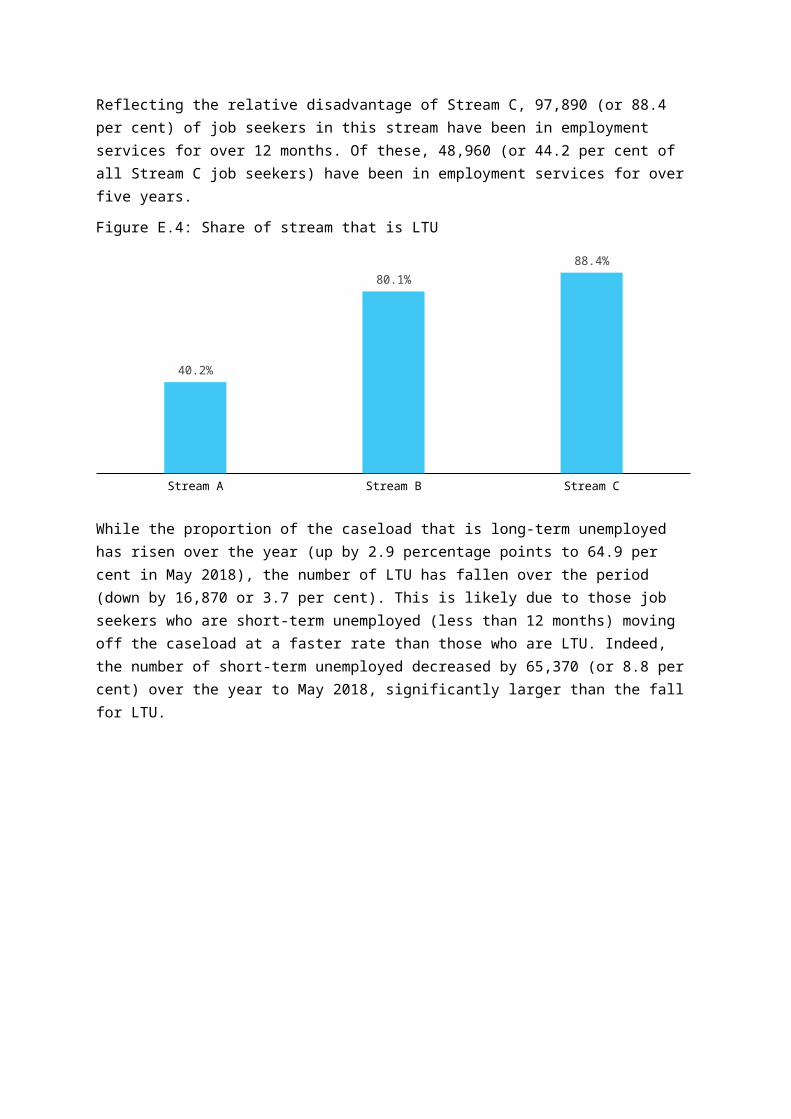
Reflecting the relative disadvantage of Stream C, 97,890 (or 88.4 per cent) of job seekers in this stream have been in employment services for over 12 months. Of these, 48,960 (or 44.2 per cent of all Stream C job seekers) have been in employment services for over five years.
Figure E.4: Share of stream that is LTU
Stream A Stream B Stream C
40.2%
80.1%88.4%
While the proportion of the caseload that is long-term unemployed has risen over the year (up by 2.9 percentage points to 64.9 per cent in May 2018), the number of LTU has fallen over the period (down by 16,870 or 3.7 per cent). This is likely due to those job seekers who are short-term unemployed (less than 12 months) moving off the caseload at a faster rate than those who are LTU. Indeed, the number of short-term unemployed decreased by 65,370 (or 8.8 per cent) over the year to May 2018, significantly larger than the fall for LTU.

Figure E.5: Number of long-term unemployed and share of the caseload, July 2015 to May 2018
7/1/
2015
9/1/
2015
11/1
/201
5
1/1/
2016
3/1/
2016
5/1/
2016
7/1/
2016
9/1/
2016
11/1
/201
6
1/1/
2017
3/1/
2017
5/1/
2017
7/1/
2017
9/1/
2017
11/1
/201
7
1/1/
2018
3/1/
2018
5/1/
2018
56.0%
57.0%
58.0%
59.0%
60.0%
61.0%
62.0%
63.0%
64.0%
65.0%
66.0%
300,000
320,000
340,000
360,000
380,000
400,000
420,000
440,000
460,000
480,000
500,000 LTU Caseload (LHS) LTU % of Total Caseload (RHS)
It is important to note that a person can be working part-time or casually while in receipt of income support. This means that a person on the caseload can be counted as LTU despite having some employment. To illustrate, in 2016-17, an average of 29.6 per cent of people on the caseload declared earnings. The propensity to have declared earnings falls as duration on the caseload increases.
Figure E.6: Proportion of the jobactive caseload with declared earnings, by duration (average for 2016-17)
Under 12 months 12 to 23 months 24 to 59 months 60 months or more Average0%
5%
10%
15%
20%
25%
30%
35% 33.2%30.4%
28.3%
23.1%
29.6%
Duration on caseload
Aver
age
prop
ortio
n (%
) of t
he c
asel
oad
decl
arin
g ea
rnin
gs
Characteristics of the extremely long-term unemployed on the jobactive caseload
Around 129,000 (or 19.1 per cent) of the caseload were extremely long-term unemployment (a duration of 60 months or more), up from 112,180 (or 14.4 per cent of the caseload) in 31 May 2016. Of these:
27.2 per cent are aged between 40 and 49 years 53.4 per cent are female 52.9 per cent have a disability 28,810 have been in employment services for 10 years or more.

Appendix F:Performance of jobactive(1 July 2015 to 31 May 2018)
Summary of job placements and outcomes (total)
A key component of jobactive is placing job seekers into employment. When a job seeker finds a job whether on their own or with assistance from their provider, that job is called a ‘job placement’.
Outcomes are payable to jobactive providers 4, 12 and 26 weeks after an individual is placed into employment, unsubsidised self-employment or an apprenticeship or traineeship. There are two types of employment outcomes, full and partial.
A full outcome is achieved when an individual earns enough to move them fully off income support for the outcome period. For individuals with a partial work capacity or who are principal carer parents, their reduced working capacity is taken into account.
A partial outcome is achieved when an individual earns enough to reduce their income support by at least 60 per cent (on average) over the outcome period, and is only available for 4 and 12 week outcome payments. For individuals with a partial work capacity or who are principal carer parents, their reduced working capacity is taken into account.
Table F.1: Outcomes by type, 1 July 2015 to 31 May 2018
Outcome Partial outcome(share of total)
Full outcome(share of total)
Total outcomes
4 Week 121,930(22.1%)
430,890(77.9%)
552,820
12 Week 161,030(34.7%)
302,920(65.3%)
463,950
26 Week N/A 289,740(100%)
289,740
Job Placements 1,054,360
Placements per Calendar Day1,095
4-week Outcomes552,820
12-week Outcomes463,950
26-week Outcomes289,740
In 2016-17, around 5% of employers used a jobactive provider.
Of these, 80% stated that they were satisfied with the service they received.
Job Placements and outcomes by stream
Over half of job placements have been for Stream A job seekers, with 45.1 per cent still in employment 26 weeks after their placement.
Table F.2: Placements and outcomes by stream, 1 July 2015 to 31 May 2018
Stream Job placements(share of total)
4-week outcomes(share of total)
12-week outcomes(share of total)
26-week outcomes(share of total)
Stream A Volunteer 6,510 0.6% 1,320 0.2% 1,140 0.2% 620 0.2%Stream A 595,340 56.5% 307,890 55.7% 265,880 57.3% 177,270 61.2%Stream B 317,110 30.1% 176,070 31.8% 143,580 30.9% 82,530 28.5%Stream C 135,370 12.8% 67,550 12.2% 53,360 11.5% 29,310 10.1%Grand Total 1,054,360 552,820 463,950 289,740
Job Placements and outcomes by duration of unemployment
Between 1 July 2015 and 31 May 2018, 546,660 of job placements were for LTU, accounting for 51.8 per cent of all job placements. Of these 93,930 (or 8.9 per cent of all placements) were for those considered to be ELTU.
Figure F.1: Outcomes by duration of unemployment, 1 July 2015 to 31 May 2018
Under 12 months 12 to 23 months 24 to 59 months 60 months or more0
100,000
200,000
300,000
400,000
500,000
600,000
507,700
219,860 232,870
93,930
256,620
125,180 125,440
45,590
222,410
104,680 101,760
35,100
149,530
64,460 58,170
17,570
Placements 4-Week Outcomes 12-Week Outcomes 26-Week Outcomes
Placements and outcomes by selected cohorts
jobactive is helping more disadvantaged job seekers move into employment. For example, between 1 July 2015 and 31 May 2018, 180,170 placements were for people with a disability. Of these, 43,300 achieved a 26-week outcome (or 14.9 per cent of all 26-week outcomes).

Table F.3: Placements and outcomes by selected cohorts, 1 July 2015 to 31 May 2018
Selected cohort Job Placement
s
4-Week Outcome
s
4-Week Outcome
Rate
12-Week Outcome
s
12-Week Outcome
Rate
26-Week Outcome
s
26-Week Outcome
Rate People with Disability
180,170 96,070 58.5% 77,810 49.6% 43,300 31.3%
Culturally and Linguistically Diverse
170,970 96,550 65.9% 81,910 58.7% 52,930 43.2%
Parents 120,600 73,540 70.0% 62,540 62.9% 37,020 42.2%Mental Health 74,810 40,570 60.9% 32,720 51.8% 17,270 31.6%Ex-Offenders 110,110 49,790 51.5% 39,150 42.4% 22,230 27.1%Indigenous 96,190 47,840 57.3% 37,920 47.9% 21,670 31.0%Homeless 96,840 45,810 52.6% 36,150 43.4% 20,410 27.6%Drug and Alcohol 68,410 31,130 51.0% 24,270 41.6% 13,100 25.3%Refugees 44,050 24,860 64.2% 20,560 56.2% 12,890 40.1%Pre Release Prisoners 680 370 72.7% 285 58.9% 140 32.9%Grand Total 1,054,360 552,820 62.4% 463,950 54.8% 289,740 38.9%
Job seekers can be recorded against multiple cohorts. For example, a job seeker can be both Indigenous and a parent.
Placements and outcomes by industry
The highest number of job placements was in the Other Services industry, with 277,540 placements between 1 July 2015 and 31 May 2018. Other Services is a diverse industry which includes firms providing personal care, funeral and religious services, machinery and automotive repair and maintenance activities. It should be noted, however, that Other Services is a small industry, accounting for around 4 per cent of total employment in Australia. Accordingly, it is unlikely that this industry would have presented 277,540 placement opportunities and it is more likely that this is being used as a ‘catch all’ category. The next two industries with a large number of placements were Accommodation and Food Services and Retail Trade, two industries that present good entry-level opportunities due to the prevalence of lower-skilled jobs.
Job seekers who obtained a job placement in the Financial and Insurance Services industry were more likely to stay in employment, with 56.9 per cent of job placements converting to a 26-week outcome. Conversely, job seekers who were placed in the Agriculture, Forestry and Fishing industry were the least likely to remain in employment, with only 27.1 per cent of job placements converting to a 26 week outcome. However, this may reflect the high incidence of seasonal and short-term work in this industry.
TableF.4: Job Placements and Conversion Rates by Industry 1 July 2015 to 31 May 2018
Employer Industry Total Job Placements
4-Week Outcome
Rate
12-Week Outcome
Rate
26-Week Outcome
Rate
Other Services* 277,540 59.9% 52.5% 37.4%
Accommodation and Food Services 129,660 55.7% 48.7% 31.4%
Retail Trade 102,910 65.0% 58.9% 41.3%
Construction 96,100 55.7% 47.4% 33.3%
Manufacturing 72,160 67.4% 57.8% 41.5%
Health Care and Social Assistance 66,480 74.2% 70.7% 54.4%
Transport, Postal and Warehousing 59,420 62.2% 54.6% 39.3%
Agriculture, Forestry and Fishing 52,750 56.0% 44.1% 27.1%
Administrative and Support Services 44,290 71.5% 63.4% 48.0%
Education and Training 36,120 69.3% 62.3% 44.9%
Professional, Scientific and Technical Services
32,430 65.5% 56.4% 40.8%
Wholesale Trade 16,080 65.8% 56.8% 40.5%
Information Media and Telecommunications 13,680 70.4% 62.8% 48.4%
Arts and Recreation Services 11,030 54.6% 46.8% 32.1%
Mining 9,070 74.2% 66.2% 50.1%
Electricity, Gas, Water and Waste Services 8,960 69.1% 61.1% 45.8%
Financial and Insurance Services 8,680 78.9% 71.8% 56.9%
Rental, Hiring and Real Estate Services 8,590 66.2% 58.0% 42.2%
Public Administration and Safety 8,420 68.2% 61.0% 46.7%
Total 1,054,360 62.4% 54.8% 38.9%
*The high number of placements in Other Services is likely due to this industry being used as a ‘catch all’ category
Placements by employer
Between 1 July 2015 and 31 May 2018, there have been 1,054,360 jobactive job placements, with 1,028,789 of these achieved with 308,855 unique employer ABNs.
A total of 61,771 (or 5.9 per cent) job placements are associated with the top 20 employer ABNs (table below).
Of these top 20 employers, 14 employer ABNs have been identified as labour hire companies. These account for 40,604 job placements, which equates to 65.7 per cent of the total job placements of the top 20 employers and 3.9 per cent of total jobactive job placements.

Table F.5: Top 20 Employers ABNs (placements of job seekers)
Company Job Placements
Woolworths 8,797
Coles Supermarkets Australia 6,303
Programmed Skilled Workforce* 5,302
Hays Specialist Recruitment (Australia)* 4,808
Chandler Macleod Group* 4,356
Randstad* 4,156
Labour Solutions Australia* 3,016
Manpower Services (Australia)* 2,883
WorkPac* 2,383
AWX Group* 2,264
Toll Personnel* 2,080
Labourpower Recruitment Services* 2,045
Tailored Workforce* 1,971
Programmed Integrated Workforce* 1,919
Australia Personnel Global* 1,845
Department of Education 1,594
Workforce Recruitment and Labour Services* 1,576
Australian Bureau of Statistics 1,529
Bunnings 1,502
ISS Facility Services Australia 1,442
*Labour Hire Company
Time to Exit6
A measure of the efficiency of jobactive services is the time it takes for job seekers to exit after commencing. Figure F.2 below shows the cumulative rate of exit from jobactive (up to 30 April 2018) for the job seekers who commenced between 1 October 2015 and 30 October 2017.7 Around 60 per cent of job seekers exit jobactive within 12 months of commencement. As expected, the less disadvantaged job seekers in Stream A achieve the highest exit rates relative to the other streams.
There are distinct patterns evident for the different streams. For Stream A, around 25 per cent exit within the first three months and a further 25 per cent exit following three months, with the exit rate diminishing from that point onwards. This differs somewhat to Streams B and C where the lower exit rates achieved early on are generally maintained for a longer period. These distinct patterns may suggest differing servicing models are required for job seekers with varying times in assistance and different levels of labour market disadvantage.

Figure F.2: Exit rates from jobactive by fortnight, April 2018
0 3 6 9 12 15 18 21 24 27 30 33 36 39 42 45 48 51 54 57 60 63 660
10
20
30
40
50
60
70
80
90
100
All
Stream A
Stream B
Stream C
Fortnights from commencement
Exit
rate
s (%
)
Post-Program Monitoring Survey data
The department measures whether job seekers have moved into employment following assistance in jobactive through the Post-Program Monitoring (PPM) Streams Survey. The department surveys a sample of job seekers three months after they have taken part in jobactive.
The data captured through the PPM surveys provides an additional source of information that is not available from the department’s administrative data, such as:
the employment and education status of job seekers who have exited or are still in employment services;
the employment status of job seekers who did not achieve a paid employment outcome but who were otherwise employed (such as part-time employment);
whether the job seeker is actively searching for work; and whether they were satisfied with the services they received.
Employment outcomes
The data presented here relates to job seekers who participated in jobactive between January 2017 and December 2017, with their employment status measured around three months later.
Figure F.3 shows that 49.5 per cent of all job seekers who participated in jobactive between January 2017 and December 2017 were employed three months later. Since the commencement of jobactive in July 2015, employment outcomes have steadily increased.
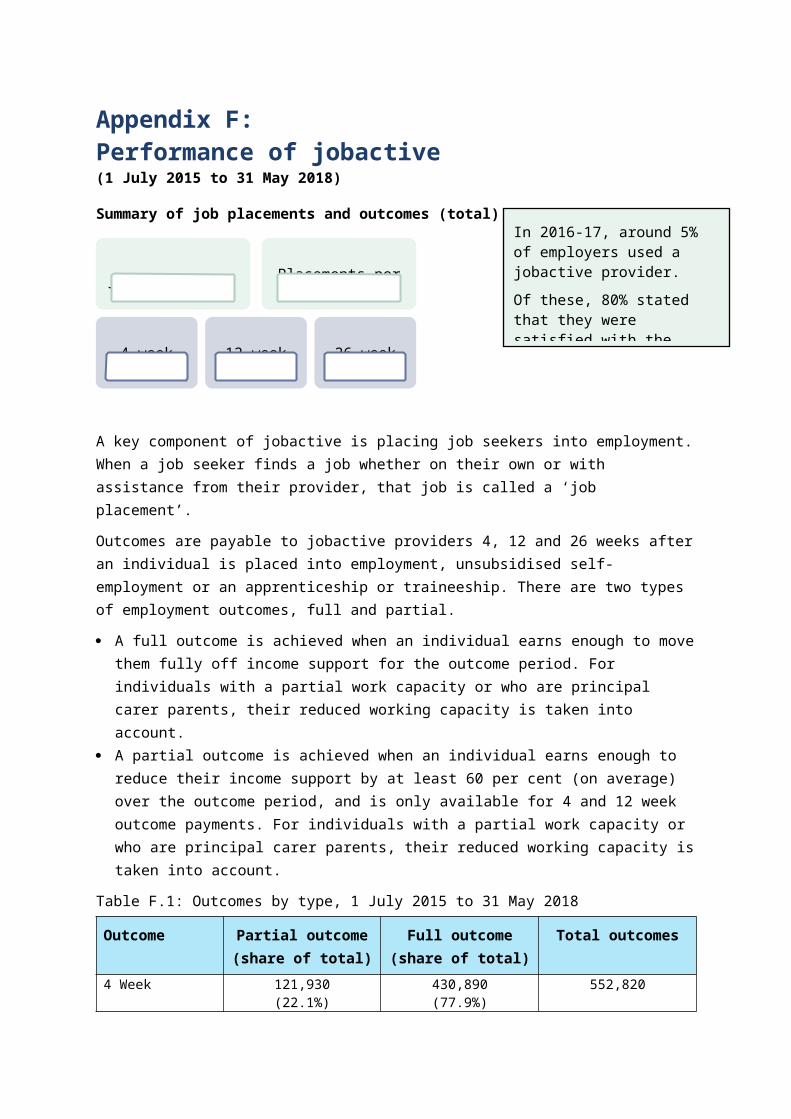
Figure F.3: Job seekers employed 3 months after participating in jobactive, June 2016 to December 2017
48.0% 48.1% 48.5% 48.7% 48.9% 49.3% 49.5%
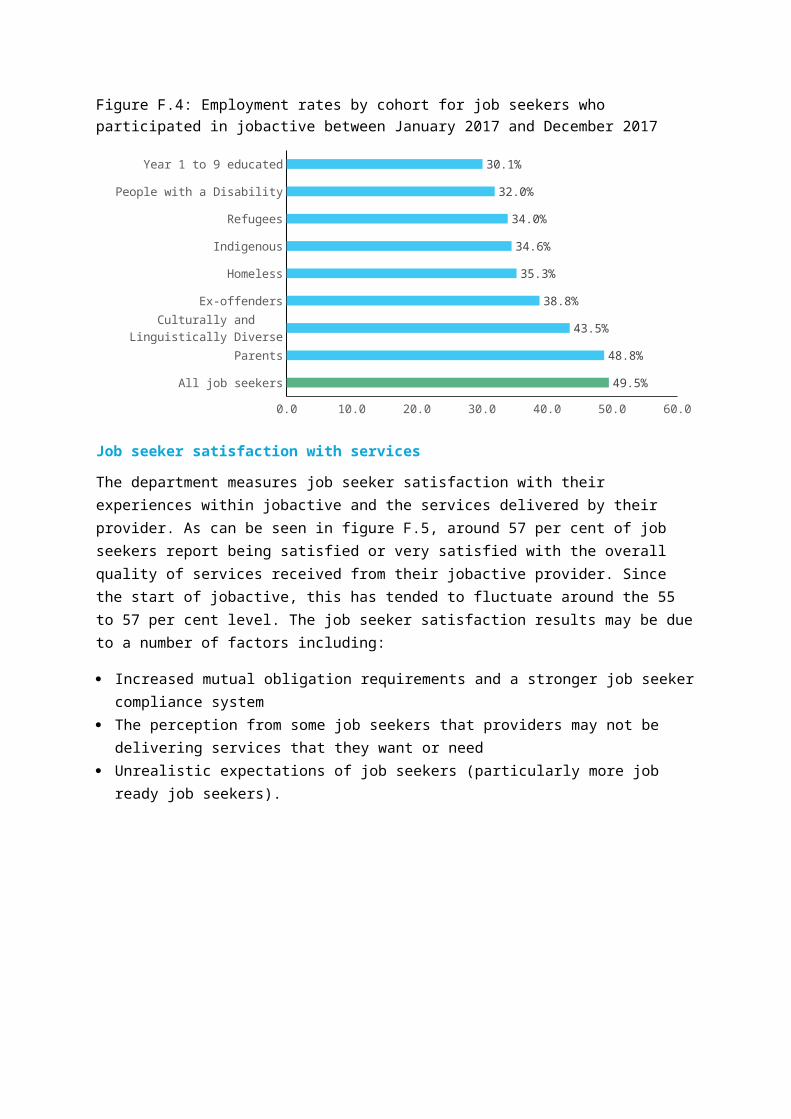
Job seekers who have barriers to employment are less likely to be employed three months after participating in jobactive. Figure F.4 shows that job seekers with low educational attainment, people with disability, refugees, homeless job seekers, Indigenous job seekers and ex-offenders have low employment rates.
Figure F.4: Employment rates by cohort for job seekers who participated in jobactive between January 2017 and December 2017
All job seekers
Parents
Culturally and Linguistically Diverse
Ex-offenders
Homeless
Indigenous
Refugees
People with a Disability
Year 1 to 9 educated
0.0 10.0 20.0 30.0 40.0 50.0 60.0
49.5%
48.8%
43.5%
38.8%
35.3%
34.6%
34.0%
32.0%
30.1%

Job seeker satisfaction with services
The department measures job seeker satisfaction with their experiences within jobactive and the services delivered by their provider. As can be seen in figure F.5, around 57 per cent of job seekers report being satisfied or very satisfied with the overall quality of services received from their jobactive provider. Since the start of jobactive, this has tended to fluctuate around the 55 to 57 per cent level. The job seeker satisfaction results may be due to a number of factors including:
Increased mutual obligation requirements and a stronger job seeker compliance system The perception from some job seekers that providers may not be delivering services that they
want or need Unrealistic expectations of job seekers (particularly more job ready job seekers).
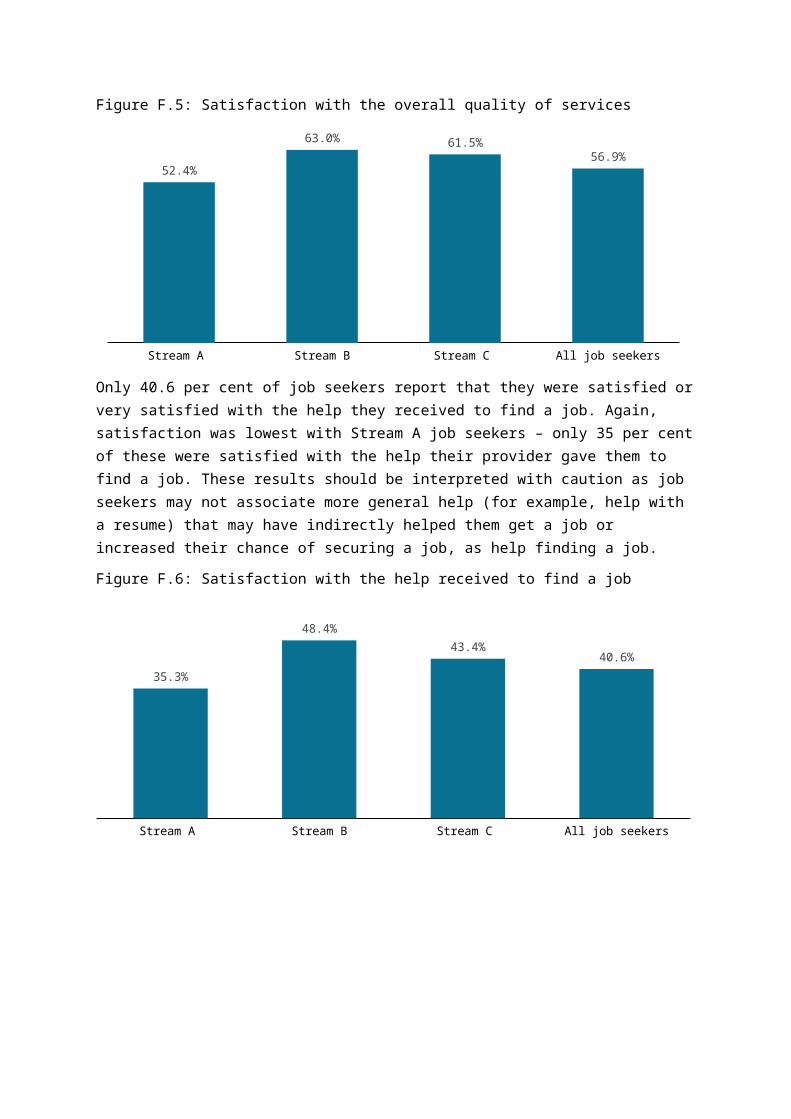
Figure F.5: Satisfaction with the overall quality of services
Stream A Stream B Stream C All job seekers
52.4%
63.0% 61.5%56.9%
Only 40.6 per cent of job seekers report that they were satisfied or very satisfied with the help they received to find a job. Again, satisfaction was lowest with Stream A job seekers – only 35 per cent of these were satisfied with the help their provider gave them to find a job. These results should be interpreted with caution as job seekers may not associate more general help (for example, help with a resume) that may have indirectly helped them get a job or increased their chance of securing a job, as help finding a job.
Figure F.6: Satisfaction with the help received to find a job
Stream A Stream B Stream C All job seekers
35.3%
48.4%43.4%
40.6%


Appendix G – Labour Market data and information Key features and challenges in the labour market
The Australian economy is growing, but also changing. This is leading to changes in the jobs Australians work in, with many occupations and industries expanding while some others become smaller. The future employment services model could help Australians to adapt to change.
Australia’s employment landscape has changed
The Australian economy has experienced almost three decades of uninterrupted growth. During this time it has undergone a range of significant changes, away from the Agriculture, Manufacturing and Mining and related industries towards more broadly-based growth, particularly in the more labour intensive services sectors.
This structural shift has led to many broad benefits for the Australian economy, although the positive effects of change have not been uniform. Some groups (such as youth, the long-term unemployed, mature-aged people, lone parent families and jobless families) are being left behind (see the box on vulnerable groups below). While some cities and regions have experienced growth in investment and employment, others have been affected by job losses in local major employers.8
While change has always been a feature of the Australian economy, there are emerging trends that are likely to have greater impact over time. For example, an ageing population will continue to increase demand for aged care and health services, further altering the structure of the economy and labour market. Technological advancement will continue to drive innovation and disruption across a range of industries, while changes to consumer preferences will also influence the types of jobs that are available in the future.
These changes will affect Australian workers in a range of ways, including; the nature of work, where people are likely to find employment and the skills that are in demand from employers.
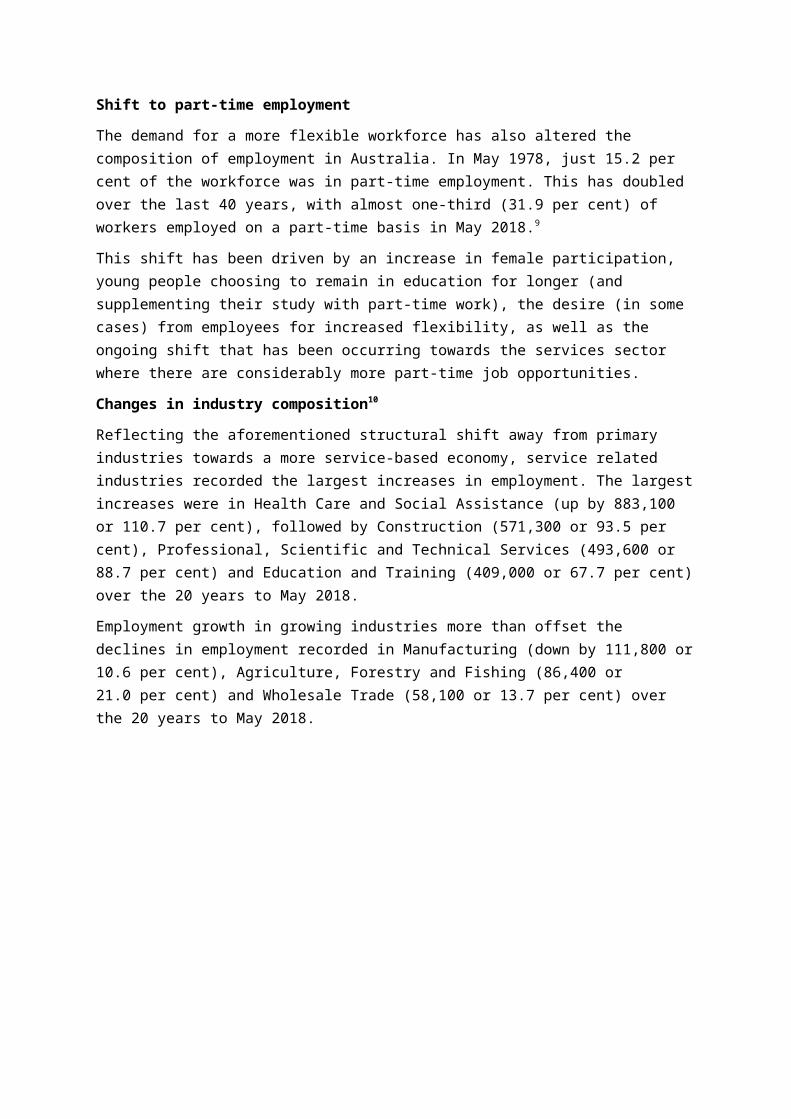
Shift to part-time employment
The demand for a more flexible workforce has also altered the composition of employment in Australia. In May 1978, just 15.2 per cent of the workforce was in part-time employment. This has doubled over the last 40 years, with almost one-third (31.9 per cent) of workers employed on a part-time basis in May 2018.9
This shift has been driven by an increase in female participation, young people choosing to remain in education for longer (and supplementing their study with part-time work), the desire (in some cases) from employees for increased flexibility, as well as the ongoing shift that has been occurring towards the services sector where there are considerably more part-time job opportunities.
Changes in industry composition10
Reflecting the aforementioned structural shift away from primary industries towards a more service-based economy, service related industries recorded the largest increases in employment. The largest increases were in Health Care and Social Assistance (up by 883,100 or 110.7 per cent), followed by Construction (571,300 or 93.5 per cent), Professional, Scientific and Technical Services (493,600 or 88.7 per cent) and Education and Training (409,000 or 67.7 per cent) over the 20 years to May 2018.

Employment growth in growing industries more than offset the declines in employment recorded in Manufacturing (down by 111,800 or 10.6 per cent), Agriculture, Forestry and Fishing (86,400 or 21.0 per cent) and Wholesale Trade (58,100 or 13.7 per cent) over the 20 years to May 2018.
Figure G.1: Employment change by industry, 20 years to May 2018
Manufacturing
Agriculture, Forestry and Fishing
Wholesale Trade
Information Media and Telecommunications
Other Services
Electricity, Gas, Water and Waste Services
Rental, Hiring and Real Estate Services
Arts and Recreation Services
Financial and Insurance Services
Administrative and Support Services
Mining
Transport, Postal and Warehousing
Public Administration and Safety
Accommodation and Food Services
Retail Trade
Education and Training
Professional, Scientific and Technical Services
Construction
Health Care and Social Assistance
-111.8
-86.4
-58.1
41.0
67.5
72.0
88.2
121.9
126.3
135.7
148.7
198.2
305.2
327.3
342.3
409.0
493.6
571.3
883.1
ABS, Labour Force, Australia, Detailed, Quarterly, May 2018, trend data
Shift towards higher skilled jobs
Alongside a shift towards a more service-based economy, there has also been a shift towards higher skilled occupations. Over the 20 years to May 2018, jobs at the highest skill level11 have comprised 45.3 per cent of total employment growth. By contrast, jobs at the lowest skill level12 comprised only 8.6 per cent of total employment growth.13 This trend is expected to continue, with 43.5 per cent of projected employment growth in higher skilled jobs.14
In 2017, the unemployment rate was just 3.2 per cent for those with a bachelor degree or higher level of educational attainment. This compares with 10.8 per cent for those with Year 10 or below. Similarly, the participation rate for those with a bachelor degree or higher stood at 87.2 per cent in 2017 but only 55.9 per cent for those with a level of educational attainment of Year 10 or below.15
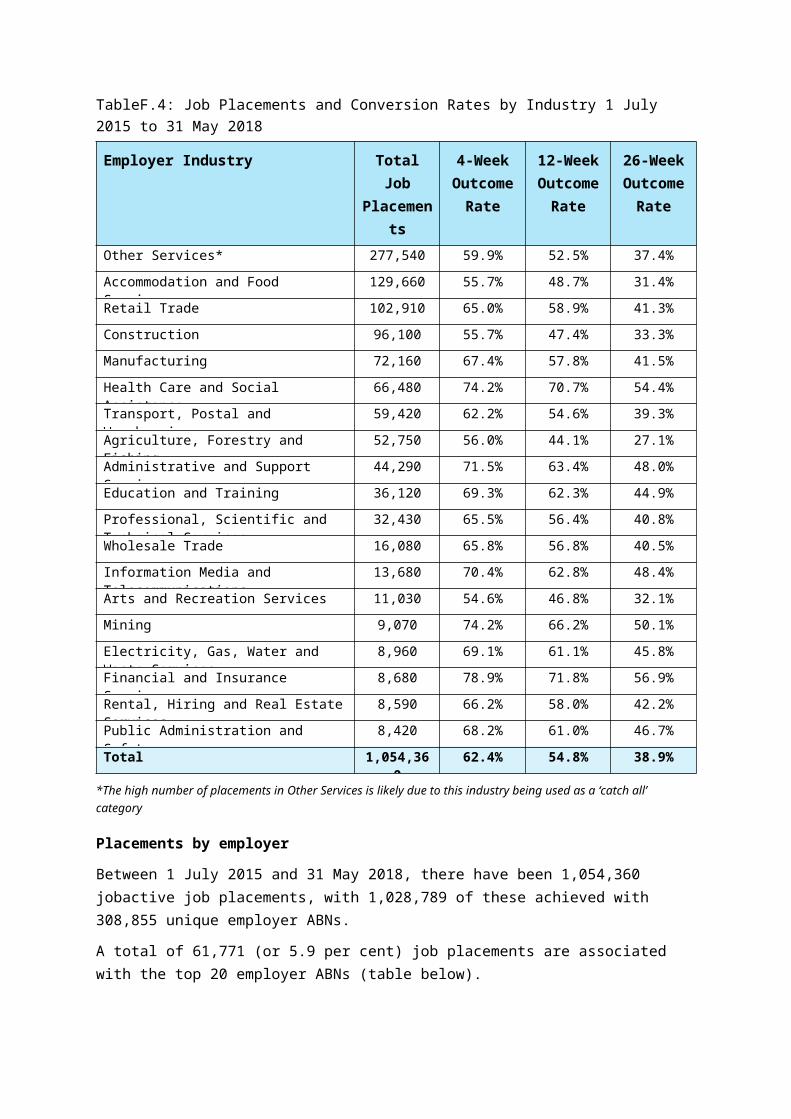
Figure G.2: labour market outcomes by highest level of educational attainment 2017 (%)
Bachelor degree or higher
Advanced Diploma/Diploma
Certificate III or IV
Year 12 or equivalent
Year 11 Year 10 or lower0
5
10
15
20
25
0
10
20
30
40
50
60
70
80
90
100
3.2 4.0 4.47.0
10.4 10.8
87.2 84.6 85.4
75.9
64.9
55.9
Unemployment rate - left axis (%) Participation rate - right axis (%)
Une
mpl
oym
ent r
ate
(%) Participation rate (%
)
Source: ABS, Survey of Education and Work, 2017 (limited to 15 to 64 years)
The number of Australians undertaking tertiary education has increased and more workers now hold post-school qualifications. In 2017, 67 per cent of workers held post-school qualifications (up from 47 per cent in 1997). The growth has been for both vocational education and training (VET) and higher education qualifications.
While higher-level qualifications generally improve job prospects, employment outcomes for university graduates have fallen over the last decade. In 2017, 71.8 per cent of bachelor degree graduates found full-time work four months after graduating, down from 84.5 per cent in 2007 (although this is above the low point of 68.1 per cent in 2014).16
There is strong competition for low skilled jobs
Entry-level jobs are characterised as those that require little experience or qualifications. New jobs are demanding higher qualifications, making it increasingly difficult for job seekers without qualifications to find work. Competition for lower skilled jobs is strong, with employers receiving an average of 19 applicants per lower skilled job, but only three making it to interview.17 Around half of employers (51 per cent) considered relevant experience to be essential for lower skilled vacancies, yet many unemployed job seekers lack recent work experience, particularly young or long-term unemployed job seekers.
Evidence also shows that people with higher qualifications are working in lower skilled jobs, placing further pressure on lower skilled workers’ ability to be competitive.18
There is considerable variability across Australia
Despite a consistently strong economy, significant disparity continues across Australia. Regional areas continue to perform more poorly compared with cities, having lower employment growth and higher unemployment rates. These differences are generally due to regional areas having a reliance on a small number of industries and limited transport infrastructure to access broader labour supply.

Employability skills
Employability skills, or soft skills, cover a range of people, social and communication skills that contribute to a person’s chance of getting and maintaining a job. Employability skills are increasingly important as the labour market is undergoing change and jobs in the services industries are becoming more common. Almost three-quarters of employers place at least as much emphasis, if not more, on employability skills when recruiting than they do on technical skills.19
Employers’ recruitment methods
Employers are increasingly using the internet as the main method to advertise job vacancies, with 60 per cent of jobs advertised online in 2016–17, up from 45 per cent in 2012–13. As shown in figure G.3, job boards and recruitment sites are the main method employers use to advertise (49 per cent of all vacancies). Government employment services are used for 4 per cent of vacancies. Social media is a rapidly emerging method for advertising positions, rising from 2 per cent of vacancies in 2013–14 to 9 per cent in 2016–17.20
Figure G.3: Recruitment methods used by employers
0%
10%
20%
30%
40%
50%
60%
49%
13%9%
26%
11% 11% 11%8%
4% 4%% o
f em
ploy
ers'
mos
t rec
ent v
acan
cies
Online recruit-ment
Recruitment methods vary by business size. For example, small businesses have a greater reliance on word of mouth, while large busi-nesses are more likely to advertise on their own company website.
The impact of technology on jobs
Technological improvements often mean that tasks that were previously done by a human can now be done by a machine. One approach to thinking about the potential impact of automation on jobs focuses on two separate aspects:
Whether jobs are routine or non-routine, that is, whether the job follows explicit rules that could be easily specified in computer code to be accomplished by machines.
Whether jobs are manual or cognitive, that is, whether the job relates to physical labour (manual) or knowledge work (cognitive).

Which jobs are most susceptible to automation?
The jobs that are the most susceptible to automation are those that are ‘routine’. As shown by figure G.4, the proportion of people employed in such jobs is decreasing.
Figure G.4: Changes in employment by skills type, 1986–2016 (%)
1986 1991 1996 2001 2006 2011 20160
10
20
30
40
50
0
10
20
30
40
50Non-routine cognitive Routine cognitive Routine manual Non-routine manual
Sources: Australian Bureau of Statistics and Reserve Bank of Australia.
Routine manual jobs in controlled environments are the easiest to automate. For example, factories and assembly lines have become increasingly automated, reducing the need for Factory Process Workers in the Manufacturing industry. Since the early 2000s, there has also been a steady decline in the proportion of people working in routine cognitive jobs (such as Bookkeepers and Accounting Clerks), with advances in computing technology exposing a new category of jobs to the possibility of automation.
By contrast to the decline of routine work, non-routine employment in Australia has steadily grown. These occupations (such as chefs, teachers, and software and application programmers) are less susceptible to automation because they often require creativity, complex thinking, managerial experience or a human presence. The fastest growing non-routine jobs are in the services industries, particularly health care and social assistance, professional, scientific and technical services and education and training.
It is also important to note that while it may be feasible to automate a job or task; this does not mean it will actually be automated. Sometimes the cost of doing so, relative to wages, may be prohibitive. Jobs that remain difficult and costly to automate include those involving social interaction (such as Aged and Disabled Carers) or creative intelligence (such as Architect), and occupations that are highly unpredictable (such as Plumbers and Gardeners).

The future of work – what will happen to future jobs and skills requirements?
It is likely that technology, shifting demographics and changing consumer preferences will continue to change the nature of work. Researchers expect the proportion of jobs in Australia which are ‘non-routine’ will continue to increase.
Existing jobs will change too, with less time spent on tasks that can be automated and a greater focus on using cognitive skills. Future improvements to technology are likely to expand automation to jobs in less structured environments. Some effects could be seen in the near future, such as changes to the nature of call or contact centre work through the use of automated customer service assistants. Other effects are a little further away, such as the likely impact of automated vehicle technology on automobile drivers and delivery drivers.
Which industries and occupations will have the most new jobs over the next five years?
The Department of Jobs and Small Business publishes projections of future changes in the Australian labour market.21 These show that the total number of people who are employed in Australia will increase by 948,400 (or 7.8 per cent) over the five years to May 2022. Employment is projected to increase in 16 of the 19 industry groupings22 and all eight occupation groups over the five years to May 2022 (figure G.5).
Figure G.5: Projected employment growth by industry and occupation, five years to May 2022
Projected employment growth, industry share(% of new jobs)
Health Care & Social Assis-tance; 25%
Professional, Scientific & Technical
Services; 13%Construction; 12%Education & Training; 12%
Accommo-dation & Food Ser-
vices; 10%
Public Admin-istration & Safety; 8%
Retail Trade; 5%
Transport, Postal &
Warehousing; 4%
Administrative & Support
Services; 3%
Other; 8%
Projected employment growth, occupation share (% of new jobs)
Professionals 36%
Community and Personal Service Workers 26%
Managers 13%
Technicians and Trades
Workers 9%
Labourers 7%
Sales Workers
4%
Machinery Operators and Drivers 3%
Clerical and Adminis-trative Workers 2%
Source: Department of Jobs and Small Business (2018) Employment Projections to May 2022
There will be jobs growth across all skill levels in Australia
While occupations that are classified in the two highest skill levels are projected to make up well over half of projected employment growth over the five years to May 2022, there is projected growth for occupations across all skill levels.
What does this mean for job seekers?
As noted in chapter 2 of this discussion paper, the design of the future employment services needs to take into account the likely changes in the labour market, including the possibility that an increased range of people will start looking for new opportunities.
Employment services will need to increase their focus on skills to help people understand how their current skills apply in different jobs, and how they can build on their skills set to move into new jobs. Employers often value transferable skills including digital literacy, critical thinking, creativity, problem solving and presentation skills. Aptitudes such as adaptability, resilience and entrepreneurial skills are also important.
It may take time for individuals to gain the skills required for new jobs, and there are likely to be fewer jobs that do not require at least some training qualifications in the future. Rapid changes can also mean people will need to keep learning new skills throughout their lifetime.
These trends indicate that job seekers, including both current workers and those not in employment, will need up-to-date information on what is happening in their local labour market, and assistance which is tailored to their needs. Job seekers who face barriers to employment or live in disadvantaged regions are particularly likely to need support to successfully transition to new jobs.
Vulnerable groups
Long-term unemployment (people who have been unemployed for 52 weeks or more)
While the labour market tends to recover during periods of strong economic (and employment growth), long-term unemployment tends to fall at a much slower rate than overall unemployment. These unemployed people are often the most disadvantaged due to skill depreciation, loss of motivation and marginalisation from finding work.
This means that the chances of long-term unemployed job seekers finding work are impacted long after the end of an economic slowdown (and an upswing in jobs). For example, despite a recent strong period of employment growth over the last 16 months, the level of long-term unemployment remains double that recorded at start of the Global Financial Crisis in late 2008.
Youth (15–24 year olds)23
Young people can face considerable disadvantage in the labour market, recording an unemployment rate of 11.6 per cent in May 2018, more than double the rate recorded for all persons (of 5.4 per cent). The burden of long-term unemployment is also being felt disproportionately by young people, with youth comprising 26.1 per cent of long-term unemployment in May 2018, despite accounting for just 16 per cent of the total population. While most youth are either engaged in some form of work or study, another key concern is the number of young people who are ‘disengaged’, with 343,400 (or 10.7 per cent of the youth population) not in work and not attending full-time education in May 2018.
Moreover, the prevalence of more highly skilled jobs in today’s labour market has made it more difficult for young people to leave school at a young age and find employment without gaining further qualifications first. While it is encouraging that more young people are participating in full-time education (52.9 per cent in May 2018, a near record high), there has been a concurrent weakening in employment outcomes for higher education graduates in recent years.
There has also been an increase in the proportion of graduates who are employed in an occupation that is not commensurate with their level of educational attainment. This suggests that graduates are ‘pushing down’ into lower skill level occupations (where they are competing with people with far fewer or no qualifications, such as long-term unemployed and unskilled young people). To illustrate, the proportion of those aged 15–64 years employed in clerical, sales and labourer occupations with a Bachelor degree or above has risen from 11.3 per cent in 2008 to 18.1 per cent in 2017 (latest available data).
Mature-aged (people aged 55 years and over)24
In the context of an ageing population, older Australians now comprise a large and growing proportion of the labour force (as they take their jobs with them as they move into the older age cohorts) as well as the overall unemployment pool. Mature-age persons tend to have a lower unemployment rate than their younger counterparts (3.8 per cent in May 2018, compared with 4.4 per cent for persons aged 25-54). However, once a mature age worker becomes unemployed, they face much greater difficulty finding subsequent employment, when compared with younger cohorts (with an average duration of unemployment of 74 weeks in May 2018, compared with 54 weeks for persons aged 25-54 years).
Evidence suggests that older unemployed persons continue to suffer from various forms of age discrimination and job selection bias. Moreover, employers may falsely believe that mature-aged workers are inflexible, cannot adapt to technological change and are difficult to train. It is true, however, that due to structural changes in the economy, an older person who has been in a job for longer may have job specific skills that are no longer required and would therefore need training (a sunk cost to employers) to gain subsequent employment after retrenchment.
Jobless families and one parent families25
Reflecting the recent strengthening in labour market conditions, the number of jobless families with children has decreased over the year to June 2017 (latest available data) by 7,200 (or 2.4 per cent) to stand at 298,700. In June 2017, 39.8 per cent of one parent families with children (or 192,000) were jobless, marginally lower than the 39.9 recorded in June 2016.
The ABS Barriers and Incentives to Labour Force Participation publication indicates that, in 2015-16, there were 158,700 women who cited ‘Caring for children’ as their main reason for not looking for work/more hours. Of these women, more than a third (59,800 or 37.7 per cent) said they ‘Preferred to look after children’ although 30,600 (or 19.3 per cent) cited childcare ‘Cost/too expensive’ as their main reason for not looking for work/more hours, while 20,900 (or 13.2 per cent) said ‘Childcare not available/childcare booked out/no childcare in locality’.26
Female labour force participation27
While the overall female participation rate has increased dramatically over recent decades, it is not surprising that it declines during a woman’s prime childbearing years and begins to rise again once their child rearing responsibilities decrease (i.e. particularly when children reach school age—see discussion on jobless families above). Importantly, the participation rate for females has increased considerably over the last four decades, up from 43.7 per cent in May 1978, to 60.4 per cent in May 2018. This reflects, in part, greater access to childcare, the emergence of more flexible work arrangements, an increasing acceptance of women with children remaining in the labour force and a rise in employment in the industries that have traditionally favoured females.
Indigenous Australians28
Indigenous Australians can face considerable disadvantage in finding work. The unemployment rate for Indigenous Australians stood at 18.2 per cent in August 2016, well above the rate for non-Indigenous (6.6 per cent). Just over half (53.9 per cent) of Indigenous people were participating in the labour market in 2016, well below the 64.9 per cent for non-Indigenous. This could be due to a range of factors, but a particular issue is that Indigenous Australians are often located in regional and remote communities where there are limited job opportunities. Indigenous Australians generally have lower educational levels than non-Indigenous Australians, which also affects their competitiveness in the job market.
Indigenous digital inclusion29
There is a gap in the digital inclusion levels between Indigenous and non-Indigenous Australians. Indigenous people are 69 per cent less likely to have any internet connection than non-Indigenous Australians.
The Australian Digital Inclusion Index (ADII), which measures Indigenous digital inclusion using indicators like access, affordability, usage, skills and relevance, shows digital inclusion for Indigenous people is seven points lower than the national average. This does not include remote areas where digital inclusion is expected to be far lower.
The low digital inclusion score cannot be explained by low socio-economic status alone. When compared with the total low SES population, Indigenous Australians score lower across all indices.
Digital literacy and affordability
Indigenous Australians are much more likely to be mobile-only users. Mobile-only users tend to have lower digital ability and are less likely to use the internet for transactions. Mobile data is more expensive so Indigenous Australians get less value out of their expenditure.
Availability
Of the 1516 Indigenous urban, regional and remote communities for which data are available, only:
856 have or will receive mobile coverage, and 51 have access to terrestrial NBN.
A total of 51.9 per cent of Indigenous people living in very remote areas did not access the internet in last 12 months, compared with 11.1 per cent of Indigenous Australians living in major cities.

Appendix H:International employment servicesSummary of international trends in employment service models
Introduction
This appendix outlines some of the key features of government-funded public employment services (PES) in several other Organisation for Economic Co-operation and Development (OECD) member countries. It is focused on policy settings in countries which are broadly comparable to Australia and which may be of assistance to readers when considering options for a future Australian employment services model.
The selection of examples in this appendix does not imply endorsement of their suitability in the Australian context. The Employment Services Expert Advisory Panel and Department of Jobs and Small Business are drawing on a wide range of domestic and international evidence to inform potential options.
All information in this appendix has been sourced from public documents. The policy settings described were current as at early 2018.
International perspectives on labour market policies and activation
International research demonstrates that there is no ‘gold standard’ in employment services. There is considerable diversity in these policies, which results from differences in starting points, institutions, government policies, funding models and culture. For instance, European employment services are often part of a social insurance model, where services are primarily provided to individuals who are less disadvantaged than those assisted by the Australia’s employment services.
Digital services
Digital service delivery is transforming the way employment services operate in many countries. International experiences demonstrate that technology can provide sophisticated ‘self-help’ digital solutions to address barriers to employment, and complement face-to-face servicing. The digital employment services in the Flemish Region of Belgium are an example of a cost-effective way of delivering services to job seekers in a self-servicing environment. As well as including functions to assist job seekers to search for work, these services also offer high-quality e-training.
Intensive services
Intensive services for disadvantaged job seekers remain a fundamental part of international employment services. Key elements of international intensive services models include:
Tailoring the assistance job seekers receive to their needs and barriers to employment Applying early intervention principles when directing assistance to disadvantaged job seekers Facilitating ‘wrap-around’ services for disadvantaged job seekers.

Caveats to consider when assessing international examples
Care needs to be taken when considering how international settings could be applied to Australian employment services due to the significant differences between countries’ economic circumstances, systems of government, policy frameworks and societies.
As a result, measures which have been successful in other countries may not necessarily be well suited to Australian circumstances.
A key difference is that almost all of the countries covered in this appendix have an insurance-based welfare system. In these countries, job seekers receive unemployment benefits in return for financial contributions paid by themselves or their employers during periods of employment. These insurance-based benefits are typically time-limited, with job seekers receiving much lower payments after a set period of time. In contrast, Australia’s welfare system is funded through tax revenue and is available to all people who meet eligibility criteria.
Examples of public employment services in other OECD-member countries
1. Belgium (Flemish Region)
As described in Chapter 4 of the discussion paper, the employment services in the Flemish Region of Belgium have adopted a ‘digital first’ (digital-by- default) approach for assisting job seekers.
In addition to these services, job seekers who are facing obstacles in finding receive intensive guidance from VDAB (the Flemish public employment service) counsellors. Intensive guidance is offered when the job seeker lacks experience, technical competences, or faces other barriers which hinder their re-employment. The caseworker identifies issues at intake, paying attention not only to employment-specific qualifications, but also to social skills, communicative skills, disability, mental health problems, limited mobility and childcare obligations. Based on these characteristics, an individual action plan is created.
If the client experiences difficulties during their job-search, they can request an appointment for an interview at any time. The caseworker can request a diagnosis by a VDAB psychologist or an in-depth multidisciplinary screening by an external employment research centre, if there is a suspicion that the job seeker may suffer from a severe mental health condition. If a physical disability or a mental health problem is detected, the job seeker receives specialised support in their job-search.
2. Denmark30
Municipal-level reforms
As part of a comprehensive municipal reform in 2004, Denmark moved its public employment service (PES) to the municipal system. Municipalities are responsible for employment and welfare service delivery (except for health care), and serve both the insured and the uninsured unemployed. Municipalities enjoy a high degree of autonomy, but their performance is assessed through a central monitoring and benchmarking system.
Early and intensive counselling
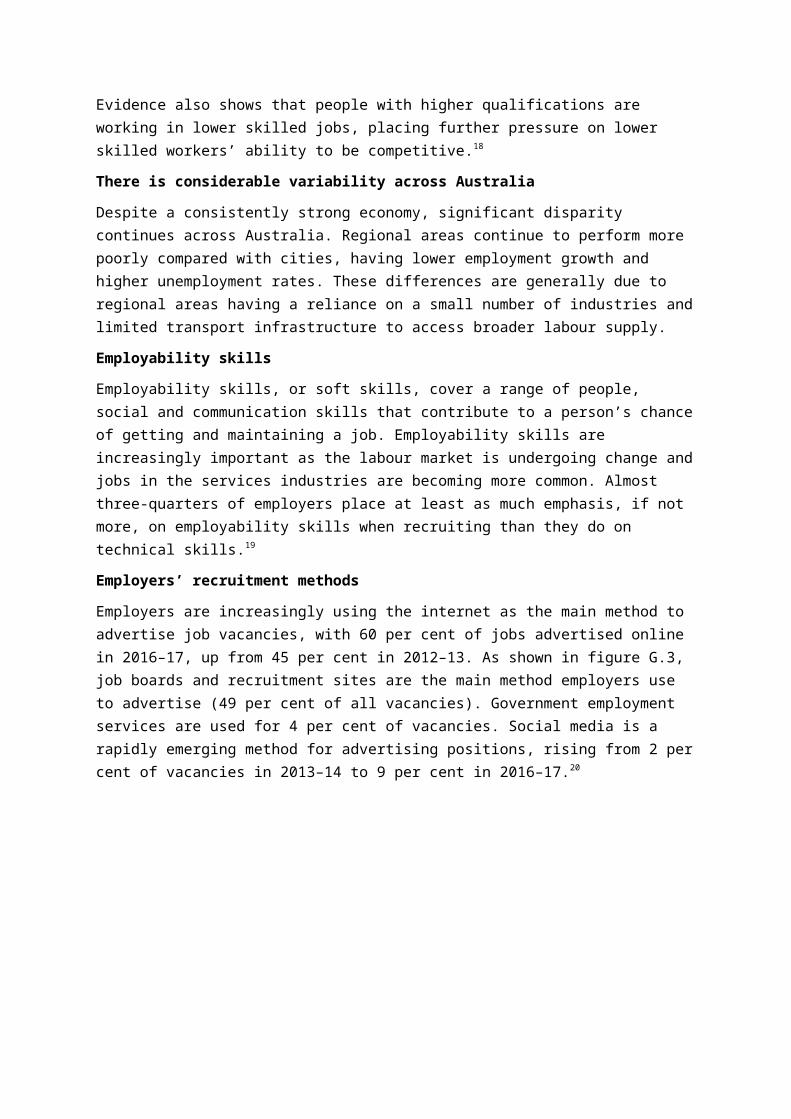
National employment reforms in 2014 introduced an early and intensified contact regime for unemployed people in every local PES office in Denmark. The reform was based on evidence from earlier pilot projects, some of which showed that early and frequent meetings increase employment rates by over 10 per cent, and that intensified contact is effective in assisting the long-term unemployed. The model aims to shorten unemployment periods and prevent long-term unemployment. In addition, PES offices have implemented local-level projects to prevent long-term unemployment.
It is expected that by participating in the program job seekers are empowered: they are made responsible for their job-search by arranging meetings with job counsellors. Local PES focus on the quality of the meetings between the job seekers and job counsellors. Job counsellors are trained in conversational and questioning methods, which are job-focused and aim to motivate the job seeker.
Multidisciplinary teams
Denmark has established multidisciplinary teams in municipalities, which assess and provide services to long-term unemployed clients with complex problems. The teams are comprised of employment experts and social workers delegated by the municipality, as well as health and education experts, who, by law, have to support the teams upon the request of the municipality.
Municipalities can commission external experts – e.g. employer counsellors – on a case-by-case basis. In most municipalities the teams have office hours on fixed days of the week, while in larger municipalities, the multidisciplinary team is always available to the clients. The teams served around 25,000 clients in 2014, which equals roughly 10 per cent of Danish long-term unemployed job seekers.
The Danish multidisciplinary teams use digitised case management. All stakeholders involved in the program can access clients’ information.
3. Germany
The 4-Phase Model (4PM) for activation and the management of transitions
The German public employment service includes a “4-Phase Model” for activation and management. The model was introduced with the goal of encouraging more customer-oriented services, including by identifying job seekers’ individual needs and directing them to solutions (including social services). It also aims to assist employment counsellors to fulfil their tasks in a systematic, high-quality and efficient way.
The 4PM is a consistent approach with four phases for individualised service provision, including:
i) profilingii) target definitioniii) strategy selection, and iv) action and controlling.
Profiling is an integral part of individualised service provision to job seekers. Through profiling, counsellors can better understand their client’s aspirations, barriers and needs. In the 4PM model, profiling is used to forecast employability by mapping job seekers’ proximity or distance from employment. The two main categories used to guide the services job seekers receive are:

‘near’ (integration into the primary labour market within six months is likely), and ‘far’ (integration within six months is unlikely).
Following the profiling phase, counsellors and job seekers develop and agree to a Job Integration Agreement (JIA). JIAs cover:
what general goals the job seeker is to work towards, and which services the PES can offer.
After the JIA is completed, employment counsellors can exercise a degree of discretion on the services offered to job seekers. The level of discretion is bound by the job seeker’s characteristics. Only certain ‘bundles’ of services can be selected for some groups of job seekers, and particularly the highly vulnerable.
Employment counsellors are supported by a product directory. This includes recommendations, lists the most suitable measures for different strategies and describes promising implementation alternatives. The product directory can be complemented with local activation/integration strategies and service bundles.
Finally, the strategy selected by the employment counsellor becomes part of an individual action plan, which contains the next steps for both parties.
All four phases are repeated at each interview between a job seeker and their employment counsellor. This provides an opportunity to adjust the job seeker’s profile, as well as their goals and strategies.
In addition to the 4PM, Germany’s public employment service has also introduced a basic qualification for workers. Workers also undertake training and knowledge sharing exercises with their colleagues.
4. Ireland
The Intreo network and preventing long-term unemployment
The Irish Government has introduced major reforms to its strategy for reducing long-term unemployment. The Government’s approach has been outlined in a succession of ‘Pathways to Work’ programs that combine reforms to the benefit system, employment programs and services for job seekers and employers.
The Pathways to Work strategy has included the new PES service delivery system which combines public, non-profit and private providers. This included the integration of three previously separate employment and benefit service delivery networks, and related registration processes, into one ‘Intreo’ public service.
Parallel to the Pathways to Work reforms, the Irish Government established a Labour Market Council, comprised of employers and policy experts to advise and build wider support for the Pathways strategy.
Profiling job seekers - Probability of Exit to Employment within 12 months’ (PEX) rating
In the Irish system, when unemployed people initially claim a benefit they must complete a profiling questionnaire, which is used to assign a ‘Probability of Exit to Employment within 12 months’ (PEX) rating. The claimant must also agree to a record of mutual commitments. All claimants then attend a
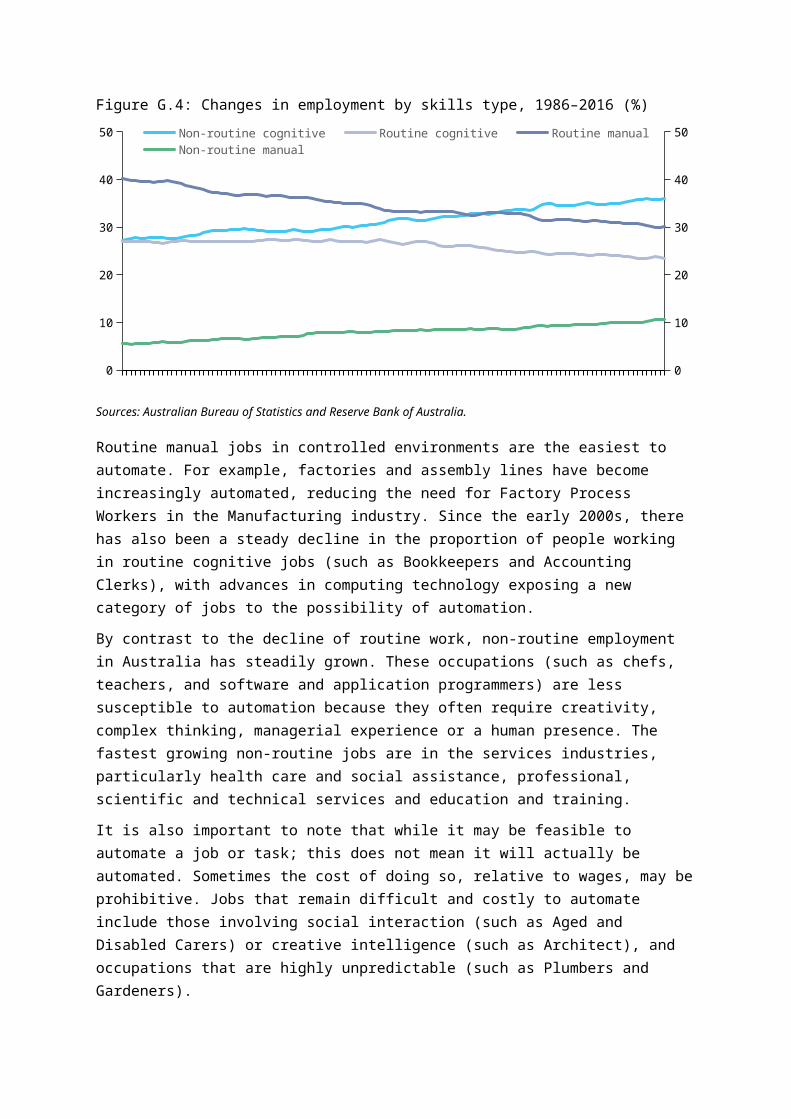
group information session where they are informed of the role of the PES, the mandatory activation process and the support available from Intreo. The results of the PEX rating determine if a claimant is given an appointment for an advisory interview with a case officer during which a ‘Personal Progression Plan’ (PPP) is discussed and agreed.
The subsequent frequency and timing of engagement with an Intreo case officer is shaped by the client’s PEX rating. Clients with a:
high PEX rating (i.e., those with a high probability of gaining employment) are encouraged to search for work but are not required to attend an advisory interview for six months.
mid-point rating attend interviews once every two months low PEX rating meet with an advisor every month.
The advisory interviews complement a ‘signing on’ regime where claimants who are not meeting a case officer attend an Intreo office each month to make a declaration that they remain unemployed and are looking for work.
JobPath - services for the long-term unemployed
The JobPath measure assists long-term unemployed job seekers to secure and sustain full-time paid employment or self-employment. It is delivered by non-government providers.
The Irish Department of Employment Affairs and Social Protection selects long-term unemployed job seekers on a random basis for referral to JobPath. The random allocation is designed to prevent providers selecting only the most job-ready clients to assist and, over a period of time, sequence the flow of referrals from amongst the existing ‘stock’ of eligible job seekers. Job seekers selected for the program meet on a one-to-one basis with an advisor who will work with them to get a job. Participation in the measure is compulsory for those selected for it.
Job seekers spend a year on JobPath and if they are placed into a job they may continue to receive support for the first year of employment. During their time on JobPath they may also be referred for further education and training opportunities.
JobPath contracts are designed to attract private providers who invest in job seekers. Under this model, providers receive their full payments only when they succeed in placing the job seeker into employment which is sustained for more than one year.
5. Republic of Korea (South Korea)
Korean employment services are covered by the Employment Insurance Act which provides individual and specific labour market programmes under the Employment Insurance System (EIS). PES are delivered by a range of central government ministries, local governments and some government affiliated bodies, with the Job Centre being the core PES organisation.
Job Centres
The Korean Government Job Centre implements most of the programs in the EIS, providing a one-stop service linking the payment of unemployment benefits with job placement and vocational training services. Job Centre services also include counselling and an active labour market program, the Successful Employment Package Program (SEPP).

Job placement services are carried out on the basis of information on the Work-Net, the public job information network that collects, stores and provides the details of job seekers and recruiting companies. Job placement services include individual counselling for discouraged job seekers to encourage and enhance self-esteem, motivation, interpersonal and communication skills; and group counselling for targeted people who have severe difficulty in finding a job. The Job Centre also holds job fairs to help connect people to jobs. On occasion, job consultants will accompany job seekers to job interviews, in an effort to improve the job placement rate.
Employment stabilisation programs
One of the main goals of the Korean EIS is to prevent unemployment and promote reemployment. This aim is reflected in the range of employment stabilisation programmes, which include the:
Job Creation Program which provides financial assistance to employers to expand employment opportunities by improving the working environment, implementing alternative work patterns or making other efforts to create jobs.
Employment Adjustment Program which aims to stabilise employment by providing subsidies to employers to cover part of the costs involved in minimising lay-offs in the course of employment adjustment.
Employment Promotion Programme which is aimed at facilitating employment of vulnerable groups in finding jobs under normal labour market conditions through employer subsidies.
Successful Employment Package Program
The SEPP is a three-stage program run by the Korean Job Centre, providing customised assistance for up to 12 months to participants. Financial incentives and income support are available at various stages to promote participation.
In the first stage, participants receive individual counselling and develop an Individual Action Plan (IAP).
During the second stage, participants are monitored at least once every two weeks by Job Centre officials who meet face-to-face or via the internet. Depending on their IAP, participants receive further job-search assistance, vocational training, work experience or help to set up their own business.
In the third stage, participants are helped to find employment through intensive job-placement services provided by both public job centres and contracted private employment services.
6. New Zealand
Employment Service Reform – Service integration
The employment and income support services in New Zealand were administered by separate departments until 1998, when they were merged to form the Department of Work and Income. The Department of Work and Income was in turn merged with the Ministry of Social Policy to form the Ministry for Social Development (MSD) in 2001. MSD mandate was to move towards “a greater emphasis on ‘investment’ in clients to achieve longer-term outcomes, in particular sustainable employment”.
MSD remains responsible for employment services and welfare policy as well as its delivery through the Work and Income agency. MSD performs national, regional and local labour market engagement

functions (including with employers), case management (including in-work support) and a work brokerage services. Through MSD, employment services are integrated with income support, housing and other assistance, such as with childcare. MSD also procures regional work preparation, training and work readiness programs. Work and Income’s website provides access to a range of practical services and resources, such as templates for a CV.
Youth Service
The Youth Service supports people aged 16 to 19 to engage in education, training, and work-based learning, and to have the life skills to be a successful contributing member of the community. There are five groups of clients:
16 and 17 year olds (and some 15 year olds) who are not engaged in employment, education or training, or young people who are at risk of moving into this category
16 to 19 year-old parents 16 and 17 year olds who can’t live with their parents or guardians, or be supported by them or
anyone else 16 or 17 years olds, who have no dependent children and are the partner of a main Work and
income beneficiary 16 to 19 years olds, who have a dependent child or children and are the partner of a main Work
and income beneficiary.
Youth Service clients receive more intensive, individualised services than most adult MSD employment service clients. MSD contracts a network of non-government provider organisations to deliver the YS in most localities. In-house MSD caseworkers provide the service in Wellington and Whanganui. Most parts of the country have only one provider in each community.
Providers hold outcomes-based contracts to improve the proportions of young people in education, training and employment. They also help clients into settled accommodation and to learn to budget their money.
7. Sweden31
Blended service delivery approach
The Swedish PES offers a unique multi-model service arrangement. The initial profiling and creation of individual action plans takes place at local employment offices during face-to-face meetings with caseworkers. Job-ready customers are expected to primarily use online services, but can also receive personalised support from caseworkers both over the telephone and via online meetings. These job seekers are referred to attend face-to-face meetings at the employment office only to update their individual action plans and for further counselling if they have not returned to employment within four months. For job seekers further away from the labour market, most services are offered face-to-face.
Swedish digital services aim to be effective for all parties, while limiting the costs facing government, job seekers and employers. For example, as a measure to improve the efficiency of the recruitment process and reduce job seekers’ travel costs, the digital service offer allows for online screening interviews between employers and job applicants.
Coordination Associations

Sweden has introduced a voluntary local cooperation scheme, called Coordination Associations (CA), to facilitate institutional cooperation between the PES, the social and health sector and municipalities. CAs are independent and led by a local political board. CA boards are made up of officials of public authorities as well as political representatives of the municipality and the county council. CAs coordinate the goals of the participating stakeholders, launch joint projects (e.g. for the integration of immigrants) and maintain inter-organisational teams that support the reintegration of long-term unemployed and help people with health issues.
Case Study: Sweden “co-browsing” (multi-modal servicing)
Sweden has one of the highest levels of broadband Internet penetration (around 90 percent) in the world. This high level of connectivity and widespread adoption of various e-services has led to a high demand from clients for online services which are provided by the PES.
In order to keep clients within the online channel and to guarantee delivery of services in a way that is relevant and adapted to the client’s capacity and situation, the Swedish public employment service has adopted co-browsing as a blended service delivery tool.
Co-browsing essentially means that a job seeker who is online and cannot find information or complete a service can allow a public employment employee to see their screen and provide assistance. In addition, chat/text, audio, and video facilities provide support in this screen-sharing process. Through the use of different channels simultaneously, co-browsing is an example of blended service delivery.
The co-browsing tool is aimed at job seekers who are job-ready and who have been unemployed for less than four months. This means that customers who are not job ready or who have been unemployed for longer than four months will be referred to the local PES office for assistance.
Customer satisfaction surveys show that over 90 per cent of public employment service clients are satisfied with this type of service. Around 92 per cent of nearly 1,600 respondents said they “would use this type of support/assistance again”.
8. The United Kingdom
Jobcentre Plus
Jobcentre Plus is a government-funded employment agency and social security office, helping people of working age find employment in the UK. Jobcentre Plus provides resources to enable job seekers to find work, through Jobpoints (touch-screen computer terminals), Jobseeker Direct (a telephone service) and the Jobcentre Plus website. These services also offer information about training opportunities for long-term unemployed people. In addition to delivering employment services, Jobcentre Plus also administers claims for benefits such as Income Support, Incapacity Benefit, and Jobseeker's Allowance.
“Work coaches” at Jobcentre Plus are civil servants (part of the Department of Work and Pensions), and generally have caseloads of 80 to 100 job seekers. Staff can access to a Flexible Support Fund (similar to the Australian Employment Fund), which can be used to provide grants to external organisations for training or other programs.

Jobcentre Plus is currently operating amid social services reform in the United Kingdom, with the United Kingdom rolling out “universal credit” (a streamlined benefit payment model). The Jobcentre Plus system is also undergoing its own reform in an effort to streamline the system. This reform will include the merger of smaller Jobcentre offices and the co-location of around 50 offices with local authorities or other community services to provide joined-up services for the local community.
Work and Health Programme
The Work and Health Programme was launched in 2017. It provides specialised support for those unemployed for over two years and, on a voluntary basis, to those with health conditions or disabilities. The UK Government expects that the majority of people referred to the Programme will be people with disability.
Eligible groups of job seekers include:
Very long-term unemployed people are required to participate, with providers being expected to bring a different and refreshed energy and approach for these job seekers
Specified early entrant groups that are Government policy priorities, including:
o ex-offenderso ex-carerso homeless peopleo ex-HM Armed Forces personnelo partners of current or former Armed Forces personnelo people for whom a drug or alcohol dependency presents a significant barrier to
employment.
People with disability can also volunteer to join the programme at any time.
Servicing is limited to 15 months unless the client is tracking towards a sustained job outcome (21 months is the maximum possible period of assistance). Job seekers return to Jobcentre Plus services if they remain on income support past this time.
9. United States
The United States workforce development system is characterised by a federal-state cooperative structure. Employment services are universally available under federal law and funded from federal budgets; services are provided through local one-stop centres (American Job Centers); state laws determine eligibility for regular unemployment benefits; and local workforce development boards determine eligibility of job seekers for dislocated worker status, based upon federal requirements.
American Job Centers (One-Stop Centers)
American Job Centers (also known as One-Stop Centers) provide a range of assistance to job seekers under one roof. The centres offer training referrals, career counselling, job listings, and other employment-related services. Customers can visit a centre in person or connect to the centre’s information online or through remote access kiosks.
The American Jobs Center System is coordinated by the United States Department of Labour Employment and Training Administration (DOLETA). The amount of Federal Government funding for
the centers is influenced by state-level labour market conditions, with supplements being provided in the event of sudden plant closings and mass layoffs. The centers also receive funding from local partner organisations.
There are currently over 2400 One-Stop Centers across the United States. Annually, 15-22 million people seek services from American Job Centers. Most people visit only once, and around five million people receive some form of employment service. Services are run by local governments, non-government organisations and private companies, with all partners being required to contribute to funding of services and meeting infrastructure costs.
Labour market information systems
America’s Labour Market Information System (ALMIS) provides career and occupational information in a variety of media and formats for use by job seekers, employers and workforce development professionals. The ALMIS is a collaborative effort between the states and the USDOLETA, and comprises federal, state and local components including data collection and analysis, research and information, product development, direct service delivery, technical assistance and capacity building.
ALMIS includes the CareerOneStop web portal that provides a single point of entry to the content contained in the USDOLETA’s E-tools, including:
America’s Job Bank – an electronic vacancy database America’s Talent Bank – an electronic resume database America’ Career Infonet – a database providing users with basic labour market information America’s Service locator.
Types of information provided on the CareerOneStop portal include:
Career advice (self-assessments; career and occupation profiles; career goals and professional development).
Education and training resources (types of training available; sources of funding; training paths for job seekers).
Job search assistance (strategies for job search; networking opportunities; information about job banks and state employment agencies; information no resume and interview preparation; and job search tips).
Links to services offered in the local area (local American Job Centres; employment and training programs; community services; and unemployment benefits available in the state).
Resources for various cohorts and groups, including career changes; veterans, retrenched workers, workers with criminal convictions, entry level workers, older workers, young adults, workers with a disability, businesses, and career advisors.
1 National Employment Services Association (NESA), Employment Services Workforce Survey of Remuneration and Human Resource Management Performance, 2016. nesa.com.au/employment-services-workforce-survey/
2 Australian Institute of Management, Staff Retention Report, 2016.
3 All figures are as at 31 May 2018 and sourced from departmental administrative data, unless otherwise stated.
4 Duration of unemployment (including long-term unemployed) refers to time in employment services and can include those who are working part-time or have had intermittent spells of employment. This differs from the Australian Bureau of Statistics definition, which requires a person to be continuously unemployed and actively looking for work.
5 This is all employment services, not just jobactive.
6 A job seeker may exit jobactive for a variety of reasons, including for employment, moving into study, exiting the labour market, movement into other labour market programs.
7 The population reported here excludes Stream A Volunteer job seekers. The Stream is designated based on the Stream that the job seeker commenced in.
8 For further discussion of recent and projected future trends in the Australian labour market, including in individual industries, see docs.jobs.gov.au/collections/australian-jobs
9Australian Bureau of Statistics (ABS), cat. no. 6202.0 – Labour Force, Australia, May 2018, seasonally adjusted data. abs.gov.au/ausstats/abs%40.nsf/mf/6202.0 .
10 Australian Bureau of Statistics (ABS), cat. no. 6291.0.55.003 – Labour Force, Australia, Detailed, Quarterly, May 2018. abs.gov.au/ausstats/[email protected]/mf/6291.0.55.003
11 Usually requiring a Bachelor degree or a higher level of educational attainment.
12 Usually requiring only Certificate I or secondary education.
13 Australian Bureau of Statistics (ABS), cat. no. 6291.0.55.003 – Labour Force, Australia, Detailed, Quarterly, May 2018, Department of Jobs and Small Business trend. abs.gov.au/ausstats/[email protected]/mf/6291.0.55.003
14 Department of Jobs and Small Business, Employment Projections to May 2022, Labour Market Information Portal, 2017. lmip.gov.au/default.aspx?LMIP/GainInsights/EmploymentProjections
15 Australian Bureau of Statistics (ABS), cat. no. 6227.0 – Education and Work, Australia, May 2017. abs.gov.au/AUSSTATS/[email protected]/Lookup/6227.0Main+Features1May%202017
16 Quality Indicators for Learning and Teaching, 2017 Graduate Outcomes Survey: National Report, 2018. www.qilt.edu.au/about-this-site/graduate-employment
17 Department of Jobs and Small Business, Survey of Employers’ Recruitment Experiences 2016–17.
18 Australian Bureau of Statistics (ABS), cat. no. 6227.0 – Education and Work, Australia, May 2017. abs.gov.au/AUSSTATS/[email protected]/Lookup/6227.0Main+Features1May%202017
19 Department of Jobs and Small Business, Survey of Employers’ Recruitment Experiences 2016–17.
20 Department of Jobs and Small Business, Survey of Employers’ Recruitment Experiences 2016–17.
21 Department of Jobs and Small Business, Employment Projections to May 2022, Labour Market Information Portal, 2017. lmip.gov.au/default.aspx?LMIP/GainInsights/EmploymentProjections
22 Total employment is projected to fall in the Manufacturing; Electricity, Gas, Water and Waste Services; and Agriculture, Forestry
and Fishing industries, though some subsectors of these industries are projected to add skilled jobs. 23 Australian Bureau of Statistics (ABS), cat. no. 6202.0 – Labour Force, Australia, May 2018. abs.gov.au/ausstats/abs%40.nsf/mf/6202.0
24 Australian Bureau of Statistics (ABS), cat. no. 6291.0.55.001 – Labour Force, Australia, Detailed – Electronic Delivery, May 2018. abs.gov.au/ausstats/[email protected]/mf/6291.0.55.001
25 Australian Bureau of Statistics (ABS), cat. no. 6224.0.55.001 – Labour Force, Australia: Labour Force Status and Other Characteristics of Families, June 2017. abs.gov.au/ausstats/[email protected]/mf/6291.0.55.001
26 Australia Bureau of Statistics (ABS), cat. no. 6239.0 - Barriers and Incentives to Labour Force Participation, Australia, July 2016 to June 2017. abs.gov.au/ausstats/abs%40.nsf/mf/6239.0
27 Australian Bureau of Statistics (ABS), cat. no. 6202.0 – Labour Force, Australia, May 2018, seasonally adjusted data. abs.gov.au/ausstats/abs%40.nsf/mf/6202.0
28 Australia Bureau of Statistics (ABS), Census of Population and Housing, August 2016.
29 J. Thomas, J. Barraket, C. Wilson, S. Ewing, T. MacDonald, J. Tucker and E. Rennie, Measuring Australia's Digital Divide: The Australian Digital Inclusion Index 2017, RMIT University, 2017. digitalinclusionindex.org.au/the-index-report/report/
30 Denmark operates as part of a Ghent System, whereby the main responsibility for welfare payments, especially unemployment benefits, is held by trade or labour unions, rather than a government agency. Ghent systems are also used in Finland, Iceland and Sweden.
31 Sweden operates as part of a Ghent System, whereby the main responsibility for welfare payments, especially unemployment benefits, is held by trade or labour unions, rather than a government agency. Ghent systems are also used in Denmark, Finland and Iceland.