next-100 technical design report (tdr). executive summaryshuman/next/tdr_jinst_final.pdf ·...
TRANSCRIPT
NEXT-100 Technical Design Report (TDR). Executive summary
This article has been downloaded from IOPscience. Please scroll down to see the full text article.
2012 JINST 7 T06001
(http://iopscience.iop.org/1748-0221/7/06/T06001)
Download details:
IP Address: 128.3.131.247
The article was downloaded on 06/06/2012 at 20:59
Please note that terms and conditions apply.
View the table of contents for this issue, or go to the journal homepage for more
Home Search Collections Journals About Contact us My IOPscience

2012 JINST 7 T06001
PUBLISHED BY IOP PUBLISHING FOR SISSA MEDIALAB
RECEIVED: April 17, 2012ACCEPTED: May 13, 2012PUBLISHED: June 6, 2012
TECHNICAL REPORT
NEXT-100 Technical Design Report (TDR). Executivesummary
V. Alvarez,a F.I.G.M. Borges,b S. Carcel,a J.M. Carmona,c J. Castel,c J.M. Catala,d
S. Cebrian,c A. Cervera,a D. Chan,e C.A.N. Conde,b T. Dafni,c T.H.V.T. Dias,b J. Dıaz,a
M. Egorov,e R. Esteve,d P. Evtoukhovitch, f L.M.P. Fernandes,b P. Ferrario,a
A.L. Ferreira,g E. Ferrer-Ribas,h E.D.C. Freitas,b V.M. Gehman,e A. Gil,a
I. Giomataris,h A. Goldschmidt,e H. Gomez,c J.J. Gomez-Cadenas,a,1 K. Gonzalez,a
D. Gonzalez-Dıaz,c R.M. Gutierrez,i J. Hauptman, j J.A. Hernando Morata,k
D.C. Herrera,c V. Herrero,d F.J. Iguaz,h I.G. Irastorza,c V. Kalinnikov, f D. Kiang,e
L. Labarga,l I. Liubarsky,a J.A.M. Lopes,b D. Lorca,a M. Losada,i G. Luzon,c
A. Marı,d J. Martın-Albo,a A. Martınez,a T. Miller,e A. Moiseenko, f F. Monrabal,a
C.M.B. Monteiro,b J.M. Monzo,c F.J. Mora,c L.M. Moutinho,g J. Munoz Vidal,a
H. Natal da Luz,b G. Navarro,i M. Nebot,a D. Nygren,e C.A.B. Oliveira,e,g R. Palma,m
J. Perez,n J.L. Perez Aparicio,m J. Renner,e L. Ripoll,o A. Rodrıguez,c J. Rodrıguez,a
F.P. Santos,b J.M.F. dos Santos,b L. Segui,c L. Serra,a D. Shuman,e C. Sofka,p
M. Sorel,a J.F. Toledo,d A. Tomas,c J. Torrent,o Z. Tsamalaidze, f D. Vazquez,k
E. Velicheva, f J.F.C.A. Veloso,g J.A. Villar,c R.C. Webb,p T. Weber,e J. Whitep andN. Yahlalia
aInstituto de Fısica Corpuscular (IFIC), CSIC & Universitat de Valencia,Calle Catedratico Jose Beltran, 2, 46980 Paterna, Valencia, Spain
bDepartamento de Fisica, Universidade de Coimbra,Rua Larga, 3004-516 Coimbra, Portugal
cLaboratorio de Fısica Nuclear y Astropartıculas, Universidad de Zaragoza,Calle Pedro Cerbuna, 12, 50009 Zaragoza, Spain
dInstituto de Instrumentacion para Imagen Molecular (I3M), Universitat Politecnica de Valencia,Camino de Vera, s/n, Edificio 8B, 46022 Valencia, Spain
eLawrence Berkeley National Laboratory (LBNL),1 Cyclotron Road, Berkeley, California 94720, U.S.A.
f Joint Institute for Nuclear Research (JINR),Joliot-Curie 6, 141980 Dubna, Russia
1Corresponding author.
c© 2012 IOP Publishing Ltd and Sissa Medialab srl doi:10.1088/1748-0221/7/06/T06001
2012 JINST 7 T06001
gInstitute of Nanostructures, Nanomodelling and Nanofabrication (i3N), Universidade de Aveiro,Campus de Santiago, 3810-193 Aveiro, Portugal
hIRFU, Centre d’Etudes Nucleaires de Saclay (CEA-Saclay),91191 Gif-sur-Yvette, France
iCentro de Investigaciones en Ciencias Basicas y Aplicadas, Universidad Antonio Narino,Carretera 3 este No. 47A-15, Bogota, Colombia
jDepartment of Physics and Astronomy, Iowa State University,12 Physics Hall, Ames, Iowa 50011-3160, U.S.A.
kInstituto Gallego de Fısica de Altas Energıas (IGFAE), Univ. de Santiago de Compostela,Campus sur, Rua Xose Marıa Suarez Nunez, s/n, 15782 Santiago de Compostela, Spain
lDepartamento de Fısica Teorica, Universidad Autonoma de Madrid,Campus de Cantoblanco, 28049 Madrid, Spain
mDpto. de Mecanica de Medios Continuos y Teorıa de Estructuras, Univ. Politecnica de Valencia,Camino de Vera, s/n, 46071 Valencia, Spain
nInstituto de Fısica Teorica (IFT), UAM/CSIC,Campus de Cantoblanco, 28049 Madrid, Spain
oEscola Politecnica Superior, Universitat de Girona,Av. Montilivi, s/n, 17071 Girona, Spain
pDepartment of Physics and Astronomy, Texas A&M University,College Station, Texas 77843-4242, U.S.A.
E-mail: [email protected]
ABSTRACT: In this Technical Design Report (TDR) we describe the NEXT-100 detector that willsearch for neutrinoless double beta decay (ββ0ν) in 136Xe at the Laboratorio Subterraneo de Can-franc (LSC), in Spain. The document formalizes the design presented in our Conceptual DesignReport (CDR): an electroluminescence time projection chamber, with separate readout planes forcalorimetry and tracking, located, respectively, behind cathode and anode. The detector is designedto hold a maximum of about 150 kg of xenon at 15 bar, or 100 kg at 10 bar. This option builds inthe capability to increase the total isotope mass by 50% while keeping the operating pressure at amanageable level.
The readout plane performing the energy measurement is composed of Hamamatsu R11410-10 photomultipliers, specially designed for operation in low-background, xenon-based detectors.Each individual PMT will be isolated from the gas by an individual, pressure resistant enclosureand will be coupled to the sensitive volume through a sapphire window. The tracking plane consistsin an array of Hamamatsu S10362-11-050P MPPCs used as tracking pixels. They will be arrangedin square boards holding 64 sensors (8× 8) with a 1-cm pitch. The inner walls of the TPC, thesapphire windows and the boards holding the MPPCs will be coated with tetraphenyl butadiene(TPB), a wavelength shifter, to improve the light collection.
KEYWORDS: Detector design and construction technologies and materials; Time projection cham-bers
ARXIV EPRINT: 1202.0721
2012 JINST 7 T06001
Contents
1 Introduction 1
2 Neutrinoless double beta decay searches 2
3 The NEXT concept 33.1 Development of the NEXT project: R&D and prototypes 53.2 The NEXT-100 detector 6
4 The pressure vessel 8
5 The field cage 11
6 The tracking plane 13
7 The energy plane 15
8 Front-end electronics and DAQ 178.1 Electronics for the energy plane 188.2 Electronics for the tracking plane 188.3 Trigger electronics 21
9 Shielding 21
10 Gas system 21
11 NEXT-100 at the LSC 24
12 Background model 2512.1 Sources of background in NEXT 2512.2 Radioactive budget of NEXT-100 2712.3 Expected background rate in NEXT-100 27
13 Summary and outlook 29
1 Introduction
Neutrinoless double beta decay (ββ0ν) is a hypothetical, very slow nuclear transition in which twoneutrons undergo β -decay simultaneously and without the emission of neutrinos. The importanceof this process goes beyond its intrinsic interest: an unambiguous observation would establish that
– 1 –
2012 JINST 7 T06001
neutrinos are Majorana particles — that is to say, truly neutral particles identical to their antiparti-cles — and prove that total lepton number is not a conserved quantity in nature.
After 70 years of experimental effort, no compelling evidence for the existence of ββ0ν hasbeen obtained. A new generation of experiments that are already running or about to run promisesto push forward the current limits exploring the degenerate region of neutrino masses (see [1] fora recent review of the field). In order to do that, the experiments are using masses of ββ iso-tope ranging from tens of kilograms to several hundreds, and will need to improve the backgroundrates achieved by previous experiments by, at least, an order of magnitude. If no signal is found,masses in the ton scale and further background reduction will be required. Only a few of thenew-generation experiments can possibly be extrapolated to those levels.
The Neutrino Experiment with a Xenon TPC (NEXT) will search for neutrinoless double betadecay in 136Xe. A xenon gas time projection chamber offers scalability to large masses of ββ iso-tope and a background rate among the lowest predicted for the new generation of experiments [1],stemming from a radiopure setup and the tracking capabilities of the detector. The NEXT exper-iment was proposed to the Laboratorio Subterraneo de Canfranc (LSC), Spain, in 2009 [2], witha source mass of the order of 100 kg. Three years of intense R&D have resulted in a ConceptualDesign Report (CDR) [3] and a Technical Design Report (TDR), summarized in this document,where the final design of the NEXT-100 detector is defined. More detailed reports on the design ofthe different subsystems will be forthcoming.
2 Neutrinoless double beta decay searches
Double beta decay (ββ ) is a very rare nuclear transition in which a nucleus with Z protons decaysinto a nucleus with Z + 2 protons and same mass number A. It can only be observed in thoseisotopes where the decay to the Z +1 isobar is forbidden or highly suppressed. Two decay modesare usually considered:
• The standard two-neutrino mode (ββ2ν), consisting in two simultaneous beta decays,(A,Z)→ (A,Z +2)+2 e−+2 νe, which has been observed in several isotopes with typicalhalf-lives in the range of 1018–1021 years (see, for instance, [1] and references therein).
• The neutrinoless mode (ββ0ν), (A,Z)→ (A,Z + 2)+ 2 e−, which violates lepton-numberconservation, and is therefore forbidden in the Standard Model of particle physics. An ob-servation of ββ0ν would prove that neutrinos are massive, Majorana particles [4]. TheHeidelberg-Moscow experiment set the most sensitive limit to the half-life of ββ0ν so far:T 0ν
1/2(76Ge) ≥ 1.9×1025 years (90% CL) [5]. In addition, a subgroup of the experiment ob-
served evidence of a positive signal, with a best value for the half-life of 1.5×1025 years [6].The claim was very controversial [7], and still awaits an experimental response.
The implications of experimentally establishing the existence of ββ0ν would be profound.First, it would demonstrate that total lepton number is violated in physical phenomena, an obser-vation that could be linked to the cosmic asymmetry between matter and antimatter through theprocess known as leptogenesis [8, 9]. Second, a Majorana nature for the neutrino, in contrast tothe Dirac nature of the other Standard Model fermions, may explain the smallness of neutrinomasses [1].
– 2 –
2012 JINST 7 T06001
Several underlying mechanisms — involving, in general, physics beyond the Standard Model— have been proposed for ββ0ν , the simplest one being the virtual exchange of light Majorananeutrinos. Assuming this to be the dominant one at low energies, the half-life of ββ0ν can bewritten as
(T 0ν
1/2)−1 = G0ν
∣∣M0ν∣∣2 m2
ββ. (2.1)
In this equation, G0ν is an exactly-calculable phase-space integral for the emission of two electrons;M0ν is the nuclear matrix element of the transition, that has to be evaluated theoretically; and mββ
is the effective Majorana mass of the electron neutrino:
mββ =∣∣∣∑
iU2
ei mi
∣∣∣ , (2.2)
where mi are the neutrino mass eigenstates and Uei are elements of the neutrino mixing matrix.Therefore a measurement of the ββ0ν decay rate would provide direct information on neutrinomasses [1].
The detectors used in double beta decay experiments are designed to measure the energy ofthe radiation emitted by a ββ source. In the case of ββ0ν , the sum of the kinetic energies ofthe two released electrons is always the same, and corresponds to the mass difference between theparent and the daughter nuclei: Qββ ≡M(Z,A)−M(Z + 2,A). However, due to the finite energyresolution of any detector, ββ0ν events are reconstructed within a non-zero energy range centeredaround Qββ , typically following a gaussian distribution. Other processes occurring in the detectorcan fall in that region of energies, thus becoming a background and compromising drastically theexperiment’s expected sensitivity to mββ [10].
All double beta decay experiments have to deal with an intrinsic background, the ββ2ν , thatcan only be suppressed by means of good energy resolution. Backgrounds of cosmogenic ori-gin force the underground operation of the detectors. Natural radioactivity emanating from thedetector materials and surroundings can easily overwhelm the signal peak, and consequently care-ful selection of radiopure materials is essential. Additional experimental signatures that allow thedistinction of signal and background are a bonus to provide a robust result.
3 The NEXT concept
New-generation double beta decay experiments have to be sensitive to lifetimes longer than 1025
years (or, equivalently, effective Majorana neutrino masses smaller than 100 meV). Designing a de-tector capable of identifying efficiently and unambiguously such a rare signal is a major experimen-tal challenge. Consequently, many different techniques have been proposed, each one with its prosand cons. In order to compare them, a figure of merit, the sensitivity to mββ , is typically used [10]:
mββ ∝√
1/ε
(b ∆EM t
)1/4
, (3.1)
where ε is the signal detection efficiency, M is the ββ isotope mass used in the experiment, t is thedata-taking time, ∆E is the energy resolution and b is the background rate in the region of interestaround Qββ (usually expressed in terms of counts per kg of ββ isotope, year and keV).
– 3 –

2012 JINST 7 T06001
Some experiments, such as the germanium calorimeters or the bolometers, emphasize the en-ergy resolution and the detection efficiency; other, like the separate-source trackers, use event kine-matical information to discriminate signal and background, thus obtaining very low backgroundrates. The NEXT experiment combines good energy resolution, a low background rate and thepossibility to scale-up the detector to large masses of ββ isotope by using a high-pressure xenongas (HPXe) electroluminescent time projection chamber (TPC) to search for ββ0ν in 136Xe. Thecombination results in excellent sensitivity to mββ . For a total exposure of 500 kg·year, the sensi-tivity is better than 100 meV. This sensitivity can match or outperform that of the best experimentsin the field [10].
Xenon is a suitable detection medium that provides both scintillation and ionization signals.In its gaseous phase, xenon can provide high energy resolution, better than 0.5% at 2500 keV [11].Two naturally-occurring isotopes of xenon can decay ββ , 134Xe (Qββ = 825 keV) and 136Xe(Qββ = 2458 keV). The latter, having a higher Q-value, is preferred for neutrinoless double betadecay searches because the decay rate is proportional to Q5
ββand the radioactive backgrounds are
less abundant at higher energies. The two-neutrino decay mode of 136Xe is slow, ∼ 2.3× 10²¹
years [12, 13], and hence the experimental requirement for good energy resolution is less stringentthan for other ββ sources. 136Xe constitutes 8.86% of all natural xenon, but the enrichment processis relatively simple and cheap compared to that of other ββ isotopes, thus making 136Xe the mostobvious candidate for a future multi-ton experiment. Also, xenon, unlike other ββ sources, has nolong-lived radioactive isotopes that could become a background.
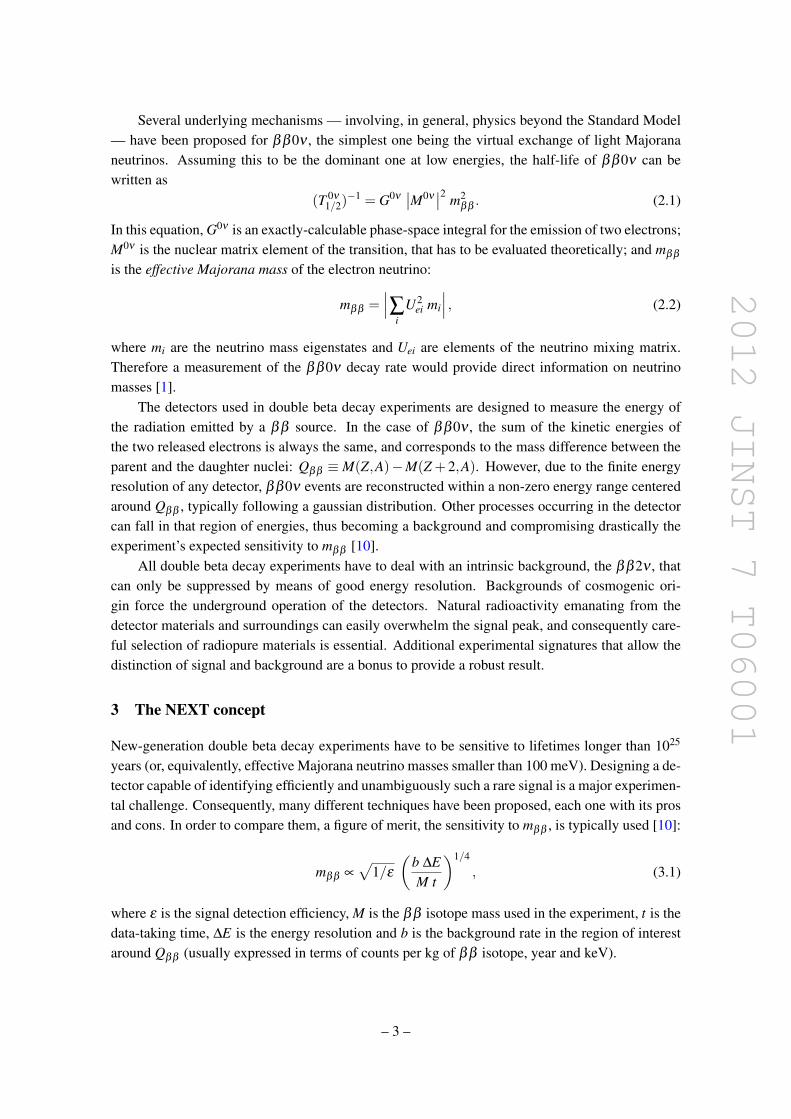
Neutrinoless double beta decay events leave a distinctive topological signature in gaseousxenon: an ionization track, about 30 cm long at 10 bar, tortuous due to multiple scattering, and withlarger energy depositions at both ends (see figure 1). The Gotthard experiment [14], consisting in asmall xenon gas TPC (5.3 kg enriched to 68% in 136Xe) operated at 5 bar, proved the effectivenessof such a signature to discriminate signal from background.
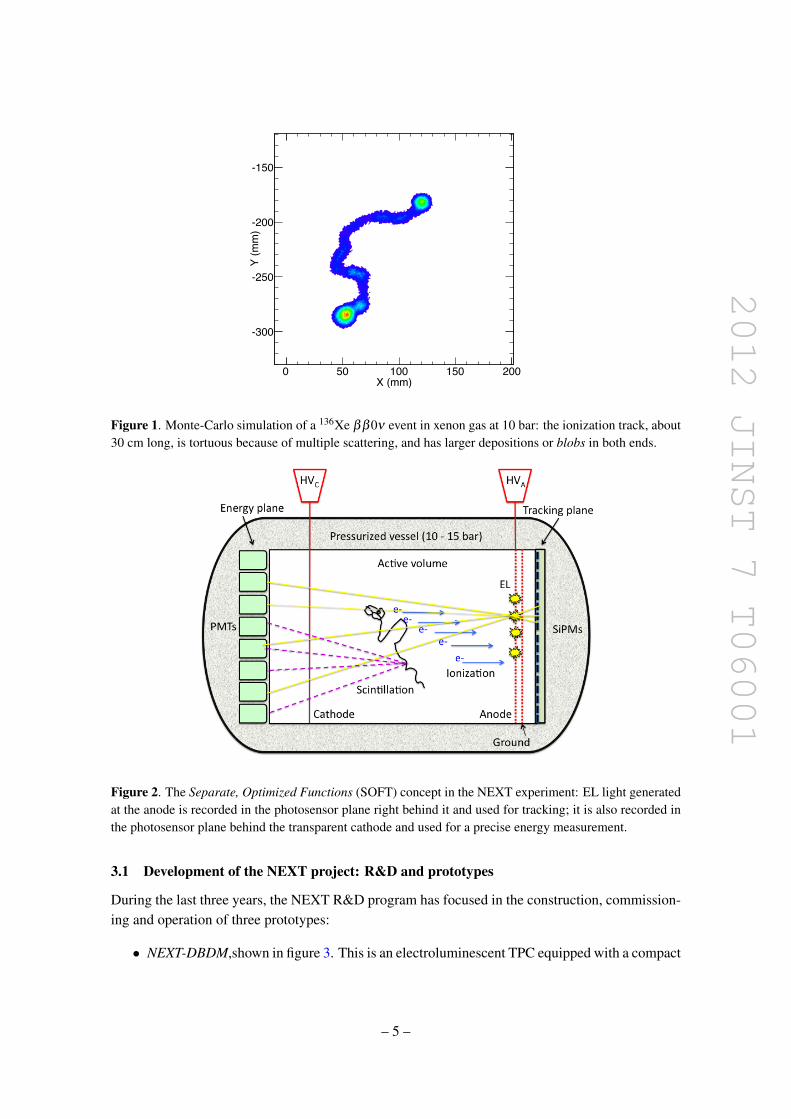
To achieve optimal energy resolution, the ionization signal is amplified in NEXT using theelectroluminescence (EL) of xenon. Also, following ideas introduced in [11] and further devel-oped in our Letter of Intent [2] and CDR [3], the chamber will have separated detection systems fortracking and calorimetry. This is the so-called SOFT concept, illustrated in figure 2. The detectionprocess is as follows: Particles interacting in the HPXe transfer their energy to the medium throughionization and excitation. The excitation energy is manifested in the prompt emission of VUV(∼ 178 nm) scintillation light. The ionization tracks (positive ions and free electrons) left behindby the particle are prevented from recombination by an electric field (0.3–0.5 kV/cm). The ion-ization electrons drift toward the TPC anode, entering a region, defined by two highly-transparentmeshes, with an even more intense electric field (3 kV/cm/bar). There, further VUV photons aregenerated isotropically by electroluminescence. Therefore both scintillation and ionization producean optical signal, to be detected with a sparse plane of PMTs (the energy plane) located behind thecathode. The detection of the primary scintillation light constitutes the start-of-event, whereas thedetection of EL light provides an energy measurement. Electroluminescent light provides trackingas well, since it is detected also a few millimeters away from production at the anode plane, via anarray, 1 cm pitch, of 1-mm2 MPPCs (the tracking plane).
– 4 –
2012 JINST 7 T06001
X (mm)0 50 100 150 200
Y (
mm
)
-300
-250
-200
-150
Figure 1. Monte-Carlo simulation of a 136Xe ββ0ν event in xenon gas at 10 bar: the ionization track, about30 cm long, is tortuous because of multiple scattering, and has larger depositions or blobs in both ends.
Figure 2. The Separate, Optimized Functions (SOFT) concept in the NEXT experiment: EL light generatedat the anode is recorded in the photosensor plane right behind it and used for tracking; it is also recorded inthe photosensor plane behind the transparent cathode and used for a precise energy measurement.
3.1 Development of the NEXT project: R&D and prototypes
During the last three years, the NEXT R&D program has focused in the construction, commission-ing and operation of three prototypes:
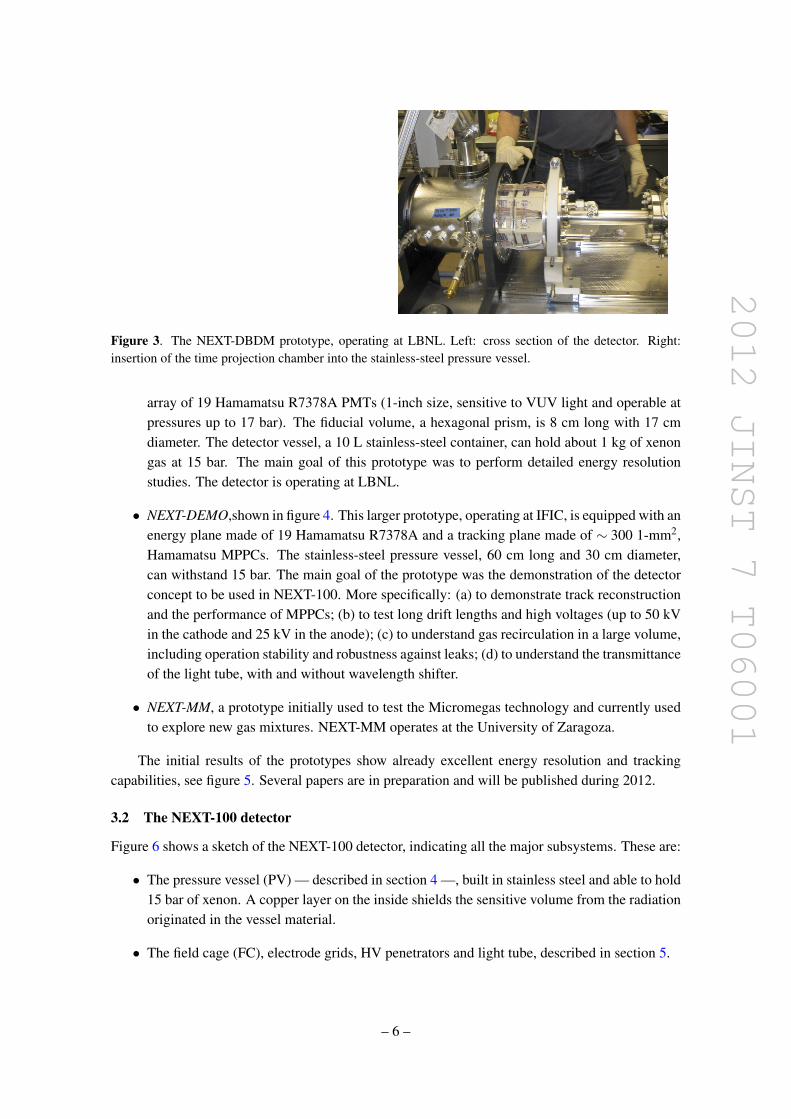
• NEXT-DBDM,shown in figure 3. This is an electroluminescent TPC equipped with a compact
– 5 –
2012 JINST 7 T06001
Figure 3. The NEXT-DBDM prototype, operating at LBNL. Left: cross section of the detector. Right:insertion of the time projection chamber into the stainless-steel pressure vessel.
array of 19 Hamamatsu R7378A PMTs (1-inch size, sensitive to VUV light and operable atpressures up to 17 bar). The fiducial volume, a hexagonal prism, is 8 cm long with 17 cmdiameter. The detector vessel, a 10 L stainless-steel container, can hold about 1 kg of xenongas at 15 bar. The main goal of this prototype was to perform detailed energy resolutionstudies. The detector is operating at LBNL.
• NEXT-DEMO,shown in figure 4. This larger prototype, operating at IFIC, is equipped with anenergy plane made of 19 Hamamatsu R7378A and a tracking plane made of ∼ 300 1-mm2,Hamamatsu MPPCs. The stainless-steel pressure vessel, 60 cm long and 30 cm diameter,can withstand 15 bar. The main goal of the prototype was the demonstration of the detectorconcept to be used in NEXT-100. More specifically: (a) to demonstrate track reconstructionand the performance of MPPCs; (b) to test long drift lengths and high voltages (up to 50 kVin the cathode and 25 kV in the anode); (c) to understand gas recirculation in a large volume,including operation stability and robustness against leaks; (d) to understand the transmittanceof the light tube, with and without wavelength shifter.
• NEXT-MM, a prototype initially used to test the Micromegas technology and currently usedto explore new gas mixtures. NEXT-MM operates at the University of Zaragoza.
The initial results of the prototypes show already excellent energy resolution and trackingcapabilities, see figure 5. Several papers are in preparation and will be published during 2012.
3.2 The NEXT-100 detector
Figure 6 shows a sketch of the NEXT-100 detector, indicating all the major subsystems. These are:
• The pressure vessel (PV) — described in section 4 —, built in stainless steel and able to hold15 bar of xenon. A copper layer on the inside shields the sensitive volume from the radiationoriginated in the vessel material.
• The field cage (FC), electrode grids, HV penetrators and light tube, described in section 5.
– 6 –

2012 JINST 7 T06001
Figure 4. The NEXT-DEMO prototype, operating at IFIC. Left: the pressure vessel. Right: the timeprojection chamber.
light output similar to the 662 keV full energy events, a point spread functionof about 6 mm radius is measured. Therefore cutting harder on the radialposition of events does not reduce render an improved fiducialization of teevents.
Fig. 3 shows a high statistics spectrum with a full energy peak, a Comp-ton continuum and edge, a backscattering peak and a xenon x-rays peak andescape peak.
Total Calibrated S2 Charge (keV)0 100 200 300 400 500 600 700 800
)-1
Counts
(ke
V
0
50
100
150
200
250
300
Figure 3: Measured energy spectrum for 662 keV gammas: This spectrum wastaken at a 15.5 atm pressure with E/P of 1.95 kV/(cm atm) in teh EL region and 775V/cm in the drift region.
In addition, we have obtained 4.7% FWHM for 59.4 keV gamma raysfrom 241Am at 10 Atm (see Fig. 5 and 6).
The hot getter was added to the system to better control the TPC per-formance by eliminating the residual N2 from the gas which a↵ects the driftvelocity and could potentially also have an electron attachment e↵ect. How-ever, the removal of N2 had the unintended consequence of reducing the lightyield in the chamber (the number of SPEs detected per ionization electron).A light yield reduction of about 60% was observed for similar TPC fields andpressure. The light yield reduction has been compensated by a subtantialincrease in the maximum E/P we were able to achieve by gradual chamber
3
Figure 5. Left: Energy spectrum of 137Cs measured by NEXT-DBDM using a calibration source. Thephotoelectric peak at 662 keV is measured with a resolution close to 1% FWHM [15]. This extrapolates to∼0.5% FWHM at the energy of the Qββ of 136Xe. Right: The reconstructed track left by a photoelectricelectron produced by the interaction of a 662-keV gamma (from a 137Cs calibration source) detected byNEXT-DEMO. Abscises and ordinates represent the transverse coordinates of the chamber; the color scaleindicates energy. The line connects points (central values) successively reconstructed in time; the associateduncertainty (of the order of 5–10 millimeters) is not shown here.
• The tracking plane (TP) made of MPPCs arranged into dice boards (DB). The front-endelectronics is inside the gas, shielded behind a thick copper plate (section 6).
• The energy plane (EP) made of PMTs housed in copper enclosures (section 7).
• The lead castle that shields the detector against external γ-rays, described in section 9.
– 7 –

2012 JINST 7 T06001
NEXT-100 Pressure Vessel Detector Overall Cross Section
Main Cylindrical VesselTorispheric Heads
Energy Plane, PMTsCu Shield
PMT FTs
Vac. Manifold
HV/Press. relief/Flow/Vac. PortsHV Cable Cu Shield Bars
F.C. InsulatorField Cage Rings
Reflectors
Shielding, External, Cu on Pb
EL mesh planes
EL HV F.T.Cathode Tracking Plane, SiPM
Cu Shield
D. Shuman (LBNL) NEXT-100 Pressure Vessel, Nov. 1, 2011 November 2, 2011 13 / 20
Figure 6. The NEXT-100 detector.
In addition, the electronics and data-acquisition system are outlined in section 8; the xenongas system is described in section 10; section 11 deals with the installation of the detector at theLSC; and the background model of NEXT-100 is discussed in section 12.
4 The pressure vessel
The pressure vessel (PV) consists of a cylindrical center section (barrel) with two identical tori-spheric heads on each end, their main flanges bolted together. The vessel orientation is horizontal,so as to minimize the overall height; this reduces the outer shielding cost and allows essentially un-limited length on each end for cabling and service expansion. Table 1 collects the basic parametersand dimensions of the PV, and a longitudinal cross section is shown in figure 7.
The vessel will be made of stainless steel, specifically the low-activity 316Ti alloy, unlesssimilarly low activity 304L or 316L alloys can be found which will allow use of roll forgings forthe flanges (these promise better leak tightness and mechanical integrity). Measurements by theXENON collaboration show that it is possible to secure 316Ti with an activity at the level of 0.2mBq/kg for the thorium series and 1.3 mBq/kg for the uranium series [16]. The mass of the PV is1 200 kg, resulting in a total activity of about 1.6 Bq for the uranium series. To shield this activitywe introduce an inner copper shield (ICS) 12 cm thick and made of radiopure copper, with anactivity of about 5–10 µBq/kg. The ICS will attenuate the radiation coming from the external de-tector (including the PV and the external lead shield) by a factor of 100. After the ICS the residualactivity due to the PV is about 0.02 Bq. One needs to add the residual activity of the ICS itself
– 8 –

2012 JINST 7 T06001
Table 1. NEXT-100 pressure vessel basic parameters and dimensions (some of these quantities could changeslightly during the construction phase due to refinements in the design).
Maximum operating pressure (differential) 14.0 barMaximum allowable working pressure (differential) 15.4 barMaximum allowable external pressure (differential) 1.5 barInner diameter 136 cmOuter diameter, barrel and heads 138 cmOuter diameter, main flanges 147 cmLength, head to head, inside 228 cmThickness, barrel and head wall 10 mmThickness, main flanges (each side) 4.0 cmNumber of bolts, main flanges, each set 140Bolt diameter, main flanges 14 mmBolt length, main flanges 11 cmMass, pressure vessel 1 200 kgMass, internal copper shielding (including heads) 10 000 kgMass, energy plane 750 kgMass, field cage 250 kgMass, tracking plane 300 kgMass, NEXT-100 total 12 500 kg
Figure 7. Pressure Vessel/Detector: side cross section view.
– 9 –

2012 JINST 7 T06001
which is, taking into account self-shielding, of the order of 0.03 Bq. Thus, the resulting activity ofthe whole system is ∼ 0.05 Bq.
The PV supports a number of internal components on the main flanges; nothing is supporteddirectly on the 10 mm thick shell. The barrel flanges have an inside flange containing a circle of240 M8 threaded holes. The internal copper shield bars attach on each end to these internal flanges;in turn these bars have machined features which then support the field cage and the sensor planes.The heads also have an internal flange; to these are fastened the internal copper shield plates. Thecathode plane high voltage feedthrough is integrated into the energy head and makes contact withthe cathode plane when the head is assembled.
Both heads have four axial nozzles, each with a 100 mm outer diameter and a 150 mm diameterflange. The central nozzle of each head is for services (power and signal cabling) to the sensorplanes. The two auxiliary nozzles on each side of this are for gas flow and pressure relief; atpresent only one on each head is used. The fourth nozzle, located furthest from the vessel axis, isused for the high voltage feedthrough of the cathode plane. To keep heads identical, one will bepresent, but capped off on the tracking head, to allow for future reconfiguration. All these axialnozzles are located on the vertical midplane of the vessel; this allows the two lead shielding wallsto come together at this midplane by making semicircular cutouts on their mating surfaces. Thereis also a ring of eight radial nozzles, located at the EL gap. Two of these (one on top, and one ata 45 deg angle) are for the EL gate high voltage feedthrough (2 possible locations) and the other 6are inspection ports for the EL gap; they may prove useful for EL diagnostics and in-situ cleaningor repair. All nozzles will be as short as possible, with simple flat-faced flanges. This is to reducevessel damage risk, to ease fabrication, and to preserve flexibility in length; extension spools areused to bring services out through the shielding. Nozzle flanges, although being flat-faced (with thedouble O-rings on the spools and caps) use standard CF flange bolt hole pattern; this is to preservethe possibility of using CF components (pressure rated). These could be pre-assembled to doubleO-ring/CF adapter plates, then pressure and leak tested prior to assembling on the nozzle.
All pressure sealing flange joints that are exposed to atmosphere on the outside are sealedusing double O-rings in grooves, for both sealing reliability, and to minimize the flange and boltsizes. The inner O-ring is for pressure sealing; the outer O-ring serves not only as a backup, butalso to create a sealed annulus which can be continuously monitored for leakage by pulling a vac-uum on it with an RGA monitor (sense port). Xenon will permeate through these O-rings and willneed to be recovered in a cold trap. The total amount is estimated to be < 200 gram/year for butylor nitrile O-rings; this includes the nozzle flanges and PMT enclosure O-ring leakage. The useof metal C-ring gaskets (special low force design) is being explored. The standard sealing forcefor these gaskets is very high and greatly increases flange thickness and diameter. The pressurevessel flanges are being designed with some reserve capacity for the higher bolt force that wouldbe required for these low force metal gaskets.
The head to vessel flange bolts are Inconel 718; this is the highest strength noncorrosive bolt-ing material allowed in the ASME code. Flange thickness and outer diameter are substantiallyminimized by using the highest possible strength bolting; this mostly compensates for the lowerradiopurity of this material (relative to Inconel 625, the next best alloy) and saves on externalshielding cost.
– 10 –

2012 JINST 7 T06001
Saddle supports will be welded to the barrel wall, as is standard practice. The barrel will bebolted through the shielding floor to the seismic platform below. The head/shield assemblies willfirst be attached to a precisely adjustable 6-strut support fixture, also known as a hexapod or Stewartplatform. This is a cradle support ring for the head which is connected to a baseplate by adjustablelength turnbuckle struts, forming a kinematic mount. This fixture is attached to a set of linear ballbearing carriages that slide on precision rails that are bolted to the shielding floor when needed.There is 1 m carriage travel to allow each head to be retracted far enough to clear the sensor planesinside. The 6-strut fixture is easily adjusted by hand to mate the head flanges to the barrel flangeswith very high precision, whereby they can be bolted together without stress. The adjustments areessentially independent for the three degrees of translation and for roll and yaw about the vesselaxis. The pitch adjustment is coupled only with the Z translation (along the axis) which is easyto deal with since this is also the rail motion direction. This 6-strut fixture will also be used toassemble the PMT and SiPM arrays to their attachment points in the barrel.
The vessel will be built strictly to ASME Pressure Vessel Design Code, section VIII. It hasbeen designed almost entirely by the Collaboration; the outside fabricator will be required how-ever to supply additional details of fabrication, such as weld design, for approval, as these can bedependent on the in-house capabilities. The fabricator is also responsible for pressure integrity,under ASME rules, and will likely perform their own calculations to verify soundness of design.The Collaboration will be specifying many aspects (and approving every aspect) of the design andfabrication, such as: cleaning of joints, weld preparation methods, inspection methods, fabricationsequence, post-weld heat treatments, etc. This is to assure that the unusually high tolerances ondimensions and radiopurity are met, without needing rework.
5 The field cage
The main body of the field cage will be a high-density polyethylene (HDPE) cylindrical shell, 2.5cm thick, that will provide electric insulation from the vessel. Three wire meshes — cathode, gateand anode — separate the two electric electric field regions of the detector (see table 2). The drift re-gion, between cathode and gate, is a cylinder of 107 cm diameter and 130 cm length. Copper stripsattached to the HDPE and connected with low background resistors grade the high voltage. The ELregion, between gate and anode, is 0.5 cm long. There is also a buffer region between the cathodeand the energy plane which will be used to degrade the high voltage in the cathode safely to ground.
Cathode, anode and gate will be similar to the wire meshes used in NEXT-DEMO, shown infigure 8. They were constructed using stainless steel mesh with 30-µm wire diameter and a 0.5 mmwire pitch, which results in an open area of 88%. The grids are formed by clamping in a ring witha tongue and groove to hold the mesh and using a tensioning ring that is torqued with set screws toachieve the optimum tension. For the large diameter required in NEXT-100, preliminary estimatesshow that electrostatic attraction will cause the EL grids to bow considerably; this can be remediedby using a larger gauge wire. For example, wire mesh with a similar open area is available with 90micron wire diameter made from titanium. We are also investigating the use of titanium or coppergrid frames to minimize the radioactive budget. However, the total mass of the EL and HVFT sys-tem is small and the use of low-background steel will be sufficient to keep the radioactive budgetacceptable.
– 11 –

2012 JINST 7 T06001
Table 2. Basic parameters of the electric field regions (drift and EL) of NEXT-100.
Drift field strength 0.3 kV cm−1
EL field strength (E/p) 3.0 kV cm−1 bar−1
Optical gain 2500 photons/e−
Drift length 130 cmEL gap 0.5 cmCathode voltage −58 kVGate grid voltage −22.5 kVAnode grid voltage 0
Figure 8. Detail of the wire meshes used in NEXT-DEMO.
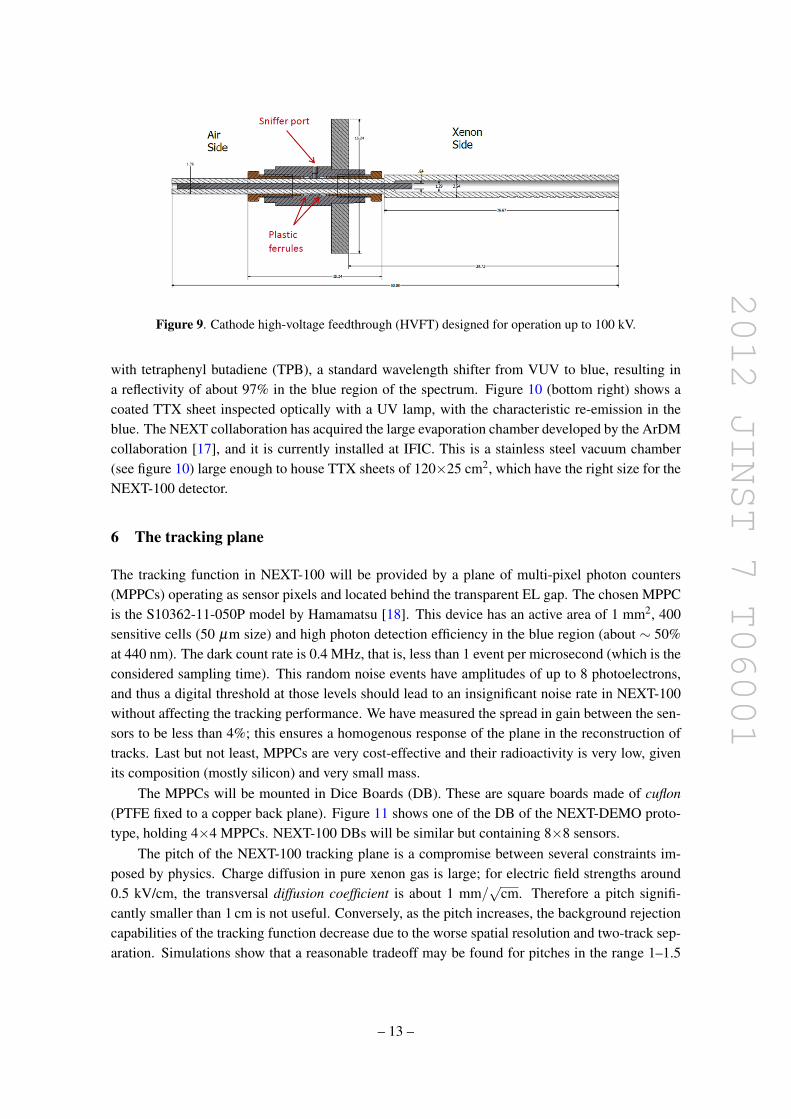
The cathode high voltage feedthrough (HVFT) will be constructed using a compression sealapproach, as illustrated in figure 9. A metal rod is pressed into a plastic tube (Tefzel or FEP, whichhave high dielectric strength) which is then clamped using plastic ferrules from both the pressureside and air side. A sniffer port is placed between the seals to assure that xenon is not leaking. Thefeedthrough will be attached to a flange located on the energy plane end-cap. A shielded cable willbe connected to the feedthrough and placed through the PMT support plate. The unshielded portionof the cable, with an additional resistive coating, will then run along the inside of the buffer fieldrings and mate with the cathode via a spring loaded junction. This approach, with the exception ofthe resistive coating, has been used in NEXT-DEMO, where a cathode voltage of 45 kV has beenachieved. A smaller prototype was tested to 100 kV in vacuum and 70 kV in nitrogen at 3 bar. Ithas been demonstrated to be xenon leak tight at 10 bar and 10-7 mbar vacuum.
To improve the light collection efficiency of the detector, reflector panels coated with a wave-length shifter will cover the inner part of the field cage. We have chosen the solution developedby the ArDM collaboration [17]: sheets of Tetratex R© (TTX) — an aligned polytetrafluoroethylene(PTFE) fibrous cloth with nearly a 100% diffuse Lambertian reflectivity — are vacuum-coated
– 12 –
2012 JINST 7 T06001
Figure 9. Cathode high-voltage feedthrough (HVFT) designed for operation up to 100 kV.
with tetraphenyl butadiene (TPB), a standard wavelength shifter from VUV to blue, resulting ina reflectivity of about 97% in the blue region of the spectrum. Figure 10 (bottom right) shows acoated TTX sheet inspected optically with a UV lamp, with the characteristic re-emission in theblue. The NEXT collaboration has acquired the large evaporation chamber developed by the ArDMcollaboration [17], and it is currently installed at IFIC. This is a stainless steel vacuum chamber(see figure 10) large enough to house TTX sheets of 120×25 cm2, which have the right size for theNEXT-100 detector.
6 The tracking plane
The tracking function in NEXT-100 will be provided by a plane of multi-pixel photon counters(MPPCs) operating as sensor pixels and located behind the transparent EL gap. The chosen MPPCis the S10362-11-050P model by Hamamatsu [18]. This device has an active area of 1 mm2, 400sensitive cells (50 µm size) and high photon detection efficiency in the blue region (about ∼ 50%at 440 nm). The dark count rate is 0.4 MHz, that is, less than 1 event per microsecond (which is theconsidered sampling time). This random noise events have amplitudes of up to 8 photoelectrons,and thus a digital threshold at those levels should lead to an insignificant noise rate in NEXT-100without affecting the tracking performance. We have measured the spread in gain between the sen-sors to be less than 4%; this ensures a homogenous response of the plane in the reconstruction oftracks. Last but not least, MPPCs are very cost-effective and their radioactivity is very low, givenits composition (mostly silicon) and very small mass.
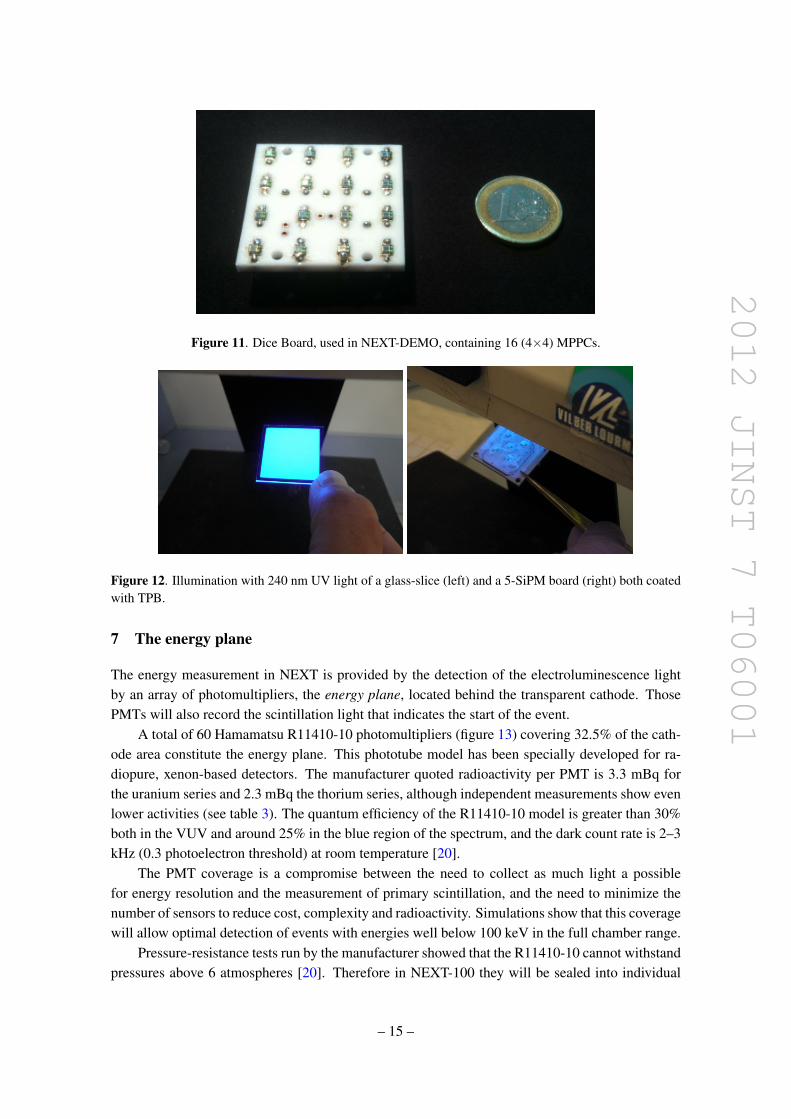
The MPPCs will be mounted in Dice Boards (DB). These are square boards made of cuflon(PTFE fixed to a copper back plane). Figure 11 shows one of the DB of the NEXT-DEMO proto-type, holding 4×4 MPPCs. NEXT-100 DBs will be similar but containing 8×8 sensors.
The pitch of the NEXT-100 tracking plane is a compromise between several constraints im-posed by physics. Charge diffusion in pure xenon gas is large; for electric field strengths around0.5 kV/cm, the transversal diffusion coefficient is about 1 mm/
√cm. Therefore a pitch signifi-
cantly smaller than 1 cm is not useful. Conversely, as the pitch increases, the background rejectioncapabilities of the tracking function decrease due to the worse spatial resolution and two-track sep-aration. Simulations show that a reasonable tradeoff may be found for pitches in the range 1–1.5
– 13 –

2012 JINST 7 T06001
First results
VikuitiTM 3MTM Foils
Optical inspection shining a 3MTM foil with 260nm lamp.
Left with TPB. Right without TPB
TTX on 3M foil with TPB illuminated with a UV
lamp. Piece of TTX above with out TPB
Figure 10. Top: Sketch of the evaporator used in the preparation of the field cage reflectors. Bottomleft: Detail of the evaporator crucibles, where the TPB powder is deposited. The cables used to hold thesamples are also visible. Bottom right: Response of a TTX sheet to VUV light after coating, showing thecharacteristic blue-light emission when illuminated by a UV lamp. In the upper part of the picture, the samefoil without coating can be seen.
cm. While physics performance appears not to degrade too much with pitch in that region, thenumber of pixels decreases with the square of the pitch. A reasonable compromise appears to be1.1 cm, which in turn requires about 7 000 pixels.
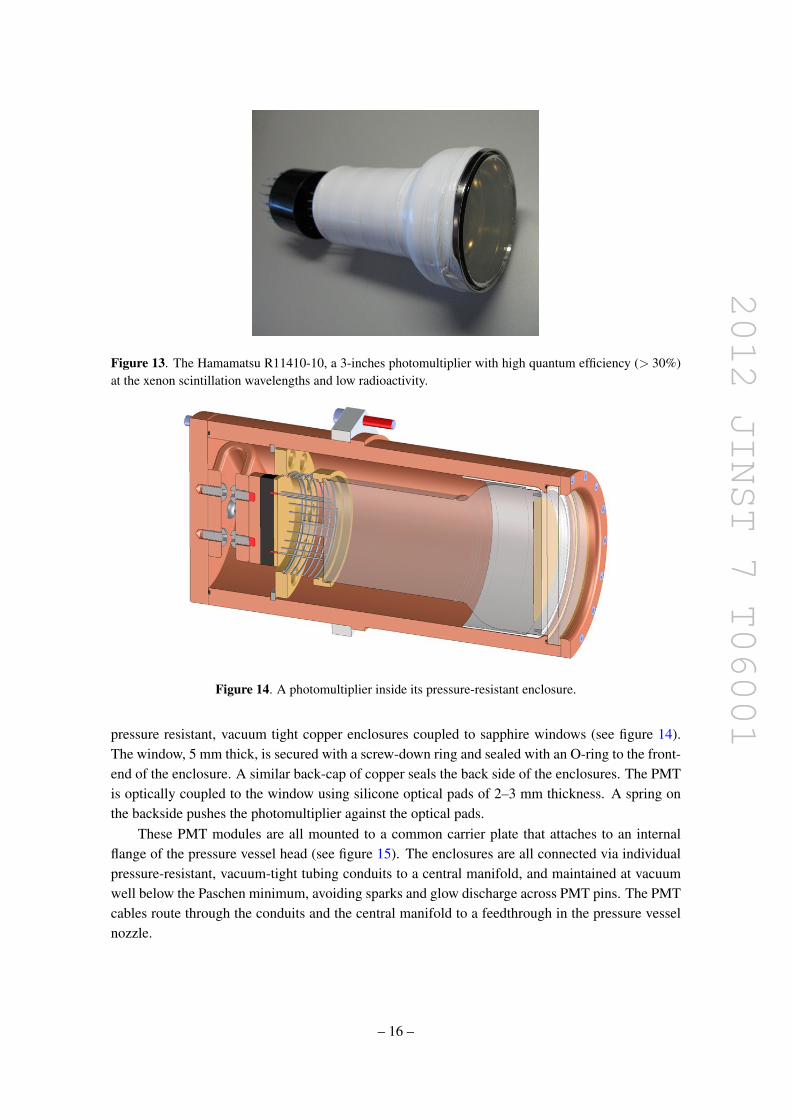
The photon detection efficiency (PDE) of the chosen MPPCs peaks in the blue region of thespectrum, and they are not sensitive below 200 nm, where the emission spectrum of xenon lies.Consequently, the DBs will be coated with tetraphenyl butadiene (TPB). The Collaboration hasdeveloped a procedure to deposit thin layers of TPB by vacuum evaporation [19]. As an illustration,figure 12 shows a glass-slice (left) and a prototype DB (right) coated with TPB and illuminated withUV light at 240 nm, clearly re-emitting in the blue.
– 14 –
2012 JINST 7 T06001
Figure 11. Dice Board, used in NEXT-DEMO, containing 16 (4×4) MPPCs.
Figure 12. Illumination with 240 nm UV light of a glass-slice (left) and a 5-SiPM board (right) both coatedwith TPB.
7 The energy plane
The energy measurement in NEXT is provided by the detection of the electroluminescence lightby an array of photomultipliers, the energy plane, located behind the transparent cathode. ThosePMTs will also record the scintillation light that indicates the start of the event.
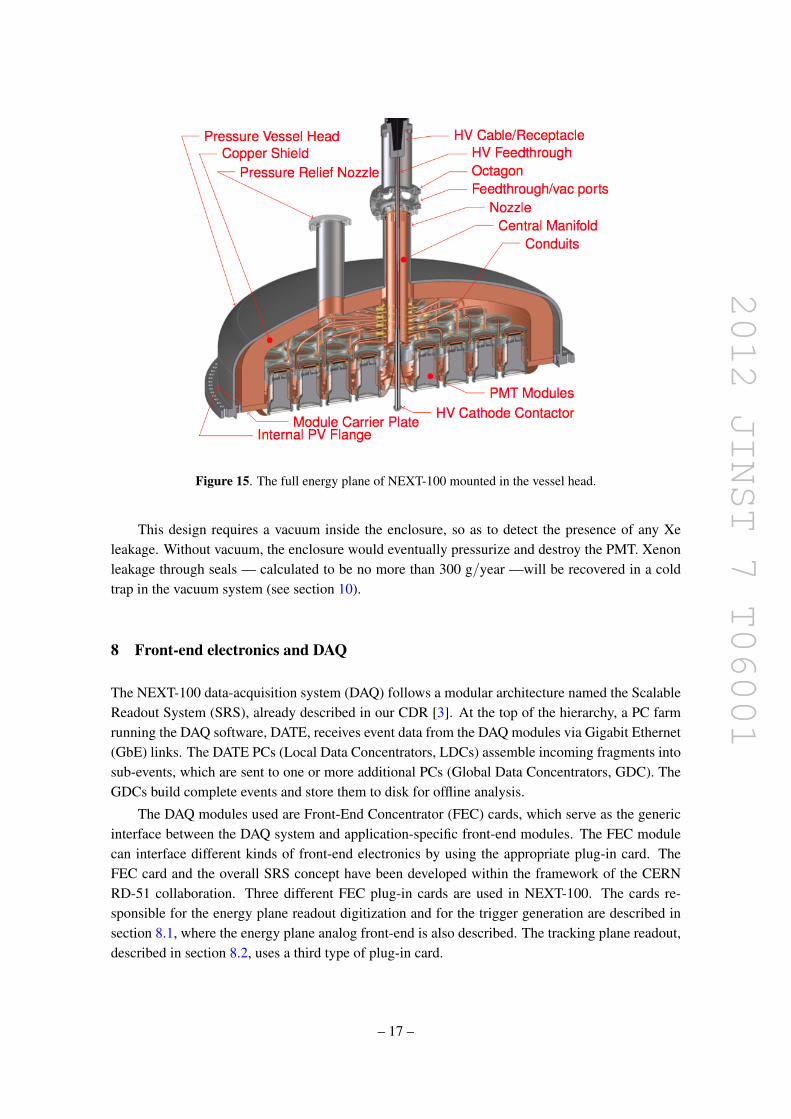
A total of 60 Hamamatsu R11410-10 photomultipliers (figure 13) covering 32.5% of the cath-ode area constitute the energy plane. This phototube model has been specially developed for ra-diopure, xenon-based detectors. The manufacturer quoted radioactivity per PMT is 3.3 mBq forthe uranium series and 2.3 mBq the thorium series, although independent measurements show evenlower activities (see table 3). The quantum efficiency of the R11410-10 model is greater than 30%both in the VUV and around 25% in the blue region of the spectrum, and the dark count rate is 2–3kHz (0.3 photoelectron threshold) at room temperature [20].
The PMT coverage is a compromise between the need to collect as much light a possiblefor energy resolution and the measurement of primary scintillation, and the need to minimize thenumber of sensors to reduce cost, complexity and radioactivity. Simulations show that this coveragewill allow optimal detection of events with energies well below 100 keV in the full chamber range.
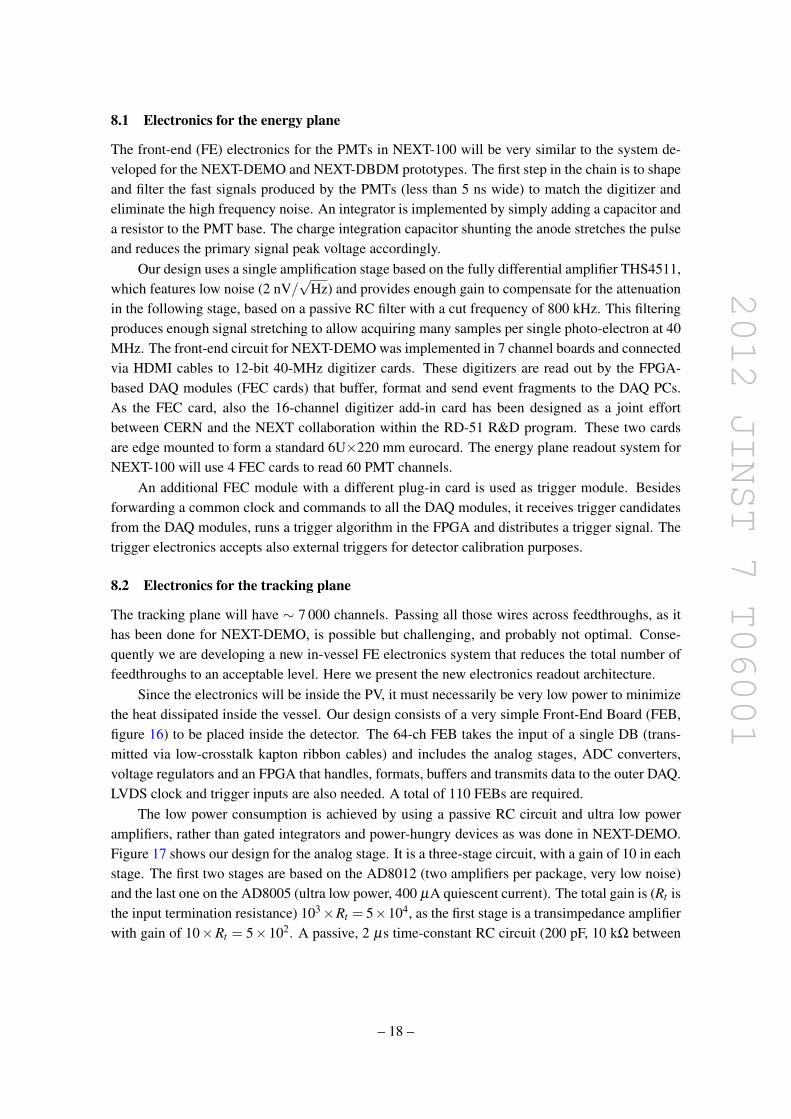
Pressure-resistance tests run by the manufacturer showed that the R11410-10 cannot withstandpressures above 6 atmospheres [20]. Therefore in NEXT-100 they will be sealed into individual
– 15 –
2012 JINST 7 T06001
Figure 13. The Hamamatsu R11410-10, a 3-inches photomultiplier with high quantum efficiency (> 30%)at the xenon scintillation wavelengths and low radioactivity.
Figure 14. A photomultiplier inside its pressure-resistant enclosure.
pressure resistant, vacuum tight copper enclosures coupled to sapphire windows (see figure 14).The window, 5 mm thick, is secured with a screw-down ring and sealed with an O-ring to the front-end of the enclosure. A similar back-cap of copper seals the back side of the enclosures. The PMTis optically coupled to the window using silicone optical pads of 2–3 mm thickness. A spring onthe backside pushes the photomultiplier against the optical pads.
These PMT modules are all mounted to a common carrier plate that attaches to an internalflange of the pressure vessel head (see figure 15). The enclosures are all connected via individualpressure-resistant, vacuum-tight tubing conduits to a central manifold, and maintained at vacuumwell below the Paschen minimum, avoiding sparks and glow discharge across PMT pins. The PMTcables route through the conduits and the central manifold to a feedthrough in the pressure vesselnozzle.
– 16 –
2012 JINST 7 T06001
Figure 15. The full energy plane of NEXT-100 mounted in the vessel head.
This design requires a vacuum inside the enclosure, so as to detect the presence of any Xeleakage. Without vacuum, the enclosure would eventually pressurize and destroy the PMT. Xenonleakage through seals — calculated to be no more than 300 g/year —will be recovered in a coldtrap in the vacuum system (see section 10).
8 Front-end electronics and DAQ
The NEXT-100 data-acquisition system (DAQ) follows a modular architecture named the ScalableReadout System (SRS), already described in our CDR [3]. At the top of the hierarchy, a PC farmrunning the DAQ software, DATE, receives event data from the DAQ modules via Gigabit Ethernet(GbE) links. The DATE PCs (Local Data Concentrators, LDCs) assemble incoming fragments intosub-events, which are sent to one or more additional PCs (Global Data Concentrators, GDC). TheGDCs build complete events and store them to disk for offline analysis.
The DAQ modules used are Front-End Concentrator (FEC) cards, which serve as the genericinterface between the DAQ system and application-specific front-end modules. The FEC modulecan interface different kinds of front-end electronics by using the appropriate plug-in card. TheFEC card and the overall SRS concept have been developed within the framework of the CERNRD-51 collaboration. Three different FEC plug-in cards are used in NEXT-100. The cards re-sponsible for the energy plane readout digitization and for the trigger generation are described insection 8.1, where the energy plane analog front-end is also described. The tracking plane readout,described in section 8.2, uses a third type of plug-in card.
– 17 –
2012 JINST 7 T06001
8.1 Electronics for the energy plane
The front-end (FE) electronics for the PMTs in NEXT-100 will be very similar to the system de-veloped for the NEXT-DEMO and NEXT-DBDM prototypes. The first step in the chain is to shapeand filter the fast signals produced by the PMTs (less than 5 ns wide) to match the digitizer andeliminate the high frequency noise. An integrator is implemented by simply adding a capacitor anda resistor to the PMT base. The charge integration capacitor shunting the anode stretches the pulseand reduces the primary signal peak voltage accordingly.
Our design uses a single amplification stage based on the fully differential amplifier THS4511,which features low noise (2 nV/
√Hz) and provides enough gain to compensate for the attenuation
in the following stage, based on a passive RC filter with a cut frequency of 800 kHz. This filteringproduces enough signal stretching to allow acquiring many samples per single photo-electron at 40MHz. The front-end circuit for NEXT-DEMO was implemented in 7 channel boards and connectedvia HDMI cables to 12-bit 40-MHz digitizer cards. These digitizers are read out by the FPGA-based DAQ modules (FEC cards) that buffer, format and send event fragments to the DAQ PCs.As the FEC card, also the 16-channel digitizer add-in card has been designed as a joint effortbetween CERN and the NEXT collaboration within the RD-51 R&D program. These two cardsare edge mounted to form a standard 6U×220 mm eurocard. The energy plane readout system forNEXT-100 will use 4 FEC cards to read 60 PMT channels.
An additional FEC module with a different plug-in card is used as trigger module. Besidesforwarding a common clock and commands to all the DAQ modules, it receives trigger candidatesfrom the DAQ modules, runs a trigger algorithm in the FPGA and distributes a trigger signal. Thetrigger electronics accepts also external triggers for detector calibration purposes.
8.2 Electronics for the tracking plane
The tracking plane will have ∼ 7 000 channels. Passing all those wires across feedthroughs, as ithas been done for NEXT-DEMO, is possible but challenging, and probably not optimal. Conse-quently we are developing a new in-vessel FE electronics system that reduces the total number offeedthroughs to an acceptable level. Here we present the new electronics readout architecture.
Since the electronics will be inside the PV, it must necessarily be very low power to minimizethe heat dissipated inside the vessel. Our design consists of a very simple Front-End Board (FEB,figure 16) to be placed inside the detector. The 64-ch FEB takes the input of a single DB (trans-mitted via low-crosstalk kapton ribbon cables) and includes the analog stages, ADC converters,voltage regulators and an FPGA that handles, formats, buffers and transmits data to the outer DAQ.LVDS clock and trigger inputs are also needed. A total of 110 FEBs are required.
The low power consumption is achieved by using a passive RC circuit and ultra low poweramplifiers, rather than gated integrators and power-hungry devices as was done in NEXT-DEMO.Figure 17 shows our design for the analog stage. It is a three-stage circuit, with a gain of 10 in eachstage. The first two stages are based on the AD8012 (two amplifiers per package, very low noise)and the last one on the AD8005 (ultra low power, 400 µA quiescent current). The total gain is (Rt isthe input termination resistance) 103×Rt = 5×10⁴, as the first stage is a transimpedance amplifierwith gain of 10×Rt = 5×10². A passive, 2 µs time-constant RC circuit (200 pF, 10 kΩ between
– 18 –

2012 JINST 7 T06001
Figure 16. Functional blocks in the FEB card.
Figure 17. This low power amplifier circuit for NEXT-100 features only 30 mW power, 4 mV/pe gain and1.7 mV rms noise.
the second and the third stage) acts as the circuit integrator. This gain will result in a 1 V outputfor a 250-pe dynamic range. Total electronic noise in the amplifier circuit is very low according tothe simulations: 1.7 mV rms. A preliminary estimation for the power dissipation due to the analogstage yields 30 mW per channel, or 210 W in total. Additional power dissipation in the FEB comesfrom drop in voltage regulators, FPGA (data handling and multiplexing) and transmission circuitsrequired to reduce the number of feedthroughs in the TPC vessel.
For the tracking plane readout digitization two alternatives are currently under study:
• A single-channel 1 MHz (or 3 MHz) low-power 12-bit ADCs (like AD7476), requiring onlytwo lines (data and chip select) for readout. This solution is used in NEXT-DEMO, andwould correspond to a total heat dissipated by the in-vessel electronics of 315 W.
• A fast (40 MHz or higher) multi-channel ADC and an analog switch for multiplexing. Thissolution can lead to a reduced power consumption, though the effect of the noise induced byhundreds of switches inside the vessel has to be studied.
FEB size can be 15×15 cm, leaving 3.5 cm2 board area per channel. This can easily accom-modate the three amplifying stages and ADC per channel plus associated SMD passive componentsin one board side. The FPGA, voltage regulators and I/O connectors can sit in the opposite layer.
– 19 –
2012 JINST 7 T06001
In addition to power consumption, another key figure of merit is FEB throughput. Datafrom the 6 800 SiPM channels must be sent across the PV. Minimizing the number of vacuumfeedthroughs is a must, and this number is directly proportional to the aggregated throughput. Tothis end, we envisage the FEB readout to be zero suppressed and triggered.
Zero suppression implies that every microsecond (the ADC sampling period), only channelswith a charge readout above an adjustable threshold will send digitized and timestamped data tothe DAQ module, where the data are stored in a circular buffer. Raw data mode of operation, whereno zero suppression occurs at the online level, will also be supported for testing purposes.
Additionally, FEB data will be read in triggered mode. For a 10 Hz trigger rate and a 2 ms eventduration, a triggered FEB readout may further reduce the FEB throughput by a factor of 50 withrespect to a continuous readout. In continuous readout mode, no trigger exists at the front-end level,and (zero-suppressed) data are sent continuously to the DAQ module, every microsecond. Once atimestamped trigger arrives to the DAQ module, the right data time interval is read from the DAQmodule circular buffer and sent to the DATE online system for event building. In triggered readoutmode, on the other hand, FEB data are sent to the DAQ module only in the presence of a trigger.The reduced throughput of the triggered mode comes at the cost of increased complexity, as circular(ring) buffers are needed at the FEB level. Quantitatively, 7 000 channels produce approximately 20MByte/event in raw data mode (no zero suppression). A 10 Hz FEB trigger rate implies thereforea 200 MByte/s, or 1.6 Gb/s, throughput. This is an acceptable number.
The necessary FEB circular buffer size has also been estimated, and possible solutions havebeen identified. One full event (2 000 samples) requires 2.000×64×12 bit, that is 1.5 Mb buffersize. For zero-dead-time operation the buffer must be large enough to be continuously filled. Abuffer of about 10 ms is therefore needed, assuming a 200 Mb/s link speed to read the buffer. Aconservative estimate for the FEB buffer size is therefore 7.5 Mb. This is feasible with Xilinx ArtixFPGAs (XC7A200T), that has an internal 13.5 Mb memory. A trade-off between readout speedand buffer size must be found in order to minimize cost and power: data links must a have a lowspeed for the sake of reduced power consumption, cheaper electronics, reduced FEB noise andenhanced signal integrity. Careful evaluation of copper and optical link solutions will provide theright compromise between buffer size, power dissipation, reliability and cost.
The number of FECs and of Local Data Concentrator (LDC) PCs for the tracking partition ofthe DAQ is determined by the tracking plane throughput and by the speed of the links (from the in-vessel electronics to the FEC card, and from the FEC card to the LDC PC). As discussed above, thetracking plane will produce 1.6 Gb/s data at most (10 Hz triggered mode, no zero suppression). As-suming 400 Mb/s as a comfortable working point for the gigabit Ethernet links between the FECsand the LDCs, 4 LDCs are required. Assuming 200 Mb/s link speed (LVDS over copper) fromthe in-vessel electronics to the DAQ (the same speed and technology used in NEXT-DEMO for theSiPM plane readout), the existing 16-link LVDS add-in card for the FEC module can be used. The110 links coming from the vessel require then 110/16=7 FEC cards. We therefore need 7 FECs and4 LDCs in the tracking DAQ partition. This is approximately the size of the full NEXT-DEMODAQ system.
– 20 –

2012 JINST 7 T06001
8.3 Trigger electronics
As it was previously mentioned, one additional FEC module with a different plug-in card is used astrigger module. This plug-in card (named CDTC16 from Clock, Data, Trigger and Control) has 16RJ-45 connectors and 4 LVDS pairs on each connector. Every readout FEC card (for both energyand tracking planes) is connected to the trigger module via a 4-pair CAT6 network cable to thetrigger module.
One LVDS pair is used to distribute a common clock to all the readout FEC. A second LVDSpair is used to send common trigger, synchronization and configuration commands to all readoutFECs. Two pairs carry trigger candidates from each readout FEC to the trigger module, where atrigger decision is taken. Accepted triggers are timestamped and sent to all readout FECs. Addi-tionally, the trigger module can send the DAQ information related to the trigger type and conditionsthat produces the trigger for offline analysis purposes.
The trigger algorithm runs on the FEC FPGA. This allows very low latencies (the algorithmruns on hardware, not on software) and virtually any kind of trigger one can think of. As an exam-ple, three basic trigger types have been initially defined: (1) External trigger (NIM or LVDS pulse);(2) Internal trigger (at least N — programmable number — PMT channels above a programmablethreshold are in coincidence in a programmable time window, using only a programmable set ofPMTs -to ignore noisy or damaged devices); and (3) Mixed trigger (internal trigger gated by anexternal trigger). More complex trigger types can be defined with the only limitation of the FPGAlogic resources.
The described trigger architecture has been implemented and tested in NEXT-DEMO and willbe also used in NEXT-100. New or modified trigger algorithms will be developed for NEXT-100.
9 Shielding
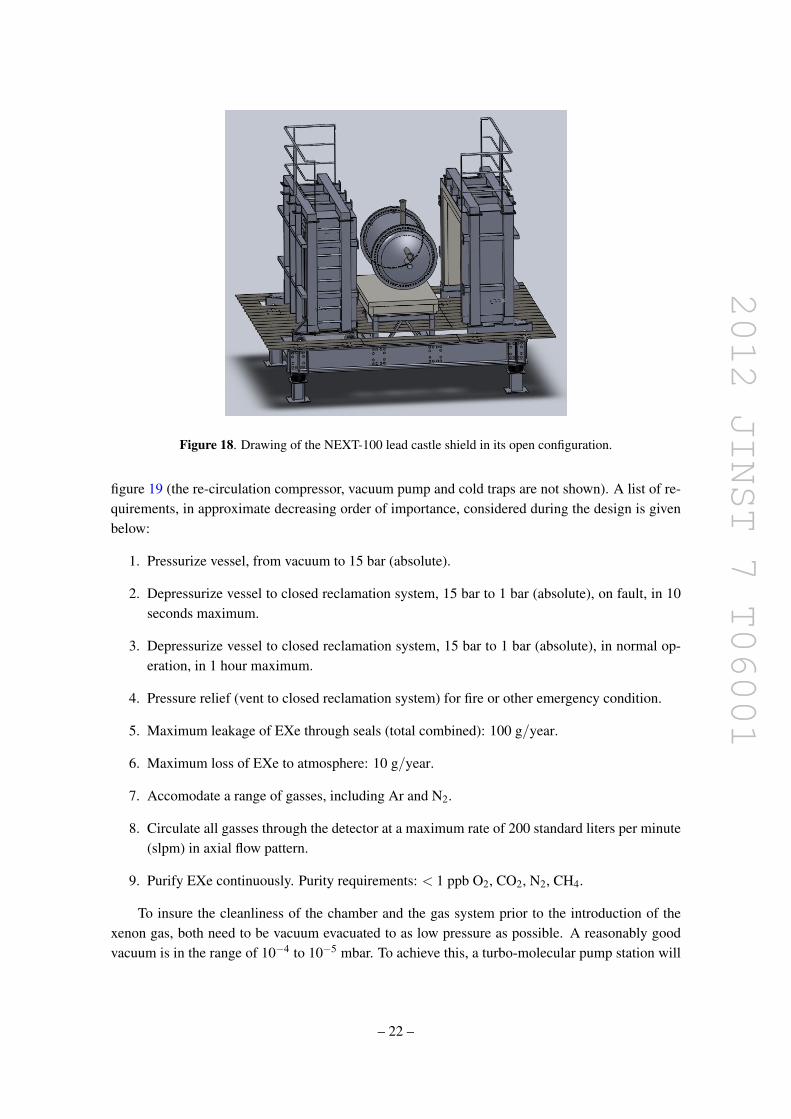
To shield NEXT-100 from the external flux of high-energy gamma rays a relatively simple lead cas-tle, shown in figure 18, has been chosen, mostly due to its simplicity and cost-effectiveness. Thelead wall has a thickness of 20 cm and is made of layers of staggered lead bricks held with a steelstructure. The lead bricks have standard dimensions (200× 100× 50 mm3), and, by requirement,an activity in uranium and thorium lower than 0.4 mBq/kg.
The lead castle is made of two halves mounted on a system of wheels that move on rails withthe help of an electric engine. The movable castle has an open and a closed position. The formeris used for the installation and service of the pressure vessel; the latter position is used in normaloperation. A lock system fixes the castle to the floor in any of the two configurations to avoidaccidental displacements.
10 Gas system
The gas system must be capable of pressurizing, circulating, purifying, and depressurizing theNEXT-100 detector with xenon, argon and possibly other gases with negligible loss and withoutdamage to the detector. In particular, the probability of any substantial loss of the very expensiveenriched xenon (EXe) must be minimized. The general schematic of the gas system is given in
– 21 –
2012 JINST 7 T06001
Figure 18. Drawing of the NEXT-100 lead castle shield in its open configuration.
figure 19 (the re-circulation compressor, vacuum pump and cold traps are not shown). A list of re-quirements, in approximate decreasing order of importance, considered during the design is givenbelow:
1. Pressurize vessel, from vacuum to 15 bar (absolute).
2. Depressurize vessel to closed reclamation system, 15 bar to 1 bar (absolute), on fault, in 10seconds maximum.
3. Depressurize vessel to closed reclamation system, 15 bar to 1 bar (absolute), in normal op-eration, in 1 hour maximum.
4. Pressure relief (vent to closed reclamation system) for fire or other emergency condition.
5. Maximum leakage of EXe through seals (total combined): 100 g/year.
6. Maximum loss of EXe to atmosphere: 10 g/year.
7. Accomodate a range of gasses, including Ar and N2.
8. Circulate all gasses through the detector at a maximum rate of 200 standard liters per minute(slpm) in axial flow pattern.
9. Purify EXe continuously. Purity requirements: < 1 ppb O2, CO2, N2, CH4.
To insure the cleanliness of the chamber and the gas system prior to the introduction of thexenon gas, both need to be vacuum evacuated to as low pressure as possible. A reasonably goodvacuum is in the range of 10−4 to 10−5 mbar. To achieve this, a turbo-molecular pump station will
– 22 –

2012 JINST 7 T06001
V22
EmergColdDump
Service line
V23
EmergExpanssionDump
Dome Loaded Reg
Overpressure Relief
Underpressure Relief
Manual Valve
Regulator
Xe Line
Recirculation Pump
Bursting Disk
Check Valve
Servo Valve
V1
Evacuation Alarm
Gas Analyzer
PressureReferenceP-x
Xe
PressureReferenceValue typicallyP=15 bar
Two parallel Getters and a bypas
UPR1
OPR1
BPR1
BD2
VM1
V21
V21
V20V19
V18
V17
V16
V3
V2
RP1
DLR1
C1
R4
R1
Reduce to 1 barGetter
XeColdRecov
RnTrap 2
XeXe
Shielding
Figure 19. Schematic of the NEXT-100 gas system.
be directly connected as close as possible to the NEXT-100 vessel through a large conductancevalve rated for vacuum and pressure. However, many internal structures of the NEXT-100 detectorwill not allow good conductance for vacuum evacuation. Therefore, instead of evacuating the sys-tem from a single point, the vacuum manifold will be connected to several points simultaneously.Also, flushing with argon several times might help in the cleaning process. Finally, continuous gasre-circulation through the getters will clean the gas system.
– 23 –
2012 JINST 7 T06001
The most vulnerable component of the gas system is the re-circulation compressor, that musthave sufficient redundancy to minimize the probability of failure and leakage. The Collaborationhas chosen a compressor manufactured by SERA COMPRESS GMBH. This compressor is madewith metal-to-metal seals on all the wetted surfaces. The gas is moved through the system by atriple stainless steel diaphragm. Between each of the diaphragms there is a sniffer port to monitorfor gas leakages. In the event of a leakage, automatic emergency shutdown can be initiated.
MICROTORR model MC4500-902FV from SAES has been chosen as the purification filterfor the xenon gas. Capable of removing electronegative impurities to less than 1 ppb, the chosenmodel has a nominal flow rate of 200 standard liters per minute, well in excess of the required flowrates for NEXT-100, thus offering sufficient spare capacity. The gas system will contain two suchgetters in parallel with a bypass. The second spare getter is placed in parallel allowing uninterruptedrunning in the event of accidental contamination of one of the getters. Also, the ability to bypassthe getters will allow the testing of the purification of the gas and aid in diagnostic and monitoringof the gas system. While cold getter technology is capable of reaching the required purity levels inwater and oxygen, a hot getter can also remove nitrogen and methane. In that regard, we foresee toupgrade to hot getters, such as the model PS4-MT15 from SAES, for the enriched xenon run.
An automatic recovery system of the expensive EXe will be needed to evacuate the chamberin case of an emergency condition. A 30-m3 expansion tank will be placed inside the laboratory toquickly reduce the gas pressure in the system. Additionally, we will implement a similar solution tothat proposed by the LUX collaboration, where a chamber permanently cooled by liquid nitrogenwill be used. Two primary conditions to trigger automatic evacuation are foreseen:
• An over-pressure, that can potentially cause an explosion. Because the gas system for NEXT-100 will be operated in a closed mode the overpressure condition could occur only under twopossible scenarios: a problem during the filling stage of the operation or a thermal expansionof the gas due to laboratory fire. In the case of overpressure an electromechanical valve, acti-vated by a pressure switch, will open a pipe from the chamber to a permanently cold recoveryvessel. This will then cryo-pump xenon into the recovery vessel, causing the gas to freeze inthe recovery tank. In the event of the electromechanical valve failing, a mechanical spring-loaded relief valve, mounted in parallel to the electromechanical valve, would open andallow the xenon to be collected in the recovery vessel. A bursting disk will also be mountedin parallel to the electromechanical and spring-loaded valves as a final safety feature.
• An under-pressure, indicating a leak in the system. Such condition would require evacuationof the chamber to prevent losses of gas. If this happens an electromechanical valve sensingunder-pressure will open and evacuate the xenon into the recovery vessel.
We have also considered the scenario in which xenon could leak through some of the photo-multipliers enclosures (leaking can). If this happens the use of a cold trap would permit to recoverthe gas.
11 NEXT-100 at the LSC
The Collaboration intends to commence the installation at the LSC of NEXT-100 and its ancillarysystems in the second quarter of 2012. Figure 20 shows an image of Hall A, future location of
– 24 –

2012 JINST 7 T06001
Figure 20. View of Hall A of the Laboratorio Subterraneo de Canfranc prior to any equipment installation.
NEXT-100. The pool-like structure is intended to be a catchment reservoir to hold xenon or argon— a liquid-argon experiment, ArDM, will be neighboring NEXT-100 in Hall A — gas in the eventof a catastrophic leak. Therefore, for reasons of safety all experiments must preclude any personnelworking below the level of the top of the catchment reservoir.
An elevated working platform will be built prior to the installation of NEXT-100. It is designedto stand a uniform load of 1500 kg/m2 and a concentrated load of 200 kg/m2. It is anchored tothe hall ground and walls. The platform floor tiles are made of galvanized steel and have standarddimension to minimize cost.
Due to the mild seismic activity of the part of the Pyrenees where the LSC is located, a com-prehensive seismic study has been conducted as part of the project risk analysis. As a result, ananti-seismic structure that will hold both pressure vessel and shielding has been designed. Thisstructure will be anchored directly to the ground and independent of the working platform (seesection 11) to allow seismic displacements in the event of an earthquake.
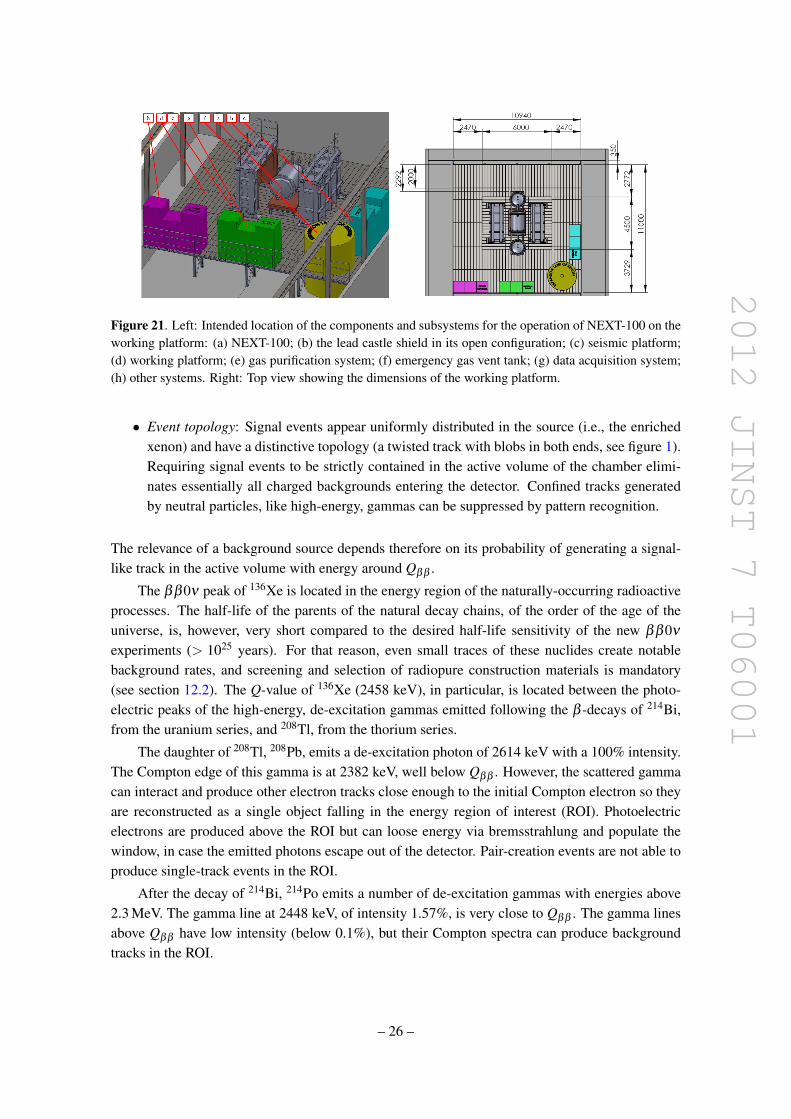
Figure 21 shows the placement of NEXT-100 and components on the platform as well as thedimensions. Work is underway, in coordination with LSC staff to refine and complete the designof each relevant element, and the integration of all the systems.
12 Background model
12.1 Sources of background in NEXT
NEXT has two powerful handles to distinguish signal from background:
• Energy resolution: Signal events have all the same energy. Selecting only the events in theenergy region around Qββ defined by the resolution eliminates most of the spurious activityin the detector.
– 25 –
2012 JINST 7 T06001
Figure 1.35: NEXT-100 lead castle and platform at the LSC
43
f. The xenon expansion tank also described in chapter 8.782
g. Power and DAQ racks.783
h. Other devices (e.g, slow controls).784
i. Gas and cable pipes (not show in the figure).785
In this chapter we present an integrated design of the working platform (WP), the786
seismic structure to hold the detector (a.k.a. detector pedestal, DP) and the lead castle787
(LC) itself.788
Figure 1.36: Top view of the layout
Figure 9.2 shows a top view of the layout, with dimensions. The platform has a789
squared shape, with dimensions of 11 × 11 m2 meters and useful surface of 112 m2. It790
includes a safety area with a length of about 2 meters to provide clear access in case of791
an emergency.792
The DP, WP and LC are composed of modular and standard elements which will793
be manufactured by a supplier. All beam welding and most of the bolting will be done794
44
Figure 21. Left: Intended location of the components and subsystems for the operation of NEXT-100 on theworking platform: (a) NEXT-100; (b) the lead castle shield in its open configuration; (c) seismic platform;(d) working platform; (e) gas purification system; (f) emergency gas vent tank; (g) data acquisition system;(h) other systems. Right: Top view showing the dimensions of the working platform.
• Event topology: Signal events appear uniformly distributed in the source (i.e., the enrichedxenon) and have a distinctive topology (a twisted track with blobs in both ends, see figure 1).Requiring signal events to be strictly contained in the active volume of the chamber elimi-nates essentially all charged backgrounds entering the detector. Confined tracks generatedby neutral particles, like high-energy, gammas can be suppressed by pattern recognition.
The relevance of a background source depends therefore on its probability of generating a signal-like track in the active volume with energy around Qββ .
The ββ0ν peak of 136Xe is located in the energy region of the naturally-occurring radioactiveprocesses. The half-life of the parents of the natural decay chains, of the order of the age of theuniverse, is, however, very short compared to the desired half-life sensitivity of the new ββ0ν
experiments (> 1025 years). For that reason, even small traces of these nuclides create notablebackground rates, and screening and selection of radiopure construction materials is mandatory(see section 12.2). The Q-value of 136Xe (2458 keV), in particular, is located between the photo-electric peaks of the high-energy, de-excitation gammas emitted following the β -decays of 214Bi,from the uranium series, and 208Tl, from the thorium series.
The daughter of 208Tl, 208Pb, emits a de-excitation photon of 2614 keV with a 100% intensity.The Compton edge of this gamma is at 2382 keV, well below Qββ . However, the scattered gammacan interact and produce other electron tracks close enough to the initial Compton electron so theyare reconstructed as a single object falling in the energy region of interest (ROI). Photoelectricelectrons are produced above the ROI but can loose energy via bremsstrahlung and populate thewindow, in case the emitted photons escape out of the detector. Pair-creation events are not able toproduce single-track events in the ROI.
After the decay of 214Bi, 214Po emits a number of de-excitation gammas with energies above2.3 MeV. The gamma line at 2448 keV, of intensity 1.57%, is very close to Qββ . The gamma linesabove Qββ have low intensity (below 0.1%), but their Compton spectra can produce backgroundtracks in the ROI.
– 26 –

2012 JINST 7 T06001
Radon constitutes a dangerous source of background due to the radioactive isotopes 222Rn(half-life of 3.8 d) from the 238U chain and 220Rn (half-life of 55 s) from the 232Th chain. As a gas,it diffuses into the air and can enter the detector. 214Bi is a decay product of 222Rn, and 208Tl adecay product of 220Rn. In both cases, radon undergoes an alpha decay into polonium, producing anegative ion which is drifted towards the anode by the electric field of the TPC. As a consequence,214Bi and 208Tl contaminations can be assumed to be deposited on the anode surface. The trackingcapabilities of NEXT allow the rejection of most of these events. Additionally, radon may beeliminated from the TPC gas mixture by recirculation through appropriate filters. Also, radon canbe suppressed in the vicinity of the detector by continuously flushing nitrogen, for instance.
The rock of the laboratory itself is a rather intense source of high-energy gammas from theradioactive decay chains. This flux of photons has been measured [21]:
• 0.71±0.12 γ/cm2/s from the 238U chain;
• 0.85±0.07 γ/cm2/s from the 232Th chain.
These fluxes include all the gamma lines in each chain. The flux corresponding to the 208Tl line at2614 keV and the flux corresponding to the 214Bi line at 1764 keV were also measured separately(from the latter it is possible to deduce the flux corresponding to the 2448 keV line). The results are
• 0.13±0.01 γ/cm2/s from the 208Tl line;
• 0.006±0.001 γ/cm2/s from the 214Bi line at 2448 keV.
Cosmic particles can also affect our experiment by producing high-energy photons or acti-vating materials. Muons are the only surviving cosmic ray particles deep underground, but theirinteractions with the rock produce neutrons. However, neutron-induced backgrounds do not appearto be significant for our experiment given the tracking capabilities of the detector.
12.2 Radioactive budget of NEXT-100
Information on radiopurity of the materials expected to be used in the construction of NEXT-100has been compiled, performing specific measurements and also examining data from the literaturefor materials not yet screened. In this executive summary we present a brief summary, shown intable 3, of our detailed database.
12.3 Expected background rate in NEXT-100
As explained above, electron tracks generated in the active volume by the high-energy gammasemitted in the decays of 208Tl and 214Bi are the main background in NEXT. Therefore, in orderto estimate the background rate to be expected in NEXT-100, large samples of 208Tl and 214Bievents were generated in our detector simulation as emanating from the different subsystems, andnormalized according to the activities shown in table 3.
Notice that since all background sources are external to the active volume of the detector(the contamination of the enriched xenon is negligible), the background rate in NEXT-100 can becomputed as the product of two quantities: the flux of high-energy gammas through the surface ofthe active volume, and the probability of a background event to be selected as a signal candidate
– 27 –

2012 JINST 7 T06001
Table 3. Activity (in mBq/kg) of the most relevant materials used in NEXT. Activities for the lower part ofthe uranium chain, starting at 226Ra, have been quoted when possible.
Material Subsystem Method/Ref. 238U 232ThLead, from Cometa Shielding GDMS 0.37 0.07Copper, from Luvata ICS GDMS < 0.012 < 0.004Steel (316Ti) PV [16] < 1.9 < 1Bolts Inconel 718 PV Ge LSC < 5.6 < 4.6Bolts Inconel 625 PV Ge LSC < 1.8 < 2.0PEEK, from Sanmetal FC/EP/TP Ge Unizar 36.3 11.7Capacitors (Tantalum) FC/EP/TP [22] 320 1230SMD Resistors, Finechem (per pc) FC Ge Unizar 0.022 < 0.048Polyethylene FC [16] 0.23 < 0.14TTX FC [23] 12.4 < 1.6TPB FC/EP/TP [24] 1.63 0.47PTFE (Teflon) EP/TP/DB [25] 0.025 0.031PMT (R11410-MOD per pc) EP [16] < 2.5 < 2.5PMT (R11410-MOD per pc) EP [26] < 0.4 < 0.3Sapphire window EP [27] < 0.31 0.12CUFLON TP [28] 0.36 0.28Kapton cable TP/EP [16] < 11 < 11
(in the following, the rejection factor). The first quantity lets us compare the relative importanceof the different subsystems in the radioactive budget of NEXT-100, while the second allows us tobetter understand the background rejection capabilities of the detector.
Our first step, therefore, is to quantify via simulation the number of high-energy gammasreaching the active volume. NEXT-100 has the structure of a Matryoshka (a Russian nesting doll).The flux of high-energy gammas emanating from the LSC walls is drastically attenuated by the leadcastle (LC), and the residual flux together with that emitted by the lead itself and the materials ofthe pressure vessel (PV) are further attenuated by the inner copper shielding (ICS). The ICS also at-tenuates the flux emitted by the tracking plane front-end electronics, which sit behind it. To this, weneed to add the contribution from the innermost elements — sensor planes and field cage — that arenot shielded by the ICS. Table 4 summarizes the contributions to the gamma flux from Matryoshkaand inner elements. Overall, 3.7×10⁶ gammas/year from 214Bi and 1.3×10⁶ gammas/year from208Tl will reach the active volume. The contributions to this radioactive budget from the differentsubsystems of the detector are very similar. An important consequence of this is that a substantialreduction of the radioactive budget can only be achieved if it happens in all the subsystems at thesame time. In its current configuration the NEXT-100 radioactive budget is quite balanced.
In a second step we computed the background rejection factor achievable with the detector.Simulated events, after reconstruction, were accepted as a ββ0ν candidate if
(a) they were reconstructed as a single track confined within the active volume;
– 28 –

2012 JINST 7 T06001
Table 4. Number of high-energy gammas per year emitted by the different subsystems of NEXT-100 andreaching the active volume of the detector.
214Bi 208Tl[105 γ/year]
Matryoshka 10.0 1.6Tracking plane 3.2 0.8Energy plane 8.6 2.8Front-end electronics 7.2 5.7Field cage 8.2 1.7Total 37.2 12.6
Table 5. Suppression of 214Bi events by the selection cuts.
Fraction of eventsSelection cut ββ0ν 214Bi 208TlConfined, single track 0.48 6.0×10⁻⁵ 2.4×10⁻³
Energy ROI 0.33 2.2×10⁻⁶ 1.9×10⁻⁶
Topology ββ0ν 0.25 1.9×10⁻⁷ 1.8×10⁻⁷
(b) their energy fell in the region of interest, defined as ±0.5 FWHM around Qββ ;
(c) the spatial pattern of energy deposition corresponded to that of a ββ0ν track (blobs in bothends).
The achieved background rejection factor together with the selection efficiency for the signal areshown in table 5. As can be seen, the cuts suppress the radioactive background by more than 7orders of magnitude.
Lastly, we multiply the gamma flux by the rejection factor to obtain the background rate (perunit of ββ isotope mass, energy and time) of the experiment:
b =(3.7×106) · (1.9×10−7)+(1.3×106) · (1.8×10−7)
100 kg ·12.5 keV' 8×10⁻⁴ counts/(keV ·kg ·y). (12.1)
If 50 extra kilograms of enriched xenon can be procured, the background rate would be even lower:5.×10−4counts/(keV ·kg ·y).
13 Summary and outlook
We have presented the technical design of the NEXT-100 detector, a high-pressure xenon gas timeprojection chamber that will search for ββ0ν in 136Xe. The detector will use electroluminescencefor the amplification of the ionization signal, and will have separate readout planes for tracking (an
– 29 –
2012 JINST 7 T06001
100 200 300 400 500 600 700 800 900 100040
60
80
100
120
140
160
180
100 kg150 kg
mβ
β (m
eV)
exposure (kg year)
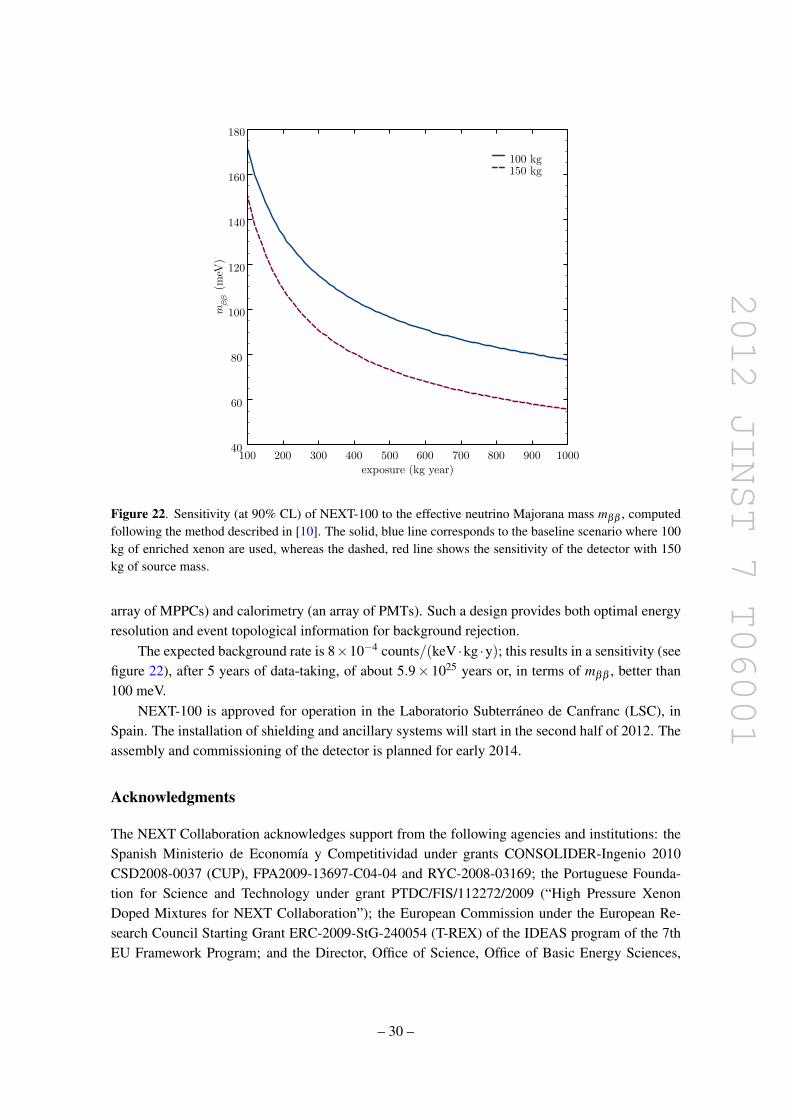
Figure 22. Sensitivity (at 90% CL) of NEXT-100 to the effective neutrino Majorana mass mββ , computedfollowing the method described in [10]. The solid, blue line corresponds to the baseline scenario where 100kg of enriched xenon are used, whereas the dashed, red line shows the sensitivity of the detector with 150kg of source mass.
array of MPPCs) and calorimetry (an array of PMTs). Such a design provides both optimal energyresolution and event topological information for background rejection.
The expected background rate is 8×10⁻⁴ counts/(keV ·kg ·y); this results in a sensitivity (seefigure 22), after 5 years of data-taking, of about 5.9× 1025 years or, in terms of mββ , better than100 meV.
NEXT-100 is approved for operation in the Laboratorio Subterraneo de Canfranc (LSC), inSpain. The installation of shielding and ancillary systems will start in the second half of 2012. Theassembly and commissioning of the detector is planned for early 2014.
Acknowledgments
The NEXT Collaboration acknowledges support from the following agencies and institutions: theSpanish Ministerio de Economıa y Competitividad under grants CONSOLIDER-Ingenio 2010CSD2008-0037 (CUP), FPA2009-13697-C04-04 and RYC-2008-03169; the Portuguese Founda-tion for Science and Technology under grant PTDC/FIS/112272/2009 (“High Pressure XenonDoped Mixtures for NEXT Collaboration”); the European Commission under the European Re-search Council Starting Grant ERC-2009-StG-240054 (T-REX) of the IDEAS program of the 7thEU Framework Program; and the Director, Office of Science, Office of Basic Energy Sciences,
– 30 –
2012 JINST 7 T06001
of the US Department of Energy under contract no. DE-AC02-05CH11231. J. Renner (LBNL)acknowledges the support of a US DOE NNSA Stewardship Science Graduate Fellowship undercontract no. DE-FC52-08NA28752.
References
[1] J.J. Gomez-Cadenas, J. Martın-Albo, M. Mezzetto, F. Monrabal and M. Sorel, The search forneutrinoless double beta decay, Riv. Nuovo Cim. 35 (2012) 29 [arXiv:1109.5515].
[2] NEXT collaboration, . F. Granena et al., NEXT, a HPGXe TPC for neutrinoless double beta decaysearches, arXiv:0907.4054.
[3] NEXT collaboration, V. Alvarez et al., The NEXT-100 experiment for neutrinoless double beta decaysearches (Conceptual Design Report), arXiv:1106.3630.
[4] J. Schechter and J.W.F. Valle, Neutrinoless double-beta decay in SU(2)×U(1) theories, Phys. Rev. D25 (1982) 2951.
[5] H.V. Klapdor-Kleingrothaus et al., Latest results from the Heidelberg-Moscow double beta decayexperiment, Eur. Phys. J. A 12 (2001) 147 [hep-ph/0103062].
[6] H.V. Klapdor-Kleingrothaus, A. Dietz, H.L. Harney and I.V. Krivosheina, Evidence for neutrinolessdouble beta decay, Mod. Phys. Lett. A 16 (2001) 2409 [hep-ph/0201231].
[7] C.E. Aalseth et al., Comment on ‘evidence for neutrinoless double beta decay’, Mod. Phys. Lett. A 17(2002) 1475 [hep-ex/0202018].
[8] M. Fukugita and T. Yanagida, Baryogenesis without grand unification, Phys. Lett. B 174 (1986) 45.
[9] S. Davidson, E. Nardi and Y. Nir, Leptogenesis, Phys. Rept. 466 (2008) 105 [arXiv:0802.2962].
[10] J.J. Gomez-Cadenas et al., Sense and sensitivity of double beta decay experiments, JCAP 06 (2011)007 [arXiv:1010.5112].
[11] D. Nygren, High-pressure xenon gas electroluminescent TPC for 0-νββ -decay search, Nucl.Instrum. Meth. A 603 (2009) 337.
[12] EXO-200 collaboration, N. Ackerman et al., Observation of two-neutrino double-beta decay in136Xe with EXO-200, Phys. Rev. Lett. 107 (2011) 212501 [arXiv:1108.4193].
[13] KAMLAND-ZEN collaboration, Measurement of the double-β decay half-life of 136Xe with theKamLAND-Zen experiment, Phys. Rev. C 85 (2012) 045504 [arXiv:1201.4664].
[14] R. Luscher et al., Search for ββ decay in 136Xe: new results from the Gotthard experiment, Phys.Lett. B 434 (1998) 407.
[15] A. Goldschmidt et al., High-pressure xenon gas TPC for neutrino-less double-beta decay in 136Xe:progress toward the goal of 1% FWHM energy resolution, submitted to the 2011 IEEE NuclearScience Symposium, IEEE Nucl. Sci. Symp. Conf. Rec. (2011) 1409.
[16] E. Aprile et al., Material screening and selection for XENON100, Astropart. Phys. 35 (2011) 43[arXiv:1103.5831].
[17] ARDM collaboration, V. Boccone et al., Development of wavelength shifter coated reflectors for theArDM argon dark matter detector, 2009 JINST 4 P06001 [arXiv:0904.0246].
[18] Hamamatsu Photonics K.K., MPPC (Multi-Pixel Photon Counter) webpage,http://jp.hamamatsu.com/products/sensor-ssd/4010/S10362-11-050P/.
– 31 –
2012 JINST 7 T06001
[19] NEXT collaboration, V. Alvarez et al., SiPMs coated with TPB: coating protocol andcharacterization for NEXT, 2012 JINST 7 P02010 [arXiv:1201.2018].
[20] K. Lung et al., Characterization of the Hamamatsu R11410-10 3-inch photomultiplier tube for darkmatter direct detection experiments, arXiv:1202.2628.
[21] G. Luzon et al., Characterization of the Canfranc Underground Laboratory: status and future plans,in Proceedings of the 6th International Workshop on Identification of Dark Matter, September 2006,pg. 514.
[22] ILIAS database on radiopurity of materials webpage, http://radiopurity.in2p3.fr/.
[23] ARDM collaboration, V. Boccone et al., Development of wavelength shifter coated reflectors for theArDM argon dark matter detector, 2009 JINST 4 P06001 [arXiv:0904.0246].
[24] I. Lawson and B. Cleveland, Low background counting at SNOLAB, in Topical Workshop on LowRadioactivity Techniques LRT 2010, AIP Conf. Proc. 1338 (2011) 68.
[25] D. Budjas et al., Gamma-ray spectrometry of ultra low levels of radioactivity within the materialscreening program for the gerda experiment, Appl. Radiat. Isot. 67 (2009) 755.
[26] C. Faham, Performance and radioactivity measurements of the pmts for the lux and lz dark matterexperiments, in TIPP2011, http://conferences.fnal.gov/tipp11/, Chicago U.S.A. (2011).
[27] D.S. Leonard et al., Systematic study of trace radioactive impurities in candidate constructionmaterials for EXO-200, Nucl. Instrum. Meth. A 591 (2008) 490 [arXiv:0709.4524].
[28] S. Nisi et al., Comparison of inductively coupled mass spectrometry and ultra low-level gamma-rayspectroscopy for ultra low background material selection, Appl. Radiat. Isot. 67 (2009) 828.
– 32 –