news u can use - mutual fund u can use april 15, 2016 slide the week that was… april 11 to april...
TRANSCRIPT

News U Can Use
April 15, 2016

Slide
The Week that was…
April 11 to April 15
2

Slide
Indian Economy
3
Government data showed that Consumer Price Index based inflation fell to a six month low
level of 4.83% in Mar 2016 from 5.26% in Feb 2016 and 5.25% in the same period of the
previous year. Food inflation also eased to 5.21% in Mar from 5.30% in the previous month
and 6.14% in the same month of the previous year. However, pulses was the only category
that witnessed double digit inflation as it registered the sharpest rise of 34.15% in Mar
compared with 38.46% in Feb and 11.48% in the same month of the previous year.
Government data showed that the index of industrial production (IIP) grew 2% in Feb 2016,
as against a contraction of 1.5% in the previous month and a growth of 4.8% in the previous
year. The growth can be attributed to the electricity and mining sectors that grew 9.6% and
5.0% in Feb.
The International Monetary Fund (IMF) retained India's growth projections for 2016-17 at
7.5%, but it reduced global growth forecast to 3.2% for 2016 and to 3.5% in 2017. Earlier, it
had estimated global growth forecast at 3.4% for 2016 and 3.6% in 2017. The IMF added
that India’s growth will continue to be driven by private consumption, lower energy prices,
and higher real incomes.
The finance minister stated that the government will amend the SARFAESI (Securitisation
and Reconstruction of Financial Assets and Enforcement of Security Interest) Act and DRT
(Debt Recovery Tribunal) Act so that banks have the flexibility to settle bad loans faster. This
amendment will likely tighten the bankruptcy law.

Slide 4
Indian Equity Market Domestic Equity Market Indices
Indices 13-Apr-16 1 Week Return YTD Return
S&P BSE Sensex 25626.75 2.92% -2.04%
Nifty 50 7850.45 3.10% -1.42%
S&P BSE Mid-Cap 10916.3 3.24% -2.93%
S&P BSE Small-Cap 10943.02 2.83% -8.36% Source: MFI Explorer
Ratios
S&P BSE
Sensex Nity 50
S&P BSE
Mid Cap
S&P BSE
Small Cap
P/E 19.37 21.56 26.7 42.98
P/B 2.82 3.32 2.43 1.9
Dividend Yield 1.43 1.42 1.48 1.12
Source: BSE, NSE Value as on Apr 13, 2016
NSE Advance/Decline Ratio
Date Advances Declines Advance/Decline Ratio
11-Apr-16 930 624 1.49
12-Apr-16 960 604 1.59
13-Apr-16 1029 524 1.96 Source: NSE
Indian equity markets gained during
the truncated trading week following
favourable domestic macro-
economic data and stability in global
crude oil prices.
Strong monsoon forecast and
positive cues from other Asian peers
supported gains. Government data
showed that the index of industrial
production grew in Feb, after
witnessing contraction for three
consecutive months. Consumer
Price Index based inflation fell to a
six-month-low level in Mar.
Adding to the upbeat developments,
the International Monetary Fund
retained Indian economy’s growth
forecast at 7.5% for FY17.
Slide 5
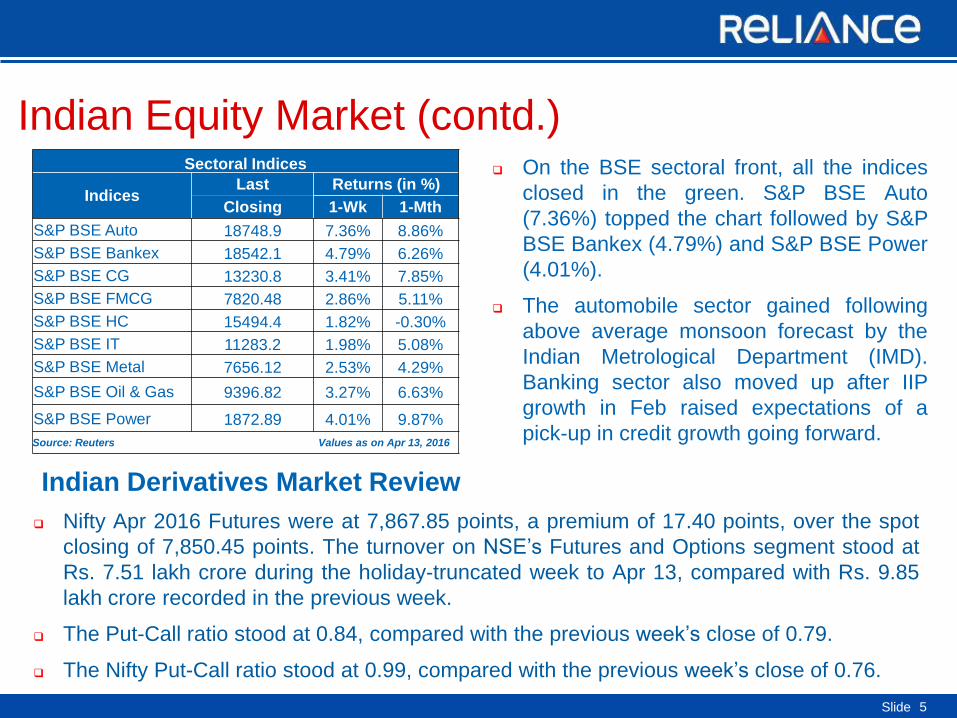
Indian Equity Market (contd.) Sectoral Indices
Indices Last Returns (in %)
Closing 1-Wk 1-Mth
S&P BSE Auto 18748.9 7.36% 8.86%
S&P BSE Bankex 18542.1 4.79% 6.26%
S&P BSE CG 13230.8 3.41% 7.85%
S&P BSE FMCG 7820.48 2.86% 5.11%
S&P BSE HC 15494.4 1.82% -0.30%
S&P BSE IT 11283.2 1.98% 5.08%
S&P BSE Metal 7656.12 2.53% 4.29%
S&P BSE Oil & Gas 9396.82 3.27% 6.63%
S&P BSE Power 1872.89 4.01% 9.87%
Source: Reuters Values as on Apr 13, 2016
On the BSE sectoral front, all the indices
closed in the green. S&P BSE Auto
(7.36%) topped the chart followed by S&P
BSE Bankex (4.79%) and S&P BSE Power
(4.01%).
The automobile sector gained following
above average monsoon forecast by the
Indian Metrological Department (IMD).
Banking sector also moved up after IIP
growth in Feb raised expectations of a
pick-up in credit growth going forward.
Indian Derivatives Market Review
Nifty Apr 2016 Futures were at 7,867.85 points, a premium of 17.40 points, over the spot
closing of 7,850.45 points. The turnover on NSE’s Futures and Options segment stood at
Rs. 7.51 lakh crore during the holiday-truncated week to Apr 13, compared with Rs. 9.85
lakh crore recorded in the previous week.
The Put-Call ratio stood at 0.84, compared with the previous week’s close of 0.79.
The Nifty Put-Call ratio stood at 0.99, compared with the previous week’s close of 0.76.

Slide 6
Domestic Debt Market
Debt Indicators
(Yield %)
Current
Value
1-Wk
Ago
1-Mth
Ago
6-Mth
Ago
Call Rate 6.38 6.36 6.75 6.65
91 Day T-Bill 6.80 6.83 7.21 7.06
08.27% 2020 , (5 Yr GOI) 7.37 7.34 7.66 7.63
07.59% 2026, (10 Yr GOI) 7.44 7.45 7.58
Source: Reuters Values as on Apr 13, 2016
In a holiday truncated week, bond
yields traded in a tight range and
inched down after retail inflation fell to
a six-month low level in Mar 2016.
Increasing hopes that an above-
normal monsoon this year could lead
to further monetary easing by the
Reserve Bank of India (RBI) boosted
market sentiments
Yield on 10-year benchmark bond
(7.59% GS 2026) fell 1 bps to close
at 7.44%, from the previous close of
7.45%. It moved in a range of 7.40%
to 7.46% during the week.
Banks’ net average borrowing under
RBI’s Liquidity Adjustment Facility
stood at Rs. 1,858.67 crore,
compared with the previous week’s
lending of Rs. 9,553.0 crore.
7.40
7.43
7.45
11-Apr 12-Apr 13-Apr
Yie
ld in %
10 -Yr Benchmark Bond ( % )
Source: CCIL

Slide 7
Domestic Debt Market (Spread Analysis)
Maturity G-Sec Yield
(%)
Corporate Yield
(%)
Spread
bps
1 Year 7.24 7.61 38
3 Year 7.42 7.81 40
5 Year 7.63 7.94 31
10 Year 7.68 8.11 43
Source: Reuters Values as on Apr 13, 2016
Yields on gilt securities fell across the
maturities in the range of 1 bps to 9 bps,
barring 1 to 5-year papers that increased
in the range of 2 bps to 5 bps.
Corporate bond yields fell across the
maturities in the range of 5 bps to 11
bps. The highest contraction was
witnessed on 5-year paper and the
lowest on 1-year paper.
Difference in spread between AAA
corporate bond and gilt contracted
across the maturities in the range of 1
bps to 12 bps.
-4
1
6
6.70
7.35
8.00
3 Mths 6 Mths 1 Yr 5 Yrs 10 Yrs 20 Yrs 30 Yrs
India Yield Curve Shift (%) (W-o-W)
Change in bps 13-Apr-16 08-Apr-16
Yie
ld in %
Cha
nge
in b
ps
Source: Reuters

Slide 8
Regulatory Updates in India
According to media reports, SEBI rejected the Association of Mutual Fund of India’s (AMFI)
proposal to allow them to isolate risky assets from the rest of their portfolios and resultant
capital redemption. It said that such a practise may encourage fund managers to take
unnecessary risks.
The Indian mutual fund industry touched new milestone in FY16 with the number of total
folios reaching a five-year high level. According to the data from the Securities and
Exchange Board of India (SEBI), total number of folios stood at 4.8 crore in FY16, highest
since FY12 when it reached 4.6 crore. For equity schemes, the number of folios stood at
3.6 crore in FY16, while it was around 83 lakhs for debt funds. Market participants attributed
the rise in folios to higher retail investments in equity funds.
In an attempt to tap growing demand from retail investors, mutual fund houses filed draft
papers with SEBI to launch as many as 30 New Fund Offers. Retirement, fixed maturity
plan (FMP), and equity are some of the themes for which mutual fund houses have filed the
applications. Unlike the traditional method of launching funds with English names, the
mutual fund houses have approached SEBI for launching plans with Hindi names. Such an
endeavour is expected to help rural investors to understand schemes’ objectives better.

Slide 9
Regulatory Updates in India (contd..) Reserve Bank of India governor launched Unified Payments Interface (UPI), a new payment
system, which will allow sending and receiving money across banks just through a single
identification, without sharing financial information.
The Supreme Court asked the Reserve Bank of India to publicly disclose the total amount
that defaulters owe to the banks. Earlier, RBI, resisted the apex court’s proposal by saying
that it would violate confidentiality and hurt business sentiments, impacting the economy.
The interest rate payable by the Centre and states on the loan provided by National Small
Savings Fund (NSSF) will be 8.8% for FY16-17, down from last fiscal’s 9.5%, following
decline in interest rates on small savings. NSSF gives loans from its net collection to Centre
and State and Union territories governments.
The government launched a model Agricultural Land Leasing Act, 2016, which will legalise
leasing of land in the country. The move is expected to promote agricultural efficiency,
equity, and poverty reduction. The new act, once adopted by the respective states, will
overrule any other existing act. According to the act, the owner of the land can now legally
enter into a lease contract with the tenant for use of his/her agricultural land for agriculture
and allied activities for a specified period for a consideration based on an agreement with
terms and conditions mutually agreed by the owner and the cultivator.

Slide 10
Global News/Economy The International Monetary Fund (IMF), in its latest World Economic Outlook, reported that
global economy will continue to grow, but at a slower pace due to increasing financial and
geopolitical risks. Resultantly, the IMF reduced its global economic growth outlook from
3.4% to 3.2% for 2016. Similarly, the growth outlook for 2017 has been lowered from 3.6% to
3.5%.
According to the Commerce Department, U.S. retail sales fell 0.3% MoM in Mar 2016, worse
than market expectation. The fall was primarily attributed to a steep drop in auto sales. Retail
sales in the previous month were revised at 0.1% drop in Feb 2016. Excluding auto sales,
retail sales increased 0.2% in Mar.
As per the minutes of the Bank of England’s latest policy meeting, policymakers did not vote
in favour of the U.K.’s exit from the European Union as they thought it would cause
prolonged uncertainty and hurt the economic outlook. This pushed policymakers to keep
policy rates unchanged.
As per the data published by the General Administration of Customs, exports in China
increased 11.5% YoY in Mar 2016 compared with the decline of 25.4% in Feb 2016. The
report also said that the exports in China increased at fastest pace in a year, and imports
declined at a slower pace.

Slide 11
Global Equity Markets Global Indices
Indices 15-Apr-15 1-Week
Return
YTD
Return
Dow Jones 17897.46 1.82% 4.36%
Nasdaq 100 4543.161 1.52% 1.01%
FTSE 100 6343.75 2.25% 4.11%
DAX Index 10051.57 4.46% -2.25%
Nikkei Average 16848.03 6.49% -8.69%
Straits Times 2923.94 4.12% 3.10%
Source: Reuters Values as on Apr 15, 2016
U.S. U.S. markets gained as global crude
oil prices stabilized, and encouraging
trade data from China eased
concerns over the health of the global
economy. Unexpected decline in U.S.
retail sales and producer prices for
Mar made investors optimistic that the
Federal Reserve may delay raising
interest rates. Corporate earning
numbers from a couple of industry
majors in the finance sector came in
line with market estimates. Europe
European markets moved up as energy stocks benefited from stability in global crude oil
prices. A stronger than expected Chinese exports data drove the markets higher. Even
International Monetary Fund’s trimming of euro area growth projection for 2016 to 1.5%
and for 2017 to 1.6% didn’t deter the markets.
Asia
Asian markets gained during the week after the World Bank commented that China will
remain the main driver of growth in Asia this year despite prolonged slowdown, and the
nation’s exports jumped 11.5% year-over-year in Mar, the first increase since June.
Markets got a further boost after Singapore's central bank unexpectedly eased its
currency policy. Encouraging corporate earning numbers added to the gains.

Slide 12
Global Debt (U.S.) The 10-year U.S. Treasury bond yield
increased 3 bps to close at 1.75%,
compared with the previous week’s
close of 1.72%.
The U.S. Treasury prices fell initially
following increase in global crude oil
prices amid reports that Saudi Arabia
and Russia had agreed to freeze
crude output. Growing hopes of
stimulus measures from the Chinese
government also weighed on
Treasury prices
However, losses were restricted after
U.S. retail sales and producer prices
fell unexpectedly in Mar and U.S.
consumer prices went up less than
expected during the same period,
renewing concerns over the health of
the U.S. economy.
1.70
1.75
1.80
11-Apr 12-Apr 13-Apr 14-Apr 15-Apr
US 10-Year Treasury Yield Movement
Source: Reuters

Slide 13
Commodities Market
Performance of various commodities
Commodities Last Closing 1-Week Ago
Brent Crude($/Barrel) 40.91 40.31
Gold ($/Oz) 1233.66 1240.01
Gold (Rs/10 gm)** 28901 29080
Silver ($/Oz) 16.21 15.34
Silver (Rs/Kg)** 37858 36651
Source: Reuters ** Last closing as on Apr 13, 2016 Values as on Apr 15, 2016
Gold
Gold prices inched up initially during
the week as a series of weak U.S.
economic data lowered chances of the
Fed raising interest rates. Bullion prices
pared gains later as investors’ appetite
for riskier assets dampened the safe-
haven appeal of the yellow metal.
Crude
Brent crude prices went up initially as a
media report stated that Russia and
Saudi Arabia have reached a
consensus on oil output freeze. Gains
were trimmed as investors turned
cautious ahead of the meeting between
major oil producers to discuss output
freeze on Apr 17.
Baltic Dry Index
The Baltic Dry Index went up during the
week due to higher capesize and
panamax activities.
9.30
10.10
10.90
11.70
15-Mar-16 25-Mar-16 4-Apr-16 14-Apr-16
Global Commodity Movement
Gold Spot ($/Oz) Silver Spot ($/Oz) Brent ($/bbl)
Glo
ba
l C
om
mo
dity P
rice
s
Rebased to 10
Source: Reuters
1.49%
-0.51%
5.66%
15-Apr-16

Slide 14
Currencies Markets
Movement of Rupee vs Other Currencies
Currency Last Closing 1-Wk Ago
US Dollar 66.43 66.47
Pound Sterling 94.67 94.04
EURO 75.46 75.90
JPY(per 100 Yen) 60.98 61.04
Source: RBI Figures in INR , Values as on Apr 13, 2016
Rupee
The Indian rupee gained against the U.S.
dollar amid a holiday-truncated week.
Gains in the local equity market and debt-
related inflows outweighed demand for
greenback from importers.
Euro
Euro weakened against the U.S. dollar as
risk appetite improved after upbeat export
data from China.
Pound
Pound gained against the U.S. dollar on
improved risk appetite across markets and
better than expected consumer inflation
data from the U.K.
Yen
Yen weakened against the U.S. dollar as
safe haven appeal diminished after upbeat
export data from China.
9.70
9.97
10.24
10.51
13-Mar-16 23-Mar-16 2-Apr-16 12-Apr-16
USD GBP Euro JPY Source: RBI
Cu
rren
cy P
rice
s (
in t
erm
s o
f IN
R)
Rebased to 10 Currency Movement
13-Apr-16
-0.57%
-0.06% 0.67%
-0.10%

Slide
The Week that was…
April 11 to April 15
15

Slide 16
The Week that was (Apr 11– Apr 15) Day Event Present Value Previous Value
Monday, April 11, 2016
China Consumer Price Index (MoM) (Mar) -0.40% 1.60%
China Producer Price Index (YoY) (Mar) -4.30% -4.90%
U.K. BRC Retail Sales Monitor (YoY) (Mar) -0.70% 0.10%
Tuesday, April 12, 2016
India Industrial Output (Feb) 2.00% -1.50%
India Consumer Price Index (MoM) (Mar) 4.83% 5.26%
U.K. Consumer Price Index (YoY) (Mar) 1.50% 1.20%
Germany Consumer Price Index (MoM) (Mar) 0.80% 0.80%
Wednesday, April 13, 2016
China Trade Balance USD (Mar) $29.86B $32.59B
U.S. Retail Sales (MoM) (Mar) -0.30% 0.00%
Euro Zone Industrial Production s.a. (MoM) (Feb) -0.80% 1.90%
Thursday, April 14, 2016 Euro Zone Consumer Price Index (MoM) (Mar) 1.20% 0.20%
Bank of England Interest Rate Decision 0.50% 0.50%
Friday, April 15, 2016
China Retail Sales (YoY) (Mar) 10.50% 10.12%
China Industrial Production (YoY) (Feb) 6.80% 5.40%
China Gross Domestic Product (YoY) (Q1) 6.70% 6.80%

Slide 17
The Week Ahead…
April 18 to April 22
Slide 18
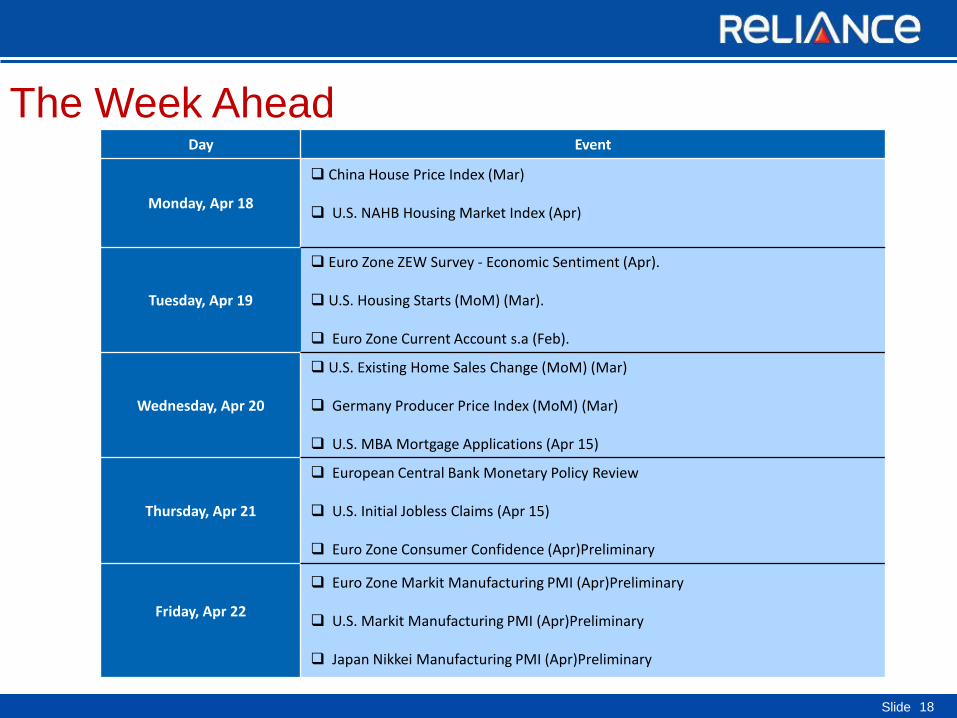
The Week Ahead Day Event
Monday, Apr 18
China House Price Index (Mar) U.S. NAHB Housing Market Index (Apr)
Tuesday, Apr 19
Euro Zone ZEW Survey - Economic Sentiment (Apr). U.S. Housing Starts (MoM) (Mar).
Euro Zone Current Account s.a (Feb).
Wednesday, Apr 20
U.S. Existing Home Sales Change (MoM) (Mar)
Germany Producer Price Index (MoM) (Mar)
U.S. MBA Mortgage Applications (Apr 15)
Thursday, Apr 21
European Central Bank Monetary Policy Review U.S. Initial Jobless Claims (Apr 15) Euro Zone Consumer Confidence (Apr)Preliminary
Friday, Apr 22
Euro Zone Markit Manufacturing PMI (Apr)Preliminary U.S. Markit Manufacturing PMI (Apr)Preliminary
Japan Nikkei Manufacturing PMI (Apr)Preliminary

Slide 19
Disclaimer The views expressed herein constitute only the opinions and do not constitute any guidelines or recommendation on any course of action to be
followed by the reader. This information is meant for general reading purposes only and is not meant to serve as a professional guide for the readers.
Certain factual and statistical (both historical and projected) industry and market data and other information was obtained by RCAM from independent,
third-party sources that it deems to be reliable, some of which have been cited above. However, RCAM has not independently verified any of such
data or other information, or the reasonableness of the assumptions upon which such data and other information was based, and there can be no
assurance as to the accuracy of such data and other information. Further, many of the statements and assertions contained in these materials reflect
the belief of RCAM, which belief may be based in whole or in part on such data and other information. The Sponsor, the Investment Manager, the
Trustee or any of their respective directors, employees, affiliates or representatives do not assume any responsibility for, or warrant the accuracy,
completeness, adequacy and reliability of such information. Whilst no action has been solicited based upon the information provided herein, due care
has been taken to ensure that the facts are accurate and opinions given are fair and reasonable. This information is not intended to be an offer or
solicitation for the purchase or sale of any financial product or instrument. Recipients of this information should rely on information/data arising out of
their own investigations. Readers are advised to seek independent professional advice, verify the contents and arrive at an informed investment
decision before making any investments. None of the Sponsor, the Investment Manager, the Trustee, their respective directors, employees, affiliates or
representatives shall be liable for any direct, indirect, special, incidental, consequential, punitive or exemplary damages, including lost profits arising in
any way from the information contained in this material. The Sponsor, the Investment Manager, the Trustee, any of their respective directors,
employees including the fund managers, affiliates, representatives including persons involved in the preparation or issuance of this material may from
time to time, have long or short positions in, and buy or sell the securities thereof, of company (ies) / specific economic sectors mentioned herein.
Statutory Details: Reliance Mutual Fund has been constituted as a trust in accordance with the provisions of the Indian Trusts Act, 1882. Sponsor:
Reliance Capital Limited. Trustee: Reliance Capital Trustee Company Limited. Investment Manager: Reliance Capital Asset Management Limited
(Registered Office of Trustee & Investment Manager: ‘H’ Block,1st Floor, Dhirubhai Ambani Knowledge City, Koparkhairne, Navi Mumbai - 400 710.
Maharashtra). The Sponsor, the Trustee and the Investment Manager are incorporated under the Companies Act 1956. The Sponsor is not
responsible or liable for any loss resulting from the operation of the Scheme beyond their initial contribution of Rs.1 lakh towards the setting up of the
Mutual Fund and such other accretions and additions to the corpus. Mutual fund investments are subject to market risks. Please read the
Scheme Information Document and Statement of Additional Information carefully before investing.
All information contained in this document has been obtained by ICRA Online Limited from sources believed by it to be accurate and reliable. Although
reasonable care has been taken to ensure that the information herein is true, such information is provided ‘as is’ without any warranty of any kind, and
ICRA Online Limited or its affiliates or group companies and its respective directors, officers, or employees in particular, makes no representation or
warranty, express or implied, as to the accuracy, suitability, reliability, timelines or completeness of any such information. All information contained
herein must be construed solely as statements of opinion, and ICRA Online Limited, or its affiliates or group companies and its respective directors,
officers, or employees shall not be liable for any losses or injury, liability or damage of any kind incurred from and arising out of any use of this
document or its contents in any manner, whatsoever. Opinions expressed in this document are not the opinions of our holding company, ICRA Limited
(ICRA), and should not be construed as any indication of credit rating or grading of ICRA for any instruments that have been issued or are to be issued
by any entity.

Thank you