news release - home – bunzl · pdf filenews release bunzl plc, york house, 45 seymour...
TRANSCRIPT

News Release
Bunzl plc, York House, 45 Seymour Street, London W1H 7JT. Telephone +44 (0)20-7725 5000
29 August 2017
HALF YEARLY FINANCIAL REPORT FOR SIX MONTHS ENDED 30 JUNE 2017
Bunzl plc, the international distribution and outsourcing Group, today publishes its half yearly financial report for the six months ended 30 June 2017. Financial results
H1 17 H1 16 Growth as reported
Growth at constant
exchange Revenue £4,119.2m £3,446.8m 20% 7% Adjusted operating profit* £272.6m £235.1m 16% 4% Adjusted profit before income tax* £248.3m £210.6m 18% 5% Adjusted earnings per share* 55.1p 46.2p 19% 7% Interim dividend 14.0p 13.0p 8% Statutory results Operating profit £206.2m £180.1m 14% Profit before income tax £181.9m £155.6m 17% Basic earnings per share 40.0p 33.8p 18% Highlights include: • Good increases at constant exchange rates in revenue, adjusted operating profit* and adjusted earnings per
share*
• Organic revenue growth increased to 3.7% • Group operating margin* down 20 basis points to 6.6%, principally due to the impact of lower margin business
won in North America • Eleven acquisitions announced to date, including one announced today, with a total committed spend of
£546 million • Return on average operating capital of 54.3% with return on invested capital of 16.4% • Continued strong cash conversion (operating cash flow† to adjusted operating profit*) of 96% • 24 year track record of dividend growth continues with an increase of 8% in the interim dividend * Before customer relationships amortisation, acquisition related items and associated tax where relevant (see Note 1) † Before acquisition related items (see Consolidated cash flow statement) Commenting on today’s results, Frank van Zanten, Chief Executive of Bunzl, said: “Bunzl has once again delivered good increases in revenue, adjusted operating profit and adjusted earnings per share. I am particularly pleased to report a significant pick up in the level of organic revenue growth to 3.7% during the first half of 2017 following the previously announced new business win in North America last year. It is also good to see that acquisition activity, which continues to be an important part of our growth strategy, has accelerated in 2017. With four months of the year remaining, we are already at a record level of annual committed spend of £546 million including two larger businesses, being DDS in the US and the proposed acquisition of the Hedis group in France. Looking forward, we are confident that the prospects for the Group are positive and that the Company will continue to grow and develop further both organically and through acquisition.”
-2-
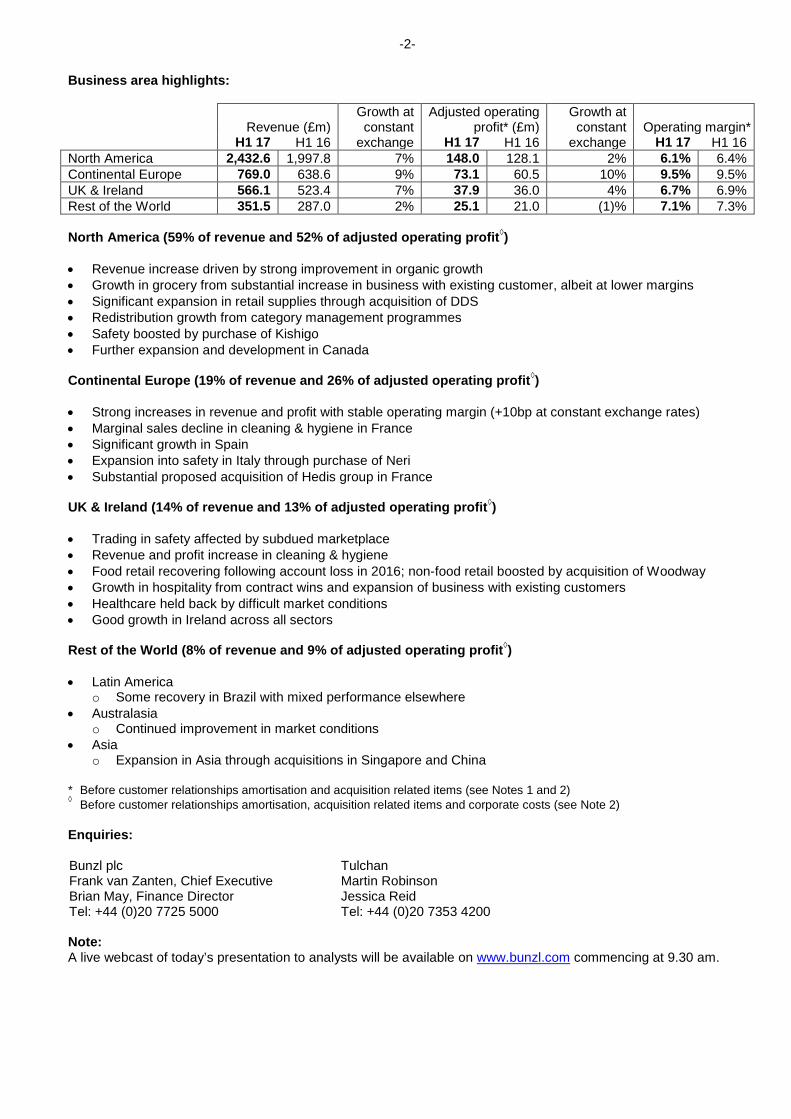
Business area highlights:
Revenue (£m)
Growth at constant
Adjusted operating profit* (£m)
Growth at constant
Operating margin*
H1 17 H1 16 exchange H1 17 H1 16 exchange H1 17 H1 16 North America 2,432.6 1,997.8 7% 148.0 128.1 2% 6.1% 6.4% Continental Europe 769.0 638.6 9% 73.1 60.5 10% 9.5% 9.5% UK & Ireland 566.1 523.4 7% 37.9 36.0 4% 6.7% 6.9% Rest of the World 351.5 287.0 2% 25.1 21.0 (1)% 7.1% 7.3% North America (59% of revenue and 52% of adjusted operating profit◊) • Revenue increase driven by strong improvement in organic growth • Growth in grocery from substantial increase in business with existing customer, albeit at lower margins • Significant expansion in retail supplies through acquisition of DDS • Redistribution growth from category management programmes • Safety boosted by purchase of Kishigo • Further expansion and development in Canada Continental Europe (19% of revenue and 26% of adjusted operating profit◊) • Strong increases in revenue and profit with stable operating margin (+10bp at constant exchange rates) • Marginal sales decline in cleaning & hygiene in France • Significant growth in Spain • Expansion into safety in Italy through purchase of Neri • Substantial proposed acquisition of Hedis group in France UK & Ireland (14% of revenue and 13% of adjusted operating profit◊) • Trading in safety affected by subdued marketplace • Revenue and profit increase in cleaning & hygiene • Food retail recovering following account loss in 2016; non-food retail boosted by acquisition of Woodway • Growth in hospitality from contract wins and expansion of business with existing customers • Healthcare held back by difficult market conditions • Good growth in Ireland across all sectors Rest of the World (8% of revenue and 9% of adjusted operating profit◊) • Latin America
o Some recovery in Brazil with mixed performance elsewhere • Australasia
o Continued improvement in market conditions • Asia
o Expansion in Asia through acquisitions in Singapore and China * Before customer relationships amortisation and acquisition related items (see Notes 1 and 2) ◊ Before customer relationships amortisation, acquisition related items and corporate costs (see Note 2) Enquiries: Bunzl plc Frank van Zanten, Chief Executive Brian May, Finance Director Tel: +44 (0)20 7725 5000
Tulchan Martin Robinson Jessica Reid Tel: +44 (0)20 7353 4200
Note: A live webcast of today’s presentation to analysts will be available on www.bunzl.com commencing at 9.30 am.
-3-
CHAIRMAN’S STATEMENT Results
Although both the macroeconomic and market conditions have remained variable in many of the countries and sectors
in which we operate, I am pleased to report that Bunzl has produced another good set of results for the first half of
2017. Overall currency translation movements, due to the weakening of sterling, had a significant positive impact on
the reported Group growth rates at actual exchange rates.
Group revenue for the first half of 2017 increased 20% to £4,119.2 million (2016: £3,446.8 million) and adjusted
operating profit before customer relationships amortisation and acquisition related items was up 16% to £272.6 million
(2016: £235.1 million). Adjusted earnings per share were 55.1p (2016: 46.2p), an increase of 19%.
At constant exchange rates, revenue increased by 7% and adjusted operating profit rose by 4% with the Group
operating margin declining from 6.8% to 6.6%. Adjusted earnings per share were up 7%.
Return on average operating capital decreased to 54.3% from 55.9% at 31 December 2016 due to a lower operating
margin and higher operating capital in the underlying business and the impact of a lower return on operating capital
from acquisitions. Return on invested capital of 16.4% was down from 16.7% at 31 December 2016 due to the effect of
acquisitions and a lower underlying return on average operating capital.
Dividend
The Board has decided to increase the interim dividend by 8% to 14.0p. Shareholders will again have the opportunity
to participate in our dividend reinvestment plan.
Strategy
We continue to pursue our proven strategy of developing the business through organic growth, consolidating the
markets in which we compete through focused acquisitions and continuously improving the quality of our operations
and making our businesses more efficient. Acquisition activity has accelerated in 2017. Including the acquisition
announced today, we have acquired, or agreed in principle to acquire, 11 businesses so far this year. The committed
spend in respect of these acquisitions is £546 million, adding annualised revenue of £543 million.
Board
David Sleath, who had served as a non-executive director since 2007, retired after the Company’s Annual General
Meeting in April 2017. Lloyd Pitchford, who is currently Chief Financial Officer of Experian plc, was appointed as a non-
executive director with effect from 1 March 2017 and assumed the role of Chairman of the Audit Committee upon
David’s retirement when Vanda Murray also became the Senior Independent Director. Stephan Nanninga, a Dutch
national who has had extensive international experience across a range of businesses operating in the distribution and
service sectors, joined the Board as a non-executive director on 1 May 2017.
CHIEF EXECUTIVE’S REVIEW Operating performance
With more than 85% of the Group’s revenue generated outside the UK, the weakening of sterling against most
currencies has had a significant positive translation impact on the Group’s reported results, increasing revenue, profits
and earnings by approximately 12%. As in previous reporting periods, the operations, including the relevant growth
rates and changes in operating margin, are therefore reviewed below at constant exchange rates to remove the
distorting impact of these currency movements. Changes in the level of revenue and profits at constant exchange rates
have been calculated by retranslating the results for the first half of 2016 at the average rates used for 2017. Unless

-4-
otherwise stated, all references in this review to operating profit are to adjusted operating profit (being operating profit
before customer relationships amortisation and acquisition related items) while operating margin refers to adjusted
operating profit as a percentage of revenue.
Revenue increased 7% (20% at actual exchange rates) to £4,119.2 million due to the positive impact of acquisitions
together with an improved level of organic growth. Consistent with the trends seen during the fourth quarter of 2016,
organic revenue continued to increase in the first half of 2017 and was up 3.7% compared to the same period last year
mainly as a result of the additional business won in North America towards the end of 2016. Operating profit was
£272.6 million, an increase of 4% (16% at actual exchange rates). The percentage growth in operating profit was lower
than that of revenue principally due to the impact of the business won in North America being at an operating margin
below the Group average, resulting in a decline in the Group operating margin by 20 basis points at both constant and
actual exchange rates to 6.6%.
In North America revenue rose 7% (22% at actual exchange rates) due to the impact of higher organic growth together
with the effect of acquisitions, while operating profit increased 2% (16% at actual exchange rates) as the operating
margin declined 30 basis points at both constant and actual exchange rates to 6.1% due to the impact of the lower
margin business won. Revenue in Continental Europe rose 9% (20% at actual exchange rates) as a result of the
impact of acquisitions and organic revenue growth, with operating profit up 10% (21% at actual exchange rates) as the
operating margin improved 10 basis points at constant exchange rates (unchanged at actual exchange rates) to 9.5%.
In UK & Ireland revenue was up 7% (8% at actual exchange rates) due to the impact of acquisitions and operating
profit increased 4% (5% at actual exchange rates) with the operating margin decreasing by 20 basis points at both
constant and actual exchange rates to 6.7%. In Rest of the World revenue increased 2% (22% at actual exchange
rates) and operating profit was down 1% (up 20% at actual exchange rates) with the business area operating margin
reducing 20 basis points at both constant and actual exchange rates to 7.1%.
Adjusted profit before income tax (being profit before income tax, customer relationships amortisation and acquisition
related items) was £248.3 million, up 5% (18% at actual exchange rates) due to the growth in adjusted operating profit
and a lower net interest charge. Profit before income tax was £181.9 million, an increase of 4% (17% at actual
exchange rates). Basic earnings per share were 6% higher (18% at actual exchange rates) at 40.0p. Adjusted
earnings per share, which excludes the effect of customer relationships amortisation and acquisition related items,
were 55.1p, an increase of 7% (19% at actual exchange rates).
Once again the operating cash flow, which is before acquisition related items, was very strong with cash conversion
(the ratio of operating cash flow to adjusted operating profit) at 96%. The ratio of net debt to EBITDA calculated at
average exchange rates increased from 2.0 times at the end of 2016 to 2.2 times.
Acquisitions Acquisition activity has picked up significantly in 2017. So far this year, including the transaction we have
announced today, we have acquired, or agreed in principle to acquire, 11 businesses for a total committed spend of
£546 million. These include two larger transactions being DDS in the US and a group of businesses in France
consisting of Hedis, Comptoir de Bretagne and Générale Collectivités. With four months of the year remaining,
2017 already represents a record level of annual acquisition spend for Bunzl and significantly exceeds the previous
high of £327 million achieved in 2015.
In January, in addition to completing the purchase of Sæbe Compagniet and Prorisk and GM Equipement, which
we agreed to acquire in November 2016, we acquired two further businesses. Early in the month we purchased

-5-
the business of Packaging Film Sales which distributes food packaging products, including flexible barrier films and
speciality bags and pouches, to food processors in the US. Revenue in 2016 was £5 million. At the end of January
we acquired LSH, a distributor of safety products, primarily to end users, based in Singapore. This represents our
first step into Singapore and provides a base from which to develop our operations in Asia. Revenue in 2016 was
£5 million.
At the end of March we completed two acquisitions. ML Kishigo, which is engaged in the sale of high visibility
clothing and other safety related workwear to distributors throughout the US, provides customised solutions for its
customers and brings additional expertise and an extended product portfolio to our existing safety business in the
US. Revenue in 2016 was £27 million. Neri supplies a broad range of personal protection equipment, including
gloves, footwear and workwear, to both distributors and end users throughout Italy and takes us into the important
safety market there for the first time. Revenue in 2016 was £41 million.
We completed four transactions during May. DDS is a distributor of goods not-for-resale and value-added services
to retailers and other general distribution customers, principally throughout North America. The business supplies
a wide range of packaging, consumables and operating store supplies through a variety of distribution and
outsourcing programmes and has expanded and extended our operations, particularly in relation to the retail
sector. Revenue in 2016 was £248 million. Tecnopacking is engaged in the distribution of industrial and
disposable packaging products to end users operating in a variety of different sectors throughout Spain as well as
in Portugal. Revenue in 2016 was £33 million. This acquisition has further extended our operations in Spain which
have grown significantly in recent years with total annualised revenue now approaching €200 million. We also
acquired two separate businesses in Canada at the end of May. AMFAS and Western Safety are distributors of
commercial and industrial first aid and safety supplies, including a full range of personal protection equipment, to
end user customers throughout Western Canada. The businesses, which together had aggregated annualised
revenue of £10 million in 2016, also provide safety-related services including training programmes and other
workplace safety solutions.
Pixel Inspiration was purchased at the end of June. A marketing services business which specialises in the digital
signage sector, Pixel provides project-based installations for multi-site retailers and financial institutions in the UK
and is also engaged in the provision of management and consultancy services related to the usage of such
installations. Revenue in 2016 was £7 million.
Towards the end of July the Company made a binding offer for the acquisition of a group of businesses in France.
Hedis, which trades through a number of subsidiaries, is engaged in the sale and distribution of cleaning & hygiene
related products to a variety of end user customers, principally in the public, healthcare, foodservice and cleaning
sectors, as well as to some redistributors. Two other businesses, Comptoir de Bretagne and Générale
Collectivités, distribute light catering equipment and tableware to a similarly fragmented customer base in France.
In 2016 the aggregate revenue of the businesses to be acquired was £134 million, of which £113 million related to
Hedis and £21 million related to Comptoir de Bretagne and Générale Collectivités. The consultation process with
the relevant works councils of the target companies has now been completed. It is anticipated that the final sale
and purchase documentation will be entered into shortly and completion of the acquisition will take place towards
the end of the year, subject to the approval of the transaction by the French competition authority.
Today we are also announcing the acquisition of HSESF and its associated companies in China. Based in
Shanghai with operations in four other provinces in eastern China, the businesses are principally engaged in the
-6-
sale of a variety of personal protection equipment to local distributors and end users but also export products to
customers overseas. The aggregate revenue of the businesses acquired was £24 million in 2016.
North America
Six months to 30.6.17
£m
Six months to 30.6.16
£m
Growth at constant
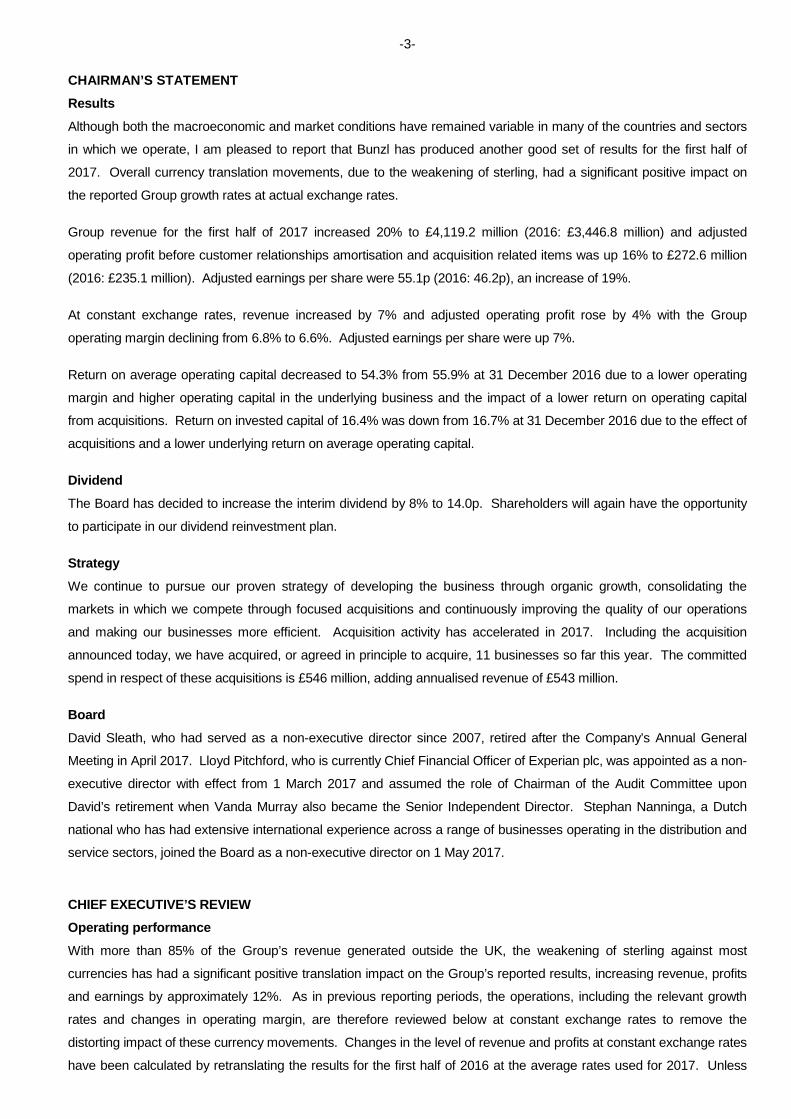
exchange Revenue 2,432.6 1,997.8 7% Adjusted operating profit* 148.0 128.1 2% Operating margin* 6.1% 6.4% * Before customer relationships amortisation and acquisition related items (see Notes 1 and 2) In North America, revenue increased by 7% to £2,432.6 million, primarily due to a substantial increase in business
with an existing grocery customer, which helped drive organic sales growth to 5%, as well as the impact of recent
acquisitions. The rate of organic growth was higher than in the recent past although the additional business won is
at an operating margin below the average margin for the North America business area. Operating profit therefore
increased by 2% to £148.0 million, with the operating margin declining to 6.1%.
Our largest business serving the grocery sector benefited from several new accounts and additional business with
one existing customer in particular has increased our capacity to handle pick and pack items which will allow us to
expand our service to other customers requesting this type of product handling. We are working on programmes to
make our operations in this sector more efficient, particularly as our customers themselves grow and expand. Our
variety of delivery options and value-added services continue to provide our customers with an effective and
efficient solution for sourcing large volume, low value not-for-resale items.
Our retail supplies business has benefited significantly from the acquisition in May of DDS which complements our
existing business by providing additional merchandising and delivery capabilities to multi-channel retailers. DDS’s
experience with speciality retailers will allow us to offer more products across our customer base and expand their
operating model to many of our existing customers. By combining their expertise in this sector with our
transportation system, consolidation facilities, extensive distribution network and scale, we can deliver a more
robust and complete market leading service to all types of retailers.
Our redistribution business serving the foodservice and janitorial and sanitation (‘jan-san’) sectors has grown during
the first half as a result of the success of our category management programme for our larger national and regional
customers. As their partner on this programme, we provide our customers with support throughout the supply
chain from the supplier to the end user. We focus on reducing their operating costs and improving their capital
management practices by optimising the flow of products that are costly for them to handle. In addition, our
experienced national sales team, using the expanded e-commerce and digital tool capabilities that we have
available, is able to offer our customers an effective solution to ensure that they can target specific products for
specific customers. We have also continued to expand our central warehouse system for jan-san items. This,
together with our ongoing investment in marketing tools and the development of new product items, has contributed
to our growth with foodservice distributor customers by allowing them to offer more products to their own
customers.
-7-
Although our business serving the food processor sector has experienced ongoing margin pressures due to the
continuing consolidation of several large customers, we have again delivered good results. We moved the
operations from our largest facility servicing this business into a new, modern warehouse that will drive more
efficiencies and provide opportunities to grow further. This facility now includes state-of-the-art automation to
facilitate the handling of small, individual items. Our national accounts strategy continues to deliver new ways to
expand our offer to our larger customers through the use of additional digital and marketing tools that we have
developed.
Revenue and operating profit declined in our operations that supply the agricultural sector due to adverse weather
conditions in California which affected the fruit and vegetable harvests. However, our continued investment in the
business has helped to generate new opportunities for us, particularly in Mexico. Following completion of the
integration of these businesses onto one IT platform, we have begun to change our warehouse footprint to improve
efficiencies and to be closer to our customers’ locations. These initiatives will allow us to generate cost savings
while at the same time gain new business through the enhanced service levels that we are able to provide.
Our safety business saw some improvement in sales due to the purchase of ML Kishigo at the end of March but
operating profit was slightly down against the backdrop of challenging market conditions in the oil and gas sector.
The acquisition has provided access to a broad, own label range of new and innovative high visibility clothing and
other safety-related workwear. These items complement our existing range of safety products and are now
available to all of our customers in this sector.
In the convenience store sector, both revenue and operating profit once again increased as we continued to
execute our pull-through strategy by partnering with our primary wholesale customers to develop even stronger
relationships with the national and regional convenience store chains. Our ability to manage our customers’
inventory and provide excellent fill rates and just-in-time delivery services continues to prove our value.
Finally, our business in Canada has shown good revenue and operating profit growth through the impact of recent
acquisitions. These include the purchase of AMFAS and Western Safety during the first half of the year. In
addition to distributing commercial and industrial first aid and safety supplies, including a full range of personal
protection equipment, they also provide safety-related services including training programmes and other workplace
safety solutions.
Continental Europe Six months to
30.6.17 £m
Six months to 30.6.16
£m
Growth at constant
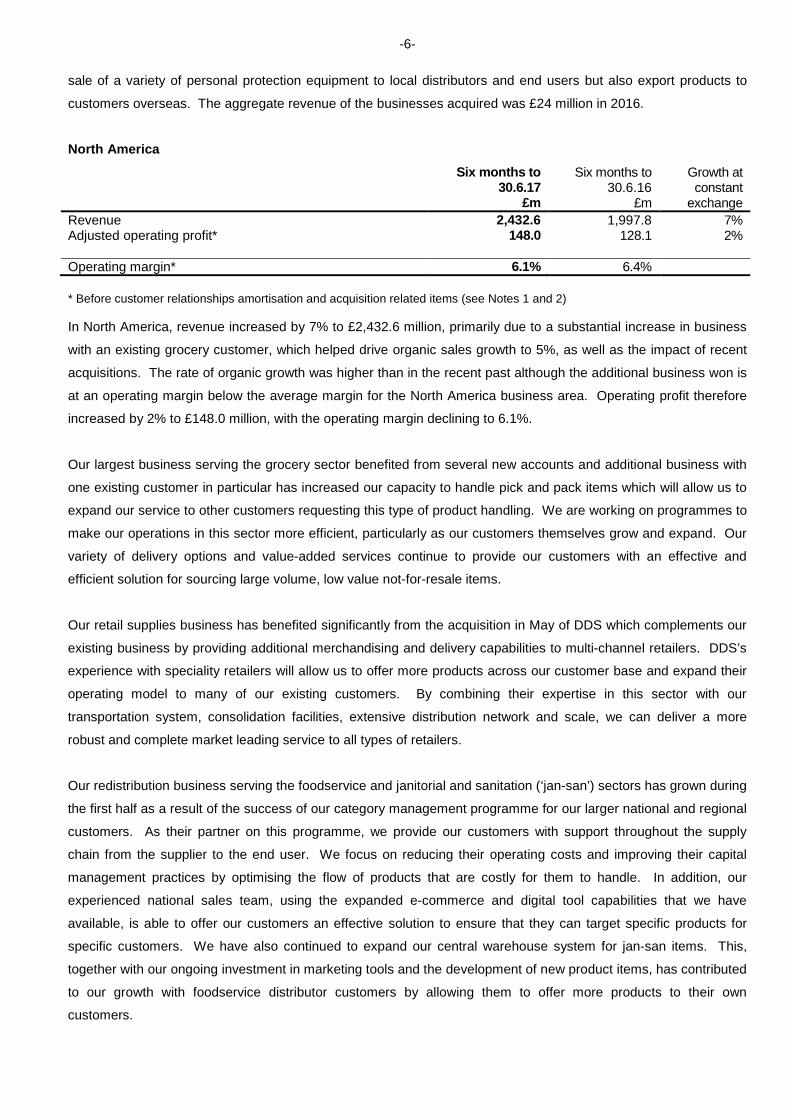
exchange Revenue 769.0 638.6 9% Adjusted operating profit* 73.1 60.5 10% Operating margin* 9.5% 9.5% * Before customer relationships amortisation and acquisition related items (see Notes 1 and 2) Revenue in Continental Europe rose by 9% at constant exchange rates to £769.0 million and operating profit
increased 10% to £73.1 million. Gross margins and operating costs continued to be carefully managed and, as a
result, the operating margin increased by 10 basis points at constant exchange rates (unchanged at actual
exchange rates) to 9.5%. Organic sales growth was 2%, an improvement over the comparable period in 2016, and
-8-
this was supplemented by the incremental impact of the five acquisitions completed in 2016 as well as from the four
businesses acquired during the first half of 2017.
In France, sales in our cleaning & hygiene business declined marginally as an underlying improvement in growth
with smaller, regional customers, particularly in the hotel, restaurant and catering (‘horeca’) sector as well as in the
industrial and food sectors, was not sufficient to offset fully the impact of the loss of two larger accounts. Sales
improved at our safety business, particularly with a number of larger accounts, albeit at lower margins. Prorisk and
GM Equipement, acquired at the end of January, have been fully integrated onto our ERP system and their stock
relocated to our main safety product warehouse. Comatec, our foodservice business, saw a significant increase in
sales, both in France and in the export market, resulting in improved profits. The proposed purchase of Hedis,
Comptoir de Bretagne and Générale Collectivités, which was announced in July and is expected to be completed
towards the end of the year, will further expand our existing cleaning & hygiene operations in France and extend
our business there into the catering equipment sector for the first time.
In the Netherlands, sales increased in the horeca, grocery, non-food retail and healthcare sectors but fell in the
cleaning, government and safety sectors. Business with customers in the retail and healthcare sectors in particular
was boosted by two larger account wins. Margin pressure and some one-off costs relating to implementation of
these new contracts led to a slight decline in operating profit.
In Belgium, sales grew in the cleaning & hygiene sector but our retail sector business continues to suffer from
difficult trading conditions as our customers face competition from lower cost retail chains. Gross margins
improved but we incurred some one-off costs relating to an IT implementation and warehouse relocation in the
cleaning & hygiene sector. Polaris Chemicals, acquired in 2016, has performed ahead of expectations.
In Germany, sales were lower in all sectors, with the exception of the hotel sector, although gross margins
improved. This, combined with the impact of operating cost reductions in all businesses, led to an improvement in
operating profit. Inkozell and MoHaGe, which were acquired in May 2016, have integrated well into the Group.
Our Swiss business has returned to sales growth, despite continued pressure in the tourism sector, due to strong
performances in the industrial, retail and medical sectors. Lower costs in the business serving the horeca sector
also contributed to a significantly higher operating profit. In Austria, Meier Verpackungen saw an improvement in
sales in particular to the fruit and vegetable and dairy sectors. Margins also improved leading to a strong increase
in operating profit.
In Denmark, sales were behind last year in all sectors, in particular due to fewer capital goods being sold into the
retail sector and the loss of a major public sector customer in the latter part of last year. Gross margins improved
and costs were reduced but this did not fully offset the impact of lower sales. Sæbe Compagniet, a distributor of
cleaning & hygiene related products, was acquired at the start of the year.
In Spain, sales grew strongly in the cleaning & hygiene sector as a contract with a major customer continues to be
rolled out. Our safety businesses continued to deliver good growth and our medical business successfully
introduced a number of new products leading to substantially higher revenue. At the same time margins improved
such that operating profit increased significantly. Tecnopacking, a distributor of industrial and disposable
packaging based near Valencia, was acquired at the end of May.
-9-
In Italy, Neri was acquired at the end of March and has extended the Group’s operations into the safety sector
there for the first time. The business is trading in line with expectations.
In Turkey, sales at our safety business, Istanbul Ticaret, increased significantly due to both volume gains and the
price inflation impact of the devaluation of the Turkish lira. Gross margins remained stable and operating profit has
risen well. Sales and profits have also risen substantially at Bursa Pazari, the packaging and foodservice supplies
business we acquired in March 2016, which is trading well ahead of expectations.
In Israel, sales grew well in both of our businesses serving the horeca and bakery sectors. With margins also
improving and limited operating cost increases, operating profit increased substantially.
In Central Europe, sales grew strongly in Romania and the Czech Republic following customer wins. In Hungary,
sales also increased in the cleaning & hygiene and safety sectors although were lower in the retail sector. The two
acquisitions made in 2016, Silwell in Hungary and Blyth in the Czech Republic, are both trading ahead of
expectations.
UK & Ireland
Six months to 30.6.17
£m
Six months to 30.6.16
£m
Growth at constant
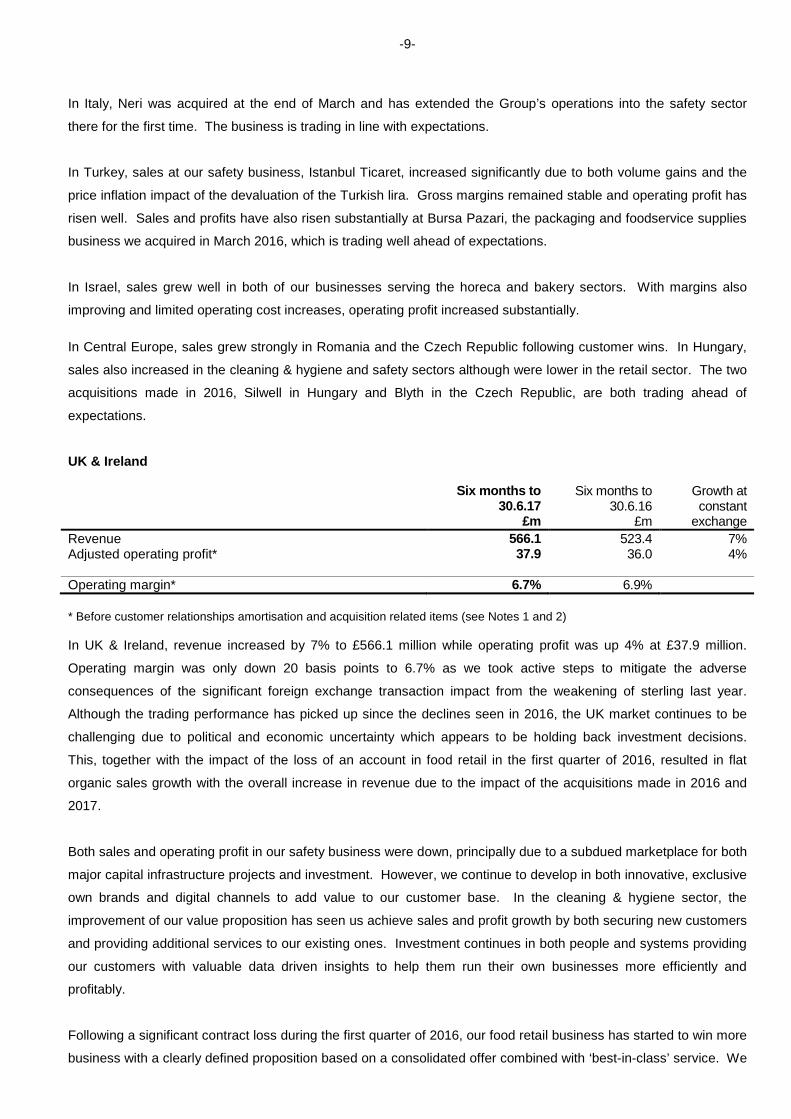
exchange Revenue 566.1 523.4 7% Adjusted operating profit* 37.9 36.0 4% Operating margin* 6.7% 6.9% * Before customer relationships amortisation and acquisition related items (see Notes 1 and 2)
In UK & Ireland, revenue increased by 7% to £566.1 million while operating profit was up 4% at £37.9 million.
Operating margin was only down 20 basis points to 6.7% as we took active steps to mitigate the adverse
consequences of the significant foreign exchange transaction impact from the weakening of sterling last year.
Although the trading performance has picked up since the declines seen in 2016, the UK market continues to be
challenging due to political and economic uncertainty which appears to be holding back investment decisions.
This, together with the impact of the loss of an account in food retail in the first quarter of 2016, resulted in flat
organic sales growth with the overall increase in revenue due to the impact of the acquisitions made in 2016 and
2017.
Both sales and operating profit in our safety business were down, principally due to a subdued marketplace for both
major capital infrastructure projects and investment. However, we continue to develop in both innovative, exclusive
own brands and digital channels to add value to our customer base. In the cleaning & hygiene sector, the
improvement of our value proposition has seen us achieve sales and profit growth by both securing new customers
and providing additional services to our existing ones. Investment continues in both people and systems providing
our customers with valuable data driven insights to help them run their own businesses more efficiently and
profitably.
Following a significant contract loss during the first quarter of 2016, our food retail business has started to win more
business with a clearly defined proposition based on a consolidated offer combined with ‘best-in-class’ service. We

-10-
are securing new customers as well as winning new product categories with existing customers. However, the food
retail sector remains challenging with strong competition between the retailers which drives a focus on usage and
price, thereby putting our revenue growth and margins under pressure. The high street also continues to provide
both opportunities and threats for our retail packaging businesses. We have recently managed to secure some
large existing customers by providing global solutions in a rapidly developing marketplace and our acquisition of
Woodway in December 2016 has further strengthened our offering in high quality packaging products with a
particular focus on e-commerce packaging solutions. The acquisition of Pixel Inspiration at the end of June has
expanded our marketing services offer into providing digital solutions in the fulfilment of point-of-sale merchandising
and will provide an excellent opportunity to grow further in this sector.
Within our catering and hospitality business we have had to contend with the impact of rising food prices and the
increase in national living wage on our customers’ costs which together have put further pressure on our
customers’ operating margins, thereby causing them to look for cost savings in our product categories. Despite
these trends, we have managed to grow both our sales and operating profit through new business wins and by
providing innovative new products and services to help our existing customers grow in this challenging and
competitive market. The combination of more flexible service solutions, development of our ‘food-to-go’ proposition
and proactive range penetration is helping secure more business with both new and existing customers.
The healthcare market in the UK continues to be a high profile focus for the government, particularly as it tries to
reduce costs. Within this environment, we have managed to grow sales by a combination of high service levels
and the development of a number of own brand products. The reluctance of some of our customers to accept price
increases in the wake of the devaluation of sterling means we have seen margins decline in some areas and
operating profit fall in the period. However, the growth in the private sector and our further penetration of the
nursing home marketplace has helped to offset some of this pressure.
Our business in Ireland has continued to grow both sales and operating profit strongly, supported by an improved
economic environment. We are currently in the process of moving to a new, purpose-built facility in Armagh, which
will improve efficiencies within our catering and hospitality businesses, and upgrading our IT and digital platforms
within our retail, cleaning and safety businesses based in Dublin. By having a number of specialist businesses
clearly focused on our specific markets, we continue to offer valued advice and insight to help our customers grow.
Rest of the World
Six months to 30.6.17
£m
Six months to 30.6.16
£m
Growth at constant
exchange Revenue 351.5 287.0 2% Adjusted operating profit* 25.1 21.0 (1)% Operating margin* 7.1% 7.3% * Before customer relationships amortisation and acquisition related items (see Notes 1 and 2)
In Rest of the World, revenue increased 2% to £351.5 million but operating profit was down 1% to £25.1 million with
operating margin down 20 basis points to 7.1%. Trading conditions have improved somewhat compared to the
recent past and the economic environments in the countries in which we operate have stabilised, but market
conditions remain variable across the business area. Of the total increase in revenue, just over 1% was due to the
organic growth of the underlying business, with acquisitions accounting for the balance.

-11-
In Brazil, the market is slowly recovering from the sharp contraction seen over the last two years, albeit against a
backdrop of renewed political uncertainty. In our safety sector, sales rose despite the continued headwinds from
increasing unemployment and low capital investment. The full integration of Casa do EPI, acquired in 2015, into
our existing safety business was completed successfully and is generating synergies. Previous initiatives taken to
improve gross margins have, together with the increase in sales, led to good growth in operating profit. In the
cleaning & hygiene sector, the recent gain of a significant new contract has led to strong sales growth.
In the Brazilian healthcare sector, sales continued to grow. Gross margins in our medical business came under
some pressure due to product mix but strong cost control offset this and operating margins were maintained. Our
dental business, acquired in late 2015, was able to increase sales and improve gross margins although the cost of
investments made in the business impacted operating profit.
In Chile, despite a continuing soft economy, our safety business Vicsa saw a further increase in sales and
improved gross margins such that operating profit exceeded expectations. While the business includes operations
in several other countries in the region, trading was strongest in Chile and Peru and the business has continued to
expand its e-commerce platforms to reach new customers. Our other safety business, Tecno Boga, following
difficult trading in 2016, has successfully launched a number of new product lines to adapt to changing demand in
the mining sector. As a result, the business has returned to sales growth. In the foodservice sector, our catering
supplies business DPS was able to increase sales and operating profit while improving operating margins.
In Colombia, our safety business Solmaq suffered from a number of operational challenges in its new warehouse
and from the impact of softer demand in the construction, industrial and public sectors. As a result, sales and
operating profit fell and the business implemented a number of operational improvement and cost reduction
measures.
Our safety business in Mexico, despite market uncertainty at the start of the year, achieved good sales growth as
customers increased stock levels to reduce price volatility. Gross margins came under pressure due to
unfavourable foreign exchange movements but strong cost control partly offset the impact on operating profit. A
new e-commerce platform was launched to improve the service offering and the business remains well positioned
to adapt to the changing market conditions in Mexico.
In Australasia, market conditions continued to show signs of improvement with demand for commodities
strengthening and new investment in the resources and construction sectors providing some underlying confidence
back into the market.
Our largest business, Bunzl Outsourcing Services, continued to develop and refine its offer into the more resilient
healthcare, cleaning, catering and retail sectors with sales and operating profit both increasing. Our strength in the
area of specialist medical consumables gives us a number of opportunities for growth through our ability to provide
expertise across a comprehensive range of clinical products and seamless delivery into a diverse and evolving
customer base. We have also made good progress with our new digital trading initiative and are now implementing
this across all of the Outsourcing Services businesses. This platform will further enhance our current offer by
creating an efficient and easy to access online mobile portal for our customers and external sales teams.
Our food processor business has also made progress with the ongoing strategy to diversify our presence across
the wider food processor sector. We have been successful in winning several major customer contracts across
Australia and we will realise the benefit of these gains as the year progresses. In New Zealand we have also

-12-
secured new business wins with major processor customers across both North and South Islands. Overall the
business has continued to develop a stronger presence with retail food packaging and has successfully introduced
several new, innovative product ranges. These will further enhance our offer for both rigid and flexible food
packaging solutions into major end user customers.
Our industrial and safety supplies business was rebranded and relaunched as Bunzl Safety in January. While
continuing to be impacted by the resources market downturn in Australia, this business has continued to progress
with its strategy to diversify its customer base by developing new business opportunities in the construction, energy
and government sectors. The business is also now realising the benefits from the recently implemented ERP
system upgrade. This, combined with a reduction in costs through the consolidation of facilities and a
reorganisation of the business to fit the current market environment, has enabled us to streamline our operational
platform and processes and will allow us to continue to drive productivity and enhance our competitive position.
Since the year end we have expanded our operations in Asia through two acquisitions. LSH, based in Singapore,
was acquired at the end of January and HSESF, based in China, was purchased at the beginning of August. The
businesses, which are principally engaged in the distribution of personal protection equipment, are trading in line
with our expectations.
Prospects
A combination of Bunzl’s strong market position, improved levels of organic revenue growth and the ongoing
benefit from acquisitions are expected to lead to further growth in each of our business areas despite variable
macroeconomic conditions across the countries in which we operate. If exchange rates remain at their current
levels, we expect that there will be a positive translation effect of approximately 6% on the full year results for 2017.
In North America, the combination of recent acquisitions and improved organic growth should result in a good
performance for the year. In Continental Europe we expect to see a strong performance due to the benefit of
acquisitions and continued organic growth. Despite ongoing uncertainty in some of our markets, UK & Ireland
should make good progress due to the impact of acquisitions and the benefit of a previously announced account
win. In Rest of the World, although market conditions will remain variable, we expect to see further progress.
The Board is confident that the prospects for the Group are positive and that the Company will continue to develop
the business and build shareholder value due to a combination of organic growth and acquisitions.
-13-
FINANCIAL REVIEW Group performance
With more than 85% of the Group’s revenue generated outside of the UK, the weakening of sterling against most
currencies has had a significant positive translation impact on the Group’s reported results increasing revenue,
profits and earnings by approximately 12%.
Revenue increased to £4,119.2 million, up 7% at constant exchange rates (20% at actual exchange rates) due to
organic growth of 3.7% and the incremental impact of acquisitions. Adjusted operating profit (being operating profit
before customer relationships amortisation and acquisition related items) increased to £272.6 million, an increase
of 4% at constant exchange rates (16% at actual exchange rates). The adjusted operating profit margin decreased
from 6.8% to 6.6% at both constant and actual exchange rates, mainly due to the additional business won with a
significant customer in North America at lower than average margins.
The net interest charge of £24.3 million decreased by £2.5 million at constant exchange rates (decrease of
£0.2 million at actual exchange rates) mainly from the impact of a lower effective interest rate on the Group’s
borrowings. Adjusted profit before income tax was £248.3 million, up 5% at constant exchange rates (18% at
actual exchange rates) due to the growth in adjusted operating profit and the lower net interest charge. With
customer relationships amortisation and acquisition related items of £66.4 million increasing by 8% at constant
exchange rates (21% at actual exchange rates), profit before tax was £181.9 million, an increase of 4% at constant
exchange rates (17% at actual exchange rates).
Tax
The effective tax rate (being the tax rate on adjusted profit before income tax) was 26.9% (30 June 2016: 27.7%).
This rate includes the effect of a reduction in provisions for tax risks following the positive outcome of a previous tax
uncertainty in the first half of the year. Based on the forecasts for the full year and assuming no significant changes
in tax legislation, it is estimated that the effective tax rate for the full year 2017 will be approximately 1.5 percentage
points higher than at the half year. The reported tax rate on statutory profit before tax was 27.6% (30 June 2016:
28.4%). This rate is higher than the effective tax rate because some acquisition related items are not tax-
deductible. As noted in the Principal risks and uncertainties section of the 2016 Annual Report, the Group is
monitoring the development of proposals for tax reforms in the US.
Profit for the period
Profit for the period increased 6% at constant exchange rates (18% at actual exchange rates) to £131.7 million.
Adjusted profit for the period increased 7% at constant exchange rates (19% at actual exchange rates) to
£181.5 million.
Earnings Earnings per share and adjusted earnings per share grew in line with the respective profits for the period. Earnings
per share were 40.0p, up 6% at constant exchange rates (up 18% at actual exchange rates). After adjusting for
customer relationships amortisation, acquisition related items and the associated tax, adjusted earnings per share
were 55.1p, an increase on 2016 of 7% at constant exchange rates (19% at actual exchange rates). Customer
relationships amortisation, acquisition related items and associated tax are items that are not taken into account by
management when assessing the results of the business as they are considered by management to form part of
the total spend on acquisitions or are non-cash items resulting from acquisitions and therefore do not relate to the
underlying operating performance and distort comparability between businesses and reporting periods.
Accordingly, such items are excluded when calculating the adjusted earnings per share on which management
-14-
assesses the performance of the Group. Further details on this and on other non-GAAP measures are set out in
Note 1.
Dividends
The interim dividend has increased by 8% to 14.0p from 13.0p in 2016.
Acquisitions
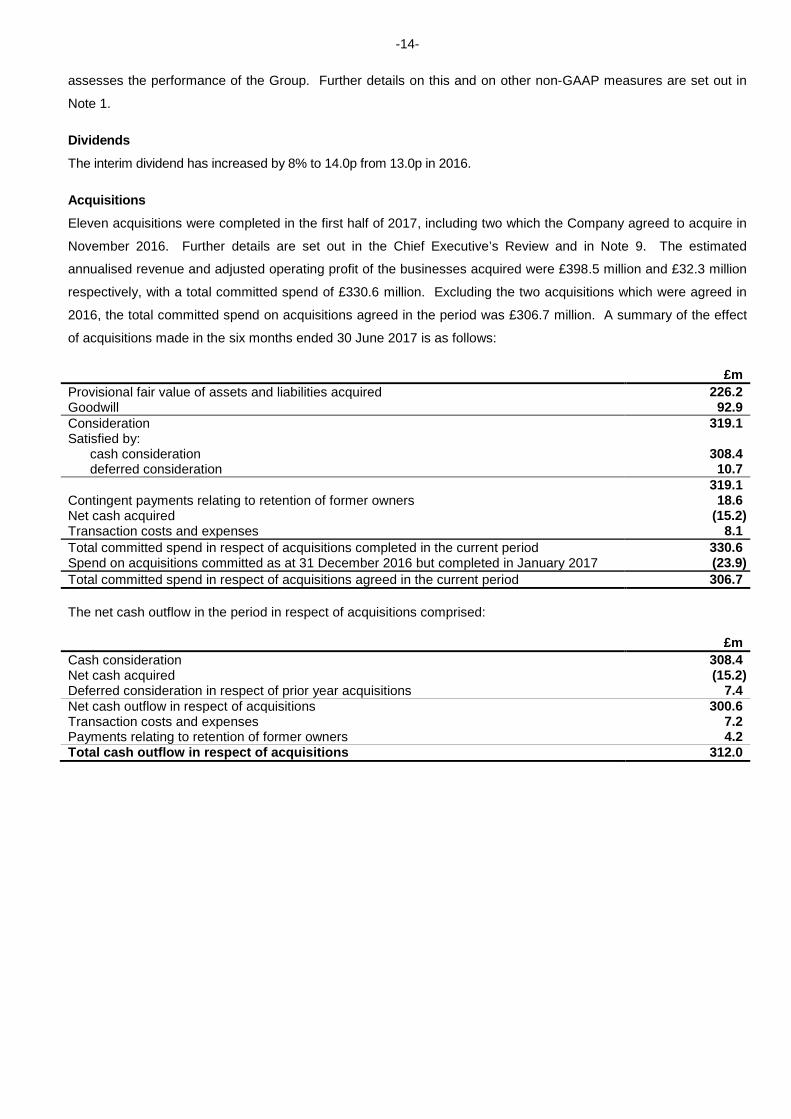
Eleven acquisitions were completed in the first half of 2017, including two which the Company agreed to acquire in
November 2016. Further details are set out in the Chief Executive’s Review and in Note 9. The estimated
annualised revenue and adjusted operating profit of the businesses acquired were £398.5 million and £32.3 million
respectively, with a total committed spend of £330.6 million. Excluding the two acquisitions which were agreed in
2016, the total committed spend on acquisitions agreed in the period was £306.7 million. A summary of the effect
of acquisitions made in the six months ended 30 June 2017 is as follows:
£m Provisional fair value of assets and liabilities acquired 226.2 Goodwill 92.9 Consideration 319.1 Satisfied by: cash consideration deferred consideration
308.4
10.7 319.1 Contingent payments relating to retention of former owners 18.6 Net cash acquired (15.2) Transaction costs and expenses 8.1 Total committed spend in respect of acquisitions completed in the current period 330.6 Spend on acquisitions committed as at 31 December 2016 but completed in January 2017 (23.9) Total committed spend in respect of acquisitions agreed in the current period 306.7 The net cash outflow in the period in respect of acquisitions comprised:
£m Cash consideration 308.4 Net cash acquired (15.2) Deferred consideration in respect of prior year acquisitions 7.4 Net cash outflow in respect of acquisitions 300.6 Transaction costs and expenses 7.2 Payments relating to retention of former owners 4.2 Total cash outflow in respect of acquisitions 312.0

-15-
Cash flow
Cash generated from operations before acquisition related items was £276.1 million, a £38.5 million increase from
2016, primarily due to a £37.5 million increase in adjusted operating profit. The Group’s free cash flow of
£187.4 million was £34.5 million higher than 2016. After payment of the 2016 interim dividend of £42.8 million, an
acquisition cash outflow of £312.0 million and a £30.2 million outflow on employee share schemes, the net cash
outflow was £197.6 million. The summary cash flow for the period was as follows:
Six months to 30.6.17
£m
Six months to 30.6.16
£m Cash generated from operations* 276.1 237.6 Net capital expenditure (13.9) (10.7) Operating cash flow* 262.2 226.9 Cash conversion %† 96% 97% Net interest (21.7) (20.8) Tax (53.1) (53.2) Free cash flow 187.4 152.9 Dividends (42.8) (38.6) Acquisitions (312.0) (98.3) Employee share schemes (30.2)
8.6
Net cash (outflow)/inflow (197.6) 24.6 * Before acquisition related items † The ratio of operating cash flow before acquisition related items to adjusted operating profit
Balance sheet
Return on average operating capital decreased from 55.9% at 31 December 2016 to 54.3%, driven by a lower
operating margin and higher average operating capital in the underlying business and the impact of the lower return
on operating capital from acquisitions. Return on invested capital decreased from 16.7% at 31 December 2016 to
16.4%, due to the effect of acquisitions and a lower return in the underlying business. Intangible assets have
increased by £193.0 million since 31 December 2016 to £2,140.6 million, primarily due to goodwill and customer
relationships arising on acquisitions in the period of £255.6 million, an amortisation charge of £51.0 million and a
negative exchange impact of £19.7 million.
The Group’s net pension deficit at 30 June 2017 of £78.7 million was £5.4 million lower than at 31 December 2016,
mainly due to an actuarial gain of £4.1 million. The actuarial gain arose as a result of the actual return on scheme
assets being £13.1 million higher than expected partly offset by a £9.0m increase in the present value of scheme
liabilities due to the impact of changes in assumptions, principally lower discount rates.

-16-
The movements in shareholders’ equity and net debt during the period were as follows:
Shareholders’ equity £m At 1 January 2017 1,312.5 Profit for the period 131.7 Dividends (138.2) Currency (net of tax) (15.0) Actuarial gain on pension schemes (net of tax) 3.1 Share based payments (net of tax) 11.2 Employee share schemes (28.9) At 30 June 2017 1,276.4 Net debt
£m
At 1 January 2017 (1,228.6) Net cash outflow (197.6) Currency 23.7 At 30 June 2017 (1,402.5) Net debt to EBITDA (times)
2.2
The Group continually monitors net debt and forecast cash flows to ensure that sufficient facilities are in place to
meet the Group’s requirements in the short, medium and long term and, in order to do so, arranges borrowings
from a variety of sources. Additionally, the Group monitors compliance with its debt covenants, principally net debt
to EBITDA of no more than 3.5 times and interest cover of no less than 3.0 times. All covenants have been
complied with for the six months ended 30 June 2017, with net debt to EBITDA calculated at average exchange
rates of 2.2 times, an increase from 2.0 times at 31 December 2016, principally as a result of the significant
acquisition spend during the period.
The Group has substantial committed borrowing facilities available to it comprising multi-currency credit facilities
from the Group’s banks and US dollar, euro and sterling bonds. As at 30 June 2017, the Group had undrawn
committed facilities of £676.4 million. During the next 12 months, £353.1 million of the committed facilities and
bonds mature. The Group’s remaining committed borrowing facilities and bonds will mature at various times over
the period up to November 2028.
Risks and uncertainties
The principal risks and uncertainties affecting the business activities of the Group for the remaining six months of
the financial year remain those detailed in the section entitled ‘Principal risks and uncertainties’ on pages 35 to 37
of the Annual Report for the year ended 31 December 2016. These include the impact of general economic
conditions and the ongoing competitive pressures in the countries in which we operate, the impact of product price
changes, the translation and transaction impacts of movements in exchange rates on the Group’s results, the ability
of the Group to complete and successfully integrate acquisitions, the impact of changes in tax legislation on the
Group’s cash flows and the availability of funding to enable the Group to meet its financial obligations as they fall
due. A copy of the 2016 Annual Report is available on the Company’s website at www.bunzl.com.
Although the principal risks and uncertainties affecting the Group are unchanged from the year ended
31 December 2016, the Board is continuing to monitor the potential risks associated with the referendum vote for
the UK to leave the European Union. Although the UK government has commenced negotiations with the
European Union, the terms under which the UK will eventually leave the European Union and the impact this will
have on the Group’s operations are currently unclear. The risks to the Group’s operations are most likely to relate

-17-
to the impact of foreign exchange volatility, an economic slowdown in the UK and the imposition of trade tariffs. Of
these risks, the first two have already been identified as principal risks for the Group, under the headings ‘Foreign
exchange’ and ‘Economic environment’. The risk relating to trade tariffs is considered to be a Group risk but is not
currently thought to be a principal risk.

-18-
Consolidated income statement Growth Six months to Six months to Actual Constant Year to 30.6.17 30.6.16 exchange exchange 31.12.16 Notes £m £m rates rates £m Revenue 2 4,119.2 3,446.8 20% 7% 7,429.1 Operating profit 2 206.2 180.1 14% 3% 409.7 Finance income 3 4.9 2.7 7.1 Finance expense 3 (29.2) (27.2) (53.9) Profit before income tax 181.9 155.6 17% 4% 362.9 Income tax 4 (50.2) (44.2) (97.0) Profit for the period attributable to
the Company’s equity holders
131.7 111.4
18%
6% 265.9 Earnings per share attributable to
the Company’s equity holders
Basic 6 40.0p 33.8p 18% 6% 80.7p Diluted 6 39.5p 33.4p 18% 6% 79.7p Dividend per share 5 14.0p 13.0p 8% 42.0p
Non-GAAP measures* Operating profit 2 206.2 180.1 409.7 Adjusted for: Customer relationships amortisation 2 47.4 38.2 81.3 Acquisition related items 2 19.0 16.8 34.0 Adjusted operating profit 2 272.6 235.1 16% 4% 525.0 Finance income 3 4.9 2.7 7.1 Finance expense 3 (29.2) (27.2) (53.9) Adjusted profit before income tax 248.3 210.6 18% 5% 478.2 Tax on adjusted profit 4 (66.8) (58.3) (128.6) Adjusted profit for the period 181.5 152.3 19% 7% 349.6 Adjusted earnings per share
6 55.1p 46.2p 19%
7% 106.1p
* See Note 1 for further details of the non-GAAP measures.

-19-
Consolidated statement of comprehensive income
Six months to Six months to Year to 30.6.17 30.6.16 31.12.16 £m £m £m Profit for the period 131.7 111.4 265.9 Other comprehensive income/(expense) Items that will not be reclassified to profit or loss: Actuarial gain/(loss) on defined benefit pension schemes 4.1 (24.1) (42.4) Tax on items that will not be reclassified to profit or loss (1.0) 5.8 8.3 Total items that will not be reclassified to profit or loss 3.1 (18.3) (34.1) Items that may be reclassified to profit or loss: Foreign currency translation differences on foreign operations (10.0) 198.9 267.0 Loss taken to equity as a result of effective net investment hedges (0.2) (36.5) (59.7) (Loss)/gain recognised in cash flow hedge reserve (4.2) (0.5) 2.6 Movement from cash flow hedge reserve to income statement (2.0) (0.1) (1.5) Tax on items that may be reclassified to profit or loss 1.4 (0.3) (0.7) Total items that may be reclassified subsequently to profit or loss (15.0) 161.5 207.7 Other comprehensive (expense)/income for the period (11.9) 143.2 173.6 Total comprehensive income attributable to the Company’s equity
holders
119.8
254.6
439.5
-20-
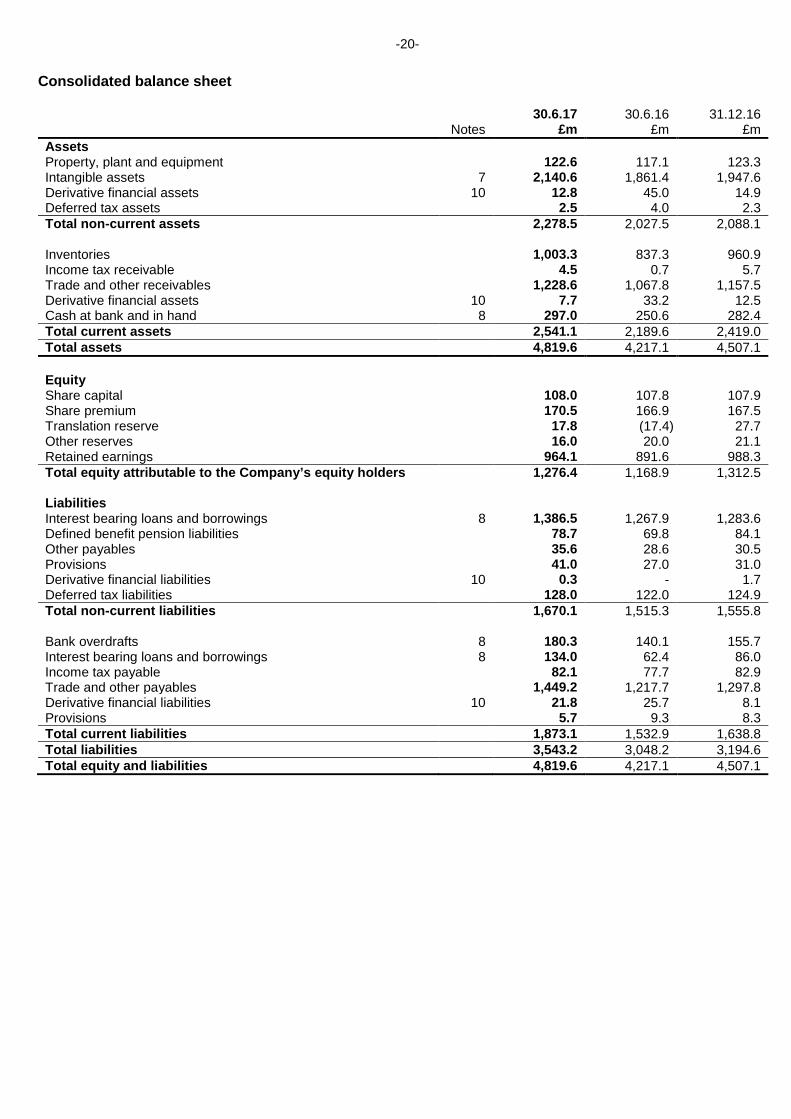
Consolidated balance sheet 30.6.17 30.6.16 31.12.16 Notes £m £m £m Assets Property, plant and equipment 122.6 117.1 123.3 Intangible assets 7 2,140.6 1,861.4 1,947.6 Derivative financial assets 10 12.8 45.0 14.9 Deferred tax assets 2.5 4.0 2.3 Total non-current assets 2,278.5 2,027.5 2,088.1 Inventories 1,003.3 837.3 960.9 Income tax receivable 4.5 0.7 5.7 Trade and other receivables 1,228.6 1,067.8 1,157.5 Derivative financial assets 10 7.7 33.2 12.5 Cash at bank and in hand 8 297.0 250.6 282.4 Total current assets 2,541.1 2,189.6 2,419.0 Total assets 4,819.6 4,217.1 4,507.1 Equity Share capital 108.0 107.8 107.9 Share premium 170.5 166.9 167.5 Translation reserve 17.8 (17.4) 27.7 Other reserves 16.0 20.0 21.1 Retained earnings 964.1 891.6 988.3 Total equity attributable to the Company’s equity holders 1,276.4 1,168.9 1,312.5 Liabilities Interest bearing loans and borrowings 8 1,386.5 1,267.9 1,283.6 Defined benefit pension liabilities 78.7 69.8 84.1 Other payables 35.6 28.6 30.5 Provisions 41.0 27.0 31.0 Derivative financial liabilities 10 0.3 - 1.7 Deferred tax liabilities 128.0 122.0 124.9 Total non-current liabilities 1,670.1 1,515.3 1,555.8 Bank overdrafts 8 180.3 140.1 155.7 Interest bearing loans and borrowings 8 134.0 62.4 86.0 Income tax payable 82.1 77.7 82.9 Trade and other payables 1,449.2 1,217.7 1,297.8 Derivative financial liabilities 10 21.8 25.7 8.1 Provisions 5.7 9.3 8.3 Total current liabilities 1,873.1 1,532.9 1,638.8 Total liabilities 3,543.2 3,048.2 3,194.6 Total equity and liabilities 4,819.6 4,217.1 4,507.1
-21-
Consolidated statement of changes in equity Share
capital £m
Share premium
£m
Translation reserve
£m
Other reserves◊
£m
Retained earnings†
£m
Total equity
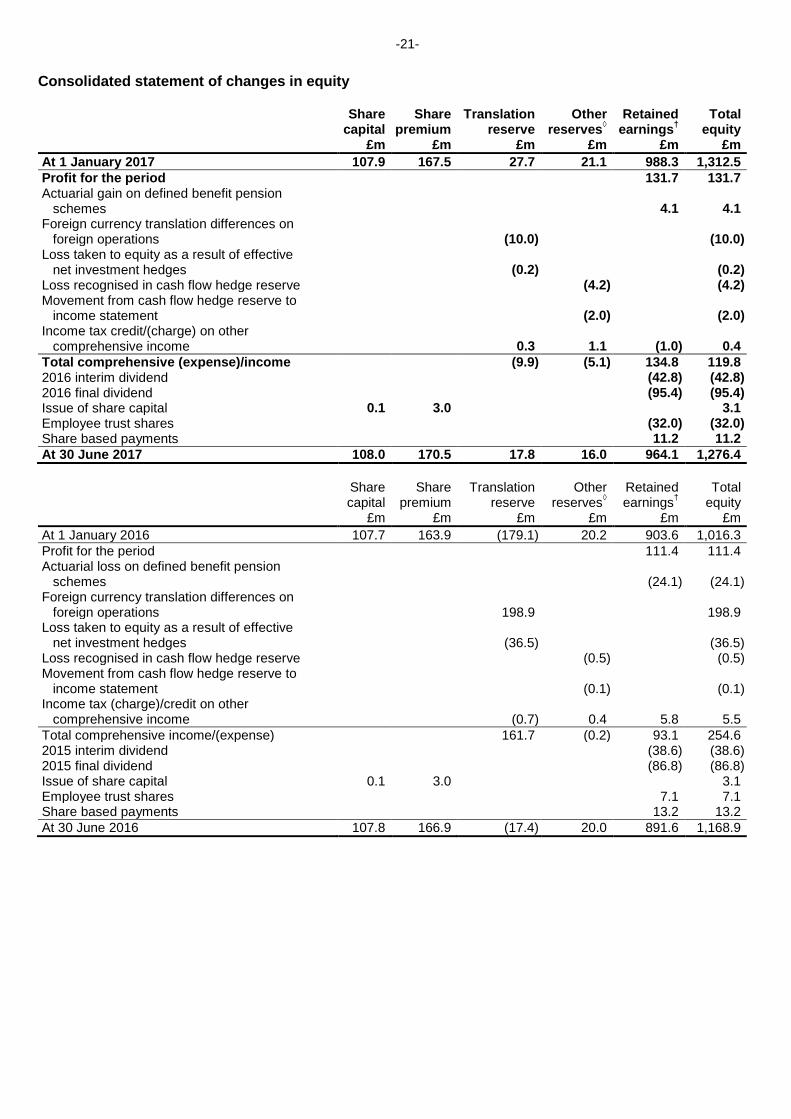
£m At 1 January 2017 107.9 167.5 27.7 21.1 988.3 1,312.5 Profit for the period 131.7 131.7 Actuarial gain on defined benefit pension schemes 4.1 4.1 Foreign currency translation differences on foreign operations (10.0) (10.0) Loss taken to equity as a result of effective net investment hedges (0.2) (0.2) Loss recognised in cash flow hedge reserve (4.2) (4.2) Movement from cash flow hedge reserve to income statement (2.0) (2.0) Income tax credit/(charge) on other comprehensive income 0.3 1.1 (1.0) 0.4 Total comprehensive (expense)/income (9.9) (5.1) 134.8 119.8 2016 interim dividend (42.8) (42.8) 2016 final dividend (95.4) (95.4) Issue of share capital 0.1 3.0 3.1 Employee trust shares (32.0) (32.0) Share based payments 11.2 11.2 At 30 June 2017 108.0 170.5 17.8 16.0 964.1 1,276.4
Share
capital £m
Share premium
£m
Translation reserve
£m
Other reserves◊
£m
Retained earnings†
£m
Total equity
£m At 1 January 2016 107.7 163.9 (179.1) 20.2 903.6 1,016.3 Profit for the period 111.4 111.4 Actuarial loss on defined benefit pension schemes
(24.1)
(24.1)
Foreign currency translation differences on foreign operations
198.9
198.9
Loss taken to equity as a result of effective net investment hedges
(36.5)
(36.5)
Loss recognised in cash flow hedge reserve (0.5) (0.5) Movement from cash flow hedge reserve to income statement
(0.1)
(0.1)
Income tax (charge)/credit on other comprehensive income
(0.7)
0.4
5.8
5.5
Total comprehensive income/(expense) 161.7 (0.2) 93.1 254.6 2015 interim dividend (38.6) (38.6) 2015 final dividend (86.8) (86.8) Issue of share capital 0.1 3.0 3.1 Employee trust shares 7.1 7.1 Share based payments 13.2 13.2 At 30 June 2016 107.8 166.9 (17.4) 20.0 891.6 1,168.9
-22-
Consolidated statement of changes in equity (continued)
Share capital
£m
Share premium
£m
Translation reserve
£m
Other reserves◊
£m
Retained earnings†
£m
Total equity
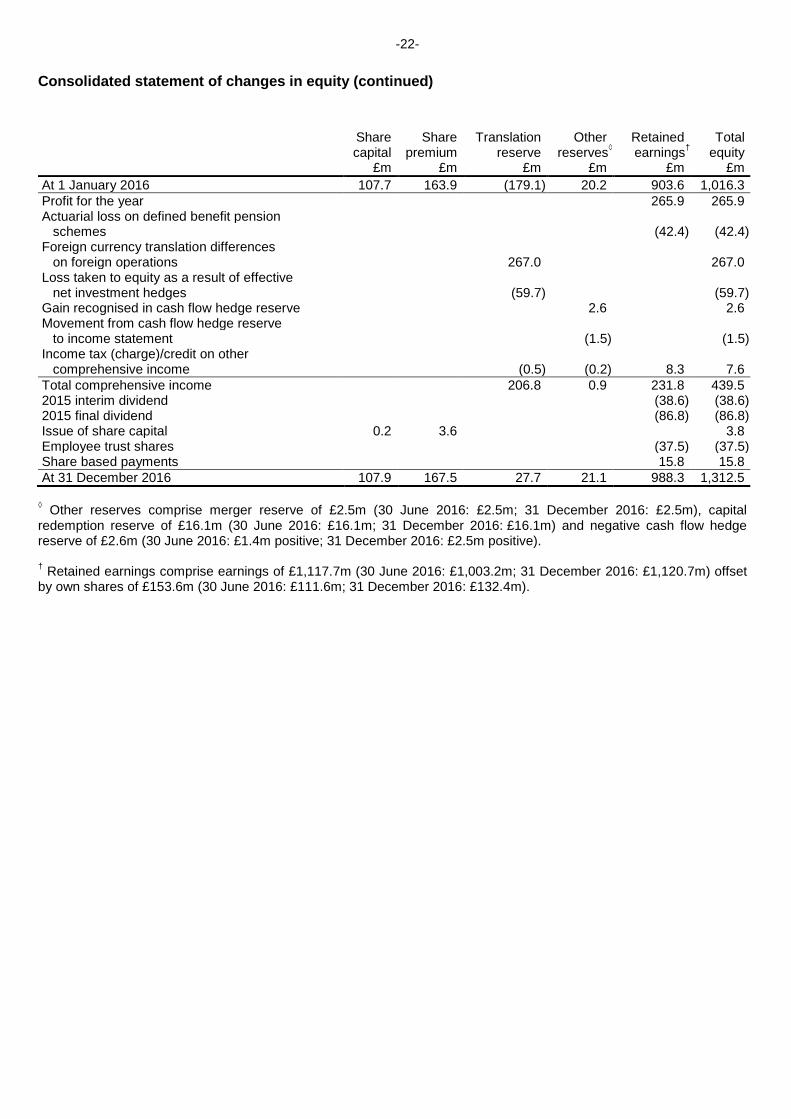
£m At 1 January 2016 107.7 163.9 (179.1) 20.2 903.6 1,016.3 Profit for the year 265.9 265.9 Actuarial loss on defined benefit pension schemes (42.4) (42.4) Foreign currency translation differences on foreign operations 267.0 267.0 Loss taken to equity as a result of effective net investment hedges (59.7) (59.7) Gain recognised in cash flow hedge reserve 2.6 2.6 Movement from cash flow hedge reserve to income statement (1.5) (1.5) Income tax (charge)/credit on other comprehensive income (0.5) (0.2) 8.3 7.6 Total comprehensive income 206.8 0.9 231.8 439.5 2015 interim dividend (38.6) (38.6) 2015 final dividend (86.8) (86.8) Issue of share capital 0.2 3.6 3.8 Employee trust shares (37.5) (37.5) Share based payments 15.8 15.8 At 31 December 2016 107.9 167.5 27.7 21.1 988.3 1,312.5
◊ Other reserves comprise merger reserve of £2.5m (30 June 2016: £2.5m; 31 December 2016: £2.5m), capital redemption reserve of £16.1m (30 June 2016: £16.1m; 31 December 2016: £16.1m) and negative cash flow hedge reserve of £2.6m (30 June 2016: £1.4m positive; 31 December 2016: £2.5m positive). † Retained earnings comprise earnings of £1,117.7m (30 June 2016: £1,003.2m; 31 December 2016: £1,120.7m) offset by own shares of £153.6m (30 June 2016: £111.6m; 31 December 2016: £132.4m).

-23-
Consolidated cash flow statement Six months to Six months to Year to 30.6.17 30.6.16 31.12.16 Notes £m £m £m Cash flow from operating activities Profit before income tax 181.9 155.6 362.9 Adjusted for:
net finance expense 3 24.3 24.5 46.8 customer relationships amortisation 7 47.4 38.2 81.3 acquisition related items 2 19.0 16.8 34.0
Adjusted operating profit 272.6 235.1 525.0 Adjustments:
non-cash items 11 19.6 16.5 28.0 working capital movement 11 (16.1) (14.0) (6.3)
Cash generated from operations before acquisition related items
276.1 237.6 546.7
Cash outflow from acquisition related items 9 (11.4) (12.4) (17.0) Income tax paid (53.1) (53.2) (123.2) Cash inflow from operating activities 211.6 172.0 406.5 Cash flow from investing activities Interest received 4.8 0.6 5.9 Purchase of property, plant and equipment and software (14.6) (10.9) (25.4) Sale of property, plant and equipment 0.7 0.2 0.6 Purchase of businesses 9 (300.6) (85.9) (159.6) Cash outflow from investing activities (309.7) (96.0) (178.5) Cash flow from financing activities Interest paid (26.5) (21.4) (49.1) Dividends paid (42.8) (38.6) (125.4) Increase in borrowings 246.3 200.9 206.1 Repayment of borrowings (61.1) (197.6) (210.5) Realised gains on foreign exchange contracts 0.8 5.3 22.9 Proceeds from issue of ordinary shares to settle share options 3.1 3.1 3.8 Proceeds from exercise of market purchase share options 14.8 14.0 26.4 Purchase of employee trust shares (48.1) (8.5) (67.7) Cash inflow/(outflow) from financing activities 86.5 (42.8) (193.5) (Decrease)/increase in cash and cash equivalents (11.6) 33.2 34.5 Cash and cash equivalents at beginning of the period 126.7 50.7 50.7 (Decrease)/increase in cash and cash equivalents (11.6) 33.2 34.5 Currency translation 1.6 26.6 41.5 Cash and cash equivalents at end of the period 8 116.7 110.5 126.7
* See Note 1 for further details of the non-GAAP measures.
Non-GAAP measures* Cash generated from operations before acquisition related items 276.1 237.6 546.7 Purchase of property, plant and equipment and software (14.6) (10.9) (25.4) Sale of property, plant and equipment 0.7 0.2 0.6 Operating cash flow 262.2 226.9 521.9 Cash conversion % (operating cash flow to adjusted operating profit) 96% 97% 99%

-24-
Notes 1. Basis of preparation The condensed set of financial statements for the six months ended 30 June 2017, with comparative figures for the six months ended 30 June 2016, is unaudited and does not constitute statutory accounts. However the external auditors have carried out a review of the condensed set of financial statements and their report in respect of the six months ended 30 June 2017 is set out in the Independent review report. The comparative figures for the year ended 31 December 2016 do not constitute the Company’s statutory accounts for the year. Those accounts have been reported on by the Company’s auditors and delivered to the Registrar of Companies. The report of the auditors was unqualified, did not include a reference to any matters to which the auditors drew attention by way of emphasis without qualifying their report and did not contain statements under Section 498(2)(3) of the Companies Act 2006. The directors, having reassessed the principal risks and uncertainties, consider it appropriate to adopt the going concern basis of accounting in the preparation of the condensed set of financial statements. The condensed set of financial statements has been prepared in accordance with International Accounting Standard (‘IAS’) 34 ‘Interim Financial Reporting’ as adopted by the EU and the Disclosure Guidance and Transparency Rules Sourcebook of the UK’s Financial Conduct Authority. The condensed set of financial statements has been prepared on the basis of the accounting policies set out in the Group’s 2016 statutory accounts which were prepared in accordance with International Financial Reporting Standards (‘IFRS’) as adopted by the EU. There are no new standards issued by the International Accounting Standards Board (‘IASB’) that are effective for the Group for the year ending 31 December 2017. The Group has adopted all relevant amendments to existing standards issued by the IASB that are effective from 1 January 2017 with no material impact on its consolidated results or financial position. IFRS 15 ‘Revenue from Contracts with Customers’ will be effective in the consolidated financial statements for the year ending 31 December 2018, with comparatives restated from a transition date of 1 January 2017. Revenue is currently recognised in the income statement at the point in time at which the significant risks and rewards of ownership of the goods are transferred. IFRS 15 requires companies to apportion revenue from customer contracts to separate performance obligations and recognise revenue as these performance obligations are satisfied. The Group has reviewed its arrangements with customers and concluded that for substantially all of its customer contracts the performance obligation is the delivery of goods and it is therefore appropriate to recognise revenue at a single point of time, on delivery of goods, which is consistent with current accounting policies. Accordingly, based on the Group’s assessment, which is ongoing, the application of IFRS 15 is not anticipated to have a material impact on the timing of revenue recognition and consequently is not anticipated to have a material impact on the Group’s operating profit or financial position. IFRS 9 ‘Financial Instruments’ will be effective in the consolidated financial statements for the year ending 31 December 2018 with a transition date of 1 January 2017. The Group has reviewed the differences between IFRS 9 and the current accounting policies which comply with IAS 39 ‘Financial Instruments: Recognition and Measurement’. Based on this analysis, the Group does not anticipate that there will be any material impact on its consolidated results or financial position. IFRS 16 ‘Leases’ will be effective in the consolidated financial statements for the year ending 31 December 2019. To prepare for the transition to this new accounting standard, data has been collated on all of the Group’s leases which are principally for warehouses and vehicles. Based on the Group’s assessment, which is ongoing, the application of IFRS 16 will have a material impact on the consolidated financial statements. The new standard will require that the Group's leased assets are recorded within property, plant and equipment as 'right of use assets' with a corresponding lease liability which is based on the discounted value of the cash payments required under each lease. The existing operating lease expenses, currently recorded in operating costs, will be replaced with a depreciation charge, which will be lower than the current operating lease expense, and a separate financing expense, which will be recorded in finance expense. There will be no net cash flow impact arising from the new standard and the Group does not currently intend to alter its approach as to whether assets should be leased or bought going forward. Current banking covenants are unaffected. Non-GAAP measures Further to the various performance measures defined under IFRS, the Group reports a number of alternative performance measures that are designed to assist with the understanding of the underlying performance of the Group and its businesses. These measures are not defined under IFRS and, as a result, do not comply with Generally Accepted Accounting Practice (and are therefore often referred to as ‘non-GAAP measures’) and may not be directly comparable with other companies’ non-GAAP measures. They are not designed to be a substitute

-25-
1. Basis of preparation (continued) for any of the IFRS measures of performance. The principal alternative performance measures used within this half yearly financial report include: • adjusted operating profit, adjusted profit before income tax and adjusted profit for the period (as reconciled on the face of the consolidated income statement); • adjusted earnings per share and adjusted diluted earnings per share (as reconciled in Note 6); • cash conversion % (operating cash flow, as reconciled on the face of the consolidated cash flow statement, to adjusted operating profit); • return on average operating capital % (the ratio of adjusted operating profit to the average of the month end operating capital employed (being property, plant and equipment and software, inventories and trade and other receivables less trade and other payables)); and • return on invested capital % (the ratio of adjusted operating profit to the average of the month end invested capital (being equity after adding back net debt, defined benefit pension schemes, cumulative customer relationships amortisation, acquisition related items and amounts written off goodwill, net of the associated tax)). These measures exclude the charge for customer relationships amortisation, acquisition related items and any associated tax, where relevant. Acquisition related items comprise deferred consideration payments relating to the retention of former owners of businesses acquired, transaction costs and expenses and adjustments to previously estimated earn outs. Customer relationships amortisation, acquisition related items and any associated tax are items which are not taken into account by management when assessing the results of the business as they are considered by management to form part of the total spend on acquisitions or are non-cash items resulting from acquisitions and therefore do not relate to the underlying operating performance and distort comparability between businesses and reporting periods. Accordingly, these items are removed in calculating the profitability measures by which management assess the performance of the Group. Other non-GAAP measures are used to monitor the performance of the Group and a number of these are based on, or derived from, the non-GAAP measures noted above. All non-GAAP measures in this half yearly financial report have been calculated consistently with the methods applied in the 2016 Annual Report. Growth rates at constant exchange rates are calculated by retranslating the results for the first half of 2016 at the average rates for the first half of 2017 so that they can be compared without the distorting impact of changes caused by foreign exchange translation. 2. Segment analysis North
America Continental
Europe UK &
Ireland Rest of the
World
Corporate
Total Six months ended 30 June 2017 £m £m £m £m £m £m Revenue 2,432.6 769.0 566.1 351.5 4,119.2 Adjusted operating profit/(loss) 148.0 73.1 37.9 25.1 (11.5) 272.6 Customer relationships amortisation (13.8) (19.6) (5.1) (8.9) - (47.4) Acquisition related items (8.8) (5.2) (2.0) (3.0) - (19.0) Operating profit/(loss) 125.4 48.3 30.8 13.2 (11.5) 206.2 Finance income 4.9 Finance expense (29.2) Profit before income tax 181.9 Adjusted profit before income tax 248.3 Income tax (50.2) Profit for the period 131.7 Purchase of property, plant and
equipment and software 4.4 4.7 2.6 2.9 - 14.6 Depreciation and software amortisation 5.2 5.3 2.4 2.1 0.2 15.2

-26-
2. Segment analysis (continued) North
America Continental
Europe UK &
Ireland Rest of the
World
Corporate
Total Six months ended 30 June 2016 £m £m £m £m £m £m Revenue 1,997.8 638.6 523.4 287.0 3,446.8 Adjusted operating profit/(loss) 128.1 60.5 36.0 21.0 (10.5) 235.1 Customer relationships amortisation (11.1) (16.2) (4.0) (6.9) - (38.2) Acquisition related items (6.4) (5.0) (0.9) (4.5) - (16.8) Operating profit/(loss) 110.6 39.3 31.1 9.6 (10.5) 180.1 Finance income 2.7 Finance expense (27.2) Profit before income tax 155.6 Adjusted profit before income tax 210.6 Income tax (44.2) Profit for the period 111.4 Purchase of property, plant and
equipment and software 3.6 3.6 1.9 1.4 0.4 10.9 Depreciation and software amortisation 4.6 4.4 2.2 1.6 0.1 12.9 North
America Continental
Europe UK &
Ireland Rest of the
World
Corporate
Total Year ended 31 December 2016 £m £m £m £m £m £m Revenue 4,362.1 1,355.1 1,087.8 624.1 7,429.1 Adjusted operating profit/(loss) 289.6 126.6 83.7 46.6 (21.5) 525.0 Customer relationships amortisation (23.1) (34.9) (8.3) (15.0) - (81.3) Acquisition related items (11.7) (12.5) (1.8) (8.0) - (34.0) Operating profit/(loss) 254.8 79.2 73.6 23.6 (21.5) 409.7 Finance income 7.1 Finance expense (53.9) Profit before income tax 362.9 Adjusted profit before income tax 478.2 Income tax (97.0) Profit for the year 265.9 Purchase of property, plant and
equipment and software 7.4 8.0 5.4 3.8 0.8 25.4 Depreciation and software amortisation 9.8 9.4 4.5 3.4 0.3 27.4 The Group’s financial results have not historically been subject to significant seasonal trends. Acquisition related items comprise the following: Six months to Six months to Year to 30.6.17 30.6.16 31.12.16 £m £m £m Deferred consideration payments relating to the retention of
former owners of businesses acquired
13.8
14.1
29.6 Transaction costs and expenses 8.1 2.9 6.8 Adjustments to previously estimated earn outs (2.9) (0.2) (2.4) Acquisition related items 19.0 16.8 34.0
-27-
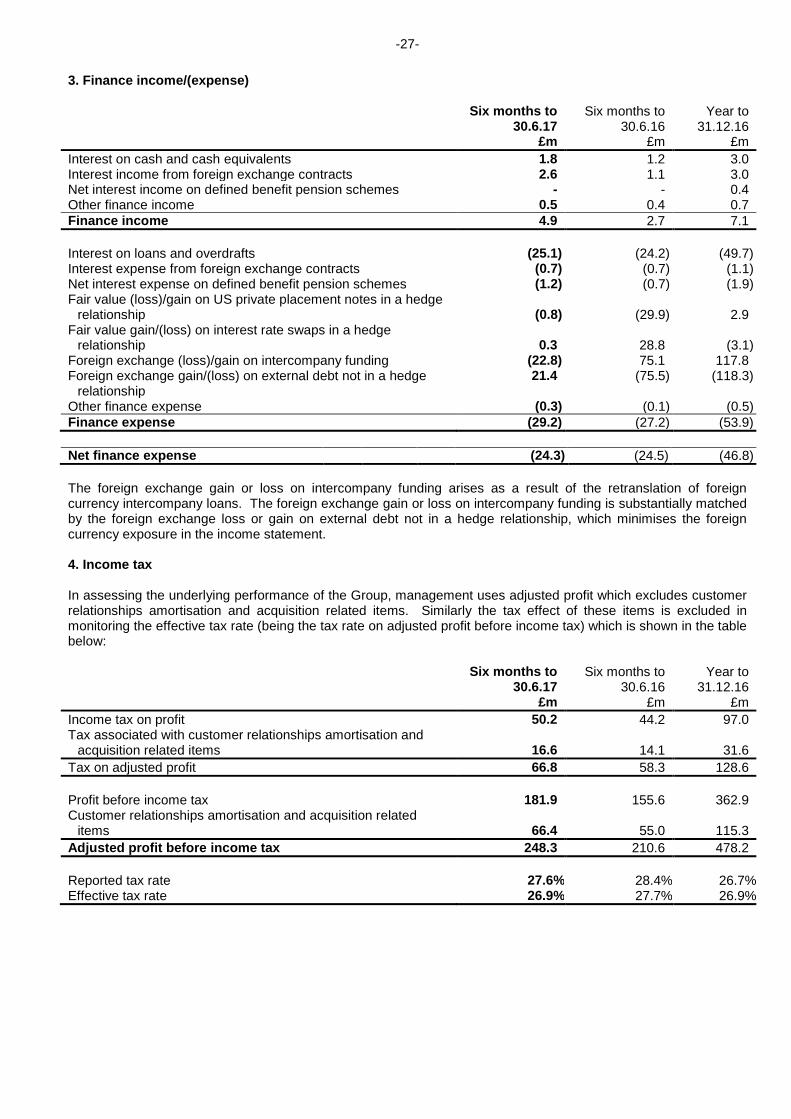
3. Finance income/(expense) Six months to Six months to Year to 30.6.17 30.6.16 31.12.16 £m £m £m Interest on cash and cash equivalents 1.8 1.2 3.0 Interest income from foreign exchange contracts 2.6 1.1 3.0 Net interest income on defined benefit pension schemes - - 0.4 Other finance income 0.5 0.4 0.7 Finance income 4.9 2.7 7.1 Interest on loans and overdrafts (25.1) (24.2) (49.7) Interest expense from foreign exchange contracts (0.7) (0.7) (1.1) Net interest expense on defined benefit pension schemes (1.2) (0.7) (1.9) Fair value (loss)/gain on US private placement notes in a hedge
relationship (0.8) (29.9) 2.9 Fair value gain/(loss) on interest rate swaps in a hedge
relationship 0.3 28.8 (3.1) Foreign exchange (loss)/gain on intercompany funding (22.8) 75.1 117.8 Foreign exchange gain/(loss) on external debt not in a hedge 21.4 (75.5) (118.3)
relationship Other finance expense (0.3) (0.1) (0.5) Finance expense (29.2) (27.2) (53.9) Net finance expense (24.3) (24.5) (46.8) The foreign exchange gain or loss on intercompany funding arises as a result of the retranslation of foreign currency intercompany loans. The foreign exchange gain or loss on intercompany funding is substantially matched by the foreign exchange loss or gain on external debt not in a hedge relationship, which minimises the foreign currency exposure in the income statement. 4. Income tax In assessing the underlying performance of the Group, management uses adjusted profit which excludes customer relationships amortisation and acquisition related items. Similarly the tax effect of these items is excluded in monitoring the effective tax rate (being the tax rate on adjusted profit before income tax) which is shown in the table below: Six months to Six months to Year to 30.6.17 30.6.16 31.12.16 £m £m £m Income tax on profit 50.2 44.2 97.0 Tax associated with customer relationships amortisation and
acquisition related items 16.6 14.1 31.6 Tax on adjusted profit 66.8 58.3 128.6 Profit before income tax 181.9 155.6 362.9 Customer relationships amortisation and acquisition related
items 66.4 55.0 115.3 Adjusted profit before income tax 248.3 210.6 478.2 Reported tax rate 27.6% 28.4% 26.7% Effective tax rate 26.9% 27.7% 26.9%

-28-
5. Dividends Six months to Six months to Year to 30.6.17 30.6.16 31.12.16 £m £m £m 2015 interim 38.6 38.6 2015 final 86.8 86.8 2016 interim 42.8 2016 final 95.4 Total 138.2 125.4 125.4 Dividends per share for the periods to which they relate are: Per share Six months to Six months to Year to 30.6.17 30.6.16 31.12.16 2016 interim 13.00p 13.00p 2016 final 29.00p 2017 interim 14.00p Total 14.00p 13.00p 42.00p The 2017 interim dividend of 14.00p per share will be paid on 2 January 2018 to shareholders on the register on 17 November 2017. The 2017 interim dividend will comprise approximately £46m of cash. The 2016 final dividend was paid on 3 July 2017, comprising £95.4m of cash. 6. Earnings per share Six months to Six months to Year to 30.6.17 30.6.16 31.12.16 £m £m £m Profit for the period 131.7 111.4 265.9 Adjusted for: customer relationships amortisation 47.4 38.2 81.3 acquisition related items 19.0 16.8 34.0 tax credit on adjusting items (16.6) (14.1) (31.6) Adjusted profit for the period 181.5 152.3 349.6 Basic weighted average ordinary shares in issue (million) 329.5 329.9 329.4 Dilutive effect of employee share plans (million) 3.7 3.5 4.3 Diluted weighted average ordinary shares (million) 333.2 333.4 333.7 Basic earnings per share 40.0p 33.8p 80.7p Adjustment 15.1p 12.4p 25.4p Adjusted earnings per share 55.1p 46.2p 106.1p Diluted earnings per share 39.5p 33.4p 79.7p Adjustment 15.0p 12.3p 25.1p Adjusted diluted earnings per share 54.5p 45.7p 104.8p

-29-
7. Intangible assets Six months to Six months to Year to 30.6.17 30.6.16 31.12.16 Goodwill £m £m £m Beginning of the period 1,191.5 999.3 999.3 Acquisitions 92.9 21.4 51.0 Currency translation (8.9) 102.6 141.2 End of the period 1,275.5 1,123.3 1,191.5 Customer relationships Cost Beginning of the period 1,306.4 1,069.2 1,069.2 Acquisitions 162.7 45.7 80.2 Currency translation (8.9) 126.7 157.0 End of the period 1,460.2 1,241.6 1,306.4 Amortisation Beginning of the period 568.7 436.5 436.5 Charge in the period 47.4 38.2 81.3 Currency translation 1.7 47.5 50.9 End of the period 617.8 522.2 568.7 Net book value of Customer relationships 842.4 719.4 737.7 Net book value of Software 22.7 18.7 18.4
Total net book value of Intangible assets 2,140.6 1,861.4 1,947.6 Both goodwill and customer relationships have been acquired as part of business combinations. Further details of acquisitions made in the period are set out in Note 9. 8. Cash and cash equivalents and net debt
The Cash at bank and in hand and Bank overdrafts amounts included in the table above include the amounts associated with the Group’s cash pool. The cash pool enables the Group to access cash in its subsidiaries to pay down the Group’s borrowings. The Group has the legal right of set-off of balances within the cash pool. The Cash at bank and in hand and Bank overdrafts figures net of the amounts in the cash pool are disclosed below for reference: 30.6.17 30.6.16 31.12.16 £m £m £m Cash at bank and in hand net of amounts in the cash pool 140.9 153.6 139.6 Bank overdrafts net of amounts in the cash pool (24.2) (43.1) (12.9) Cash and cash equivalents 116.7 110.5 126.7 Six months to Six months to Year to 30.6.17 30.6.16 31.12.16 Movement in net debt £m £m £m Beginning of the period (1,228.6) (1,107.2) (1,107.2) Net cash (outflow)/inflow (197.6) 24.6 16.0 Realised gains on foreign exchange contracts 0.8 5.3 22.9 Currency translation 22.9 (91.5) (160.3) End of the period (1,402.5) (1,168.8) (1,228.6)
30.6.17 30.6.16 31.12.16 £m £m £m Cash at bank and in hand 297.0 250.6 282.4 Bank overdrafts (180.3) (140.1) (155.7) Cash and cash equivalents 116.7 110.5 126.7 Interest bearing loans and borrowings - current liabilities (134.0) (62.4) (86.0) Interest bearing loans and borrowings - non-current liabilities (1,386.5) (1,267.9) (1,283.6) Derivatives managing interest rate risk and currency profile 1.3 51.0 14.3 Net debt (1,402.5) (1,168.8) (1,228.6)
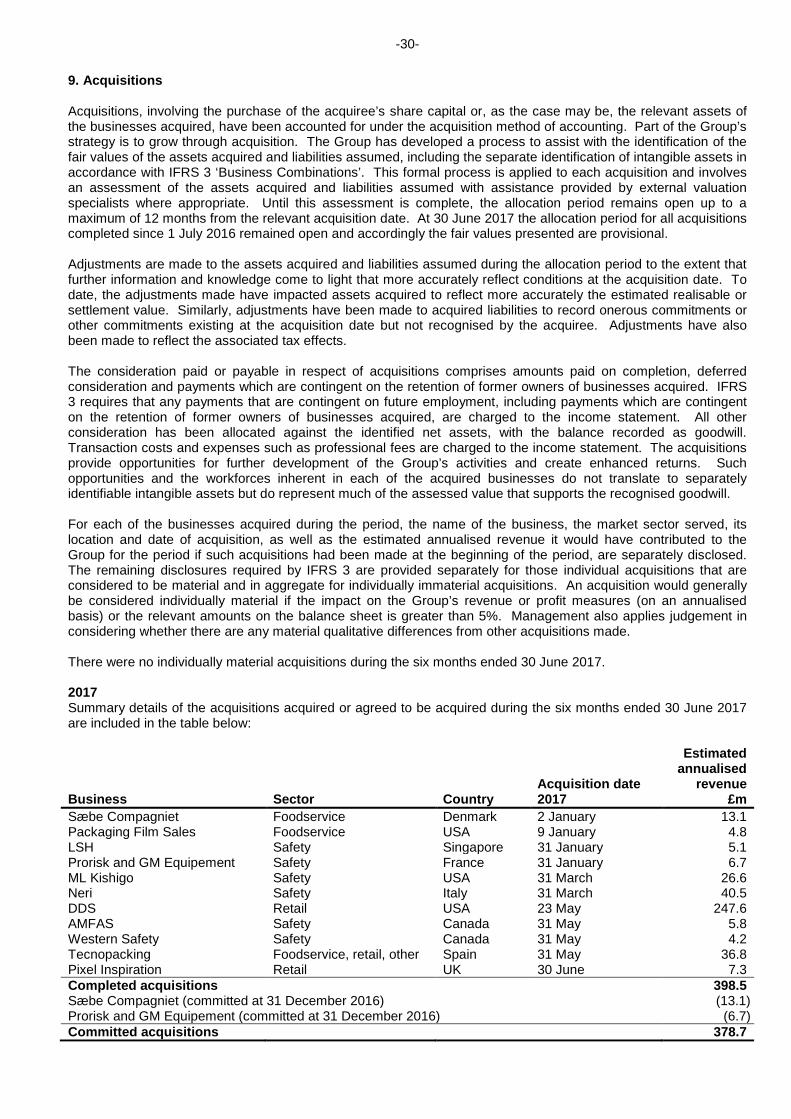
-30-
9. Acquisitions Acquisitions, involving the purchase of the acquiree’s share capital or, as the case may be, the relevant assets of the businesses acquired, have been accounted for under the acquisition method of accounting. Part of the Group’s strategy is to grow through acquisition. The Group has developed a process to assist with the identification of the fair values of the assets acquired and liabilities assumed, including the separate identification of intangible assets in accordance with IFRS 3 ‘Business Combinations’. This formal process is applied to each acquisition and involves an assessment of the assets acquired and liabilities assumed with assistance provided by external valuation specialists where appropriate. Until this assessment is complete, the allocation period remains open up to a maximum of 12 months from the relevant acquisition date. At 30 June 2017 the allocation period for all acquisitions completed since 1 July 2016 remained open and accordingly the fair values presented are provisional. Adjustments are made to the assets acquired and liabilities assumed during the allocation period to the extent that further information and knowledge come to light that more accurately reflect conditions at the acquisition date. To date, the adjustments made have impacted assets acquired to reflect more accurately the estimated realisable or settlement value. Similarly, adjustments have been made to acquired liabilities to record onerous commitments or other commitments existing at the acquisition date but not recognised by the acquiree. Adjustments have also been made to reflect the associated tax effects. The consideration paid or payable in respect of acquisitions comprises amounts paid on completion, deferred consideration and payments which are contingent on the retention of former owners of businesses acquired. IFRS 3 requires that any payments that are contingent on future employment, including payments which are contingent on the retention of former owners of businesses acquired, are charged to the income statement. All other consideration has been allocated against the identified net assets, with the balance recorded as goodwill. Transaction costs and expenses such as professional fees are charged to the income statement. The acquisitions provide opportunities for further development of the Group’s activities and create enhanced returns. Such opportunities and the workforces inherent in each of the acquired businesses do not translate to separately identifiable intangible assets but do represent much of the assessed value that supports the recognised goodwill. For each of the businesses acquired during the period, the name of the business, the market sector served, its location and date of acquisition, as well as the estimated annualised revenue it would have contributed to the Group for the period if such acquisitions had been made at the beginning of the period, are separately disclosed. The remaining disclosures required by IFRS 3 are provided separately for those individual acquisitions that are considered to be material and in aggregate for individually immaterial acquisitions. An acquisition would generally be considered individually material if the impact on the Group’s revenue or profit measures (on an annualised basis) or the relevant amounts on the balance sheet is greater than 5%. Management also applies judgement in considering whether there are any material qualitative differences from other acquisitions made. There were no individually material acquisitions during the six months ended 30 June 2017. 2017 Summary details of the acquisitions acquired or agreed to be acquired during the six months ended 30 June 2017 are included in the table below:
Business Sector Country Acquisition date 2017
Estimated annualised
revenue £m
Sæbe Compagniet Foodservice Denmark 2 January 13.1 Packaging Film Sales Foodservice USA 9 January 4.8 LSH Safety Singapore 31 January 5.1 Prorisk and GM Equipement Safety France 31 January 6.7 ML Kishigo Safety USA 31 March 26.6 Neri Safety Italy 31 March 40.5 DDS Retail USA 23 May 247.6 AMFAS Safety Canada 31 May 5.8 Western Safety Safety Canada 31 May 4.2 Tecnopacking Foodservice, retail, other Spain 31 May 36.8 Pixel Inspiration Retail UK 30 June 7.3 Completed acquisitions 398.5 Sæbe Compagniet (committed at 31 December 2016) (13.1) Prorisk and GM Equipement (committed at 31 December 2016) (6.7) Committed acquisitions 378.7

-31-
9. Acquisitions (continued) A summary of the effect of acquisitions completed in the six months ended 30 June 2017 and 30 June 2016 and for the year ended 31 December 2016 is shown below: 30.6.17 30.6.16 31.12.16 Provisional fair value of assets acquired £m £m £m Customer relationships 162.7 45.7 80.2 Property, plant and equipment and software 5.8 0.6 (0.5) Inventories 53.1 5.0 16.5 Trade and other receivables 59.3 16.6 44.1 Trade and other payables (42.5) (8.8) (32.3) Net cash/(overdrafts) 15.2 (3.6) 1.0 Provisions (10.9) (0.4) (3.8) Defined benefit pension liabilities - (0.9) (1.0) Income tax payable and deferred tax liabilities (16.5) (11.0) (17.8) Fair value of net assets acquired 226.2 43.2 86.4 Goodwill 92.9 21.4 51.0 Consideration 319.1 64.6 137.4 Satisfied by: cash consideration 308.4 52.8 124.4 deferred consideration 10.7 11.8 13.0 319.1 64.6 137.4 Contingent payments relating to retention of former owners 18.6 9.1 18.2 Net (cash)/overdrafts acquired (15.2) 3.6 (1.0) Transaction costs and expenses 8.1 2.9 6.8 Total committed spend in respect of acquisitions completed in
the current period 330.6
80.2
161.4 Spend on acquisitions committed at prior period end but
completed in the current period (23.9)
-
- Spend on acquisitions committed but not completed at the
period end -
-
22.8 Total committed spend in respect of acquisitions agreed in
the current period 306.7
80.2
184.2 The net cash outflow in respect of acquisitions comprised: Six months to
30.6.17 £m
Six months to 30.6.16
£m
Year to 31.12.16
£m Cash consideration 308.4 52.8 124.4 Net (cash)/overdrafts acquired (15.2) 3.6 (1.0) Deferred consideration in respect of prior year acquisitions 7.4 29.5 36.2 Net cash outflow in respect of acquisitions 300.6 85.9 159.6 Transaction costs and expenses 7.2 2.7 5.9 Payments relating to retention of former owners 4.2 9.7 11.1 Total cash outflow in respect of acquisitions 312.0 98.3 176.6 Acquisitions completed in the six months ended 30 June 2017 contributed £57.3m (six months ended 30 June 2016: £17.1m; year ended 31 December 2016: £85.7m) to the Group’s revenue and £5.6m (six months ended 30 June 2016: £2.5m; year ended 31 December 2016: £11.2m) to the Group’s adjusted operating profit for the six months ended 30 June 2017. The estimated contributions from acquisitions completed to the results of the Group if such acquisitions had been made at the beginning of the respective period, are as follows: Six months to
30.6.17 £m
Six months to 30.6.16
£m
Year to 31.12.16
£m Revenue 199.3 36.7 182.3 Adjusted operating profit 16.1 5.6 21.5
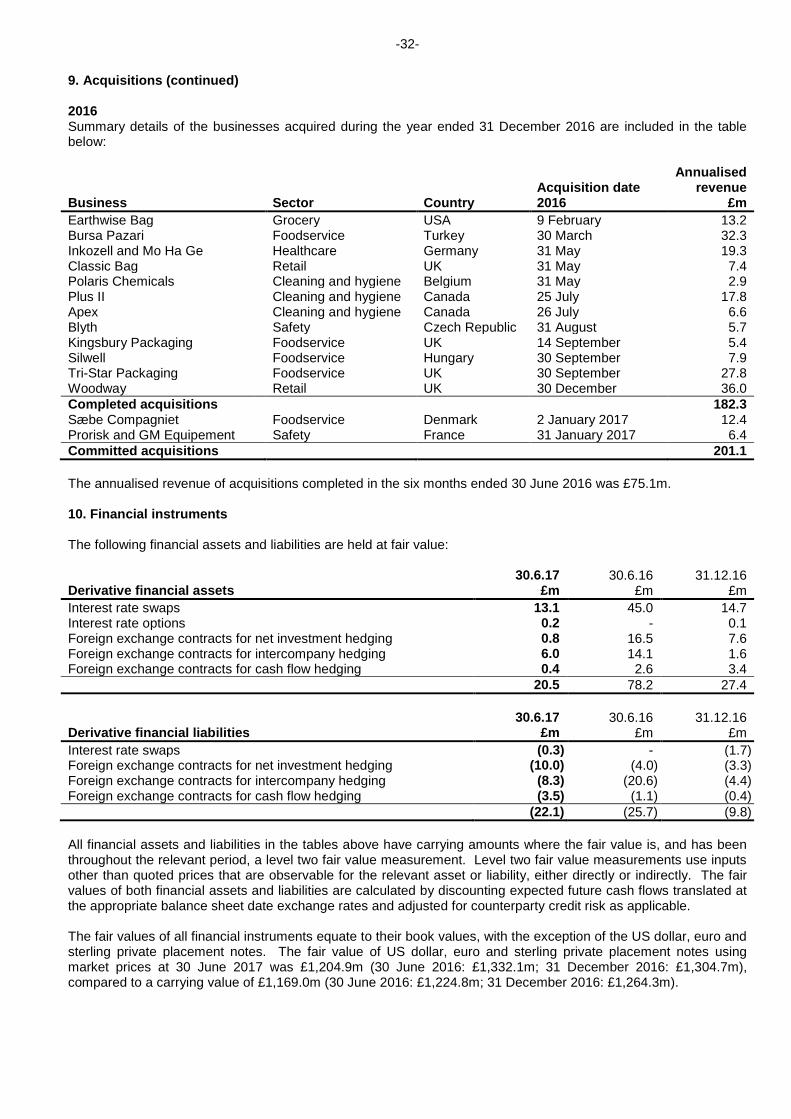
-32-
9. Acquisitions (continued) 2016 Summary details of the businesses acquired during the year ended 31 December 2016 are included in the table below:
Business Sector Country Acquisition date 2016
Annualised revenue
£m Earthwise Bag Grocery USA 9 February 13.2 Bursa Pazari Foodservice Turkey 30 March 32.3 Inkozell and Mo Ha Ge Healthcare Germany 31 May 19.3 Classic Bag Retail UK 31 May 7.4 Polaris Chemicals Cleaning and hygiene Belgium 31 May 2.9 Plus II Cleaning and hygiene Canada 25 July 17.8 Apex Cleaning and hygiene Canada 26 July 6.6 Blyth Safety Czech Republic 31 August 5.7 Kingsbury Packaging Foodservice UK 14 September 5.4 Silwell Foodservice Hungary 30 September 7.9 Tri-Star Packaging Foodservice UK 30 September 27.8 Woodway Retail UK 30 December 36.0 Completed acquisitions 182.3 Sæbe Compagniet Foodservice Denmark 2 January 2017 12.4 Prorisk and GM Equipement Safety France 31 January 2017 6.4 Committed acquisitions 201.1 The annualised revenue of acquisitions completed in the six months ended 30 June 2016 was £75.1m. 10. Financial instruments The following financial assets and liabilities are held at fair value: Derivative financial assets
30.6.17 £m
30.6.16 £m
31.12.16 £m
Interest rate swaps 13.1 45.0 14.7 Interest rate options 0.2 - 0.1 Foreign exchange contracts for net investment hedging 0.8 16.5 7.6 Foreign exchange contracts for intercompany hedging 6.0 14.1 1.6 Foreign exchange contracts for cash flow hedging 0.4 2.6 3.4 20.5 78.2 27.4 Derivative financial liabilities
30.6.17 £m
30.6.16 £m
31.12.16 £m
Interest rate swaps (0.3) - (1.7) Foreign exchange contracts for net investment hedging (10.0) (4.0) (3.3) Foreign exchange contracts for intercompany hedging (8.3) (20.6) (4.4) Foreign exchange contracts for cash flow hedging (3.5) (1.1) (0.4) (22.1) (25.7) (9.8) All financial assets and liabilities in the tables above have carrying amounts where the fair value is, and has been throughout the relevant period, a level two fair value measurement. Level two fair value measurements use inputs other than quoted prices that are observable for the relevant asset or liability, either directly or indirectly. The fair values of both financial assets and liabilities are calculated by discounting expected future cash flows translated at the appropriate balance sheet date exchange rates and adjusted for counterparty credit risk as applicable. The fair values of all financial instruments equate to their book values, with the exception of the US dollar, euro and sterling private placement notes. The fair value of US dollar, euro and sterling private placement notes using market prices at 30 June 2017 was £1,204.9m (30 June 2016: £1,332.1m; 31 December 2016: £1,304.7m), compared to a carrying value of £1,169.0m (30 June 2016: £1,224.8m; 31 December 2016: £1,264.3m).
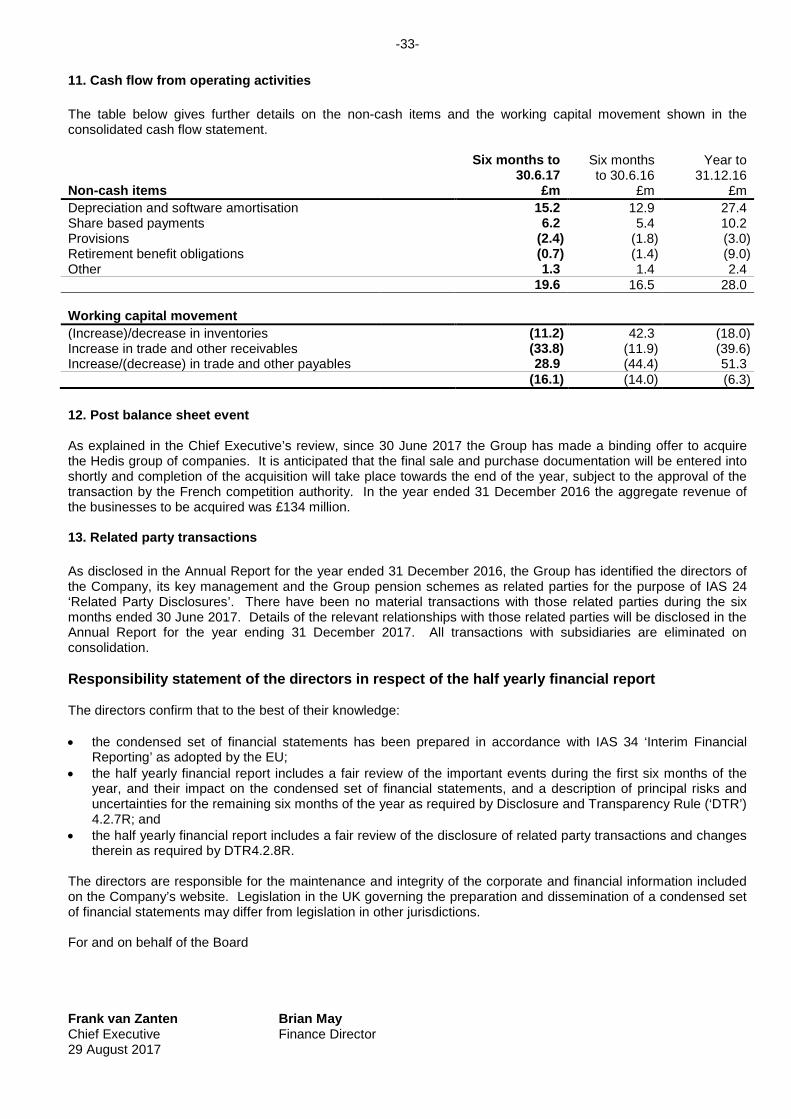
-33-
11. Cash flow from operating activities The table below gives further details on the non-cash items and the working capital movement shown in the consolidated cash flow statement.
Non-cash items
Six months to 30.6.17
£m
Six months to 30.6.16
£m
Year to 31.12.16
£m Depreciation and software amortisation 15.2 12.9 27.4 Share based payments 6.2 5.4 10.2 Provisions (2.4) (1.8) (3.0) Retirement benefit obligations (0.7) (1.4) (9.0) Other 1.3 1.4 2.4 19.6 16.5 28.0 Working capital movement (Increase)/decrease in inventories (11.2) 42.3 (18.0) Increase in trade and other receivables (33.8) (11.9) (39.6) Increase/(decrease) in trade and other payables 28.9 (44.4) 51.3 (16.1) (14.0) (6.3) 12. Post balance sheet event As explained in the Chief Executive’s review, since 30 June 2017 the Group has made a binding offer to acquire the Hedis group of companies. It is anticipated that the final sale and purchase documentation will be entered into shortly and completion of the acquisition will take place towards the end of the year, subject to the approval of the transaction by the French competition authority. In the year ended 31 December 2016 the aggregate revenue of the businesses to be acquired was £134 million. 13. Related party transactions As disclosed in the Annual Report for the year ended 31 December 2016, the Group has identified the directors of the Company, its key management and the Group pension schemes as related parties for the purpose of IAS 24 ‘Related Party Disclosures’. There have been no material transactions with those related parties during the six months ended 30 June 2017. Details of the relevant relationships with those related parties will be disclosed in the Annual Report for the year ending 31 December 2017. All transactions with subsidiaries are eliminated on consolidation. Responsibility statement of the directors in respect of the half yearly financial report The directors confirm that to the best of their knowledge: • the condensed set of financial statements has been prepared in accordance with IAS 34 ‘Interim Financial
Reporting’ as adopted by the EU; • the half yearly financial report includes a fair review of the important events during the first six months of the
year, and their impact on the condensed set of financial statements, and a description of principal risks and uncertainties for the remaining six months of the year as required by Disclosure and Transparency Rule (‘DTR’) 4.2.7R; and
• the half yearly financial report includes a fair review of the disclosure of related party transactions and changes therein as required by DTR4.2.8R.
The directors are responsible for the maintenance and integrity of the corporate and financial information included on the Company’s website. Legislation in the UK governing the preparation and dissemination of a condensed set of financial statements may differ from legislation in other jurisdictions. For and on behalf of the Board
Frank van Zanten Chief Executive
Brian May Finance Director
29 August 2017

-34-
Independent review report to Bunzl plc Report on the condensed interim financial statements Our conclusion We have reviewed Bunzl plc's condensed interim financial statements (the ‘interim financial statements’) in the half yearly financial report of Bunzl plc for the six month period ended 30 June 2017. Based on our review, nothing has come to our attention that causes us to believe that the interim financial statements are not prepared, in all material respects, in accordance with International Accounting Standard 34, ‘Interim Financial Reporting’, as adopted by the European Union and the Disclosure Guidance and Transparency Rules sourcebook of the United Kingdom’s Financial Conduct Authority. What we have reviewed The interim financial statements comprise:
• the consolidated income statement and consolidated statement of comprehensive income for the six month period ended 30 June 2017;
• the consolidated balance sheet as at 30 June 2017;
• the consolidated cash flow statement for the period then ended;
• the consolidated statement of changes in equity for the period then ended; and
• the explanatory notes to the interim financial statements.
The interim financial statements included in the half yearly financial report have been prepared in accordance with International Accounting Standard 34, ‘Interim Financial Reporting’, as adopted by the European Union and the Disclosure Guidance and Transparency Rules sourcebook of the United Kingdom’s Financial Conduct Authority. As disclosed in Note 1 to the interim financial statements, the financial reporting framework that has been applied in the preparation of the full annual financial statements of the Group is applicable law and International Financial Reporting Standards (IFRSs) as adopted by the European Union. Responsibilities for the interim financial statements and the review Our responsibilities and those of the directors The half yearly financial report, including the interim financial statements, is the responsibility of, and has been approved by, the directors. The directors are responsible for preparing the half yearly financial report in accordance with the Disclosure Guidance and Transparency Rules sourcebook of the United Kingdom’s Financial Conduct Authority. Our responsibility is to express a conclusion on the interim financial statements in the half yearly financial report based on our review. This report, including the conclusion, has been prepared for and only for Bunzl plc for the purpose of complying with the Disclosure Guidance and Transparency Rules sourcebook of the United Kingdom’s Financial Conduct Authority and for no other purpose. We do not, in giving this conclusion, accept or assume responsibility for any other purpose or to any other person to whom this report is shown or into whose hands it may come save where expressly agreed by our prior consent in writing. What a review of interim financial statements involves We conducted our review in accordance with International Standard on Review Engagements (UK and Ireland) 2410, ‘Review of Interim Financial Information Performed by the Independent Auditor of the Entity’ issued by the Auditing Practices Board for use in the United Kingdom. A review of interim financial information consists of making enquiries, primarily of persons responsible for financial and accounting matters, and applying analytical and other review procedures. A review is substantially less in scope than an audit conducted in accordance with International Standards on Auditing (UK) and, consequently, does not enable us to obtain assurance that we would become aware of all significant matters that might be identified in an audit. Accordingly, we do not express an audit opinion. We have read the other information contained in the half yearly financial report and considered whether it contains any apparent misstatements or material inconsistencies with the information in the interim financial statements. PricewaterhouseCoopers LLP Chartered Accountants London 29 August 2017