news release date release number 14/16 for personal use only · news release release time immediate...
TRANSCRIPT

1
NEWS RELEASE Release Time IMMEDIATE
Date 21 June 2016
Release Number 14/16
BHP BILLITON PROVIDES AN UPDATE ON ITS COAL BUSINESS BHP Billiton today outlined the path for its Coal business to improve returns by unlocking productivity, reducing costs and releasing latent capacity. President Operations Minerals Australia, Mike Henry, told investors at a Coal briefing that the Company saw significant opportunity to further increase the competitiveness of its coal operations – both in terms of costs and volumes. “Rather than waiting for higher prices, we have been deliberate in shaping a quality, focused portfolio that allows us to deliver value in challenging market conditions and positions us well for an expected longer-term improvement in coal market fundamentals,” Mr Henry said. BHP Billiton’s Coal business has delivered over US$3 billion of productivity gains since 2012 and is targeting another US$600 million by the end of the 2017 financial year. “While cost compression has been evident across the industry, we continue to work hard under our new operating model to improve our performance,” Mr Henry said.
“Even in today’s difficult environment, all of our operations remain cash positive.”
BHP Billiton can also grow its Coal business by releasing low-cost, latent capacity as well as by exercising high quality growth options if market conditions call for it.
The Group’s strong position in coal will be further supported by improving market dynamics.
“The developing world needs steel, steel needs coking coal, and we have the strongest resource position in the seaborne market,” Mr Henry said.
“Against the backdrop of greater uncertainty in the outlook for thermal coal, we are confident that base demand in emerging economies will remain resilient for decades to come and our higher quality coals position us well in an increasingly carbon constrained world.”
For
per
sona
l use
onl
y
2
Further information on BHP Billiton can be found at: bhpbilliton.com
Media Relations
Investor Relations
Australia and Asia Eleanor Colonico Tel: +61 3 9609 2360 Mobile +61 407 064 748 Email: [email protected] Paul Hitchins Tel: +61 3 9609 2592 Mobile +61 419 315 001 Email: [email protected] Amanda Saunders Tel: +61 3 9609 3935 Mobile +61 417 487 973 Email: [email protected] Fiona Hadley Tel: +61 3 9609 2211 Mobile +61 427 777 908 Email: [email protected] United Kingdom and South Africa Ruban Yogarajah Tel: +44 207 802 4033 Mobile +44 7827 082 022 Email: [email protected] Jennifer White Tel : +44 207 802 7462 Mobile +44 7827 253 764 Email: [email protected] North America Jaryl Strong Tel: +1 713 499 5548 Mobile: +1 281 222 6627 Email: [email protected]
Australia and Asia Tara Dines Tel: +61 3 9609 2222 Mobile: +61 499 249 005 Email: [email protected] Andrew Gunn Tel: +61 3 9609 3575 Mobile: +61 402 087 354 Email: [email protected] United Kingdom and South Africa Rob Clifford Tel: +44 20 7802 4131 Mobile: +44 7788 308 844 Email: [email protected] Americas James Wear Tel: +1 212 310 1421 Mobile: +1 347 882 3011 Email: [email protected] Joseph Suarez Tel: +1 212 310 1422 Mobile: +1 646 400 3803 Email: [email protected]
BHP Billiton Limited ABN 49 004 028 077 Registered in Australia Registered Office: Level 18, 171 Collins Street Melbourne Victoria 3000 Australia Tel +61 1300 55 4757 Fax +61 3 9609 3015
BHP Billiton Plc Registration number 3196209 Registered in England and Wales Registered Office: Neathouse Place London SW1V 1LH United Kingdom Tel +44 20 7802 4000 Fax +44 20 7802 4111
Members of the BHP Billiton Group which is headquartered in Australia
Follow us on social media F
or p
erso
nal u
se o
nly

Coal: The path to improve returns21 June 2016
Mike Henry
President Operations, Minerals Australia
Caval RidgeF
or p
erso
nal u
se o
nly

Disclaimer
Forward-looking statements
This presentation contains forward-looking statements, including statements regarding: trends in commodity prices and currency exchange rates; demand for commodities; plans, strategies and objectives of management; closure or divestment of
certain operations or facilities (including associated costs); anticipated production or construction commencement dates; capital costs and scheduling; operating costs and shortages of materials and skilled employees; anticipated productive lives of
projects, mines and facilities; provisions and contingent liabilities; tax and regulatory developments.
Forward-looking statements can be identified by the use of terminology such as ‘intend’, ‘aim’, ‘project’, ‘anticipate’, ‘estimate’, ‘plan’, ‘believe’, ‘expect’, ‘may’, ‘should’, ‘will’, ‘continue’, ‘annualised’ or similar words. These statements discuss future
expectations concerning the results of operations or financial condition, or provide other forward-looking statements.
These forward-looking statements are not guarantees or predictions of future performance, and involve known and unknown risks, uncertainties and other factors, many of which are beyond our control, and which may cause actual results to differ
materially from those expressed in the statements contained in this presentation. Readers are cautioned not to put undue reliance on forward-looking statements.
For example, future revenues from our operations, projects or mines described in this presentation will be based, in part, upon the market price of the minerals, metals or petroleum produced, which may vary significantly from current levels. These
variations, if materially adverse, may affect the timing or the feasibility of the development of a particular project, the expansion of certain facilities or mines, or the continuation of existing operations.
Other factors that may affect the actual construction or production commencement dates, costs or production output and anticipated lives of operations, mines or facilities include our ability to profitably produce and transport the minerals, petroleum
and/or metals extracted to applicable markets; the impact of foreign currency exchange rates on the market prices of the minerals, petroleum or metals we produce; activities of government authorities in some of the countries where we are exploring
or developing these projects, facilities or mines, including increases in taxes, changes in environmental and other regulations and political uncertainty; labour unrest; and other factors identified in the risk factors discussed in BHP Billiton’s filings with
the US Securities and Exchange Commission (the “SEC”) (including in Annual Reports on Form 20-F) which are available on the SEC’s website at www.sec.gov.
Except as required by applicable regulations or by law, the Group does not undertake any obligation to publicly update or review any forward-looking statements, whether as a result of new information or future events.
Past performance cannot be relied on as a guide to future performance.
Non-IFRS financial information
BHP Billiton results are reported under International Financial Reporting Standards (IFRS) including Underlying EBIT and Underlying EBITDA which are used to measure segment performance. This release may also include certain non-IFRS
measures including Adjusted effective tax rate, Free cash flow, Gearing ratio, Net debt, Net operating assets, Underlying attributable profit, Underlying basic (loss)/earnings per share, Underlying EBIT margin and Underlying EBITDA margin. These
measures are used internally by management to assess the performance of our business, make decisions on the allocation of our resources and assess operational management. Non-IFRS measures have not been subject to audit or review and
should not be considered as an indication of or alternative to an IFRS measure of profitability, financial performance or liquidity.
Presentation of data
Unless specified otherwise: all data is presented on a continuing operations basis to exclude the contribution from assets that were demerged with South32; references to Underlying EBITDA margin exclude third party trading activities; data from
subsidiaries is shown on a 100 per cent basis and data from equity accounted investments and other operations is shown on a proportionate consolidation basis. Queensland Coal comprises the BHP Billiton Mitsubishi Alliance (BMA) asset, jointly
operated with Mitsubishi, and the BHP Billiton Mitsui Coal (BMC) asset, operated by BHP Billiton.
No offer of securities
Nothing in this presentation should be construed as either an offer to sell or a solicitation of an offer to buy or sell BHP Billiton securities in any jurisdiction, or be treated or relied upon as a recommendation or advice by BHP Billiton.
Reliance on third party information
The views expressed in this presentation contain information that has been derived from publicly available sources that have not been independently verified. No representation or warranty is made as to the accuracy, completeness or reliability of
the information. This presentation should not be relied upon as a recommendation or forecast by BHP Billiton.
Mike Henry, President Operations, Minerals Australia
21 June 2016 2
For
per
sona
l use
onl
y
Statement of Coal Reserves
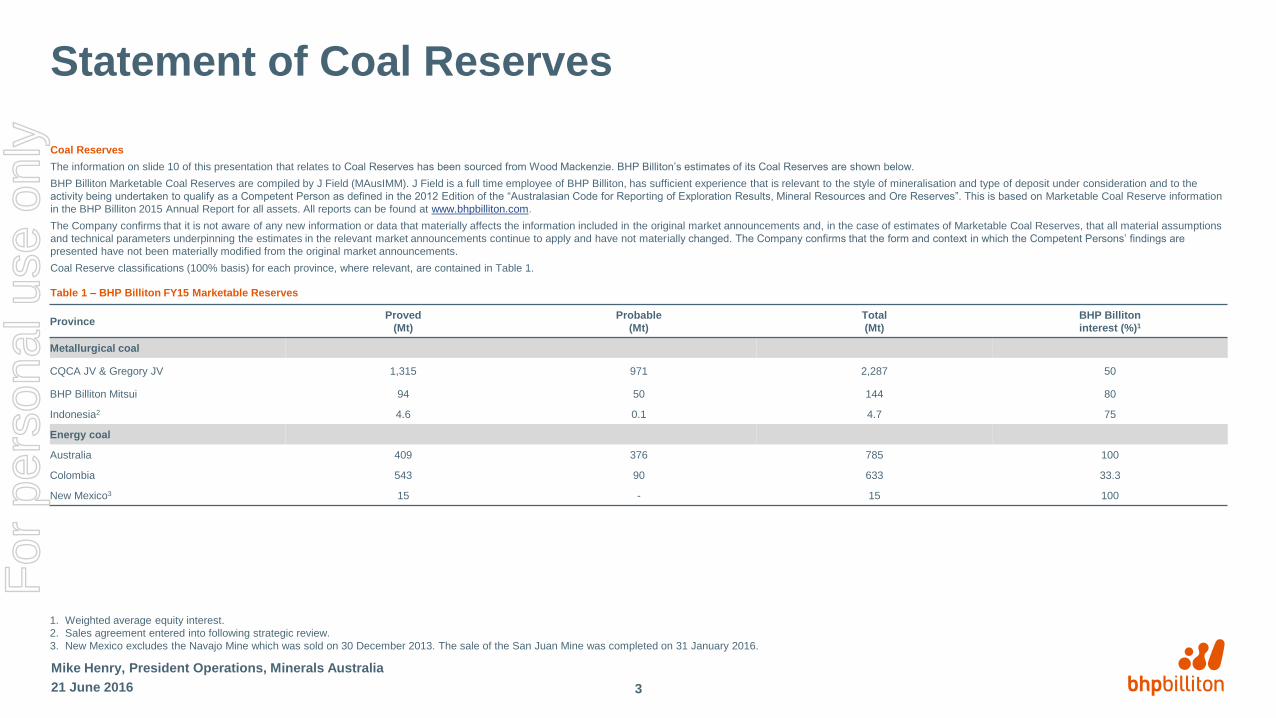
Coal Reserves
The information on slide 10 of this presentation that relates to Coal Reserves has been sourced from Wood Mackenzie. BHP Billiton’s estimates of its Coal Reserves are shown below.
BHP Billiton Marketable Coal Reserves are compiled by J Field (MAusIMM). J Field is a full time employee of BHP Billiton, has sufficient experience that is relevant to the style of mineralisation and type of deposit under consideration and to the
activity being undertaken to qualify as a Competent Person as defined in the 2012 Edition of the “Australasian Code for Reporting of Exploration Results, Mineral Resources and Ore Reserves”. This is based on Marketable Coal Reserve information
in the BHP Billiton 2015 Annual Report for all assets. All reports can be found at www.bhpbilliton.com.
The Company confirms that it is not aware of any new information or data that materially affects the information included in the original market announcements and, in the case of estimates of Marketable Coal Reserves, that all material assumptions
and technical parameters underpinning the estimates in the relevant market announcements continue to apply and have not materially changed. The Company confirms that the form and context in which the Competent Persons’ findings are
presented have not been materially modified from the original market announcements.
Coal Reserve classifications (100% basis) for each province, where relevant, are contained in Table 1.
Table 1 – BHP Billiton FY15 Marketable Reserves
Mike Henry, President Operations, Minerals Australia
21 June 2016
ProvinceProved
(Mt)
Probable
(Mt)
Total
(Mt)
BHP Billiton
interest (%)1
Metallurgical coal
CQCA JV & Gregory JV 1,315 971 2,287 50
BHP Billiton Mitsui 94 50 144 80
Indonesia2 4.6 0.1 4.7 75
Energy coal
Australia 409 376 785 100
Colombia 543 90 633 33.3
New Mexico3 15 - 15 100
1. Weighted average equity interest.
2. Sales agreement entered into following strategic review.
3. New Mexico excludes the Navajo Mine which was sold on 30 December 2013. The sale of the San Juan Mine was completed on 31 January 2016.
3
For
per
sona
l use
onl
y

The path to improve returns
• Safe and reliable operations provide the platform for success
• Longer-term coal market outlook remains positive
• We continue to optimise our simple portfolio of high-quality assets
• We will unlock further productivity, reduce costs and release latent capacity
21 June 2016
Mike Henry, President Operations, Minerals Australia
4
For
per
sona
l use
onl
y

Experienced team enabled by new Operating Model
• Our new Operating Model supports improved returns
– enhanced focus on safety, volume and cost
– lower overheads and more effective functional support
– accelerated replication of best practice
– global centres of excellence for Maintenance, Projects
and Geoscience
• Deep operating experience across the leadership team
– average industry experience of 23 years
– operating experience across 6 continents and
13 commodities
21 June 2016
Mike Henry, President Operations, Minerals Australia
5
Corporate
AffairsTechnology
Human
ResourcesFinance
Risk and
Legal
Marketing
and Supply
Global
Functions
Global Centres
of Excellence
Minerals Australia Leadership Team
Vice President
Planning & Technical
David Ruddell
24 years
Vice President
HSE
Hannes van Rensburg
28 years
Asset President
BMA
Rag Udd
19 years
Asset President
WAIO
Edgar Basto
20 years
Asset President
Olympic Dam
Jacqui McGill
28 years
Vice President
Projects
Matthew Furrer
25 years
Asset President
BMC, NSWEC, IndoMet
James Palmer
19 years
Vice President
Improvement
Rob Telford
23 years
President Operations
Minerals Australia
Mike Henry
26 years
Asset President
Nickel West
Eddy Haegel
25 years
Vice President
Maintenance
Brandon Craig
21 yearsFor
per
sona
l use
onl
y

Safe and sustainable operations
• ~50% improvement in TRIF since June 20151,2
– focused on the elimination of fatalities and serious incidents
• Replication of the Field Leadership Program from Western
Australia Iron Ore in FY16 is supporting a safer business
– strengthened safety engagement with our employees
– improved control verification
– better incident reporting and reviews
21 June 2016
Mike Henry, President Operations, Minerals Australia
Improving our safety performance(TRIF per million hours worked1, operated coal assets)
3
4
5
6
7
8
June 2013 June 2014 June 2015
12 month moving average 3 month moving average
1. Total recordable injury frequency (TRIF) for operated coal assets. Excludes assets demerged with South32 from March 2015 and San Juan Coal from January 2016.
2. Reflects improvement in 3 month moving average TRIF.
6
For
per
sona
l use
onl
y

Short-term
• Cost curve has flattened
• Lower prices are leading to closures and reduced investment
Long-term
• The world continues to require steel and metallurgical coal is
essential for pig iron production
• China will continue to import seaborne metallurgical coal
– demand supported by coastal market access and requirement
for consistent, quality product in larger blast furnaces
– commitment to rationalise domestic supply remains a risk
• Scarcity of high-quality resources and demand growth in
emerging economies underpins robust outlook
– particularly in India where we expect strong steel production
growth
Metallurgical coal outlook supported by growing demand for high-quality product
21 June 2016
Mike Henry, President Operations, Minerals Australia
Source: Wood Mackenzie; Worldsteel; BHP Billiton analysis.
1. Includes productivity improvements.
2. Emerging Asia includes India and countries in South Asia and North Asia, excluding China, Japan and South Korea.
0
5
10
15
2000 2015 2020e 2025e 2030e 2035e
Emerging Asia² China US Europe
Gap to close in emerging market steel stock(finished steel per capita, t)
7
Seaborne metallurgical coal supply and demand (Bt)
Supply
opportunity
Existing supply1 Demand range Demand
2015 2020e 2025e 2030e 2035e
For
per
sona
l use
onl
y

2015 2020e 2025e 2030e 2035e
Energy coal will remain an important part of the global energy complexShort-term
• Markets are expected to remain oversupplied in the near term
– China’s demand for imports is likely to fall further as domestic
overcapacity persists
Long-term
• Absolute demand expected to increase by 10-15% by the mid-2020s,
despite a declining share in the global electricity generation fuel mix
• India and South East Asia have 26% of the world’s population, but
account for only 13% of global electricity generation
– low-cost energy coal is expected to be a preferred fuel source
• China consumes >50% of the world’s energy coal and while its total
long-term demand for energy coal is expected to increase, its
demand for seaborne coal is likely to decline
21 June 2016
Mike Henry, President Operations, Minerals Australia
Source: Wood Mackenzie; IEA; BHP Billiton analysis.
1. Includes productivity improvements.
2. Based on IEA data from WEO2015_AnnexA © OECD/IEA, www.iea.org/statistics. Licence: www.iea.org/t&c;
as modified by BHP Billiton.
Global electricity fuel mix2
(PWh) (coal share, %)
Energy coal use in electricity2
(PWh)
India China
Other non-OECD Asia
RoW
8
Additional seaborne supply required to meet expected demand(Bt)
0
25
50
0
25
50
2013 2020e 2030e 2035e
Coal Oil and gas
Nuclear Hydro
Other Coal share
0
5
10
15
2013 2020e 2030e 2035e
Supply
opportunity
Existing supply1 Demand range Demand
Global Accord
scenario shock event
For
per
sona
l use
onl
y

Our portfolio is resilient in a 2oC world
• Warming of the climate is unequivocal, the human influence is
clear and physical impacts are unavoidable
• We believe the world must pursue the twin objectives of limiting
climate change and providing access to affordable energy
– we do not prioritise one of these over the other – both are
essential
• Our diverse portfolio is resilient in both an orderly and a rapid
transition to a 2oC world1
– metallurgical coal is essential for pig iron production, with
more stringent regulations to reduce emissions likely to
increase VIU2 for quality metallurgical coal
– base demand for energy coal is resilient in emerging
economies given its cost competitiveness against other fuel
types, with demand for higher-quality product expected to
increase in a carbon constrained world
21 June 2016
Mike Henry, President Operations, Minerals Australia
Long-term commodity demand range in a 2°C world
60
80
100
120
140
En
erg
y c
oal
Me
tallu
rgic
al
co
al
Oil
He
nry
Hu
b g
as
Co
pp
er
Iro
n o
re
Po
tash
Ura
niu
m
Long-term demand range across Global Accord1 scenario and shock
event (relative to long-term demand in central case)
2014 actual demand (relative to long-term demand in central case)
Long-term demand
in the central case
9
1. Our Global Accord scenario reflects a global outcome whereby the long-term goal of holding the increase in
global average temperature to below 2°C above pre-industrial levels is met.
2. Value-in-use (VIU).
For
per
sona
l use
onl
y
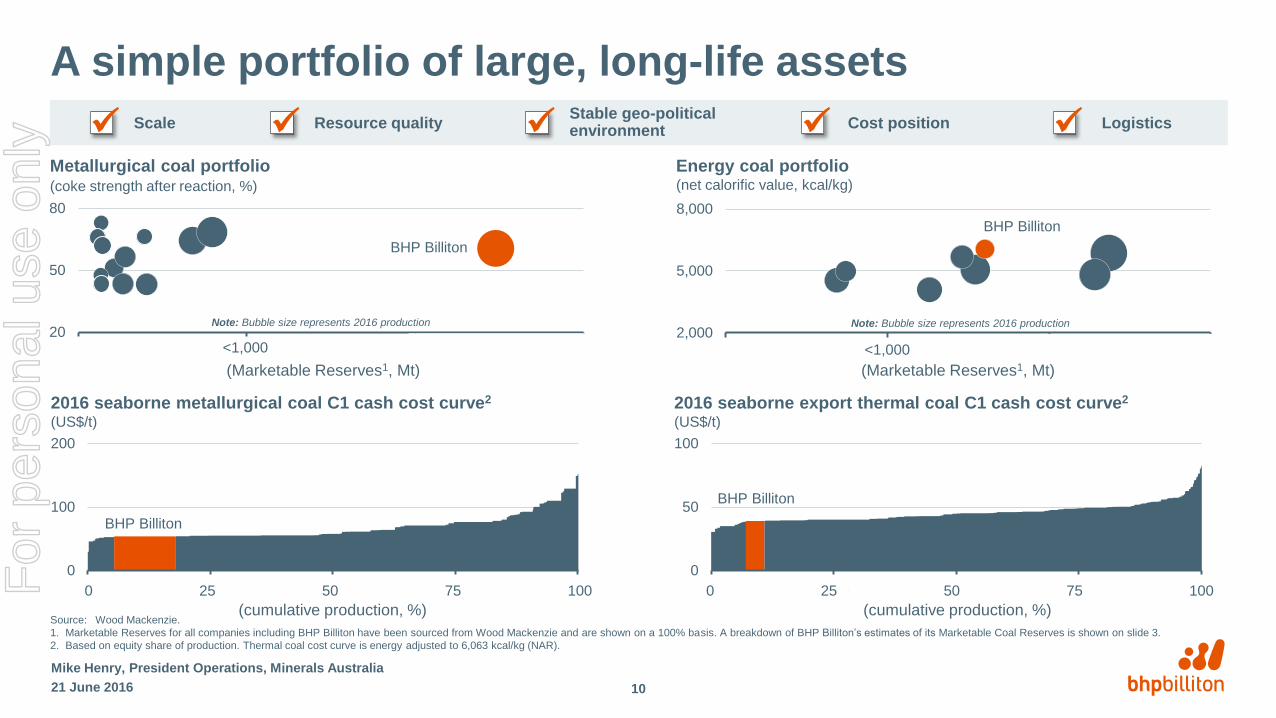
A simple portfolio of large, long-life assets
21 June 2016
Mike Henry, President Operations, Minerals Australia
Metallurgical coal portfolio(coke strength after reaction, %)
Energy coal portfolio(net calorific value, kcal/kg)
BHP Billiton
2,000
5,000
8,000
Scale Resource quality Stable geo-political environment
Logistics Cost position
BHP Billiton
20
50
80
2016 seaborne export thermal coal C1 cash cost curve2
(US$/t)
Source: Wood Mackenzie.
1. Marketable Reserves for all companies including BHP Billiton have been sourced from Wood Mackenzie and are shown on a 100% basis. A breakdown of BHP Billiton’s estimates of its Marketable Coal Reserves is shown on slide 3.
2. Based on equity share of production. Thermal coal cost curve is energy adjusted to 6,063 kcal/kg (NAR).
2016 seaborne metallurgical coal C1 cash cost curve2
(US$/t)
(Marketable Reserves1, Mt) (Marketable Reserves1, Mt)
Note: Bubble size represents 2016 production Note: Bubble size represents 2016 production
(cumulative production, %)
0
100
200
0% 25% 50% 75% 100%0 25 50 75 100
(cumulative production, %)
0
50
100
0% 25% 50% 75% 100%0 25 50 75 100
<1,000 <1,000
BHP Billiton
BHP Billiton
10
For
per
sona
l use
onl
y

We continue to simplify our portfolio
• We have created a concentrated portfolio of tier 1
assets that retain significant growth optionality
– Illawarra Coal and South Africa Energy Coal
demerged with South32
– sale agreement entered into for IndoMet Coal
– sale of San Juan Mine completed and transition
of Navajo Coal to NTEC1 on track for end-CY16
• Our response to the economics of individual operations
has been disciplined
– closure of Crinum operations prior to development of
high-cost final longwall panel
– suspension of high-cost, loss-making capacity at
Norwich Park and Gregory
– reduction of higher-cost production at NSW Energy Coal
– outsourcing of drill, blast and pre-strip operations at
Blackwater and pursuit of fit for purpose enterprise agreement
• We will continue to pursue further optimisation of our portfolio
21 June 2016
Mike Henry, President Operations, Minerals Australia
Cerrejón Coal
IndoMet Coal
Queensland Coal
NSW Energy Coal
New Mexico Coal
Note: Bubble size indicative of FY15 production/capacity.
1. Navajo Transitional Energy Company (NTEC).
Metallurgical coal Demerged/sold assetsEnergy coal
South Africa Energy Coal
Illawarra Coal
11
For
per
sona
l use
onl
y

3,500
6,130
8,760
FY13 FY14 FY15 FY16eFY17e
Continued improvements in productivity…
21 June 2016
Mike Henry, President Operations, Minerals Australia
0
5
10
15
Previous Improvement Pit-stop service All Coal(current average)
• Delivered >US$3 billion in productivity gains since FY121
– additional ~US$600 million expected by end-FY17
• Most operations will have the bottleneck at the wash plant by
end-FY17
– targeting wash plant utilisation of 8,000 hours by FY19
– improvement driven by a focus on maintenance strategies
and reducing non-coal delays
• Focus on achieving truck utilisation of 6,500 hours by FY202
– Daunia’s ultra-class fleet is achieving ~6,000 hours – the best
across BHP Billiton’s ultra class fleet
– improvement driven by improved shift change processes, pit
stop servicing, and upgraded dispatch and reporting systems
• We expect to deliver a 5 Mt (8%) increase in volumes3 from FY15
to FY18
1. FY15 relative to FY12.
2. Truck hours exclude queue time. Target represents wash plant availability of 96% and 8,000 operating hours, and truck
availability of 88% and 6,500 operating hours.
3. Includes Queensland Coal and NSW Energy Coal.
4. Average over FY15 and FY16 YTD.
Increasing availability through ‘pit-stop’ maintenance(ultra-class truck service duration, hours)
Daunia
Upside
potential
12
Wash plant and truck productivity2
(availability, %) (operating hours per annum)
4
80
90
100
FY13 FY14 FY15 FY16e FY17e
Wash plant (bottleneck)
Ultra-class trucks
Target
Target
May 2016
May 2016
For
per
sona
l use
onl
y

40
60
80
FY12 FY15 FY16e FY17e
Unit cash costs
30
45
60
FY12 FY15 FY16e FY17e
Unit cash costs
…is sustainably lowering costs…
• Absolute cash costs ~25% below FY121 despite higher volumes
– 56% reduction in unit costs at Queensland Coal
– 29% reduction in unit costs at NSW Energy Coal
• Further 16% reduction in absolute costs anticipated by FY172
– unit costs down 20% to US$52/t3 at Queensland Coal
– unit costs down 9% to US$38/t3 at NSW Energy Coal
• At NSW Energy Coal, geological constraints (monocline
transition) will increase waste stripping, haulage distances and
unit costs post FY17
– studies underway to assess mitigating options
• Recovery in FY17 EBITDA margins despite lower expected prices
• All operations remain cash flow positive
21 June 2016
Mike Henry, President Operations, Minerals Australia
1. FY15 relative to FY12.
2. FY17 relative to FY15.
3. Based on exchange rates of AUD/USD 0.72 in FY16 and 0.71 in FY17. Excludes freight and royalties.
4. FY16 and FY17 EBITDA margins based on production and unit cost guidance, and consensus prices.
Queensland Coal(unit cash costs3, US$/t)
NSW Energy Coal(unit cash costs3, US$/t)
150
(EBITDA margin4, %)
(price index,
FY12=100)
(EBITDA margin4, %)
(price index,
FY12=100)
0
50
100
0
20
40
FY12 FY15 FY16e FY17eEBITDA margin
Thermal coal consensus price
13
0
50
100
0
15
30
FY12 FY15 FY16e FY17e
EBITDA margin
HCC consensus price
For
per
sona
l use
onl
y
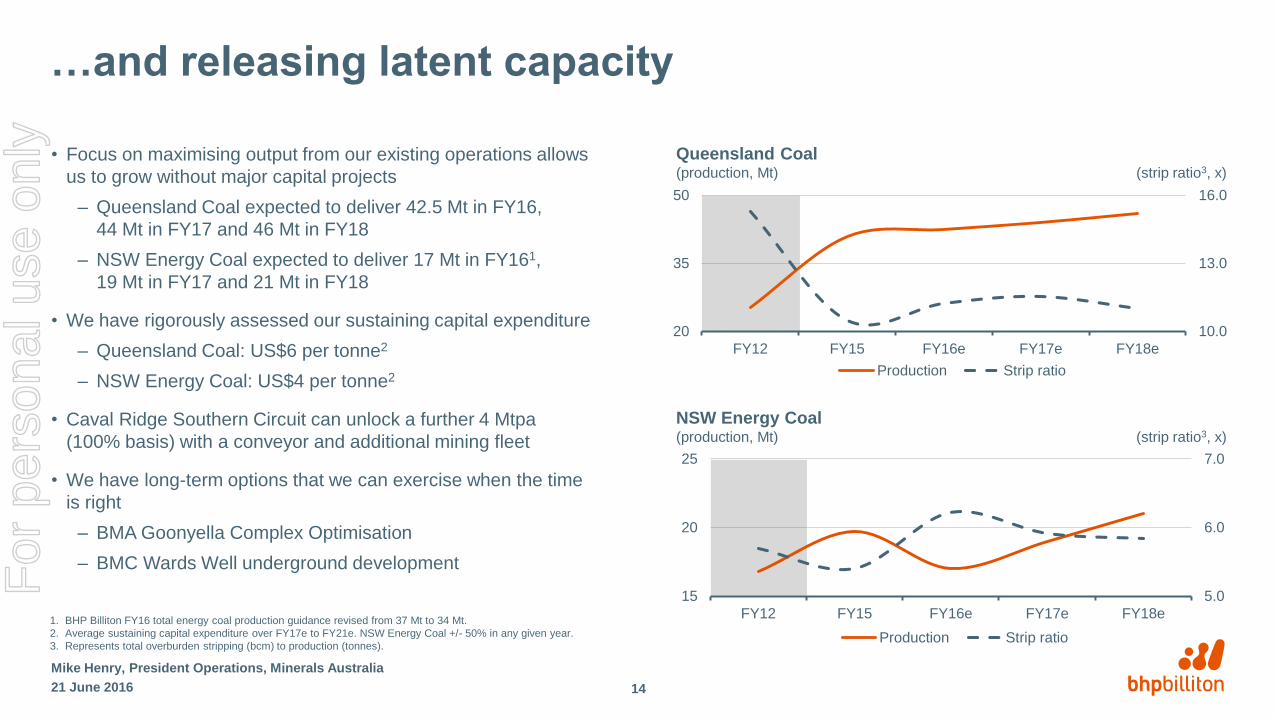
…and releasing latent capacity
• Focus on maximising output from our existing operations allows
us to grow without major capital projects
– Queensland Coal expected to deliver 42.5 Mt in FY16,
44 Mt in FY17 and 46 Mt in FY18
– NSW Energy Coal expected to deliver 17 Mt in FY161,
19 Mt in FY17 and 21 Mt in FY18
• We have rigorously assessed our sustaining capital expenditure
– Queensland Coal: US$6 per tonne2
– NSW Energy Coal: US$4 per tonne2
• Caval Ridge Southern Circuit can unlock a further 4 Mtpa
(100% basis) with a conveyor and additional mining fleet
• We have long-term options that we can exercise when the time
is right
– BMA Goonyella Complex Optimisation
– BMC Wards Well underground development
21 June 2016
Mike Henry, President Operations, Minerals Australia
1. BHP Billiton FY16 total energy coal production guidance revised from 37 Mt to 34 Mt.
2. Average sustaining capital expenditure over FY17e to FY21e. NSW Energy Coal +/- 50% in any given year.
3. Represents total overburden stripping (bcm) to production (tonnes).
14
5.0
6.0
7.0
15
20
25
FY12 FY15 FY16e FY17e FY18e
Production Strip ratio
10.0
13.0
16.0
20
35
50
FY12 FY15 FY16e FY17e FY18e
Production Strip ratio
Queensland Coal(production, Mt) (strip ratio3, x)
NSW Energy Coal(production, Mt) (strip ratio3, x)
For
per
sona
l use
onl
y

Enterprise Agreement (EA) renewals
21 June 2016
Mike Henry, President Operations, Minerals Australia
• Caval Ridge, Poitrel, Daunia and Mt Arthur Coal EAs recently
approved
• Progress continuing on Broadmeadow Mine EA
• BMA has commenced renegotiating the BMA EA 2012
– seeking to simplify the EA
– focus on flexibility to better enable safe productivity
improvements and cost efficiencies
– proposing a standalone agreement for Blackwater reflecting its
unique operating environment
– coverage to exclude Norwich Park and Gregory Crinum which
are no longer in operation
– outcomes need to reflect the current market environment
Daunia
15
For
per
sona
l use
onl
y

The path to improve returns
• Safe and reliable operations provide the platform for success
• Longer-term coal market outlook remains positive
• We continue to optimise our simple portfolio of high-quality assets
• We will unlock further productivity, reduce costs and release latent capacity
21 June 2016
Mike Henry, President Operations, Minerals Australia
16
For
per
sona
l use
onl
y

For
per
sona
l use
onl
y

BHP Billiton guidance
Coal FY16e FY17e FY18e Notes
Total metallurgical coal production (Mt) 43 44 46 FY16 comprises Queensland Coal and IndoMet Coal.
Total energy coal production (Mt) 34
Queensland Coal
Production (Mt) 42.5 44 46
Unit cash costs (US$/t) 56 52 Excludes freight and royalties; based on an exchange rate of AUD/USD 0.72 in FY16 and 0.71 in FY17.
Sustaining capital expenditure (US$/t) 3 6 FY17e–FY21e average.
NSW Energy Coal
Production (Mt) 17 19 21
Unit cash costs (US$/t) 44 38 Excludes freight and royalties; based on an exchange rate of AUD/USD 0.72 in FY16 and 0.71 in FY17.
Sustaining capital expenditure (US$/t) 1 4 FY17e–FY21e average; +/- 50% in any given year.
21 June 2016
Mike Henry, President Operations, Minerals Australia
18
For
per
sona
l use
onl
y

Breakdown of costs
21 June 2016
Mike Henry, President Operations, Minerals Australia
Cash costs (FY16e, %)
30%
22%15%
10%
10%
9%4%
29%
18%
17%
10%
9%
8%
9%
Cash costs(FY16e, %)
Fixed versus variable split (approximate) (FY16e, %)
65%
35%
Fixed versus variable split (approximate)(FY16e, %)
65%
35%
BMA NSW Energy Coal
19
Contractors and consultants
Consumables
Labour
Port and rail
Royalties, rates and taxes
Fuel and electricity
Other
Fixed
Variable
For
per
sona
l use
onl
y

Queensland Coal operations
• Largest supplier of seaborne metallurgical coal
• BHP Billiton interest: BMA 50%; BMC 80%
• Capacity at four Queensland ports with matched rail flexibility
allows us to optimise the supply chain
• Key BMA fleet statistics
– 33 draglines (world’s largest fleet)
– 53 shovels and excavators
– 313 dump trucks
– 142 dozers
– 19 loaders
• Key BMC fleet statistics
– 1 dragline
– 7 shovels and excavators
– 42 dump trucks
– 26 dozers
– 3 loaders
21 June 2016
Mike Henry, President Operations, Minerals Australia
Note: All rail and port capacities are shown at 100%.
1. Blackwater Rail System capacity has been estimated.
20
Moranbah
Mackay
EmeraldBlackwater
South Walker
Creek
Poitrel
Peak Downs
Saraji
Blackwater
Caval Ridge
Daunia
DBCT
Hay Point
Norwich Park
Goonyella Rail System
Blackwater Rail System
Goonyella Riverside
Broadmeadow
BMA
Rail
PortMining lease
BMC
Mine locations
Newlands
Rail System
Rockhampton
For
per
sona
l use
onl
y

New South Wales Energy Coal operations
• Open-cut coal mine in the Hunter Valley, Australia, with 23 Mtpa of
coal handling, preparation and wash plant capacity
• BHP Billiton interest: 100%
• ~6%1 of production sold to Bayswater power station via conveyor,
remainder exported from Newcastle Port
• Owns 35.5% stake in Newcastle Coal Infrastructure Group (NCIG),
which operates the Newcastle Third Port export coal loading facility
• Key fleet statistics
– 2 shovels
– 15 excavators
– 87 dump trucks
– 28 dozers
21 June 2016
Mike Henry, President Operations, Minerals Australia
1. Based on FY15 sales volumes.
21
Muswellbrook
Singleton
Maitland
Cessnock
Mt Arthur
Quirindi
Tamworth
Gunnedah
Mudgee
NEWCASTLE
NSWEC
Rail
Port
Mining lease
Mine locations
For
per
sona
l use
onl
y

Cerrejón Coal operations
• One of the world’s largest open-cut export energy coal mines,
located in the La Guajira province of Colombia
• BHP Billiton interest: 33.3%
• Cerrejón owns and operates integrated rail and port facilities
• Key fleet statistics
– 36 shovels and excavators
– 101 dozers
– 11 front end loaders
– 258 waste trucks
– 56 coal trucks
21 June 2016
Mike Henry, President Operations, Minerals Australia
Note: Port capacity shown at 100%.
RIOHACHA
Dibulla
VALLEDUPAR
Lapaz
San Juan Del Cesar
Villanueva
Fonseca
Barrancas
Albania
Maicao
V E N E Z U E L A
C O L O M B I A
Cerrejón
Castilletes
Nazareth
Taroa
Cabo de La Vela
Manaure
Uribia
CARIBBEAN SEA
Puerto Bolivar
GULF OF
VENEZUELA
22
For
per
sona
l use
onl
y

Coal operations material moved and strip ratios
21 June 2016
Mike Henry, President Operations, Minerals Australia
BMA(material moved, Bt) (strip ratio1, x)
BMC (material moved, Bt) (strip ratio1, x)
NSW Energy Coal(material moved, Bt) (strip ratio1, x)
Material moved Strip ratio
23
1. Represents total overburden stripping (bcm) to production (tonnes).
0.0
4.0
8.0
0.0
0.2
0.4
FY12 FY13 FY14 FY15 FY16e FY17e FY18e0.0
9.0
18.0
0.0
1.5
3.0
FY12 FY13 FY14 FY15 FY16e FY17e FY18e
0.0
6.0
12.0
0.0
0.2
0.4
FY12 FY13 FY14 FY15 FY16e FY17e FY18eFor
per
sona
l use
onl
y

For
per
sona
l use
onl
y