news from xerox corporationfor immediate release 45 glover avenue p.o. box 4505 norwalk, ct...
TRANSCRIPT
Xerox Corporation
45 Glover Avenue
P.O. Box 4505
Norwalk, CT 06856-4505
tel +1-203-968-3000
News from Xerox
For Immediate Release
Xerox Reports Fourth-Quarter Earnings GAAP EPS from continuing operations of 25 cents
Adjusted EPS of 29 cents
Revenue of $5.6 billion; 55 percent from services
Cash flow from operations of $1 billion; $2.4 billion for full-year 2013
Share repurchase of $700 million for full-year 2013
Quarterly cash dividend increase to 6.25 cents per share
NORWALK, Conn., Jan. 24, 2014 – Xerox (NYSE: XRX) announced today fourth-quarter 2013 adjusted earnings per share of 29 cents. Adjusted EPS excludes 4 cents related to amortization of intangibles, resulting in GAAP EPS from continuing operations of 25 cents. In the fourth quarter, total revenue of $5.6 billion was down 3 percent or 4 percent in constant currency. Revenue from the company’s services business, which represented 55 percent of total revenue, was $3.0 billion, flat year over year and down 1 percent in constant currency. Revenue from the company’s document technology business, which represented 42 percent of total revenue, was $2.4 billion, down 6 percent. “We managed anticipated headwinds while continuing to build our business by investing in growth markets such as healthcare and graphic communications, and expanding Services internationally,” said Ursula Burns, Xerox chairman and chief executive officer. “Looking ahead, we’re focused on evolving our portfolio and implementing our cost initiatives to improve both revenue and margins.” “Our clients continue to partner with us to take out complexities in their business processes and we’re seeing success in the marketplace. With services signings up 21 percent in the past year and our BPO and ITO renewal rate at 92 percent for the year, we’re well positioned entering 2014.” Fourth-quarter operating margin of 9.3 percent was down 1.3 points. Gross margin was 30.7 percent, and selling, administrative and general expenses were 18.6 percent of revenue. Xerox generated approximately $1 billion in cash flow from operations during the fourth quarter and $2.4 billion for the year, ending 2013 with a cash balance of $1.8 billion. The company repurchased $524 million of shares in the fourth quarter 2013 and approximately $700 million for the full-year.

Xerox’s board of directors increased the company’s quarterly cash dividend by 8.7 percent to 6.25 cents per share, beginning with the dividend payable on April 30, 2014. For first-quarter 2014, Xerox expects GAAP earnings of 19 to 21 cents per share and adjusted EPS of 23 to 25 cents per share. The company reiterated its full-year 2014 guidance of GAAP EPS in the range of 93 to 99 cents, and adjusted EPS of $1.10 to $1.16. Xerox expects to generate operating cash flow of $1.8 billion to $2.0 billion in 2014 with no finance receivable sales planned. Full-year 2013 results include:
GAAP EPS from continuing operations of 93 cents, adjusted EPS of $1.09
Total revenue of $21.4 billion; $11.9 billion from services, $8.9 billion from document technology
Operating margin of 8.9 percent
Operating cash flow of $2.4 billion
Net income from continuing operations of $1.2 billion, adjusted net income of $1.4 billion
Share repurchase of $700 million About Xerox Since the invention of Xerography 75 years ago, the people of Xerox (NYSE: XRX) have helped businesses simplify the way work gets done. Today, we are the global leader in business process and document management, helping organizations of any size be more efficient so they can focus on their real business. Headquartered in Norwalk, Conn., more than 140,000 Xerox employees serve clients in 160 countries, providing business services, printing equipment and software for commercial and government organizations. Learn more at www.xerox.com. Non- GAAP Measures: This release refers to the following non-GAAP financial measures:
Adjusted EPS (earnings per share) for the fourth quarter and full-year 2013 as well as for the first quarter and full-year 2014 guidance which excludes the amortization of intangible assets.
Adjusted net income for the full-year 2013 which excludes the amortization of intangible assets.
Operating margin for the fourth quarter and full-year 2013 which excludes certain expenses.
Constant Currency revenue growth for the fourth quarter 2013 which excludes the effects of currency translation.
Refer to the “Non-GAAP Financial Measures” section of this release for a discussion of these non-GAAP measures and their reconciliation to the reported GAAP measure. Forward-Looking Statements This release contains "forward-looking statements" as defined in the Private Securities Litigation Reform Act of 1995. The words “anticipate,” “believe,” “estimate,” “expect,” “intend,” “will,” “should” and similar expressions, as they relate to us, are intended to identify forward-looking statements. These

statements reflect management’s current beliefs, assumptions and expectations and are subject to a number of factors that may cause actual results to differ materially. These factors include but are not limited to: changes in economic conditions, political conditions, trade protection measures, licensing requirements and tax matters in the United States and in the foreign countries in which we do business; changes in foreign currency exchange rates; actions of competitors; our ability to obtain adequate pricing for our products and services and to maintain and improve cost efficiency of operations, including savings from restructuring actions; the risk that unexpected costs will be incurred; the risk that subcontractors, software vendors and utility and network providers will not perform in a timely, quality manner; our ability to recover capital investments; the risk that multi-year contracts with governmental entities could be terminated prior to the end of the contract term; the risk that our Services business could be adversely affected if we are unsuccessful in managing the ramp-up of new contracts; development of new products and services; our ability to protect our intellectual property rights; our ability to expand equipment placements; the risk that individually identifiable information of customers, clients and employees could be inadvertently disclosed or disclosed as a result of a breach of our security; interest rates, cost of borrowing and access to credit markets; reliance on third parties for manufacturing of products and provision of services; our ability to drive the expanded use of color in printing and copying; the outcome of litigation and regulatory proceedings to which we may be a party; and other factors that are set forth in the “Risk Factors” section, the “Legal Proceedings” section, the “Management’s Discussion and Analysis of Financial Condition and Results of Operations” section and other sections of our Quarterly Reports on Form 10-Q for the quarters ended March 31, 2013, June 30, 2013 and September 30, 2013, and our 2012 Annual Report on Form 10-K filed with the Securities and Exchange Commission. The Company assumes no obligation to update any forward-looking statements as a result of new information or future events or developments, except as required by law. -XXX- Media Contacts: Ken Ericson, Xerox, +1-202-520-2388, [email protected]
Karen Arena, Xerox, +1-732-407-8510, [email protected] Investor Contacts: Jennifer Horsley, Xerox, +1-203-849-2656, [email protected] Troy Anderson, Xerox, +1-203-849- 5217, [email protected] Note: To receive RSS news feeds, visit http://news.xerox.com/rss. For open commentary, industry perspectives and views visit http://www.linkedin.com/company/xerox, http://twitter.com/xeroxcorp, http://twitter.com/XeroxDocuShare, http://realbusinessatxerox.blogs.xerox.com, http://www.facebook.com/XeroxCorp, http://www.youtube.com/XeroxCorp. Xerox® and Xerox and Design® are trademarks of Xerox in the United States and/or other countries.

Xerox Corporation
Condensed Consolidated Statements of Income (Unaudited)
(in millions, except per-share data) 2013 2012
%
Change 2013 2012
%
Change
Revenues
Sales 1,540$ 1,659$ (7%) 5,659$ 5,927$ (5%)
Outsourcing, maintenance and rentals 3,910 3,958 (1%) 15,293 15,213 1%
Financing 119 146 (18%) 483 597 (19%)
Total Revenues 5,569 5,763 (3%) 21,435 21,737 (1%)
Costs and Expenses
Cost of sales 998 1,052 (5%) 3,616 3,791 (5%)
Cost of outsourcing, maintenance and rentals 2,824 2,819 - 11,008 10,802 2%
Cost of financing 38 45 (16%) 163 198 (18%)
Research, development and engineering expenses 153 160 (4%) 601 655 (8%)
Selling, administrative and general expenses 1,037 1,077 (4%) 4,137 4,216 (2%)
Restructuring and asset impairment charges 56 91 (38%) 116 154 (25%)
Amortization of intangible assets 83 82 1% 332 328 1%
Other expenses, net 35 71 (51%) 150 261 (43%)
Total Costs and Expenses 5,224 5,397 (3%) 20,123 20,405 (1%)
345 366 (6%) 1,312 1,332 (2%)
Income tax expense 73 71 3% 276 272 1%
Equity in net income of unconsolidated affiliates 43 47 (9%) 169 152 11%
315 342 (8%) 1,205 1,212 (1%)
(Loss) income from Discontinued Operations, net of tax (4) 1 * (26) 11 *
Net Income 311 343 (9%) 1,179 1,223 (4%)
Less: Net income attributable to noncontrolling interests 5 8 (38%) 20 28 (29%)
Net Income Attributable to Xerox 306$ 335$ (9%) 1,159$ 1,195$ (3%)
Amounts attributable to Xerox:
Net Income from continuing operations 310$ 334$ (7%) 1,185$ 1,184$ *
Net (loss) Income from discontinued operations (4) 1 * (26) 11 *
Net Income attributable to Xerox 306$ 335$ (9%) 1,159$ 1,195$ (3%)
Basic Earnings per Share:
Continuing Operations 0.25$ 0.26$ (4%) 0.95$ 0.89$ 7%
Discontinued Operations - - * (0.02) 0.01 *
Total Basic Earnings per Share 0.25$ 0.26$ (4%) 0.93$ 0.90$ 3%
Diluted Earnings per Share:
Continuing Operations 0.25$ 0.26$ (4%) 0.93$ 0.87$ 7%
Discontinued Operations (0.01) - * (0.02) 0.01 *
Total Diluted Earnings per Share 0.24$ 0.26$ (8%) 0.91$ 0.88$ 3%
* Percent change not meaningful.
(1) Referred to as "Pre-Tax Income" throughout the remainder of this document.
Income before Income Taxes & Equity Income (1)
Income from Continuing Operations
Three Months Year
Ended December 31, Ended December 31,
Xerox Corporation
Condensed Consolidated Statements of Comprehensive Income (Unaudited)
Three Months Ended Year Ended
(in millions) 2013 2012 2013 2012
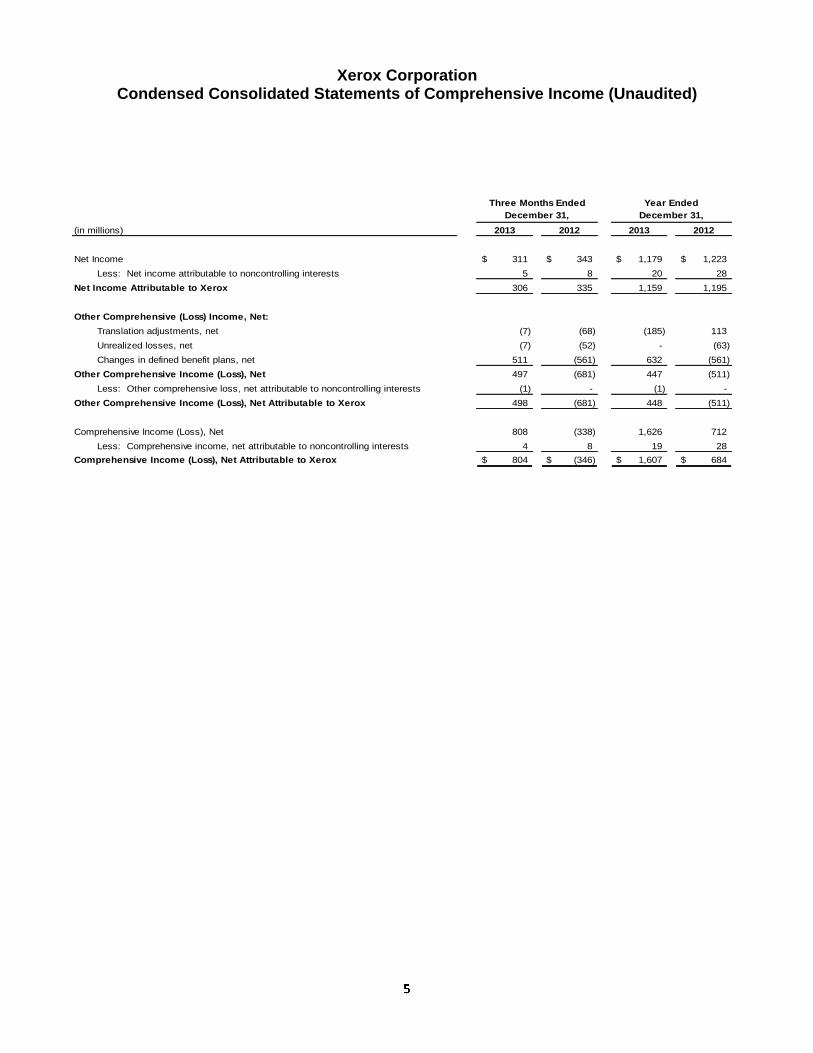
Net Income 311$ 343$ 1,179$ 1,223$
Less: Net income attributable to noncontrolling interests 5 8 20 28
Net Income Attributable to Xerox 306 335 1,159 1,195
Other Comprehensive (Loss) Income, Net:
Translation adjustments, net (7) (68) (185) 113
Unrealized losses, net (7) (52) - (63)
Changes in defined benefit plans, net 511 (561) 632 (561)
Other Comprehensive Income (Loss), Net 497 (681) 447 (511)
Less: Other comprehensive loss, net attributable to noncontrolling interests (1) - (1) -
Other Comprehensive Income (Loss), Net Attributable to Xerox 498 (681) 448 (511)
Comprehensive Income (Loss), Net 808 (338) 1,626 712
Less: Comprehensive income, net attributable to noncontrolling interests 4 8 19 28
Comprehensive Income (Loss), Net Attributable to Xerox 804$ (346)$ 1,607$ 684$
December 31, December 31,

Xerox Corporation
Condensed Consolidated Balance Sheets (Unaudited)
December 31, December 31,
(in millions, except share data in thousands) 2013 2012
Assets
Cash and cash equivalents 1,764$ 1,246$
Accounts receivable, net 2,929 2,866
Billed portion of finance receivables, net 113 152
Finance receivables, net 1,500 1,836
Inventories 998 1,011
Other current assets 1,207 1,162
Total current assets 8,511 8,273
Finance receivables due after one year, net 2,917 3,325
Equipment on operating leases, net 559 535
Land, buildings and equipment, net 1,466 1,556
Investments in affiliates, at equity 1,285 1,381
Intangible assets, net 2,503 2,783
Goodwill 9,205 9,062
Deferred tax assets, long-term 368 763
Other long-term assets 2,222 2,337
Total Assets 29,036$ 30,015$
Liabilities and Equity
Short-term debt and current portion of long-term debt 1,117$ 1,042$
Accounts payable 1,626 1,913
Accrued compensation and benefits costs 734 741
Unearned income 496 438
Other current liabilities 1,713 1,776
Total current liabilities 5,686 5,910
Long-term debt 6,904 7,447
Pension and other benefit liabilities 2,136 2,958
Post-retirement medical benefits 785 909
Other long-term liabilities 757 778
Total Liabilities 16,268 18,002
Series A Convertible Preferred Stock 349 349
Common stock 1,210 1,239
Additional paid-in capital 5,282 5,622
Treasury stock, at cost (252) (104)
Retained earnings 8,839 7,991
Accumulated other comprehensive loss (2,779) (3,227)
Xerox shareholders' equity 12,300 11,521
Noncontrolling interests 119 143
Total Equity 12,419 11,664
Total Liabilities and Equity 29,036$ 30,015$
Shares of common stock issued 1,210,321 1,238,696
Treasury stock (22,001) (14,924)
Shares of common stock outstanding 1,188,320 1,223,772

Xerox Corporation Condensed Consolidated Statements of Cash Flows (Unaudited)
Three Months Ended Twelve Months Ended
(in millions) 2013 2012 2013 2012
Cash Flows from Operating Activities:
Net income 311$ 343$ 1,179$ 1,223$
Adjustments required to reconcile net income to cash flows from operating activities:
Depreciation and amortization 346 336 1,358 1,301
Provision for receivables 37 44 123 127
Provision for inventory 13 4 35 30
Net (gain) loss on sales of businesses and assets (31) 1 (45) 2
Undistributed equity in net income of unconsolidated affiliates (7) (23) (92) (90)
Stock-based compensation 12 33 90 125
Restructuring and asset impairment charges 56 91 116 154
Payments for restructurings (29) (31) (136) (144)
Contributions to defined benefit pension plans (68) (54) (230) (364)
(Increase) decrease in accounts receivable and billed portion of finance receivables (19) 245 (576) (776)
Collections of deferred proceeds from sales of receivables 111 120 482 470
Decrease (increase) in inventories 144 128 (38) -
Increase in equipment on operating leases (96) (76) (303) (276)
Decrease in finance receivables 90 260 609 947
Collections on beneficial interest from sales of finance receivables 15 - 58 -
Decrease (increase) in other current and long-term assets 13 (69) (145) (265)
Increase (decrease) in accounts payable and accrued compensation 94 350 (29) 120
(Decrease) increase in other current and long-term liabilities (16) 55 (50) (71)
Net change in income tax assets and liabilities 30 45 125 138
Net change in derivative assets and liabilities 17 13 (11) 11
Other operating, net (55) (42) (145) (82)
Net cash provided by operating activities 968 1,773 2,375 2,580
Cash Flows from Investing Activities:
Cost of additions to land, buildings and equipment (93) (105) (346) (388)
Proceeds from sales of land, buildings and equipment 34 1 86 9
Cost of additions to internal use software (18) (25) (81) (125)
Proceeds from sale of businesses 15 - 26 -
Acquisitions, net of cash acquired - (33) (155) (276)
Other investing, net 9 2 18 19
Net cash used in investing activities (53) (160) (452) (761)
Cash Flows from Financing Activities:
Net proceeds (payments) on debt 497 (850) (434) (108)
Common stock dividends (71) (54) (272) (231)
Preferred stock dividends (6) (6) (24) (24)
Proceeds from issuances of common stock 28 1 124 44
Excess tax benefits from stock-based compensation 3 - 16 10
Payments to acquire treasury stock, including fees (524) (334) (696) (1,052)
Repurchases related to stock-based compensation (3) (1) (57) (42)
Distributions to noncontrolling interests (24) (6) (56) (69)
Other financing - - (3) -
Net cash used in financing activities (100) (1,250) (1,402) (1,472)
Effect of exchange rate changes on cash and cash equivalents 1 1 (3) (3)
Increase in cash and cash equivalents 816 364 518 344
Cash and cash equivalents at beginning of period 948 882 1,246 902
Cash and Cash Equivalents at End of Period 1,764$ 1,246$ 1,764$ 1,246$
December 31, December 31,

Financial Review Revenues
(in millions) 2013 2012
%
Change 2013 2012
Equipment sales 969$ 1,014$ (4%) 17% 18%
Annuity revenue 4,600 4,749 (3%) 83% 82%
Total Revenue 5,569$ 5,763$ (3%) 100% 100%
Reconciliation to Condensed Consolidated Statements of Income:
Sales 1,540$ 1,659$ (7%)Less: Supplies, paper and other sales (571) (645) (11%)
Equipment Sales 969$ 1,014$ (4%)
Outsourcing, maintenance and rentals 3,910$ 3,958$ (1%)
Add: Supplies, paper and other sales 571 645 (11%)
Add: Financing 119 146 (18%)
Annuity Revenue 4,600$ 4,749$ (3%)
Three Months Ended
December 31, % of Total Revenue
Fourth quarter 2013 total revenues decreased 3% as compared to the fourth quarter 2012, with a 1-percentage point positive impact from currency, and reflected the following:
Annuity revenue decreased 3% as compared to the fourth quarter 2012, with no impact from currency. Annuity revenue is comprised of the following:
o Outsourcing, maintenance and rentals revenue includes outsourcing revenue within the Services segment, and maintenance revenue (including bundled supplies) and rental revenue, both primarily within the Document Technology segment. A decrease of 1% was driven by a 1% decline in the Services segment and a 3% decline in the Document Technology segment, partially offset by growth in the Other segment.
o Supplies, paper and other sales includes unbundled supplies and other sales, primarily within our Document Technology segment. A decrease of 11% was driven by a reduction in channel supplies inventories in the U.S. and in developing markets, moderately lower supplies and paper demand, and lower licensing sales.
o Financing revenue is generated from financed sale transactions primarily within our Document Technology segment. A decrease of 18% was driven by lower finance receivables primarily as a result of prior period sales of finance receivables and lower originations. See Sales of Finance Receivables section for further discussion.

Equipment sales revenue is reported primarily within our Document Technology segment and the document outsourcing business within our Services segment. Equipment sales revenue decreased 4% as compared to the fourth quarter 2012, including a 1-percentage point positive impact from currency. Benefits from product introductions and a positive mix impact were more than offset by lower volumes in developing markets and price declines ranging from 5% to 10%, which is consistent with prior quarters.
Additional analysis of the change in revenue for each business segment is included in the “Segment Review” section.
Costs, Expenses and Other Income Summary of Key Financial Ratios The following is a summary of key financial ratios used to assess our performance:
2013 2012
Total Gross Margin 30.7% 32.0% (1.3) pts.
RD&E as a % of Revenue 2.7% 2.8% 0.1 pts.
SAG as a % of Revenue 18.6% 18.7% 0.1 pts.
Operating Margin (1) 9.3% 10.6% (1.3) pts.
Pre-tax income margin 6.2% 6.4% (0.2) pts.
Three Months Ended
December 31,
B / (W) *
* Note – Variances do not foot due to rounding.
Operating Margin Fourth quarter 2013 operating margin1 of 9.3% decreased 1.3-percentage points as compared to the fourth quarter 2012, driven primarily by a decline in gross margin of 1.3-percentage points and a moderate improvement in operating expenses as a percent of revenue. The operating margin decline reflects continued pressure on Services margins from higher healthcare platform expenses and the run-off of the student loan business, as well as from higher pension settlement costs impacting Document Technology. Gross Margin Gross margin of 30.7% decreased 1.3-percentage points as compared to the fourth quarter 2012. A decrease of 1.7-percentage points in the Services segment and 0.3-percentage points in the Document Technology segment, along with the impact of a higher mix of Services revenue, were the primary drivers. Additional analysis of the change in gross margin for each business segment is included in the “Segment Review” section.

Research, Development and Engineering Expenses (“RD&E”) Fourth quarter 2013 RD&E as a percentage of revenue of 2.7% was lower by 0.1-percentage point as compared to fourth quarter 2012. Decreases from the higher mix of Services revenue (which historically has lower RD&E as a percentage of revenue), lower spending and productivity improvements were in-line with the overall revenue decline. RD&E of $153 million was $7 million lower than the fourth quarter 2012, reflecting the impact of restructuring and productivity improvements. Innovation continues to be a core strength and we continue to invest at levels that enhance our innovation, particularly in services, color and software. R&D is strategically coordinated with Fuji Xerox. Selling, Administrative and General Expenses (“SAG”) SAG as a percentage of revenue of 18.6% decreased 0.1-percentage points from the fourth quarter 2012. Decreases from the higher mix of Services revenue (which historically has lower SAG as a percentage of revenue), restructuring and productivity improvements, and lower compensation-related expenses were partially offset by higher pension settlement expenses in the Document Technology segment. The net reduction in SAG expenses is in-line with the overall revenue decline. SAG of $1,037 million was $40 million lower than the fourth quarter 2012. This included a $3 million unfavorable impact from currency for the quarter. SAG expenses reflect the following:
$1 million decrease in selling expenses, driven primarily by benefits from restructuring and productivity improvements as well as lower compensation-related expenses. These decreases were mostly offset by the impact of acquisitions and targeted selling investments in higher growth business units.
$31 million decrease in general and administrative expenses driven primarily by benefits from restructuring and productivity improvements as well as lower compensation-related expenses.
$8 million decrease in bad debt expenses to $35 million, due to overall improved collections and lower write-offs. Fourth quarter 2013 bad debt expense remained at less than one percent of receivables.
Restructuring and Asset Impairment Charges During the fourth quarter 2013, we recorded net restructuring and asset impairment charges of $56 million, which included approximately $64 million of severance costs related to headcount reductions of approximately 1,600 employees worldwide and $2 million of lease cancellations. These costs were partially offset by $10 million of net reversals for changes in estimated reserves from prior period initiatives. During the fourth quarter 2012, we recorded net restructuring and asset impairment charges of $91 million, which included approximately $94 million of severance costs related to headcount reductions of approximately 4,300 employees primarily in North America. These costs were partially offset by $3 million of net reversals for changes in estimated reserves from prior period initiatives. The restructuring reserve balance as of December 31, 2013 for all programs was $116 million, of which approximately $108 million is expected to be spent over the next twelve months.

In the first quarter 2014, we expect to incur additional restructuring charges of approximately $0.01 per diluted share for actions and initiatives that have not yet been finalized. This compares to first quarter 2013, when net restructuring charges were an $8 million benefit due to net reversals from prior period initiatives exceeding charges incurred in the quarter. Worldwide Employment Worldwide employment of approximately 143,100 as of December 31, 2013 decreased by approximately 4,500 from December 31, 2012, due to restructuring-related actions and normal attrition outpacing hiring and a slower pace of acquisitions.
Other Expenses, Net
(in millions) 2013 2012
Non-financing interest expense 60$ 60$
Interest income (2) (3)
(Gains)/losses on sales of businesses and assets (31) 1
Currency (gains) losses, net - 3
Litigation matters 3 1
Loss on sales of accounts receivables 4 4
Deferred compensation investment gains (4) (1)
All other expenses, net 5 6
Total Other Expenses, Net 35$ 71$
Three Months Ended
December 31,
Non-financing interest expense Fourth quarter 2013 non-financing interest expense of $60 million was flat with fourth quarter 2012. When combined with financing interest expense (cost of financing), total company interest expense declined by $7 million from the fourth quarter 2012, primarily driven by a lower average debt balance partially offset by a higher average cost of debt. Gains on sales of businesses and assets Fourth quarter 2013 gains on sales of businesses and assets was primarily comprised of a $29 million gain on the sale of a portion of our Wilsonville, Oregon product design, engineering and chemistry group and related assets for $32.5 million in cash to 3D Systems, Inc. (3D Systems). The sale involved the transfer of approximately 100 engineers and contractors to 3D Systems. The related assets include laboratory, testing and modeling equipment. The sale also included a grant of a non-exclusive license to certain patents and non-patented intellectual property to enable 3D Systems to continue development of certain technologies associated with the transferred employees and related assets.
Income Taxes Fourth quarter 2013 effective tax rate was 21.2%. On an adjusted basis1, the fourth quarter 2013 tax rate was 24.5% which was lower than the U.S. statutory tax rate primarily due to foreign tax credits resulting from actual and anticipated dividends from our foreign subsidiaries.

Fourth quarter 2012 effective tax rate was 19.4%. On an adjusted basis1, fourth quarter 2012 tax rate was 22.8%, which was lower than the U.S. statutory tax rate primarily due to foreign tax credits resulting from anticipated dividends and other foreign transactions and geographical mix of profits. Xerox operations are widely dispersed. The statutory tax rate in most non U.S. jurisdictions is lower than the combined U.S. and state tax rate. The amount of income subject to these lower foreign rates relative to the amount of U.S. income will impact our effective tax rate. However, no one country outside of the U.S. is a significant factor to our overall effective tax rate. Certain foreign income is subject to U.S. tax net of any available foreign tax credits. Our full year effective tax rate includes a benefit of approximately 12 percentage points from these non U.S. operations, which is comparable to 2012. Our effective tax rate is based on nonrecurring events as well as recurring factors, including the taxation of foreign income. In addition, our effective tax rate will change based on discrete or other nonrecurring events that may not be predictable. Excluding the effects of intangibles amortization and other discrete items, we anticipate that our adjusted1 effective tax rate will range from 25% to 27% for 2014.
Equity in Net Income of Unconsolidated Affiliates Equity in net income of unconsolidated affiliates, which primarily reflects our 25% share of Fuji Xerox net income, was $43 million, a decrease of $4 million compared to the fourth quarter 2012. Both fourth quarter 2013 and fourth quarter 2012 equity income include charges of $1 million related to our share of Fuji Xerox after-tax restructuring.
Net Income Fourth quarter 2013 net income from continuing operations attributable to Xerox was $310 million, or $0.25 per diluted share. On an adjusted basis1, net income from continuing operations attributable to Xerox was $361 million, or $0.29 per diluted share. Fourth quarter 2013 adjustments to net income reflect the amortization of intangible assets. Fourth quarter 2012 net income from continuing operations attributable to Xerox was $334 million, or $0.26 per diluted share. On an adjusted basis1, net income from continuing operations attributable to Xerox was $385 million, or $0.30 per diluted share. Fourth quarter 2012 adjustments to net income reflect the amortization of intangible assets. The Net Income and EPS reconciliation table in the Non-GAAP Financial Measures section contains the fourth quarter adjustments to net income. The calculations of basic and diluted earnings per share are included as Appendix I. See Non-GAAP financial measures for calculation of adjusted EPS.

Discontinued Operations
During 2013, in connection with our decision to exit from the Paper distribution business, we completed the sale of our North American (N.A.) and European Paper businesses. The decision to exit the Paper distribution business was largely the result of management’s objective to focus more on Services and innovative Document Technology. Net proceeds from the sale of the N.A. and European Paper businesses were approximately $36 million, of which approximately $26 million was received in cash ($15 million in fourth quarter 2013) and is reported as cash flows from investing activities in the Condensed Consolidated Statements of Cash Flows. The remainder was received as a note receivable. As a result of these transactions, we have reported these paper-related operations as Discontinued Operations and reclassified their results from the Other segment to Discontinued Operations in 2013. All prior periods have accordingly been reclassified to conform to this presentation. The net assets sold in connection with these transactions are primarily related to working capital – accounts receivable and inventory - utilized in the business. In the fourth quarter 2013, we recorded a net pre-tax loss on disposal of $2 million, primarily related to additional restructuring costs associated with the sale of our European Paper business. This was in addition to the $23 million net pre-tax loss for the disposition of these businesses that we recorded in the second quarter of 2013. The components of Discontinued Operations for the periods presented are as follows:
(in millions) 2013 2012 2013 2012
Revenues * 34$ 160$ 403$ 653$
(Loss) income from operations (2)$ 1$ 3$ 16$
Loss on disposal (2) - (25) -
Net (loss) income before income taxes (4) 1 (22) 16
Income tax expense - - (4) (5)
(Loss) income from discontinued
operations, net of tax (4)$ 1$ (26)$ 11$
Diluted earnings per share from
discontinued operations (0.01)$ -$ (0.02)$ 0.01$
Total diluted earnings per share, inclusive
of discontinued operations 0.24$ 0.26$ 0.91$ 0.88$
Three Months Ended Year Ended
December 31, December 31,
*Fourth Quarter 2013 revenue from discontinued operations reflects one month of revenue from our European Paper business since the sale was completed October 31, 2013. Year-to-date 2013 revenue from discontinued operations reflects ten months of revenue from our European Paper business and five months of revenue from our N.A. Paper business since this sale was completed May 31, 2013.

Segment Review
(in millions)
Total
Revenues
% of Total
Revenue
Segment
Profit (Loss)
Segment
Margin
2013
Services 3,039$ 55% 291$ 9.6%
Document Technology 2,351 42% 274 11.7%
Other 179 3% (36) (20.1%)
Total 5,569$ 100% 529$ 9.5%
2012
Services 3,054$ 53% 343$ 11.2%
Document Technology 2,495 43% 307 12.3%
Other 214 4% (62) (29.0%)
Total 5,763$ 100% 588$ 10.2%
Three Months Ended December 31,
Refer to Appendix II for the reconciliation of Segment Profit to Pre-tax Income.
Services
Our Services segment comprises three service offerings: Business Process Outsourcing (BPO), Document Outsourcing (DO) and Information Technology Outsourcing (ITO). Services Revenue Breakdown:
(in millions) 2013 2012
%
Change
Business Processing Outsourcing 1,803$ 1,853$ (3%)
Document Outsourcing 889 856 4%
Information Technology Outsourcing 397 389 2%
Less: Intra-Segment Eliminations (50) (44) 14%
Total Revenue - Services 3,039$ 3,054$ --
December 31,
Three Months Ended
Note: Fourth quarter 2012 BPO and DO revenues have been revised by $119M to reflect the transfer of the Communication & Marketing Services (CMS) business from DO to BPO in 2013.
Revenue Fourth quarter 2013 Services total revenue of $3,039 million was essentially flat with the fourth quarter 2012, with a 1-percentage point positive impact from currency.
BPO revenue decreased 3% and represented 58% of total Services revenue. Growth in our healthcare, human resources and state government businesses was more than offset by lower volumes in portions of our customer care business and the run-off of the student loan business.
DO revenue increased 4% and represented 29% of total Services revenue. DO growth was driven primarily by our partner print services offerings.

ITO revenue increased 2% and represented 13% of total Services revenue. As expected, ITO growth has decelerated as compared to prior quarters. ITO growth was driven by the continued revenue ramp from prior period signings.
Segment Margin Fourth quarter 2013 Services segment margin of 9.6% decreased by 1.6-percentage points from the fourth quarter 2012 driven primarily by a gross margin decline of 1.7-percentage points as increased productivity improvements and restructuring benefits were more than offset by the impact of price declines, higher healthcare platform expenses and the run-off of the student loan business. SAG benefits from restructuring as well as lower compensation-related expenses contributed a modest offset to the gross margin decline. Metrics Pipeline Our total Services sales pipeline grew 9% over the fourth quarter 2012. This sales pipeline includes the Total Contract Value (“TCV”) of new business opportunities that potentially could be contracted within the next six months and excludes business opportunities with estimated annual recurring revenue in excess of $100 million. Signings Signings are defined as estimated future revenues from contracts signed during the period, including renewals of existing contracts. Services signings were an estimated $3.0 billion in TCV for the quarter.
BPO signings of $1.8 billion TCV.
DO signings of $870 million TCV.
ITO signings of $320 million TCV. Signings on a trailing twelve month basis increased 21% in relation to the comparable prior year period. Signings were flat with the fourth quarter 2012, with increased new business signings offset by fewer eligible renewals. The above DO signings amount does not include signings from our partner print services offerings. Note: TCV is the estimated total contractual revenue related to future contracts in the pipeline or signed contracts, as applicable.
Renewal rate (for BPO and ITO) Renewal rate is defined as the annual recurring revenue (“ARR”) on contracts that are renewed during the period as a percentage of ARR on all contracts on which a renewal decision was made during the period. The fourth quarter 2013 contract renewal rate for BPO and ITO contracts was 92%, which exceeded our target range of 85%-90%.

Document Technology Our Document Technology segment includes the sale of products and supplies, as well as the associated maintenance and financing of those products. Document Technology Revenue Breakdown:
(in millions) 2013 2012
%
Change
Equipment sales 790$ 827$ (4%)
Annuity revenue 1,561 1,668 (6%)
Total Revenue 2,351$ 2,495$ (6%)
Three Months Ended
December 31,
Fourth quarter 2013 Document Technology revenue of $2,351 million decreased 6% from the fourth quarter 2012, with no impact from currency. Document Technology revenues exclude the impact of growth in Document Outsourcing. Inclusive of Document Outsourcing, fourth quarter 2013 aggregate document-related revenue decreased 3% from the fourth quarter 2012. Document Technology segment revenue results included the following:
Equipment sales revenue decreased 4% from the fourth quarter 2012, including a 1-percentage point positive impact from currency. Equipment sales continue to benefit from the mid-range product refresh in 2013, growth and acquisitions in the small and mid-size business market, and increased demand for color digital production presses. These benefits were more than offset by the continued migration of customers to our growing partner print services offering (included in our Services segment), weakness in developing markets and price declines, which were in the historical 5% to 10% range.
Annuity revenue decreased by 6% from the fourth quarter 2012, with a 1-percentage point positive impact from currency. The decrease reflects a modest decline in total pages, a reduction in channel supplies inventory levels, weakness in developing markets and a continued decline in financing revenue as a result of prior period sales of finance receivables and lower originations. Annuity revenue is also impacted by the continued migration of customers to our partner print services offering (included in our Services segment).
Document Technology revenue mix was 19% entry, 59% mid-range and 22% high-end, consistent with recent quarters. Segment Margin Fourth quarter 2013 Document Technology segment margin of 11.7% decreased by 0.6-percentage points from the fourth quarter 2012, driven by a 0.3-percentage point decrease in gross margin as the benefits from cost productivities and favorable currency on Yen based purchases were more than offset by price declines and unfavorable changes in revenue mix. SAG benefits from restructuring and productivity improvements and lower compensation-related expenses were more than offset by the impact of overall lower revenues. Both gross margin and SAG were also impacted by higher pension settlement expense.
Total Installs (Document Technology and Document Outsourcing2) Install activity includes document outsourcing and Xerox-branded products shipped to Global Imaging Systems. Detail by product group (see Appendix II) is shown below:
Entry
1% increase in color multifunction devices driven by demand for the WorkCentre® products.
17% increase in color printers.
26% decrease in black-and-white multifunction devices driven by developing markets.
Mid-Range
11% increase in mid-range color devices, driven by demand for the ConnectKey products.
1% decrease in mid-range black-and-white devices.
High-End
20% increase in high-end color systems, driven by growth in the sale of digital front-ends (DFE’s) to Fuji Xerox as well as strong customer demand for the Color J75 Press and the iGen as we continue to strengthen our market leadership in the Production Color segment. Excluding the Fuji Xerox DFE sales, high-end color installs increased 7%.
5% increase in high-end black-and-white systems, reflecting increased demand across our DocuPrint and Nuvera product lines.
Other
Revenue Fourth quarter 2013 Other revenue of $179 million decreased 16% from the fourth quarter
2012, with a 1-percentage point positive impact from currency. The decline is due primarily to lower revenue in our wide format business, lower sales of electronic presentation systems, lower developing market paper sales and lower licensing revenue. After the aforementioned discontinued operations treatment of our N.A and Europe Paper distribution businesses, total paper revenue (all within developing markets) comprised approximately one third of fourth quarter 2013 Other segment revenue.
Segment Margin Fourth quarter 2013 Other segment loss of $36 million decreased $26 million from the fourth quarter 2012, primarily driven by the previously discussed gain on the sale of assets to 3D Systems. Non-financing interest expense as well as all Other expenses, net (excluding Deferred compensation investment gains) are reported within the Other segment.
During 2013, in connection with our decision to exit from the Paper distribution business, we completed the sale of our N.A. Paper business in the second quarter and our European Paper business in the fourth quarter. As a result of these transactions, we have reported these paper-related operations as Discontinued Operations and reclassified their results from the Other segment to Discontinued Operations for 2013. All prior periods have accordingly been reclassified to conform to this presentation. Notes (1)
See the “Non-GAAP Financial Measures” section for an explanation of the non-GAAP financial measure. (2)
Equipment sales associated with Document Outsourcing are reported as revenue in our Services segment revenues.

Capital Resources and Liquidity The following table summarizes our cash and cash equivalents for the three months ended December 31, 2013 and 2012:
(in millions) 2013 2012 Change
Net cash provided by operating activities 968$ 1,773$ (805)$
Net cash used in investing activities (53) (160) 107
Net cash used in financing activities (100) (1,250) 1,150
1 1 -
Increase in cash and cash equivalents 816 364 452
Cash and cash equivalents at beginning of period 948 882 66
Cash and Cash Equivalents at End of Period 1,764$ 1,246$ 518$
December 31,
Effect of exchange rate changes on cash and cash equivalents
Three Months Ended
Cash Flows from Operating Activities Net cash provided by operating activities was $968 million in the fourth quarter 2013. The $805 million decrease in operating cash from the fourth quarter 2012 was primarily due to the following:
$88 million decrease in pre-tax income before net gain on sales of businesses and assets and restructuring.
$273 million decrease from accounts receivable primarily related to a reduction in the use of accelerated collection programs such as early pay discounts as well as lower cash from the sales of accounts receivable.
$256 million decrease due to lower accounts payable and accrued compensation primarily related to the timing of accounts payable payments and improved supplier payment terms initially benefitting prior periods, as well as lower inventory and other spending.
$175 million decrease due to lower net run-off of finance receivables of $155 million and higher equipment on operating leases of $20 million. The lower net run-off of finance receivables was primarily related to the impact from the receivables sales. See Sales of Finance Receivables for further discussion.
$17 million decrease due to higher net income tax payments.
$14 million decrease due to higher voluntary contributions to our defined benefit pension plans primarily related to timing.
$29 million increase from lower spending for product software and up-front costs for outsourcing service contracts.

Cash Flows from Investing Activities Net cash used in investing activities was $53 million in the fourth quarter 2013. The $107 million decrease in the use of cash from the fourth quarter 2012 was primarily due to the following:
$33 million decrease due to proceeds from the sale of assets to 3D Systems.
$33 million decrease in acquisitions. 2012 acquisitions included two businesses acquired by our Document Technology segment.
$19 million decrease due to lower capital expenditures (including internal use software).
$15 million decrease due to proceeds from the sale of the European Paper business.
Cash Flows from Financing Activities Net cash used in financing activities was $100 million in the fourth quarter 2013. The $1,150 million decrease in the use of cash from the fourth quarter 2012 was primarily due to the following:
$1,347 million decrease from net debt activity. Fourth quarter 2013 reflects proceeds of $500 million from the issuance of Senior Notes as compared to an $844 million decrease in Commercial Paper in the fourth quarter 2012.
$27 million decrease due to higher proceeds from the issuance of common stock.
$190 million increase in share repurchases.
$35 million increase due to higher common stock dividends of $17 million as well as distributions to noncontrolling interests of $18 million.
Customer Financing Activities The following represents our Total finance assets, net associated with our lease and finance operations:
December 31, December 31,
(in millions) 2013 2012
Total Finance receivables, net (1) 4,530$ 5,313$
Equipment on operating leases, net 559 535
Total Finance Assets, net (2)5,089$ 5,848$
(1)
Includes (i) billed portion of finance receivables, net, (ii) finance receivables, net and (iii) finance receivables due after one year, net as included in our Condensed Consolidated Balance Sheets.
(2) Change from December 31, 2012 includes an increase of $35 million due to currency across all Finance Assets, and a decrease due to the finance receivables sales discussed further below.

The following summarizes our debt:
December 31, December 31,
(in millions) 2013 2012
Principal debt balance 7,979$ 8,410$
Net unamortized discount (58) (63)
Fair value adjustments(1) 100 142
Total Debt 8,021$ 8,489$
_____________ (1) Fair value adjustments represent changes in the fair value of hedged debt obligations attributable to movements in benchmark interest rates. Hedge accounting requires hedged debt instruments to be reported at an amount equal to the sum of their carrying value (principal value plus/minus premiums/discounts) and any fair value adjustment.
Our lease contracts permit customers to pay for equipment over time rather than at the date of installation; therefore, we maintain a certain level of debt (that we refer to as financing debt) to support our investment in these lease contracts, which are reflected in Total finance assets, net. For this financing aspect of our business, we maintain an assumed 7:1 leverage ratio of debt to equity as compared to our finance assets. Based on this leverage, the following represents the breakdown of total debt between financing debt and core debt:
December 31, December 31,
(in millions) 2013 2012
Financing Debt(1) 4,453$ 5,117$
Core Debt 3,568 3,372
Total Debt 8,021$ 8,489$
(1) Financing Debt includes $3,964 million and $4,649 million as of December 31, 2013 and December 31, 2012, respectively, of debt associated with Total Finance receivables, net and is the basis for our calculation of "Equipment financing interest" expense. The remainder of the financing debt is associated with equipment on operating leases.
Sales of Accounts Receivable Accounts receivable sales arrangements are utilized in the normal course of business as part of our cash and liquidity management. We have facilities in the U.S., Canada and several countries in Europe that enable us to sell certain accounts receivable without recourse to third-parties. The accounts receivables sold are generally short-term trade receivables with payment due dates of less than 60 days. Accounts receivable sales were as follows:
(in millions) 2013 2012 2013 2012
Accounts receivable sales 814$ 883$ 3,401$ 3,699$
Deferred proceeds 102 114 486 639
Loss on sale of accounts receivables 4 5 17 21
Estimated (decrease) increase to
operating cash flows (1) (13)$ 89$ (55)$ (78)$
Three Months Twelve Months
Ended December 31, Ended December 31,
(1) Represents the difference between current and prior period receivable sales adjusted for the effects of the deferred proceeds, collections prior to the end of the quarter and
currency.

Sales of Finance Receivables In December 2013, our Canadian subsidiary transferred its entire interest in a group of lease finance receivables to a third party trust. The transfer was accounted for as a sale and resulted in the de-recognition of lease receivables with a net carrying value of $257 million, the receipt of cash proceeds of $248 million and a beneficial interest of $26 million. A pre-tax gain of $15 million was recognized on this transaction and is net of additional fees and expenses of approximately $1 million. A similar sale of lease receivables was completed in the third quarter 2013 in the U.S., which resulted in a pre-tax gain of $25 million. In 2012, we completed similar sale transactions on two separate portfolios of U.S. lease finance receivables with a combined net carrying value of $682 million to a third-party financial institution for cash proceeds of $630 million and beneficial interests from the purchaser of $101 million. A pre-tax gain of $44 million ($21 million in the fourth quarter 2012) was recognized on these transactions and is net of additional fees and expenses of approximately $5 million. The gains on these transactions are reported in Finance Income in Document Technology segment revenues, as the sold receivables were from this segment. We will continue to service the sold receivables and expect to record servicing fee income over the expected life of the associated receivables. These transactions enable us to lower the cost associated with our financing portfolio. The net impact on operating cash flows from these transactions is summarized below:
(in millions) 2013 2012 2013 2012
Net cash received for sales of finance receivables (1) 247$ 314$ 631$ 625$
Impact from prior sales of finance receivables (2) (134) (45) (392) (45)
Collections on beneficial interest 15 - 58 -
Estimated increase to operating cash flows 128$ 269$ 297$ 580$
(2) Represents cash that would have been collected if we had not sold finance receivables.
Three Months Year
Ended December 31, Ended December 31,
(1) Net of beneficial interest, fees and expenses.

Forward-Looking Statements This release contains "forward-looking statements" as defined in the Private Securities Litigation Reform Act of 1995. The words “anticipate,” “believe,” “estimate,” “expect,” “intend,” “will,” “should” and similar expressions, as they relate to us, are intended to identify forward-looking statements. These statements reflect management’s current beliefs, assumptions and expectations and are subject to a number of factors that may cause actual results to differ materially. These factors include but are not limited to: changes in economic conditions, political conditions, trade protection measures, licensing requirements and tax matters in the United States and in the foreign countries in which we do business; changes in foreign currency exchange rates; actions of competitors; our ability to obtain adequate pricing for our products and services and to maintain and improve cost efficiency of operations, including savings from restructuring actions; the risk that unexpected costs will be incurred; the risk that subcontractors, software vendors and utility and network providers will not perform in a timely, quality manner; our ability to recover capital investments; the risk that multi-year contracts with governmental entities could be terminated prior to the end of the contract term; the risk that our Services business could be adversely affected if we are unsuccessful in managing the ramp-up of new contracts; development of new products and services; our ability to protect our intellectual property rights; our ability to expand equipment placements; the risk that individually identifiable information of customers, clients and employees could be inadvertently disclosed or disclosed as a result of a breach of our security; interest rates, cost of borrowing and access to credit markets; reliance on third parties for manufacturing of products and provision of services; our ability to drive the expanded use of color in printing and copying; the outcome of litigation and regulatory proceedings to which we may be a party; and other factors that are set forth in the “Risk Factors” section, the “Legal Proceedings” section, the “Management’s Discussion and Analysis of Financial Condition and Results of Operations” section and other sections of our Quarterly Reports on Form 10-Q for the quarters ended March 31, 2013, June 30, 2013 and September 30, 2013, and our 2012 Annual Report on Form 10-K filed with the Securities and Exchange Commission. The Company assumes no obligation to update any forward-looking statements as a result of new information or future events or developments, except as required by law.

Non-GAAP Financial Measures We have reported our financial results in accordance with generally accepted accounting principles (GAAP). In addition, we have discussed the non-GAAP measures described below. A reconciliation of these non-GAAP financial measures to the most directly comparable financial measures calculated and presented in accordance with GAAP are set forth below as well as in the 2013 fourth quarter presentation slides available at www.xerox.com/investor. These non-GAAP financial measures should be viewed in addition to, and not as a substitute for, the Company’s reported results prepared in accordance with GAAP. Adjusted Earnings Measures To better understand the trends in our business, we believe it is necessary to adjust the following amounts determined in accordance with GAAP to exclude the effects of certain items as well as their related income tax effects.
Net income and Earnings per share (EPS)
Effective tax rate In 2013 and 2012 we adjusted for the amortization of intangible assets. The amortization of intangible assets is driven by our acquisition activity which can vary in size, nature and timing as compared to other companies within our industry and from period to period. Accordingly, due to the incomparability of acquisition activity among companies and from period to period, we believe exclusion of the amortization associated with intangible assets acquired through our acquisitions allows investors to better compare and understand our results. The use of intangible assets contributed to our revenues earned during the periods presented and will contribute to our future period revenues as well. Amortization of intangible assets will recur in future periods. We also calculate and utilize an Operating income and margin earnings measure by adjusting our pre-tax income and margin amounts to exclude certain items. In addition to the amortization of intangible assets, operating income and margin also exclude Other expenses, net as well as Restructuring and asset impairment charges. Other expenses, net is primarily comprised of non-financing interest expense and also includes certain other non-operating costs and expenses. Restructuring and asset impairment charges consist of costs primarily related to severance and benefits for employees pursuant to formal restructuring and workforce reduction plans. Such charges are expected to yield future benefits and savings with respect to our operational performance. We exclude these amounts in order to evaluate our current and past operating performance and to better understand the expected future trends in our business.

Constant Currency To better understand trends in our business, we believe that it is helpful to adjust revenue to exclude the impact of changes in the translation of foreign currencies into U.S. dollars. We refer to this adjusted revenue as “constant currency.” Currencies for developing market countries (Latin America, Brazil, Middle East, India, Eurasia and Central-Eastern Europe) that we operate in are reported at actual exchange rates for both actual and constant revenue growth rates because (1) these countries historically have had volatile currency and inflationary environments and (2) our subsidiaries in these countries have historically taken pricing actions to mitigate the impact of inflation and devaluation. Management believes the constant currency measure provides investors an additional perspective on revenue trends. Currency impact can be determined as the difference between actual growth rates and constant currency growth rates. Management believes that these non-GAAP financial measures provide an additional means of analyzing the current period’s results against the corresponding prior period’s results. However, these non-GAAP financial measures should be viewed in addition to, and not as a substitute for, the Company’s reported results prepared in accordance with GAAP. Our non-GAAP financial measures are not meant to be considered in isolation or as a substitute for comparable GAAP measures and should be read only in conjunction with our consolidated financial statements prepared in accordance with GAAP. Our management regularly uses our supplemental non-GAAP financial measures internally to understand, manage and evaluate our business and make operating decisions. These non-GAAP measures are among the primary factors management uses in planning for and forecasting future periods. Compensation of our executives is based in part on the performance of our business based on these non-GAAP measures. A reconciliation of these non-GAAP financial measures and the most directly comparable measures calculated and presented in accordance with GAAP are set forth on the following tables:

Net Income and EPS reconciliation:
(in millions; except per share amounts) Net Income EPS Net Income EPS
Reported(1)310$ 0.25$ 334$ 0.26$
Adjustments:
Amortization of intangible assets 51 0.04 51 0.04
Adjusted 361$ 0.29$ 385$ 0.30$
Weighted average shares for adjusted EPS(2)1,261 1,296
Fully diluted shares at end of period(3)1,235
(in millions; except per share amounts) Net Income EPS Net Income EPS
Reported(1)1,185$ 0.93$ 1,184$ 0.87$
Adjustments:
Amortization of intangible assets 205 0.16 203 0.15
Adjusted 1,390$ 1.09$ 1,387$ 1.02$
Weighted average shares for adjusted EPS(2)1,274 1,356
Fully diluted shares at end of period(3)1,235
__________
December 31, 2013 December 31, 2012
(1) Net Income and EPS from continuing operations attributable to Xerox.
(2) Average shares for the calculation of adjusted EPS include 27 million of shares associated with the Series A
convertib le preferred stock and therefore the related quarterly dividend was excluded.
(3) Represents common shares outstanding at December 31, 2013 as well as shares associated with our Series A
convertib le preferred stock plus dilutive potential common shares as used for the calculation of diluted earnings per
share in the fourth quarter 2013.
Year Ended Year Ended
Three Months Ended Three Months Ended
December 31, 2013 December 31, 2012
Effective Tax reconciliation:
(in millions)
Pre-Tax
Income
Income Tax
Expense
Effective
Tax Rate
Pre-Tax
Income
Income Tax
Expense
Effective
Tax Rate
Reported(1) 345$ 73$ 21.2% 366$ 71$ 19.4%
Adjustments:
Amortization of intangible assets 83 32 82 31
Adjusted 428$ 105$ 24.5% 448$ 102$ 22.8%
(in millions)
Pre-Tax
Income
Income Tax
Expense
Effective
Tax Rate
Pre-Tax
Income
Income Tax
Expense
Effective
Tax Rate
Reported(1) 1,312$ 276$ 21.0% 1,332$ 272$ 20.4%
Adjustments:
Amortization of intangible assets 332 127 328 125
Adjusted 1,644$ 403$ 24.5% 1,660$ 397$ 23.9%__________
December 31, 2013 December 31, 2012
(1) Pre-Tax Income and Income Tax Expense from continuing operations attributable to Xerox.
Three Months Ended Three Months Ended
December 31, 2013 December 31, 2012
Year Ended Year Ended

Operating Income / Margin reconciliation:
(in millions) Profit Revenue Margin Profit Revenue Margin
Reported pre-tax income (1)345$ 5,569$ 6.2% 366$ 5,763$ 6.4%
Adjustments:
Amortization of intangible assets 83 82
Xerox restructuring charge 56 91
Other expenses, net 35 71
Adjusted Operating 519$ 5,569$ 9.3% 610$ 5,763$ 10.6%
Equity in net income of unconsolidated affiliates 43 47
Fuji Xerox restructuring charge 1 1
Other expenses, net* (34) (70)
Segment Profit/Revenue 529$ 5,569$ 9.5% 588$ 5,763$ 10.2%
(in millions) Profit Revenue Margin Profit Revenue Margin
Reported pre-tax income (1)1,312$ 21,435$ 6.1% 1,332$ 21,737$ 6.1%
Adjustments:
Amortization of intangible assets 332 328
Xerox restructuring charge 116 154
Other expenses, net 150 261
Adjusted Operating 1,910$ 21,435$ 8.9% 2,075$ 21,737$ 9.5%
Equity in net income of unconsolidated affiliates 169 152
Fuji Xerox restructuring charge 9 16
Litigation matters (37) -
Other expenses, net (150) (261)
Segment Profit/Revenue 1,901$ 21,435$ 8.9% 1,982$ 21,737$ 9.1%
_______________
* Includes rounding adjustments.
December 31, 2013 December 31, 2012
(1) Profit and Revenue from continuing operations attributable to Xerox.
Three Months Ended Three Months Ended
December 31, 2013 December 31, 2012
Year Ended Year Ended
Guidance:
Q1 2014 FY 2014
GAAP EPS from Continuing Operations $0.19 - $0.21 $0.93 - $0.99
Adjustments:
Amortization of intangible assets 0.04 0.17
Adjusted EPS $0.23 - $0.25 $1.10 - $1.16
Note: GAAP and Adjusted EPS guidance includes anticipated restructuring
Earnings Per Share Guidance

APPENDIX I
Xerox Corporation
Earnings per Common Share (in millions, except per share data. Shares in thousands)
2013 2012 2013 2012
Basic Earnings (Loss) per Share:
Net income from continuing operations attributable to Xerox 310$ 334$ 1,185$ 1,184$
Accrued Dividends on preferred stock (6) (6) (24) (24)
Adjusted net income from continuing operations available
to common shareholders 304$ 328$ 1,161$ 1,160$
Net (loss) income from discontinued operations attributable to Xerox (4) 1 (26) 11
Adjusted net income available to common shareholders 300$ 329$ 1,135$ 1,171$
Weighted average common shares outstanding 1,213,670 1,248,784 1,225,486 1,302,053
Basic Earnings (Loss) per Share:
Continuing Operations 0.25$ 0.26$ 0.95$ 0.89$
Discontinued Operations - - (0.02) 0.01
Total 0.25$ 0.26$ 0.93$ 0.90$
Diluted Earnings (Loss) per Share:
Net income from continuing operations attributable to Xerox 310$ 334$ 1,185$ 1,184$
Accrued Dividends on preferred stock - - - (24)
Interest on Convertible Securities, net - - 1 1
Adjusted net income from continuing operations available
to common shareholders 310$ 334$ 1,186$ 1,161$
Net (loss) income from discontinued operations attributable to Xerox (4) 1 (26) 11
Adjusted net income available to common shareholders 306$ 335$ 1,160$ 1,172$
Weighted average common shares outstanding 1,213,670 1,248,784 1,225,486 1,302,053
Common shares issuable with respect to:
Stock options 4,458 1,154 5,401 4,335
Restricted stock and performance shares 13,965 17,322 13,931 20,804
Convertible preferred stock 26,966 26,966 26,966 -
Convertible securities 1,494 1,992 1,743 1,992
Adjusted weighted average common shares outstanding 1,260,553 1,296,218 1,273,527 1,329,184
Diluted Earnings (Loss) per Share:
Continuing Operations 0.25$ 0.26$ 0.93$ 0.87$
Discontinued Operations (0.01) - (0.02) 0.01
Total 0.24$ 0.26$ 0.91$ 0.88$
The following securities were not included in the computation of diluted earnings per share
because to do so would have been anti-dilutive (shares in thousands):
Stock options 9,741 32,578 8,798 29,397
Restricted stock and performance shares 12,377 26,911 12,411 23,430
Convertible preferred stock - - - 26,966
Convertible Securities - - - -
22,118 59,489 21,209 79,793
Dividends per Common Share 0.0575$ 0.0425$ 0.2300$ 0.1700$
Three Months Ended Year Ended
December 31,December 31,

APPENDIX II
Xerox Corporation
Reconciliation of Segment Operating Profit to Pre-Tax Income
(in millions) 2013 2012
Segment Profit 529$ 588$
Reconciling items:
Restructuring and asset impairment charges (56) (91)
Restructuring charges of Fuji Xerox (1) (1)
Amortization of intangible assets (83) (82)
Equity in net income of unconsolidated affiliates (43) (47)
Other (1) (1)
Pre-Tax Income 345$ 366$
December 31,
Three Months Ended
Our reportable segments are aligned to how we manage the business and view the markets we serve. Our reportable segments are Services, Document Technology and Other. Services:
The Services segment comprises three service offerings: Business Process Outsourcing. Document Outsourcing, which includes Managed Print Services and revenues from our
partner print services offerings. Information Technology Outsourcing.
Document Technology:
The Document Technology segment is centered around strategic product groups, which share common technology, manufacturing and product platforms. This segment includes the sale of document systems and supplies, provision of technical service and financing of products. Our products range from:
“Entry”, which includes A4 devices and desktop printers. “Mid-Range”, which includes A3 devices that generally serve workgroup environments in
mid to large enterprises. This includes products that fall into the market categories, Color 41+ppm <$100K and Light Production 91+ppm <$100K.
“High-End”, which includes production printing and publishing systems that generally serve the graphic communications marketplace and large enterprises.
Other: The Other segment includes paper sales in our developing market countries, Wide Format
Systems, licensing revenue, GIS network integration solutions and electronic presentation systems and non-allocated corporate items, including Other expenses, net.

APPENDIX III
Xerox Corporation Discontinued Operations Summary
Detailed below is a summary of the Other segment and Total segment results by quarter for 2013 and 2012 as a result of the reclassification of the North American and European Paper business to Discontinued Operations. The entire restated income statement for 2012 and first quarter 2013 can be found in the financial model included on our website at http://news.xerox.com/investors/materials.
(in millions) Q1 Q2 Q3 Q4 YTD
2013
Other Segment Revenue 147$ 183$ 159$ 179$ 668$
Total Performance Revenue 5,202$ 5,402$ 5,262$ 5,569$ 21,435$
Other Segment Profit (70)$ (61)$ (55)$ (36)$ (222)$
Total Segment Profit 390$ 484$ 498$ 529$ 1,901$
Other Segment Margin (47.6%) (33.3%) (34.6%) (20.1%) (33.2%)
Total Segment Margin 7.5% 9.0% 9.5% 9.5% 8.9%
Q1 Q2 Q3 Q4 FY
2012
Other Segment Revenue 172$ 192$ 169$ 214$ 747$
Total Performance Revenue 5,331$ 5,368$ 5,275$ 5,763$ 21,737$
Other Segment Profit (57)$ (71)$ (66)$ (62)$ (256)$
Total Segment Profit 451$ 495$ 448$ 588$ 1,982$
Other Segment Margin (33.1%) (37.0%) (39.1%) (29.0%) (34.3%)
Total Segment Margin 8.5% 9.2% 8.5% 10.2% 9.1%